Article

Synthetic Bacterial Consortium Induces Dynamic Shifts in Fungal Community and Alters Microbial Network Topology in Barley Soil Under Field Conditions

by
Roderic Gilles Claret Diabankana
1,*,
Ernest Nailevich Komissarov
1,
Daniel Mawuena Afordoanyi
2,
Bakhtiyar Islamov
1,
Artemiy Yurievich Sukhanov
1,
Elena Shulga
1,
Maria Nikolaevna Filimonova
3,
Keremli Saparmyradov
1,
Natalia V. Trachtmann
1 and
Shamil Z. Validov
1
1
Laboratory of Molecular Genetics and Microbiology Methods, Kazan Scientific Center of the Russian Academy of Sciences, 420111 Kazan, Russia
2
Kazan E. K. Zavoisky Physical-Technical Institute, Kazan Scientific Center of the Russian Academy of Sciences, 420029 Kazan, Russia
3
Academic and Research Centre, Institute of Fundamental Medicine and Biology, Kazan Federal University, 420008 Kazan, Russia
*
Author to whom correspondence should be addressed.
Soil Syst. 2025, 9(4), 116; https://doi.org/10.3390/soilsystems9040116
Submission received: 21 August 2025 / Revised: 1 October 2025 / Accepted: 16 October 2025 / Published: 19 October 2025

Abstract

Microorganisms are fundamental drivers of soil productivity, mediating nutrient cycling and pathogen suppression. In this study, we evaluated changes in the fungal community in the soil of barley (Hordeum vulgare L.) in a field experiment involving the application of a consortium of Paenibacillus pabuli, Priestia megaterium, Pseudomonas koreensis, and Pseudomonas orientalis. Seed pretreatment and seed pretreatment followed by rhizosphere drenching at different growth stages were implemented. Regarding fungal communities in bulk soil, the rhizospheres of untreated and treated plants were characterized based on full-length ribosomal RNA gene (18S-5.8S-28S) metabarcoding sequencing. Despite the compositional shifts, no statistical differences were observed among the alpha diversity metrics. Seed treatment resulted in long-term, targeted suppression of Fusarium graminearum, Fusarium fujikuroi, Fusarium musae, and Fusarium verticillioides from the booting through flowering and dough development stages, outperforming seed pretreatment followed by rhizosphere drenching. A low-modularity network was observed in the rhizosphere of untreated plants. Seed treatment fostered a highly interconnected and uniform network with low hub-betweenness scores. Rhizosphere drenching of pretreated seeds shifted the network topology toward higher hub-betweenness scores, reducing their connectivity by up to 10% in the rhizosphere and bulk soil. These findings provide a framework for optimizing the soil ecosystem for sustainable agriculture.

1. Introduction

The enhancement in plant productivity and the reduction in reliance on chemical pesticides are the primary objectives in modern agriculture [1]. Soil health for sustainable agriculture is referred as the ability of the soil to support the growth and development of crops without losing their structure and biological diversity [2,3], in which microbial communities play a crucial role by providing essential functions such as organic matter decomposition and nutrient recycling [4,5]. Plant interactions with the soil microbiota primarily occur in the rhizosphere. Rhizodeposit hotspots formed by plants attract a diverse range of microbes, including beneficial, pathogenic, and neutral species, significantly influencing plant development [6,7]. Beneficial residents are referred to as soil microbes, which provide host-plant beneficial properties such as nutrient acquisition and systemic resistance. Bad residents, including fungi, bacteria, and viruses, are key biotic factors infecting plant development and reducing yields, which are estimated to reach up to 20–50% of worldwide production [8]. Therefore, there is a need for an environmental equilibrium where soil-borne disease does not harm plants. In this context, manipulating the rhizosphere microbiome to suppress soil-borne diseases and enhance crop productivity presents a promising strategy in agricultural biotechnology for sustainable agriculture and microbiome engineering [9].
The rhizosphere microbiome has become a vital factor in nutrient acquisition, stress tolerance, and productivity, providing a biological alternative to chemical inputs, particularly in marginal soils [10,11]. Plant microbiome manipulation using beneficial microbial strains has been recognized as a sustainable alternative method of plant protection against abiotic and biotic stresses [12]. By introducing specific microbial strains, it is possible to tune or regulate the composition and functionality of plant microbiomes, thereby improving plant health, productivity, and resilience to environmental challenges. The resulting synergistic advantages create a microenvironment where a specific disease does not develop on a susceptible host despite the presence of its causal agent (pathogen) in favorable conditions [13,14]. Also, this presents a natural microbe-based plant defense where beneficial soil microorganisms are the first line of defense against phytopathogens [15]. Several studies have emphasized the role of fungal communities in mediating interactions among microbial species and shaping microbiome formation [16,17,18,19]. Synthetic microbial communities as eco-friendly alternatives in response to problems in modern agriculture are artificially assembled microbial consortia that help crops grow better, resist diseases, and absorb nutrients more efficiently [20]. Numerous studies have demonstrated the positive impact of consortia on plant parameters under laboratory conditions [21,22]. However, the key observations made in some studies reflected on the failure of microbial inoculants to perform effectively in field conditions due to abiotic and biotic factors such as soil chemical properties, moisture, and competition for nutrients and niches [23,24,25].
Microbial network co-occurrence analysis is a promising approach to targeting microbiome engineering based on ecological functions. This approach enables the identification of microbes that negatively correlate with pathogens or highlights species that are positively associated with plant growth [26,27,28,29]. Recent advances in network ecology have revealed the taxonomic composition and complex interactions between microorganisms as essential for microbiome functioning [30,31,32]. Successful establishment of microbes depends on integration into existing microbial interaction networks [33,34], since microbial topology strongly influences microbiome stability and functionality [35,36]. Currently, few studies have evaluated the effect of applying microbial consortia on the general topology and architecture of the fungal network community of barley (Hordeum vulgare L) under field conditions. In this study, a consortium of 4 plant growth-promoting rhizobacteria isolated from barley was selected to evaluate their ability to reshape the co-occurrence fungal network of barley rhizosphere under field conditions at the tillering (GS3), booting (GS5), flowering (GS7), and dough development (GS9) stages. These critical growth stages directly influence yield components, stress resilience, and final grain quality in cereals. The proposed aim was to evaluate the specific changes in fungal network structure, establishing new keystone taxa, as well as improved network stability in soil inoculated with the above consortium. In this context, a field experiment was conducted to test the general hypothesis that a synthetic bacterial consortium can alter the change in the barley rhizosphere microbiome. The main purpose of this study was to evaluate the effects of a four-strain PGPR consortium on the fungal community structure and the topological properties of the microbial co-occurrence network across critical growth stages (tillering, booting, flowering, and dough development). The following hypotheses were put forward. Pretreated seeds that undergo rhizosphere drenching with a bacterial consortium would induce dynamic, stage-dependent shifts in fungal community composition. Rhizosphere drenching of plants from seed treatment would alter the change in microbial communities in the bulk soil surrounding plants of seeds pretreated with a PGPR consortium. These changes would alter the co-occurrence network topology, leading to a less complex but more modular and stable architecture. The resulting changes would establish new, fungal taxa as keystones within the network

2. Materials and Methods

2.1. Microbial Strains and Barley Variety

Bacterial strains Paenibacillus pabuli, P. megaterium, P. koreensis, and Pseudomonas orientalis (internal collection numbers MGMM122, MGMM123, MGMM124, and MGMM125, respectively), as well as phytopathogens Alternaria alternata F-3047 [37], Fusarium oxysporium Fo1 [38], and Fusarium oxysporum f.sp. lycopersici (Forl) ZUM2407 [39], used in this study are part of the microbial strain collection of the Laboratory of Molecular Genetics and Microbiology Methods (FRC Kazan Scientific Centre, Kazan, Russia). The bacterial strains were isolated from the roots of the spring barley cv. Kamashevsky (Kazan, Russia) and cryopreserved at −80 °C in glycerol stock [30% (v/v) in phosphate-buffered saline (PBS) (140 mM NaCl, 5 mM KH2PO4, 1 mM NaHCO3, pH 7.4)]. The isolated bacterial strains were identified based on the 16S rRNA gene. The 16S rRNA sequences were deposited in the NCBI database under accession numbers PX061243, PX061244, PX061245, and PX061246, respectively. When needed, the bacterial strains were recovered overnight on Luria–Bertani (LB) medium [g/L: Bacto-tryptone—10; Bacto-yeast extract—5; NaCl—10; pH 7.0] at 30 ± 1 °C. Single colonies were picked and reinoculated in LB broth [g/L: 10—Bacto-tryptone; Bacto-yeast extract—5; NaCl—10; agar—18; pH 7.0] under the same conditions to achieve a final colony-forming units (CFU) mL−1 of more than 108. Seeds barley cv. Kamashevsky was provided by the Tatar Research Institute of Agricultural Chemistry and Soil Science (FRC Kazan Scientific Center, Kazan, Russia).

2.2. Plant Growth-Promoting Characteristics of Selected Bacterial Strains

The ability of selected bacterial strains to inhibit the growth of phytopathogenic A. alternata F-3047, F. oxysporum Fo1, and Forl ZUM2407 was assessed using a dual culture plate assay [40]. Their ability to produce cellulase, protease, and amylase was tested by plating 2 µL of each bacterial suspension on basal medium amended with an appropriate substrate, as previously described by Diabankana et al. [41]. The ability of selected bacterial strains to produce phytase and lipase was evaluated according to Bae et al. [42]. The compatibility between selected bacteria was analyzed using the cross-streak test as previously described by Santiago et al. [43] on King’s B (KB) medium [g/L: peptone-10; glycerol—10 mL; K2HPO4—1.5; MgSO4—1.5; agar, 15]. After inoculation, plates were then incubated at 30 °C for 5 days. The presence of any inhibition zone at the intersection of the paired strains was considered an antagonistic activity (non-compatibility between paired strains). The ability of bacterial strains to produce Indole-3-Acetic Acid (IAA) was determined using the colorimetric method with Salkowski’s reagent [44], following the protocol described by Gordon and Weber [45].

2.3. Experimental Setup

2.3.1. Basal Fertilizer and Fertigation Management

The experiment was conducted during the vegetative growing season in 2024 (April–August) on the agricultural landscape (55°38′13.7″ N 49°20′31.1″ E) of the Federal Research Center “Kazan Scientific Center of Russian Academy of Sciences” located in Laishevsky District (Republic of Tatarstan, Russia). Before pretreatment and sowing, basic chemical soil properties were assayed. Alkaline hydrolysable nitrogen (AHN) was determined by the alkaline hydrolysis diffusion method, available phosphorus (P2O5) was extracted using the Olsen bicarbonate method and measured spectrophotometrically, and available potassium (K2O) was extracted with ammonium acetate and measured by flame photometry. Chemical soil properties were AHN—100.00 mg/kg, P2O5—203.5 mg/kg, K2O—120.25 mg/kg, and pH 4.9. The soil was a gray forest, medium loamy type, which is consistent with the well-characterized profile of Gray Forest soils (Greyzemic Phaeozems). The soil organic matter (OM) content was 3.19 g/kg. The humic acid (HA) content constituted 4.0% of the total OM. Soil was supplied with complex fertilizer [nitrogen (N) 16%, phosphorus (P2O5) 16%, potassium (K2O) 16%] at a rate of 25 g/m2. The precipitation level and temperature for the first 6 months are shown in Figure S1. Temperatures remained within the mesophilic range (14.4–21.2 °C), which was favorable for microbial activity. May and June experienced alternating periods of heavy rainfall (up to +90.5%) and drought (−77.8%). July was characterized by both below-average temperatures (14.4 °C) and excessive rainfall (+361.9%). By August, more stable conditions appeared with warmer temperatures (21.2 °C) and moderate increases in rainfall (+7.4–44.4%).

2.3.2. Bacterial Inoculum Preparation and Crop Management

For inoculum preparation, bacterial cultures grown overnight in LB broth with cell concentrations of more than 108 CFU.mL−1 were mixed at a ratio of 1/1. The treatments included untreated seed, seed pretreatment with bacterial consortium, and seed pretreatment followed by rhizosphere drenching with bacterial consortium groups (Figure 1). To avoid any direct impact of pesticides on the applied bacterial consortium and native soil microbiome, no herbicides were used during the experiment. Weed control was managed manually throughout the growing season. Each group was maintained in three replications, using plots measuring 100 cm × 100 cm and separated by a 15 cm buffer (row spacing) to minimize cross-contamination (Figure 1 (a, d, e)). For seed pretreatment, barley seeds were semi-dry pretreated with bacterial inoculum at a concentration of 45 mL per kg of seeds. After semi-dry inoculation, seeds were sown by mechanical seeding on 19 April at a density of 30 g/m2. Rhizosphere drenching was performed early in the morning. For this purpose, the plant’s row of each treated plot was drenched in 4 replicates with 1 L of fresh bacterial inoculum at GS3, GS5, GS7, and GS9. A sterile water tap was used to drench the control group (Figure 1).

2.4. Soil Sample Collection and Property Analysis

The rhizosphere and bulk soil samples were analyzed according to Riley et al. [46], as shown in Table 1, in 4 replicates before each rhizosphere drenching period (one week before each rhizosphere drenching period). Bulk soil was collected from a 5 cm depth at 7.5 cm from growing plants (Figure 1 (a, b)). For Rhizosphere soil collection, the plant root system was carefully excavated to preserve the root architecture. Loose soil was removed by gentle shaking, and the soil remaining tightly adhered to the roots was defined as rhizosphere soil. The collected samples were placed in thermoses and brought to the laboratory within 5 h for further analysis.

Soil Chemical Analyses

Soil chemical analyses were performed on air-dried and sieved (<2 mm) soil samples. Soil pH was determined potentiometrically in a 1:2.5 (w/v) soil-to-water suspension using a pH meter PH2111 with LabSen21 glass electrode (Ambala Cantt, Haryana, India) according to Thomas [47]. The organic matter (OM) content was determined by the wet oxidation method according to Walkley-Black [48]. For this purpose, soil samples were oxidized by potassium dichromate (K2Cr2O7) in concentrated sulfuric acid (H2SO4). The excess dichromate that did not react was titrated with 0.5N ferrous ammonium sulfate hexahydrate [Fe(NH4)2(SO4)2·6H2O]. The organic carbon content was then converted to organic matter by multiplying by the Van Bemmelen conventional factor 1.724 [49]. Humic Acid (HA) content was extracted from the soil with 0.1 M NaOH at a ratio of 1:10 under a nitrogen atmosphere [50]. The mixture was incubated overnight under shaking conditions, then centrifuged at 2000× g for 25 min. For HA precipitation, the resulting supernatant was acidified to pH 2 using concentrated hydrochloric acid. The HA fraction was separated by centrifugation at 2000× g for 25 min, then dried at 65 °C [51]. The HA content was determined using a gravimetric method.

2.5. DNA Isolation and Metabarcoding Analysis

The collected bulk and rhizosphere soil were placed in a sterile 50 mL Falcon tube with 30 mL of sterile PBS. The tube was vortexed at maximum speed for 1 min to dislodge the soil, followed by sonication for 1 min in a water bath sonicator LEADSONIC (Shenzhen, China) to further separate soil particles from the plant materials. The plant materials were then aseptically removed using sterile forceps. The resulting soil suspensions were then centrifuged at 4000× g for 10 min at 5 °C. After centrifugation, the supernatant was discarded, and the soil pellet was stored at −80 °C before DNA extraction.

2.5.1. DNA Isolation

Total DNA from soil samples was isolated using the Quick-DNA Fungal/Bacterial Microprep Kit/Quick-DNA Faecal/Soil Microbe Microprep Kit (Zymo Research, Irvine, California, USA) following the recommended protocol. DNA quantity was checked using a Qubit 4 fluorometer (Thermo Fisher Scientific, Waltham, MA, USA). The quantity of isolated DNA integrity was assessed according to the manufacturer’s instructions from Agilent Technologies using a 2100 Bioanalyzer (Agilent Technologies, Santa Clara, CA, USA) and estimated using 1% agarose gel electrophoresis in 0.5 TAE buffer.

2.5.2. Metabarcoding Sequencing and Library Preparation

The universal eukaryotic primers SSU515Fngs—TW13 [52,53] tailed with sample-specific PacBio barcode sequences were used to amplify the full fungal 18S–5.8S–28S rRNA gene from DNA samples. For fungal amplification, PCR amplification included 42 cycles [53] in which the initial denaturation and final extension were set at 95 °C for 15 min and 72 °C for 10 min, respectively. Each cycle included denaturation and annealing steps of 30 s at 95 °C and 55 °C, followed by an extension step at 72 °C for 60 s. The quality of the obtained PCR product was assessed using a 2100 Bioanalyzer (Agilent Technologies, Santa Clara, CA, USA). PCR products were then pooled in approximately equimolar concentrations. Library preparation was conducted using the SMRTbell Prep Kit 3.0 (PacBio, Menlo Park, CA, USA), after which the Qubit HS DNA kit (Qubit Fluorometer, Invitrogen, Carlsbad, CA, USA) and Fragment Analyser (Agilent Technologies, Santa Clara, CA, USA) were used to measure the concentration and size of the obtained libraries. Sequencing was performed by an external laboratory (CeGaT, Tübingen, Germany) on the PacBio Sequel IIe system v10.1 (PacBio, Menlo Park, CA, USA).

2.5.3. Bioinformatics Analysis

The PacBio Circular Consensus Sequencing (CCS) reads were demultiplexed using lima (part of SMRT-Link analysis software v. 9), which assigns reads to samples based on barcode sequences. Low-quality reads and adapters were removed using Cutadapt v3.2 [54]. Base-called reads were then filtered at the threshold of quality score set at 8 and 12 for fungal reads and bacterial reads, respectively. The filtered reads were once again trimmed for removal of any remaining adapter and primer sequences using Cutadapt v.3.2 [54]. The obtained CCS reads were further submitted to the quality check pipeline using DADA2 [55] R Statistics package (v1.20.0) [56] for amplicon sequence variant (ASV) inference without clustering. Reads were filtered by length using SeqKit v2.9.0 [57], retaining sequences between 200 and 3500 bp for eukaryotes and between 1000 and 1700 bp for bacterial reads. For generating operational taxonomic units, reads were aligned to a reference database with minimap2 v2.22 using default settings [58,59]. Alignments with a quality score less than 4 and sequence divergence from a reference greater than 0.1 were excluded from reads. Here, only aligned reads to the reference sequence designated as primary by minimap2 were retained and counted. The reference database UNITE version 9 eukaryotes dynamic 29.11.2022 was used [60]. Fungal guilds were assigned by genus name from the FunGuild database [61].

2.6. Statistical Analysis

The statistical analysis of the obtained data was conducted with R Studio software 2024 12.1 Build 563 (v.4.3.1). Microbial abundance data were analyzed with the following packages: tidyverse v2.0.0 for data manipulation, readxl (v1.4.3) for data import, and ggplot2 v3.4.4 for visualization. The alpha diversity metrics, including richness (Chao1), Shannon, Pielou’s Evenness, and Simpson, were evaluated to assess the degree of microbial diversity among samples. A non-parametric test, the Wilcoxon test, at p < 0.05, was used to test the significance of the difference between groups. Since microbial taxa with low abundance are ecological linchpins [62,63] and are mostly undetected in alpha diversity metrics, for appropriate effect analysis of seed coating and irrigation on fungal communities, relative abundance was classified as major, moderate, and minor according to Wu et al. [64] and Dai et al. [65] with slight changes. Operational taxonomic units (OTUs) were categorized into three subcommunities as follows: abundant (major) as OTUs with a relative abundance >1% in at least 50% of samples and detected in >80% of all samples; rare as OTUs with an average relative abundance <0.9% across all samples; moderate as OTUs that did not meet the criteria for either rare or abundant OTUs. Correlations between soil properties and bacterial genera were analyzed by redundancy analysis (RDA). Multicollinearity tests were used to remove variables with variance inflation factors (VIF) >10 [66], and finally, permutation tests (999 permutations) were performed to assess the significance of soil properties on bacterial communities. Network analysis was performed using the Psych package v.2.1.9. Its robustness was evaluated through the following sensitivity analyses. The correlation thresholds 0.2 < |ρ| > 0.4 were used to generate topologies (Mantel test r > 0.85, p < 0.001) with taxon selection showing 89% hub congruence. All analyses employed fixed random seeds (seed = 123) to ensure reproducibility. Sequence data were deposited at NCBI SRA under accession PRJNA1307238.

2.6.1. Fold Changes in Fungal Community Analysis

The fold change in the fungal community was analyzed for the genus-level counts sampled per week and during the entire treatment. A pseudocount of 0.5 was added to all abundance values to mitigate undefined fold changes arising from zero counts while preserving the relative abundance structure. Fold changes were calculated per week to retain replicate-specific variability using the following:
FC week = T r e a t m e n t   a b u n d a n c e w e e k + 0.5 C o n t r o l   a b u n d a n c e w e e k + 0.5
FCweek values were log2-transformed to symmetrize the distribution of fold changes and facilitate interpretation of up-/down-regulation using the following formula: log2FCweek = log2(FCweeks). The mean log2 fold changes and associated variability metrics were calculated across biological replicates for each genus, followed by Wald tests and p-values adjusted by the false discovery rate (p-adj < 0.05). The Benjamini–Hochberg method also adjusted for multiple pairwise comparison correction. FC values were interpreted as follows: FC > 1 as higher abundance in treated samples; FC < 1 as suppression in treated samples; FC ≈ 1 as no significant change. The top of the potential barley pathogenic fungal genera [67,68] was then visualized.

2.6.2. Fungal Community Networks and Comparison

To build fungal community networks, data originating from ITS amplicon processing were used to create genus-level abundance. For this purpose, data were first filtered to retain taxa with a minimum total abundance of 100 reads across all samples to reduce noise from low-abundance taxa. To minimize the negative correlations, taxa with zero count values were discarded. Spearman’s rank correlation coefficient with a threshold of |ρ| > 0.7 and FDR-corrected p-values < 0.05 were used to compute pairwise observations between genera [69,70]. Adjacency matrices were created based on the threshold absolute correlation values. The igraph package v1.6.0 was used to construct topological network properties, where nodes, edges, and weights represent fungal genera, significant correlations, and absolute correlation strength, respectively [69]. The following topological properties were characterized: network size (node and edge counts), connectivity (average node degree), centrality (betweenness centrality computed without edge weights), and network integration (diameter) [71,72]. Top-ranked taxa by betweenness centrality within each network were considered as hub genera—a potential key connector [73]. The identification of genera co-occurring modules was conducted using the Louvain clustering algorithm [74]. Networks were visualized using a standardized Fruchterman-Reingold layout with node size proportional to log10-transformed abundance. Network comparison between groups included shared genera/total genera as node Jaccard similarity, shared edges/total edges in union networks as the edge conservation rate, and genera unique to specific treatment hubs as differential hub identification.

3. Results

3.1. Biological Characterization of Selected Microbial Strains

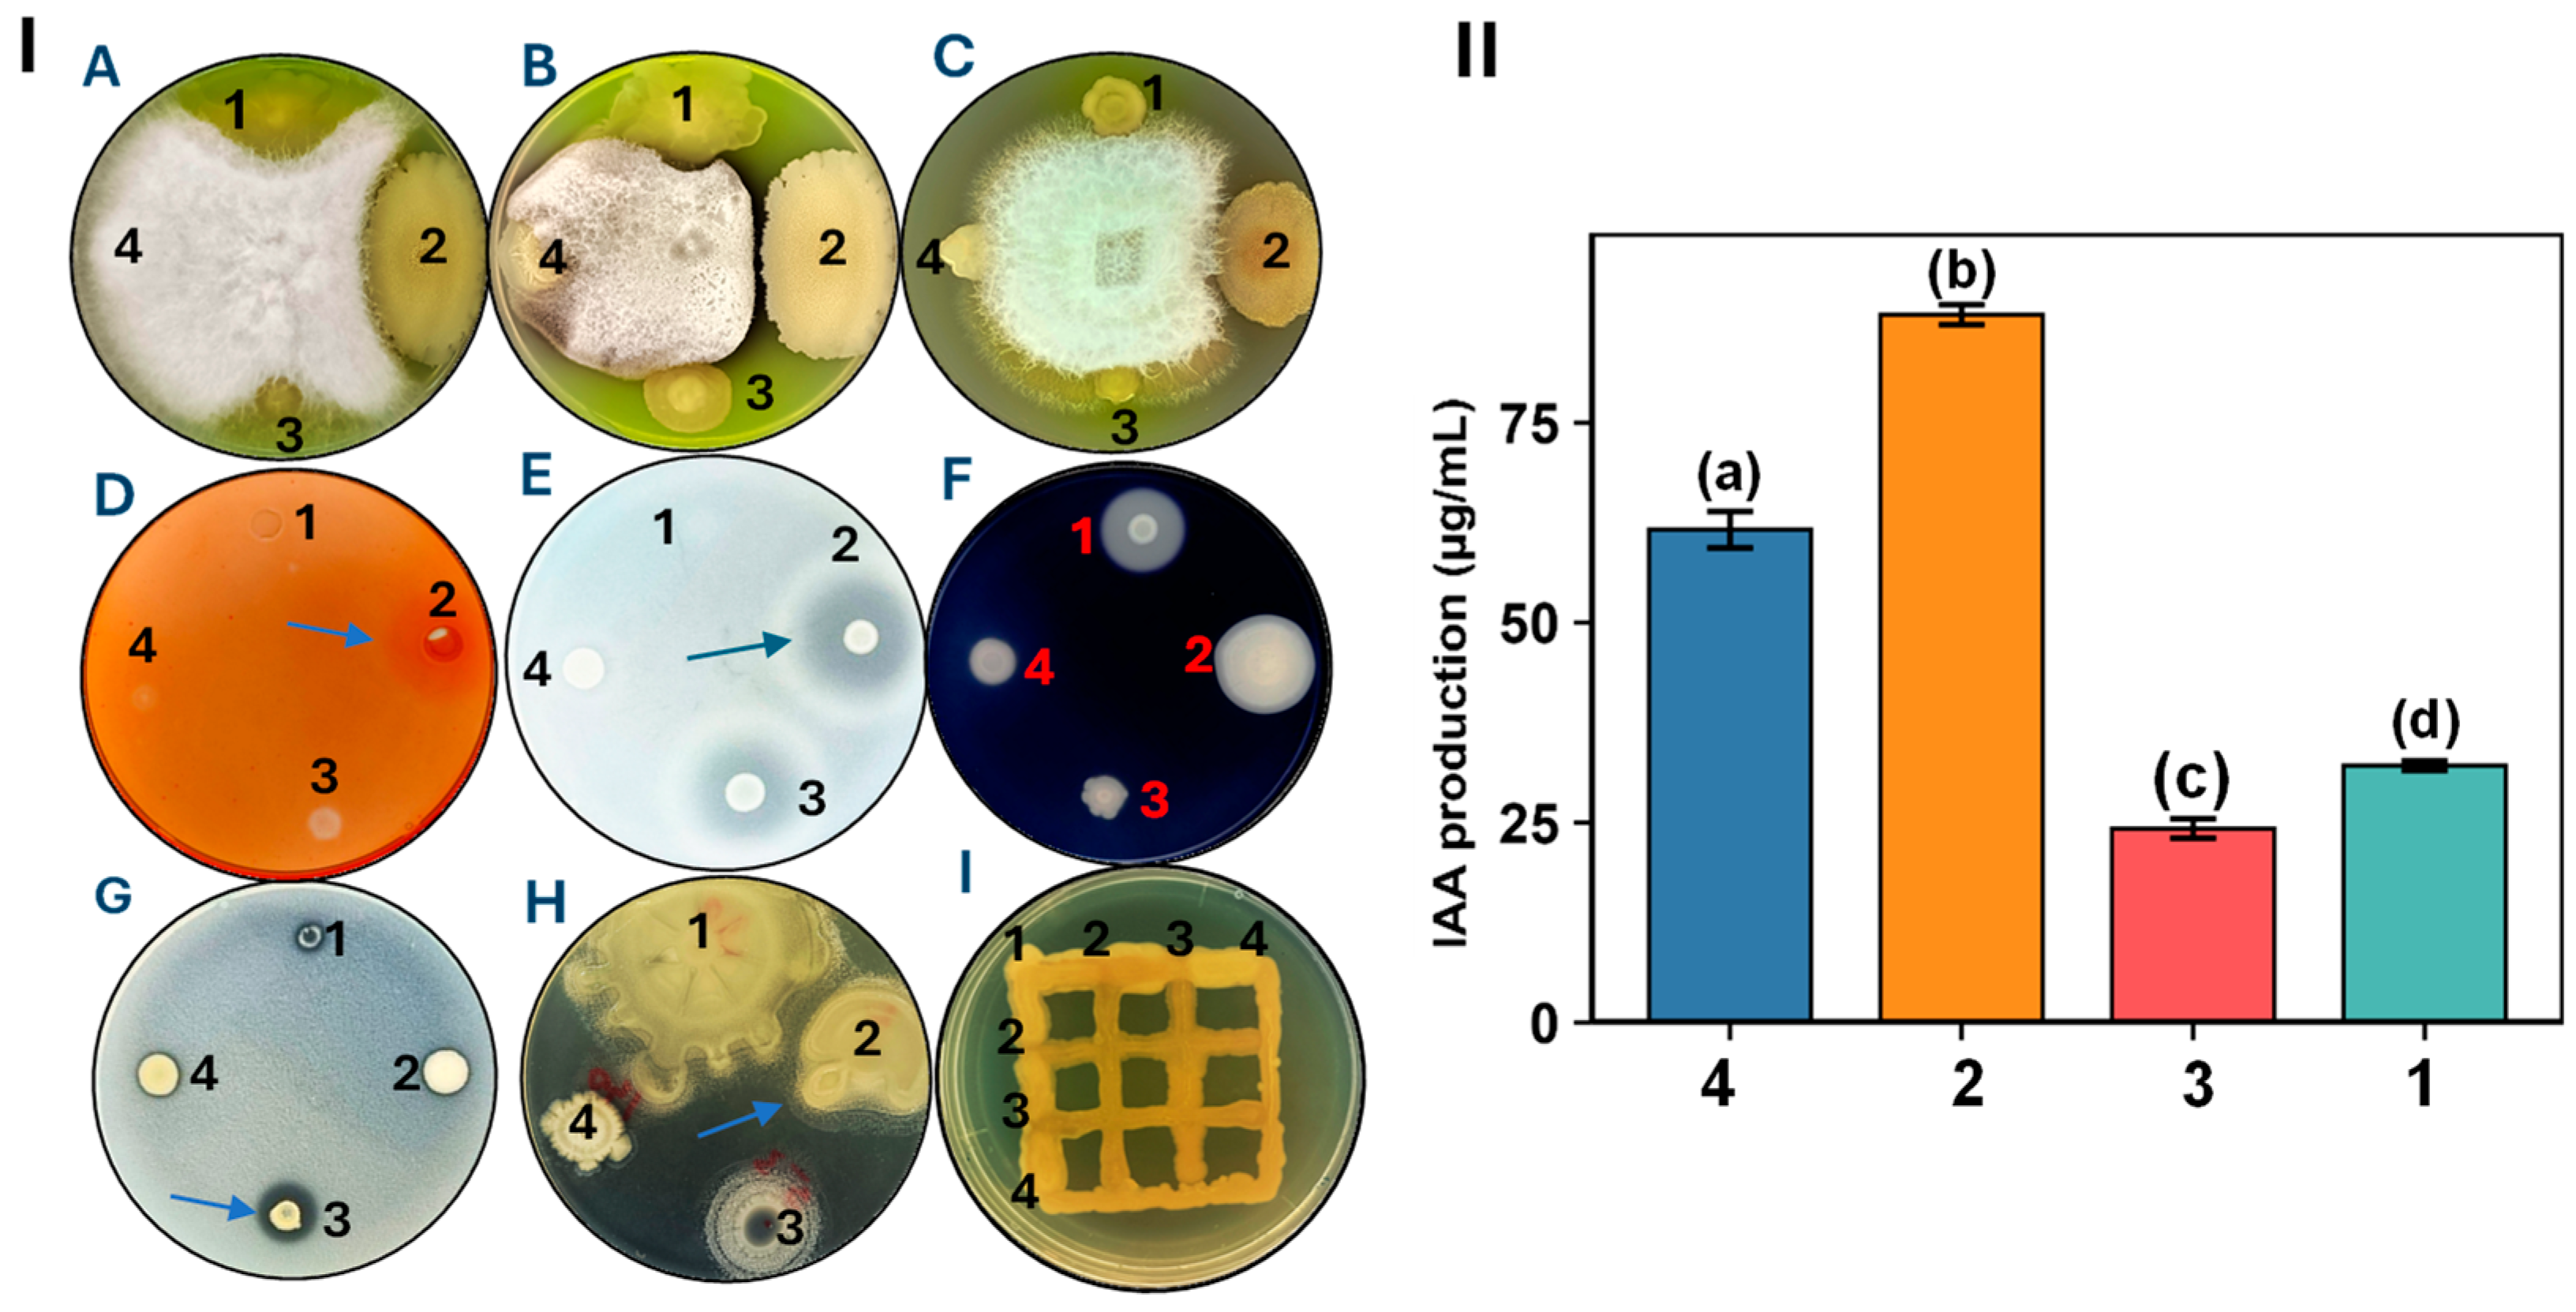
The potential ability of selected strains to produce enzymes and phytohormones was assessed, and the results are shown in Figure 2. Priestia megaterium MGMM124 (2) demonstrated the ability to inhibit the growth of tested phytopathogens (Figure 2I—A, B, and C), whereas P. orientalis MGMM125 (4) failed to suppress the growth of all tested phytopathogens. Paenibacillus pabuli MGMM122 (1) and P. koreensis MGMM123 (3) exhibited a moderate antagonistic activity against F. oxysporum Fo1 and low activity against A. alternata F-3047 and Forl ZUM2407. All selected strains demonstrated the ability to produce cellulase, protease, amylase, phytase, and lipase (Figure 2I—D, F, G, and H), except P. pabuli MGMM122 (1), which did not show protease activity (Figure 2I—E). In terms of their compatibility, the obtained result indicated the absence of inhibition zones at the cross-streaking intersection between cross-streaking co-inoculated strains, indicating the positive absence of antagonistic activity and compatibility of selected microorganisms (Figure 2I). The phytohormone indole-3-acetic acid produced by P. pabuli MGMM122 (1), P. megaterium MGMM124 (2), P. koreensis MGMM123 (3), and P. orientalis MGMM125 (4) was assayed as 32.13 ± 0.61 µg/mL, 88.51 ± 1.25 µg/mL, 24.25 ± 1.21 µg/mL, and 61.62 ± 2.28 µg/mL, respectively (Figure 2II).

3.2. Dynamic Shifts in Fungal Community Composition

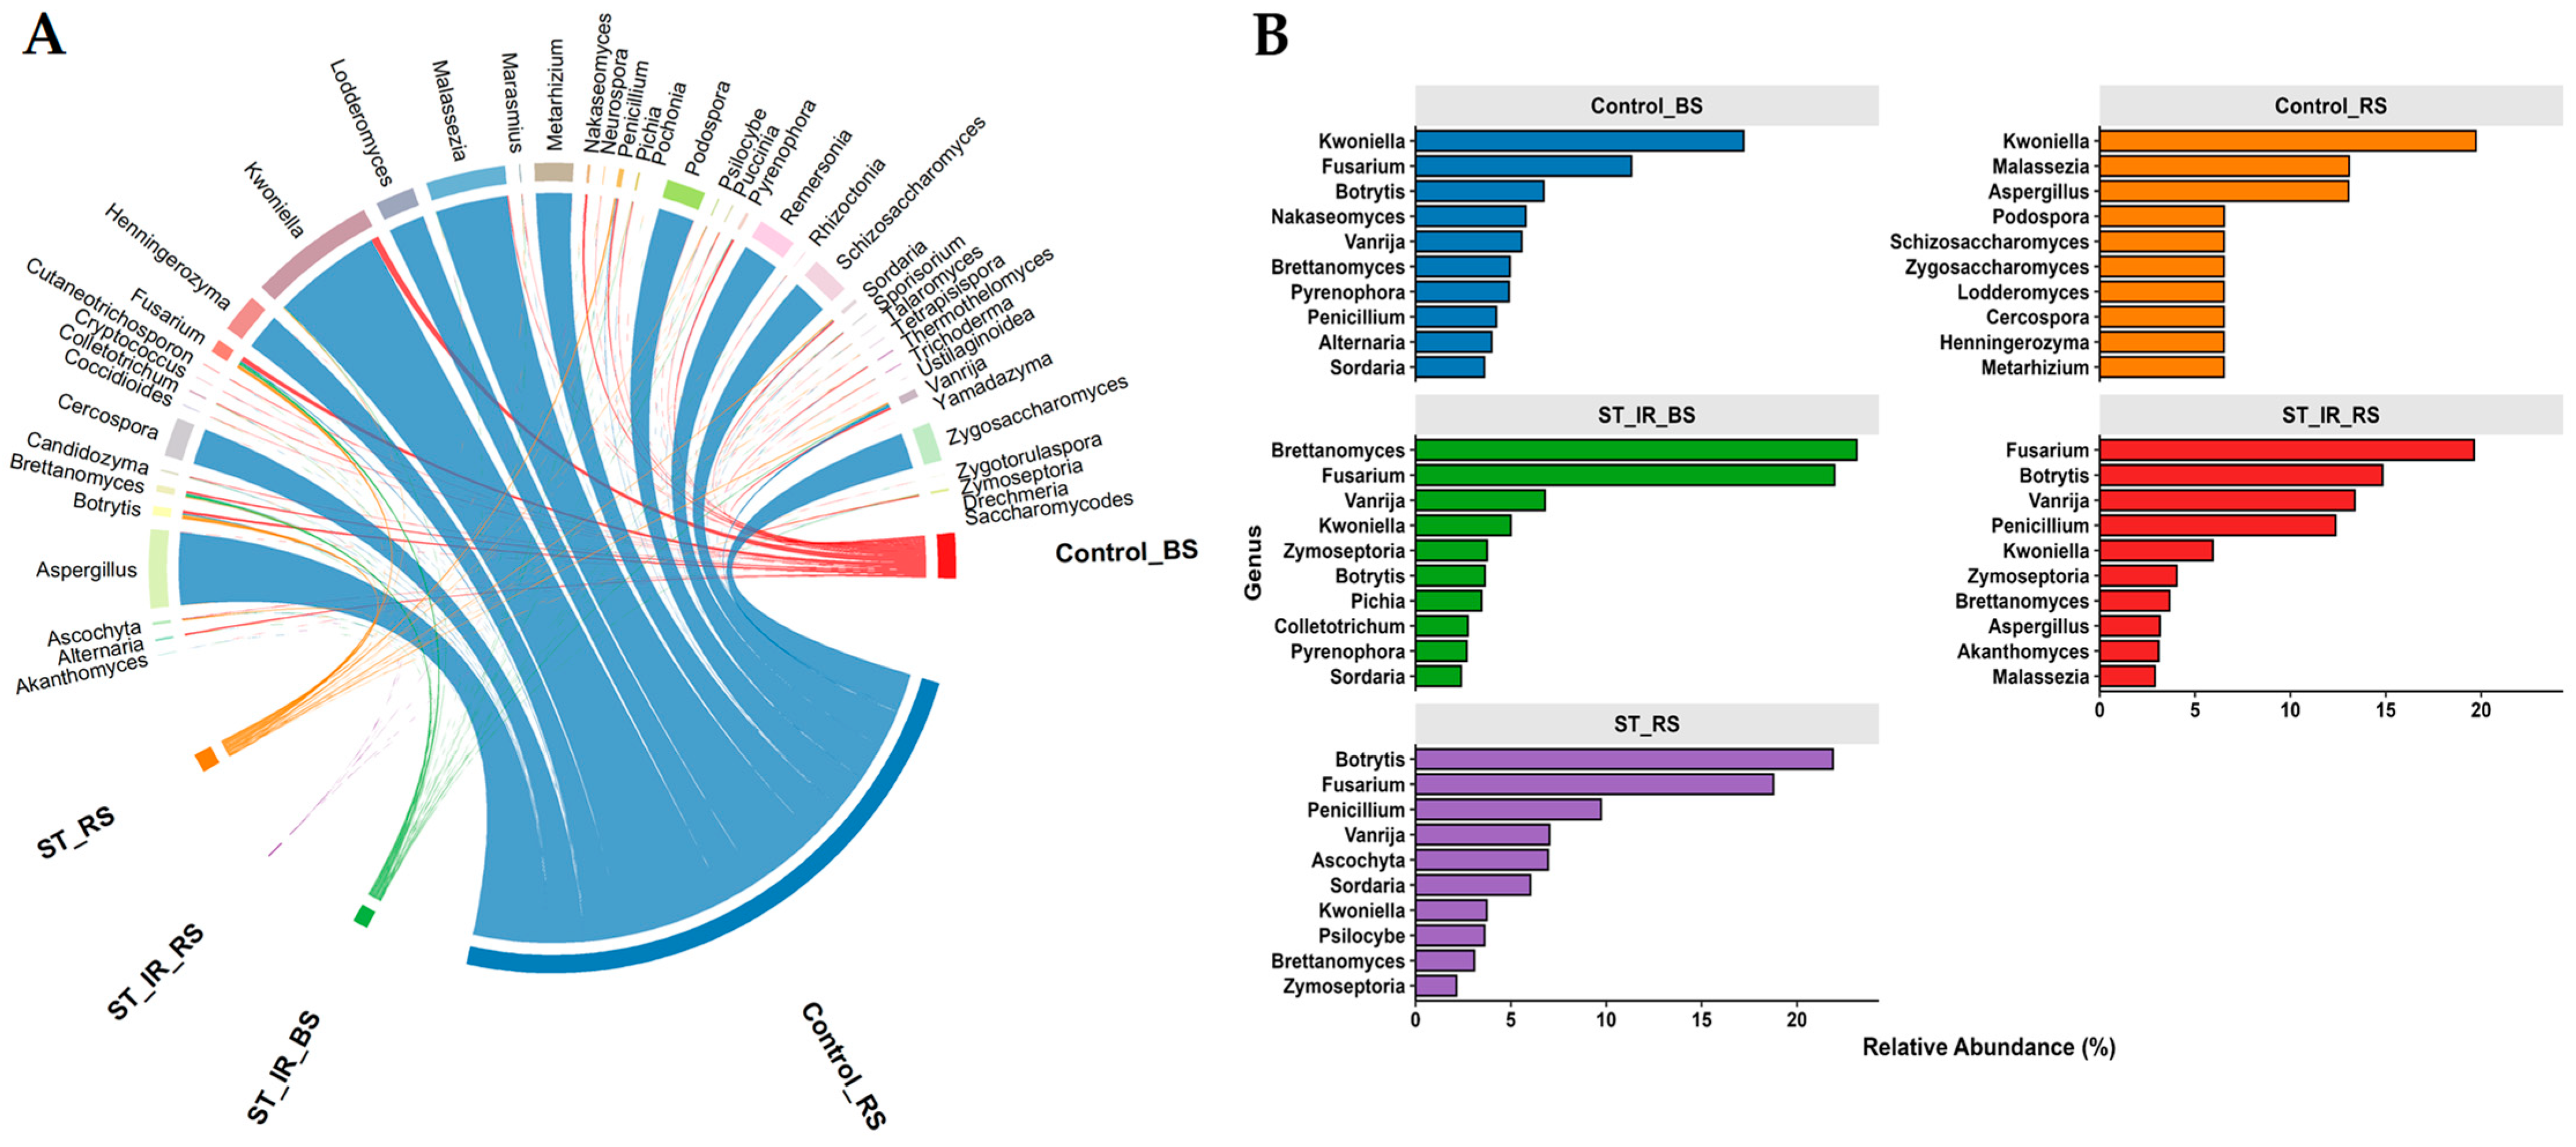
The relative abundance of fungal genera in soil shows a distinct variation between treatments, treatment-specific (Supplementary Data File S1). At the tillering growth stage (GS3), a statistically strong dominance at p < 0.05 of Kwoniella (19.7%), followed by Malassezia (13.1%) and then Aspergillus (13.01%) in the rhizosphere soil of the untreated group (Control_RS) (Figure 3A), was observed (Figure 3B). Other predicted genera included Podospora (6.53%), Schizosaccharomyces (6.52%), Zygosaccharomyces (6.52%), Lodderomyces (6.52%), Cercospora (6.52%), Henningerozyma (6.52%), and Metarhizium (6.52%), displaying almost identical relative abundance (Figure 3B). In contrast, the surrounding bulk soil of untreated plants group (Control_BS) was statistically (at p < 0.05) highlighted by a lower relative abundance, in which Kwoniella (17.21%), followed by Fusarium (11.31%), Botrytis (6.71%), Nakaseomyces (5.77%), Vanrija (5.56%), Brettanomyces (4.95%), Pyrenophora (4.91%), Penicillium (4.24%) were the most pronounced genera.
Rhizosphere of seeds pretreated (ST_RS) with microbial consortium exhibited a shift toward Botrytis, Fusarium, and Penicillium, showing the most relative abundance of 21.9%, 18.81%, and 9.71%, respectively. The observed reduced relative abundance of Kwoniella (3.73%) at p < 0.05 compared to untreated rhizosphere plants (Control_RS) suggests that seed pretreatment with the consortium may induce alterations in the fungal community in the rhizosphere. In the ST_RS group, the relative abundance of several genera (among top genera), including Ascochyta (6.94%), Sordaria (6.02%), Vanrija (7.02%), Brettanomyces (3.07%), Psilocybe (3.62%), and Zymoseptoria (2.14%), was significantly higher (p < 0.05) compared to Control_RS (Figure 3B).
Compared to ST_RS, rhizosphere drenching of seeds pretreated with microbial consortium (ST_IR_RS) induces a shift in dominance of the top fungal genera, with a significant increase (p < 0.05) in the relative abundance of dominant genera such as Fusarium (19.61%), Botrytis (14.81%), Vanrija (13.37%), and Penicillium (12.41%). The relative abundance of Kwoniella (5.93%) and Malassezia (2.90%) was significantly lower (p < 0.05) in ST_IR_RS compared to the ST_RS group (Figure 3B). Relative abundance of other predicted genera, including Zymoseptoria, Brettanomyces, Aspergillus, and Akanthomyces, was assayed as 4.04%, 3.66%, 3.15%, and 3,12%, respectively.
In contrast to Control_BS, seed treatment followed by rhizosphere drenching with microbial consortium significantly induced a shift among the top genera in surrounding bulk soil (ST_IR_BS) toward Brettanomyces (23.12%) and Fusarium (22.01%), while Kwoniella was reduced (5.01%). Vanrija, Zymoseptoria, Botrytis, Pichia, Colletotrichum, Pyrenophora, and Sordaria remained nearby, each exhibiting a relative abundance greater than 7%.
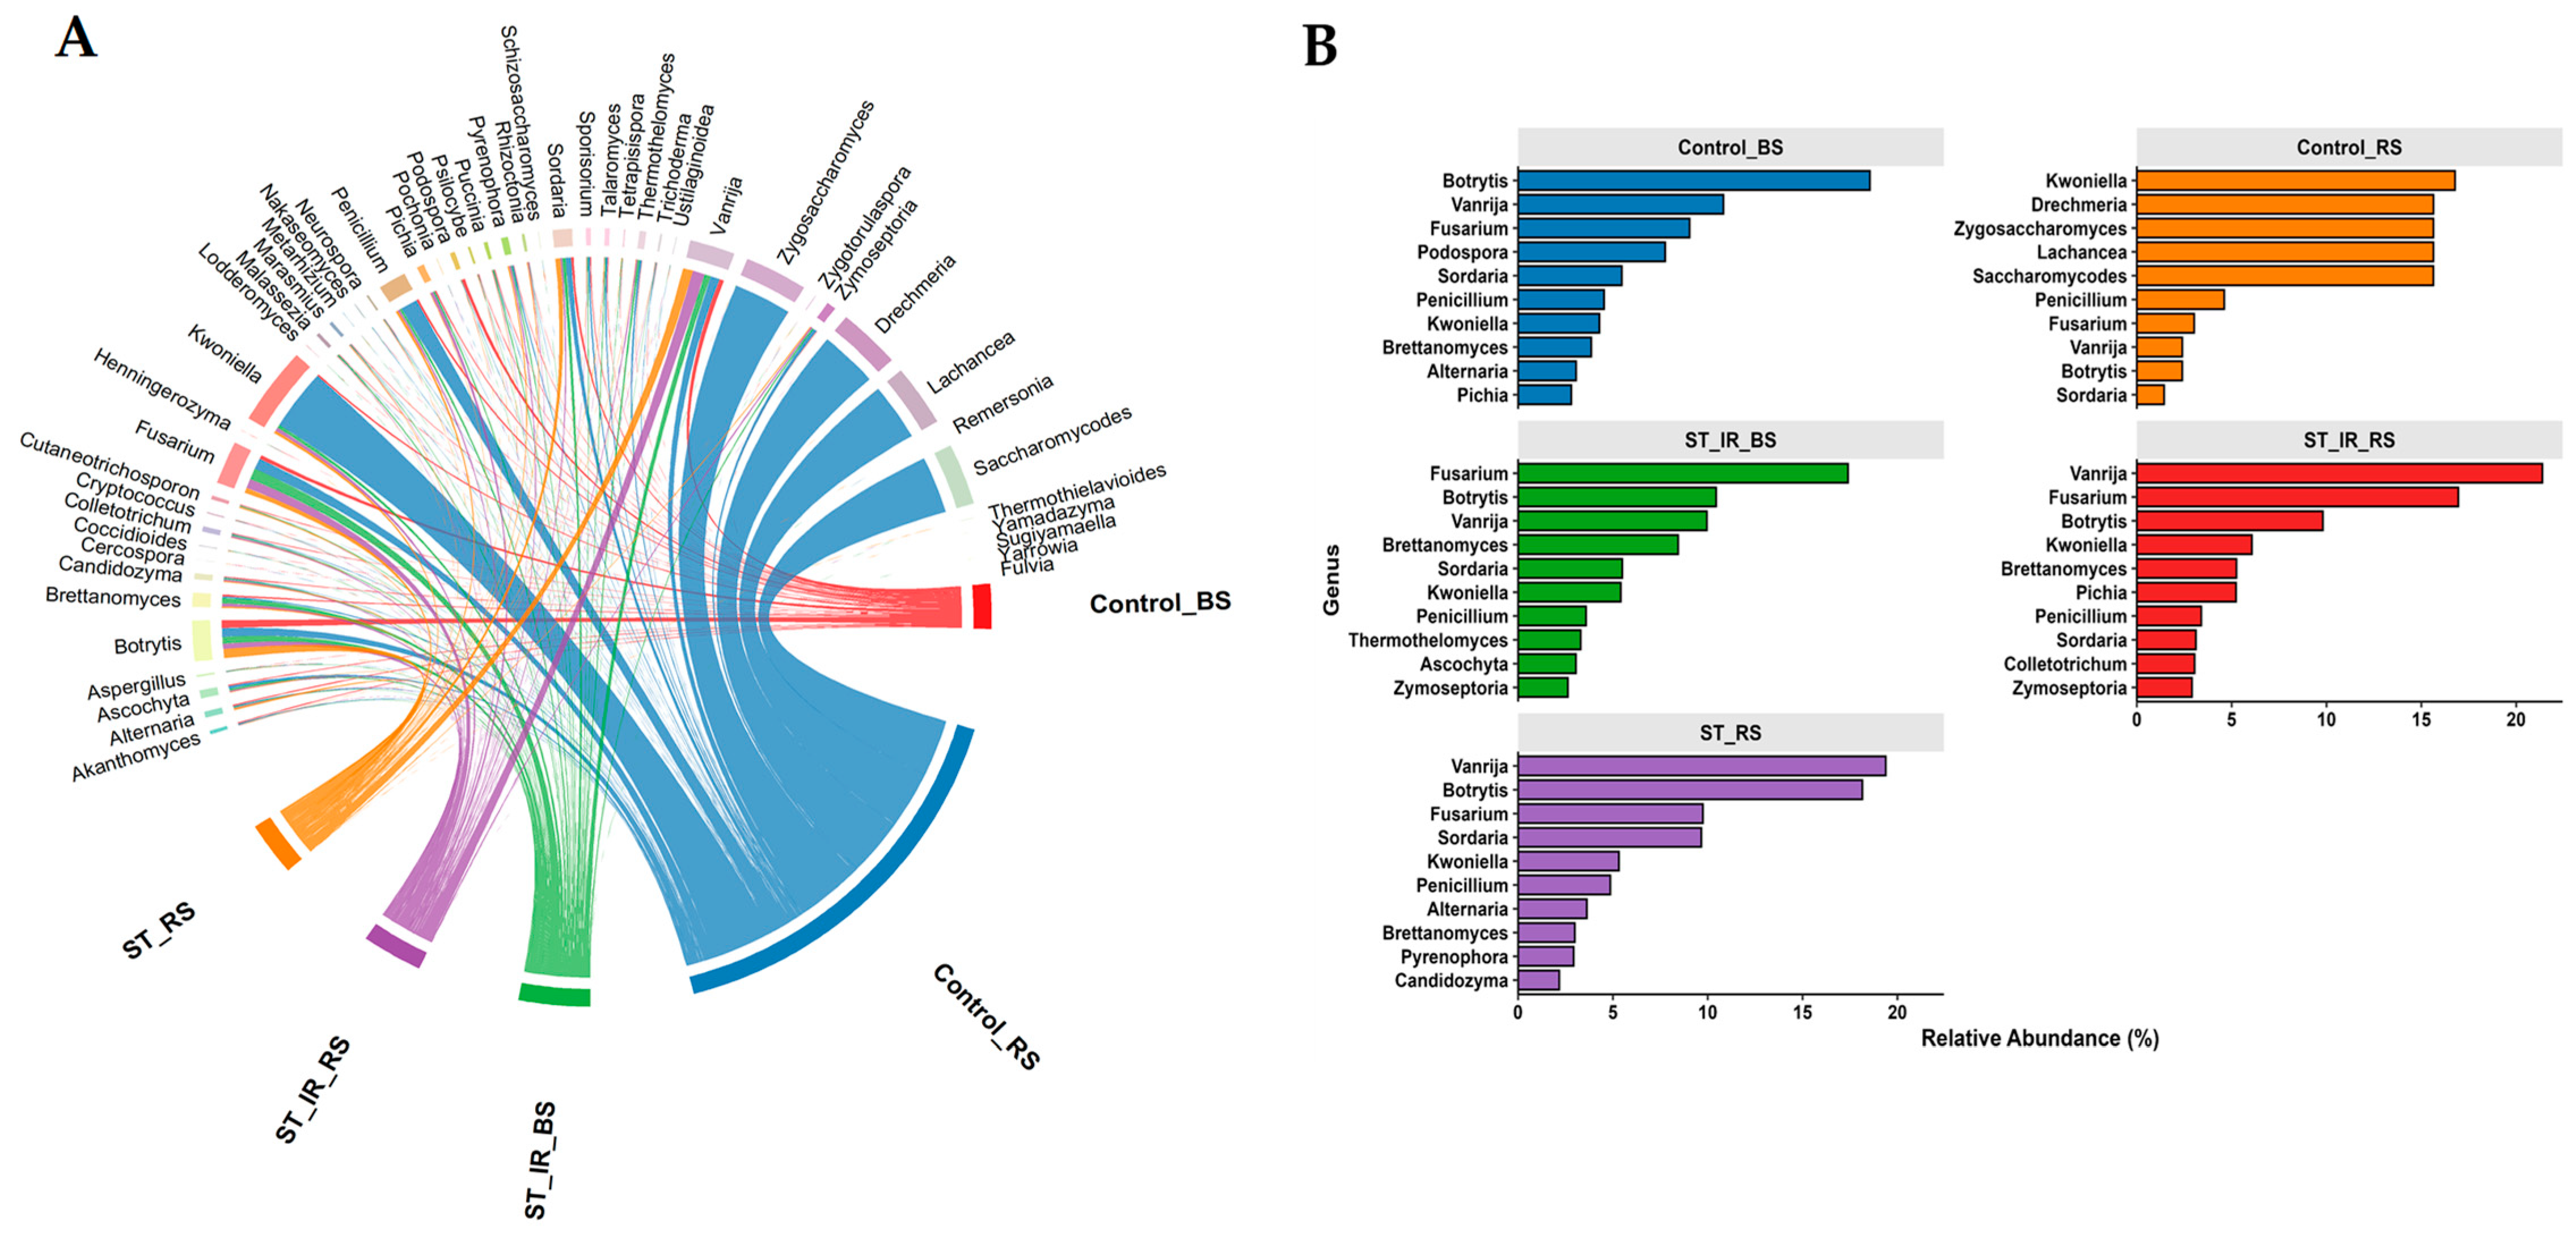
At the booting growth stage (GS5) (Figure 4), Kwoniella significantly (at p < 0.05) remained dominant in the rhizosphere of untreated seed (Control_RS) (Figure 4A), as previously observed at GS3 in control RS (Figure 3B). Drechmeria (15.63%), Lachancea (15.63%), Zygosaccharomyces (15.63%), and Saccharomycodes (15.63%) emerged as part of the predicted main genera. This indicates the plants’ ability to drive selection. Other genera, including Penicillium (4.60%), Fusarium (3.02%), Vanrija (2.39%), Botrytis (2.39%), and Sordaria (1.43%), maintained low abundance. In the bulk soil of untreated seed (Control_BS), Botrytis became the dominant genus, followed by Vanrija and Fusarium, with relative abundances of 18.54%, 10.82%, and 9.04%, respectively. In the seed-treated rhizosphere (ST_RS), Vanrija (19.4%) and Botrytis (18.2%) were the most prevalent genera, followed by Fusarium (9.74%) and Sordaria (9.66%). The high relative abundance of Vanrija in ST_RS indicates that seed pretreatment with a bacterial consortium may induce its proliferation in the rhizosphere of barley. Other prevalent genera included Kwoniella (5.31%), Penicillium (4.86%), Alternaria (3.62%), Brettanomyces (2.99%), Pyrenophora (2.93%), and Candidozyma (2.17%) were predicted among the most abundant genera.
The fungal community in ST_IR_RS was dominated by Vanrija (21.4%), Fusarium (16.9%), and Botrytis (9.81%). We observed that rhizosphere drenching with microbial consortium significantly (at p < 0.05) increases the relative abundance of Fusarium (17.42%) and Botrytis (10.41%) in the surrounding bulk soil (ST_IR_BS) of barley. Brettanomyces remained prominent in bulk soil, showing a relative abundance of 8.4%. The persistence of Fusarium in ST_IR_BS suggests that rhizosphere drenching with a microbial consortium induces the proliferation of this genus.
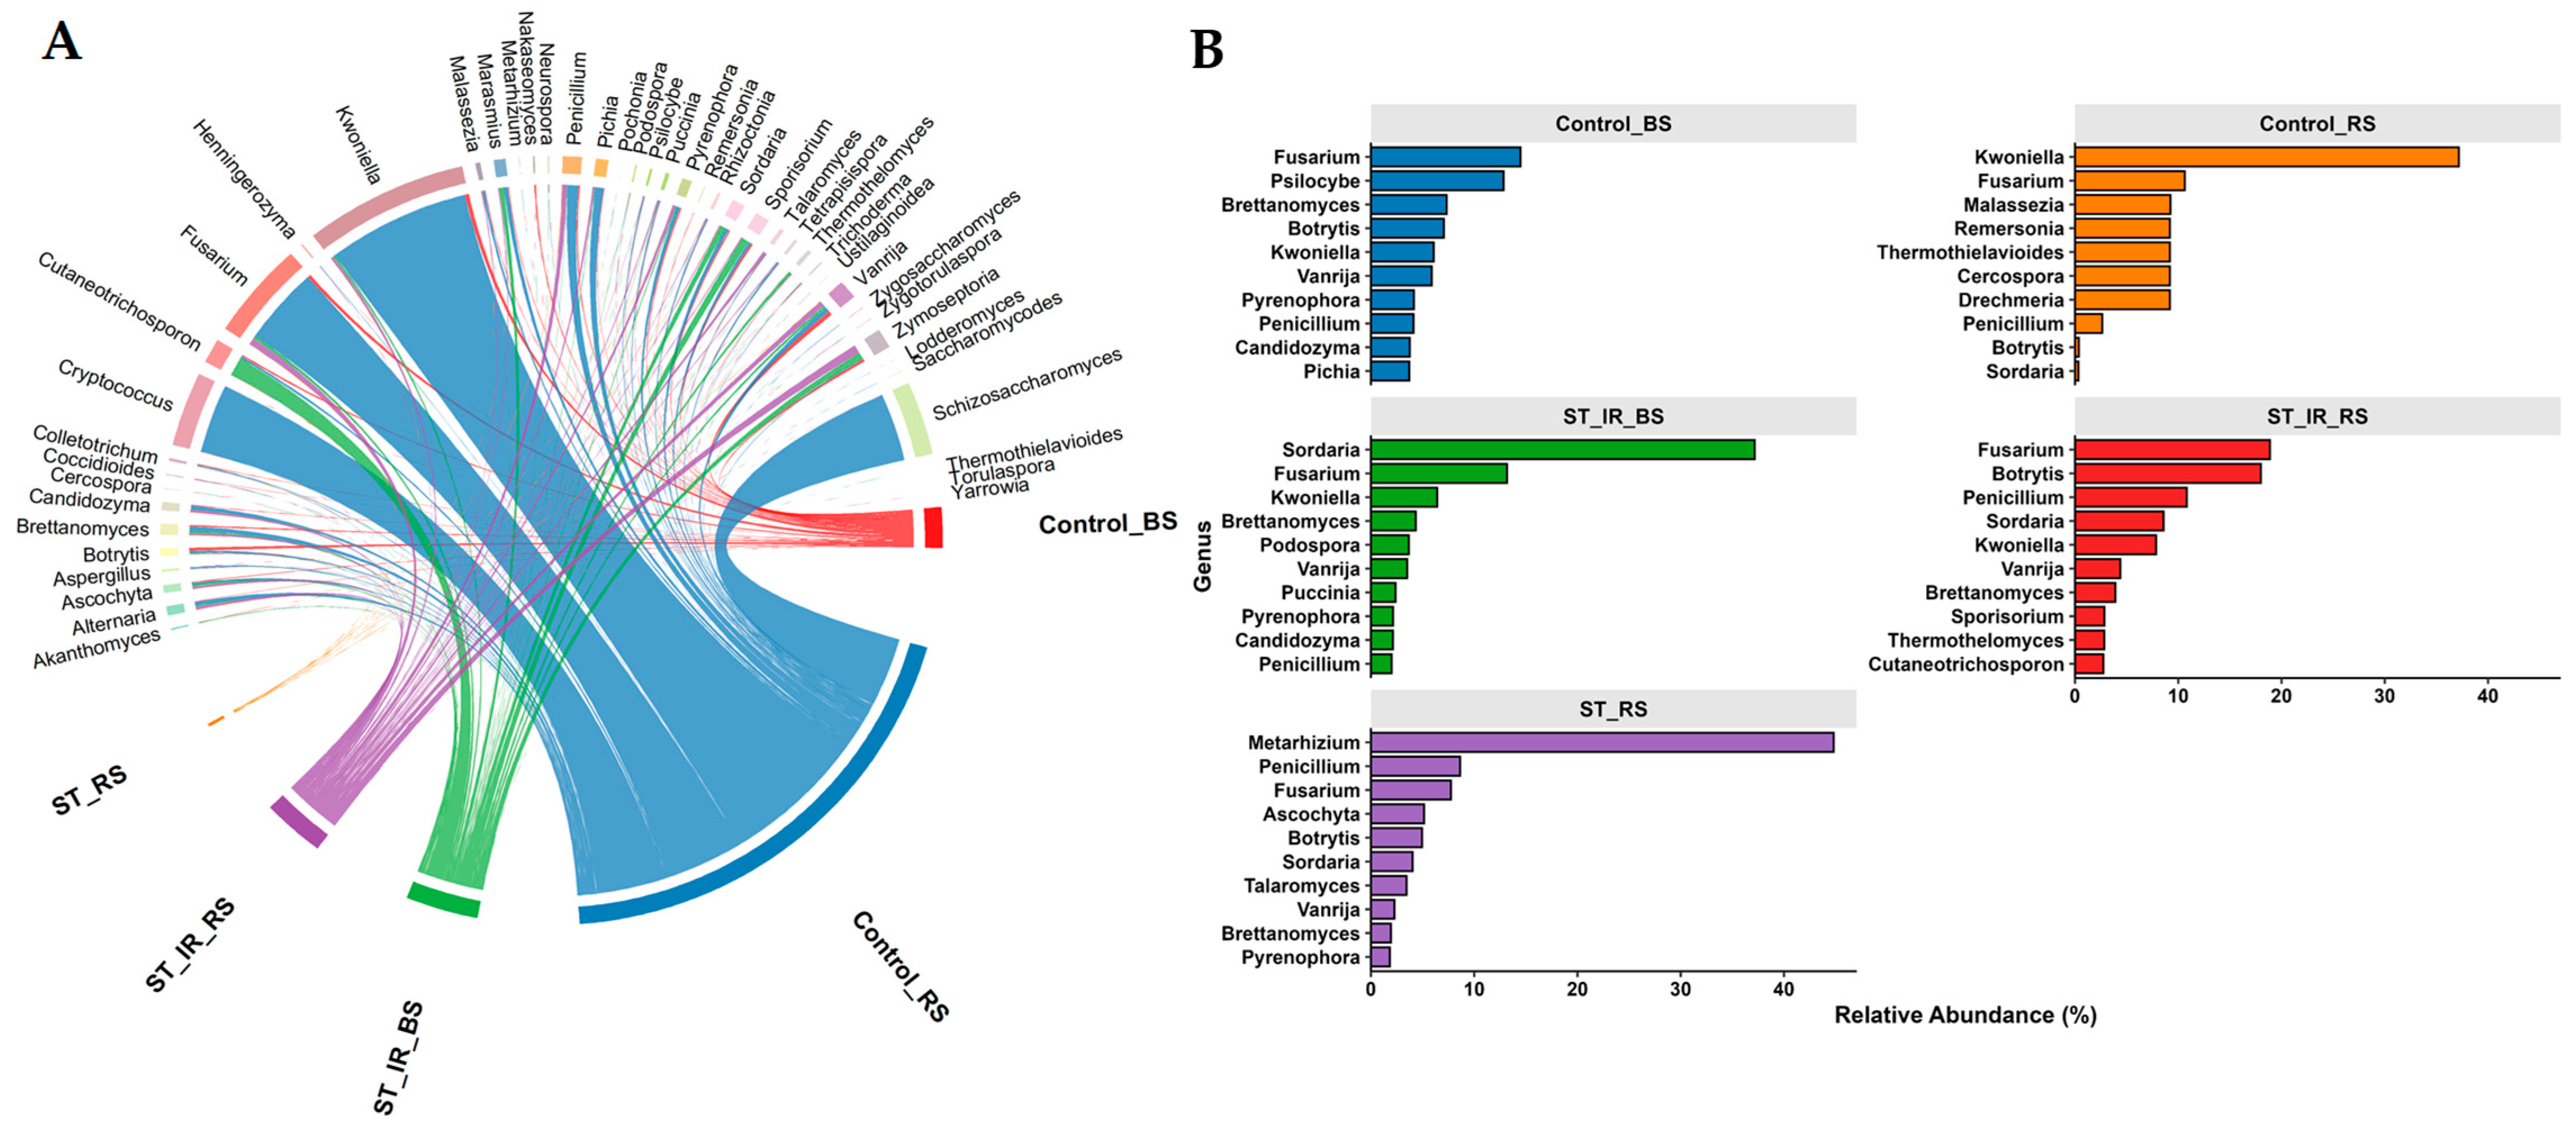
Relative abundance of the fungal community in the barley soil at the flowering growth stage (GS7) under the treatments of microbial consortium is shown in Figure 5. The surrounding bulk soil of the untreated group (Control_BS) was characterized by the predominance of Fusarium (14.48%) and Psilocybe (12.83%) and by the prevalence of Brettanomyces (7.33%) and Botrytis (7.05%) (Figure 5A). Kwoniella, Vanrija, Pyrenophora, Penicillium, Candidozyma, and Pichia were found in low relative abundances (<6.5%). In the rhizosphere of untreated plants (Control_RS), the relative abundance of Kwoniella increased by up to 37.17% (Figure 5B). A key observation in ST_RS was the presence of Metarhizium, which significantly (at p < 0.05) emerged as the dominant genus with a relative abundance of 44.81%. Penicillium (8.63%), Fusarium (7.74%), Ascochyta (5.14%), Botrytis (4.95%), Sordaria (4.04%), Talaromyces (3.44%), Vanrija (2.26%), Brettanomyces (1.93%), and Pyrenophora (1.83%) were secondary, indicating a potential suppression of other genera. Seed treatment followed by rhizosphere drenching (ST_IR_RS) with microbial consortium at GS7 led to the predominance of Fusarium (18.89%), Botrytis (18.01%), and Penicillium (10.83%). In contrast, rhizosphere drenching (ST_IR_RS) overwhelmingly induced the dominance of Sordaria (37.15%) in the surrounding bulk soil (ST_IR_BS), whereby Fusarium (13.17%) was the second most abundant. The relative abundance of Kwoniella, Brettanomyces, Podospora, Vanrija, Puccinia, Pyrenophora, Candidozyma, and Penicillium was moderate, showing a value of 6.41%, 4.33%, 3.67%, 3.51%, 2.37%, 2.14%, 2.12%, and 2.01%, respectively.
The relative abundance of the fungal community in the soil of barley at the dough development stage (GS9) is presented in Figure 6. Control_BS was characterized by the presence of Vanrija (11.61%) and Kwoniella (10.61%), which were the most abundant. Fusarium (8.92%) and Botrytis (7.96%), Zymoseptoria (6.41%), Sporisorium (5.011%), Cutaneotrichosporon (4.33%), Sordaria (4.04%), and Brettanomyces (3.92%) remained persistent as previously observed in GS7. In the rhizosphere of untreated plants (Control_RS), Kwoniella (32.82%) remained dominant, with a relative increase in Fusarium (18.06%) and Cryptococcus (16.10%) abundance being observed. Penicillium (2.44%), Pichia (1.93%), Brettanomyces (1.16%), Vanrija (1.13%), Marasmius (1.01%), and Alternaria (0.93%) were the second most abundant genera. ST_RS was characterized by predominance of Penicillium (13.30%), Fusarium (10.94%), Candidozyma (10.93%), and Vanrija (9.83%). Sordaria, Kwoniella, Pyrenophora, Brettanomyces, Sporisorium, and Alternaria, as the second most abundant genera, were present at relatively low abundances of 7.51%, 6.12%, 5.54%, 4.69%, 3.78%, and 3.63%, respectively, in ST_RS.
At GS9, we observed that rhizosphere drenching at GS9 significantly (at p < 0.05) induced shifts among dominant fungal genera in ST_RS (Figure 6B), where Zymoseptoria (14.72%) and Fusarium (11.80%) were the most predominant genera in ST_IR_RS. Vanrija (9.54%), Penicillium (8.67%), Pyrenophora (5.28%), Alternaria (5.06%), Talaromyces (4.87%), and Kwoniella (4.62%) were the second most abundant genera. Rhizosphere drenching of ST_RS at GS9 with microbial consortium significantly at p < 0.05 also led to the predominance of Cutaneotrichosporon (28.1%), Sporisorium (11.45%), Zymoseptoria (9.98%), Sordaria (8.30%), and Marasmius (6.55%). Fusarium (4.65%) and Thermothelomyces (4.10%) were less prominent in this stage in the ST IR BS group.

3.3. Fungal Community Composition and Unique Taxa Across Experimental Groups

The composition of the fungal community, including shared and unique microbial taxa among each experimental group, was analyzed (Figure 7, Supplementary Data File S1). The result demonstrated that all groups shared a core microbiome consisting of 69 fungal species. Each group carried at least one unique fungal species, except for Control_BS, which served as the baseline reference for the initial microbial profile, sharing all its taxa with other groups. Fulvia fulva was found to be unique to ST_RS, while Purpureocillium takamizusanense was identified in ST_IR_RS. Three fungal species, including Fusarium musae, Fusarium fujikuroi, and Torulaspora globosa, predicted in the Control_RS group were absent in other groups. Shared species, including Malassezia japonica, Schizosaccharomyces pombe, and Yarrowia lipolytica, were found between Control_RS, ST_IR_BS, and ST_IR_RS. Australozyma saopauloensis and Cryptococcus decagattii were unique to ST_IR_RS and ST_IR_BS. Additionally, Control_RS and ST_IR_RS shared the unique species Saccharomycodes ludwigii, which were absent in other groups. Fusarium verticillioides, Cryptococcus bacillisporus, and Rhizophagus irregularis were predicted in ST_RS, Control_RS, Control_BS, and ST_IR_BS. Podospora pseudoanserina and Lodderomyces beijingensis appeared in Control_BS, Control_RS, and ST_IR_BS. Lachancea thermotolerans was present solely in Control_RS and ST_RS. Drechmeria coniospora was restricted to ST_IR_RS and Control_RS, while Podospora bellae-mahoneyi was found only in Control_BS, ST_RS, ST_IR_RS, and ST_IR_BS.

3.4. Fungal Subcommunity Analysis

The subcommunity analysis of fungal microbiome revealed that the plant rhizosphere displayed a higher relative abundance of abundant taxa compared to bulk soils (BS), which indicated the ability of roots to attract and select different microbial taxa (Figure 8). In GS3, the surrounding bulk soil (Control_BS) rare taxa showed a relative abundance of 23% and remained at the same level at GS5, GS7, and GS9. An identical tendency was observed for abundant and moderate taxa. Compared to Control_BS, the rhizosphere soil, including Control_RS, ST_RS, ST_IR_RS groups, as well as ST_IR_BS, was characterized by the predominance of abundant taxa, showing a relative abundance of up to 72.7%. However, as the plants developed, a decline in abundant taxa led to an increase in moderate taxa, which displayed a relative abundance of 60.6%.
The obtained results also indicated that rhizosphere drenching promotes the proliferation of moderate microbial taxa (Figure 8). At GS9, the relative abundance of moderate microbial taxa in the ST_IR_RS group reached up to 43.8% compared to Control_BS. Furthermore, the results revealed that seeds pretreated with bacterial consortium followed by rhizosphere drenching cause a sharp decline in abundant taxa (63.8% to 26.0%) and a rise in moderate taxa (19.6% to 65.1%) at the later growth stage GS9 in the surrounding bulk soil (ST_IR_BS). A slight late shift in moderate taxa was also observed in the rhizosphere of the Control_BS at GS9, with their relative abundance increasing to 31.5%. These findings emphasize the ability of seed pretreatment with microbial consortium to establish an early specialized rhizosphere microbiome, while pretreatment combined with rhizosphere drenching leads to significant community restructuring in the bulk soil at a later stage.

3.5. Correlation Between Soil Properties and Microbial Community

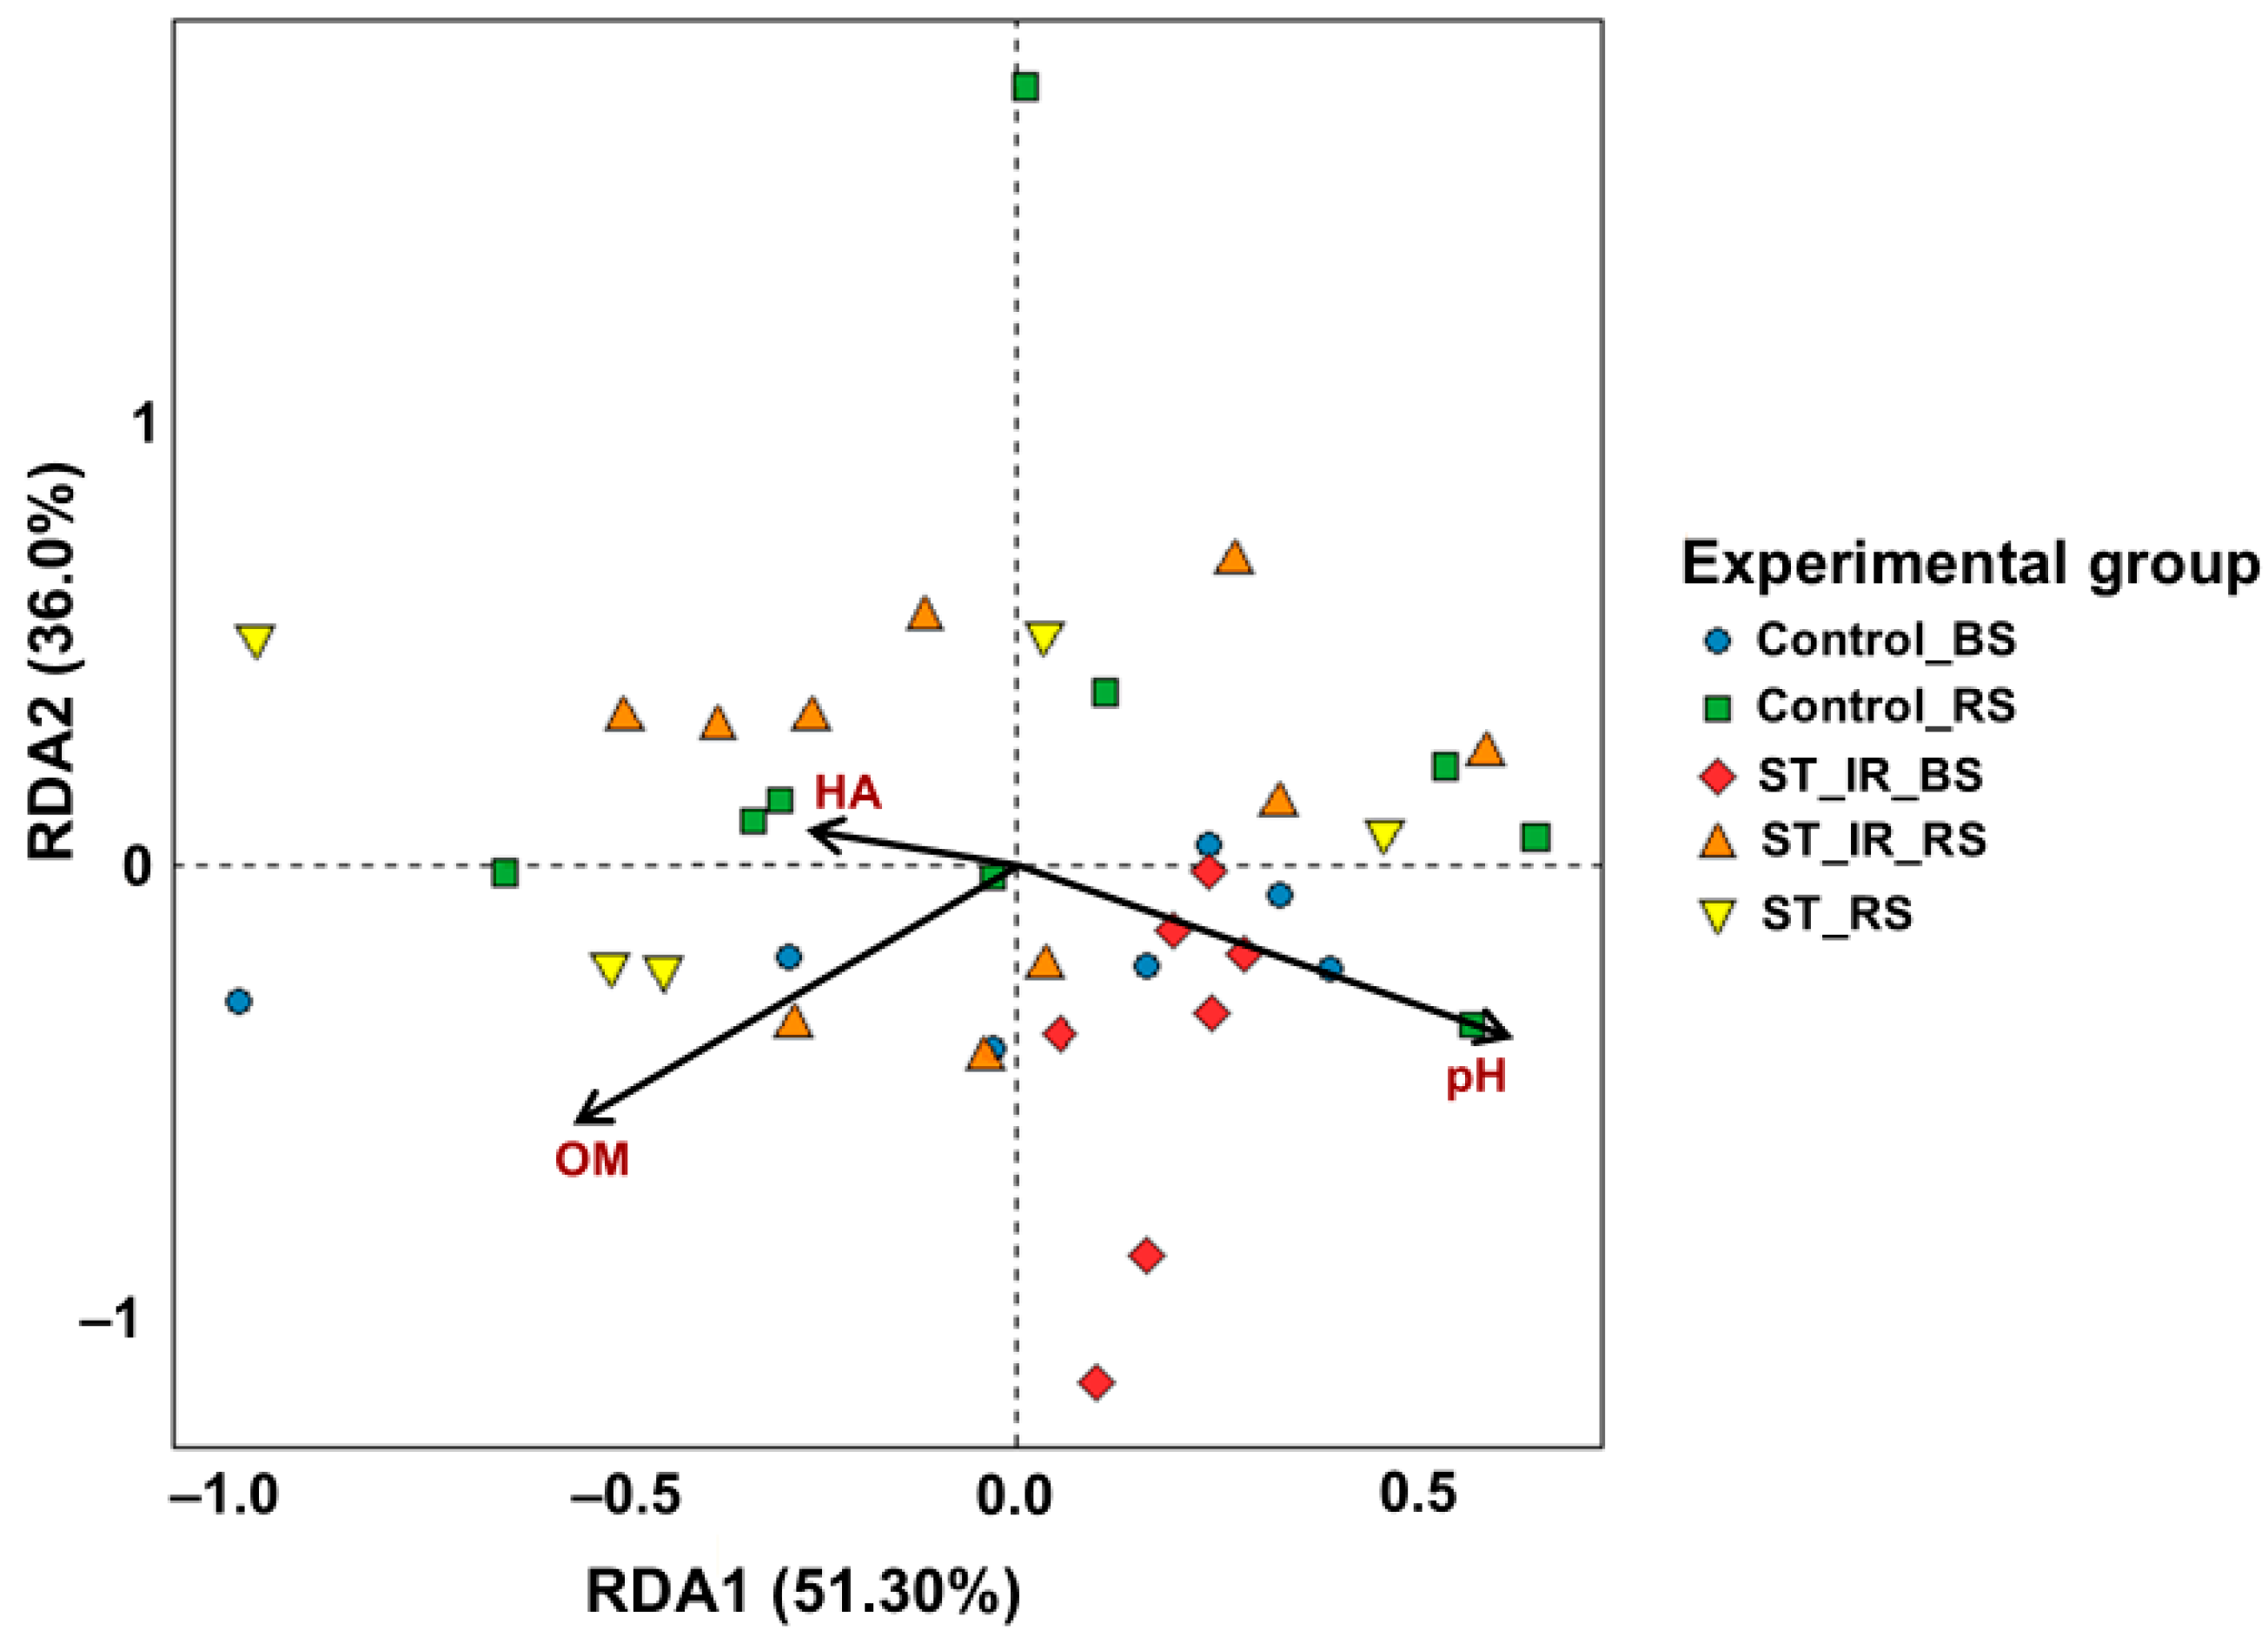
To determine whether changes in microbial communities were associated with soil properties (Supplementary Data File S2), a correlation analysis was conducted (Figure 9). The redundancy analysis (RDA) showed a significant effect (F = 1.3063, p = 0.0911). Variance partitioning across constrained axes identified RDA1 (51.30% of explained variance) as the primary factor gradient, which was strongly associated with organic matter (OM) and pH, while RDA2 (36.0%) captured secondary structuring forces, leaving minimal variance (12.8%) for RDA3 linked to humic acid (HA). Term-wise analysis clarified distinct ecological roles. Organic matter (OM) emerged as a statistically significant predictor (F = 1.70; p = 0.0499), accounting for 43.4% of constrained variance. Conversely, HA showed a redundancy (F = 0.62, p = 0.8819), contributing to 15.8% of explained variance without significant independent effects. pH exhibited a marginal non-significant effect (F = 1.60; p = 0.0607), contributing to 40.8% of explained constrained variance. The results indicated OM as a primary environmental filter, while pH served as a secondary modulator of species distributions.

3.6. Fold Change Dynamics of Phytopathogens in the Rhizosphere of Barley Under Different Treatments

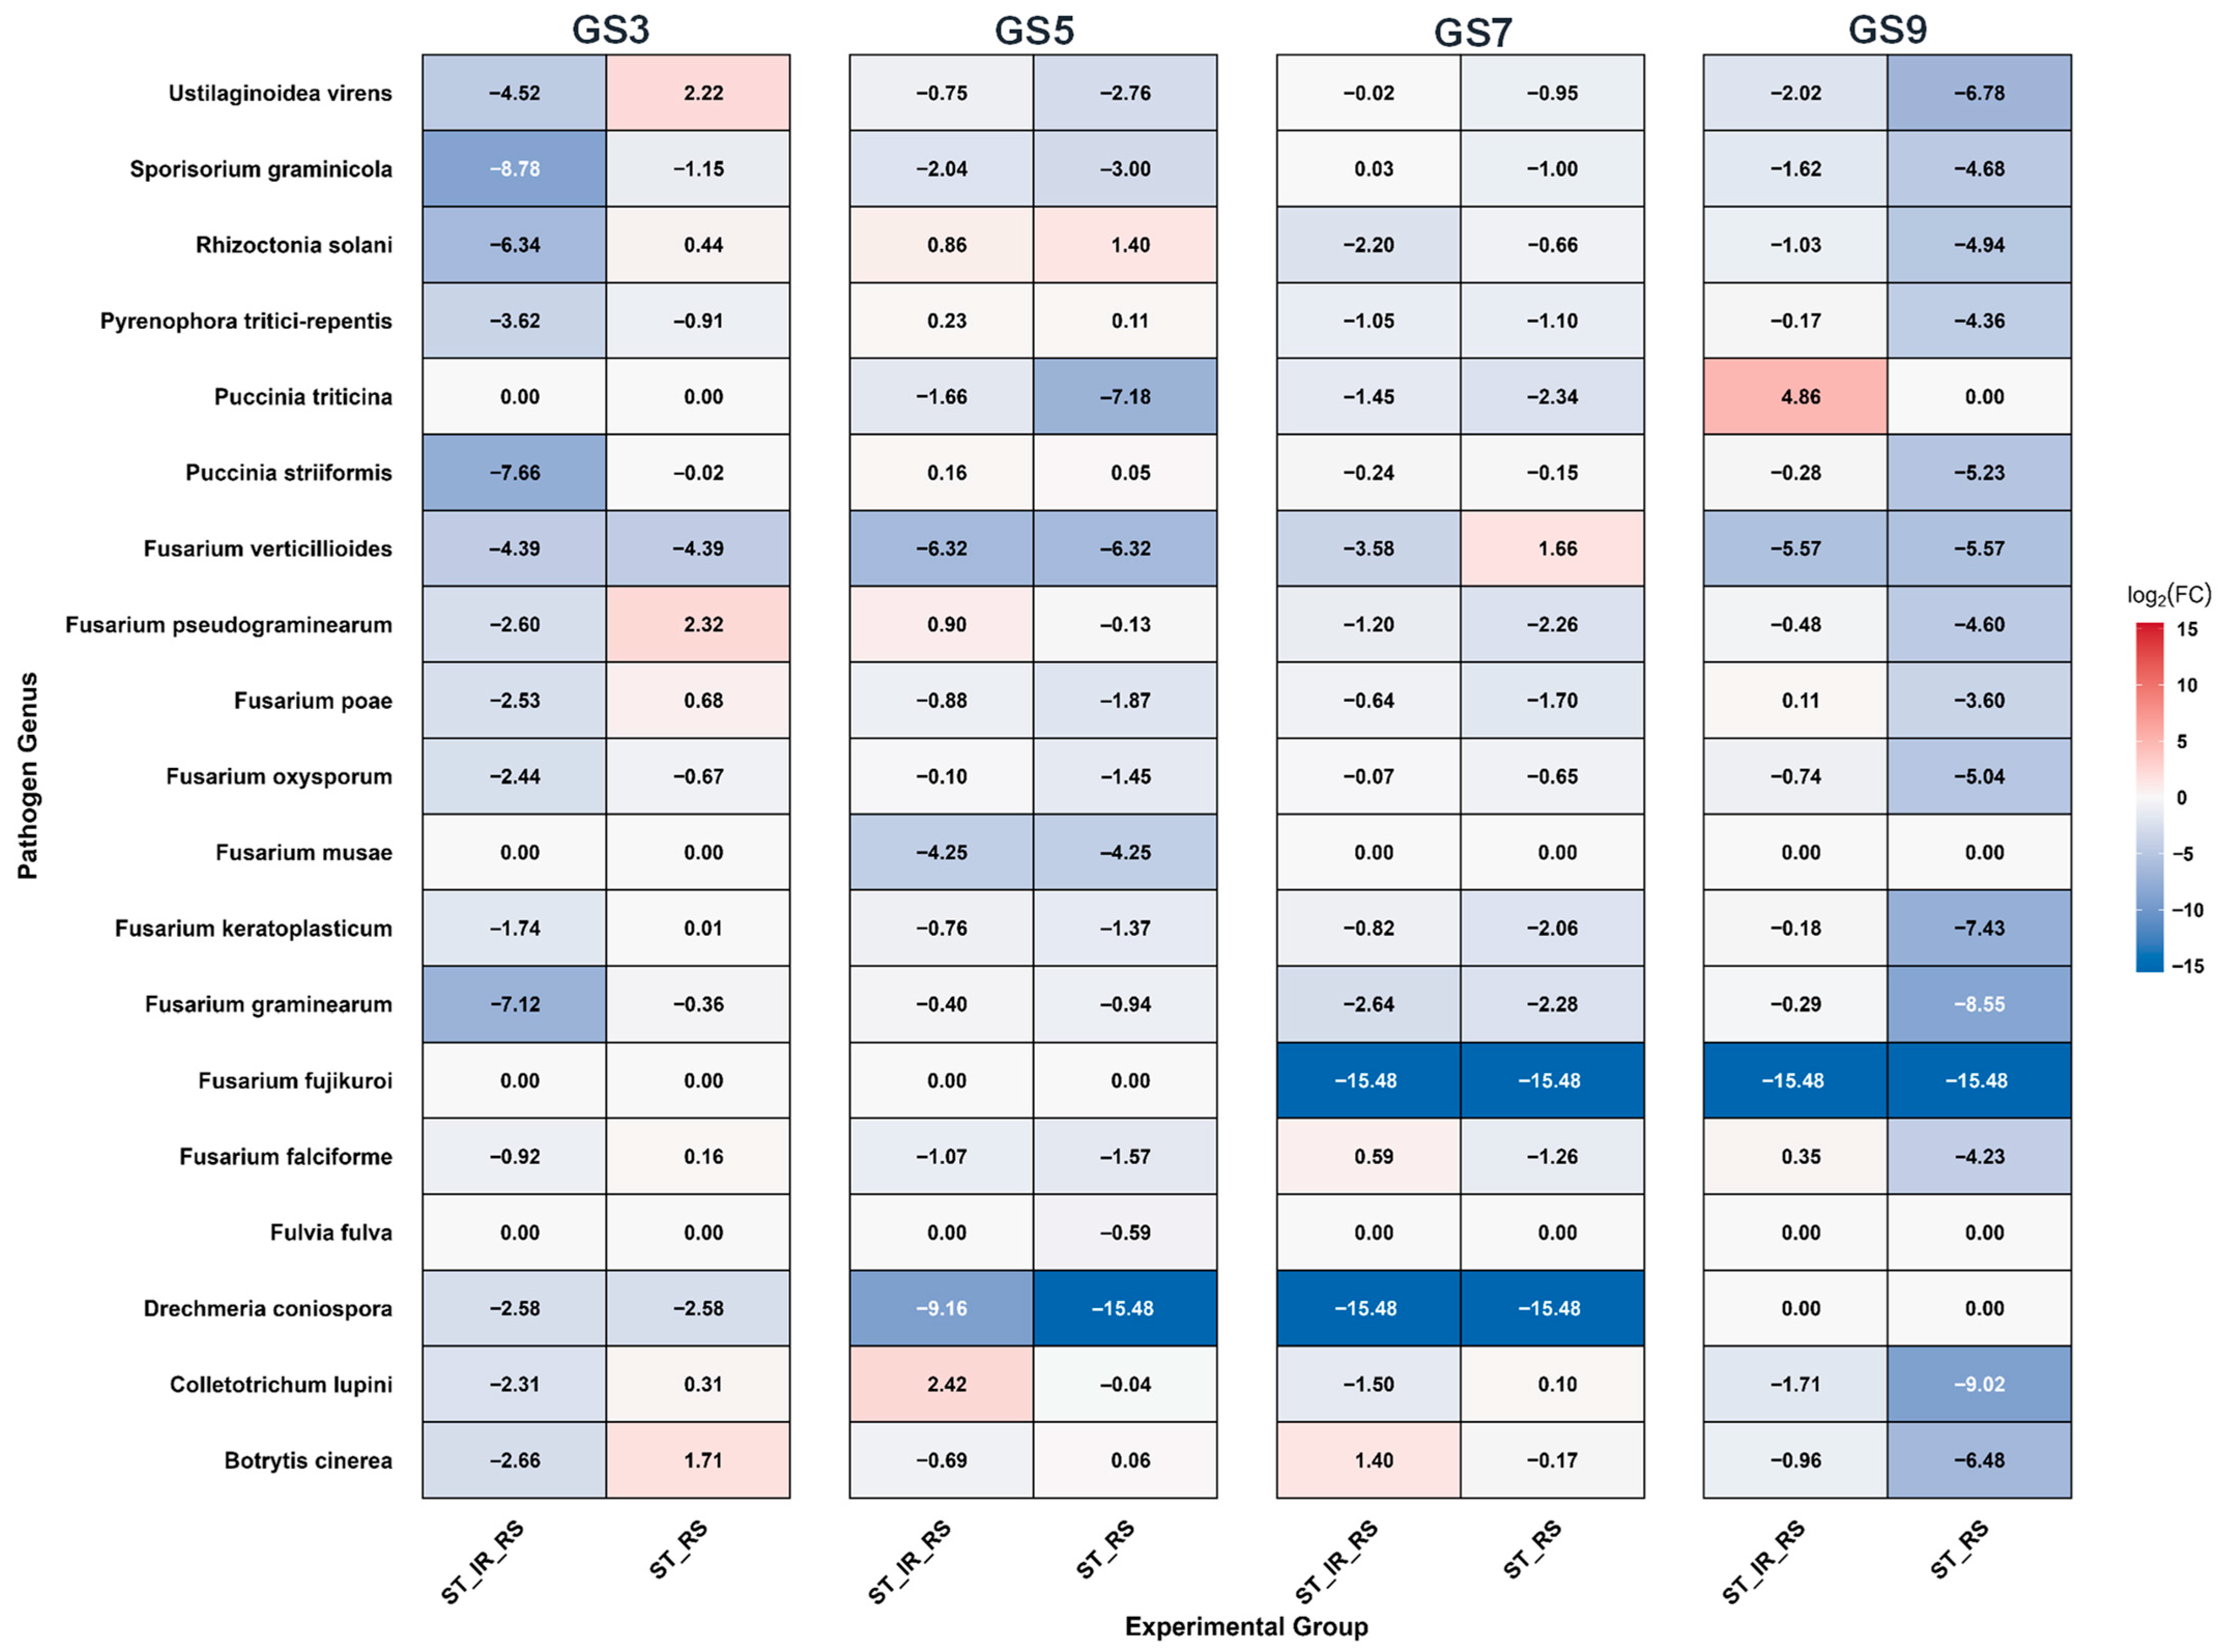
The effect of a microbial consortium on phytopathogenic fungi in the barley rhizosphere was evaluated (Figure 10). At the early growth stage (GS3), the rhizosphere of seed pretreated with the microbial consortium (ST_RS) showed partial suppression of most barley-associated phytopathogenic fungi, whereas ST_IR_RS induced a more pronounced log2 FC reduction (p < 0.05). Notably, Fusarium graminearum, F. oxysporum, and F. verticillioides exhibited significant declines in log2FC. At GS3, seed treatment particularly suppressed Drechmeria coniospora and F. verticillioides, with log2FC values of −2.58 and −4.39, respectively. By GS5, pathogen dynamics shifted. Under ST_IR_RS, most phytopathogens showed a significant rebound, with Ustilaginoidea virens and Rhizoctonia solani displaying positive log2FCs. However, F. verticillioides remained suppressed. In comparison to ST_IR_RS, seed pretreatment at GS5 was effective in suppressing most fungal pathogens, particularly some Fusarium species. The resulting observation indicates that GS5 is a crucial growth stage when only seed pretreatment with the microbial consortium (ST_RS) reduces the presence of pre-existing pathogens in barley. At GS7, both treatments showed variable effects, with several pathogens exhibiting partial recovery in log2 FC from early suppression. For instance, F. falciform (0.59) and Botrytis cinerea (1.40) increased in ST_IR_RS. Conversely, under seed pretreatment (ST_RS), an increment was observed only for F. verticillioides, with a log2FC of 1.66. At the later stage (GS9), all phytopathogens in ST_RS remained suppressed, especially Fusarium species such as F. fujikuroi (−15.48) and F. graminearum (−8.55), indicating high suppression levels. Under ST_IR_RS, compared to ST_RS, GS9 showed positive log2 FCs for Puccinia triticina (4.86), Fusarium poae (11), and F. falciform (0.35).

3.7. Alpha Diversity Analysis of Fungal Communities in Barley Under Treatments of Microbial Consortium

The fungal community’s alpha diversity was assessed, with results presented in Figure 11. Both bulk and rhizosphere soil from untreated plants (Control_BS and Control_RS) showed higher diversity metrics compared to other treatments. Control bulk soil displayed the highest Shannon diversity and Simpson dominance, assayed as 3.47 ± 0.11 and 0.95 ± 0.01, respectively. Rhizosphere soil from untreated plant groups (Control_RS) showed Shannon and Simpson index values of 3.22 ± 0.15 and 0.92 ± 0.02, respectively, which indicate the rhizosphere preferential recruitment of specific microorganisms. In contrast, seeds pretreated with microbial consortium (ST_RS) induced a decrement in Shannon and Simpson indices of fungal community, demonstrating the lowest value (Shannon: 2.91 ± 0.27; Simpson: 0.88 ± 0.07) as compared to other groups. In addition, ST_IR_RS displayed almost identical Shannon and Simpson indices to the untreated plant group, showing a value of 3.18 ± 0.16 and 0.94 ± 0.01, respectively. In addition, the obtained result also revealed that rhizosphere drenching of pretreated seeds reduces Shannon and Simpson indices in the surrounding bulk soil. Shannon and Simpson values were up to 1.12- and 1.05-fold, respectively, lower than values from Control_BS. Species richness, as measured by both Chao1 and observed OTUs, revealed a reduction in the estimated number of species in the fungal community in the rhizosphere of ST_RS, showing a value of 54.75 ± 17.34. The highest species richness and community evenness were observed in Control_RS and its counterpart Control_BS, with the Chao1 values of 74 ± 2.4 and 68 ± 4.24, respectively. Their community evenness values were 0.82 ± 0.03 and 0.75 ± 0.04, respectively. Seed treatment (ST_RS) as well as seed treatment followed by rhizosphere drenching (ST_IR_RS) slightly reduced fungal community evenness. Their value was estimated as 0.74 ± 0.12 and 0.81 ± 0.05, respectively. In the bulk soil of the seed treatment followed by rhizosphere drenching group (ST_IR_BS), no statistically significant difference in microbial community evenness was observed compared to the bulk soil of the untreated plants (Control_BS) (adj. p < 0.05, Wilcoxon test)

3.8. Fungal Community Interaction Networks in Soil Under Treatments at Different Growth Stages

Key Topological Features in Network Co-Occurrence

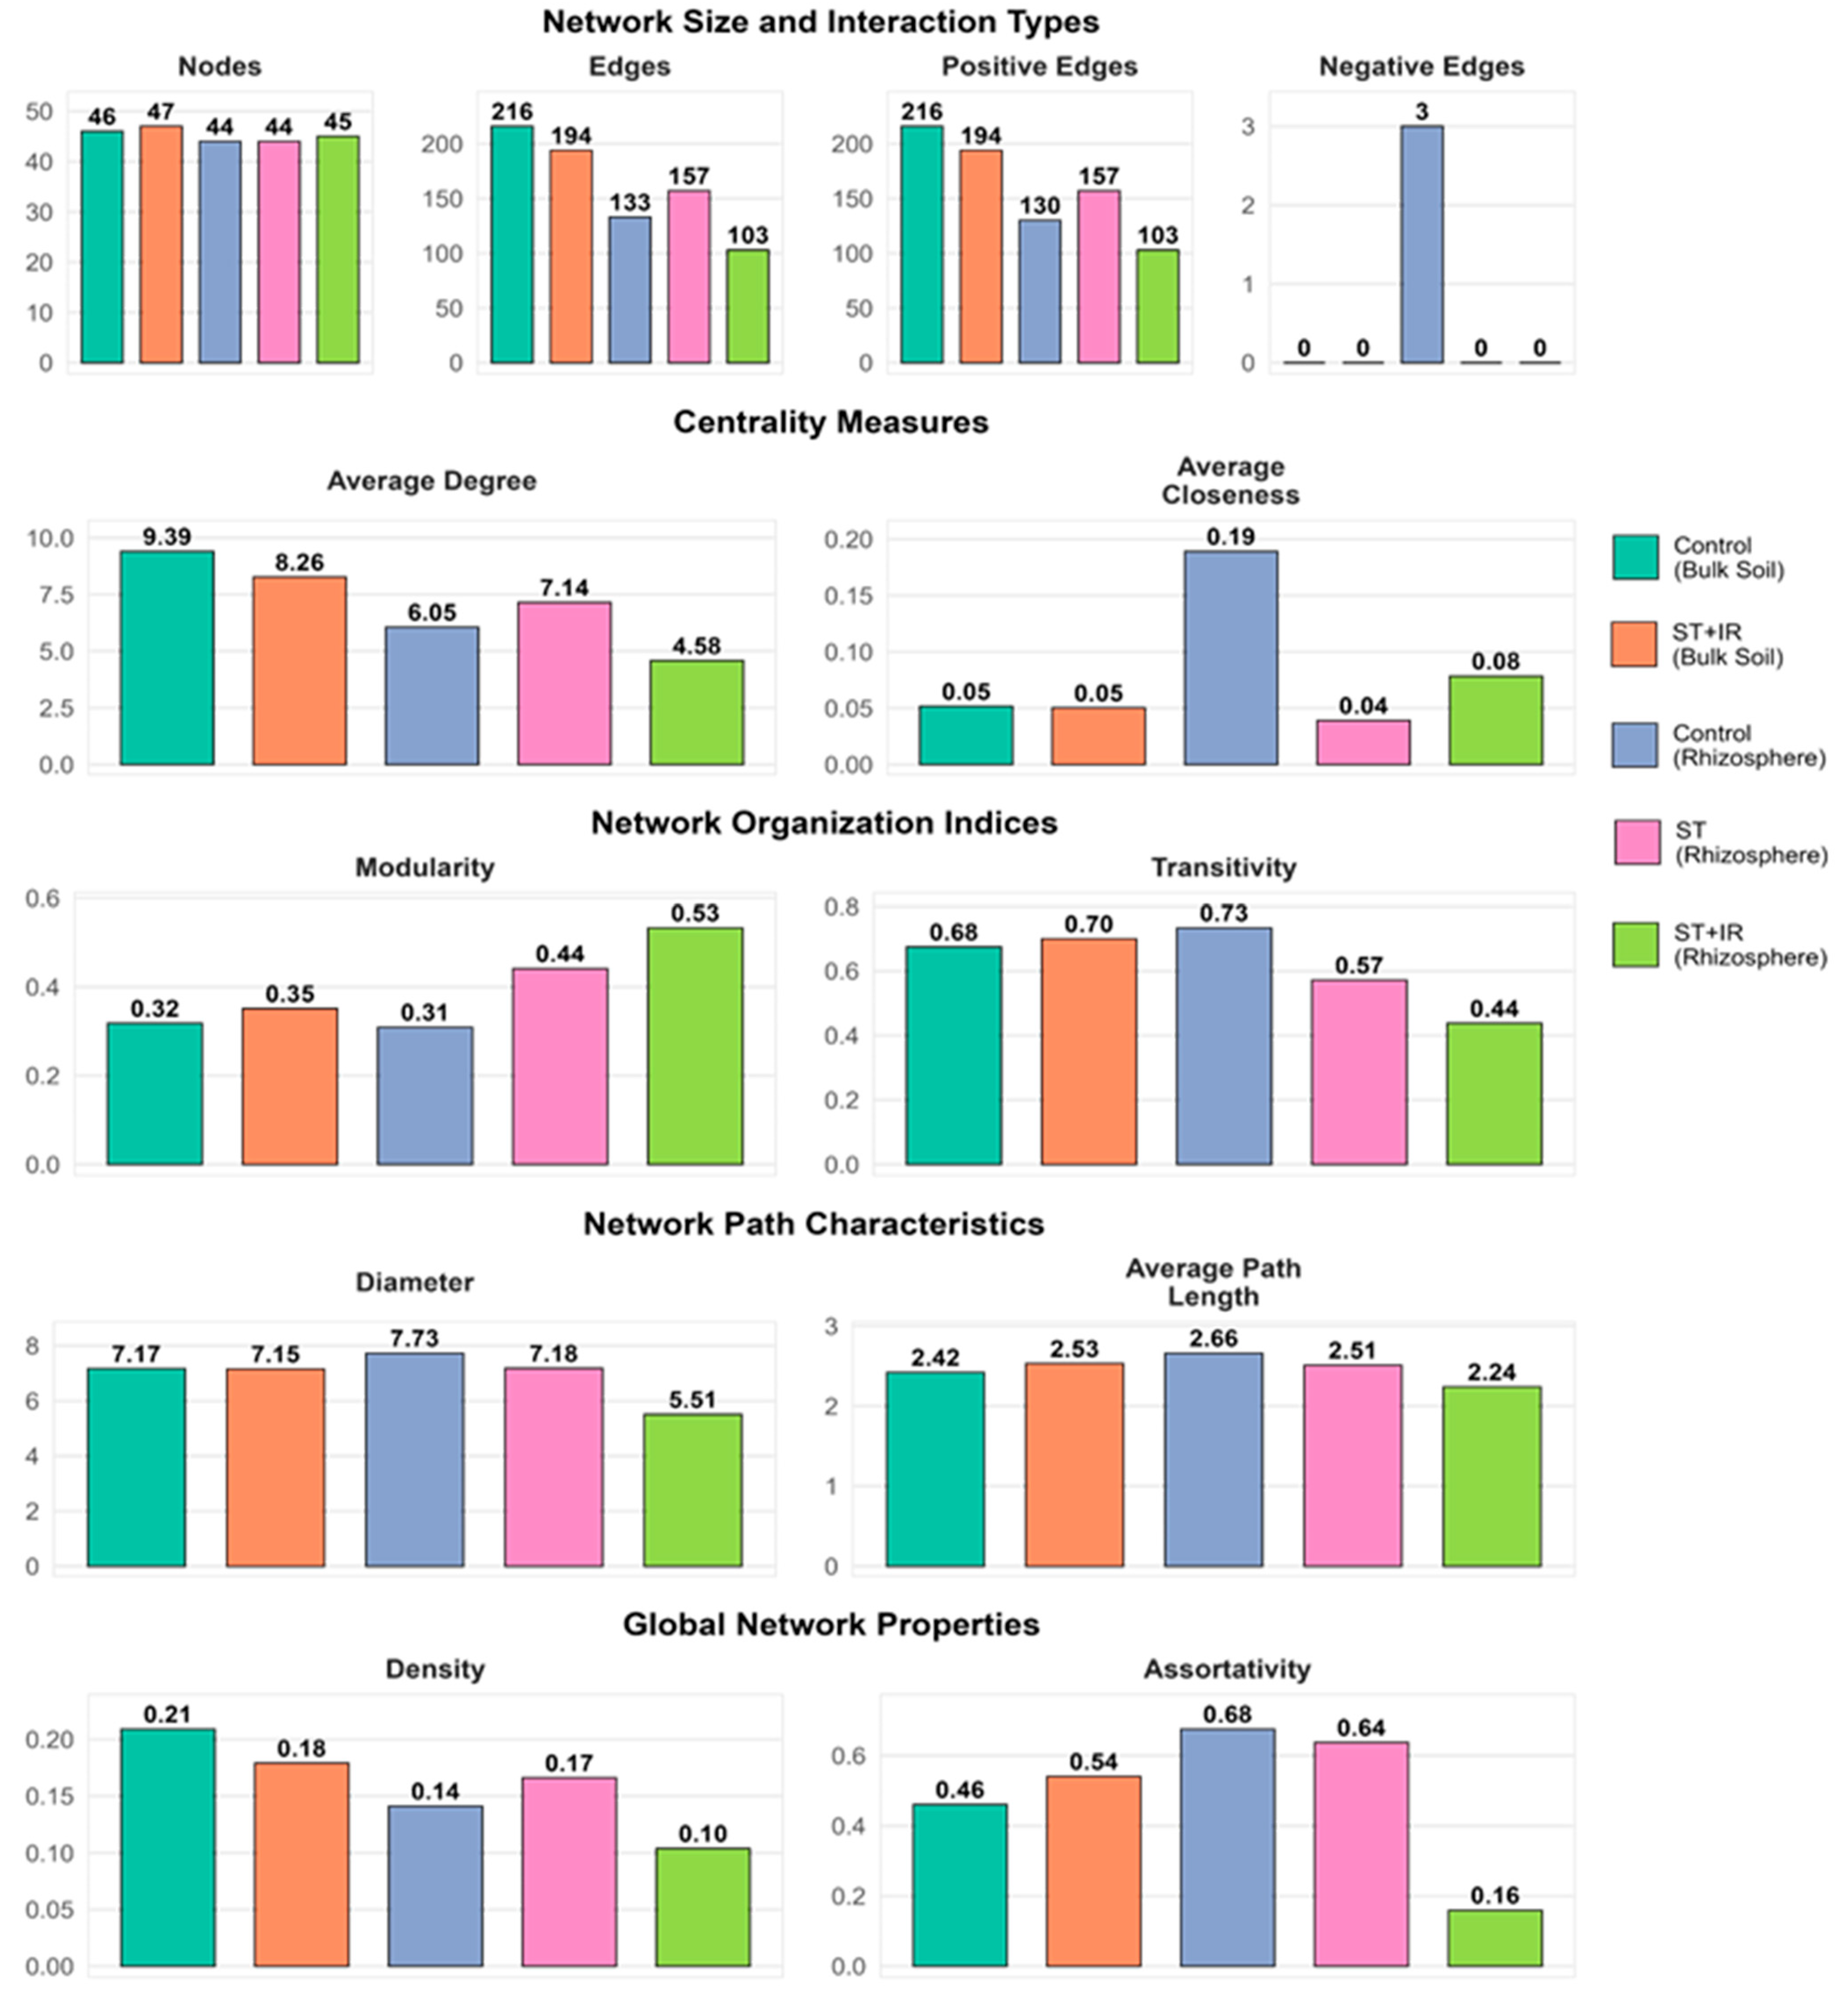
We performed network metric analysis across treatments to establish the effect of the microbial consortium on fungal communities (Figure 12 and Table 2). The obtained results revealed that among the analyzed groups, the network of control bulk soil (Control_BS) and seeds pretreated followed by rhizosphere drenching (ST_IR_BS) displayed slightly more nodes, consisting of 46 and 47 genera, respectively (Table 2). In contrast, the networks of the rhizosphere of untreated plants (Control RS), seed-pretreated plants (ST RS), and seed-pretreated plants followed by rhizosphere drenching (ST_IR_RS) comprised 44, 44, and 45 genera, respectively (Supplementary Data File S3). All microbial networks showed a positive correlation between nodes (edges), except for the rhizosphere of untreated plants (Control_RS), which displayed 3 negative edges found between Aspergillus and Talaromyces, Cryptococcus and Nakaseomyces, as well as Malassezia and Talaromyces. Their correlation values were determined as −0.78, −0.75, and −0.8, respectively. Bulk soil (Control_BS) displayed the highest connectivity (216 edges), whereas the rhizosphere of seeds treated following plant irrigation (ST_IR_RS) with microbial consortium was the lowest (103 edges). Seed treatment following rhizosphere drenching with the consortium induced changes in the network structure of ST_IR_BS, reducing connectivity by 10% (194 edges). Network density followed a similar trend. A decrease of up to 50% of network density was seen in the comparison of Control_BS to ST_IR_RS, indicating a potential reduction in the interaction of the microbial community under combined treatment.
The effects of microbial consortium treatment on network organization revealed a progressive modularity index increment. Drenching the rhizosphere of pretreated seeds with a microbial consortium enhanced the network structure of both ST_RS and ST_IR_BS. Compared to Control_RS, network modularity increased by 12.91% in ST_IR_BS and 16.98% in ST_RS. In contrast, network transitivity (clustering coefficient), which measures the degree to which nodes in a network tend to cluster together, displays an inverse pattern. Network transitivity decreased by 41.09% compared to the rhizosphere of untreated plants (Control_RS).
The network of rhizosphere seeds pretreated following plant irrigation with microbial consortium (ST_R_RS) also displayed the lowest transitivity, diameter, assortativity, as well as the shortest average path length compared to other networks. These topological changes suggest that seed pretreatment followed by rhizosphere drenching induces disproportionate network simplification, where microbial interactions become more modular and less clustered. The reduction in connections under ST_IR treatment, coupled with increased modularity, indicates a shift toward specialized and fragmented communities.
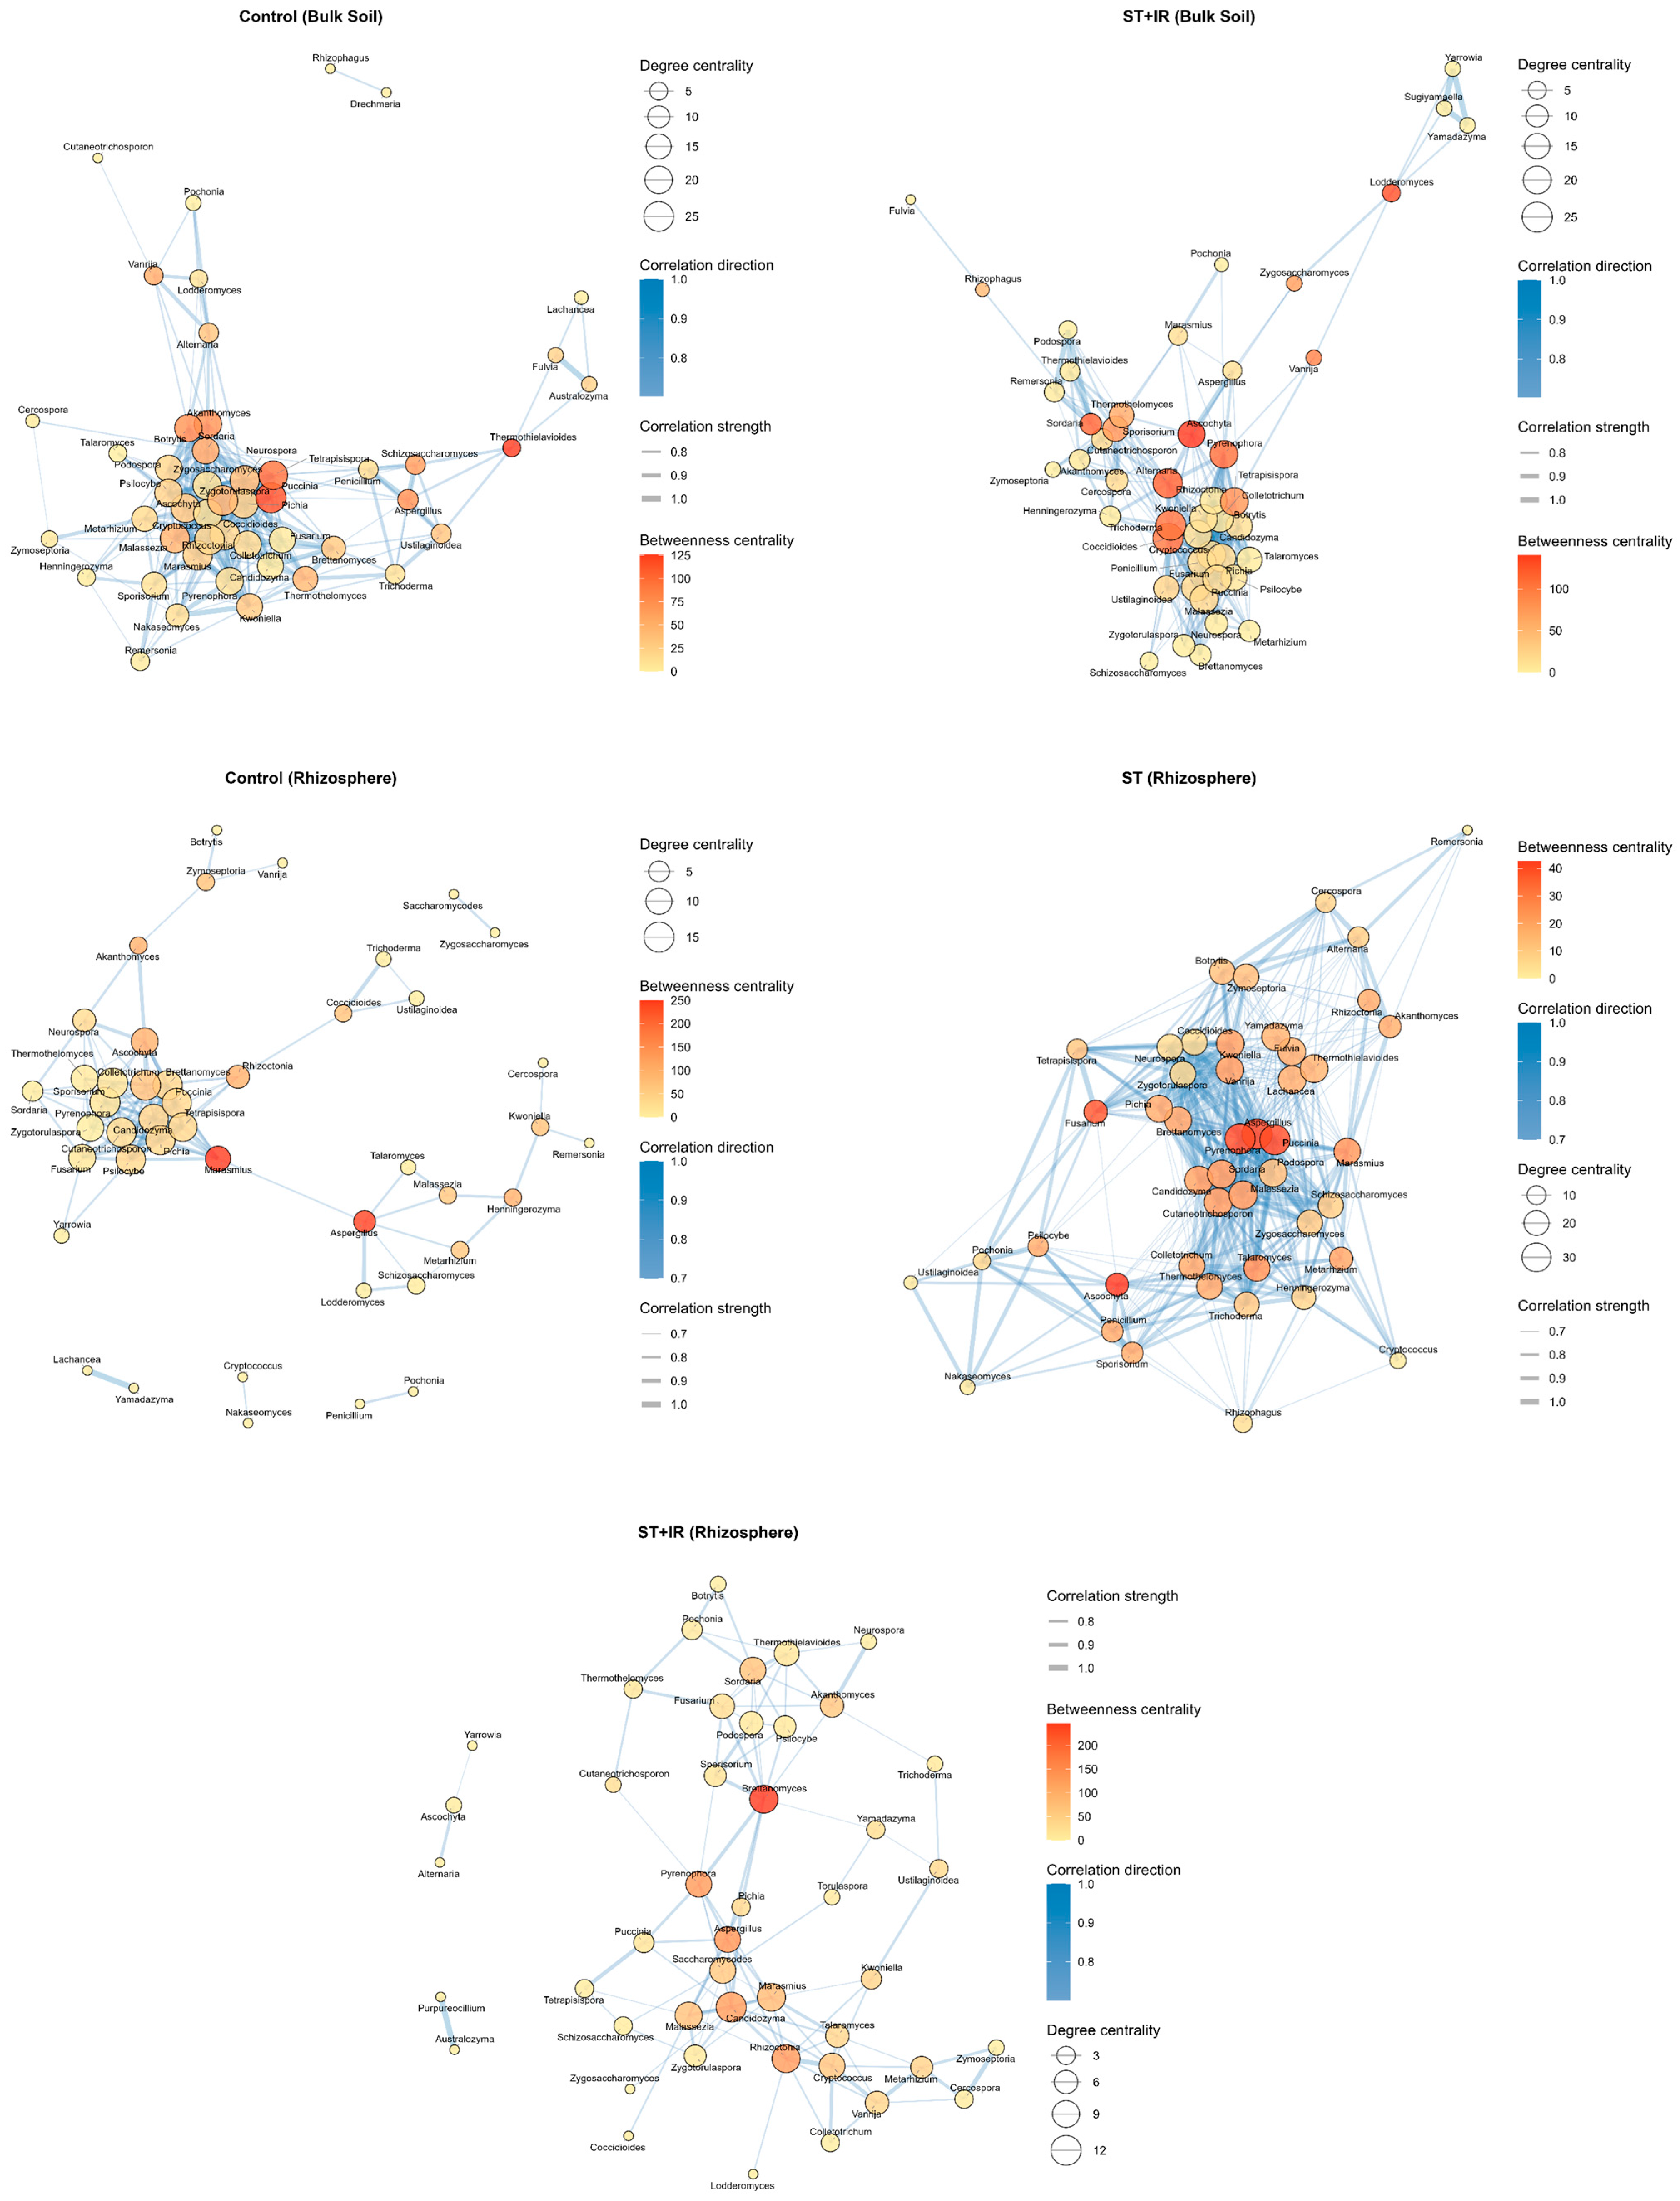
Metric analysis showed that the microbial network of the surrounding bulk soil (Control_BS) was led by Thermothielavioides, Puccinia, Tetrapisispora, and Akanthomyces taxa, showing a betweenness value of 126, 114.69, 94.15, and 72.23, respectively. In the network of surrounding bulk soil, Puccinia, Zygotorulaspora, Coccidioides, Rhizoctonia, and Malassezia exhibited a high degree of centrality (highly connected), showing a value of more than 24 among top hub genera in bulk soil (Figure 13 and Table S1). The formed network in the rhizosphere of untreated seed (Control RS) displayed unique hub properties, with Colletotrichum, Pyrenophora, and Sporisorium showing a moderate degree of centrality value, assayed as 15, suggesting a more modular network structure where certain taxa specialize in connecting distinct microbial groups. Despite their centrality, Pyrenophora and Sporisorium showed a low betweenness, which was assayed as 2.5 and 28.5, respectively. Fusarium was also found to be part of network centrality (Table S1). Seed treatment with microbial consortium (ST_RS) developed an exceptionally interconnected network, where three dominant hubs, Aspergillus, Puccinia, and Pyrenophora, displayed an identical hub connectivity (degree centrality and betweenness centrality). Candidozyma and Cutaneotrichosporon were secondary hubs, dominant genera maintaining substantial network influence. Seed treatment by microbial consortium induced uniform strength formation across hub genera, ranging between 23.66 and 27.26. The formation of uniform strength indicated balanced interaction, allowing a core group of taxa to establish widespread relationships with other community members (Table S1). In contrast, seed treatment following plant irrigation (ST_IR_RS) with microbial consortium induced the formation of a more distinctive network structure, which was characterized by the predominance of low-degree and high-betweenness hubs. Drenching the rhizosphere of pretreated seeds with a microbial consortium enhanced (ST_IR_RS), Brettanomyces, having a moderate connectivity degree, emerged as a critical connector network module (Table S1). Candidozyma, Rhizoctonia, and Marasmius emerged as peripheral hubs, exhibiting high betweenness of 101.33, 150.5, and 52.67, as well as degree values of 10, 12, and 10, respectively. On the other hand, drenching the rhizosphere of pretreated seeds with a microbial consortium induced topology change in the fungal network of surrounding bulk soil (ST_IR_BS), where Coccidioides and Trichoderma emerged as co-dominant hubs (Table S1). The presence of Candidozyma and Fusarium as the top hub genera was highlighted by their low-degree hubs and betweenness centrality.

4. Discussion

Soil microbial community structure is one of the most important components that strongly affects plant productivity. Here, we hypothesized that most synthetic microbial consortia may fail to establish most of their properties under field conditions since native microbial communities in field conditions exhibit resilience, resisting colonization by introduced strains [75]. By drenching the rhizosphere of pretreated seed plants with a microbial consortium, they could induce shifts in the topology and architecture of the fungal network. We observed that both seed pretreatment and seed pretreatment followed by rhizosphere drenching induced shifts among the dominant fungal genera. At the tillering growth stage, in both treatments, Fusarium and Botrytis were most dominant compared to untreated barley groups, where Kwoniella, Malassezia, and Aspergillus prevailed. The observed shift in dominant fungal genera suggests that seed treatment with a microbial consortium induces modifications in the rhizosphere by suppressing certain genera through competitive exclusion, antibiosis, or niche modification [76,77,78] while allowing others to occupy that niche [79]. By analyzing the dynamic relative abundance of all predicted Fusarium species, we found that both treatments (ST and ST_IR) suppress the growth of F. graminearum and entirely inhibit F. fijikuroi, F. musae, and F. verticilioides while only partially suppressing or failing to suppress other Fusarium species (Figure S2). The post-treatment suppression aligns with previous studies showing that microbial consortia may target specific pathogenic species [76,80,81]. For instance, a consortium of Streptomyces griseus, S. Africanus, and S. coelicolor effectively suppressed F. oxysporum f.sp. ciceri by producing superoxide dismutase, catalase, ascorbate peroxidase, and other antioxidants [82]. The combination of Funneliformis mosseae, Glomus fasciculatum, B. velezensis, and Bacillus sp. successfully suppressed F. oxysporum f.sp. lycopersici through the production of antibiosis and siderophores [83]. A microbial consortium consisting of P. aeruginosa, B. cereus, B. amyloliquefaciens, and Trichoderma citrinoviride inhibits the growth of Macrophomina phaseolina and Sclerotinia sclerotiorum by producing siderophores and enzymes such as beta-glucanase, chitinase, and cellulase [84]. A consortium consisting of P. aeruginosa and Trichoderma harzianum was effective against F. oxysporum f.sp. cubense Tropical Race 4 by producing phenolic and proline contents and also promoted host growth [85]. In our study, the selective suppression of F. graminearum, F. fijikuroi, F. musae, and F. verticillioides suggests that the consortium may have prioritized antagonism through the production of enzymes such as cellulase and the production of antimicrobial compounds against these selected Fusarium strains, as observed on plate agar assay against Forl ZUM2407, F. oxysporum (Figure 2I, A–C). The moderate relative abundance of non-targeted Fusarium species could reflect the ecological niche partition. The complete ratification of F. verticillioides induced by rhizosphere irrigation may be due to the accumulation of beneficial microorganisms, leading to the creation of niches less favorable for F. verticillioides. As supporting data, Raaijmakers et al. [86] found that P. defensor (ex fluorescens) WCS374 required a proximity colony forming of 105 CFU per gram of root area for significant suppression of Fusarium wilt of radish (Raphanus sativus). This trend towards a shift among the dominant genera persisted up to the stage of milk development (GS7) compared with the control groups, where Fusarium and Botrytis were not among the most abundant genera. The obtained result aligns with previous studies showing Fusarium species as common wheat grain contaminants, particularly during late growth stages [87]. Notably, Botrytis appeared exclusively in the Control_BS among the most dominant genera. We suggest that the absence of Botrytis in the group pretreated with microbial consortium may be due to their inhibition via niche competition created by emerging beneficial genera [88].
Phytopathogens are among the most critical factors affecting plants and can affect plants at various stages of their life cycle [89,90]. To better explore the systemic treatment effects mediated by the microbial consortium in the rhizosphere of barley, a dynamic of phytopathogenic fungi was evaluated (Figure 10). Our results demonstrated that at GS3, a critical developmental stage, where plants are more vulnerable to pathogen attacks, seed pretreatment followed by rhizosphere drenching was most significantly effective (up to −8.78 log2 fold change related to untreated plants) to suppress the abundance of phytopathogenic fungi predicted compared to ST_RS. This suggests that seed pretreatment provides early protection by inducing systemic resistance, while rhizosphere plant irrigation may provide secondary metabolites that amplify defense signals. These findings align with previous studies demonstrating that root dipping with bacterial suspension at the concentration of 107 cfu mL−1 reduced V. dahliae severity by 40–70% compared to the untreated [91]. Soil drenching with mycorrhizae and foliar sprays of P. fluorescens and T. harzianum provided superior disease suppression compared to individual treatments [92]. Our study revealed that both treatments effectively suppressed key pathogens, including D. coniospora and multiple Fusarium species, including F. musae, F. graminearum, and F. fujikuroi. However, the microbial consortium showed pathogen-specific limitations, demonstrating no significant suppression against Botrytis cinerea, Rhizoctonia solani, or F. falciforme [76,80,81].
Rare microbial taxa (with extremely low relative abundance) are ecological linchpins, providing functional insurance against stress, nutrient cycling [93,94,95,96]. Several studies have shown the ability of rare microbial taxa to maintain stable populations during droughts, persist after soil fumigation, and survive antibiotic treatments [94,97,98]. Our result revealed that seed pretreatment with microbial consortium alone resulted in minimal disturbance to rare fungal taxa as compared to seed treatment followed by rhizosphere drenching. These findings align with both niche protection theory [99,100], which suggests that seed pretreatment can create competition at the seed surface, and microbial consortia primarily compete with dominant root colonizers rather than rare taxa [101]. In contrast, seed pretreatment followed by rhizosphere drenching may induce alternance in microhabitats, as demonstrated by Banerjee et al. [71], who found that fluctuations in water levels reduce the diversity of rare fungi. Additionally, redundancy analysis indicated that organic matter serves as a primary environmental filtering, significantly influencing the assembly of soil microbiomes. Organic matter (OM) provides diverse carbon substrates that favor the growth of specific microbial taxa [102]. The limited significance of pH reflects its complex interactions with organic matter, as previously reported by Rousk et al. [103]. In their study, Rousk et al. showed that the impact of pH on microbial taxa can be mediated by organic matter solubility.
Since the rhizosphere was drenched with microbial consortium, we further analyzed its impact on fungal community structure in bulk soil. Our data revealed that seed pretreatment followed by rhizosphere drenching with microbial consortium does not significantly alter the overall microbial community structure in the surrounding bulk soil (ST_IR_BS) compared to the bulk soil of the untreated control (Control_BS). This may be due to the limited nutrients in bulk soil than in the rhizosphere, since in bulk soil dominant taxa occupied stable ecological niches, which make them less susceptible to shifts that could be induced by microbial consortia [104,105]. Moreover, microbial community restructuring in bulk soil often requires prolonged or repeated interventions [106,107]. The ecological community based on shared and unique taxa across experimental groups revealed a conserved substantial core microbiome (69 taxa), which indicates functional redundancy, where core taxa maintain ecosystem functions even when perturbed [108,109]. The presence of unique taxa Fusarium fujikuroi, F. musae, and Torulaspora globosa in Control_RS highlights the role of the rhizosphere to serve as a selective habitat for niche-specific fungi [109], whereas their absence in treated groups suggests the disruption of these niches by applied microbial consortia. The presence of shared and unique taxa between groups indicates treatment-specific functional shifts, suggesting that microbial treatments could influence the microbial community, leading to the emergence of both common and unique microbial functions [110].
Neither treated nor untreated seeds statistically affected the alpha diversity of the fungal community in barley. This indicates that the introduced microbial consortia integrated into the existing community, maintaining the diversity levels. Similar findings were reported by Toju et al. [111] and Schlatter et al. [112]. For instance, Toju et al. [111] discovered that beneficial fungi can suppress pathogens by preempting niches without decreasing overall alpha diversity. Similarly, Schlatter et al. [112] showed that microbial inoculants can effectively colonize plant rhizospheres while preserving the native diversity through niche partitioning. The absence of significant changes in alpha diversity may also indicate functional redundancy within the rhizosphere microbiome. This effect was previously shown by Louca et al. [113], demonstrating the functional redundancy of microbial communities to maintain alpha diversity amid compositional shifts in rhizospheric microbial taxa [114].
Through the analysis of soil fungal co-occurrence networks, bulk soil (Control_BS) exhibited a network that maintained a stable microbiome with a well-balanced organization, supporting ecosystem processes. In this environment, potential pathogens are minimized [115], as noted by Banerjee et al. [71], indicating that highly connected generalist taxa primarily contribute to the stability of bulk soil networks. The presence of Puccinia in network connectivity may result from the high numbers of its teliospores and urediniospores, which can survive in soil for extended periods of time [116,117,118,119]. Thermothielavioides and Rhizophagus, which exhibit high betweenness, emerged as central nodes, indicating their ability to function as keystones in maintaining network stability [120,121,122]. Although the network exhibited moderate pathogen resilience, where pathogens with low relative abundance served as central nodes, its stability was highly dependent on these keystone taxa. The removal of these microbial taxa can significantly disrupt nutrient flows, as previously described by Agler et al. [16] in the concept of keystone species. Seed pretreatment (ST_RS) with a microbial consortium induced a highly interconnected and uniform network in the barley rhizosphere, where a hemibiotroph, Colletotrichum, and a foliar pathogen, Pyrenophora, acted as central hubs despite their low betweenness. The presence of multiple keystone taxa in a network with similar centrality values suggests synergistic interactions between taxa, potentially mediated by metabolite exchanges [102]. The formed network demonstrated high pathogen and drought resilience, characterized by the presence of biocontrol fungi genera, such as Trichoderma, and stress-adapted yeasts, like Zygosaccharomyces. The structured network format reflected the results reported by Kaisermann et al. [123] on drought-resistant rhizosphere microbiomes. In terms of stability, the forming network of ST_RS displayed a moderate dependence connectivity, demonstrating the tradeoff between specialization and resilience previously reported by Louca et al. [36]. Seeds pretreatment followed by rhizosphere drenching (ST_IR_RS) reshaped networks toward high-betweenness hubs with Brettanomyces and Marasmius acting as hubs of centrality, indicating taxa that link disparate modules without high connectivity. Niche disruption caused by the marginalization of Fusarium may result from rhizosphere drenching, which can distribute beneficial antagonistic resident soil microbiomes that directly suppress Fusarium through antibiosis, competition for nutrients, and hyphal parasitism [124]. Numerous articles have highlighted that microbial interactions in bulk soil are significantly influenced by moisture availability [125,126,127]. Our experiment demonstrated that the generalist pathogens Botrytis and Puccinia prevailed in the surrounding bulk soils. However, treating the rhizosphere of barley with a microbial consortium after seed pretreatment disrupts the network hubs of fungal communities in the surrounding bulk soil (ST_IR_BS). The combined treatment promotes the co-dominance of beneficial species such as Trichoderma and stress-tolerant yeasts like Candidasyma. The presence of Coccidioides in the microbial network induced by rhizosphere drenching demonstrates their ability to function as stress-responsive hubs [128]. In contrast, the rhizosphere of untreated plants (Control_RS) represented the least stable characteristic, with a low-modularity structure and persistent Fusarium abundance, matching patterns observed in pathogen-prone soils by Berendsen et al. [129]. Its pathogen vulnerability and drought sensitivity made it particularly fragile under stress conditions, as predicted by the stress-gradient hypothesis in microbial ecology [130]. Our study on the impact of microbial activity on soil fungal community networks supports the concept of microbiome engineering [102,112] and underscores that targeted management of microbiomes can improve agricultural resilience by optimizing the structure of microbial networks. Overall, pretreating seeds with a beneficial microbial consortium improved network stability across all treatments. The improvement was achieved by increasing the uniformity of hubs, reducing the centrality of pathogens, and promoting functional redundancy through consistent hub strength. Furthermore, combining seed treatment with rhizosphere drenching at different growth stages can modify networks to favor high-betweenness hubs. Taking into account the interannual variability in agricultural ecosystems, long-term studies are needed to confirm the persistence of the observed network effects. Nevertheless, although our results successfully demonstrate a restructuring of rhizosphere communities, the effect of microbial consortium treatments on plant growth parameters remained important for establishing any correlations with rhizosphere microbial community shifts. Therefore, subsequent experiments incorporating detailed plant phenotyping, such as growth, development, tolerance, structure, and physiology, will be essential to directly link these specific microbial community shifts to plant fitness and yield outcomes under different environmental conditions.

5. Conclusions

This study revealed evidence of key changes in fungal community driven by the presence and absence of microbial consortia. The application of a synthetic microbial consortium (P. pabuli, P. megaterium, P. koreensis, and P. orientalis) induced shifts in fungal network architecture under field conditions and introduced new dormant taxa in relation to active/dominant native soil microbiomes. The dominant genera, Fusarium and Botrytis, emerged as the prevalent taxa in treated plants compared to untreated controls. The microbial consortia effectively suppressed specific pathogenic Fusarium species (F. graminearum, F. fijikuroi, F. musae, and F. verticilioides) likely due to the production of cellulolytic enzymes and antimicrobial compounds. Although both pretreatments did not statistically affect rare fungal taxa, drenching of pretreated seeds fostered a highly interconnected and uniform network among key species and reduced the centrality of phytopathogenic fungi. Network analysis identified Thermothielavioides and Rhizophagus as keystone taxa that are crucial for stabilizing the surrounding bulk soil. High-betweenness hubs were observed between the biocontrol genus Trichoderma and the stress-tolerant pathogenic yeast Brettanomyces and Marasmius, specifically in treated rhizosphere plants. Overall, these findings represent significant advances in microbiome engineering, demonstrating that microbial preparations can alter ecological networks. This work establishes a robust framework for engineering rhizosphere microbiomes through strategic manipulation of microbial networks. Optimization of microbial consortia based on network co-occurrence can be an important innovative approach to sustainable crop production and protection. These findings align with published studies, highlighting network analysis as a powerful tool for deciphering microbial interactions and revealing key ecological patterns.

Supplementary Materials

The following supporting information can be downloaded at: https://www.mdpi.com/article/10.3390/soilsystems9040116/s1. Figure S1. The precipitation levels and temperature conditions during the vegetative growing season of 2024 (April–August) for barley in the agricultural landscape of the Federal Research Center “Kazan Scientific Center of Russian Academy of Sciences” located in Laishevsky District (Republic of Tatarstan, Russia); Figure S2. Dynamics of relative abundance of Fusarium species in fungal community under different microbial consortium treatments; Table S1. The top hub genera of the fungal community across treatments ranked by network centrality. Supplementary Data Files (File S1—metadata; File S2—soil physicochemical properties; File S3—fungal network properties).

Author Contributions

Conceptualization S.Z.V.; methodology, E.N.K., R.G.C.D. and S.Z.V.; software, A.Y.S. and R.G.C.D.; validation, S.Z.V.; formal analysis, R.G.C.D.; investigation, E.N.K., E.S., K.S., A.Y.S. and B.I.; resources, S.Z.V.; data curation, D.M.A., N.V.T., M.N.F. and S.Z.V.; writing—original draft preparation, R.G.C.D.; writing—review and editing, R.G.C.D., D.M.A., N.V.T., M.N.F. and S.Z.V.; visualization, R.G.C.D.; supervision S.Z.V.; project administration, S.Z.V.; funding acquisition, S.Z.V. All authors have read and agreed to the published version of the manuscript.

Funding

This research was funded by the government assignment (No. 124050300050-4) for the FRC Kazan Scientific Center of RAS FMEG-2024-0012.

Data Availability Statement

The original contributions presented in the study are included in the article and Supplementary Materials; further inquiries can be directed to the corresponding authors.

Acknowledgments

The authors wish to express their gratitude to the research team at the Laboratory of Molecular Genetics and Microbiology (Kazan Scientific Center, Russian Academy of Sciences), specially to Abdulla Yergeshov, whose efforts were instrumental in the successful completion of this work.

Conflicts of Interest

The authors declare no conflicts of interest.

References

  1. Devlet, A. Modern agriculture, and challenges. Front. Life Sci. Relat. Technol. 2021, 2, 21–29. [Google Scholar] [CrossRef]
  2. Tahat, M.M.; Alananbeh, K.M.; Othman, Y.A.; Leskovar, D.I. Soil health and sustainable agriculture. Sustainability 2020, 12, 4859. [Google Scholar] [CrossRef]
  3. Cárceles Rodríguez, B.; Durán-Zuazo, V.H.; Soriano Rodríguez, M.; García-Tejero, I.F.; Gálvez Ruiz, B.; Cuadros Tavira, S. Conservation Agriculture as a Sustainable System for Soil Health: A Review. Soil Syst. 2022, 6, 87. [Google Scholar] [CrossRef]
  4. Condron, L.; Stark, C.; O’Callaghan, M.; Clinton, P.; Huang, Z. The role of microbial communities in the formation and decomposition of soil organic matter. In Soil Microbiology and Sustainable Crop Production; Springer: Dordrecht, The Netherlands, 2010; pp. 81–118. [Google Scholar]
  5. Fierer, N. Embracing the unknown: Disentangling the complexities of the soil microbiome. Nat. Rev. Microbiol. 2017, 15, 579–590. [Google Scholar] [CrossRef] [PubMed]
  6. Kumawat, K.C.; Razdan, N.; Saharan, K. Rhizospheric Microbiome: Bio-Based Emerging Strategies for Sustainable Agriculture Development and Future Perspectives. Microbiol. Res. 2022, 254, 126901. [Google Scholar] [CrossRef]
  7. Santoyo, G. How plants recruit their microbiome? New insights into beneficial interactions. J. Adv. Res. 2022, 40, 45–58. [Google Scholar] [CrossRef] [PubMed]
  8. Savary, S.; Ficke, A.; Aubertot, J.N.; Hollier, C. Crop losses due to diseases and their implications for global food production and food security. Food Secur. 2012, 4, 519–537. [Google Scholar] [CrossRef]
  9. Hakim, S.; Naqqash, T.; Nawaz, M.S.; Laraib, I.; Siddique, M.J.; Zia, R.; Mirza, M.S.; Imran, A. Rhizosphere engineering with plant growth-promoting microorganisms for agriculture and ecological sustainability. Front. Sustain. Food Syst. 2021, 5, 617157. [Google Scholar] [CrossRef]
  10. Thepbandit, W.; Athinuwat, D. Rhizosphere microorganisms supply availability of soil nutrients and induce plant defense. Microorganisms 2024, 12, 558. [Google Scholar] [CrossRef]
  11. Mahmud, K.; Missaoui, A.; Lee, K.; Ghimire, B.; Presley, H.W.; Makaju, S. Rhizosphere microbiome manipulation for sustainable crop production. Curr. Plant Biol. 2021, 27, 100210. [Google Scholar] [CrossRef]
  12. Vishwakarma, K.; Kumar, N.; Shandilya, C.; Mohapatra, S.; Bhayana, S.; Varma, A. Revisiting plant–microbe interactions and microbial consortia application for enhancing sustainable agriculture: A review. Front. Microbiol. 2020, 11, 560406. [Google Scholar] [CrossRef]
  13. Weller, D.M.; Raaijmakers, J.M.; Gardener, B.B.M.; Thomashow, L.S. Microbial populations responsible for specific soil suppressiveness to plant pathogens. Annu. Rev. Phytopathol. 2002, 40, 309–348. [Google Scholar] [CrossRef] [PubMed]
  14. Schlatter, D.; Kinkel, L.; Thomashow, L.; Weller, D.; Paulitz, T. Disease suppressive soils: New insights from the soil microbiome. Phytopathology 2017, 107, 1284–1297. [Google Scholar] [CrossRef] [PubMed]
  15. Raaijmakers, J.M.; Paulitz, T.C.; Steinberg, C.; Alabouvette, C.; Moënne-Loccoz, Y. The rhizosphere: A playground and battlefield for soilborne pathogens and beneficial microorganisms. Plant Soil 2009, 321, 341–361. [Google Scholar] [CrossRef]
  16. Agler, M.T.; Ruhe, J.; Kroll, S.; Morhenn, C.; Kim, S.T.; Weigel, D.; Kemen, E.M. Microbial hub taxa link host and abiotic factors to plant microbiome variation. PLoS Biol. 2016, 14, e1002352. [Google Scholar] [CrossRef]
  17. Trivedi, P.; Leach, J.E.; Tringe, S.G.; Sa, T.; Singh, B.K. Plant-microbiome interactions: From community assembly to plant health. Nat. Rev. Microbiol. 2020, 18, 607–621. [Google Scholar] [CrossRef] [PubMed]
  18. Godoy, O. Coexistence theory as a tool to understand biological invasions in species interaction networks: Implications for the study of novel ecosystems. Funct. Ecol. 2019, 33, 1190–1201. [Google Scholar] [CrossRef]
  19. Qian, X.; Li, X.; Li, H.; Zhang, D. Floral fungal-bacterial community structure and co-occurrence patterns in four sympatric island plant species. Fungal Biol. 2021, 125, 49–61. [Google Scholar] [CrossRef]
  20. Shayanthan, A.; Ordoñez, P.A.C.; Oresnik, I.J. The role of synthetic microbial communities (SynCom) in sustainable agriculture. Front. Agron. 2022, 4, 896307. [Google Scholar] [CrossRef]
  21. Santoyo, G.; Guzmán-Guzmán, P.; Parra-Cota, F.I.; Santos-Villalobos, S.D.L.; Orozco-Mosqueda, M.D.C.; Glick, B.R. Plant growth stimulation by microbial consortia. Agronomy 2021, 11, 219. [Google Scholar] [CrossRef]
  22. Khan, S.T. Consortia-based microbial inoculants for sustaining agricultural activities. Appl. Soil Ecol. 2022, 176, 104503. [Google Scholar] [CrossRef]
  23. Trabelsi, D.; Mhamdi, R. Microbial inoculants and their impact on soil microbial communities: A review. BioMed Res. Int. 2013, 2013, 863240. [Google Scholar] [CrossRef]
  24. Čaušević, S.; Dubey, M.; Morales, M.; Salazar, G.; Sentchilo, V.; Carraro, N.; Ruscheweyh, H.-J.; Sunagawa, S.; van der Meer, J.R. Niche availability and competitive loss by facilitation control the proliferation of bacterial strains intended for soil microbiome interventions. Nat. Commun. 2024, 15, 2557. [Google Scholar] [CrossRef]
  25. Khare, E.; Arora, N.K. Effects of soil environment on field efficacy of microbial inoculants. In Plant Microbes Symbiosis: Applied Facets; Springer: New Delhi, India, 2014; pp. 353–381. [Google Scholar] [CrossRef]
  26. Shen, Z.Z.; Penton, C.R.; Lv, N.; Xue, C.; Yuan, X.; Ruan, Y.; Li, R. Banana Fusarium wilt disease incidence is influenced by shifts of soil microbial communities under different monoculture spans. Microb. Ecol. 2017, 75, 739–750. [Google Scholar] [CrossRef]
  27. Xiong, W.; Li, R.; Ren, Y.; Liu, C.; Zhao, Q.; Wu, H.; Jousset, A.; Shen, Q. Distinct roles for soil fungal and bacterial communities associated with the suppression of vanilla Fusarium wilt disease. Soil Biol. Biochem. 2017, 107, 198–207. [Google Scholar] [CrossRef]
  28. Xu, T.; Jiang, W.; Qin, D.; Liu, T.; Zhang, J.; Chen, W.; Gao, L. Characterization of the microbial communities in wheat tissues and rhizosphere soil caused by dwarf bunt of wheat. Sci. Rep. 2021, 11, 5773. [Google Scholar] [CrossRef] [PubMed]
  29. Tang, L.; Xia, Y.; Fan, C.; Kou, J.; Wu, F.; Li, W.; Pan, K. Control of Fusarium wilt by wheat straw is associated with microbial network changes in watermelon rhizosphere. Sci. Rep. 2020, 10, 12736. [Google Scholar] [CrossRef]
  30. Orland, C.; Emilson, E.J.; Basiliko, N.; Mykytczuk, N.C.; Gunn, J.M.; Tanentzap, A.J. Microbiome functioning depends on individual and interactive effects of the environment and community structure. ISME J. 2019, 13, 1–11. [Google Scholar] [CrossRef] [PubMed]
  31. Eng, A.; Borenstein, E. Taxa-function robustness in microbial communities. Microbiome 2018, 6, 45. [Google Scholar] [CrossRef]
  32. Tian, L.; Wang, X.-W.; Wu, A.-K.; Fan, Y.; Friedman, J.; Dahlin, A.; Waldor, M.K.; Weinstock, G.M.; Weiss, S.T. Deciphering functional redundancy in the human microbiome. Nat. Commun. 2020, 11, 6217. [Google Scholar] [CrossRef]
  33. Weiland-Bräuer, N. Friends or foes—Microbial interactions in nature. Biology 2021, 10, 496. [Google Scholar] [CrossRef]
  34. Srinivasan, S.; Jnana, A.; Murali, T.S. Modeling microbial community networks: Methods and tools for studying microbial interactions. Microb. Ecol. 2024, 87, 56. [Google Scholar] [CrossRef] [PubMed]
  35. Coyte, K.Z.; Schluter, J.; Foster, K.R. The ecology of the microbiome: Networks, competition, and stability. Science 2015, 350, 663–666. [Google Scholar] [CrossRef]
  36. Louca, S.; Polz, M.F.; Mazel, F.; Albright, M.B.N.; Huber, J.A.; O’Connor, M.I.; Ackermann, M.; Hahn, A.S.; Srivastava, D.S.; Crowe, S.A.; et al. Function and functional redundancy in microbial systems. Nat. Ecol. Evol. 2018, 2, 936–943. [Google Scholar] [CrossRef] [PubMed]
  37. Afordoanyi, D.M.; Diabankana, R.G.C.; Krupin, E.; Bikchantaev, I.; Taylan, A.; Validov, S. Inhibitory effects of Bacillus licheniformis WJ53A and homofermentative lactic acid bacteria on clostridial growth in corn silage. Pak. J. Agric. Sci. 2023, 60, 53–63. [Google Scholar] [CrossRef]
  38. Diabankana, R.G.C.; Frolov, M.; Islamov, B.; Shulga, E.; Filimonova, M.N.; Afordoanyi, D.M.; Validov, S. Identification and Aggressiveness of Fusarium Species Associated with Onion Bulb (Allium cepa L.) during Storage. J. Fungi 2024, 10, 161. [Google Scholar] [CrossRef]
  39. Validov, S.Z.; Kamilova, F.D.; Lugtenberg, B.J. Monitoring of pathogenic and non-pathogenic Fusarium oxysporum strains during tomato plant infection. Microb. Biotechnol. 2011, 4, 82–88. [Google Scholar] [CrossRef]
  40. Diabankana, R.G.C.; Afordoanyi, D.M.; Safin, R.I.; Nizamov, R.M.; Karimova, L.Z.; Validov, S.Z. Antifungal properties, abiotic stress resistance, and biocontrol ability of Bacillus mojavensis PS17. Curr. Microbiol. 2021, 78, 3124–3132. [Google Scholar] [CrossRef]
  41. Diabankana, R.G.C.; Shulga, E.U.; Validov, S.Z.; Afordoanyi, D.M. Genetic characteristics and enzymatic activities of Bacillus velezensis KS04AU as a stable biocontrol agent against phytopathogens. Int. J. Plant Biol. 2022, 13, 201–222. [Google Scholar] [CrossRef]
  42. Bae, H.D.; Yanke, L.J.; Cheng, K.J.; Selinger, L.B. A novel staining method for detecting phytase activity. J. Microbiol. Methods 1999, 39, 17–22. [Google Scholar] [CrossRef] [PubMed]
  43. Santiago, C.D.; Yagi, S.; Ijima, M.; Nashimoto, T.; Sawada, M.; Ikeda, S.; Asano, K.; Orikasa, Y.; Ohwada, T. Bacterial compatibility in combined inoculations enhances the growth of potato seedlings. Microbes Environ. 2017, 32, 14–23. [Google Scholar] [CrossRef]
  44. Ehmann, A. The Van Urk-Salkowski reagent—A sensitive and specific chromogenic reagent for silica gel thin-layer chromatographic detection and identification of indole derivatives. J. Chromatogr. A 1977, 132, 267–276. [Google Scholar] [CrossRef] [PubMed]
  45. Gordon, S.A.; Weber, R.P. Colorimetric estimation of indoleacetic acid. Plant Physiol. 1951, 26, 192–195. [Google Scholar] [CrossRef] [PubMed]
  46. Riley, D.; Barber, S.A. Bicarbonate accumulation and pH changes at the soybean (Glycine max (L.) Merr.) root-soil interface. Soil Sci. Soc. Am. J. 1969, 33, 905–908. [Google Scholar] [CrossRef]
  47. Thomas, G.W. Soil pH and soil acidity. In Methods of Soil Analysis: Part 3 Chemical Methods; SSSA: Madison, WI, USA, 1996; pp. 475–490. [Google Scholar] [CrossRef]
  48. Walkley, A.; Black, I.A. An Examination of the Degtjareff Method for Determining Soil Organic Matter, and a Proposed Modification of the Chromic Acid Titration Method. Soil Sci. 1934, 37, 29–38. [Google Scholar] [CrossRef]
  49. Leelamanie, D.A.L.; Liyanage, T.D.P.; Rajarathna, I.M.L.V. A Comparison of Weight Loss and C Analysis Methods in Determining Organic Matter Content in Sri Lankan Soils. Trop. Agric. Res. Ext. 2015, 18, 3. [Google Scholar] [CrossRef]
  50. Abakumov, E.V.; Rodina, O.A.; Eskov, A.K. Humification and Humic Acid Composition of Suspended Soil in Oligotrophous Environments in South Vietnam. Appl. Environ. Soil Sci. 2018, 2018, 1026237. [Google Scholar] [CrossRef]
  51. Jarukas, L.; Ivanauskas, L.; Kasparaviciene, G.; Baranauskaite, J.; Marksa, M.; Bernatoniene, J. Determination of Organic Compounds, Fulvic Acid, Humic Acid, and Humin in Peat and Sapropel Alkaline Extracts. Molecules 2021, 26, 2995. [Google Scholar] [CrossRef]
  52. Tedersoo, L.; Anslan, S.; Bahram, M.; Põlme, S.; Riit, T.; Liiv, I.; Kõljalg, U.; Kisand, V.; Nilsson, R.H.; Hildebrand, F.; et al. Shotgun metagenomes and multiple primer pair-barcode combinations of amplicons reveal biases in metabarcoding analyses of fungi. MycoKeys 2015, 10, 1–43. [Google Scholar] [CrossRef]
  53. Tedersoo, L.; Tooming-Klunderud, A.; Anslan, S. PacBio metabarcoding of fungi and other eukaryotes: Errors, biases and perspectives. New Phytol. 2018, 217, 1370–1385. [Google Scholar] [CrossRef] [PubMed]
  54. Martin, M. Cutadapt removes adapter sequences from high-throughput sequencing reads. EMBnet J. 2011, 17, 10–12. [Google Scholar] [CrossRef]
  55. Callahan, B.J.; McMurdie, P.J.; Rosen, M.J.; Han, A.W.; Johnson, A.J.A.; Holmes, S.P. DADA2: High-resolution sample inference from Illumina amplicon data. Nat. Methods 2016, 13, 581–583. [Google Scholar] [CrossRef] [PubMed]
  56. Buetas, E.; Jordán-López, M.; López-Roldán, A.; D’Auria, G.; Martínez-Priego, L.; De Marco, G.; Carda-Diéguez, M. Full-length 16S rRNA gene sequencing by PacBio improves taxonomic resolution in human microbiome samples. BMC Genom. 2024, 25, 310. [Google Scholar] [CrossRef]
  57. Shen, W.; Sipos, B.; Zhao, L. SeqKit2: A Swiss Army Knife for Sequence and Alignment Processing. iMeta 2024, 3, e191. [Google Scholar] [CrossRef]
  58. Li, H. Minimap2: Pairwise alignment for nucleotide sequences. Bioinformatics 2018, 34, 3094–3100. [Google Scholar] [CrossRef]
  59. Li, H. New strategies to improve minimap2 alignment accuracy. Bioinformatics 2021, 37, 4572–4574. [Google Scholar] [CrossRef]
  60. Abarenkov, K.; Nilsson, R.H.; Larsson, K.-H.; Taylor, A.F.S.; May, T.W.; Frøslev, T.G.; Pawlowska, J.; Lindahl, B.; Põldmaa, K.; Truong, C.; et al. The UNITE database for molecular identification and taxonomic communication of fungi and other eukaryotes: Sequences, taxa and classifications reconsidered. Nucleic Acids Res. 2024, 52, D791–D797. [Google Scholar] [CrossRef] [PubMed]
  61. Nguyen, N.H.; Song, Z.; Bates, S.T.; Branco, S.; Tedersoo, L.; Menke, J.; Schilling, J.S.; Kennedy, P.G. FUNGuild: An open annotation tool for parsing fungal community datasets by ecological guild. Fungal Ecol. 2016, 20, 241–248. [Google Scholar] [CrossRef]
  62. Lynch, M.D.; Neufeld, J.D. Ecology and exploration of the rare biosphere. Nat. Rev. Microbiol. 2015, 13, 217–229. [Google Scholar] [CrossRef] [PubMed]
  63. Shade, A.; Jones, S.E.; Caporaso, J.G.; Handelsman, J.; Knight, R.; Fierer, N.; Gilbert, J.A. Conditionally rare taxa disproportionately contribute to changes in microbial diversity. mBio 2014, 5, e01371-14. [Google Scholar] [CrossRef]
  64. Wu, L.; Ning, D.; Zhang, B.; Li, Y.; Sanabria, J. Global diversity and biogeography of bacterial communities in wastewater treatment plants. Nat. Microbiol. 2019, 4, 1183–1195. [Google Scholar] [CrossRef]
  65. Dai, T.; Wen, D.; Bates, C.T.; Wu, L.; Guo, X.; Liu, S.; Su, Y.; Lei, J.; Zhou, J. Nutrient supply controls the linkage between species abundance and ecological interactions in marine bacterial communities. Nat. Commun. 2022, 13, 175. [Google Scholar] [CrossRef]
  66. Aertsen, W.; Kint, V.; Van Orshoven, J.; Özkan, K.; Muys, B. Comparison and ranking of different modelling techniques for prediction of site index in Mediterranean mountain forests. Ecol. Model. 2010, 217, 1119–1130. [Google Scholar] [CrossRef]
  67. Murray, G.M.; Brennan, J.P. Estimating disease losses to the Australian barley industry. Australas. Plant Pathol. 2010, 39, 85–96. [Google Scholar] [CrossRef]
  68. Figueroa, M.; Hammond-Kosack, K.E.; Solomon, P.S. A review of wheat diseases—A field perspective. Mol. Plant Pathol. 2018, 19, 1523–1536. [Google Scholar] [CrossRef] [PubMed]
  69. Csardi, G.; Nepusz, T. The igraph software. Complex Syst. 2006, 1695, 1–9. [Google Scholar]
  70. Röttjers, L.; Faust, K. From hairballs to hypotheses—Biological insights from microbial networks. FEMS Microbiol. Rev. 2018, 42, 761–780. [Google Scholar] [CrossRef]
  71. Banerjee, S.; Schlaeppi, K.; van der Heijden, M.G.A. Keystone taxa as drivers of microbiome structure and functioning. Nat. Rev. Microbiol. 2018, 16, 567–576. [Google Scholar] [CrossRef]
  72. Ge, Z.; Li, S.; Bol, R.; Zhu, P.; Peng, C.; An, T.; Cheng, N.; Liu, X.; Li, T.; Xu, Z.; et al. Differential long-term fertilization alters residue-derived labile organic carbon fractions and microbial community during straw residue decomposition. Soil Till. Res. 2021, 213, 105120. [Google Scholar] [CrossRef]
  73. Zamkovaya, T.; Foster, J.S.; de Crécy-Lagard, V.; Conesa, A. A network approach to elucidate and prioritize microbial dark matter in microbial communities. ISME J. 2021, 15, 228–244. [Google Scholar] [CrossRef] [PubMed]
  74. Raag, V.A.; Waltman, L.; van Eck, N.J. From Louvain to Leiden: Guaranteeing well-connected communities. Sci. Rep. 2019, 9, 5233. [Google Scholar] [CrossRef] [PubMed]
  75. Kusstatscher, P.; Wicaksono, W.A.; Thenappan, D.P.; Adam, E.; Müller, H.; Berg, G. Microbiome management by biological and chemical treatments in maize is linked to plant health. Microorganisms 2020, 8, 1506. [Google Scholar] [CrossRef] [PubMed]
  76. Johansson, P.M.; Johnsson, L.; Gerhardson, B. Suppression of wheat-seedling diseases caused by Fusarium culmorum and Microdochium nivale using bacterial seed treatment. Plant Pathol. 2003, 52, 219–227. [Google Scholar] [CrossRef]
  77. Todorović, I.; Moënne-Loccoz, Y.; Raičević, V.; Jovičić-Petrović, J.; Muller, D. Microbial diversity in soils suppressive to Fusarium diseases. Front. Plant Sci. 2023, 14, 1228749. [Google Scholar] [CrossRef] [PubMed]
  78. Solórzano, R.; Ramírez Maguiña, H.A.; Johnson, L.; Ureta Sierra, C.; Cruz, J. Current progress in microbial biocontrol of banana Fusarium wilt: A systematic review. Agronomy 2025, 15, 619. [Google Scholar] [CrossRef]
  79. Müller, T.; Behrendt, U.; Ruppel, S.; von der Waydbrink, G.; Müller, M.E. Fluorescent pseudomonads in the phyllosphere of wheat: Potential antagonists against fungal phytopathogens. Curr. Microbiol. 2016, 72, 383–389. [Google Scholar] [CrossRef]
  80. Sundaramoorthy, S.; Raguchander, T.; Ragupathi, N.; Samiyappan, R. Combinatorial effect of endophytic and plant growth promoting rhizobacteria against wilt disease of Capsicum annum L. caused by Fusarium solani. Biol. Control 2012, 60, 59–68. [Google Scholar] [CrossRef]
  81. Kumari, P.; Khanna, V. Seed bacterization stimulated resistance in chickpea against Fusarium oxysporum f. sp. ciceris. Indian Phytopathol. 2019, 72, 689–697. [Google Scholar] [CrossRef]
  82. Ankati, S.; Srinivas, V.; Pratyusha, S.; Gopalakrishnan, S. Streptomyces consortia-mediated plant defense against Fusarium wilt and plant growth-promotion in chickpea. Microb. Pathog. 2021, 157, 104961. [Google Scholar] [CrossRef]
  83. Devi, N.O.; Tombisana Devi, R.K.; Debbarma, M.; Hajong, M.; Thokchom, S. Effect of endophytic Bacillus and arbuscular mycorrhiza fungi (AMF) against Fusarium wilt of tomato caused by Fusarium oxysporum f. sp. lycopersici. Egypt. J. Biol. Pest. Control 2022, 32, 1–14. [Google Scholar] [CrossRef]
  84. Thakkar, A.; Saraf, M. Development of microbial consortia as a biocontrol agent for effective management of fungal diseases in Glycine max L. Arch. Phytopathol. Plant Prot. 2015, 48, 459–474. [Google Scholar] [CrossRef]
  85. Wong, C.K.F.; Saidi, N.B.; Vadamalai, G.; Teh, C.Y.; Zulperi, D. Effect of bioformulations on the biocontrol efficacy, microbial viability, and storage stability of a consortium of biocontrol agents against Fusarium wilt of banana. J. Appl. Microbiol. 2019, 127, 544–555. [Google Scholar] [CrossRef] [PubMed]
  86. Raaijmakers, J.; Leeman, M.; van Oorschot, M.; van der Sluis, I.; Schippers, B.; Bakker, P. Dose-response relationships in biological control of Fusarium wilt of radish by Pseudomonas spp. Phytopathology 1995, 85, 1075–1081. Phytopathology 1995, 85, 1075–1081. [Google Scholar] [CrossRef]
  87. Birr, T.; Hasler, M.; Verreet, J.A.; Klink, H. Composition and predominance of Fusarium species causing Fusarium head blight in winter wheat grain depending on cultivar susceptibility and meteorological factors. Microorganisms 2020, 8, 617. [Google Scholar] [CrossRef] [PubMed]
  88. Ghoul, M.; Mitri, S. The ecology and evolution of microbial competition. Trends Microbiol. 2016, 24, 833–845. [Google Scholar] [CrossRef]
  89. Mansfield, J.; Genin, S.; Magori, S.; Citovsky, V.; Sriariyanum, M.; Ronald, P.; Dow, M.; Verdier, V.; Beer, S.V.; Machado, M.A.; et al. Top 10 plant pathogenic bacteria in molecular plant pathology. Mol. Plant Pathol. 2012, 13, 614–629. [Google Scholar] [CrossRef] [PubMed]
  90. Mendes, R.; Garbeva, P.; Raaijmakers, J.M. The rhizosphere microbiome: Significance of plant beneficial, plant pathogenic, and human pathogenic microorganisms. FEMS Microbiol. Rev. 2013, 37, 634–663. [Google Scholar] [CrossRef]
  91. Tjamos, E.C.; Tsitsigiannis, D.I.; Tjamos, S.E.; Antoniou, P.P.; Katinakis, P. Selection and screening of endorhizosphere bacteria from solarized soils as biocontrol agents against Verticillium dahliae of solanaceous hosts. Eur. J. Plant Pathol. 2004, 110, 35–44. [Google Scholar] [CrossRef]
  92. Abdel-Kader, M.M.; El-Mougy, N.S.; Khalil, M.S.A.; El-Gamal, N.G.; Attia, M. Soil drenching and foliar spray with bioagents for reducing wheat leaf diseases under natural field conditions. J. Plant Dis. Prot. 2023, 130, 279–291. [Google Scholar] [CrossRef]
  93. Hol, W.H.G.; De Boer, W.; Termorshuizen, A.J.; Meyer, K.M.; Schneider, J.H.M.; Van Dam, N.M.; Van Veen, J.A.; Van Der Putten, W.H. Reduction of rare soil microbes modifies plant–herbivore interactions. Ecol. Lett. 2010, 13, 292–301. [Google Scholar] [CrossRef]
  94. Jousset, A.; Bienhold, C.; Chatzinotas, A.; Gallien, L.; Gobet, A.; Kurm, V.; Küsel, K.; Rillig, M.C.; Rivett, D.W.; Salles, J.F.; et al. Where less may be more: How the rare biosphere pulls ecosystems strings. ISME J. 2017, 11, 853–862. [Google Scholar] [CrossRef] [PubMed]
  95. Chen, Q.-L.; Ding, J.; Zhu, D.; Hu, H.-W.; Delgado-Baquerizo, M.; Ma, Y.-B.; He, J.-Z.; Zhu, Y.-G. Rare microbial taxa as the major drivers of ecosystem multifunctionality in long-term fertilized soils. Soil Biol. Biochem. 2020, 141, 107686. [Google Scholar] [CrossRef]
  96. Deng, X.; Zhang, N.; Li, Y.; Zhu, C.; Qu, B.; Liu, H.; Li, R.; Bai, Y.; Shen, Q.; Salles, J.F. Bio-organic soil amendment promotes the suppression of Ralstonia solanacearum by inducing changes in the functionality and composition of rhizosphere bacterial communities. New Phytol. 2022, 235, 1558–1574. [Google Scholar] [CrossRef]
  97. Nemergut, D.R.; Schmidt, S.K.; Fukami, T.; O’Neill, S.P.; Bilinski, T.M.; Stanish, L.F.; Knelman, J.E.; Darcy, J.L.; Lynch, R.C.; Wickey, P.; et al. Patterns and processes of microbial community assembly. Microbiol. Mol. Biol. Rev. 2013, 77, 342–356. [Google Scholar] [CrossRef]
  98. Zhou, J.; Deng, Y.; Luo, F.; He, Z.; Tu, Q.; Zhi, X. Functional molecular ecological networks. mBio 2010, 1, e00169-10. [Google Scholar] [CrossRef]
  99. Kurm, V.; Van der Putten, W.H.; Hol, W.G. Cultivation-success of rare soil bacteria is not influenced by incubation time and growth medium. PLoS ONE 2019, 14, e0210073. [Google Scholar] [CrossRef]
  100. Albuquerque, U.P.; Nascimento, A.L.B.D.; da Silva Chaves, L.; Feitosa, I.S.; de Moura, J.M.B.; Gonçalves, P.H.S.; da Silva, R.H.; da Silva, T.C.; Júnior, W.S.F. A brief introduction to niche construction theory for ecologists and conservationists. Biol. Conserv. 2019, 237, 50–56. [Google Scholar] [CrossRef]
  101. Newsham, K.K.; Goodall-Copestake, W.P.; Ochyra, R.; Váňa, J. Mycothalli of the hepatic Barbilophozia hatcheri in Antarctica: Distribution and identities of mycobionts. Fungal Ecol. 2014, 11, 91–99. [Google Scholar] [CrossRef]
  102. Xu, Q.; Li, L.; Guo, J.; Guo, H.; Liu, M.; Guo, S.; Kuzyakov, Y.; Ling, N.; Shen, Q. Active microbial population dynamics and life strategies drive the enhanced carbon use efficiency in high-organic matter soils. mBio 2024, 15, e00177-24. [Google Scholar] [CrossRef] [PubMed]
  103. Rousk, J.; Bååth, E.; Brookes, P.C.; Lauber, C.L.; Lozupone, C.; Caporaso, J.G.; Knight, R.; Fierer, N. Soil bacterial and fungal communities across a pH gradient in an arable soil. ISME J. 2010, 4, 1340–1351. [Google Scholar] [CrossRef] [PubMed]
  104. Schmidt, J.E.; Kent, A.D.; Brisson, V.L.; Gaudin, A.C. Agricultural management and plant selection interactively affect rhizosphere microbial community structure and nitrogen cycling. Microbiome 2019, 7, 146. [Google Scholar] [CrossRef]
  105. Guan, H.; Fan, J.; Zhang, H.; Harris, W. Comparison of drivers of soil microbial communities developed in karst ecosystems with shallow and deep soil depths. Agronomy 2021, 11, 173. [Google Scholar] [CrossRef]
  106. Duan, N.; Li, L.; Liang, X.; Fine, A.; Zhuang, J.; Radosevich, M.; Schaeffer, S.M. Variation in bacterial community structure under long-term fertilization, tillage, and cover cropping in continuous cotton production. Front. Microbiol. 2022, 13, 847005. [Google Scholar] [CrossRef] [PubMed]
  107. Wang, W.; Dong, Y.; Wang, H.-B.; Xue, D.-H.; Zhang, H.-F.; Li, Z.-J.; Wang, H.; Bo, H.-J.; Zhang, W.-J.; Zhang, B.-H.; et al. Long-term legume cultivation affects the soil bacterial community via altering the soil pore structure in coal mine reclamation agroecosystems. Plant Cell Environ. 2025, 48, 1–15. [Google Scholar] [CrossRef]
  108. Luo, X.; Liu, K.; Shen, Y.; Yao, G.; Yang, W.; Mortimer, P.E.; Gui, H. Fungal community composition and diversity vary with soil horizons in a subtropical forest. Front. Microbiol. 2021, 12, 650440. [Google Scholar] [CrossRef]
  109. Daraz, U.; Erhunmwunse, A.S.; Dubeux Jr, J.C.; Mackowiak, C.; Liao, H.L.; Wang, X.B. Soil fungal community structure and function response to rhizoma perennial peanut cultivars. BMC Plant Biol. 2024, 24, 582. [Google Scholar] [CrossRef]
  110. Ling, N.; Wang, T.; Kuzyakov, Y. Rhizosphere bacteriome structure and functions. Nat. Commun. 2022, 13, 836. [Google Scholar] [CrossRef]
  111. Panke-Buisse, K.; Poole, A.C.; Goodrich, J.K.; Ley, R.E.; Kao-Kniffin, J. Selection on soil microbiomes reveals reproducible impacts on plant function. ISME J. 2015, 9, 980–989. [Google Scholar] [CrossRef] [PubMed]
  112. Toju, H.; Sato, H. Root-associated fungi shared between arbuscular mycorrhizal and ectomycorrhizal conifers in a temperate forest. Front. Microbiol. 2018, 9, 433. [Google Scholar] [CrossRef]
  113. Schlatter, D.C.; Hansen, J.C.; Schillinger, W.F.; Sullivan, T.S.; Paulitz, T.C. Common and unique rhizosphere microbial communities of wheat and canola in a semiarid Mediterranean environment. Appl. Soil Ecol. 2019, 144, 170–181. [Google Scholar] [CrossRef]
  114. Louca, S.; Parfrey, L.W.; Doebeli, M. Decoupling function and taxonomy in the global ocean microbiome. Science 2016, 353, 1272–1277. [Google Scholar] [CrossRef] [PubMed]
  115. Ondreičková, K.; Piliarová, M.; Klčová, L.; Žofajová, A.; Gubiš, J.; Horník, M.; Gubišová, M.; Hudcovicová, M.; Kraic, J. The impact of sewage sludge on the fungal communities in the rhizosphere and roots of barley and on barley yield. Open Life Sci. 2021, 16, 210–221. [Google Scholar] [CrossRef]
  116. Delgado-Baquerizo, M.; Eldridge, D.J.; Liu, Y.-R.; Sokoya, B.; Wang, J.-T.; Hu, H.-W.; He, J.-Z.; Bastida, F.; Moreno, J.L.; Bamigboye, A.R.; et al. Global homogenization of the structure and function in the soil microbiome of urban greenspaces. Sci. Adv. 2021, 7, eabg5809. [Google Scholar] [CrossRef]
  117. Duplessis, S.; Cuomo, C.A.; Lin, Y.-C.; Aerts, A.; Tisserant, E.; Veneault-Fourrey, C.; Joly, D.L.; Hacquard, S.; Amselem, J.; Cantarel, B.L.; et al. Obligate biotrophy features unraveled by the genomic analysis of rust fungi. Proc. Natl. Acad. Sci. USA 2011, 108, 9166–9171. [Google Scholar] [CrossRef]
  118. Barua, P.; You, M.P.; Bayliss, K.; Lanoiselet, V.; Barbetti, M.J. A rapid and miniaturized system using Alamar blue to assess fungal spore viability: Implications for biosecurity. Eur. J. Plant Pathol. 2017, 148, 139–150. [Google Scholar] [CrossRef]
  119. Barua, P.; You, M.P.; Bayliss, K.L.; Lanoiselet, V.; Barbetti, M.J. Extended survival of Puccinia graminis f. sp. tritici urediniospores: Implications for biosecurity and on-farm management. Plant Pathol. 2018, 67, 799–809. [Google Scholar] [CrossRef]
  120. Sohaliya, N.; Naik, A.; Patel, D. Puccinia. In Compendium of Phytopathogenic Microbes in Agro-Ecology; Springer: Cham, Switzerland, 2025; pp. 609–632. [Google Scholar]
  121. Chao, H.; Cai, A.; Heimburger, B.; Wu, Y.; Zhao, D.; Sun, M.; Hu, F. Keystone taxa enhance the stability of soil bacterial communities and multifunctionality under steelworks disturbance. J. Environ. Manag. 2024, 356, 120664. [Google Scholar] [CrossRef] [PubMed]
  122. Xun, W.; Liu, Y.; Li, W.; Ren, Y.; Xiong, W.; Xu, Z.; Zhang, N.; Miao, Y.; Shen, Q. Specialized metabolic functions of keystone taxa sustain soil microbiome stability. Microbiome 2021, 9, 35. [Google Scholar] [CrossRef]
  123. Kaisermann, A.; de Vries, F.T.; Griffiths, R.I.; Bardgett, R.D. Legacy effects of drought on plant–soil feedbacks and plant–plant interactions. New Phytol. 2017, 215, 1413–1424. [Google Scholar] [CrossRef]
  124. Wachowska, U.; Sulyok, M.; Wiwart, M.; Suchowilska, E.; Kandler, W.; Krska, R. The application of antagonistic yeasts and bacteria: An assessment of in vivo and under field conditions pattern of Fusarium mycotoxins in winter wheat grain. Food Control 2022, 138, 109039. [Google Scholar] [CrossRef]
  125. Stark, J.M.; Firestone, M.K. Mechanisms for soil moisture effects on activity of nitrifying bacteria. Appl. Environ. Microbiol. 1995, 61, 218–221. [Google Scholar] [CrossRef] [PubMed]
  126. Brockett, B.F.; Prescott, C.E.; Grayston, S.J. Soil moisture is the major factor influencing microbial community structure and enzyme activities across seven biogeoclimatic zones in western Canada. Soil Biol. Biochem. 2012, 44, 9–20. [Google Scholar] [CrossRef]
  127. Torres, N.; Yu, R.; Kurtural, S.K. Inoculation with mycorrhizal fungi and irrigation management shape the bacterial and fungal communities and networks in vineyard soils. Microorganisms 2021, 9, 1273. [Google Scholar] [CrossRef]
  128. He, X.; Zhang, Q.; Li, B.; Jin, Y.; Jiang, L.; Wu, R. Network mapping of root–microbe interactions in Arabidopsis thaliana. npj Biofilms Microbiomes 2021, 7, 72. [Google Scholar] [CrossRef]
  129. Berendsen, R.L.; Vismans, G.; Yu, K.; Song, Y.; de Jonge, R.; Burgman, W.P.; Burmølle, M.; Herschend, J.; Bakker, P.A.H.M.; Pieterse, C.M.J. Disease-induced assemblage of a plant-beneficial bacterial consortium. ISME J. 2018, 12, 1496–1507. [Google Scholar] [CrossRef] [PubMed]
  130. Pétriacq, P.; López, A.; Luna, E. Fruit decay to diseases: Can induced resistance and priming help? Plants 2018, 7, 77. [Google Scholar] [CrossRef] [PubMed]
Figure 1. Graphical abstract highlighting the experimental design. CT_BS—Control_BS (surrounding bulk soil from untreated soil); ST_IR_BS (surrounding bulk soil of seed pretreated followed by rhizosphere drenching); CT_RS—Control_RS (rhizosphere soil of untreated soil); ST_RS (rhizosphere soil of seed pretreated); ST_IR_RS (rhizosphere soil of seed pretreated followed by rhizosphere drenching). Plots were 100 cm long and 100 cm wide (d, e). Within each plot, 10 rows were arranged. The distance between plants within a row (c) was 10 cm, and the distance between rows (a) was 15 cm. Bulk soil samples were collected from a depth of 5 cm (b).
Soilsystems 09 00116 g001
Figure 2. Biological traits (I) and indole acetic acid (II) production of selected bacterial strains (I). Antagonistic activity of P. pabuli MGMM122 (1), P. megaterium MGMM124 (2), P. koreensis MGMM123 (3), and P. orientalis MGMM125 (4) against F. oxysporium Fo1 (A), A. alternata F-3047 (B), and Forl ZUM2407 (C). The ability of P. pabuli MGMM122, P. megaterium MGMM124, P. koreensis MGMM123, and P. orientalis MGMM125 to produce cellulase (D), protease (E), amylase (F), phytase (G), and lipase (H). Arrows indicated the enzymatic zone of activity. Cross-streak test between co-inoculated bacterial strains (I). Statistical difference at p < 0.05 among the produced indole acetic acid is presented by different letters above the bars.
Soilsystems 09 00116 g002
Figure 3. Fungal community at the genus level in the soil of barley at the tillering growth stage GS3 under treatments of microbial consortium. Chord diagram (A) of microbial composition across treated groups, with the width proportional to genus abundance. Control_BS as bulk soil from the control; Control_RS as rhizosphere soil from the control; ST_RS as rhizosphere soil of seed pretreated; ST_IR_RS as rhizosphere soil from seed pretreated, followed by rhizosphere drenching; ST_IR_BS as surrounding bulk soil from ST_IR_RS. The arc length of each treatment group corresponds to its total relative abundance in the fungal community. The arc length of fungal genera reflects their relative abundance. The top relative abundance of genera (B) in the fungal community in the soil of barley.
Soilsystems 09 00116 g003
Figure 4. Fungal community at the genus level in the barley soil at the booting growth stage GS5 under the treatments of microbial consortium. Chord diagram (A) of microbial composition across treated groups, with the width proportional to genus abundance. Control_BS as bulk soil from the control; Control_RS as rhizosphere soil from the control; ST_RS as rhizosphere soil of seed pretreated; ST_IR_RS as rhizosphere soil from seed pretreated, followed by rhizosphere drenching; ST_IR_BS as surrounding bulk soil from ST_IR_RS. The arc length of each treatment group corresponds to its total relative abundance in the fungal community. The arc length of fungal genera reflects their relative abundance. The top relative abundance of genera (B) in the fungal community in the soil of barley.
Soilsystems 09 00116 g004
Figure 5. Fungal community at the genus level in the soil of barley at the booting growth stage GS7 under the treatments of microbial consortium. Chord diagram (A) of microbial composition across treated groups, with the width proportional to genus abundance. Control_BS as bulk soil from the control; Control_RS as rhizosphere soil from the control; ST_RS as rhizosphere soil of seed pretreated; ST_IR_RS as rhizosphere soil from seed pretreated, followed by rhizosphere drenching; ST_IR_BS as surrounding bulk soil from ST_IR_RS. The arc length of each treatment group corresponds to its total relative abundance in the fungal community. The arc length of fungal genera reflects their relative abundance. The top relative abundance of genera (B) in the fungal community in the soil of barley.
Soilsystems 09 00116 g005
Figure 6. Fungal community at the genus level in the soil of barley during dough development (GS9) under treatments of microbial consortium. Chord diagram (A) of microbial composition across treated groups, with the width proportional to genus abundance. Control_BS as bulk soil from control; Control_RS as rhizosphere soil from the control; ST_RS as rhizosphere soil of seed pretreated; ST_IR_RS as rhizosphere soil from seed pretreated, followed by rhizosphere drenching; ST_IR_BS as surrounding bulk soil from ST_IR_RS. The arc length of each treatment group corresponds to its total relative abundance in the fungal community. The arc length of fungal genera reflects their relative abundance. The top relative abundance of genera (B) in the fungal community in the soil of barley.
Soilsystems 09 00116 g006
Figure 7. Venn diagram displaying the overlap of fungal species of microbial community across experimental groups in response to microbial consortium treatments. Control_BS (bulk soil from control); ST_IR_BS (bulk soil surrounding plants from pretreated seed followed by rhizosphere drenching); Control_RS (rhizosphere soil from control); ST_RS (rhizosphere soil of seed pretreated); ST_IR_RS (rhizosphere soil from seed pretreated following irrigation). a—(ST_RS): Fulvia fulva; b—(ST_IR_RS): Purpureocillium takamizusanense; c—(Control_RS; ST_IR_BS; ST_IR_RS): Malassezia japonica, Schizosaccharomyces pombe, Yarrowia lipolytica; d—(ST_IR_RS; ST_IR_BS): Australozyma saopauloensis, Cryptococcus decagattii; e—(Control_RS; ST_IR_RS): Saccharomycodes ludwigii; f—(ST_IR_BS): Lodderomyces elongisporus, Sugiyamaella lignohabitans; g—(ST_RS; Control_RS; Control_BS; ST_IR_BS): Fusarium verticillioides, Cryptococcus bacillisporus, Rhizophagus irregularis; h—(Control_BS; Control_RS; ST_IR_BS): Podospora pseudoanserina, Lodderomyces beijingensis; i—(Control_RS; ST_RS): Lachancea thermotolerans j—(Control_RS): Fusarium musae, Fusarium fujikuroi, Torulaspora globosa; k—(ST_IR_RS; Control_RS): Drechmeria coniospora; l—(Control_BS; ST_RS; ST_IR_RS; ST_IR_BS): Podospora bellae-mahoneyi.
Soilsystems 09 00116 g007
Figure 8. Relative abundance of fungal subcommunity at the genus level in the soil of barley under different treatments. Control_BS (bulk soil from control); ST_IR_BS (surrounding bulk soil surrounding plants from pretreated seed followed by rhizosphere drenching); Control_RS (rhizosphere soil of untreated plants); ST_RS (rhizosphere soil of seed pretreated); ST_IR_RS (rhizosphere soil of plants seed pretreated followed by rhizosphere drenching). Red, blue, and green colors indicated abundant, moderate, and rare microbial taxa, respectively.
Soilsystems 09 00116 g008
Figure 9. Redundancy analysis (RDA) between soil properties and fungal communities at the genus level from the group pretreated with microbial consortium. Control_BS (bulk soil from control); ST_IR_BS (surrounding plants from pretreated seed followed by rhizosphere drenching); Control_RS (rhizosphere soil of untreated plants); ST_RS (rhizosphere soil of seed pretreated); ST_IR_RS (rhizosphere soil of plants seed pretreated followed by rhizosphere drenching).
Soilsystems 09 00116 g009
Figure 10. Dynamics of log fold-change in phytopathogenic species in the rhizosphere of barley under treatment with microbial consortia in field conditions at GS3, GS5, GS7, and GS9 stages. ST_RS (rhizosphere of seed pretreated); ST_IR_RS (rhizosphere of plants seed pretreated followed by rhizosphere drenching).
Soilsystems 09 00116 g010
Figure 11. Alpha diversity analysis of fungal communities in the rhizosphere of barley under treatment with a microbial consortium. Control_BS (surrounding bulk soil of untreated plants); ST_IR_BS (surrounding bulk soil from seed pretreated followed by rhizosphere drenching); Control_RS (rhizosphere soil of untreated plants); ST_RS (rhizosphere soil of seed pretreated); ST_IR_RS (rhizosphere soil of seed pretreated followed by rhizosphere drenching). The Wilcoxon test at p < 0.05 was used to test the significant difference between groups. No statistical difference was found between groups at p < 0.05.
Soilsystems 09 00116 g011
Figure 12. Topological properties of fungal co-occurrence networks across treatments. Control_BS (surrounding bulk soil of untreated plants); ST_IR_BS (surrounding bulk soil from seed pretreated followed by rhizosphere drenching); Control_RS (rhizosphere soil from untreated plants); ST_RS (rhizosphere soil of seed pretreated); ST_IR_RS (rhizosphere soil of seed pretreated followed by rhizosphere drenching).
Soilsystems 09 00116 g012
Figure 13. Fungal community interaction networks analysis of top genera under different treatments with microbial consortia. Control_BS (surrounding bulk soil of untreated plants); ST_IR_BS (surrounding bulk soil from pretreated seed followed by rhizosphere drenching); Control_RS (rhizosphere soil of untreated plants); ST_RS (rhizosphere soil of seed pretreated); ST_IR_RS (rhizosphere soil of pretreated seed followed by rhizosphere drenching).
Soilsystems 09 00116 g013
Table 1. Experimental setup and sample collections.
Growth Stages (GS)Sample Collections
Bulk Soil (BS)Rhizosphere Soil (RS)
Untreated (CT_BS)Seed Treatment and Rhizosphere Drenching (ST_IR_BS)Untreated (CT_RS)Seed Treatment (ST_RS)Seed Treatment and Rhizosphere Drenching (ST_IR_RS)
Tillering (GS3)
Booting (GS5)
Flowering (GS7)
Dough development (GS9)
N.B. Samples from each plot were collected in 4 repetitions at different sampling points before each period of rhizosphere humidification. The sampling points were mixed to generate a unique soil pot sample. The unique soil sample was collected in four repetitions.
Table 2. Key topological features of the fungal network community across treatment.
Network Properties Control BSST_IR_BSControl RSST_RS ST_IR_RS
Nodes4647444445
Edges216194133157103
Positive edges216194130157103
Negative edges00300
Average degree9.39 ± 0.048.25 ± 0.086.04 ± 0.037.14 ± 0.024.58 ± 0.01
Average closeness0.05 ± 0.070.05 ± 0.010.19 ± 0.020.04 ± 0.010.08 ± 0.02
Modularity0.320.350.310.440.53
Transitivity0.680.700.740.570.44
Diameter7.177.157.737.185.51
Average path length2.42 ± 0.132.53 ± 0.102.66 ± 0.082.51 ± 0.072.24 ± 0.18
Density0.210.180.140.170.10
Assortativity0.460.540.670.640.16
Disclaimer/Publisher’s Note: The statements, opinions and data contained in all publications are solely those of the individual author(s) and contributor(s) and not of MDPI and/or the editor(s). MDPI and/or the editor(s) disclaim responsibility for any injury to people or property resulting from any ideas, methods, instructions or products referred to in the content.