Abstract
Soil bacterial communities are vital for ecosystem functioning in the humid tropics, yet their response to land-use change remains poorly understood. This knowledge gap is exacerbated by the lack of long-term studies. We employed a space-for-time substitution approach to assess the effects of land-use intensification on soil bacterial communities across a gradient of anthropogenic disturbance in Trinidad. Three sub-watersheds (Arouca = pristine, Maracas = intermediate, Tacarigua = intensive) were selected, each containing adjacent forest, grassland, and agricultural land uses. We combined geophysical soil apparent electrical conductivity (ECa-directed) sampling with 16S rDNA gene amplicon sequencing to characterize bacterial communities and their relationships with soil and landscape properties. Soil properties were the primary determinant of bacterial community structure, explaining 56% of the variation (p < 0.001), with pH, clay content, hygroscopic water, and nutrient availability as key drivers. Bacterial α-diversity differed significantly among sub-watersheds (p < 0.01), with Tacarigua exhibiting lower richness and diversity compared to Arouca and Maracas, but not across land uses. While a core microbiome of ten bacterial families was ubiquitous across land uses, indicating a stable foundational community, land-use intensification significantly altered β-diversity (p < 0.01 among sub-watersheds). Agricultural soils showed the greatest divergence from forest soils (p < 0.05), with a marked decline in key Proteobacterial families (e.g., Xanthomonadaceae, Pseudomonadaceae) involved in nutrient cycling and plant growth promotion. Although inherent soil properties shape the core microbiome, land-use intensification acts as a strong secondary filter, shifting soil bacterial communities toward more stress-resistant Firmicutes with potentially less diverse functions. Our findings demonstrate the utility of integrating space-for-time substitution with molecular profiling to predict long-term microbial responses to environmental change in vulnerable tropical ecosystems.
1. Introduction
Tropical regions, located between 23°28′ N and 23°28′ S, are characterized by year-round warm temperatures and exceptionally high soil biodiversity [1,2]. In these regions, the humid tropics receive over 2000 mm of annual rainfall, with high humidity throughout the year. Soils in these environments are typically acidic, phosphorus-limited, and prone to nutrient leaching, while high microbial activity and slow organic matter accumulation create unique but fragile ecosystems [3,4,5]. Soil bacterial communities are fundamental to these ecosystems, supporting functions such as nutrient cycling, organic matter decomposition, soil aggregation, disease suppression, and climate regulation [6,7,8,9,10]. Despite their ecological importance, tropical soils remain underrepresented in global soil microbiome databases [11], leaving gaps in our understanding of how environmental and anthropogenic pressures shape microbial communities in these systems.
Globally, bacterial communities respond strongly to gradients in soil pH, moisture, soil texture, vegetation, and land-use practices [12,13,14,15,16,17,18]. However, findings from the tropics are inconsistent. In the Amazon, land-use intensification increased bacterial alpha (α) and beta (β) diversities, with soil pH and chemical properties as major drivers [19,20], while other studies found that forest soils supported the highest bacterial diversity relative to pastures and croplands [20]. Similarly, across the Caribbean and Central America, results are mixed. Soil pH strongly influenced bacterial communities in Trinidadian soils [21,22], but had little effect on soils in Costa Rica [23]. In Jamaica, soil properties shaped bacterial composition in post-mined and unmined bauxite soils [24], while Pittl et al. [25] reported significant microbial differences among soil types in a rainforest in Costa Rica. These discrepancies suggest that tropical microbiomes are shaped by complex, site-specific interactions between soil properties, topography, vegetation, and land use, and that broader regional patterns remain poorly understood.
The Caribbean archipelago, a recognized biodiversity hotspot, exhibits a mosaic of soils due to its volcanic and tectonic history [26]. In Trinidad and Tobago, soil variability ranges from highly weathered, clay-rich Ultisols in the south to nutrient-poor Oxisols in the Northern Range [26]. The Northern Range of Trinidad, in particular, has undergone deforestation, hillside farming, and urban expansion, contributing to watershed degradation and threatening ecosystem services such as freshwater supply and carbon storage [27,28]. Given these pressures, soil microbial communities in this region are likely being reshaped, with potential consequences for soil fertility and resilience. Yet, no systematic study has evaluated how soil properties, landscape parameters, and land-use practices jointly influence bacterial assemblages in Trinidad’s humid tropical watersheds.
Long-term monitoring of microbial responses to such land-use changes in the humid tropics is rare. To overcome this limitation, we applied a space-for-time substitution approach [29,30], in which spatial contrasts among land uses are used as proxies for temporal dynamics. Specifically, we treated forest, grassland, and agriculture within each sub-watershed as a land-use chronosequence, representing successive stages of land conversion. By embedding these land uses within three sub-watersheds of differing management intensity (Arouca = pristine, Maracas = intermediate, Tacarigua = intensive), we inferred trajectories of bacterial community change under land use intensification while simultaneously accounting for soil and landscape variability.
In this study, we tested the following two hypotheses: (i) soil physicochemical properties are the primary determinants of bacterial community structure, reflecting adaptation to local edaphic conditions, and (ii) land-use intensification modifies these intrinsic communities, potentially reducing the abundance of sensitive taxa through soil disturbance and management practices. Specifically, we aimed to (i) quantify differences in bacterial α- and β-diversity among land uses and sub-watersheds, (ii) identify soil and landscape variables shaping community composition, and (iii) evaluate how land-use intensification modulates soil-microbe relationships.
2. Materials and Methods
2.1. Region Description
The Northern Range of Trinidad and Tobago, the southernmost twin island nation in the Caribbean archipelago, is the island’s primary relief landform and is the country’s largest watershed [27]. The majority of the Northern Range is elevated between 90 m and 450 m; however, elevations extend well over 600 m in some areas. The Range’s climate is typical of a seasonal tropical regime with a dry season from January to May and a wet season from June to December. Long-term rainfall records show that annual rainfall decreases relative to elevation from 3048 mm in the northeast of the Range to 1524 mm towards the west and south [27]. Temperatures in the Northern Range are generally similar to Trinidad’s mean annual maximum and minimum temperatures of 33.1 °C and 22.7 °C, while temperatures slightly decrease at higher elevations and within shaded valleys. Natural vegetation formations in the Northern Range vary according to temperature and moisture gradients associated with elevation and rainfall patterns. However, due to anthropogenically driven land use change, much of the natural vegetation has been converted to tree-crop estates, agricultural fields, quarries, and urban centers.
2.2. Site Description
Three sub-watersheds in the Northern Range of Trinidad were selected to represent a gradient of anthropogenic management intensity: Arouca (10°41′54.7″ N 61°19′20.7″ W), considered the most pristine with minimal intervention; Maracas (10°42′49.6″ N 61°24′44.5″ W), with intermediate management intensity; and Tacarigua (10°42′02.5″ N 61°21′00.5″ W), the most intensively farmed sub-watershed, featuring high-input vegetable production (Figure 1). Based on the USDA Keys to Soil Taxonomy, the dominant soil types within the study area are Chromic Dystraquerts and Dystric Fluventic Eutrudepts [31] (Figure 1). The three sub-watersheds vary in their level of farming intensity, with Arouca being the most pristine and Tacarigua the most intensively farmed. Each sub-watershed included three adjacent land use areas (forest, grass, agriculture), hereafter referred to as plots; thus, land uses are nested in sub-watersheds. Forest plots were characterized as seasonal evergreen forests. Perennial grass plots were dominated by a mixture of Elephant grass (Pennisetum purpureum) and fowl-foot grass (Eleusine indica). Agricultural plots varied from long-term plantation crops such as cocoa (Theobroma cacao L.), medium-term green fig (Musa acuminata), short-term pigeon peas (Cajanus cajan), and habanero peppers (Capsicum chinense habanero) (Table S1). Soil depth information is unavailable for most of the study areas. However, De Caries et al. [32] measured soil depth (i.e., the depth to the argillic horizon), which ranged from 0.17 m to 1.25 m along a transect in the same study site in the Maracas sub-watershed. Based on soil sampling exercises, soil depth was generally deepest in the Maracas sub-watershed, followed by the Tacarigua and then the Arouca sub-watersheds.
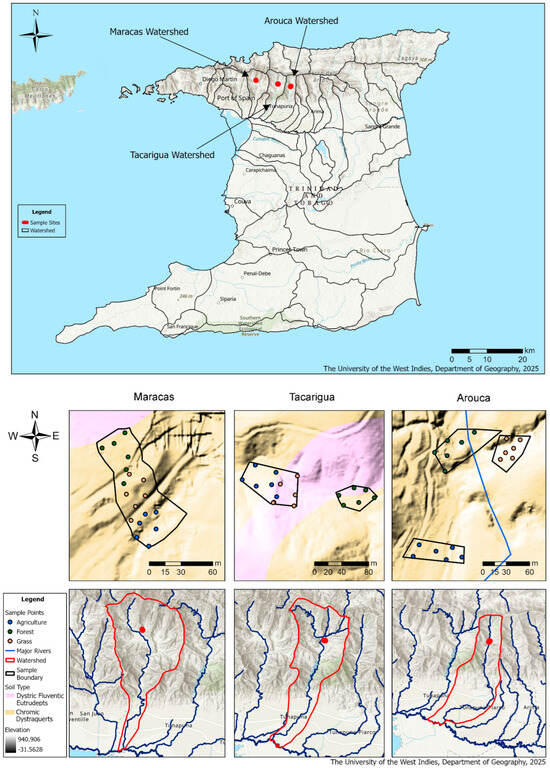
Figure 1.
Map of Trinidad showing the study region and the location of each sampling point within each sub-watershed. Note. The different colored areas represent land cover and soil types within each watershed: Blue—Agricultural land, Green—Forested areas, Orange—Grassland or open cover, Red outlines—Watershed boundaries, Blue lines—Major rivers, Soil Type Dystric Fluventic Eutrudepts—Pink areas, and Soil Type Chromic Dystraquerts—Tan areas.
2.3. Study Design Sampling Chronology
We adopted a space-for-time substitution (SFT) approach [30,33] to assess the effects of land-use intensification on soil bacterial communities. In this framework, spatial variation among land uses is interpreted as a proxy for temporal trajectories of change, enabling us to infer long-term impacts of conversion without extended monitoring. Within each sub-watershed (Arouca, Maracas, Tacarigua), we identified three adjacent land uses, namely forest, grassland, and agriculture, that represent successive stages of land conversion, hereafter referred to as a land-use chronosequence. We assumed that plots were comparable in all factors within each sub-watershed except for land-use history, and therefore differences in bacterial communities among land uses reflect cumulative effects of disturbance and management. The three sub-watersheds themselves were selected to represent a broader gradient of management intensity across Trinidad’s Northern Range. This nested design allowed us to capture both local chronosequences (land-use transitions within sub-watersheds) and regional variation (differences in watershed-level management intensity). All geophysical surveys and soil sampling were conducted during the dry season, between September 2019 and March 2020, to minimize seasonal variation in soil conditions.
2.4. Soil Sampling and Analyses
A DUALEM-1S EC meter (Dualem, Milton, ON, Canada) equipped with supplemental hardware and software as described by De Caires et al. [34] was used to perform geophysical surveys of each land use plot by apparent soil electrical conductivity (ECa) readings every 1 s at 0–0.5 m depth where possible. Geophysical surveys were conducted between September 2019 and March 2020. The ECa data collected during the first survey (September 2019) were inputted into ESAP (ESAP-95 version 2.01 software package; [35]) to generate a directed sampling design for each land use plot based on the spatial variability of the ECa [36], hereafter referred to as the ECa-directed sampling design. Six ECa-directed sampling points were identified in each of the three land use plots in each of the three above-mentioned sub-watersheds (i.e., 54 sampling points in total).
In October 2019, at each predetermined sample location, a composite soil sample (0–0.2 m depth) was collected using a Dutch auger, consisting of 3–5 sub-cores within a 1 m radius. A subsample (~20 g) was placed in a sterile bag for microbial analysis, and the remainder of the soil was placed in a Ziplock bag for the analysis of soil physicochemical properties. The samples collected for microbial analysis were placed in an ice cooler immediately after sampling and transferred to a −80 °C freezer for storage. Before shipping these soil samples for downstream analyses, they were treated with the LifeGaurd DNA preservation solution according to the manufacturer’s protocol (Qiagen, Hilden, Germany). Additionally, at each sampling point, the DUALEM-1S EC meter was placed flat on the Earth’s surface and oriented as appropriate to obtain ECa point measurements.
At the laboratory, samples collected for physicochemical analysis were first analyzed for gravimetric water content (θg) by drying approximately 30 g of moist soil to constant weight at 105 °C [37]. The remaining soil was air-dried, mixed, crushed, and passed through a 2 mm sieve. Particle size distribution was determined by the hydrometer method [38]. Hygroscopic water content (θh) and water-stable aggregates (WSAs) were determined as described in [39] and [28], respectively. Soil pH (soil-to-water ratio 1:1.25) [40], soluble salts (SS) [41], and acid activity (AA) [42] were measured using standard methods. Exchangeable Na, Ca, and Mg were extracted using neutral 1 M potassium chloride (KCl) [43] and then determined by Atomic Absorption Spectroscopy. The loss-by-ignition method was used to determine soil organic matter [44]. Available phosphorus (P), potassium (K), iron (Fe), manganese (Mn), zinc (Zn), and copper (Cu) were extracted using a modified Olsen sodium bicarbonate/EDTA extractant [45]. Phosphorus was measured by colorimetry (Portch and Hunter 2002), and K, Fe, Mn, Zn, and Cu were measured by atomic absorption spectroscopy [46]. Available boron (B) and extractable sulfate-sulfur (S) were extracted with calcium phosphate. Boron was determined by colorimetry with curcumin [47] and S by turbidimetry with barium chloride [48]. Exchangeable ammonium nitrogen (i.e., available nitrogen (N)) was extracted with 2 M KCl and determined by colorimetry [49]. Cation exchange capacity (CEC) was determined by the summation of Ca, Mg, K, Na, and H cations [50].
2.5. Digital Elevation-Derived Landscape Variables
Landscape variables (slope gradient and curvature) were extracted from digital elevation models with a resolution of 2 m using ArcGIS Pro (v2.8). The slope was derived at each sampling point using the Slope tool to calculate the maximum rate of change from a raster cell to its neighboring cells, which provides a natural fit to the terrain. The Curvature function was used to derive planform curvature, hereafter referred to as curvature, at each sampling point as it relates to both the convergence and divergence of flow across a surface [51].
2.6. rDNA Extraction, Library Preparation, Sequencing, and Processing
Genomic DNA was extracted from 0.25 g of soil using a DNeasy PowerSoil Pro Kit (Qiagen, Hilden, Germany) following the manufacturer’s protocol. DNA concentrations were quantified using a Qubit 2.0 fluorometer and dsDNA High Sensitivity kit both from Thermo Fisher Scientific (Waltham, MA, USA), and standardized to 2.5 ng/μL before library preparation. The V3–V4 fragment of the 16S rDNA gene was polymerase chain reaction (PCR)-amplified using 342F (5′–CTACGGGGGGCAGCAG–3′) and 806R (5′–GACTACHVGGGTWTCTAAT–3′) primers with Illumina adapters [5].
A reaction volume of 20 μL containing 2 μL of genomic DNA and 18 μL of a master mix comprising 12.5 μL of nuclease-free water (HF-H2O), 2.5 μL of DreamTaq buffer, 2.5 μL of 2 mM concentration dNTP (Invitrogen, Carlsbad, CA, USA), 0.25 μL of each primer (IDTVR, Coralville, IA, USA) and 0.25 μL of DreamTaq Hot Start DNA Polymerase (Thermo Scientific, Carlsbad, CA, USA) was prepared and used for amplification under the following conditions: 5 min at 95 °C; 30 cycles of 30 s at 95 °C, 45 s at 54 °C, and 1 min at 72 °C; 7 min at 72 °C in T100TM Thermal cycler (Bio-Rad Laboratories, Hercules, CA, USA). Following amplification, 1% Agarose Gel with 0.1% SYBR Safe (Invitrogen, Carlsbad, Hercules, CA, USA) was used to validate that the targeted region was amplified. PCR products were purified using Sera-Mag DNA purification beads (Cytiva, Marlborough, MA, USA) before and after indexing. A 25 μL volume mix containing 2.5 μL of purified PCR product, 2.5 μL of both indexes in the Nextera XT Index Kit (Illumina Inc., San Diego, CA, USA), and 17.5 μL of a DreamTaq reaction mix containing 12.25 μL of NF-H2O, 2.5 μL of Dreamtaq Buffer, 2.5 μL of 2 mM concentration dNTP, and 0.25 μL of DreamTaq was indexed under the following conditions: 3 min at 95 °C; 8 cycles of 30 s at 95 °C, 30 s at 55 °C, and 30 s at 72 °C; 5 min at 72 °C and held at 4 °C using a T100TM Thermal cycler (Bio-Rad Laboratories, Hercules, CA, USA). Indexed purified PCR products were quantified using a Qubit 2.0 fluorometer and dsDNA High Sensitivity kit and standardized to 4 ng/μL before pooling all the purified indexed PCR products for Illumina Sequencing. Negative controls containing no DNA and randomly selected replicates were used as quality assurance/quality control measures throughout DNA library preparation. Negative controls were quantified using Qubit and confirmed to contain negligible DNA. The pooled sample was sequenced using 600 cycles of Illumina MiSeq Chemistry (Illumina, San Diego, CA, USA).
Cutadapt (v.4.1) [52] was used to remove the primer sequences from both forward and reverse reads. Forward and reverse reads were imported into QIIME 2 (v.2022.2, [53]) using the fastq manifest format, and both forward and reverse reads were visually inspected. Overall, the reverse reads had low quality, which led to poor retention of paired reads (26.5%) following merging and denoising using DADA2 (even after optimized trimming for low-quality base calls). As a result, analysis was performed using the forward reads only, which resulted in 50.8% of reads retained after denoising using the DADA2 [53] plugin for QIIME 2. A total of 1,495,672 reads and 5356 unique features were retained with minimum (14,133), median (22,418), and maximum (32,691) reads per sample. Taxonomic classification of each amplicon sequence variant (ASV) was performed using the q2-feature-classifier plugin [54] in QIIME 2 and a classifier that was pre-trained from the SILVA database v.138.1 [55] at 99% sequence similarity. The final output table of ASVs was used to analyze bacterial community diversity, structure, and composition.
2.7. Statistical Analysis
All data and statistical analyses were performed using R Core Environment 4.5.1 [56] and RStudio version 2024.12.1+563 [57]. The relative abundance and core microbiomes, using 20% prevalence and 0.01% relative abundance thresholds. All subsequent analyses were performed on a phyloseq object [58] that combined taxonomic, feature-table, and categorical metadata information, and where chloroplast, mitochondria, and unclassified phyla were removed. The analysis of microbiome compositions with bias correction (ANCOMBC) [59] was used to identify taxa with differential abundance among land uses and sub-watersheds. Samples were rarefied before α-diversity (Observed, Chao1, and Shannon indexes) analysis at the lowest even sampling depth of 14,123. Rarefaction analysis was performed using the ggrare function in the ggplot2 package (v3.5.1) [60] to confirm the adequate sampling depth needed to capture bacterial diversity (Figure S1).
A two-factor nested analysis of variance (ANOVA), with sub-watershed as a fixed factor and land use nested within the sub-watershed as a random factor, was used to evaluate the effect of these factors on soil physicochemical, landform parameters, α-diversity. Statistical significance and pairwise comparisons were performed using Tukey’s post hoc tests using TukeyHSD function. Principal component analysis (PCA) was conducted on the Bray–Curtis dissimilarity matrix following centered log-ratio transformation with zero replacement [61,62] to assess the microbial community structure (β–diversity). This was followed by a permutational analysis of variance (PERMANOVA) and pair-wise PERMANOVA to evaluate interactions among sub-watersheds and land uses using the vegan package (v. 2.6-4) [63]. A redundancy analysis (RDA) was used to explore, visualize, and model the relationship between soil bacterial communities, environmental (soil and landform) parameters, and land use.
3. Results
3.1. Differences in Soil Physico-Chemistry and Landscape Parameters Among Sub-Watersheds and Land Uses
The three sub-watersheds exhibited distinct soil physicochemical properties consistent with their selection along a gradient of land-use intensity (Table 1 and Table 2), while land uses within them showed more variable differences. Landform parameters were very similar across sub-watersheds except for a lower slope gradient in the Arouca sub-watershed (Table 1). Soils were generally coarse-textured (600–814 g kg−1 of sand), with silt and clay contents of varying smaller proportions. The highest clay content (173 g kg−1) was observed in the Maracas sub-watershed, which also showed the largest gradient across land uses, with the lowest and highest clay contents in agriculture (106 g kg−1) and forest (237 g kg−1) plots, respectively. The amount of water-stable aggregates was doubled in the Arouca sub-watershed (521 ± 41 g kg−1) compared to the other two sub-watersheds. Water contents (θh and θg) did not vary significantly among sub-watersheds but significantly differed across land use (Table 1). Generally, the forest land use showed the highest water contents, with the largest range across land uses found in the Arouca sub-watershed, with θh (the hygroscopic water content) in agriculture plots being lowest (0.008 g g−1), intermediate in grassland (0.009 g g−1), and highest in forest (0.013 g g−1) plots.

Table 1.
Soil physical properties, water content, and landform parameters for sub-watersheds and land use.
Table 2.
Soil chemical properties by sub-watersheds and land use.
Soil chemical properties, especially N, P, K, pH, Fe, Mn, Zn, AA, and SS, varied significantly among sub-watersheds (Table 2). Specifically, Mn, P, N, and SS were significantly higher in the Arouca sub-watershed compared to the Maracas and Tacarigua sub-watersheds. Both Mn and P span a land use gradient in the Arouca sub-watershed with Mn following the order of Forest < Agriculture < Grassland, and P following the order Forest < Grassland < Agriculture. P was also significantly higher in agriculture plots within each sub-watershed (Table 2). OM and CEC did not vary significantly across sub-watersheds but differed across land uses within sub-watersheds. Many of the soil physical and landscape parameters were co-correlated (Figure 2).
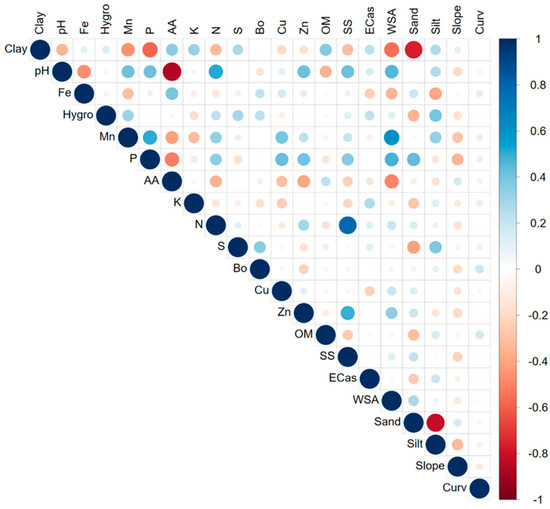
Figure 2.
Correlation matrix between landscape factors and soil properties across the three sub-watersheds. Clay = Clay content, Fe = iron, Hygro = hygroscopic water content, Mn = manganese, P = phosphorus, AA = acid activity, K = potassium, N = nitrogen, S = sulphur, Bo = boron, Cu = copper, Zn = zinc, OM = soil organic matter content, SS = soluble salts, ECas = apparent soil electrical conductivity (0–0.5 m), WSA = water-stable aggregates, Sand = sand content, Silt = silt content, Curv = curvature.
3.2. Bacterial Community Composition Among Sub-Watersheds and Land Uses
The study used 54 samples collected from the three sub-watersheds and the three land uses. After removing chloroplasts, mitochondria, and unclassified phyla, 1,228,727 ASVs were retained, averaging 22,754 reads per sample with a range of 14,123 to 32,662. A total of 5356 unique ASVs were identified. At the phylum level, Firmicutes were overwhelmingly dominant, comprising 85% of ASVs across all sub-watersheds and land uses (Figure 3a,b), followed by Proteobacteria and Actinobacteriota. We note that this high relative abundance may be influenced by the use of LifeGuard DNA preservation solution, which can enhance the recovery of endospore-forming Firmicutes [64]. Despite this potential bias, clear patterns emerged: Firmicutes were least abundant in the most pristine Arouca sub-watershed and under forest and grassland land uses, which are least affected by anthropogenic activities.
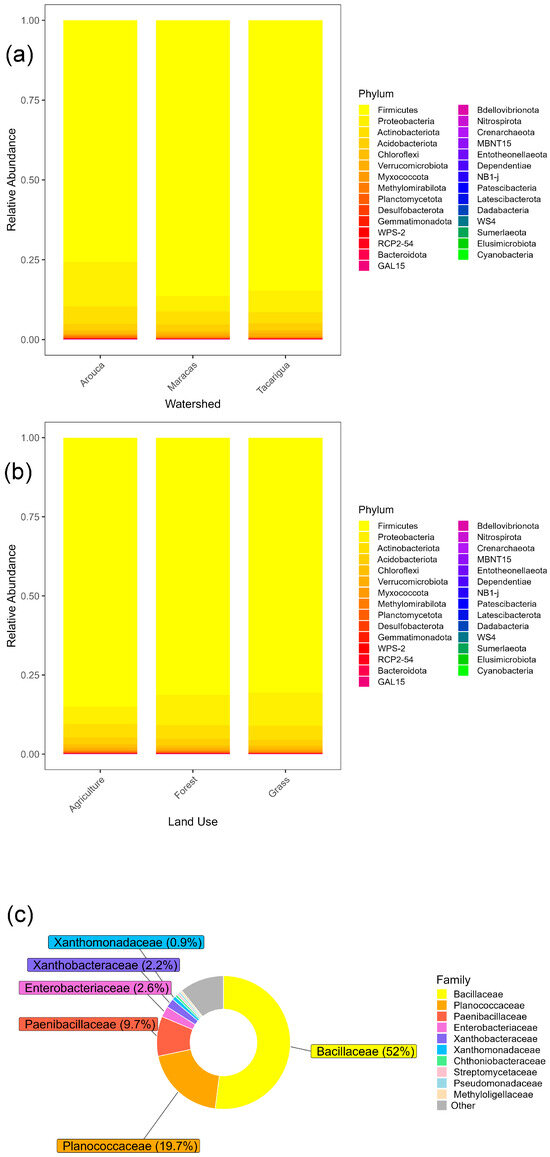
Figure 3.
Relative abundance of the dominant bacterial phyla in the soil bacterial microbiome identified using the SILVA database across (a) sub-watersheds and (b) land uses. (c) Pie chart of dominant bacterial families across the sub-watersheds and land uses.
To examine the microbial community composition further, a “core microbiome” was defined as ten core bacterial families present in every sample. These ten families included Bacillaceae, Planococcaceae, Paenibacillaceae, Xanthobacteraceae, Enterobacteriaceae, Xanthomonadaceae, Pseudomonadaceae, and Chthoniobacteraceae, as well as Uncultured and Not Assigned families (Figure 4). Four of the families (Bacillaceae, Planococcaceae, Paenibacillaceae, and Peptostreptococcaceae) are common Gram-positive soil bacteria families, and four families belong to Gram-negative bacteria commonly found in soils (Xanthobacteraceae, Enterobacteriaceae, Xanthomonadaceae, and Chthoniobacteraceae). The core microbiome was very similar across land uses (Figure 4), and it was not possible to identify a core microbiome separated by sub-watershed.
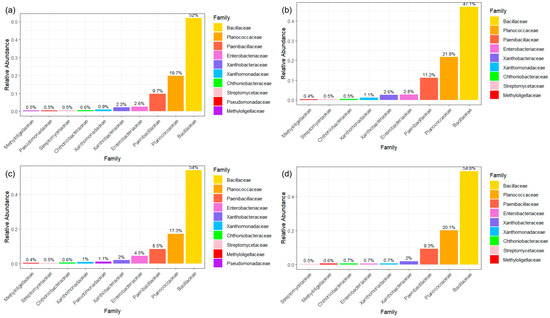
Figure 4.
Core bacterial microbiome defined as 20% prevalence at an abundance threshold of at least 0.01% for (a) all samples and each land use; (b) forest; (c) grass; and (d) agriculture.
The ‘core microbiome’ of ten bacterial families was found to be ubiquitous across all samples (Figure 4). This indicates a stable foundational community which is resistant to land-use change. Despite this stability at the broad taxonomic level, analysis of differential abundance (ANCOM-BC) revealed significant shifts in specific taxa. A total of 159 ASVs (from 54 families) were differentially abundant among sub-watersheds (Figure S2) and 32 ASVs (from 17 families) among land uses (Figure 5) (p < 0.001). Although there was low differential abundance at the family level among land uses, bacterial abundance in the forest and agricultural soils was most different (Figure 3 and Figure 4). Both forest and grassland showed high abundance of JG30-KF-AS9, which was not detected in agriculture plots. However, in agriculture plots, Blastocatellaceae were highly abundant as well as in forest plots, but were not detected in grassland plots. Overall, bacterial families in grassland plots overlapped most with families found in both forest and agriculture plots.
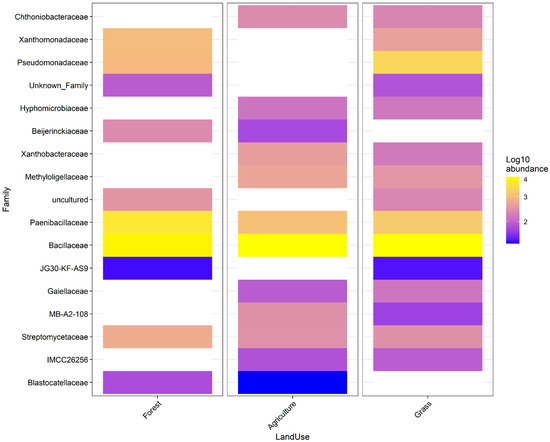
Figure 5.
Bacterial differential abundance showing differences in bacterial community composition by family between land uses. Families shown as grey are not present. Differences in bacterial communities for each sub-watershed are shown in Figure S3.
3.3. Soil Bacterial Community Richness and Diversity (α-Diversity) and Community Structure (β-Diversity)
The α-diversity indices (Observed, Chao1, and Shannon) were significantly different among sub-watersheds (p < 0.05) (Table 3). Pair-wise comparisons revealed that all α-diversity indices were significantly different between the Tacarigua and the Arouca sub-watersheds (p < 0.05). Additionally, the Shannon index differed significantly between Tacarigua and the Maracas sub-watersheds, indicating that these sub-watersheds had similar bacterial richness but different diversities (Table 4). In contrast, the α-diversity indices were not significantly different among land uses.
Table 3.
Results of a two-way nested ANOVA showing differences in α-diversity between watersheds and land uses nested within watersheds. Significant differences (p < 0.05) shown in bold.
Table 4.
Pairwise comparisons showing differences in α-diversity between watersheds. Significant differences (p < 0.05) shown in bold.
In contrast to the clear effect of sub-watershed on the bacterial α-diversity, we observed no significant differences in α-diversity indices among land uses (Table 3). However, an analysis of β-diversity revealed strong and interpretable patterns consistent with the SFT approach. Sub-watershed and land use both significantly impacted bacterial community structure (Figure 6 and Table 5). Bacterial communities were distinctly clustered by sub-watershed, explaining 28% of the variation, while land use explained an additional 20%. Along PC1, the Arouca (most pristine) and Tacarigua (most intensively farmed) sub-watersheds were well separated, with Maracas in an intermediate position. The observed pattern also mirrors the hypothesized temporal trajectory of land-use intensification (forest → grassland → agriculture) across watersheds of increasing land management pressure.
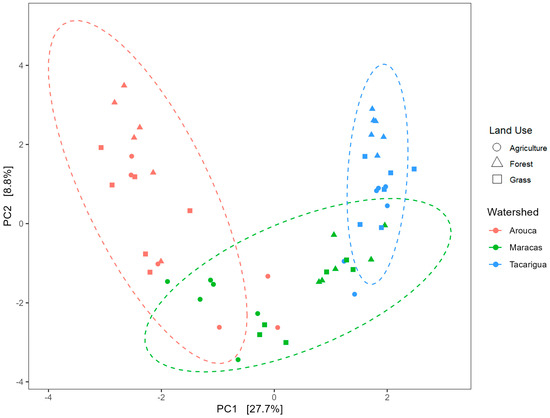
Figure 6.
Principal Component Analysis (PCA) was performed on centered-log transformed data and shows the effect of land use (symbols) and sub-watershed (colors) on the β-diversity of the soil bacterial microbiome. Dashed circles mark the three sub-watersheds.
Table 5.
Results of a PERMANOVA showing differences in β-diversity between watersheds and land use nested in watershed. Significant differences are shown in bold (p < 0.05).
Within sub-watersheds, bacterial communities in agricultural plots showed greater overlap with communities in forest and grassland plots, particularly in the Tacarigua sub-watershed. This suggests that under intensive management, bacterial communities may converge or homogenize across land uses, reflecting cumulative disturbance legacies. Contrastingly, bacterial communities in forest and grassland remained more distinct in the less disturbed Arouca sub-watershed, consistent with earlier stages of the land-use conversion sequence. Pairwise comparisons confirmed that bacterial β-diversity was significantly different (p < 0.01) among all sub-watersheds, and specifically between forest and agricultural land uses (p < 0.05) (Table 6).
Table 6.
Results of a PERMANOVA showing pair-wise comparisons in β-diversity between watersheds and land uses. Significant differences are shown in bold (p < 0.05).
Together, these results support the interpretation that bacterial community structure reflects not only spatial heterogeneity but also directional, stage-dependent changes consistent with a chronosequence framework.
3.4. Relationship Between Soil Physico-Chemistry Properties and Bacterial Community Composition
Soil and landscape parameters explained 56% of the variation in the soil bacterial composition across sample sites, with pH, Mn, Fe, clay content, θh and P (Figure 7) being predictors of variation in soil bacterial community composition across the sub-watersheds (Table 7; adjusted R2 = 23%). In the Maracas sub-watershed, bacterial community composition was best described by clay content and K, whereas the major drivers were AA and Fe in the Tacarigua sub-watershed, and pH, Mn, θh and P in the Arouca sub-watershed (Table 7). These results demonstrate that while a common set of edaphic factors (pH, Mn, Fe, clay, θh, P) governs bacterial community composition at the regional scale, the primary environmental filters are location-specific. This underscores that soil properties are the foundational drivers of microbial community structure, but their relative importance is modulated by the local land use context of each sub-watershed.
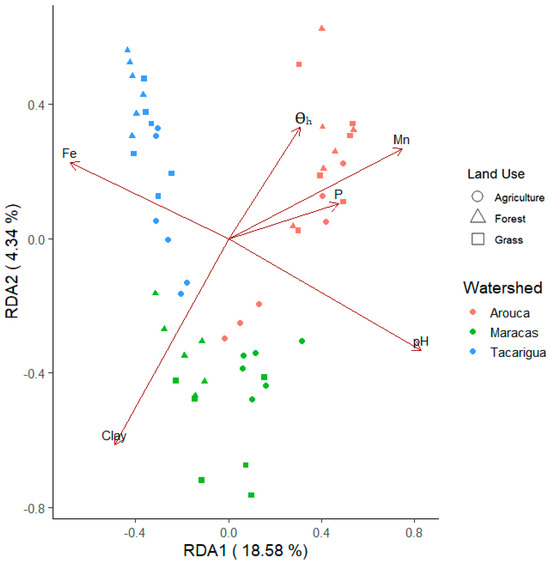
Figure 7.
Redundancy Analysis (RDA) biplot of soil bacterial communities across sub-watersheds and land uses constrained by significantly correlated soil parameters; Fe = iron, Clay = clay content, θh = hygroscopic water content, Mn = manganese, P = phosphorus, pH = soil pH.
Table 7.
Statistical summary of the significant soil physico-chemical predictors of bacterial community composition as determined by redundancy analysis (RDA) shown in Figure 5. All measured soil properties and landscape parameters were added in the analysis; only significant properties are presented here. Significant differences are shown in bold (Pr (>F) < 0.05), R2 = 0.32, adjusted R2 = 0.23; Mn = manganese, Fe = iron, θh = hygroscopic water content, P = phosphorus.
4. Discussion
4.1. Landscape Parameters and Soil Physical Properties
Overall, the sub-watersheds in this study are prone to water stress, erosion, and leaching, reflected in the generally low P, N, and K contents, high sand content, and poor aggregate stability. The three most important nutrients required for plant growth (N, P, and K; Table 2) were generally lower than the recommended threshold for crops [65]. In comparison, though Cu, Fe, Mn, Zn, and S exceeded the recommended thresholds for agricultural production in multiple sampling locations. However, the average nutrient values were generally optimal for the growth and productivity of agricultural crops.
Aggregate stability with an average of 273 g kg−1 was similar to a study in the Maracas sub-watershed [34]. The Arouca sub-watershed, which is least impacted by human activity, had greater aggregate stability compared to the Maracas and Tacarigua sub-watersheds (Table 1). Notably, forests had the lowest aggregate stability within their respective sub-watersheds; barring this, forests may be more resilient to drought commonly experienced in the dry season as they were able to hold more water and contained the highest clay and slit content compared to the grassland agriculture land use within their respective sub-watersheds. However, forests may be more resilient to dry-season drought because of their higher clay and silt contents, which improve water-holding capacity relative to grassland and agriculture plots. Tian et al. [66] reported that vegetated land had several advantages over bare land. Thus, these results corroborate existing knowledge on the potential benefits of vegetation restoration, particularly forest restoration, on improving soil physicochemical properties.
These results corroborate existing knowledge that soil physicochemical properties are dominant controls on microbial composition in the humid tropics. Soil pH, clay content, and mineral type strongly regulate nutrient solubility, element toxicity, and the creation of microsites that support microbial niches [12,67,68,69]. The low macronutrients (NPK) but elevated trace metals we observed are consistent with Northern Range soils previously reported as highly leached and erosion-prone [34,70].
4.2. Bacterial Community Composition
Our study reports on an overall dominance of Firmicutes (Figure 3). We acknowledge that a dominance of Firmicutes may be an overestimation of this family based on the use of LifeGuard DNA preserving solution as reported by [55]. However, another study published by [71] reported no difference between soils that were treated or untreated with LifeGuard. Nonetheless, soils dominated by Firmicutes are not uncommon, as studies such as [72] classified nearly all bacterial 16S rDNA sequences obtained from black soil in northeast China into the phylum Firmicutes with Bacillus, Paenibacillus, and Lysinibacillus among the most abundant genera. The dominance of Firmicutes here is likely an ecological response to local soil stressors, i.e., low macronutrients, coarse texture, water stress, and high trace metals, conditions under which spore-forming Gram-positive taxa thrive (Table 1 and Table 2).
The results of this study are different to previous studies conducted in open native savannah grasslands, teak, and native forests in Trinidad [22,73], where Gram-negative Proteobacteria and Acidobacteria dominated bacterial communities. This may reflect differences in soil and landform parameters (i.e., slope and curvature), as soils in previous studies had significantly lower pH (range = 4.0–5.2) than in the current study (range = 4.5–7.0), were finer in texture (silt + clay range = 650–910 g kg−1) than the current study (range = 145–536 g kg−1), and were more nutrient-rich.
4.3. Linking Bacterial Families to Soil Functions
In general, Firmicutes, a group of endospore-producing Gram-positive bacteria, can tolerate harsh environmental conditions and plays important roles in nutrient cycling [74], disease suppression [75], promotion of plant growth [76], enzyme activity [77] and soil aggregation [78]. Firmicutes are a ubiquitous component of soil microbiomes and are frequently found in relatively high abundances in extreme edaphic conditions such as acidic, saline–alkali, and desert soils [72]. Soils in this study were located on gentle to steep slopes. They were prone to erosion and subjected to extended periods of water stress. In some instances, trace elements such as Cu, Fe, Mn, Zn, and S exceeded the recommended thresholds for agricultural production at multiple sampling locations. We consequently hypothesize that this resulted in water- and nutrient-stressed conditions, which are ideal for Firmicutes to thrive.
Generally, Bacillaceae, Planococcaceae, Paenibacillaceae, and Peptostreptococcaceae are well-adapted to survive in various environmental conditions, including soils with strong temporal variations in temperature and moisture [79]. Many Gram-positive bacteria produce endospores, which are highly resilient, dormant structures that can withstand extreme conditions such as heat, desiccation, and nutrient scarcity [80]. Spore production is a critical survival strategy, allowing these bacteria to persist through unfavorable periods, such as prolonged drought in the humid tropics, and germinate when conditions become favorable again [81]. Thus, the ability to produce endospores ensures that Gram-positive bacteria can maintain their populations and continue to play essential roles in soil ecosystems, such as nutrient cycling and organic matter decomposition, despite the challenges posed by fluctuating environmental conditions.
Unlike several Gram-positive bacteria that produce dormant spores in response to low nutrients and harsh conditions, Gram-negative bacteria generally develop resistance cells without dormancy [82]. Overall, the bacteria in the total core microbiome are known to play important roles in soil N and carbon cycling [83,84,85], decomposition [84,85], disease suppression [86], and plant–microbe interactions [87]. However, it is important to note that the ecological roles of bacteria can vary depending on the species and environmental conditions, and further research is needed to fully understand their functions in humid tropical soil ecosystems, where taxonomic information is unavailable at the species level.
4.4. Bacterial Families by Land Use
Concurrent with the core microbiome results, Methyloligellaceae was most abundant in the agricultural plots. Additionally, the absence of Xanthomonadaceae, which can degrade aromatic compounds and pesticides, fix N, and have plant growth-promoting properties, such as the production of phytohormones and the ability to solubilize nutrients like P [88], are likely to negatively impact important functions in agricultural soils. Pseudomonadaceae also play important roles in soil as they can help plants tolerate biotic and abiotic stresses. Some species can fix N, solubilize P, degrade pesticides, and produce plant growth-promoting compounds, thus improving nutrient uptake and plant productivity [89]. Thus, instead of concluding a direct “loss” of function, our findings indicate that land-use intensification alters the balance of functionally relevant taxa, potentially shifting nutrient cycling and agrochemical degradation capacity. It should be noted that several unclassified/uncultured bacteria were differentially abundant among sub-watersheds; therefore, more work is needed to isolate and characterize these species among these unique humid tropical water-stressed sub-watersheds, as they may have undocumented novel soil functions.
4.5. Drivers of Soil Bacterial Community Richness and Diversity (i.e., α-Diversity) and Community Structure (i.e., β-Diversity)
Bacterial α-diversity differed between sub-watersheds (Table 3), and α-diversity significantly differed in the Tacarigua sub-watershed compared to the Arouca sub-watershed (Table 4). Additionally, the Shannon index differed significantly between Tacarigua and the Maracas sub-watersheds, indicating that these sub-watersheds had similar bacterial richness but different diversities. However, bacterial α-diversity was similar across land uses, showing that inherent soil properties rather than anthropogenic influence (i.e., land use) impacted bacterial species richness and diversity. Not surprisingly, refs. [22] and [90] reported similar results, where land use did not affect the α-diversity of soil bacteria in native forests vs. teak forests, and in native forests vs. grassland, respectively.
We observed similar results with respect to β-diversity, the diversity between ecosystems or habitats, with β-diversity being different between sub-watersheds, and only significantly different between forest and agriculture plots (Figure 5 and Figure 6, Table 7). Similar results were observed by [12] who found that land use had a weak but significant effect on the soil bacterial β-diversity in Malaysia. Although land use plays a significant role in shaping soil bacterial β-diversity through the release of various root exudates, altering soil pH, nutrient composition, nutrient availability, soil structure, soil moisture, and organic matter, our results indicate that the pattern in β-diversity is consistent with that of soil physicochemical properties which differed more among sub-watersheds than land uses, and which contrasted between forest and agriculture land uses (Table 1 and Table 2). Thus, our results support that soil physicochemical properties are the stronger determinant, consistent with findings from Malaysia [75] and other tropical studies. As more variation is observed among sub-watersheds than land uses, this strongly suggests that soil properties that differ significantly among land uses and sub-watersheds are major drivers of bacterial community spatial distribution (Figure 7).
4.6. Inherent Soil Properties, Land Use, and the Bacterial Community
Soil properties and landscape parameters explained 56% of the variation in the soil bacterial composition across samples and sub-watersheds. While axes 1 and 2 of the ordination (Figure 7) explained only ~23% of variation (18.6% + 4.3%), the higher explanatory power from environmental fitting reflects the multivariate influence of multiple soil factors on bacterial composition. This discrepancy should be emphasized since ordination axes visualize dominant gradients, but do not capture all ecological variance explained by predictor variables. This is a reasonable amount of variability explained when we consider that rDNA captures all sequences present in soil, in both wet and dry seasons. Samples were taken only during the dry season, e.g., nutrient availability changes with differences in rainfall and soil water contents, but information captured in rDNA will extend to the wet season too. Additionally, soil physico-chemical parameters co-change with season and land use, resulting in co-correlations (Figure S2) despite explaining different parts of the soil microbial community as described above.
In this study, pH, Mn, Fe, clay content, θh, and P separated soil bacterial communities from the three sub-watersheds. The explanatory soil properties separating bacterial communities are those which are most distinct within and between sub-watersheds (Table 1 and Table 2), reinforcing that location and edaphic context determine bacterial composition. Indeed, numerous studies have demonstrated the significance of physicochemical soil characteristics in determining the composition of microbial communities. Soil pH and clay content are generally acknowledged key drivers of soil bacterial communities, which also affect nutrient solubility and availability [39,91,92] similar to the results found in our study.
Other studies found CEC to be the major driver of rhizobacterial community composition in Trinidad savannas [73]. Soil pH affects the availability and solubility of nutrients, bacterial enzyme activity, element toxicity, and root exudates, with several studies having identified soil pH as a key driver of bacterial community composition [12,67,93]. Further, Brandt et al. [68] and Yokobe et al. [69] showed that mineral type was the main factor driving microbial community composition by influencing nutrient availability, regulating soil pH, and creating microhabitats. They also found that land use had a smaller effect on bacterial community composition than minerals (i.e., soil properties), similar to our results.
4.7. Evidence for a Space-for-Time Substitution Trajectory
Pairwise comparisons showed that β-diversity was significantly different among all sub-watersheds, and specifically between forest and agricultural land uses (Table 7). This pattern supports the chronosequence assumption that forest represents the least disturbed baseline and agriculture the most altered endpoint, with grassland and mixed-use plots occupying intermediate positions. The separation of Arouca (least disturbed), Maracas (intermediate), and Tacarigua (intensively managed) sub-watersheds along the main β-diversity axis (Figure 4) mirrors a trajectory of land-use intensification. Thus, although our study design was cross-sectional, the distinct clustering of communities across land uses and watersheds is consistent with directional changes expected under a SFT framework [30,94]. This strengthens our inference that soil bacterial communities are not only shaped by site-specific soil properties but also reflect cumulative anthropogenic pressures over time.
The SFT approach employed here rests on the assumption that the spatial sequence of land uses (forest → grassland → agriculture) within each watershed represents a valid chronosequence, approximating the temporal trajectory of microbial change following land conversion. Our study design strengthens this assumption by nesting land uses within watersheds, thereby controlling for underlying geology and climate; and focusing on a region with a well-documented history of sequential land-use change.
While a true temporal study would be ideal, the SFT approach provides a powerful and pragmatic alternative for inferring long-term trends in slow-responding systems such as soil microbiomes [95]. We acknowledge that unmeasured historical contingencies or site-specific factors could influence our results. However, the strong and consistent patterns observed across multiple sub-watersheds, particularly the directional shift in community composition from the most pristine (Arouca) to the most intensively managed (Tacarigua), support the interpretation that our spatial gradients reflect genuine successional dynamics driven by land-use intensification.
5. Conclusions
Our study demonstrates that in the humid tropical landscapes of Trinidad’s Northern Range, inherent soil properties and landscape features form the primary template upon which soil bacterial communities are structured, explaining the majority of the observed variation in both richness and composition. This foundational template is characterized by gradients in pH, texture, and nutrient availability, which vary significantly across watersheds. However, land-use intensification acts as a powerful secondary filter, modifying these inherent communities. By employing a space-for-time substitution approach, we infer a trajectory of change associated with agricultural intensification. This trajectory is marked not by a simple loss of diversity, but by a significant shift in community structure (β-diversity) and a change in the balance of functionally relevant taxa. The inferred shift is characterized by a decline in certain Proteobacterial groups associated with nutrient cycling and plant growth promotion (e.g., Xanthomonadaceae, Pseudomonadaceae) and an increase in stress-tolerant, sporulating taxa (e.g., Firmicutes), suggesting an adaptation to the altered conditions of managed ecosystems.
Our integrated methodology, combining geophysical (ECa-directed) sampling with high-resolution amplicon sequencing, proves to be a powerful tool for generating spatially explicit insights into soil microbiome drivers at a landscape scale. This approach is particularly valuable in heterogeneous tropical environments where long-term temporal monitoring is challenging. The broader implications of our findings suggest that conservation of natural watershed areas is crucial for preserving the diverse soil microbial communities that underpin tropical ecosystem resilience and function. For agricultural sustainability, management practices that mitigate soil disturbance and foster a more beneficial microbiome, should be explored.
Future research should focus on moving from correlation to causation by isolating and characterizing the uncultured taxa identified in this study and through long-term, temporal monitoring of microbial function in response to land-use management practices. This will be essential for validating the trajectories inferred here and for developing strategies to manage the tropical soil microbiome for ecosystem health.
Supplementary Materials
The following supporting information can be downloaded at: https://www.mdpi.com/article/10.3390/soilsystems9040112/s1, Figure S1: Rarefaction curve for all samples across watersheds; Figure S2: Bacterial differential abundance depicting differences in families between sub-watersheds. Families shown as grey are not present in the watershed; Table S1. Descriptors of sampled sites. (References [96,97,98,99,100,101,102,103,104,105,106,107,108,109,110,111,112,113,114,115,116,117,118,119] are cited in the supplementary materials).
Author Contributions
S.A.D.C.: Conceptualization, Data curation, Formal analysis, Investigation, Methodology, Software, Writing—original draft, Writing—review & editing, Validation, Visualization; S.R.: Writing—original draft, Writing—review & editing, Validation, Visualization; D.S.: Conceptualization, Writing—review & editing, C.S.M.: Conceptualization, Formal analysis, Investigation, Methodology, Software; M.N.W.: Conceptualization, Writing—review & editing,; B.J.Z.: Conceptualization, Writing—original draft, Writing—review & editing, Validation; F.K.: Writing—review & editing, Validation; M.L.: Formal analysis, Investigation, Methodology, Software; D.P.M.C.: Formal analysis, Investigation, Methodology, Software; S.G.S.: Conceptualization, Data curation, Formal analysis, Investigation, Methodology, Software, Writing—original draft, Writing—review & editing, Validation, Visualization; B.H.: Conceptualization, Data curation, Formal analysis, Investigation, Methodology, Software, Writing—original draft, Writing—review & editing, Validation, Visualization. All authors have read and agreed to the published version of the manuscript.
Funding
This research received no external funding.
Institutional Review Board Statement
Not applicable.
Informed Consent Statement
Not applicable.
Data Availability Statement
Data are available on request from the authors.
Conflicts of Interest
The authors declare no conflict of interest.
References
- Rodrigues, A.F.; Latawiec, A.E.; Reid, B.J.; Solórzano, A.; Schuler, A.E.; Lacerda, C.; Fidalgo, E.C.C.; Scarano, F.R.; Tubenchlak, F.; Pena, I.; et al. Systematic Review of Soil Ecosystem Services in Tropical Regions. R. Soc. Open Sci. 2021, 8, 201584. [Google Scholar] [CrossRef] [PubMed]
- Osborne, P.L. Tropical Ecosystems and Ecological Concepts; Cambridge University Press: Cambridge, UK, 2012; ISBN 9781139057868. [Google Scholar]
- Craswell, E.T.; Lefroy, R.D.B. The Role and Function of Organic Matter in Tropical Soils. Nutr. Cycl. Agroecosyst. 2001, 61, 7–18. [Google Scholar] [CrossRef]
- Camenzind, T.; Philipp Grenz, K.; Lehmann, J.; Rillig, M.C. Soil Fungal Mycelia Have Unexpectedly Flexible Stoichiometric C:N and C:P Ratios. Ecol. Lett. 2021, 24, 208–218. [Google Scholar] [CrossRef]
- Mori, H.; Maruyama, F.; Kato, H.; Toyoda, A.; Dozono, A.; Ohtsubo, Y.; Nagata, Y.; Fujiyama, A.; Tsuda, M.; Kurokawa, K. Design and Experimental Application of a Novel Non-Degenerate Universal Primer Set That Amplifies Prokaryotic 16S RRNA Genes with a Low Possibility to Amplify Eukaryotic RRNA Genes. DNA Res. 2014, 21, 217–227. [Google Scholar] [CrossRef]
- Guerra, C.A.; Heintz-Buschart, A.; Sikorski, J.; Chatzinotas, A.; Guerrero-Ramírez, N.; Cesarz, S.; Beaumelle, L.; Rillig, M.C.; Maestre, F.T.; Delgado-Baquerizo, M.; et al. Blind Spots in Global Soil Biodiversity and Ecosystem Function Research. Nat. Commun. 2020, 11, 3870. [Google Scholar] [CrossRef] [PubMed]
- Carrión, O.; Curson, A.R.J.; Kumaresan, D.; Fu, Y.; Lang, A.S.; Mercadé, E.; Todd, J.D. A Novel Pathway Producing Dimethylsulphide in Bacteria Is Widespread in Soil Environments. Nat. Commun. 2015, 6, 6579. [Google Scholar] [CrossRef] [PubMed]
- Gupta, V.V.S.R.; Germida, J.J. Soil Aggregation: Influence on Microbial Biomass and Implications for Biological Processes. Soil Biol. Biochem. 2015, 80, A3–A9. [Google Scholar] [CrossRef]
- Jiao, S.; Peng, Z.; Qi, J.; Gao, J.; Wei, G. Linking Bacterial-Fungal Relationships to Microbial Diversity and Soil Nutrient Cycling. mSystems 2021, 6, e01052-20. [Google Scholar] [CrossRef]
- Expósito, R.G.; de Bruijn, I.; Postma, J.; Raaijmakers, J.M. Current Insights into the Role of Rhizosphere Bacteria in Disease Suppressive Soils. Front. Microbiol. 2017, 8, 2529. [Google Scholar] [CrossRef]
- Delgado-Baquerizo, M.; Oliverio, A.M.; Brewer, T.E.; Benavent-González, A.; Eldridge, D.J.; Bardgett, R.D.; Maestre, F.T.; Singh, B.K.; Fierer, N. A Global Atlas of the Dominant Bacteria Found in Soil. Science 2018, 359, 320–325. [Google Scholar] [CrossRef]
- Tripathi, B.M.; Kim, M.; Singh, D.; Lee-Cruz, L.; Lai-Hoe, A.; Ainuddin, A.N.; Go, R.; Rahim, R.A.; Husni, M.H.A.; Chun, J.; et al. Tropical Soil Bacterial Communities in Malaysia: PH Dominates in the Equatorial Tropics Too. Microb. Ecol. 2012, 64, 474–484. [Google Scholar] [CrossRef]
- Evans, S.E.; Wallenstein, M.D. Climate Change Alters Ecological Strategies of Soil Bacteria. Ecol. Lett. 2014, 17, 155–164. [Google Scholar] [CrossRef] [PubMed]
- Chu, H.; Neufeld, J.D.; Walker, V.K.; Grogan, P. The Influence of Vegetation Type on the Dominant Soil Bacteria, Archaea, and Fungi in a Low Arctic Tundra Landscape. Soil Sci. Soc. Am. J. 2011, 75, 1756–1765. [Google Scholar] [CrossRef]
- Xiao, J.; Wu, H.; Xu, C.; Hu, Y.; Xu, Z.; Zhang, D.; Li, A.; Wei, X.; Ge, T.; Wei, G. The Distribution of Aerobic Bacteria in Chinese Cropland Is Linked to the Soil Texture. Front. Microbiol. 2025, 16, 1541460. [Google Scholar] [CrossRef]
- Sun, D.; Lin, Q.; Angst, G.; Huang, L.; Anikó, C.; Emsens, W.J.; van Diggelen, R.; Vicena, J.; Cajthaml, T.; Frouz, J. Microbial Communities in Soil Macro-Aggregates with Less Connected Networks Respire Less across Successional and Geographic Gradients. Eur. J. Soil Biol. 2022, 108, 103378. [Google Scholar] [CrossRef]
- Du, M.; Xue, P.; Minasny, B.; McBratney, A.; Tang, Y. Patterns, Processes, and Predictions: Soil Bacteria Unique Habitats Along a Megametre Transect in Eastern Australia. Soil Ecol. Lett. 2025, 7, 250313. [Google Scholar] [CrossRef]
- Xue, P.; Minasny, B.; Román Dobarco, M.; Wadoux, A.M.J.C.; Padarian Campusano, J.; Bissett, A.; de Caritat, P.; McBratney, A. The Biogeography of Soil Bacteria in Australia Exhibits Greater Resistance to Climate Change Than Fungi. Glob. Change Biol. 2025, 31, e70268. [Google Scholar] [CrossRef]
- De Carvalho, T.S.; Da Conceição Jesus, E.; Barlow, J.; Gardner, T.A.; Soares, I.C.; Tiedje, J.M.; De Souza Moreira, F.M. Land Use Intensifcation in the Humid Tropics Increased Both Alpha and Beta Diversity of Soil Bacteria. Ecology 2016, 97, 2760–2771. [Google Scholar] [CrossRef] [PubMed]
- Tomazelli, D.; Klauberg-Filho, O.; Mendes, L.W.; Goss-Souza, D. The Impact of Land-Use Changes and Management Intensification on Bacterial Communities in the Last Decade: A Review. Appl. Environ. Microbiol. 2024, 90, e00309-24. [Google Scholar] [CrossRef]
- de Gannes, V.; Eudoxie, G.; Bekele, I.; Hickey, W.J. Relations of Microbiome Characteristics to Edaphic Properties of Tropical Soils from Trinidad. Front. Microbiol. 2015, 6, 146237. [Google Scholar] [CrossRef] [PubMed]
- De Gannes, V.; Bekele, I.; Dipchansingh, D.; Wuddivira, M.N.; De Cairies, S.; Boman, M.; Hickey, W.J. Microbial Community Structure and Function of Soil Following Ecosystem Conversion from Native Forests to Teak Plantation Forests. Front. Microbiol. 2016, 7, 224226. [Google Scholar] [CrossRef]
- Del Mar Gamboa, M.; Rodríguez, E.; Vargas, P. Diversity of Mesophilic Clostridia in Costa Rican Soils. Anaerobe 2005, 11, 322–326. [Google Scholar] [CrossRef]
- Lewis, D.E.; Chauhan, A.; White, J.R.; Overholt, W.; Green, S.J.; Jasrotia, P.; Wafula, D.; Jagoe, C. Microbial and Geochemical Assessment of Bauxitic Un-Mined and Post-Mined Chronosequence Soils from Mocho Mountains, Jamaica. Microb. Ecol. 2012, 64, 738–749. [Google Scholar] [CrossRef] [PubMed]
- Pittl, E.; Innerebner, G.; Wanek, W.; Insam, H. Microbial Communities of Arboreal and Ground Soils in the Esquinas Rainforest, Costa Rica. Plant Soil 2010, 329, 65–74. [Google Scholar] [CrossRef]
- Hardy, F. Soil Classification in the Caribbean Region (A Review). In Technical Communication of the Commonwealth Bureau of Soil Science; No.46; Commonwealth Agricultural Bureau: Buckinghamshire, UK, 1949. [Google Scholar]
- Northern Range Assessment. In Report of an Assessment of the Northern Range, Trinidad and Tobago: People and the Northern Range; State of the Environment Report; Intergovernmental Platform on Biodiversity and Ecosystem Services: Bonn, Germany, 2005.
- Wuddivira, M.N.; Stone, R.J.; Ekwue, E.I. Clay, Organic Matter, and Wetting Effects on Splash Detachment and Aggregate Breakdown under Intense Rainfall. Soil Sci. Soc. Am. J. 2009, 73, 226–232. [Google Scholar] [CrossRef]
- Jenny, H. (Ed.) Factors of Soil Formation, a System of Quantitative Pedology; McGraw-Hill Book Company: New York, NY, USA, 1941. [Google Scholar]
- Pickett, S.T.A. Space-for-Time Substitution as an Alternative to Long-Term Studies. In Long-Term Studies in Ecology; Springer Nature: Berlin/Heidelberg, Germany, 1989; pp. 110–135. [Google Scholar] [CrossRef]
- Ditzler, C. Revision of the Classification of the Soils of Trinidad and Tobago; 2017; Available online: https://sta.uwi.edu/ffa/sites/default/files/ffa/USDA%20soil%20Taxonomy%20Upgrade-Trinidad%20and%20Tobago.pdf (accessed on 15 June 2025).
- De Caires, S.A.; St. Martin, C.; Wuddivira, M.N.; Farrick, K.K.; Zebarth, B.J. Predicting Soil Depth in a Humid Tropical Watershed: A Comparative Analysis of Best-Fit Regression and Geospatial Models. Catena 2023, 222, 106843. [Google Scholar] [CrossRef]
- Walker, L.R.; Wardle, D.A.; Bardgett, R.D.; Clarkson, B.D. The Use of Chronosequences in Studies of Ecological Succession and Soil Development. J. Ecol. 2010, 98, 725–736. [Google Scholar] [CrossRef]
- De Caires, S.A.; Wuddivira, M.N.; St Martin, C.; Roopnarine, R.; Gordon, A.; Zebarth, B.J. Multivariate Geospatial Analysis for Predicting Soil Variability along a Toposequence of a Watershed in the Humid Tropics. Catena 2022, 210, 105919. [Google Scholar] [CrossRef]
- Lesch, S.M.; Strauss, D.J.; Rhoades, J.D. Spatial Prediction of Soil Salinity Using Electromagnetic Induction Techniques: 1. Statistical Prediction Models: A Comparison of Multiple Linear Regression and Cokriging. Water Resour. Res. 1995, 31, 373–386. [Google Scholar] [CrossRef]
- De Caires, S.A.; Wuddivira, M.N.; Bramble, D.S.E.; Atwell, M.; Roopnarine, R.; Farrick, K.K. Soil Sampling Strategies for the Characterization of Spatial Variability Under Two Distinct Land Uses. Commun. Soil Sci. Plant Anal. 2021, 52, 2217–2240. [Google Scholar] [CrossRef]
- De Caires, S.A.; Wuddivira, M.N.; Bekele, I. Spatial Analysis for Management Zone Delineation in a Humid Tropic Cocoa Plantation. Precis. Agric. 2015, 16, 129–147. [Google Scholar] [CrossRef]
- Gee, G.W.; Or, D. 2.4 Particle-Size Analysis. In Methods of Soil Analysis, Part 4: Physical Methods; Dane, J.H., Topp, C.G., Eds.; John Wiley & Sons, Ltd.: Hoboken, NJ, USA, 2018; pp. 255–293. ISBN 9780891188933. [Google Scholar]
- Wuddivira, M.N.; Robinson, D.A.; Lebron, I.; Bréchet, L.; Atwell, M.; De Caires, S.; Oatham, M.; Jones, S.B.; Abdu, H.; Verma, A.K.; et al. Estimation of Soil Clay Content from Hygroscopic Water Content Measurements. Soil Sci. Soc. Am. J. 2012, 76, 1529–1535. [Google Scholar] [CrossRef]
- Mclean, E.O. Soil PH and Lime Requirement. In Methods of Soil Analysis: Part 2 Chemical and Microbiological Properties, 9.2.2, 2nd ed.; Page, A.L., Ed.; John Wiley & Sons, Ltd.: Hoboken, NJ, USA, 1982; pp. 199–224. [Google Scholar]
- Jackson, M.L. Soil Chemical Analysis; Prentice Hall Inc.: Englewood Chiffs, NJ, USA, 1958. [Google Scholar]
- Thomas Sims, J. Lime Requirement. In Methods of Soil Analysis, Part 3: Chemical Methods; Sparks, D.L., Page, A.L., Helmke, P.A., Loeppert, R.H., Soltanpour, P.N., Tabatabai, M.A., Johnston, C.T., Sumner, M.E., Eds.; Soil Science Society of America, Inc.: Madison, WI, USA; American Society of Agronomy, Inc.: Madison, WI, USA, 2018; pp. 491–515. ISBN 9780891188667. [Google Scholar]
- Amedee, G.; Peech, M. The Significance of KCl-Extractable Al (III) as an Index to Lime Requirement of Soils of the Humid Tropics. Soil Sci. 1976, 121, 227–233. [Google Scholar] [CrossRef]
- Storer, D.A. A Simple High Sample Volume Ashing Procedure for Determination of Soil Organic Matter. Commun. Soil Sci. Plant Anal. 1984, 15, 759–772. [Google Scholar] [CrossRef]
- Rohman, P.C.; Cox, F.R. Evaluation of the Modified Olsen Extracting Reagent for Copper, Zinc and Manganese. Commun. Soil Sci. Plant Anal. 1988, 19, 1859–1870. [Google Scholar] [CrossRef]
- Isaac, R.A.; Kerber, J.D. Atomic Absorption and Flame Photometry: Techniques and Uses in Soil, Plant, and Water Analysis. In Instrumental Methods for Analysis of Soils and Plant Tissue; Walsh, L.M., Ed.; John Wiley & Sons, Ltd.: Hoboken, NJ, USA, 2015; pp. 17–37. ISBN 9780891188766. [Google Scholar]
- Sarkar, D.; Sheikh, A.A.; Batabyal, K.; Mandal, B. Boron Estimation in Soil, Plant, and Water Samples Using Spectrophotometric Methods. Commun. Soil Sci. Plant Anal. 2014, 45, 1538–1550. [Google Scholar] [CrossRef]
- Fox, R.L.; Olson, R.A.; Rhoades, H.F. Evaluating the Sulfur Status of Soils by Plant and Soil Tests. Soil Sci. Soc. Am. J. 1964, 28, 243–246. [Google Scholar] [CrossRef]
- Mulvaney, R.L. Nitrogen—Inorganic Forms. In Methods of Soil Analysis, Part 3: Chemical Methods; Sparks, D.L., Page, A.L., Helmke, P.A., Loeppert, R.H., Soltanpour, P.N., Tabatabai, M.A., Johnston, C.T., Sumner, M.E., Eds.; John Wiley & Sons, Ltd.: Hoboken, NJ, USA, 2018; pp. 1123–1184. ISBN 9780891188667. [Google Scholar]
- Coleman, N.T.; Weed, S.B.; McCracken, R.J. Cation-Exchange Capacity and Exchangeable Cations in Piedmont Soils of North Carolina. Soil Sci. Soc. Am. J. 1959, 23, 146–149. [Google Scholar] [CrossRef]
- Frothingham, K.M.; Rhoads, B.L. Three-Dimensional Flow Structure and Channel Change in an Asymmetrical Compound Meander Loop, Embarras River, Illinois. Earth Surf. Process Landf. 2003, 28, 625–644. [Google Scholar] [CrossRef]
- Martin, M. Cutadapt Removes Adapter Sequences from High-Throughput Sequencing Reads. EMBnet J. 2011, 17, 10–12. [Google Scholar] [CrossRef]
- Bolyen, E.; Rideout, J.R.; Dillon, M.R.; Bokulich, N.A.; Abnet, C.C.; Al-Ghalith, G.A.; Alexander, H.; Alm, E.J.; Arumugam, M.; Asnicar, F.; et al. Reproducible, Interactive, Scalable and Extensible Microbiome Data Science Using QIIME 2. Nat. Biotechnol. 2019, 37, 852–857. [Google Scholar] [CrossRef] [PubMed]
- Bokulich, N.A.; Kaehler, B.D.; Rideout, J.R.; Dillon, M.; Bolyen, E.; Knight, R.; Huttley, G.A.; Gregory Caporaso, J. Optimizing Taxonomic Classification of Marker-Gene Amplicon Sequences with QIIME 2′s Q2-Feature-Classifier Plugin. Microbiome 2018, 6, 90. [Google Scholar] [CrossRef]
- Robeson, M.S.; O’Rourke, D.R.; Kaehler, B.D.; Ziemski, M.; Dillon, M.R.; Foster, J.T.; Bokulich, N.A. RESCRIPt: Reproducible Sequence Taxonomy Reference Database Management. PLoS Comput. Biol. 2021, 17, e1009581. [Google Scholar] [CrossRef]
- R Core Team R: A Language and Environment for Statistical Computing; Version 4.3.3, R Foundation for Statistical Computing: Vienna, Austria, 2023. Available online: https://www.r-project.org/ (accessed on 15 June 2025).
- RStudio Integrated Development Environment (IDE) Version 2024.12.1+56. Available online: https://posit.co/download/rstudio-desktop/ (accessed on 15 June 2025).
- McMurdie, P.J.; Holmes, S. Phyloseq: An R Package for Reproducible Interactive Analysis and Graphics of Microbiome Census Data. PLoS ONE 2013, 8, e61217. [Google Scholar] [CrossRef] [PubMed]
- Lin, H.; Peddada, S. Das Analysis of Compositions of Microbiomes with Bias Correction. Nat. Commun. 2020, 11, 3514. [Google Scholar] [CrossRef]
- Wickham, H. Data Analysis. In ggplot2 Elegant Graphics for Data Analysis; Springer: Cham, Switzerland, 2016; pp. 189–201. ISBN 978-3-319-24277-4. [Google Scholar]
- Gloor, G.B.; Wu, J.R.; Pawlowsky-Glahn, V.; Egozcue, J.J. It’s All Relative: Analyzing Microbiome Data as Compositions. Ann. Epidemiol. 2016, 26, 322–329. [Google Scholar] [CrossRef]
- Liu, H.; Han, H.; Zhang, C.; Yu, X.; Nie, W.; Shao, Q.; Yang, P.; Li, X.; Yang, Y.; Cao, H. Patterns of Bacterial Distance Decay and Community Assembly in Different Land-Use Types as Influenced by Tillage Management and Soil Layers. Ecotoxicol. Environ. Saf. 2023, 266, 115595. [Google Scholar] [CrossRef]
- Oksanen, J.; Simpson, G.L.; Blanchet, F.G.; Kindt, R.; Legendre, P.; Minchin, P.R.; O’Hara, R.B.; Solymos, P.; Stevens, M.H.H.; Szoecs, E.; et al. Vegan: Community Ecology Package, R Package Version 2.6-4; CRAN: Contributed Packages; CRAN: Vienna, Australia, 2025. [Google Scholar]
- Iturbe-Espinoza, P.; Brandt, B.W.; Braster, M.; Bonte, M.; Brown, D.M.; van Spanning, R.J.M. Effects of DNA Preservation Solution and DNA Extraction Methods on Microbial Community Profiling of Soil. Folia Microbiol. 2021, 66, 597–606. [Google Scholar] [CrossRef]
- Portch, S.; Hunter, A.H. A Systematic Approach to Soil Fertility Evaluation and Improvement (PPI/PPIC China Program Special Publication No. 5), Modern Agriculture and Fertilizers; Canpotex Limited: Hong Kong, China, 2002. [Google Scholar]
- Tian, Q.; Taniguchi, T.; Shi, W.Y.; Li, G.; Yamanaka, N.; Du, S. Land-Use Types and Soil Chemical Properties Influence Soil Microbial Communities in the Semiarid Loess Plateau Region in China. Sci. Rep. 2017, 7, 45289. [Google Scholar] [CrossRef] [PubMed]
- Barnett, S.E.; Youngblut, N.D.; Buckley, D.H. Soil Characteristics and Land-Use Drive Bacterial Community Assembly Patterns. FEMS Microbiol. Ecol. 2020, 96, 194. [Google Scholar] [CrossRef]
- Brandt, L.; Stache, F.; Poll, C.; Bramble, D.S.; Schöning, I.; Schrumpf, M.; Ulrich, S.; Kaiser, K.; Mikutta, R.; Mikutta, C.; et al. Mineral Type and Land-Use Intensity Control Composition and Functions of Microorganisms Colonizing Pristine Minerals in Grassland Soils. Soil Biol. Biochem. 2023, 182, 109037. [Google Scholar] [CrossRef]
- Yokobe, T.; Hyodo, F.; Tateno, R.; Tokuchi, N. Soil Mineral Fraction Influences the Bacterial Abundance: Evidence from a Mineral and Plant Materials Incubation Study. Biogeochemistry 2022, 161, 273–287. [Google Scholar] [CrossRef]
- Wuddivira, M.N.; Ekwue, E.I.; Stone, R.J. Modelling Slaking Sensitivity to Assess the Degradation Potential of Humid Tropic Soils under Intense Rainfall. Land. Degrad. Dev. 2010, 21, 48–57. [Google Scholar] [CrossRef]
- Dully, V.; Rech, G.; Wilding, T.A.; Lanzén, A.; MacKichan, K.; Berrill, I.; Stoeck, T. Comparing Sediment Preservation Methods for Genomic Biomonitoring of Coastal Marine Ecosystems. Mar. Pollut. Bull. 2021, 173, 113129. [Google Scholar] [CrossRef]
- Liu, J.; Cui, X.; Liu, Z.; Guo, Z.; Yu, Z.; Yao, Q.; Sui, Y.; Jin, J.; Liu, X.; Wang, G. The Diversity and Geographic Distribution of Cultivable Bacillus-like Bacteria across Black Soils of Northeast China. Front. Microbiol. 2019, 10, 459320. [Google Scholar] [CrossRef]
- Thomas-Barry, G.; St. Martin, C.C.G.; Lynch, M.D.J.; Ramsubhag, A.; Rouse-Miller, J.; Charles, T.C. Driving Factors Influencing the Rhizobacteriome Community Structure of Plants Adapted to Multiple Climatic Stressors in Edaphic Savannas. Sci. Total Environ. 2021, 769, 145214. [Google Scholar] [CrossRef] [PubMed]
- Ren, M.; Zhang, Z.; Wang, X.; Zhou, Z.; Chen, D.; Zeng, H.; Zhao, S.; Chen, L.; Hu, Y.; Zhang, C.; et al. Diversity and Contributions to Nitrogen Cycling and Carbon Fixation of Soil Salinity Shaped Microbial Communities in Tarim Basin. Front. Microbiol. 2018, 9, 317810. [Google Scholar] [CrossRef] [PubMed]
- Lee, S.M.; Kong, H.G.; Song, G.C.; Ryu, C.M. Disruption of Firmicutes and Actinobacteria Abundance in Tomato Rhizosphere Causes the Incidence of Bacterial Wilt Disease. ISME J. 2020, 15, 330–347. [Google Scholar] [CrossRef]
- Hashmi, I.; Bindschedler, S.; Junier, P. Firmicutes. In Beneficial Microbes in Agro-Ecology; Amaresan, N., Annapurna, K., Sankaranarayanan, A., Kumar, M.S., Kumar, K., Eds.; Academic Press: Cambridge, MA, USA, 2020; pp. 363–396. ISBN 978-0-12-823414-3. [Google Scholar]
- Liu, X.; Huang, Z.; Havrilla, C.A.; Liu, Y.; Wu, G.L. Plant Litter Crust Role in Nutrients Cycling Potentials by Bacterial Communities in a Sandy Land Ecosystem. Land. Degrad. Dev. 2021, 32, 3194–3203. [Google Scholar] [CrossRef]
- Kravchenko, A.N.; Negassa, W.C.; Guber, A.K.; Hildebrandt, B.; Marsh, T.L.; Rivers, M.L. Intra-Aggregate Pore Structure Influences Phylogenetic Composition of Bacterial Community in Macroaggregates. Soil Sci. Soc. Am. J. 2014, 78, 1924–1939. [Google Scholar] [CrossRef]
- McEldowney, S.; Fletcher, M. The Effect of Temperature and Relative Humidity on the Survival of Bacteria Attached to Dry Solid Surfaces. Lett. Appl. Microbiol. 1988, 7, 83–86. [Google Scholar] [CrossRef]
- Setlow, P.; Johnson, E.A. Spores and Their Significance. In Food Microbiology: Fundamentals and Frontiers; Doyle, M.P., Diez-Gonzalez, F., Hill, C., Eds.; John Wiley & Sons, Ltd.: Hoboken, NJ, USA, 2019; pp. 23–63. ISBN 9781683670476. [Google Scholar]
- Chen, M.; Alexander, M. Survival of Soil Bacteria during Prolonged Desiccation. Soil Biol. Biochem. 1973, 5, 213–221. [Google Scholar] [CrossRef]
- Navarro Llorens, J.M.; Tormo, A.; Martínez-García, E. Stationary Phase in Gram-Negative Bacteria. FEMS Microbiol. Rev. 2010, 34, 476–495. [Google Scholar] [CrossRef]
- Kappler, U.; Davenport, K.; Beatson, S.; Lucas, S.; Lapidus, A.; Copeland, A.; Berry, K.W.; Del Rio, T.G.; Hammon, N.; Dalin, E.; et al. Complete Genome Sequence of the Facultatively Chemolithoautotrophic and Methylotrophic Alpha Proteobacterium Starkeya Novella Type Strain (ATCC 8093T). Stand. Genom. Sci. 2012, 7, 44–58. [Google Scholar] [CrossRef] [PubMed]
- Li, J.; Li, F.; Yu, S.; Qin, S.; Wang, G. Impacts of Mariculture on the Diversity of Bacterial Communities Within Intertidal Sediments in the Northeast of China. Microb. Ecol. 2013, 66, 861–870. [Google Scholar] [CrossRef]
- Sangwan, P.; Chen, X.; Hugenholtz, P.; Janssen, P.H. Chthoniobacter flavus Gen. Nov., Sp. Nov., the First Pure-Culture Representative of Subdivision Two, Spartobacteria Classis Nov., of the Phylum Verrucomicrobia. Appl. Environ. Microbiol. 2004, 70, 5875–5881. [Google Scholar] [CrossRef] [PubMed]
- Rossmann, B.; Müller, H.; Smalla, K.; Mpiira, S.; Tumuhairwe, J.B.; Staver, C.; Berg, G. Banana-Associated Microbial Communities in Uganda Are Highly Diverse but Dominated by Enterobacteriaceae. Appl. Environ. Microbiol. 2012, 78, 4933–4941. [Google Scholar] [CrossRef] [PubMed]
- Kämpfer, P.; Ruppel, S.; Remus, R. Enterobacter radicincitans Sp. Nov., a Plant Growth Promoting Species of the Family Enterobacteriaceae. Syst. Appl. Microbiol. 2005, 28, 213–221. [Google Scholar] [CrossRef]
- Ryan, R.P.; Monchy, S.; Cardinale, M.; Taghavi, S.; Crossman, L.; Avison, M.B.; Berg, G.; van der Lelie, D.; Dow, J.M. The Versatility and Adaptation of Bacteria from the Genus Stenotrophomonas. Nat. Rev. Microbiol. 2009, 7, 514–525. [Google Scholar] [CrossRef]
- Roquigny, R.; Novinscak, A.; Biessy, A.; Filion, M. Pseudomonadaceae: From Biocontrol to Plant Growth Promotion. In Rhizotrophs: Plant Growth Promotion to Bioremediation; Springer: Singapore, 2017; Volume 2, pp. 39–68. ISBN 978-981-10-4862-3. [Google Scholar]
- Suleiman, A.K.A.; Manoeli, L.; Boldo, J.T.; Pereira, M.G.; Roesch, L.F.W. Shifts in Soil Bacterial Community after Eight Years of Land-Use Change. Syst. Appl. Microbiol. 2013, 36, 137–144. [Google Scholar] [CrossRef]
- Lindsay, W.L.; Schwab, A.P. The Chemistry of Iron in Soils and Its Availability to Plants. J. Plant Nutr. 1982, 5, 821–840. [Google Scholar] [CrossRef]
- Galantini, J.A.; Senesi, N.; Brunetti, G.; Rosell, R. Influence of Texture on Organic Matter Distribution and Quality and Nitrogen and Sulphur Status in Semiarid Pampean Grassland Soils of Argentina. Geoderma 2004, 123, 143–152. [Google Scholar] [CrossRef]
- Cheng, J.; Zhao, M.; Cong, J.; Qi, Q.; Xiao, Y.; Cong, W.; Deng, Y.; Zhou, J.; Zhang, Y. Soil PH Exerts Stronger Impacts than Vegetation Type and Plant Diversity on Soil Bacterial Community Composition in Subtropical Broad-Leaved Forests. Plant Soil 2020, 450, 273–286. [Google Scholar] [CrossRef]
- Johnson, E.A.; Miyanishi, K. Testing the Assumptions of Chronosequences in Succession. Ecol. Lett. 2008, 11, 419–431. [Google Scholar] [CrossRef]
- Fukami, T.; Wardle, D.A. Long-Term Ecological Dynamics: Reciprocal Insights from Natural and Anthropogenic Gradients. Proc. R. Soc. B Biol. Sci. 2005, 272, 2105–2115. [Google Scholar] [CrossRef] [PubMed]
- Zhang, B.; Fan, R.; Bai, Z.; Wang, S.; Wang, L.; Shi, J. Biosorption Characteristics of Bacillus gibsonii S-2 Waste Biomass for Removal of Lead (II) from Aqueous Solution. Environ. Sci. Pollut. Res. 2013, 20, 1367–1373. [Google Scholar] [CrossRef]
- Batool, R.; ur Rehman, S.; Rafique, M.; Ali, J.; Mukhtar, T.; Mahmood, S.; Sultan, T.; Hussain Munis, F.; Javed Chaudhary, H. Biocontrol Potential of Bacillus gibsonii and Brevibacterium frigoritolerans in Suppression of Fusarium Stalk Rot of Maize: A Sustainable Approach. Asian J. Agric. Biol. 2019, 7, 320–333. [Google Scholar]
- Bello-Morales, R.; Andreu, S.; Ruiz-Carpio, V.; Ripa, I.; López-Guerrero, J.A. Extracellular Polymeric Substances: Still Promising Antivirals. Viruses 2022, 14, 1337. [Google Scholar] [CrossRef]
- Shao, T.; Gu, X.; Zhu, T.; Pan, X.; Zhu, Y.; Long, X.; Shao, H.; Liu, M.; Rengel, Z. Industrial Crop Jerusalem artichoke Restored Coastal Saline Soil Quality by Reducing Salt and Increasing Diversity of Bacterial Community. Appl. Soil Ecol. 2019, 138, 195–206. [Google Scholar] [CrossRef]
- Grady, E.N.; MacDonald, J.; Liu, L.; Richman, A.; Yuan, Z.C. Current Knowledge and Perspectives of Paenibacillus: A Review. Microb. Cell Fact. 2016, 15, 203. [Google Scholar] [CrossRef]
- Slobodkin, A. The Family Peptostreptococcaceae. In The Prokaryotes: Firmicutes and Tenericutes; Rosenberg, E., DeLong, E.F., Lory, S., Stackebrandt, E., Thompson, F., Eds.; Springer: Berlin/Heidelberg, Germany, 2014; pp. 291–302. ISBN 978-3-642-30120-9. [Google Scholar]
- Oren, A. The Family Xanthobacteraceae. In The Prokaryotes: Alphaproteobacteria and Betaproteobacteria; Rosenberg, E., DeLong, E.F., Lory, S., Stackebrandt, E., Thompson, F., Eds.; Springer: Berlin/Heidelberg, Germany, 2014; Volume 9783642301971, pp. 709–726. ISBN 978-3-642-30197-1. [Google Scholar]
- Barea, J.M.; Toro, M.; Orozco, M.O.; Campos, E.; Azcón, R. The Application of Isotopic (32P and 15N) Dilution Techniques to Evaluate the Interactive Effect of Phosphate-Solubilizing Rhizobacteria, Mycorrhizal Fungi and Rhizobium to Improve the Agronomic Efficiency of Rock Phosphate for Legume Crops. Nutr. Cycl. Agroecosystems 2002, 63, 35–42. [Google Scholar] [CrossRef]
- Hyde, E.R.; Haarmann, D.P.; Petrosino, J.F.; Lynne, A.M.; Bucheli, S.R. Initial Insights into Bacterial Succession during Human Decomposition. Int. J. Leg. Med. 2015, 129, 661–671. [Google Scholar] [CrossRef] [PubMed]
- Neu, A.T.; Allen, E.E.; Roy, K. Defining and Quantifying the Core Microbiome: Challenges and Prospects. Proc. Natl. Acad. Sci. USA 2021, 118, e2104429118. [Google Scholar] [CrossRef] [PubMed]
- Ghashghavi, M.; Hester, E.R.; Oliver, V.; Lüke, C.; Jetten, M.S.M.; Lücker, S. Comparison of the Bacterial and Methanotrophic Diversities between an Italian Paddy Field and Its Neighboring Meadow. bioRxiv 2019, 535229. [Google Scholar] [CrossRef]
- Zhou, J.; Huang, Y.; Mo, M. Phylogenetic Analysis on the Soil Bacteria Distributed in Karst Forest. Braz. J. Microbiol. 2009, 40, 827–837. [Google Scholar] [CrossRef] [PubMed][Green Version]
- Dedysh, S.N. Bryobacteraceae. In Bergey’s Manual of Systematics of Archaea and Bacteria; John Wiley & Sons, Inc.: Hoboken, NJ, USA, 2019; pp. 1–4. [Google Scholar] [CrossRef]
- Goswami, A.; Adkins-Jablonsky, S.J.; Barreto Filho, M.M.; Shilling, M.D.; Dawson, A.; Heiser, S.; O’Connor, A.; Walker, M.; Roberts, Q.; Morris, J.J. Heavy Metal Pollution Impacts Soil Bacterial Community Structure and Antimicrobial Resistance at the Birmingham 35th Avenue Superfund Site. Microbiol. Spectr. 2023, 11, e02426-22. [Google Scholar] [CrossRef]
- Asaf, S.; Numan, M.; Khan, A.L.; Al-Harrasi, A. Sphingomonas: From Diversity and Genomics to Functional Role in Environmental Remediation and Plant Growth. Crit. Rev. Biotechnol. 2020, 40, 138–152. [Google Scholar] [CrossRef]
- Tao, J.; Wang, J.; Zheng, X.; Jia, A.; Zou, M.; Zhang, J.; Tao, X. Effects of Tetracycline and Copper on Water Spinach Growth and Soil Bacterial Community. Processes 2022, 10, 1135. [Google Scholar] [CrossRef]
- Jiang, Z.M.; Mou, T.; Sun, Y.; Su, J.; Yu, L.Y.; Zhang, Y.Q. Environmental Distribution and Genomic Characteristics of Solirubrobacter, with Proposal of Two Novel Species. Front. Microbiol. 2023, 14, 1267771. [Google Scholar] [CrossRef]
- Górska, E.B.; Stępien, W.; Cunha, A.; Sierra-Garcia, I.N.; Szyszkowska, K.; Gozdowski, D.; Gworek, B.; Sas-Paszt, L.; Lisek, A.; Hewelke, E.; et al. Microbial Diversity as an Indicator of a Diversified Cropping System for Luvisoils in a Moderate Climate. Case Study—Long Term Experiments from Poland. Ecol. Indic. 2022, 141, 109133. [Google Scholar] [CrossRef]
- Pacwa-Płociniczak, M.; Biniecka, P.; Bondarczuk, K.; Piotrowska-Seget, Z. Metagenomic Functional Profiling Reveals Differences in Bacterial Composition and Function During Bioaugmentation of Aged Petroleum-Contaminated Soil. Front. Microbiol. 2020, 11, 559027. [Google Scholar] [CrossRef]
- Proença, D.N.; Whitman, W.B.; Varghese, N.; Shapiro, N.; Woyke, T.; Kyrpides, N.C.; Morais, P.V. Arboriscoccus pini gen. nov., sp. nov., an Endophyte from a Pine Tree of the Class Alphaproteobacteria, Emended Description of Geminicoccus roseus, and Proposal of Geminicoccaceae fam. nov. Syst. Appl. Microbiol. 2018, 41, 94–100. [Google Scholar] [CrossRef] [PubMed]
- Campos, M.A.; Zhang, Q.; Acuña, J.J.; Rilling, J.I.; Ruiz, T.; Carrazana, E.; Reyno, C.; Hollenback, A.; Gray, K.; Jaisi, D.P.; et al. Structure and Functional Properties of Bacterial Communities in Surface Sediments of the Recently Declared Nutrient-Saturated Lake Villarrica in Southern Chile. Microb. Ecol. 2023, 86, 1513–1533. [Google Scholar] [CrossRef] [PubMed]
- Zhong, C.; Fu, J.; Jiang, T.; Zhang, C.; Cao, G. Polyphosphate Metabolic Gene Expression Analyses Reveal Mechanisms of Phosphorus Accumulation and Release in Microlunatus phosphovorus Strain JN459. FEMS Microbiol. Lett. 2018, 365, fny034. [Google Scholar] [CrossRef] [PubMed]
- Miksch, S.; Meiners, M.; Meyerdierks, A.; Probandt, D.; Wegener, G.; Titschack, J.; Jensen, M.A.; Ellrott, A.; Amann, R.; Knittel, K. Bacterial Communities in Temperate and Polar Coastal Sands Are Seasonally Stable. ISME Commun. 2021, 1, 29. [Google Scholar] [CrossRef]
- Huber, K.J.; Overmann, J. Vicinamibacteraceae fam. nov., the First Described Family within the Subdivision 6 Acidobacteria. Int. J. Syst. Evol. Microbiol. 2018, 68, 2331–2334. [Google Scholar] [CrossRef]
Disclaimer/Publisher’s Note: The statements, opinions and data contained in all publications are solely those of the individual author(s) and contributor(s) and not of MDPI and/or the editor(s). MDPI and/or the editor(s) disclaim responsibility for any injury to people or property resulting from any ideas, methods, instructions or products referred to in the content. |
© 2025 by the authors. Licensee MDPI, Basel, Switzerland. This article is an open access article distributed under the terms and conditions of the Creative Commons Attribution (CC BY) license (https://creativecommons.org/licenses/by/4.0/).