Article

Microplastic Transport by Overland Flow: Effects of Soil Texture and Slope Gradient Under Simulated Semi-Arid Conditions

Instituto de Investigaciones Agropecuarias, INIA La Platina, Santiago 8831314, Chile
Soil Syst. 2025, 9(2), 40; https://doi.org/10.3390/soilsystems9020040
Submission received: 25 February 2025 / Revised: 21 April 2025 / Accepted: 28 April 2025 / Published: 29 April 2025

Abstract

:
Microplastic pollution in soils and surface waters is a growing environmental concern, yet the mechanisms governing transport by overland flow remain unclear. This study investigated the influence of soil texture and slope gradient on the movement of microplastics with different shapes and polymer compositions under simulated rainfall and typical agricultural conditions in a semi-arid climate. Small soil flumes were subjected to controlled rainfall simulations replicating typical rain patterns, and microplastic transport was quantified using collection flasks. The results indicated that neither soil texture nor slope gradient significantly affected total microplastic transport. However, fibres exhibited greater retention in the soil compared to other shapes. Polymer composition did not play a major role in microplastic mobility, except for polystyrene pellets, which were transported more readily than polyethylene pellets. Field observations of agricultural soils with a history of sludge application confirmed a predominance of fibres in the topsoil, reinforcing the tendency of this shape to resist mobilisation. These findings suggest that microplastic transport by surface runoff is primarily governed by particle shape and buoyancy rather than soil properties or slope inclination. Future research should explore the roles of particle size, rainfall intensity, and organic matter content in microplastic mobility under natural field conditions.

1. Introduction

Microplastics have a detrimental impact on the environment, ultimately threatening sustainable development and human health [1]. They alter soil physical and chemical properties [2] and might adsorb heavy metals and persistent organic pollutants, increasing toxicity and potential for bioaccumulation [3]. Microplastics also contaminate water, compromising water security [4], and pollute the food chain, posing ingestion risks for both animals and humans [5]. These plastic particles, measuring less than 5 mm in size, cycle through the environment, transported by water and wind [6]. Water is the predominant transport agent, moving microplastics from inland sources to marine ecosystems [7]. In addition to the microplastics already present in water, new particles are continuously introduced as plastic production increases each year, exacerbating the overall plastic burden in the environment [8].
The increasing pollution of water by microplastics occurs through different pathways, including urban runoff, agricultural irrigation, surface water flow, infiltration and aquifer contamination, and inadequate water treatment, among other routes connecting inland waters to the seas and vice versa [9]. Along these pathways, water picks up microplastics lying on or buried in soils [10]. Among different land uses, urban and agricultural soils are the most contaminated by microplastics, highlighting human intervention as the primary driver of soil pollution, which ultimately leads to water pollution through microplastic transport by excess water [11]. Microplastics enter the soil directly through agricultural activities involving plastic products and consumables, such as plastic mulches [12], and indirectly through soil amendments with high microplastic loads, such as certain composts, manure, or sludge [13].
Within the broader context of microplastic pollution and its exchange through the environment and ecosystems, the study of microplastic transport processes in soils via excess water has been a major scientific focus [14]. These studies address the questions of how and to what extent microplastics move from land to sea at regional [15] and field scales [16], examining transport at the soil surface by runoff water as well as vertical movement from the topsoil to subsurface horizons [17]. In this context, vertical microplastic transport has primarily been studied in laboratory settings using leaching columns filled with sand, glass beads, or coarse-textured soils. Column studies show that the size and shape of microplastics modulate leaching potential [18], while polymer composition does not play a major role in either facilitating or impeding microplastic leaching [19].
The surface transport of microplastics by excess water has been studied at regional, basin, and field scales [1]. However, broad-scale observations have yet to clarify how different surface textures and roughness influence microplastic transport by runoff, or how variations in shape and chemical composition affect transport patterns [17].
As particle transport by excess water is influenced by factors such as surface roughness, slope, and soil texture, studying these processes requires observations across a variety of surface conditions [20]. To achieve this, laboratory experiments involving simulated rainfall have been used for over 50 years [21]. Simulated rainfall applied at high volume rates rapidly generates Hortonian overland flow, enabling researchers to quantify sediment transport under controlled conditions [22]. This approach serves as a proxy for assessing the movement of particles, including pollutants, across different surfaces [23]. However, beyond the differences between real and simulated rainfall from a nozzle, irrigation also introduces water into agricultural soils, making rainfall just one of several pathways for microplastic transport [24]. Different irrigation technologies cause different water movement patterns, which may or may not cause runoff and contribute to microplastic transport [16,25]. Therefore, observations from runoff experiments should be correlated with field observations.
In the present study, we contribute to the understanding of microplastic transport through the environment, from soils to surface waters, by assessing how microplastic composition and shape influence movement across the soil surface via excess water. To achieve this, we present the findings of a laboratory experiment using simulated rainfall to investigate the transport of microplastics with varying shapes and chemical compositions across soils with different textures and slope gradients. The soil textures and slope gradients selected for the experiments are representative of conditions typically found in agricultural settings within the Chilean semi-arid region, which relate to other soils across the world in similar climate conditions [26]. Simulated rainfall was applied to small soil flumes to observe and compare microplastic movement under controlled conditions. Additionally, we correlated our laboratory observations with field surveys of two agricultural fields with high microplastic contamination, comparing whether the patterns observed in the lab aligned with real-world environmental behaviour. Our primary hypothesis was that soil texture and slope gradient would influence microplastic runoff and that these effects would depend on the shape and polymer composition of the transported microplastics.

2. Materials and Methods

2.1. Soil Flumes

Short soil flumes were used to assess microplastic transport and entanglement across different chemical compositions and shapes. Each flume measured 50 cm in length, 25 cm in width, and 6 cm in depth, following the settings of Verhaegen [27]. One of the 25 cm sides was 5 cm high and had a discharge funnel. The flumes were filled with the topsoil of a Kastanozem (loamic). The soil used had a texture of 32% clay, 41% silt, and 27% sand (classified as clay loam). Since the effect of soil texture on microplastic entanglement and movement was a variable of interest, river sand was added to the collected topsoil to adjust the sand content according to the targeted texture for each treatment (see Section 2.7).

2.2. Rain Simulation

Rain simulation was conducted using full-cone nozzles spraying at an 80° angle with a flow rate of 0.6 L/min at 3 bars of pressure, positioned at a height of 3 m (ATFI 80° IMPACT, Chile). Under these settings, the precipitation over each flume was 0.06 mm/min or 3.8 mm/h, replicating typical rainfall patterns in central Chile. The nozzle produced droplets ranging in size from 230 to 320 μm. The drop energy was estimated using the sand method proposed by Scholten et al. [28], yielding a value of 41 ± 18 J m−2, or 5.1 ± 6.4 J per flume. The simulated rainfall lasted for 30 min, and the outflow from each soil flume was collected in flasks placed at the discharge funnels.

2.3. Microplastics

Acrylic fibres, less than 3 mm in length, were produced using an electric lint remover on an orange faux wool vest. Polyester fibres of the same size were obtained using the same method but from a blue vest. Polyethylene pellets were purchased as standard 3–4 mm, colourless pellets (though were slightly whitish due to thickness). Polystyrene pellets (1–3 mm, white) were obtained by breaking disposable cups. Polyvinyl chloride films were produced by tearing a red waterproof poncho, while polyethylene films were obtained by tearing pale blue supermarket bags. Polyvinyl chloride fragments were generated by sawing a blue water pipe, and polyethylene fragments were produced by filing a high-density red polyethylene cutting board. The resulting plastic confetti from tearing or filing larger objects was sieved to retain fragments and films within the 0.5–2 mm size range. The selected plastic polymers represent the most common types found in agricultural soil samples [24].

2.4. Microplastic Recovery from the Collection Flasks

The supernatant from the collected outflow was vacuum-filtered using Whatman No. 42 filter paper supported by a Büchner funnel. Distilled water was used to rinse the flask walls, ensuring all microplastics were transferred to the filter paper. The filters were examined under a stereo microscope (model SMZ 745 T coupled with an NI-150 high-intensity illuminator, Nikon, Tokyo, Japan) at 8× magnification. The sediment at the bottom of the flasks was dried, weighed, and subsequently inspected under the stereo microscope to account for any microplastics that had settled.

2.5. Field Survey and Soil Sampling

The observations of microplastic transport in soil flumes were correlated with field data collected from two agricultural fields in central Chile. These fields, hereinafter referred to as Field A and Field B, correspond to different soil types according to the World Reference Base for Soil Resources: Field A is classified as a Hortic Stagnic Phaeozem (Clayic), while Field B is a Skeletic Brunic Stagnic Phaeozem (Arenic, Abruptic), indicating contrasting soil textures. At this latitude in Chile, summers are warm with low annual precipitation (<250 mm/year), and the mean annual temperature ranges from 10 °C to 23 °C. According to the Köppen–Geiger climate classification, this region corresponds to the Csb unit [29]. Due to these climatic conditions, the soils in the study area present a xeric moisture regime and a thermic temperature regime [26]. Both fields have been cultivated with corn for animal feed under a fallow–corn rotation for over 10 years. Both fields are furrow-irrigated and have been amended with more than 40 tons of sludge per hectare in the past five years. Therefore, both soils were managed similarly and are located in the same climate, making their contrasting textures particularly valuable for comparison.
At each field, soil samples were collected from eight paddocks using a soil auger at increasing depths: 0–15 cm, 15–30 cm, and 30–50 cm from the topsoil. Each paddock sample was composed of three subsamples taken at the vertices of an equilateral triangle. The slope gradient at each sampling point was measured at the centroid of the triangle using a digital protractor. The soil samples were stored in 400 μm thick polyethylene bags for transportation.

2.6. Soil Analysis for Microplastic Quantification

Microplastics were extracted and quantified from soil samples following the approach described by Corradini et al. [30]. Glass centrifuge tubes containing 5× g of soil and 20 mL of water (1.00 g cm−3) were centrifuged for 15 min at 2000 rpm, after which the supernatant was filtered using Whatman No. 42 filter paper. Following the recovery of the supernatant, the remaining sediments in the tubes were mixed with 20 mL of sodium chloride (5 M, ρ = 1.20 g cm−3), stirred for 30 s at 21,000 rpm, and centrifuged before filtering the supernatant again. The sediments were then subjected to a third wash with 20 mL of zinc chloride (5 M, ρ = 1.55 g cm−3), stirred, and centrifuged, and the supernatant was filtered once more using the same filter paper. The filters were stored in Petri dishes for optical examination. Microplastic particles were identified and counted using a stereo microscope (model SMZ 745 T, coupled with an NI-150 high-intensity illuminator, Nikon, Tokyo, Japan) at 20× magnification. Each filter was examined twice to ensure accuracy in particle counting. Microplastic particles were identified based on shiny surfaces, strong colours, and sharp geometrical shapes, while synthetic fibres were distinguished by smooth sides and strong colours. A hot needle test was used to check whether the isolated particles were plastic [31]. A random sample of the examined microplastics was photographed using a Micrometrics® 519CU CMOS 5.0 Megapixel camera (ACCU-SCOPE Inc., Commack, NY, USA) for the measurement of length and width. Image analysis was performed using ImageJ 1.5 software [32].

2.7. Experimental Design

The experiment followed a completely randomised design with a factorial arrangement of two treatments: soil texture and slope gradient. The soil texture treatment included three levels: clay loam, loam, and sandy loam. The slope gradient treatment had two levels: 0.5% and 2%. The experimental unit was a soil flume, with five replicates per treatment. At the head of each soil flume, 1.5 mL of each prepared microplastic was placed before initiating the simulated rainfall. The rainfall simulation ran for 30 min, after which the outflow was collected.

2.8. Statistical Analysis

The effect of slope gradient and soil texture on microplastic transport by excess water was evaluated using an ANOVA model, in which the count of microplastics collected in the flasks was the response variable, while slope gradient and soil texture were the explanatory variables. The interaction between these two explanatory variables was also considered. Differences between groups were assessed using Tukey’s HSD test, with the significance level set at 95% for both the ANOVA and the Tukey test. The described analysis was conducted to identify differences in the total microplastic counts collected in the flasks, as well as for each specific type of microplastic used in the experiment. A paired t-test was used to compare the counts of microplastics collected in the flasks between microplastics of the same shape but different chemical compositions, such as polyethylene versus polystyrene pellets. Descriptive statistics were used to summarise field observations.

3. Results

3.1. Rain Simulation

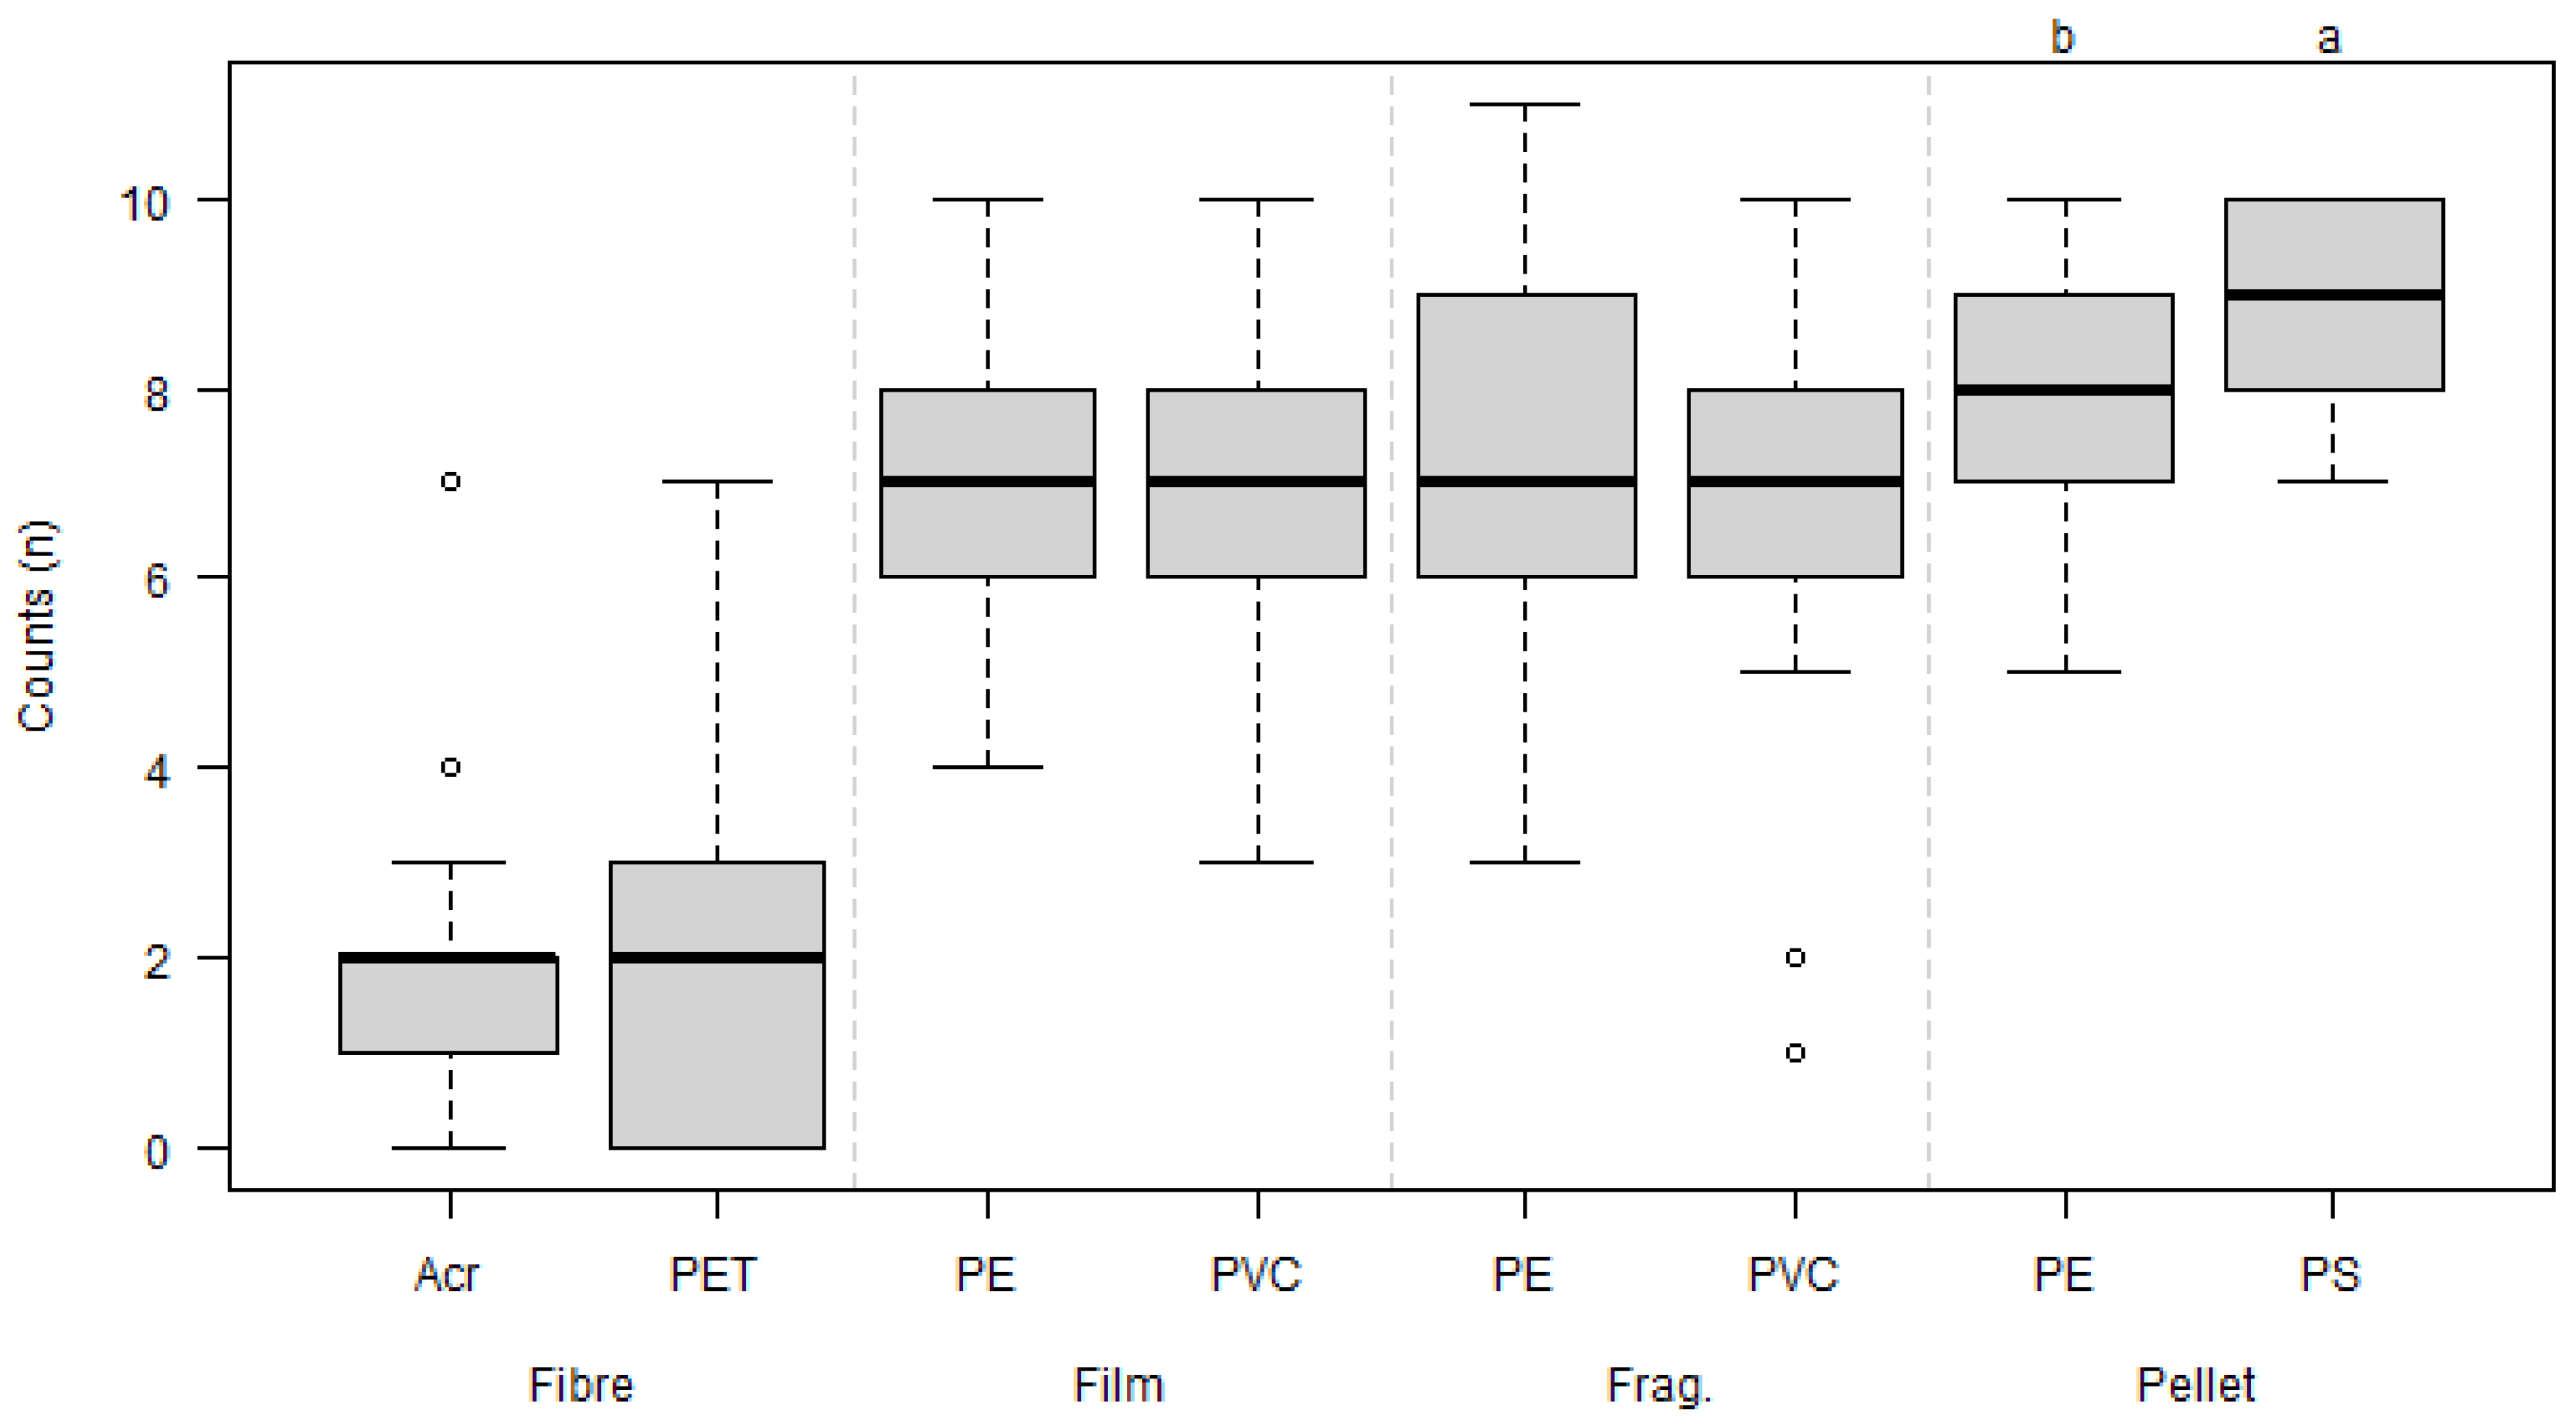
3.1.1. The Effect of Polymer Type and Shape on Microplastic Transport

The paired t-test performed to compare the counts of microplastics of the same shape but different polymer compositions in the collection flasks showed that polymer type did not accelerate or delay microplastic transport by excess water (Table 1). An exception was observed for microplastics in the shape of pellets, as the counts of polyethylene and polystyrene pellets in the collection flasks were statistically different (p-value < 0.001). Regarding shape, the counts of polyethylene microplastics in the form of fragments, films, and pellets showed no differences, suggesting that shape did not have a marked effect on microplastic transport by excess water. However, fibres, both acrylic and polyester, exhibited lower transport compared to all other microplastics used in the rainfall experiment (Figure 1).

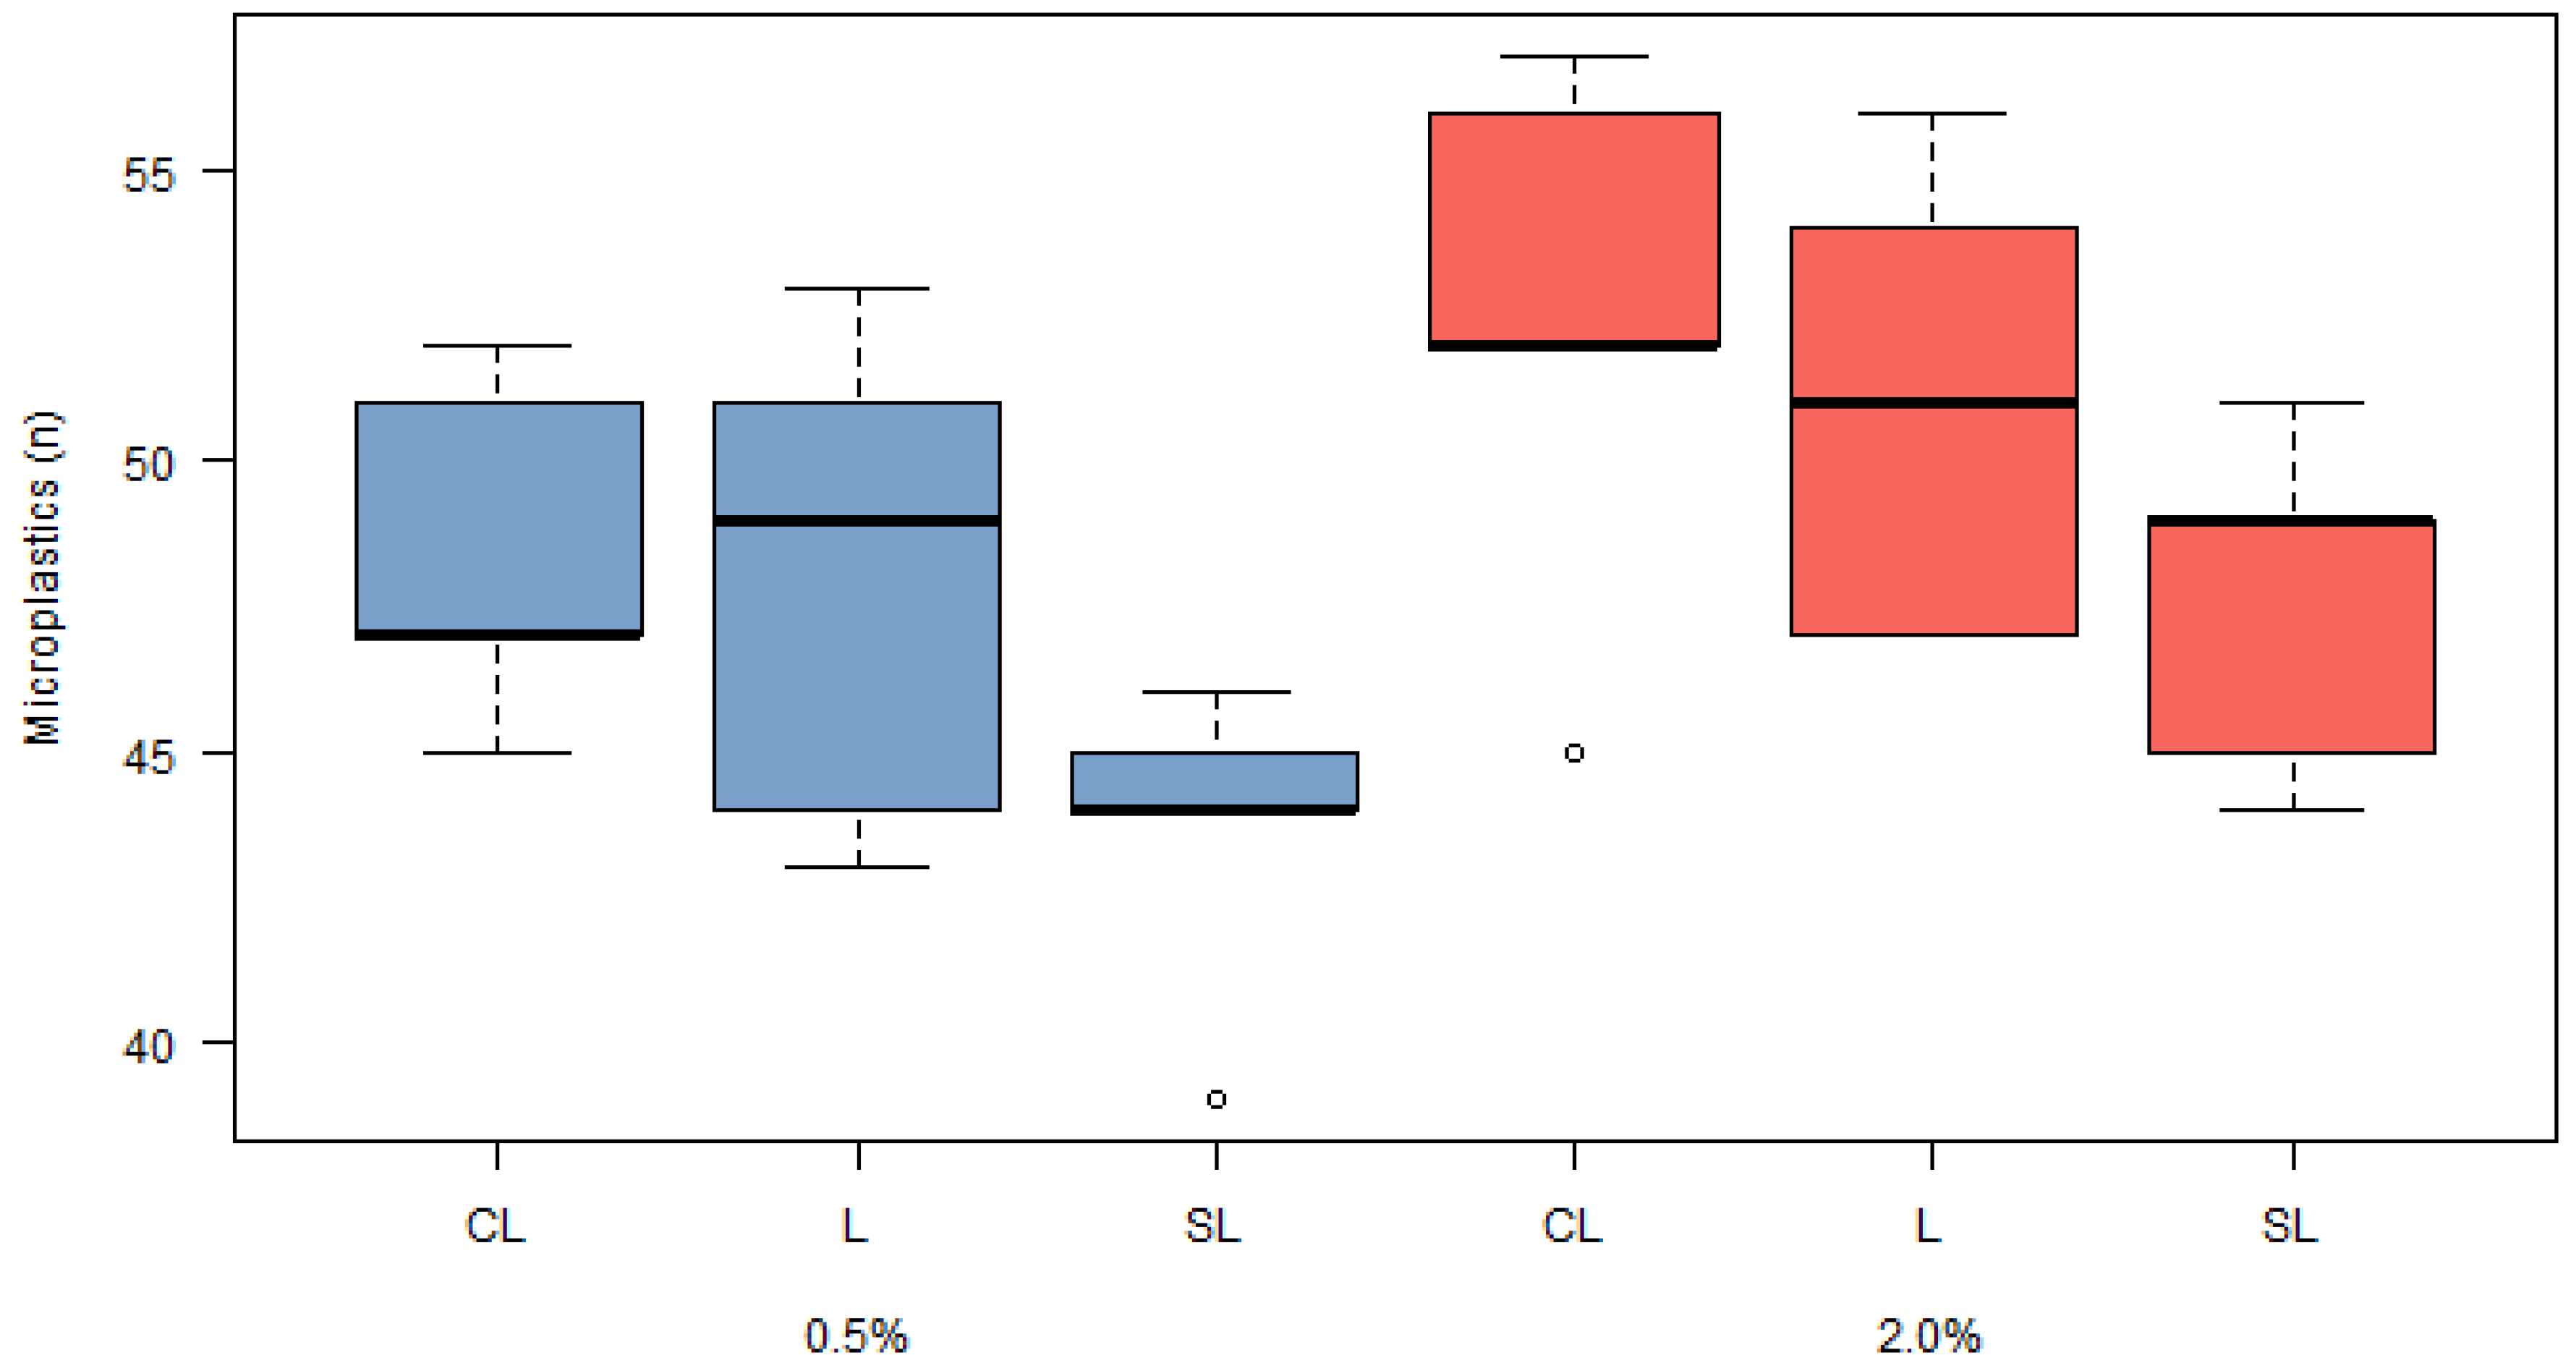
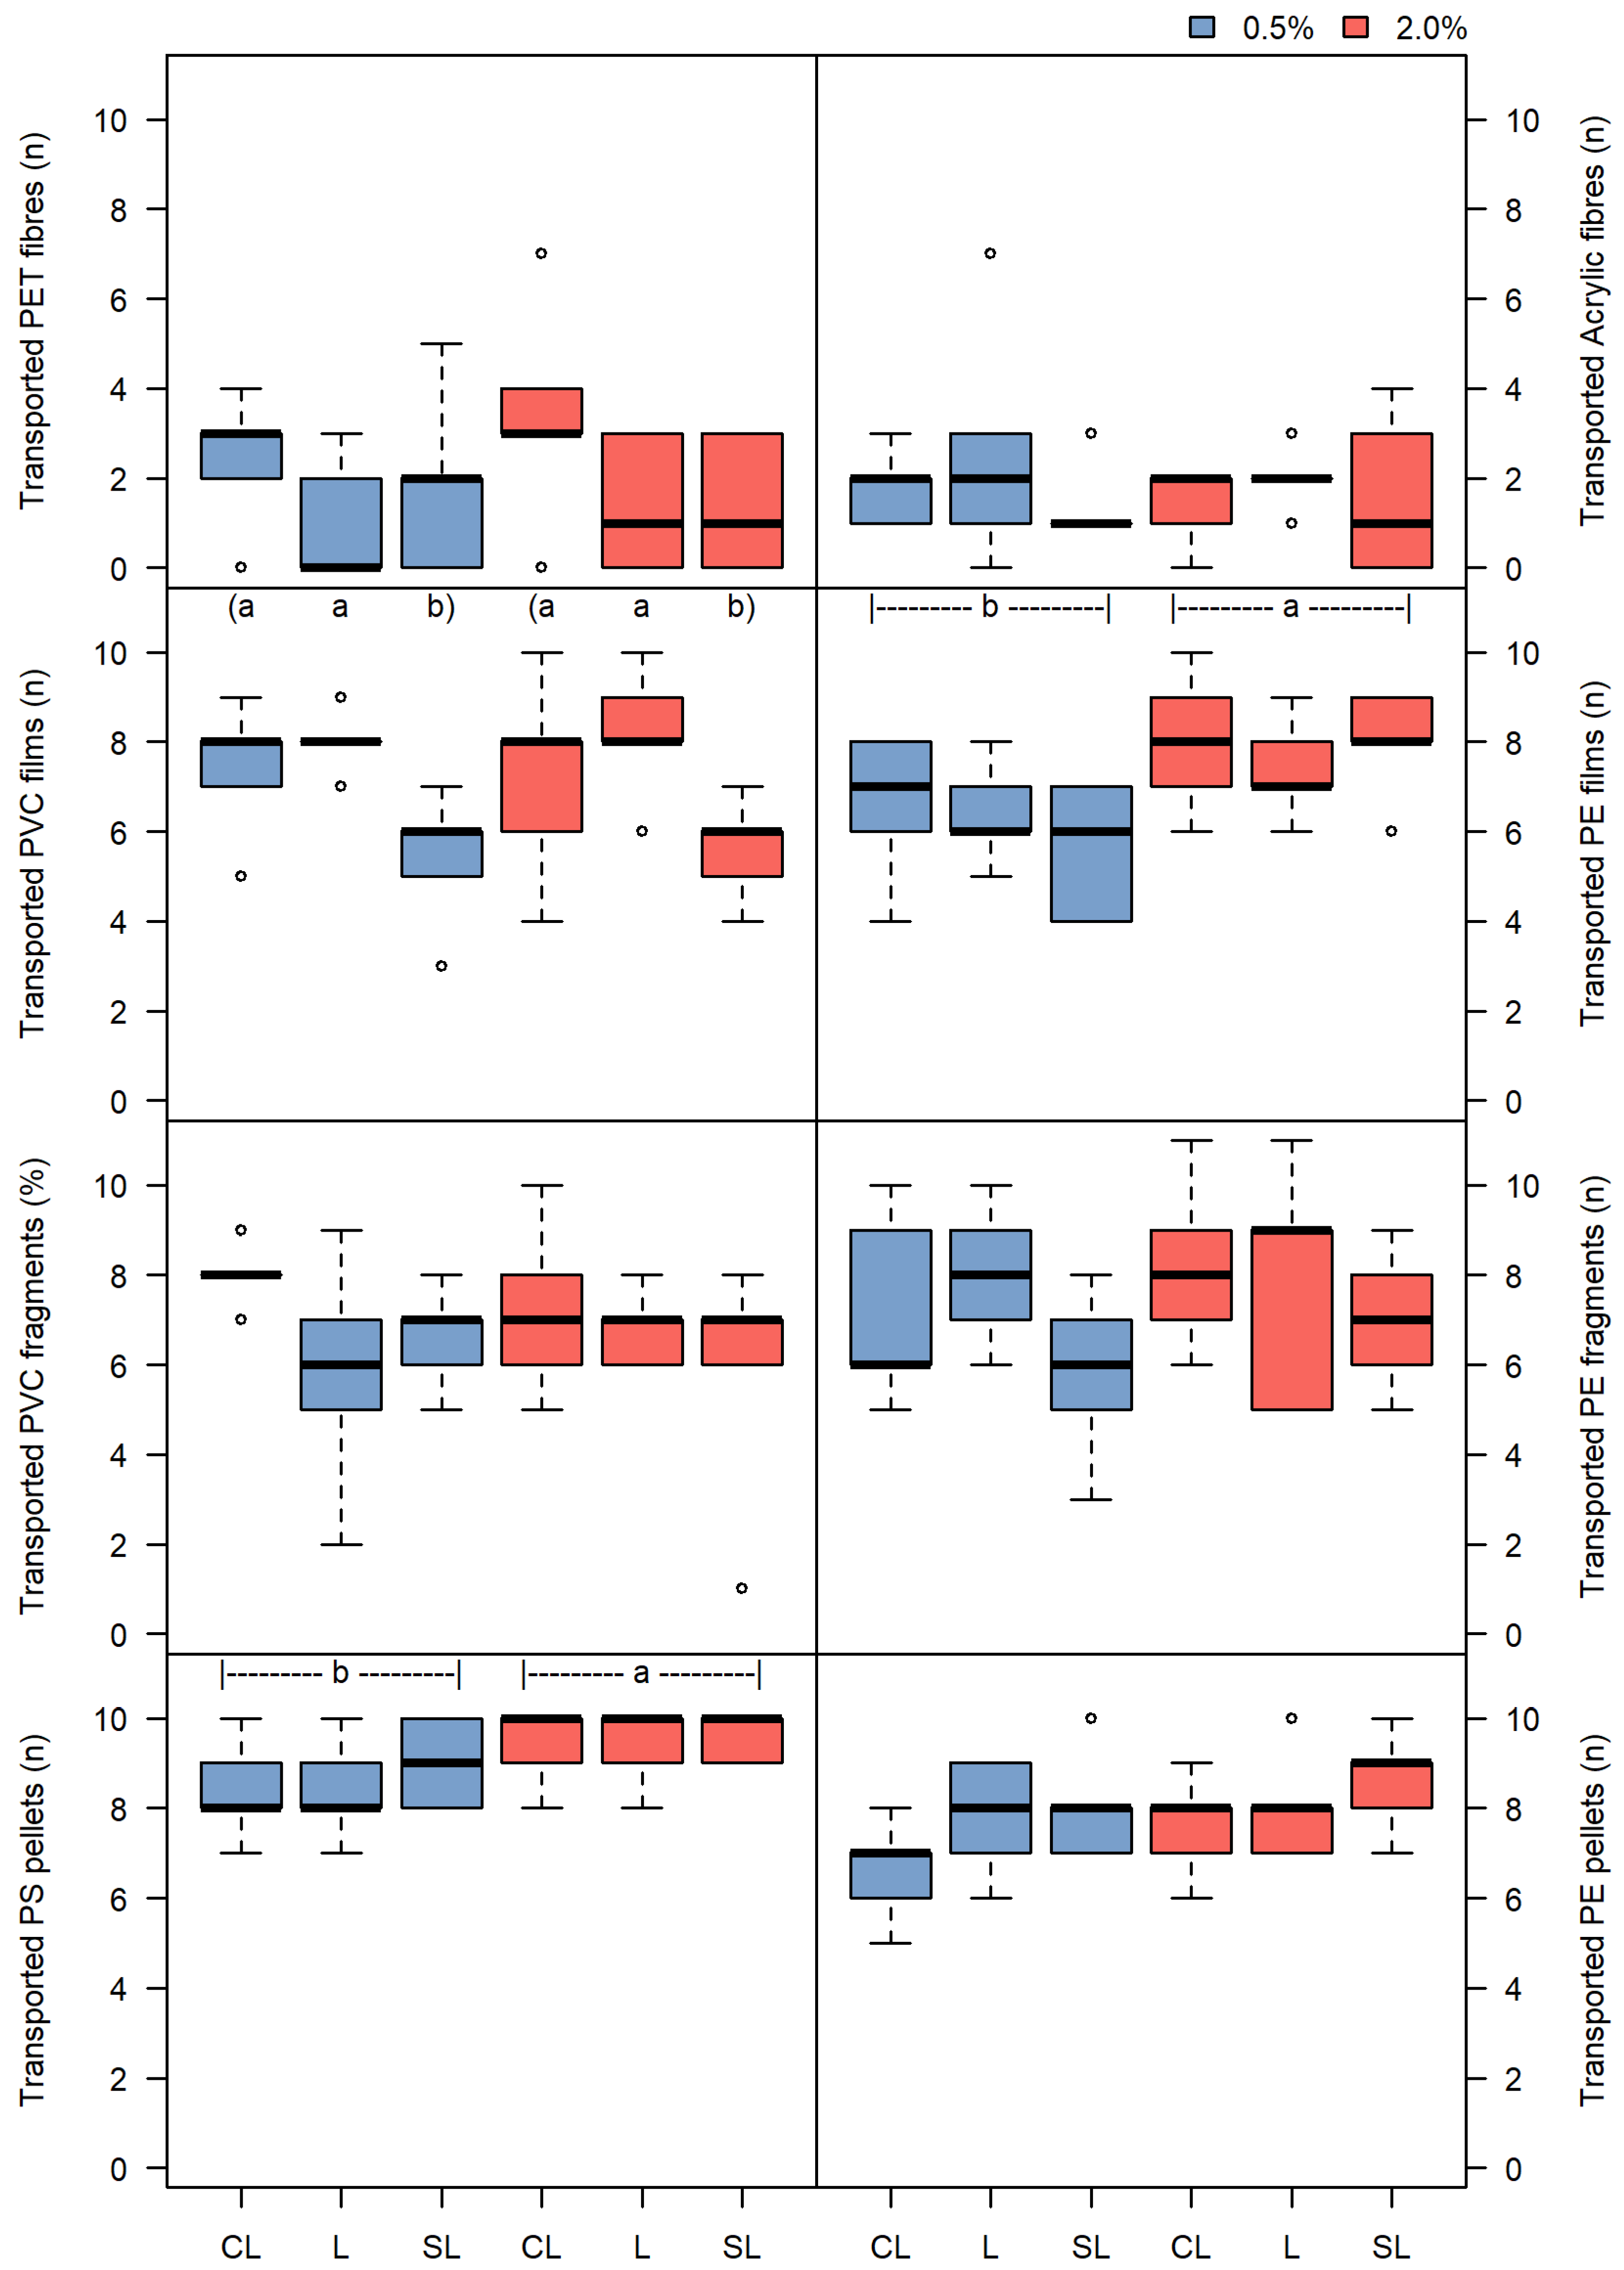
3.1.2. The Effect of Slope and Texture on Microplastic Transport

Neither slope gradient nor soil texture influenced microplastic transport in the rainfall simulation experiment (Figure 2). However, when testing for differences in the counts of specific types of microplastics, significant variations were observed for some. A lower transport rate was recorded for polyvinyl chloride films moving across flumes filled with a sandy loam substrate (p-value = 0.002). In contrast, flume slope affected the transport of polystyrene pellets and polyethylene films, with the highest counts recorded at the steepest slope (2%) (p-value = 0.020 and 0.004, respectively). No other shapes or polymers showed significant differences in transport to the collection flasks based on flume slope or soil texture (Figure 3).

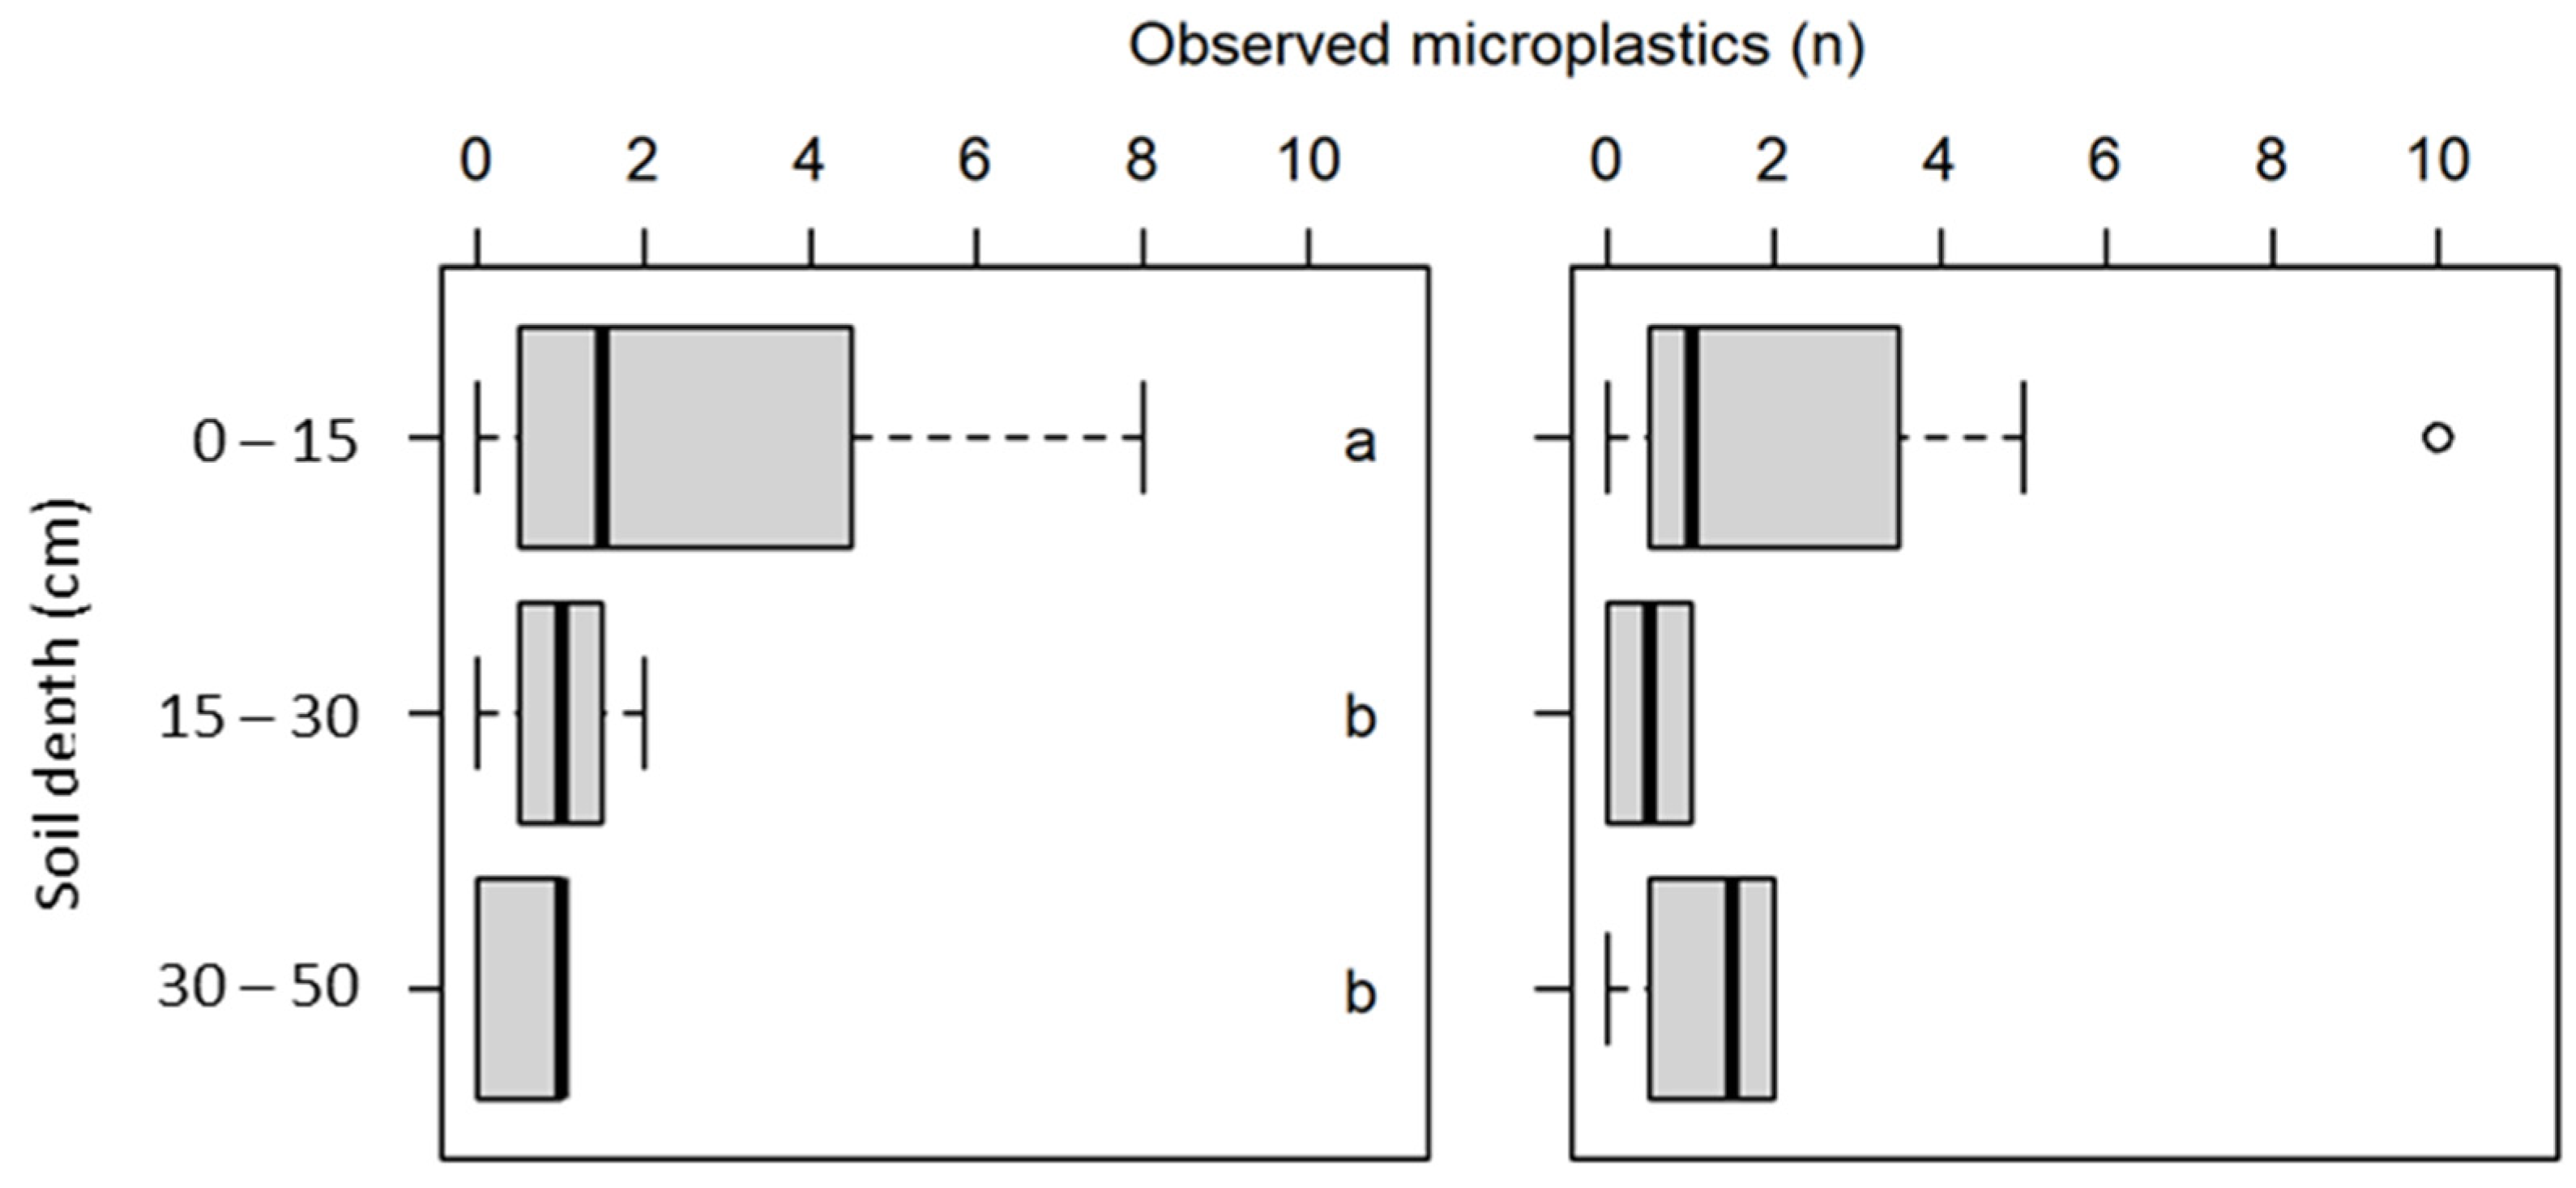
3.2. Field Observations

The field survey showed a higher count of microplastics in the topsoil of each paddock (Figure 4). With the exception of a single particle, all collected microplastics were fibres. No differences in microplastic quantities were observed between the two fields, despite the contrasting soil textures (clay vs. sandy clay loam) and variations in slope gradient (0.7–4.3%) (Figure 5). At the time of sampling, more than a year had passed since the last sludge application.

4. Discussion

The rainfall simulation experiment did not support the initial hypothesis, as neither soil texture nor flume slope influenced the transport of microplastics of different shapes and compositions. Additionally, no significant differences were observed in the transport of microplastics based on polymer type or shape, except for fibres, which had consistently low counts in the collection flasks. These results do not align with findings from other laboratory studies. The discrepancies could be attributed to differences in experimental design, including variations in soil structure, rainfall intensity, or microplastic size distribution.
The absence of evidence for the effect of soil texture on microplastic transport was unexpected, as previous studies suggest that coarser textures promote the downward movement of microplastics. In a laboratory experiment using soil columns, Soltani Tehrani et al. showed that under simulated rainfall, lightweight polyethylene microplastics moved more easily through loamy sand soil than through sandy loam soil, which has a lower sand proportion [33]. The soils tested in their column experiment had a higher sand content (57% or 74%) than the soils used in the present study (maximum 54%), but the sand content of their sandy loam soil closely matched that of our experiment. Since their results showed downward microplastic transport, even for low-density particles, it was expected that in our experiment, at least in the more porous soil with higher sand content, microplastics would exhibit greater retention, as suggested by Jiang et al. [7]. The expected mechanism was that some microplastics would be transported downward into the flume soil by water infiltration, with the coarser soil capturing them in its larger pore spaces before Hortonian flow was initiated. Once soil saturation occurred, microplastics would no longer be transported to the outlet funnels and collected in the flasks. This trapping effect should have resulted in a lower microplastic count in the collection flasks, as a portion of the particles would have remained embedded within the soil. However, this expected outcome was not observed.
A study by Soltani Tehrani et al. [33] was not the only column experiment to report greater microplastic movement in sandy or coarse-textured soils. For example, Apte et al. reported a fasted lixiviation rate in quartz sand compared to silty soil [34], while Li et al. showed that coarser particles exhibited faster downward movement of microplastics [35]. One key difference between these experiments and our study was the size of the microplastics used. The microplastics in our experiment were larger than those used in the cited studies, which could explain the unexpected behaviour. The microplastics we tested were within the coarser fraction of sand (>250 μm), whereas the column experiments primarily used microplastics in the finer range (100–200 μm). This size difference suggests that the pore spaces in the flume soils may not have been large enough to allow for the downward movement and retention of microplastics. However, this hypothesis is partially challenged by the findings of Moses et al., who studied microplastic dynamics in a German river [36]. After monitoring water quality for a year, they observed that peaks in microplastic concentrations for particles smaller than 500 μm followed sediment runoff patterns, whereas larger microplastics (>500 μm) did not exhibit the same behaviour. Their findings suggest that microplastic transport is influenced by more complex dynamics, potentially mediated by surface attachment and particle weight.
Evaluating the downward movement of microplastics in porous media using lixiviating columns is a common approach, and the review by Li et al., published before the three studies cited in the preceding paragraph, highlights several earlier findings on the topic [37]. However, due to their design, these studies do not account for the effect of soil slope on microplastic movement patterns. A steeper slope accelerates the onset of Hortonian flow, which should, in turn, reduce the amount of microplastic leaching into the soil, particularly since most microplastics are buoyant particles [38]. The key takeaway, as Han et al. suggest, may be that “smaller size, steeper incline, and greater water flow rate facilitate the movement of plastics on surfaces” [38]. Despite this expectation, the influence of slope was not clear in our experiment. Instead, only two types of microplastics (polyethylene films and polystyrene pellets) showed a significant difference in particle counts collected in the flasks at the end of the funnel. Interestingly, both microplastics were the lightest among the respective shape categories: polyethylene films were lighter than polyvinyl chloride films, and polystyrene pellets were lighter than polyethylene pellets. The differences in polymer density may have influenced mobilisation, as lower-density microplastics require less energy to detach from the soil surface. This pattern aligns with the findings of Moses et al. for a German river [36], where lighter polystyrene pellets were transported more easily by excess water than heavier polyethylene pellets. Similar trends have been reported in paddy soils, where variations in microplastic weight and density affected transport rates [39]. Additionally, smaller (<50 μm) and low-density microplastics exhibited higher mobility rates in Chinese soils with minimal development and a 3.5% slope [40]. The question remains as follows: why, in our experiment, did an increase in slope lead to higher counts of polystyrene pellets and polyethylene films in the collection flasks, yet have no measurable effect on the other tested microplastics? Given that all tested microplastics were similar in size, one possible explanation is that the slope used in our experiment was insufficient to induce slope-driven transport for the heavier microplastics. The 2% slope tested in our soil flumes was 42% lower than the general slope of the soils evaluated in China, where Liu et al. reported greater mobility of less-dense microplastics [40]. It is possible that, due to shape and weight, the microplastics tested in our experiment (aside from polystyrene pellets and polyethylene films) remained on the topsoil, retained by friction, rather than being transported by surface water under the tested slope conditions. If this hypothesis is correct, an insufficient slope could explain not only the absence of a slope effect, but also the lack of a significant soil texture effect. In fact, stepped paddy fields have been shown to promote microplastic accumulation in soils, preventing transport beyond individual terraces due to a minimal slope [25]. However, the authors did not provide the specific slope measurements for each paddy field level or terrace, making direct comparisons difficult.
Another possible explanation for the low response to slope and texture factors might be the amount of rainfall or the drop energy produced by the rain simulator. Greater overland flow generally results in higher net microplastic transport, as more energy is available to detach and mobilise microplastics and sediments [15]. Considering the flumes as an open system with constant pressure, the total energy of the water (kinetic + potential) at the top of the flumes was 31 Pa for the 0.5% slope flumes and 110 Pa for the 2% slope flumes, following the calculations of Schroers et al. [41]. Based on the flow rate of the flumes, each slope factor had 25 mW and 150 mW of power available for detaching and transporting microplastic particles. However, this energy may not have been sufficient to mobilise particles larger than 1000 μm, particularly given the roughness of the bare soil surface used in this study.
Similar to the potential limitations in available power for microplastic transport, the drop energy impacting the flume surface might have been insufficient to effectively detach microplastics from the soil. To the best of our knowledge, the effect of drop impact energy on microplastic detachment and transport in soils has not yet been thoroughly evaluated. However, it is well established that drop size has a direct relationship with erosion and sediment transport [42]. In our experiment, the drop size was relatively small, and the measured kinetic energy was 41 ± 18 J m−2, which is considerably lower than what is typically expected in natural environments without canopy cover (>1000 J m−2) [42].
The case of fibres stands out from the other microplastics studied, as they were strongly retained by the soil during the simulated rainfall, regardless of whether they were made of polyethylene terephthalate or acrylic. The high retention of fibres in porous media has been observed in both sand column experiments [43] and environmental conditions [44], suggesting that our findings align well with previous research. In their sand column experiment, Cohen and Radian observed that fibre composition did not influence fibre transport [43]. Instead, fibre size was the determining factor in whether fibres accumulated in the topsoil or moved to deeper layers with water. Fibres larger than 50 μm, which were at least ten times bigger than those used in the present study, remained in the topsoil. Both their findings and ours highlight the potential for fibre accumulation in surface soils, which may have long-term environmental implications, as suggested by Zhou et al. [13].
The field observations, which showed microplastics (primarily fibres) concentrating in the topsoil, align with previous evidence. As observed in the flume experiments, fibres in the surveyed fields became entangled or trapped in the soil more easily than other forms of microplastics, leading to accumulation at the soil surface. This retention suggests that fibres remain in the topsoil until they break down into smaller microplastic particles [43]. Other studies examining fields treated with sewage sludge have reported similar findings. For example, in a controlled experiment in a field belonging to the Chinese Academy of Agricultural Sciences, researchers found that after 16 years of sludge application, fibres between 200 and 500 μm were the predominant type of microplastic in the topsoil, accounting for more than 50% of the total microplastics found [13]. Similarly, in Sweden, researchers also observed fibre accumulation in the topsoil, with a limited amount of microplastics penetrating below the ploughing depth [44]. However, in contrast to the Chinese study, fibres in the Swedish study accounted for only around 25% of the total microplastic count, with fragments being the dominant type. Despite these differences, a previous survey of Chilean soils reported fibre predominance [30]. Consequently, there still is contrasting evidence.
Regarding our hypothesis, the field observations confirmed that the shape of microplastics, rather than composition, primarily influenced accumulation in the topsoil or superficial transport by excess water. The observations also indicated that soil texture played a secondary role in an agricultural context, where soils typically range from sandy loam to clay loam. However, the observation window did not allow for a thorough assessment of the relevance of microplastic composition. The time elapsed between the last sludge application and sampling was likely long enough for most sludge-related microplastics to have been mobilised by rain or irrigation. Additionally, the agricultural nature of the surveyed fields limited the ability to evaluate the effect of slope under real conditions, as most fields receiving sludge applications in the area have slopes ranging between 1% and 2%, resulting in relatively uniform conditions. Nonetheless, the field observations are presented here to contextualise the findings from the soil flume experiments with simulated rainfall.
Before concluding the discussion, we would like to address the limitations of our study from both rainfall simulation and field survey perspectives. The most evident limitation is the size detection limit of our method. Since microplastic counting and identification were conducted using a stereo microscope, the smallest observable microplastic measured 250 μm. Although this detection threshold is common in environmental surveys [24], it excludes microplastics in the silt (2–75 μm) and fine sand (75–250 μm) size ranges, which, due to a lower weight, have a greater potential for environmental transport [18]. Future studies should focus on the horizontal (2D) movement of smaller microplastics across a slope, as these particles may travel faster or, conversely, become trapped in the smallest voids between soil aggregates. Another aspect that was not considered in the present study was the effect of ageing on microplastic transport. The literature suggests that aged microplastics tend to move more freely downward in the soil profile, and that ageing can also influence surface transport by excess water. As microplastics degrade, they lose mass and may experience changes in hydrophobicity, potentially altering mobility [45,46]. Although incorporating ageing as a variable would have increased the complexity of the experiment and gone beyond the scope of this preliminary study, it remains a relevant factor for future research. Similarly, organic matter content was not explicitly addressed in our study. The soil used in the flumes had a relatively low organic carbon content (15 ± 2 g/kg), and it is known that soil carbon can facilitate microplastic migration [47]. However, field studies have reported mixed results regarding this relationship [48]. Regarding the flume experiment, it is important to note that the rim effects and the splashing of microplastics out of the channels due to raindrop impact were not accounted for. Consequently, the present study focused only on downward transport rather than potential lateral transport. In terms of the field survey, it is also worth noting that the last sludge application in the surveyed fields occurred one to two years before sampling. Over this period, both irrigation and winter rainfall may have altered the composition and distribution of microplastics on the soil surface. Future studies should implement continuous monitoring of similar fields to detect potential peaks in microplastic discharge that may coincide with irrigation or rainfall events, as generally suggested by the literature.

5. Conclusions

The rainfall simulation experiment did not support the initial hypothesis, as neither soil texture nor slope gradient had a consistent effect on the transport of microplastics across the soil surface, even when slope gradients were less than 2% and sand content ranged from 30% to 75%. While polymer composition did not significantly influence microplastic movement, shape had a minor effect, with fibres being more strongly retained in the soil than other forms. These findings suggest that, under the tested conditions, microplastic transport by overland flow is primarily governed by particle buoyancy and interactions with the soil surface rather than by variations in slope or texture.
This study contributes to the understanding of microplastic dynamics by reinforcing previous observations that microplastics, particularly fibres, tend to accumulate in the topsoil rather than being readily transported by runoff. The results also highlight the need for further research on the influence of particle size, surface roughness, and hydrological conditions on microplastic mobilisation. Future studies should incorporate a broader range of microplastic sizes, examine the effects of ageing and organic matter interactions, and conduct field-scale assessments under natural rainfall conditions to better predict the environmental fate of microplastics in agricultural landscapes.

Funding

This work was supported by the Agencia Nacional de Investigación y Desarrollo (ANID) of Chile, Project FONDECYT de Iniciación N°11220656.

Institutional Review Board Statement

Not applicable.

Informed Consent Statement

Not applicable.

Data Availability Statement

The dataset is available on request from the author.

Conflicts of Interest

The author declare no conflicts of interest and that the funders had no role in the design of this study; in the collection, analyses, or interpretation of the data; in the writing of the manuscript; or in the decision to publish the results.

Abbreviations

The following abbreviations are used in this manuscript:
ACRAcrylic (fibre)
PEPolyethylene
PETPolyethylene terephthalate
PSPolystyrene
PVCPolyvinyl chloride

References

  1. Islam, T.; Cheng, H. Existence and fate of microplastics in terrestrial environment: A global fretfulness and abatement strategies. Sci. Total Environ. 2024, 953, 176163. [Google Scholar] [CrossRef] [PubMed]
  2. Iqbal, S.; Li, Y.; Xu, J.; Worthy, F.R.; Gui, H.; Faraj, T.K.; Jones, D.L.; Bu, D. Smallest microplastics intensify maize yield decline, soil processes and consequent global warming potential. J. Hazard. Mater. 2025, 486, 136993. [Google Scholar] [CrossRef] [PubMed]
  3. Siwach, S.; Bharti, M.; Yadav, S.; Dolkar, P.; Modeel, S.; Yadav, P.; Negi, T.; Negi, R.K. Unveiling the ecotoxicological impact of microplastics on organisms—The persistent organic pollutant (POP): A comprehensive review. J. Contam. Hydrol. 2024, 266, 104397. [Google Scholar] [CrossRef]
  4. Andrady, A.L. Microplastics in the marine environment. Mar. Pollut. Bull. 2011, 62, 1596–1605. [Google Scholar] [CrossRef]
  5. Zeng, H.; Cui, Y.; Shao, R.; Li, T.; Zhao, Y.; Liu, R.; Dai, Z.; Liu, Y.; Wang, J.; Xie, Q.; et al. Microplastics in animal-derived products and their potential risks to human health. TrAC Trends Anal. Chem. 2025, 185, 118187. [Google Scholar] [CrossRef]
  6. Sunil, S.; Bhagwat, G.; Vincent, S.G.T.; Palanisami, T. Microplastics and climate change: The global impacts of a tiny driver. Sci. Total Environ. 2024, 946, 174160. [Google Scholar] [CrossRef]
  7. Jiang, Y.; Yang, Y.; Zhan, C.; Cheng, B. Impacts of rainfall and lakeshore soil properties on microplastics in inland freshwater: A case study in Donghu Lake, China. Environ. Sci. Process. Impacts 2024, 26, 891–901. [Google Scholar] [CrossRef]
  8. Sharma, S.; Sharma, V.; Chatterjee, S. Contribution of plastic and microplastic to global climate change and their conjoining impacts on the environment—A review. Sci. Total Environ. 2023, 875, 162627. [Google Scholar] [CrossRef]
  9. Colmenarejo Calero, E.; Kovač Viršek, M.; Mali, N. Microplastics in Groundwater: Pathways, Occurrence, and Monitoring Challenges. Water 2024, 16, 1228. [Google Scholar] [CrossRef]
  10. Turner, A. Paint particles in the marine environment: An overlooked component of microplastics. Water Res. X 2021, 12, 100110. [Google Scholar] [CrossRef]
  11. Tziourrou, P.; Golia, E.E. Plastics in Agricultural and Urban Soils: Interactions with Plants, Micro-Organisms, Inorganic and Organic Pollutants: An Overview of Polyethylene (PE) Litter. Soil Syst. 2024, 8, 23. [Google Scholar] [CrossRef]
  12. Boonsong, P.; Ussawarujikulchai, A.; Prapagdee, B.; Pansak, W. Contamination of microplastics in greenhouse soil subjected to plastic mulching. Environ. Technol. Innov. 2025, 37, 103991. [Google Scholar] [CrossRef]
  13. Zhou, W.; Xu, J.; Fu, B.; Wu, Y.; Zhang, K.; Han, J.; Kong, J.; Ma, Y. Microplastic accumulation and transport in agricultural soils with long-term sewage sludge amendments. J. Hazard. Mater. 2024, 480, 136263. [Google Scholar] [CrossRef] [PubMed]
  14. Lwanga, E.H.; Beriot, N.; Corradini, F.; Silva, V.; Yang, X.; Baartman, J.; Rezaei, M.; van Schaik, L.; Riksen, M.; Geissen, V. Review of microplastic sources, transport pathways and correlations with other soil stressors: A journey from agricultural sites into the environment. Chem. Biol. Technol. Agric. 2022, 9, 20. [Google Scholar] [CrossRef]
  15. Sulaiman, M.S.; Anuar, S.T.; Ibrahim, Y.S.; Yusof, K.M.K.K.; Mohamad, Y.; Khalik, W.M.A.W.M.; Azmi, A.A.; Zainal Abidin, S.; Abdullah, N.S.; Yahya, N.K.E.M. Estimation of macroplastic yield from river basin to coastal area: A case study of the Klang River, Malaysia. Mar. Pollut. Bull. 2025, 212, 117527. [Google Scholar] [CrossRef]
  16. Du, A.; Hu, C.; Wang, X.; Zhao, Y.; Xia, W.; Dai, X.; Wang, L.; Zhang, S. Experimental Study on the Migration and Distribution of Microplastics in Desert Farmland Soil Under Drip Irrigation. Environ. Toxicol. Chem. 2024, 43, 1250–1259. [Google Scholar] [CrossRef]
  17. Kang, Q.; Zhang, K.; Dekker, S.C.; Mao, J. Microplastics in soils: A comprehensive review. Sci. Total Environ. 2025, 960, 178298. [Google Scholar] [CrossRef]
  18. Rieckhof, C.; Martínez-Hernández, V.; Holzbecher, E.; Meffe, R. Effect of particle size on the transport of polystyrene micro- and nanoplastic particles through quartz sand under unsaturated conditions. Environ. Pollut. 2024, 363, 125193. [Google Scholar] [CrossRef]
  19. Fu, Y.Z.; Yang, J.Y. Effects of Microplastics Migration on Farmland Soil Physical and Chemical Properties Under Leaching Conditions. Water Air Soil Pollut. 2025, 236, 40. [Google Scholar] [CrossRef]
  20. Liu, J.; Zheng, L. Microplastic migration and transformation pathways and exposure health risks. Environ. Pollut. 2025, 368, 125700. [Google Scholar] [CrossRef]
  21. Shachori, A.; Seginer, I. Sprinkling assembly for simulation of design storms as a means for erosion and runoff studies. Int. Assoc. Sci. Hydrology. Bull. 1962, 7, 57–72. [Google Scholar] [CrossRef]
  22. Shi, H.; Zheng, F.; Zhao, T.; Xu, X.; Liu, G. Impacts of straw mulching in longitudinal furrows on hillslope soil erosion and deposition in the Chinese Mollisol region. Soil Tillage Res. 2024, 243, 106178. [Google Scholar] [CrossRef]
  23. Cousins, A.; Dunn, C.; Aberg, D.; Smyth, A.J.; Williams, M.; Green, J.A.M.; Kurr, M. Evaluating microplastic trapping efficiency in seagrass meadows using hydraulic flume simulations. Mar. Pollut. Bull. 2025, 213, 117660. [Google Scholar] [CrossRef] [PubMed]
  24. Sahai, H.; Aguilera del Real, A.M.; Alcayde, A.; Bueno, M.J.M.; Wang, C.; Hernando, M.D.; Fernández- Alba, A.R. Key insights into microplastic pollution in agricultural soils: A comprehensive review of worldwide trends, sources, distribution, characteristics and analytical approaches. TrAC Trends Anal. Chem. 2025, 185, 118176. [Google Scholar] [CrossRef]
  25. Zhang, Y.; Wen, X.; Zhou, W.; Yang, Y.; Zhou, Z.; Chen, J.; Wang, X.; Wang, Y.; Tian, J.; Yuan, Y.; et al. Retention and migration of microplastics in stepped paddy fields: A study on microplastic dynamics in the special irrigation system. Environ. Res. 2025, 269, 120909. [Google Scholar] [CrossRef]
  26. Casanova, M.; Salazar, O.; Seguel, O.; Luzio, W. The Soils of Chile; Hartemink, A.E., Ed.; World Soils Book Series; Springer: Dordrecht, The Netherlands, 2013. [Google Scholar] [CrossRef]
  27. Verhaegen, T. The use of small flumes for the determination of soil erodibility. Earth Surf. Process. Landf. 1987, 12, 185–194. [Google Scholar] [CrossRef]
  28. Scholten, T.; Geißler, C.; Goc, J.; Kühn, P.; Wiegand, C. A new splash cup to measure the kinetic energy of rainfall. J. Plant Nutr. Soil Sci. 2011, 174, 596–601. [Google Scholar] [CrossRef]
  29. Kottek, M.; Grieser, J.; Beck, C.; Rudolf, B.; Rubel, F. World map of the Köppen-Geiger climate classification updated. Meteorol. Z. 2006, 15, 259–263. [Google Scholar] [CrossRef]
  30. Corradini, F.; Meza, P.; Eguiluz, R.; Casado, F.; Huerta-Lwanga, E.; Geissen, V. Evidence of microplastic accumulation in agricultural soils from sewage sludge disposal. Sci. Total Environ. 2019, 671, 411–420. [Google Scholar] [CrossRef]
  31. Berenstein, G.; Córdoba, P.; Díaz, Y.B.; González, N.; Ponce, M.B.; Montserrat, J.M. Macro, meso, micro and nanoplastics in horticultural soils in Argentina: Abundance, size distribution and fragmentation mechanism. Sci. Total Environ. 2024, 906, 167672. [Google Scholar] [CrossRef]
  32. Schneider, C.A.; Rasband, W.S.; Eliceiri, K.W. NIH Image to ImageJ: 25 years of image analysis. Nat. Methods 2012, 9, 671–675. [Google Scholar] [CrossRef] [PubMed]
  33. Soltani Tehrani, R.; Yang, X.; van Dam, J. Rainfall-induced microplastic fate and transport in unsaturated Dutch soils. J. Contam. Hydrol. 2025, 268, 104456. [Google Scholar] [CrossRef]
  34. Apte, S.; Dike, S.; Dabir, V. Vertical transport of HDPE microplastics through sandy and silty soil. Environ. Chall. 2024, 17, 101050. [Google Scholar] [CrossRef]
  35. Li, W.; Brunetti, G.; Zafiu, C.; Kunaschk, M.; Debreczeby, M.; Stumpp, C. Experimental and simulated microplastics transport in saturated natural sediments: Impact of grain size and particle size. J. Hazard. Mater. 2024, 468, 133772. [Google Scholar] [CrossRef]
  36. Moses, S.R.; Löder, M.G.J.; Herrmann, F.; Laforsch, C. Seasonal variations of microplastic pollution in the German River Weser. Sci. Total Environ. 2023, 902, 166463. [Google Scholar] [CrossRef]
  37. Li, F.; Huang, D.; Wang, G.; Cheng, M.; Chen, H.; Zhou, W.; Xiao, R.; Li, R.; Du, L.; Xu, W. Microplastics/nanoplastics in porous media: Key factors controlling their transport and retention behaviors. Sci. Total Environ. 2024, 926, 171658. [Google Scholar] [CrossRef] [PubMed]
  38. Han, N.; Zhao, Q.; Wu, C. Threshold migration conditions of (micro) plastics under the action of overland flow. Water Res. 2023, 242, 120253. [Google Scholar] [CrossRef]
  39. Harada, S.; Yajima, I.; Fukushima, K.; Nitta, Y. Retention, Degradation, and Runoff of Plastic-Coated Fertilizer Capsules in Paddy Fields in Fukushima and Miyagi Prefectures, Japan: Consistency of Capsule Degradation Behavior and Variations in Carbon Weight and Stable Carbon Isotope Abundance. Water 2024, 16, 1782. [Google Scholar] [CrossRef]
  40. Liu, D.; Yang, Z.; Gong, Y.; Song, D.; Chen, Y. Occurrence and emission characteristics of microplastics in agricultural surface runoff under different natural rainfall and short-term fertilizer application. J. Hazard. Mater. 2024, 477, 135254. [Google Scholar] [CrossRef]
  41. Schroers, S.; Eiff, O.; Kleidon, A.; Scherer, U.; Wienhöfer, J.; Zehe, E. Morphological controls on surface runoff: An interpretation of steady-state energy patterns, maximum power states and dissipation regimes within a thermodynamic framework. Hydrol. Earth Syst. Sci. 2022, 26, 3125–3150. [Google Scholar] [CrossRef]
  42. Katayama, A.; Nanko, K.; Jeong, S.; Kume, T.; Shinohara, Y.; Seitz, S. Short communication: Concentrated impacts by tree canopy drips—Hotspots of soil erosion in forests. Earth Surf. Dyn. 2023, 11, 1275–1282. [Google Scholar] [CrossRef]
  43. Cohen, N.; Radian, A. Microplastic Textile Fibers Accumulate in Sand and Are Potential Sources of Micro(nano)plastic Pollution. Environ. Sci. Technol. 2022, 56, 17635–17642. [Google Scholar] [CrossRef] [PubMed]
  44. Heinze, W.M.; Steinmetz, Z.; Klemmensen, N.D.R.; Vollertsen, J.; Cornelis, G. Vertical distribution of microplastics in an agricultural soil after long-term treatment with sewage sludge and mineral fertiliser. Environ. Pollut. 2024, 356, 124343. [Google Scholar] [CrossRef]
  45. Qiu, Y.; Niu, J.; Zhang, C.; Chen, L.; Su, B.; Zhou, S. Interpretable machine learning reveals transport of aged microplastics in porous media: Multiple factors co-effect. Water Res. 2025, 274, 123129. [Google Scholar] [CrossRef]
  46. Shafea, L.; Goebel, M.O.; Woche, S.K.; Peth, S. UV-ageing effects on polystyrene microplastics surface polarity and transport in soils. Environ. Chall. 2025, 18, 101080. [Google Scholar] [CrossRef]
  47. Kumar, R.; Verma, A.; Rakib, M.R.J.; Gupta, P.K.; Sharma, P.; Garg, A.; Girard, P.; Aminabhavi, T.M. Adsorptive behavior of micro(nano)plastics through biochar: Co-existence, consequences, and challenges in contaminated ecosystems. Sci. Total Environ. 2023, 856, 159097. [Google Scholar] [CrossRef]
  48. Corradini, F.; Melillán, E.; Schoebitz, M.; Carrasco, R.; Jiménez, M. Assessing on-site plastics fragmentation: Linking macroplastics litter to microplastics pollution in vegetable fields. Sci. Total Environ. 2024, 955, 177168. [Google Scholar] [CrossRef]
Figure 1. Boxplot for the observed microplastic counts in the collection flask after simulated rainfall, categorised by shape and polymer type. Acr, acrylic; PE, polyethylene; PET, polyethylene terephthalate; PS, polystyrene; and PVC, polyvinyl chloride. Letters (a and b) at the top of the plot indicate statistical differences between polymers by type, with differences observed only for pellets.
Soilsystems 09 00040 g001
Figure 2. Boxplot showing the total microplastic counts in the collection flasks after simulated rainfall. Data from flumes with a 0.5% slope gradient are represented in blue, while data from flumes with a 2.0% slope gradient are shown in red. CL, clay loam; L, loam; and SL, sandy loam.
Soilsystems 09 00040 g002
Figure 3. Boxplot of observed microplastic counts in the collection flasks after simulated rainfall, categorised by shape, polymer type, slope, and soil texture. CL, clay loam; L, loam; and SL, sandy loam. Acr, acrylic; PE, polyethylene; PET, polyethylene terephthalate; PS, polystyrene; and PVC, polyvinyl chloride. Letters (a and b) at the top of the plot indicate statistical differences between polymers by type, with differences observed only for pellets.
Soilsystems 09 00040 g003
Figure 4. Boxplot of observed microplastic counts in the soil samples of Filed A (left) and Field B (right) by depth. Different letters indicate statistically significant differences among the soil depths. Letters (a and b) at the top of the plot indicate statistical differences between polymers by type, with differences observed only for pellets.
Soilsystems 09 00040 g004
Figure 5. Relationship between the paddock slope gradient and microplastic counts in the topsoil. Paddocks from Field A are represented in blue, while paddocks from Field B are shown in red.
Soilsystems 09 00040 g005
Table 1. Mean and standard deviation of observed microplastic counts in the collection flask after simulated rainfall, categorised by shape and polymer type. Differences among polymers for each shape were tested using a t-test; only pellets showed a significant difference, with polyethylene having lower counts and polystyrene higher counts (indicated with a and b). ACR, acrylic; PE, polyethylene; PET, polyethylene terephthalate; PS, polystyrene; and PVC, polyvinyl chloride.
Shape/TypeACRPEPETPSPVCGroup Mean
Fibre1.8 ± 1.4-1.9 ± 1.8--1.9 ± 1.6
Film-7 ± 1.6--7.0 ± 1.87.0 ± 1.7
Fragment-7.3 ± 2.0--6.7 ± 1.97.0 ± 1.9
Pellet-7.8 ± 1.3 b-9.0 ± 1.0 a-8.4 ± 1.3
Group mean1.8 ± 1.47.4 ± 1.61.9 ± 1.89.0 ± 1.06.8 ± 1.86.1 ± 3.0
Disclaimer/Publisher’s Note: The statements, opinions and data contained in all publications are solely those of the individual author(s) and contributor(s) and not of MDPI and/or the editor(s). MDPI and/or the editor(s) disclaim responsibility for any injury to people or property resulting from any ideas, methods, instructions or products referred to in the content.

