Abstract
The extreme conditions in arid ecosystems make these environments sensitive to environmental changes. Particularly, land use and seasonal changes are determinants of their soil carbon dynamics. The effect of those elements on soil respiration (RS) is still poorly known in several arid regions of the world. This study investigates the seasonal effect on the RS and its controlling factors throughout different land use systems in northeastern Mexico. RS and 34 biotic and abiotic variables were measured across agricultural crops, natural shrublands, livestock farms, walnut orchards, and industrially influenced soils during the dry and wet seasons. Six variables (soil water content, soil organic matter, soil temperature, silt, and pH) were found as drivers of RS on both local and regional scales. Seasonal and land use had a transversal effect on RS and its controlling factors. RS dynamics were primarily modulated by soil water content, with the wet season and managed lands showing increased sensitivity to climatic and anthropogenic changes. These results indicate that land management strategies are critical for carbon cycling, particularly in water-limited regions like northeastern Mexico, where land use changes are occurring at an accelerated pace.
1. Introduction
Soils are the largest carbon reservoir on earth, containing three times more carbon than vegetation or the atmosphere [1,2]. They can act as a source or sink of the atmospheric CO2 flux [3], with arid lands regulating the trend and interannual variability of the sinking behavior [4,5,6]. Arid lands cover roughly 47.2% of the earth’s surface, enhancing their importance in the global carbon storage processes [7]. At a large scale, the carbon dynamic of these ecosystems is mainly regulated by abiotic factors such as atmospheric temperature, precipitation, and shortwave radiation [4]. At lower scales, biotic elements such as soil organic matter degradation and microbial [8,9,10] and vegetation activity [11,12,13,14] also play a key role.
Soil respiration (RS) represents the below-ground CO2 biologically generated by the activity of its organisms both autotrophs (CO2 fixers) and heterotrophs (not CO2 fixers) [15]. The low precipitation and temperature extremes in arid ecosystems make them highly sensitive to natural and anthropogenic changes, often reflected in highly variable RS rates [11,16,17,18,19]. The RS dynamic in arid environments has been related to factors such as photosynthesis, root expansion, soil moisture, and temperature, which tend to be determinants [10,20,21,22]. Seasonal variation is another critical factor that modulates the CO2 exchange in arid ecosystems [4,6]. Particularly, it has been shown that irregular rainfall patterns with shorter wet periods and longer drought intervals can modulate RS seasonality and its controlling factors. For example, Huxman, et al. [23] showed that precipitation pulse size and frequency regulate the carbon balance by determining the temporal activity of microbial respiration and photosynthetic activity, resulting in arid ecosystems acting as carbon sources following rainfall. Similarly, it has been shown that precipitation legacies control the carbon uptake and ecosystem respiration of the following seasons, making the gross ecosystem productivity more sensitive to precipitation than respiration [24]. In general, microbial respiration increases following very small or moderate precipitation events, while photosynthetic activity (related to root respiration) is associated with relatively larger events or a series of small ones [23].
Among the anthropogenic activities that modify the soil dynamics, land use change is a driving element in altering the soil carbon balance and, subsequently, the RS activity of natural ecosystems [15]. Even though studies carried out in recent years, the effects of land use changes on RS patterns in arid zones still are not completely known, and different outcomes have been recorded. Specifically, when agricultural lands are compared with natural areas of the same region. For example, higher respiration values in a tropical dry forest than in a pasture area were obtained in Brazil [25]. Similarly, Zhang et al. [26] showed that woodland had higher RS rates in a land use conversion sequence of the same arid area in China. Conversely, other studies have shown higher RS rates in agricultural crops than in natural environments [20,27,28]. In addition, only a few studies have compared the seasonal changes throughout different land use systems, most of them in China [26,29,30,31,32]. In semi-arid regions of Africa, RS rates in savanna ecosystems under grazing pressure are lower than in undisturbed areas [33]. At the same time, intensive cultivation further reduces RS by disrupting soil structure and depleting carbon stocks [34]. Similarly, in Australian arid lands, degraded areas exhibit reduced RS compared to native shrublands, highlighting the influence of land management on carbon dynamics [35]. These examples underscore the need for studies to address the critical knowledge gaps in understanding seasonal patterns and the controlling factors of RS across diverse land uses of arid ecosystems at regional scales.
In Mexico, extensive land use changes have taken place in northern arid zones. Many areas of the Chihuahuan desert biogeographic region (the largest North American desert) have experienced a strong impact from agriculture and industry [36], which modify the soil carbon dynamics at different magnitudes. Therefore, measuring the RS throughout specific temporal and spatial scales is necessary to understand its dynamics best in the region. This study investigates the seasonal effect on RS and its controlling factors throughout different land use systems in Mexico southeast of the Chihuahuan Desert. Therefore, we hypothesized that the soil water availability, modulated by the seasonal changes, will primarily affect RS dynamics in the different land uses, showing higher RS rates during the wet season and in land uses with agricultural practices.
2. Materials and Methods
2.1. Study Area
This study was carried out within the Chihuahuan desert biogeographic region, at the Saltillo, Ramos Arizpe, General Cepeda, and Arteaga municipalities of Coahuila de Zaragoza state in northern Mexico (Figure 1). The dominant climate in the region is BWhw, corresponding to very arid, semi-warm, with a mean annual temperature between 18° and 22 °C [37]. The main edaphological categories are Calcisol, Kastanozem, Leptosol, Lithosol, Regosol, and Xerosol [38]. The dominant vegetation types are microphile and rosetophile desert scrub, with species such as Fouquieria splendens, Larrea tridentata, Yucca carnerosana, Yucca filifera, Dasylirion cedrosanum, Echinocactus spp., Echinocereus spp., Mammillaria spp., and Opuntia spp. [39]. According to the precipitation registers in the region [37], two main seasons were considered: (1) dry season, comprising February, April, and December 2019 (cumulative rainfall 21.2 mm); and (2) wet season, comprising June, August, and October 2019 (cumulative rainfall 149 mm) [40]. Hereafter, these periods will be referred to the as dry season and wet season, respectively.
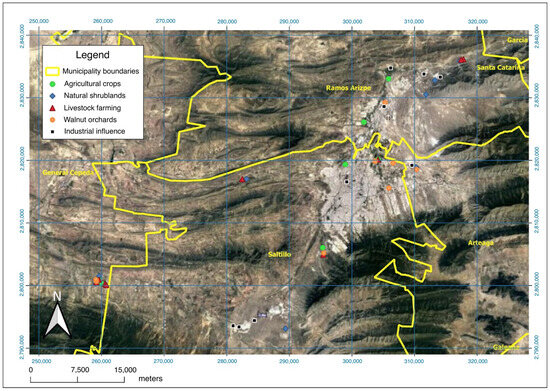
Figure 1.
Location map showing the sampling sites studied in Coahuila de Zaragoza, México.
2.2. Sampling Design
Forty-five sampling sites were used with five land uses: agricultural crops (AC), livestock farming (LF), walnut orchard (WO), industrial influence (II), and natural shrubland (NS). The general characteristics of the land use systems sampled are shown in Table 1. Nine sampling sites were established at each land use, and five spaced (30 m) sampling points in a row per site (replicates) were taken (n = 225). A total of 35 parameters corresponding to the soil respiration (RS), environmental variables (air temperature, relative humidity, photosynthetically active radiation, soil temperature, and soil water content), and abiotic (bulk density, sand, silt, clay, total C and N, electrical conductivity, pH, and soil nutrients) and biotic (microbial biomass carbon and soil organic matter) soil properties were taken at each sampling point. Soil nutrient measurements correspond to 19 chemical compounds (Al2O3, CaO, Cl, Cr2O3, CuO, Fe2O3, K2O, MgO, MnO, Na2O, NiO, P2O5, PbO, SO3, SiO2, SrO, TiO2, ZnO, and ZrO2).

Table 1.
General characteristics of land use systems studied in arid lands from Chihuahua de Zaragoza, México.
Sampling was carried out from February to December 2019 during the maximum RS activity hours (12:00 to 16:00) [40,41] with the sites measured randomly. The RS and environmental variables were measured every other month (February, April, June, August, October, and December), whereas the electrical conductivity (EC), pH, microbial biomass carbon (MBC), and soil organic matter (SOM) were registered only twice: during the dry (February) and wet (August) seasons. Bulk density (BD), sand, silt clay, total C and N, and soil nutrients were measured only once at the first sampling event (February).
2.3. Measurement of Soil Respiration, Environmental Variables, and Soil Properties
RS was measured with a portable dynamic closed chamber (SRC-1; PP System, Amesbury, MA, USA) connected to an infrared gas analyzer (EGM-5; PP Systems, Amesbury, MA). The chamber was placed on an external PVC collar (5 cm depth × 10 cm diameter) temporarily inserted to a depth of three centimeters into the soil 24 h before the RS measurements to minimize the impact of this insertion [42]. Regarding the environmental variables, the soil temperature (Tsoil) and soil water content (SWC) were recorded at 8 cm depth by using a Hydra Probe II (Stevens Water Monitoring Systems Inc., Portland, OR, USA). The air temperature (Tair) and relative humidity (RH) were recorded with a WatchDog (mod. 1450) microstation, and the photosynthetically active radiation (PAR) was recorded with an MQ-200 sensor (Apogee Instruments, Inc., Logan, UT, USA).
pH and EC were determined in a 1:2.5 (w:v) aqueous suspension (Orion Star A211 and Orion Star A212, respectively; both from Thermo Fisher Scientific, Waltham, MA, USA). The MBC was obtained by the fumigation extraction method [43]. The SOM was evaluated by the loss on ignition method (at 400 °C for 4 h). The BD was analyzed by the volumetric method using a graduated cylinder. The soil texture (sand, silt, and clay content) was determined by granulometry with a Horiba LA 950 V2 Particle Size Analyzer. Total C and N were measured on air-dried soil samples using a C:N elemental analyzer (Flash Smart, Thermo Fisher Scientific, Waltham, MA, USA). Total concentrations of soil nutrients were determined by X-ray fluorescence (Bruker S4 Pioneer, Billerica, MA, USA).
2.4. Data Analysis
RS data measured with EMG-5 (g CO2 m−2 h−1) were converted to micromoles of carbon dioxide per square meter per second (µmol CO2 m−2 s−1) divided by the conversion factor 0.1584 [44]. Prior to the data analyses, outliers were validated (by using Tukey’s method), and a random forest algorithm imputation was applied for missing data (<8% of the total data in all the cases) [45,46]. Seasonal and land use effects were analyzed by computing a one- or two-way analysis of variance (ANOVA). Tukey’s tests were carried out to test differences among land uses. Normality and homoscedasticity of variance were tested. The natural logarithm transformation was implemented to meet the assumptions when necessary. Nutrient content data were summarized to be used in the structural equation models (see below) by computing a principal component analysis (PCA, two first components). PCA results are shown in the Supplementary Materials (Figure S1 and Table S1). ANOVAs and PCA were computed in R software version 4.2.1 [47].
Structural equation models (SEMs) were used to identify the factors controlling RS, incorporating all the previously analyzed data and various hypothetical causal relationships among variables. Additionally, SEMs were used to examine significant differences in the RS drivers across seasons and between the studied land uses. An initial model considering that environmental (Tair, Tsoil, HR, SWC, and PAR), soil abiotic (soil texture, pH, EC, and nutrients), and biotic (SOM, MBC) had an influence over RS was constructed. Models considered a complete set of hypotheses based on the literature [48,49,50] and previous experience [40,41,51]. From the general model, a multigroup SEM was used to test whether the studied factors were linked by the same causal structure in each season (dry or wet) and to identify the paths that did not behave similarly in the two seasons. For this analysis, the same hypothetical model was used for each season group separately. Since a lack of fit was detected in the fully constrained multigroup model, a series of nested models, where equality constraints were removed one at a time, were developed to detect which one would significantly improve the model [52,53]. To test for differences in parameter values between the two seasons, χ2 and AIC statistics were used.
The degree of fit between observed and expected covariance structures was assessed in the multigroup model by the root mean square error of approximation statistic (RMSEA), where values < 0.08 indicate a good fit, between 0.08 and 0.10 provide a moderate fit, and >0.10 suggest a poor fit [54]. The models’ fit to the data was additionally evaluated by Bentler and Bonett’s normed-fit index (NFI), in which values ranging between 0 and 1 and those >0.9 indicate an acceptable fit [55]. The maximum likelihood algorithm was used to estimate standardized path coefficients [56]. All SEM analyses were performed by using SPSS® AMOS 26.0 software.
3. Results
3.1. Soil Respiration, Environmental Variables, and Soil Properties
Both season and land use significantly (p < 0.001) affected all sampled variables at each season, as shown by the ANOVA results (Table 2 and Table 3). Nevertheless, an interaction effect of land use and season (p < 0.05) was observed, except for pH and MBC (Table 3). Regarding environmental variables analyzed, Figure 2 and Table 2 show the highest and lowest RS values were recorded during the wet season in walnut orchards (WOs) and the dry season in sites under the industrial influence (II), respectively. The highest PAR value was recorded during the wet season in II sites, whereas the lowest was observed during the wet season in walnut orchard (WO) areas. The highest and lowest Tair values were observed during the wet season in natural shrublands (NS) and during the dry season in livestock farming (LF) sites, respectively. Tsoil had the highest value throughout the wet season in NS and the lowest throughout the dry season in LF sites. The highest and lowest RH values were shown throughout the wet and dry seasons in WO and II sites, respectively. The SWC showed the highest and lowest values during the wet and dry seasons in LF sites and NS, respectively. The highest EC was observed during the dry season in agricultural crops (AC), whereas the lowest was registered during the wet season in NS. The most basic pH was measured throughout the dry season in soils from II, whereas the lowest values were detected during the wet season in AC. The MBC was highest during the wet season in LF sites and it was lowest during the dry season in II sites. Finally, SOM was highest throughout the dry season in LF sites and lowest during the wet season in II sites.
Table 2.
Seasonal and land use variation for the soil respiration, and the environmental, physicochemical, and biological soil properties measured in arid lands from Coahuila de Zaragoza, Mexico. AC = agricultural crops, II = industrial influence, LF = livestock farming, NS = natural shrublands, WOs = walnut orchards.
Table 3.
Effect of season (S), land use (LU), and the interaction (S × LU) in the respiration, environmental, physicochemical, and biological soil properties of arid lands from Coahuila de Zaragoza, México.
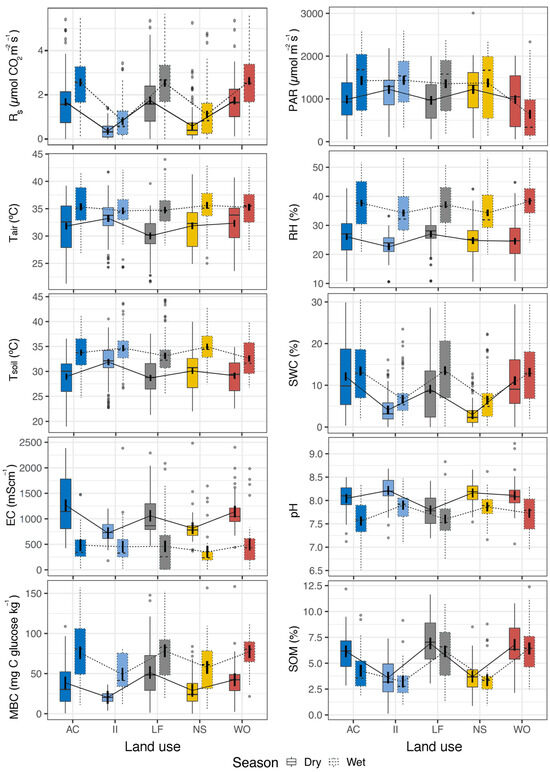
Figure 2.
Seasonal variation during dry (solid lines) and wet (dashed lines) seasons of soil respiration (RS), photosynthetically active radiation (PAR), air temperature (Tair), relative humidity (RH), soil temperature (Tsoil), soil water content (SWC), electrical conductivity (EC), pH, microbial biomass carbon (MBC), and soil organic matter (SOM) in lands with agricultural crops (ACs), industrial influence (II), livestock farming (LF), natural shrublands (NS), and walnut orchards (WOs) from Coahuila de Zaragoza, Mexico. Different colors indicate different land uses. Vertical black bar inside each box indicates 95% confidence intervals.
3.2. RS Controlling Factors
SEMs showed the causal-effect relation of biotic and abiotic variables controlling RS. At the regional scale (i.e., overall data, Figure 3), this analysis exhibits the robust control of SOM content influencing positively or negatively the abiotic (SWC, soil temperature, pH, silt content) and biotic (microbial biomass) soil factors, which results in a direct and indirect influence over the RS. The SWC was the main controlling factor of the RS variability regardless of the season. Even if total effects are considered, the SWC exerts a stronger influence over RS than SOM (Table 4). Furthermore, multigroup SEM also showed how the controlling factors of RS variability significantly (p < 0.05) changed in importance (e.g., SWC and SOM), no longer had an influence (i.e., silt and MB), or even shifted the influence over the RS (i.e., Tsoil). Specifically, the SWC showed a stronger influence over the RS during the dry season than the wet one (standardized regression weight (SRW) of 0.53 and 0.50, respectively). On the contrary, SOM showed a slightly stronger influence over the RS during the wet season than the dry one (SRW of 0.23 and 0.20, respectively). Both silt percentage and MBC only influenced the RS during the dry season. Furthermore, Tsoil positively influenced the RS during the dry season and negatively during the wet (SRW of 0.06 and −0.06, respectively) (Figure 3).
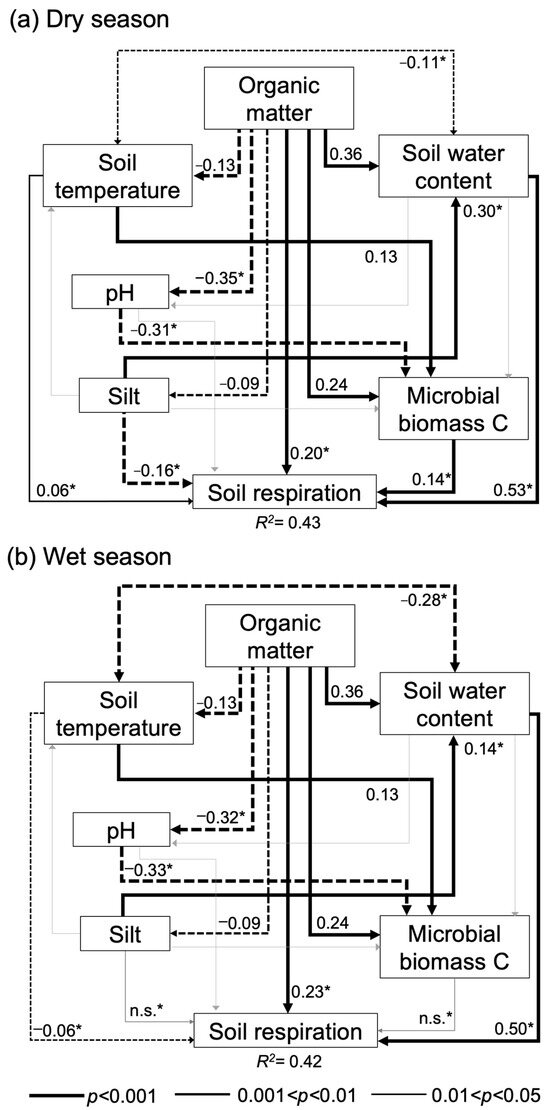
Figure 3.
Path diagrams representing hypothesized causal relationships among the factors controlling the soil respiration in arid lands from Coahuila de Zaragoza, Mexico: (a) dry season; (b) wet season. Arrows depict causal relationships: positive and negative effects are indicated by solid and dashed lines, respectively, with numbers indicating standardized estimated regression weights (SRW). Arrow widths are proportional to significance values according to the legend. Asterisks depict significant differences between the same path in the dry and wet season models. Paths with non-significant (n.s.) coefficients are in gray. Multilevel model: NFI = 0.98; RMSEA = 0.018; χ2 = 31.68; p = 0.08; nested p = 0.089; n = 675.
Table 4.
Standardized direct, indirect, and total effects of the main controlling factors for soil respiration (RS) during the dry and wet season in arid lands from Coahuila de Zaragoza, Mexico (See Figure 3).
SEM by land use (Figure 4 and Figure 5), in addition to the consistent and strong influence of SWC over RS (except for II during dry season), exhibit the positive control of Tsoil over RS under the dry season (i.e., AC, LF, WO; Figure 4a,c,d) and are negative during the wet one (LF, II; Figure 5c,e). Other controls were less consistent across land use and season. Silt content negatively influenced the RS for LF (both seasons), WOs (dry season; Figure 4d), and positively in NS (wet season; Figure 5b). SOM positively influenced II RS regardless of the season and negatively influenced it in WOs. The MBC influenced the RS positively on LF and II (dry season; Figure 4c,e) and negatively influenced it in WOs (wet season; Figure 5d). pH only had an effect over RS during the dry season on NS and LF (Figure 4b,c).
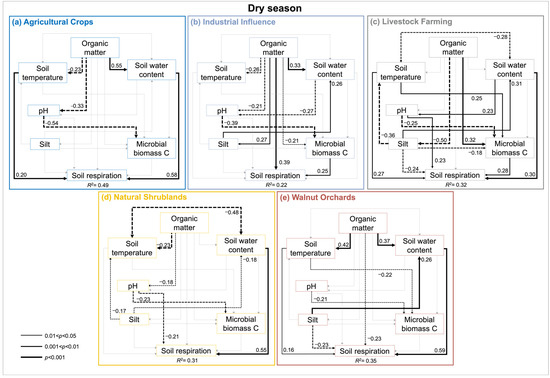
Figure 4.
Path diagrams representing hypothesized causal relationships among the factors controlling the soil respiration during the dry season across different land uses from Coahuila de Zaragoza, Mexico (a–e). Arrows depict causal relationships: positive and negative effects are indicated by solid and dashed lines respectively, with numbers indicating standardized estimated regression weights (SRWs). Arrow widths are proportional to significance values according to the legend. Paths with non-significant coefficients are in gray.
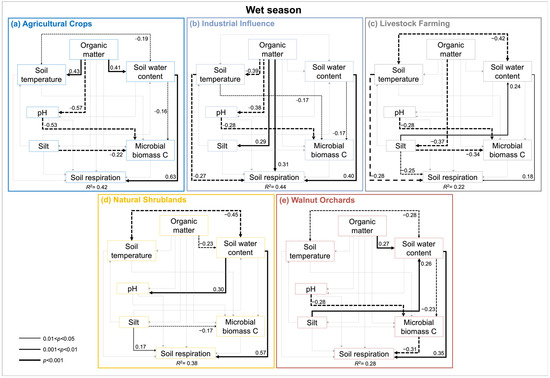
Figure 5.
Path diagrams representing hypothesized causal relationships among the factors controlling the soil respiration during the wet season across different land uses from Coahuila de Zaragoza, Mexico (a–e). Arrows depict causal relationships: positive and negative effects are indicated by solid and dashed lines, respectively, with numbers indicating standardized estimated regression weights (SRWs). Arrow widths are proportional to significance values according to the legend. Paths with non-significant coefficients are in gray.
4. Discussion
4.1. RS Seasonal Dynamic
The annual mean RS rate recorded in this study (1.57 μmol CO2 m−2 s−1; Table 2) exhibits noticeable distinctions compared to other arid zones with varying land uses in China (2.27 μmol CO2 m−2 s−1 growing season [20,26]) and Brazil (2.03 μmol CO2 m−2 s−1, [25]). Still, it is consistent with that previously recorded in natural shrublands from northwestern Mexico (1.4. μmol CO2 m−2 s−1) [57]. Inherent variations in the controlling factors of land CO2 exchange at continental scales (atmospheric temperature, precipitation, and shortwave radiation) partially account for the above-mentioned similarities and differences in the RS annual rates [4,6]. According to those spatial variations, those studies also showed a significant seasonal change, which is mirrored in an increase in the RS during the wet season, matching our results. This RS seasonal pattern is common in other natural environments, such as the dry tropical forest [58], tropical cloud forest [59], pine forest [9], pine-oak forest [60], and arid meadows [61]. Nevertheless, some other environments have reached a negative response of RS to precipitation (e.g., coastal wetlands [62] and other semi-humid or humid ecosystems [63]). Thus, data about seasonal and precipitation effects on the RS from the different habitats around the world are still necessary to understand the soil C dynamic best.
The magnitude of the seasonal change obtained in the studied region (145% to 191% higher during the wet season throughout the different land uses; Table 2) is smaller when compared to other arid environments in Mexico (295% in chaparral vegetation [57]), India (229% to 256% through fragmented tropical thorn forests; [10]), Brazil (1089% and 1220% in dry tropical forest and degraded pasture, respectively [25]), and Africa (421 to 598% through three different land uses; [34]). In addition to the continental variations in environmental variables that drive RS at large scales (mentioned above), the C dynamic is also influenced by variations in the SOM added to the soil by plants and its specific modifications through the mineral matrix [64]. Therefore, factors such as water availability, vegetation type [40,57,65,66], microclimatic variations [67], and high spatial heterogeneity in the vegetation composition [14,68] can help to explain the differences regarding the magnitude of the RS seasonal change between sites at lower scales. Thus, RS seasonal change recorded in our overall results may be attributable to a higher sensitivity of the autotrophic respiration to drought when microorganisms are in dormant states [69] but also to the capacity of microorganisms to rapidly resuscitate from that state after being stimulated by the increase of the SWC during the wet season [9,40,70]. This is supported by the direct effect of the SOM over MBC, and RS (Figure 3 and Table 4), which also suggests an important contribution of the heterotrophic component [71,72,73].
4.2. Land Use Effects on RS
Despite the strong seasonal effect on RS, as expected, land use also influenced the recorded RS rates, aligning with findings documented in other arid zones [20,29,74]. Our results show RS rates observed across the land uses with inherent management practices (managed lands: agricultural crops, livestock farming, and walnut orchards) were 250% to 372% higher (Table 2) than those from areas without specific management practices (natural shrublands and sites under industrial influence). Despite this, the recorded RS for agricultural crops (annual mean: 2.11 μmol CO2 m−2 s−1) falls within the global cropland annual range (0.47–4.16 μmol CO2 m−2 s−1 [75]). This pattern of higher RS for agricultural lands compared to native vegetation aligns with observations in various studies [20,27,29,32], underscoring the negative impact of agricultural practices on the soil’s carbon dioxide stocks of arid ecosystems. Nevertheless, it has also been recorded that implementing sustainable management practices or cultivating specific crops, such as some native ones, can mitigate the adverse effects on RS [76,77], potentially even acting as a C sink [78]. To propose more sustainable practices, further studies are necessary to investigate the potential effect of those practices on the C dynamics of agricultural lands in the region.
Prima facie results revealed heightened SOM, SWC, and MBC values in agricultural lands compared to sites without management practices (Figure 2 and Table 2). Irrigation and fertilization practices, along with cattle excrement commonly found in agricultural lands (Table 1), directly lower pH and EC while increasing SOM, carbon, and water availability (Table 2; Figure 4 and Figure 5). These changes create favorable conditions that enhance microbial activity, boosting RS [35,79,80]. Since the agricultural sites in the region often continue their management practices even during the dry, the consistent stimulation of RS controlling factors may also explain the RS seasonal variation when comparing sites with and without agronomic management. Specifically, during the dry season, RS values were 288% to 480% higher in sites with agronomic management, contrasting with the wet season where the difference ranged from 228% to 323% (Table 2). Although the influence of specific management practices, such as fertilization, was not analyzed in this study, it is possible that they strongly influence the RS rates obtained. This has been shown in other studies that record an increase from 18% to 48% after nitrogen (N) or phosphorous (P) fertilization [79,80]. Similarly, tillage and fallowing practices tend to increase CO2 emissions from 0.2 to 3 times in crops regarding bare soils [81,82]. The influence of these non-sustainable management practices (that increase the loss of soil CO2) on the regional RS dynamic requires a more detailed investigation.
Regarding sites without management practices, SOM and water content showed a higher influence on RS with positive effects regardless of seasonal changes (Figure 4 and Figure 5). Changes in the native vegetation concerning the characteristic structure of sites with management practices can influence the RS by modifying microhabitat conditions [83], such as microclimate, detritus amount and quality, and autotrophic respiration [66,84]. Our data suggest that the lowest RS values recorded in land uses without management practices can be explained by a lower ecological dynamic derived from simpler structural components or fewer consumables for heterotrophic respiration. Those sites displayed the lowest vegetation density (except when compared with livestock farming sites, personal observation), which directly influences variables that limit microorganism activity (lower EC, SWC, and SOM, along with higher pH), resulting in a reduced carbon flux (lower MBC and RS values) (Table 2 and Figure 2). A similar response of the RS and microbial activity due to changes in structural components of ecosystems (mainly related to the vegetative component) has been recorded in other arid environments [11,12].
4.3. Dynamics of RS Controlling Factors Across Land Uses and Seasons
This study identified six variables as the RS primary controlling factors: SWC, SOM, MBC, Tsoil, Silt, and pH. Among these, the SWC consistently emerged as the most influential factor, irrespective of the season or land use (Table 4, Figure 3, Figure 4 and Figure 5). The dominance of SWC contrasts with studies that emphasize Tsoil as the primary RS driver [22,31,72,85,86]. In general, the contribution of Tsoil or SWC to RS depends on the type of ecosystem and is strongly influenced by factors such as water and soil nutrient availability, microbial communities, and autotrophic organisms. For example, in arid ecosystems with varying land uses, soil temperature tends to be closely correlated with RS in agricultural sites, particularly during the wet season [33,77,82]. However, our findings mainly revealed a weak direct effect of Tsoil on RS across the different land uses and seasons. Similarly, the influence of Tsoil on MBC was found to be weak, with significant effects observed only during the dry season in LF and WO, and during the wet season in areas affected by industrial activities (Figure 4 and Figure 5). In areas with native vegetation of arid ecosystems, it has been shown that soil temperature acts as a limiting factor for microbial activity, negatively affecting RS [25,87]. The lower influence of Tsoil on RS in sites without management practices in our results may be explained by higher temperatures coupled with the limited availability of SOM for microbial activity. Conversely, in managed sites, factors such as constant irrigation, higher vegetation cover (indirectly showed by the PAR values in crop sites), and humidity generated by cow excrements may contribute to relatively lower temperatures and a weaker Tsoil influence on the RS [28]. These findings emphasize the importance of considering the interactions among the RS and its controlling factors in further studies in the region.
Despite the dominant role of the SWC, total weights (Table 4) indicated that SOM is the second most important controlling factor. High drought stress in the region diminishes plants’ activity, leading to low SOM levels that restrict microbial activity [88,89]. These patterns were particularly observed in soils with industrial influence during the dry season, where SOM served as the primary constraint of microbial biomass carbon (Figure 4b). In general, our results show that SOM can either positively or negatively influence both abiotic (SWC, Tsoil, pH, silt content) and biotic (microbial biomass) controlling factors (Figure 3 and Figure 4), thereby shaping the spatial and seasonal dynamic of RS. The quality of SOM, in terms of its fraction proportions (recalcitrant, extra recalcitrant, and labile), may explain the differing influence of SOM on the RS. Labile SOM requires less energy for microbial degradation, which supports a higher abundance of microorganisms. Conversely, more recalcitrant SOM is less bioavailable, thereby reducing its contribution to RS. This agrees with previous studies that highlight the significance of SOM in soil dynamics [73,90]. Drought stress is the main factor positively associated with RS and the dehydrogenase activity during the decomposition of organic matter. In contrast, phenol oxidase activity reflects the breakdown of recalcitrant carbon in heterotrophic respiration, a key process in lignin decomposition. The activity of phenol oxidase is primarily determined by seasonal changes in soil moisture [91,92]. During dry periods, phenol oxidase its activity is restricted due to reduced substrate availability, microbial proliferation, and nutrient content, resulting in lower RS, matching with our results. In contrast, wet periods show increased phenol oxidase activity, consistent with the idea that soil water availability and seasonal rain events are critical drivers of carbon flux in arid ecosystems [4,10,11,23,24,57].
Although the effects of pollutants were not directly analyzed in this study, the presence of heavy metals was recorded in some of the sites influenced by industrial activity. Among the nine industrialized sampled sites, two contained Cr2O3 (0.057%, maximum recorded concentration) and one contained PbO (0.078%, maximum recorded concentration). The negative effects of Cr and Pb pollution on microbial activity (arylsulphatase, alkaline phosphatase, and urease) and RS rates have been demonstrated in roadside soils of intensive traffic regions [93]. Our results yielded sites under industrial influence exhibited higher PAR and lower vegetation density (personal observation), as well as reduced MBC, and RS values compared to natural shrublands (non-significant differences; Table 2). These findings support the assumption that exposure to industrial volatile compounds and suspended particles negatively impacts RS dynamics. However, the influence of industrial activity on regional RS values warrants further investigation to understand its long-term impacts on C dynamics.
The consistently high negative effect of sites with management practices on pH, as shown in our results (Table 2 and Figure 2), aligns with findings from other studies [94,95]. Low pH values in these land uses were negatively correlated to MBC, regardless of season, directly influencing the RS (Figure 4 and Figure 5). The high SOM content in such sites may contribute to an increase in the H+ release during its degradation, thereby lowering pH and negatively affecting MBC [96]. Although soil acidification is a global challenge for carbon cycling and sustainable soil management, the relationship between these remains insufficiently understood. The dynamics of soil pH are complex due to its variable responses to several factors (e.g., climate, topography, parent material, soil biology, human disturbances, sampling design, and measurement errors) [97]. Nevertheless, our results confirm the negative impact of land use changes, particularly those involving agronomic management, on soil pH and their subsequent effects on the RS dynamics.
Silt content also influences RS differently depending on land use. In livestock farming and walnut orchards, silt has a negative effect on RS, whereas in natural shrublands, it exhibits a positive impact. In livestock farming, animal trampling can compact the soil, especially those with more silt, reducing porosity and limiting aeration, decreasing oxygen availability for microorganisms and RS [95,98]. Conversely, in the natural shrublands, silt particles may promote microaggregate formation, protecting organic matter and enhancing the respiratory activity of specific microorganisms even when their total biomass is limited [99,100].
This research provides new insights into the critical drivers of RS across various land uses and seasons, advancing our understanding of carbon dynamics in arid environments. By identifying SWC, SOM, and MBC as the main controlling factors, this study offers valuable indicators for monitoring soil carbon dynamics under both natural and managed conditions. Future research should continue exploring how changing precipitation patterns, intensified land use, and industrial pollutants might interact to affect soil carbon fluxes, particularly under climate change scenarios. This knowledge will be essential for designing targeted interventions aimed at enhancing carbon sequestration in arid ecosystems, thereby contributing to global climate change mitigation efforts.
5. Conclusions
The findings of this study underscore the complex interplay between seasonal variations, land use practices, and soil characteristics in regulating soil respiration (RS) in arid ecosystems. The central role of soil water content (SWC) as the primary RS driver highlights the vulnerability of arid soils to changing rainfall patterns. Increased RS rates during the wet season and in managed lands point to elevated sensitivity to hydric inputs, which are likely intensified by agricultural and livestock practices. These results suggest that land management strategies have substantial implications for C cycling, especially in water-limited regions like northeastern Mexico, where land use change is accelerating.
The high RS rates observed in agricultural lands, driven by elevated soil organic matter (SOM) and microbial biomass carbon (MBC), highlight a dual role for land management in either exacerbating or mitigating soil carbon release. While intensive agricultural practices can amplify RS, potentially increasing CO2 emissions, practices aimed at conserving soil moisture and organic matter could help stabilize C storage. Our study also reveals that unmanaged or industrially influenced lands display markedly lower RS, potentially due to suppressed vegetation growth and microbial activity from pollution exposure. Our results confirm the fragility of CO2 dynamics to changes in land use in arid regions, highlighting the importance of resuming sustainable actions that help mitigate the increase in greenhouse gas emissions. This finding points to the need for further research into the ecological impacts of industrial activities and the varying management practices of agricultural sites on soil carbon dynamics and microbial communities in the region.
Supplementary Materials
The following supporting information can be downloaded at https://www.mdpi.com/article/10.3390/soilsystems9010012/s1, Figure S1. Principal Component Analysis (PCA) of soil nutrients sampled in arid lands with agricultural crops (AC), industrial influence (II), livestock farming (LF), natural shrublands (NS), and walnut orchards (WO) in Coahuila de Zaragoza, Mexico; Table S1. Contribution percentage and correlation coefficient of each analyzed nutrient in the principal component analysis; Table S2. Standardized Regression Weights of path analyses by land use for the dry season in Coahuila de Zaragoza, Mexico; Table S3. Standardized Regression Weights of path analyses by land use for the wet in Coahuila de Zaragoza, Mexico; Table S4. Model fit of Structural Equation Models presented in Figure 4 (Dry) and Figure 5 (Wet).
Author Contributions
Conceptualization, D.F.-R. and E.F.C.; methodology, E.F.C., G.G.-C., R.J.-A., and D.F.-R.; software, E.F.C. and D.F.-R.; validation, E.F.C. and D.F.-R.; formal analysis, E.F.C. and D.F.-R.; investigation, D.F.-R. and E.F.C.; resources, D.F.-R.; data curation, E.F.C.; writing—original draft preparation, E.F.C.; writing—review and editing, E.F.C., G.G.-C., R.J.-A., and D.F.-R.; visualization, E.F.C. and D.F.-R.; supervision, D.F.-R. and E.F.C.; project administration, D.F.-R.; funding acquisition, D.F.-R. All authors have read and agreed to the published version of the manuscript.
Funding
This study was found by Fondo Sectorial CONACyT-INEGI, 289644, Mexico.
Institutional Review Board Statement
Not applicable.
Informed Consent Statement
Not applicable.
Data Availability Statement
The data that support the findings of this study are available from the corresponding author, DFR, upon reasonable request.
Acknowledgments
We would like to thank Fernando Ayala and Andres Torres-Gómez for their help in the field work. We also thank all owners who allowed the sampling.
Conflicts of Interest
The authors declare no conflicts of interest.
References
- Lal, R.; Monger, C.; Nave, L.; Smith, P. The role of soil in regulation of climate. Philos. Trans. R. Soc. B Biol. Sci. 2021, 376, 20210084. [Google Scholar] [CrossRef] [PubMed]
- Jobbágy, E.G.; Jackson, R.B. The vertical distribution of soil organic carbon and its relation to climate and vegetation. Ecol. Appl. 2000, 10, 423–436. [Google Scholar] [CrossRef]
- Ciais, P.; Sabine, C.; Bala, G.; Bopp, L.; Brovkin, V.; Canadell, J.; Chhabra, A.; DeFries, R.; Galloway, J.; Heimann, M.; et al. Carbon and Other Biogeochemical Cycles. In Climate Change 2013—The Physical Science Basis: Working Group I Contribution to the Fifth Assessment Report of the Intergovernmental Panel on Climate Change; Intergovernmental Panel on Climate Change, Ed.; Cambridge University Press: Cambridge, UK, 2014; pp. 465–570. [Google Scholar]
- Ahlström, A.; Raupach, M.R.; Schurgers, G.; Smith, B.; Arneth, A.; Jung, M.; Reichstein, M.; Canadell, J.G.; Friedlingstein, P.; Jain, A.K.; et al. The dominant role of semi-arid ecosystems in the trend and variability of the land CO2 sink. Science 2015, 348, 895. [Google Scholar] [CrossRef]
- Poulter, B.; Frank, D.; Ciais, P.; Myneni, R.B.; Andela, N.; Bi, J.; Broquet, G.; Canadell, J.G.; Chevallier, F.; Liu, Y.Y.; et al. Contribution of semi-arid ecosystems to interannual variability of the global carbon cycle. Nature 2014, 509, 600–603. [Google Scholar] [CrossRef]
- Zhang, L.; Xiao, J.; Zheng, Y.; Li, S.; Zhou, Y. Increased carbon uptake and water use efficiency in global semi-arid ecosystems. Environ. Res. Lett 2020, 15, 034022. [Google Scholar] [CrossRef]
- Lal, R. Carbon Sequestration in Dryland Ecosystems. Environ. Manag. 2004, 33, 528–544. [Google Scholar] [CrossRef] [PubMed]
- Bell, C.W.; Tissue, D.T.; Loik, M.E.; Wallenstein, M.D.; Acosta-Martinez, V.; Erickson, R.A.; Zak, J.C. Soil microbial and nutrient responses to 7 years of seasonally altered precipitation in a Chihuahuan Desert grassland. Glob. Change Biol. 2014, 20, 1657–1673. [Google Scholar] [CrossRef] [PubMed]
- Carbone, M.S.; Still, C.J.; Ambrose, A.R.; Dawson, T.E.; Williams, A.P.; Boot, C.M.; Schaeffer, S.M.; Schimel, J.P. Seasonal and episodic moisture controls on plant and microbial contributions to soil respiration. Oecologia 2011, 167, 265–278. [Google Scholar] [CrossRef]
- Tomar, U.; Baishya, R. Seasonality and moisture regime control soil respiration, enzyme activities, and soil microbial biomass carbon in a semi-arid forest of Delhi, India. Ecol. Process. 2020, 9, 50. [Google Scholar] [CrossRef]
- de Graaff, M.-A.; Throop, H.L.; Verburg, P.S.J.; Arnone, J.A.; Campos, X. A Synthesis of Climate and Vegetation Cover Effects on Biogeochemical Cycling in Shrub-Dominated Drylands. Ecosystems 2014, 17, 931–945. [Google Scholar] [CrossRef]
- Vargas, R.; Detto, M.; Baldocchi, D.D.; Allen, M.F. Multiscale analysis of temporal variability of soil CO2 production as influenced by weather and vegetation. Glob. Change Biol. 2010, 16, 1589–1605. [Google Scholar] [CrossRef]
- Roby, M.C.; Scott, R.L.; Barron-Gafford, G.A.; Hamerlynck, E.P.; Moore, D.J.P. Environmental and Vegetative Controls on Soil CO2 Efflux in Three Semiarid Ecosystems. Soil Syst. 2019, 3, 6. [Google Scholar] [CrossRef]
- Salinas-Zavala, C.A.; Douglas, A.V.; Diaz, H.F. Interannual variability of NDVI in northwest Mexico. Associated climatic mechanisms and ecological implications. Remote Sens. Environ. 2002, 82, 417–430. [Google Scholar] [CrossRef]
- Luo, Y.; Zhou, X. Soil Respiration and the Environment; Academic Press: Cambridge, MA, USA, 2006. [Google Scholar]
- Barba, J.; Cueva, A.; Bahn, M.; Barron-Gafford, G.A.; Bond-Lamberty, B.; Hanson, P.J.; Jaimes, A.; Kulmala, L.; Pumpanen, J.; Scott, R.L.; et al. Comparing ecosystem and soil respiration: Review and key challenges of tower-based and soil measurements. Agric. For. Meteorol. 2018, 249, 434–443. [Google Scholar] [CrossRef]
- Bell, T.W.; Menzer, O.; Troyo-Diéquez, E.; Oechel, W.C. Carbon dioxide exchange over multiple temporal scales in an arid shrub ecosystem near La Paz, Baja California Sur, Mexico. Glob. Change Biol. 2012, 18, 2570–2582. [Google Scholar] [CrossRef]
- Berryman, E.M.; Barnard, H.R.; Adams, H.R.; Burns, M.A.; Gallo, E.; Brooks, P.D. Complex terrain alters temperature and moisture limitations of forest soil respiration across a semiarid to subalpine gradient. J. Geophys. Res. 2015, 120, 707–723. [Google Scholar] [CrossRef]
- Thomas, C.K.; Law, B.E.; Irvine, J.; Martin, J.G.; Pettijohn, J.C.; Davis, K.J. Seasonal hydrology explains interannual and seasonal variation in carbon and water exchange in a semiarid mature ponderosa pine forest in central Oregon. J. Geophys. Res. 2009, 114, 1–22. [Google Scholar] [CrossRef]
- Lai, L.; Zhao, X.; Jiang, L.; Wang, Y.; Luo, L.; Zheng, Y.; Chen, X.; Rimmington, G.M. Soil respiration in different agricultural and natural ecosystems in an arid region. PLoS ONE 2012, 7, e48011. [Google Scholar] [CrossRef]
- Phillips, C.L.; Nickerson, N. Soil Respiration. In Reference Module in Earth Systems and Environmental Sciences; Elsevier: Amsterdam, The Netherlands, 2015. [Google Scholar]
- Wang, B.; Zha, T.S.; Jia, X.; Wu, B.; Zhang, Y.Q.; Qin, S.G. Soil moisture modifies the response of soil respiration to temperature in a desert shrub ecosystem. Biogeosciences 2014, 11, 259–268. [Google Scholar] [CrossRef]
- Huxman, T.E.; Snyder, K.A.; Tissue, D.; Leffler, A.J.; Ogle, K.; Pockman, W.T.; Sandquist, D.R.; Potts, D.L.; Schwinning, S. Precipitation pulses and carbon fluxes in semiarid and arid ecosystems. Oecologia 2004, 141, 254–268. [Google Scholar] [CrossRef] [PubMed]
- Delgado-Balbuena, J.; Arredondo, J.T.; Loescher, H.W.; Pineda-Martínez, L.F.; Carbajal, J.N.; Vargas, R. Seasonal Precipitation Legacy Effects Determine the Carbon Balance of a Semiarid Grassland. J. Geophys. Res. 2019, 124, 987–1000. [Google Scholar] [CrossRef]
- de Sousa, J.R.L.; Silva, R.M.S.; dos Santos, E.S.; de Souza, E.S.; da Silva, J.E.O.; de Medeiros, É.V.; Medeiros, L.G.P.; Antonino, A.C.D.; Hammecker, C. Impacts of land-use changes on soil respiration in the semi-arid region of Brazil. Rev. Bras. De Cienc. Do Solo 2020, 44, e0200092. [Google Scholar] [CrossRef]
- Zhang, Y.; Guo, S.; Liu, Q.; Jiang, J.; Wang, R.; Li, N. Responses of soil respiration to land use conversions in degraded ecosystem of the semi-arid Loess Plateau. Ecol. Eng. 2015, 74, 196–205. [Google Scholar] [CrossRef]
- Ebrahimi, M.; Sarikhani, M.R.; Safari Sinegani, A.A.; Ahmadi, A.; Keesstra, S. Estimating the soil respiration under different land uses using artificial neural network and linear regression models. Catena 2019, 174, 371–382. [Google Scholar] [CrossRef]
- Guillen-Cruz, G.; Campuzano, E.F.; Juárez-Altamirano, R.; López-García, K.L.; Torres-Arreola, R.; Flores-Rentería, D. Interannual Variation and Control Factors of Soil Respiration in Xeric Shrubland and Agricultural Sites from the Chihuahuan Desert, Mexico. Land 2023, 12, 1961. [Google Scholar] [CrossRef]
- Meena, A.; Hanief, M.; Dinakaran, J.; Rao, K.S. Soil moisture controls the spatio-temporal pattern of soil respiration under different land use systems in a semi-arid ecosystem of Delhi, India. Ecol. Process. 2020, 9, 15. [Google Scholar] [CrossRef]
- Ma, K.; Zhang, Y.; Ruan, M.; Guo, J.; Chai, T. Land Subsidence in a Coal Mining Area Reduced Soil Fertility and Led to Soil Degradation in Arid and Semi-Arid Regions. Int. J. Environ. Res. Public Health 2019, 16, 3929. [Google Scholar] [CrossRef] [PubMed]
- Zhang, L.; Chen, Y.; Li, W.; Zhao, R. Seasonal variation of soil respiration under different land use/land cover in arid region. Sci. China Earth Sci. 2007, 50, 76–85. [Google Scholar] [CrossRef]
- Zhang, Y.; Zhao, W.; Fu, L.; Zhao, C.; Jia, A. Land use conversion influences soil respiration across a desert-oasis ecoregion in Northwest China, with consideration of cold season CO2 efflux and its significance. Catena 2020, 188, 104460. [Google Scholar] [CrossRef]
- Fekadu, G.; Adgo, E.; Meshesha, D.T.; Tsunekawa, A.; Haregeweyn, N.; Peng, F.; Mulualem, T.; Tsubo, M.; Tassew, A.; Masunaga, T.; et al. Spatiotemporal variations of soil respiration under different land uses and their control in Northwestern Ethiopia. Model. Earth Syst. Environ. 2024, 10, 1157–1169. [Google Scholar] [CrossRef]
- Owusu-Prempeh, N.; Amekudzi, L.K.; Kyereh, B. Assessment of soil carbon dioxide efflux from contrasting land uses in a semi-arid savannah ecosystem, northeastern Ghana (West Africa). Sci. Afr. 2024, 26, e02420. [Google Scholar] [CrossRef]
- Rabbi, S.M.F.; Tighe, M.; Cowie, A.; Wilson, B.R.; Schwenke, G.; McLeod, M.; Badgery, W.; Baldock, J. The relationships between land uses, soil management practices, and soil carbon fractions in South Eastern Australia. Agric. Ecosyst. Environ. 2014, 197, 41–52. [Google Scholar] [CrossRef]
- CONAFOR-UACh. Línea Base Nacional de Degradación de Tierras y Desertificación. Informe Final; Comisión Nacional Forestal y Universidad Autónoma Chapingo: Zapopan, Jalisco, Mexico, 2013. [Google Scholar]
- CICESE. CLICOM. Obtenido de Base de Datos Climatológica Nacional. Available online: http://cucapa-clicom-mex.cicese.mx (accessed on 30 January 2024).
- Food and Agriculture Organization of the United Nations. World Reference Base for Soil Resources 2015; FAO: Rome, Italy, 2015; Volume 106, p. 203. [Google Scholar]
- Encina-Domínguez, J.A.; Arévalo-Sierra, J.R.; Villarreal-Quintanilla, J.A.; Estrada-Castillón, E.A. Composition, structure and richness of vascular plants of the desert scrub in the north of Coahuila, Mexico. Bot. Sci. 2020, 98, 1–15. [Google Scholar] [CrossRef]
- Flores-Rentería, D.; Delgado-Balbuena, J.; Campuzano, E.F.; Curiel Yuste, J. Seasonal controlling factors of CO2 exchange in a semiarid shrubland in the Chihuahuan Desert, Mexico. Sci. Total Environ. 2023, 858, 159918. [Google Scholar] [CrossRef] [PubMed]
- Campuzano, E.F.; Delgado-Balbuena, J.; Flores-Renteria, D. Controlling factors of the ecosystem and soil respiration in a xeric shrubland in the Chihuahuan Desert, Mexico. Terra Latinoam. 2021, 39, e1251. [Google Scholar] [CrossRef]
- Heinemeyer, A.; Di Bene, C.; Lloyd, A.R.; Tortorella, D.; Baxter, R.; Huntley, B.; Gelsomino, A.; Ineson, P. Soil respiration: Implications of the plant-soil continuum and respiration chamber collar-insertion depth on measurement and modelling of soil CO2 efflux rates in three ecosystems. Eur. J. Soil Sci. 2011, 62, 82–94. [Google Scholar] [CrossRef]
- Gregorich, E.; Wen, G.; Voroney, R.; Kachanoski, R. Calibration of a rapid direct chloroform extraction method for measuring soil microbial biomass C. Soil Biol Biochem. 1990, 22, 1009–1011. [Google Scholar] [CrossRef]
- Lamptey, S.; Li, L.; Xie, J. Impact of nitrogen fertilization on soil respiration and net ecosystem production in maize. Plant Soil Environ. 2018, 64, 353–360. [Google Scholar] [CrossRef]
- Senthamarai Kannan, K.; Manoj, K.; Arumugam, S. Labeling Methods for Identifying Outliers. Int. J. Stat. Syst. 2015, 10, 231–238. [Google Scholar]
- Stekhoven, D.J.; Bühlmann, P. MissForest--non-parametric missing value imputation for mixed-type data. Bioinformatics 2012, 28, 112–118. [Google Scholar] [CrossRef] [PubMed]
- R-Core-Team. R: A Language and Environment for Statistical Computing, R 4.2.1; Scientific Research: Vienna, Austria, 2021. [Google Scholar]
- Gao, L.; Zhao, P.; Kang, S.; Li, S.; Tong, L.; Ding, R.; Lu, H. Surface soil water content dominates the difference between ecosystem and canopy water use efficiency in a sparse vineyard. Agric. Water Manag. 2019, 226, 105817. [Google Scholar] [CrossRef]
- Huang, N.; Wang, L.; Guo, Y.; Hao, P.; Niu, Z. Modeling Spatial Patterns of Soil Respiration in Maize Fields from Vegetation and Soil Property Factors with the Use of Remote Sensing and Geographical Information System. PLoS ONE 2014, 9, e105150. [Google Scholar] [CrossRef] [PubMed]
- Matías, L.; Castro, J.; Zamora, R. Effect of simulated climate change on soil respiration in a Mediterranean-type ecosystem: Rainfall and habitat type are more important than temperature or the soil carbon pool. Ecosystems 2012, 15, 299–310. [Google Scholar] [CrossRef]
- Vargas-Terminel, M.L.; Flores-Rentería, D.; Sánchez-Mejía, Z.M.; Rojas-Robles, N.E.; Sandoval-Aguilar, M.; Chávez-Vergara, B.; Robles-Morua, A.; Garatuza-Payan, J.; Yépez, E.A. Chronological dataset of soil respiration fluxes from a seasonally dry forest in Northwest México. Data Brief 2023, 51, 109716. [Google Scholar] [CrossRef] [PubMed]
- Curiel Yuste, J.; Flores-Rentería, D.; García-Angulo, D.; Hereş, A.-M.; Bragă, C.; Petritan, A.M.; Petritan, I.C. Cascading effects associated with climate-change-induced conifer mortality in mountain temperate forests result in hot-spots of soil CO2 emissions. Soil Biol. Biochem. 2019, 133, 50–59. [Google Scholar] [CrossRef]
- García-Camacho, R.; Iriondo, J.M.; Escudero, A. Seedling dynamics at elevation limits: Complex interactions beyond seed and microsite limitations. Am. J. Bot. 2010, 97, 1791–1797. [Google Scholar] [CrossRef]
- Maccallum, R.C.; Browne, M.W.; Sugawara, H.M. Power analysis and determination of sample size for covariance structure modeling. Phychol. Methods 1996, 1, 130–149. [Google Scholar] [CrossRef]
- Iriondo, J.M.; Albert, M.a.J.; Escudero, A. Structural equation modelling: An alternative for assessing causal relationships in threatened plant populations. Biol. Conserv. 2003, 113, 367–377. [Google Scholar] [CrossRef]
- Shipley, B. Cause and Correlation in Biology: A User’s Guide to Path Analysis, Structural Equations and Causal Inference; Cambridge University Press: Cambridge, UK, 2002; p. 332. [Google Scholar]
- Leon, E.; Vargas, R.; Bullock, S.; Lopez, E.; Panosso, A.R.; La Scala, N. Hot spots, hot moments, and spatio-temporal controls on soil CO2 efflux in a water-limited ecosystem. Soil Biol. Biochem. 2014, 77, 12–21. [Google Scholar] [CrossRef]
- Yu, S.; Mo, Q.; Chen, Y.; Li, Y.; Li, Y.; Zou, B.; Xia, H.; Jun, W.; Li, Z.; Wang, F. Effects of seasonal precipitation change on soil respiration processes in a seasonally dry tropical forest. Ecol. Evol. 2020, 10, 467–479. [Google Scholar] [CrossRef]
- Campos, A.C. Response of soil surface CO2–C flux to land use changes in a tropical cloud forest (Mexico). For. Ecol. Manag. 2006, 234, 305–312. [Google Scholar] [CrossRef]
- Covaleda, S.; Prat, C.; García-Oliva, F.; Etchevers, J.; Gallardo Lancho, J. Flujos de CO2 edáfico en un transecto de bosques de pino-encino afectados por actividad antrópica en la microcuenca de Atécuaro (Michoacán, Méjico). In Emisiones de Gases con Efecto Invernadero en Ecosistemas Iberoamericanos; Sociedad Iberoamericana de Física y Química Ambiental: Salamanca, Spain, 2009. [Google Scholar]
- Moyes, A.B.; Bowling, D.R. Interannual variation in seasonal drivers of soil respiration in a semi-arid Rocky Mountain meadow. Biogeochemistry 2013, 113, 683–697. [Google Scholar] [CrossRef]
- Han, G.; Sun, B.; Chu, X.; Xing, Q.; Song, W.; Xia, J. Precipitation events reduce soil respiration in a coastal wetland based on four-year continuous field measurements. Agric. For. Meteorol. 2018, 256–257, 292–303. [Google Scholar] [CrossRef]
- Du, Y.; Wang, Y.-P.; Hui, D.; Su, F.; Yan, J. Significant effects of precipitation frequency on soil respiration and its components—A global synthesis. Glob. Change Biol. 2023, 29, 1188–1205. [Google Scholar] [CrossRef] [PubMed]
- Doetterl, S.; Abramoff, R. Understanding Soil Organic Carbon Dynamics at Larger Scales; Burleigh Dodds Science Publishing: Cambridge, UK, 2022. [Google Scholar]
- Cueva, A.; Robles Zazueta, C.A.; Garatuza Payan, J.; Yépez, E.A. Soil respiration in Mexico: Advances and future directions. Terra Latinoam. 2016, 34, 253–269. [Google Scholar]
- Montaño, N.; Ayala, F.; Bullock, S.; Briones, O.; García Oliva, F.; García Sánchez, R.; Maya, Y.; Perroni, Y.; Siebe, C.; Tapia Torres, Y. Carbon stocks and fluxes in arid and semiarid ecosystems of Mexico: Synthesis and prospects. Terra Latinoam. 2016, 34, 39–59. [Google Scholar]
- Pontifes, P.A.; García-Meneses, P.M.; Gómez-Aíza, L.; Monterroso-Rivas, A.I.; Caso-Chávez, M. Land use/land cover change and extreme climatic events in the arid and semi-arid ecoregions of Mexico. Atmósfera 2018, 31, 355–372. [Google Scholar] [CrossRef]
- Villarreal-Quintanilla, J.; Encina-Domínguez, J.A. Plantas vasculares endémicas de Coahuila y algunas áreas adyacentes, México. Acta Botánica Mex. 2005, 70, 1–46. [Google Scholar] [CrossRef]
- Schimel, J.P. Life in Dry Soils: Effects of Drought on Soil Microbial Communities and Processes. Annu. Rev. Ecol., Evol. Syst. 2018, 49, 409–432. [Google Scholar] [CrossRef]
- Salazar, A.; Sulman, B.N.; Dukes, J.S. Microbial dormancy promotes microbial biomass and respiration across pulses of drying-wetting stress. Soil Biol. Biochem. 2018, 116, 237–244. [Google Scholar] [CrossRef]
- Dijkstra, F.A.; Carrillo, Y.; Pendall, E.; Morgan, J.A. Rhizosphere priming: A nutrient perspective. Front. Microbiol. 2013, 4, 216. [Google Scholar] [CrossRef] [PubMed]
- Yu, Y.; Zhao, C.; Zhao, Z.; Yu, B.; Zhou, T. Soil respiration and the contribution of root respiration of cotton (Gossypium hirsutum L.) in arid region. Acta Ecol. Sin. 2015, 35, 17–21. [Google Scholar] [CrossRef]
- Hernández-Becerra, N.; Tapia-Torres, Y.; Beltrán-Paz, O.; Blaz, J.; Souza, V.; García-Oliva, F. Agricultural land-use change in a Mexican oligotrophic desert depletes ecosystem stability. PeerJ 2016, 4, e2365. [Google Scholar] [CrossRef] [PubMed]
- Yáñez Díaz, I.; Silva, I.; González-Rodríguez, H.; Marmolejo, J.; Jurado, E.; Gómez-Meza, M. Soil respiration in four land use systems. Rev. Mex. Cienc. For. 2017, 8, 123–149. [Google Scholar]
- Chen, S.; Huang, Y.; Zou, J.; Shen, Q.; Hu, Z.; Qin, Y.; Chen, H.; Pan, G. Modeling interannual variability of global soil respiration from climate and soil properties. Agric. For. Meteorol. 2010, 150, 590–605. [Google Scholar] [CrossRef]
- Guillen-Cruz, G.; Rodríguez-Sánchez, A.L.; Fernández-Luqueño, F.; Flores-Rentería, D. Influence of vegetation type on the ecosystem services provided by urban green areas in an arid zone of northern Mexico. Urban For. Urban Green. 2021, 62, 127135. [Google Scholar] [CrossRef]
- Guillen-Cruz, G.; Torres-Arreola, R.; Sanchez-Mejia, Z.; Flores-Renteria, D. The effect of conventional and sustainable agricultural management practices on carbon and water fluxes in a Mexican semi-arid region. PeerJ 2022, 10, e14542. [Google Scholar] [CrossRef] [PubMed]
- Jardim, A.M.d.R.F.; Morais, J.E.F.d.; Souza, L.S.B.d.; Marin, F.R.; Moura, M.S.B.d.; Morellato, L.P.C.; Montenegro, A.A.d.A.; Ometto, J.P.H.B.; de Lima, J.L.M.P.; Dubeux Júnior, J.C.B.; et al. Sink or carbon source? how the Opuntia cactus agroecosystem interacts in the use of carbon, nutrients and radiation in the Brazilian semi-arid region. J. Hydrol. 2023, 625, 130121. [Google Scholar] [CrossRef]
- Wang, R.; Sun, Q.; Wang, Y.; Liu, Q.; Du, L.; Zhao, M.; Gao, X.; Hu, Y.; Guo, S. Temperature sensitivity of soil respiration: Synthetic effects of nitrogen and phosphorus fertilization on Chinese Loess Plateau. Sci. Total Environ. 2017, 574, 1665–1673. [Google Scholar] [CrossRef]
- Wang, R.; Wang, Z.; Sun, Q.; Zhao, M.; Du, L.; Wu, D.; Li, R.; Gao, X.; Guo, S. Effects of crop types and nitrogen fertilization on temperature sensitivity of soil respiration in the semi-arid Loess Plateau. Soil Till. Res. 2016, 163, 1–9. [Google Scholar] [CrossRef]
- McLauchlan, K. The Nature and Longevity of Agricultural Impacts on Soil Carbon and Nutrients: A Review. Ecosystems 2006, 9, 1364–1382. [Google Scholar] [CrossRef]
- Bilandžija, D.; Zgorelec, Ž.; Kisić, I. Influence of Tillage Practices and Crop Type on Soil CO2 Emissions. Sustainability 2016, 8, 90. [Google Scholar] [CrossRef]
- Flores-Rentería, D.; Rincón, A.; Valladares, F.; Curiel Yuste, J. Agricultural matrix affects differently the alpha and beta structural and functional diversity of soil microbial communities in a fragmented Mediterranean holm oak forest. Soil Biol. Biochem. 2016, 92, 79–90. [Google Scholar] [CrossRef]
- Raich, J.W.; Tufekciogul, A. Vegetation and soil respiration: Correlations and controls. Biogeochemistry 2000, 48, 71–90. [Google Scholar] [CrossRef]
- Bond-Lamberty, B.; Thomson, A. Temperature-associated increases in the global soil respiration record. Nature 2010, 464, 579–582. [Google Scholar] [CrossRef] [PubMed]
- Yvon-Durocher, G.; Caffrey, J.M.; Cescatti, A.; Dossena, M.; Giorgio, P.d.; Gasol, J.M.; Montoya, J.M.; Pumpanen, J.; Staehr, P.A.; Trimmer, M.; et al. Reconciling the temperature dependence of respiration across timescales and ecosystem types. Nature 2012, 487, 472–476. [Google Scholar] [CrossRef] [PubMed]
- Rey, A.; Pegoraro, E.; Oyonarte, C.; Were, A.; Escribano, P.; Raimundo, J. Impact of land degradation on soil respiration in a steppe (Stipa tenacissima L.) semi-arid ecosystem in the SE of Spain. Soil Biol. Biochem. 2011, 43, 393–403. [Google Scholar] [CrossRef]
- Tapia-Torres, Y.; Elser, J.J.; Souza, V.; García-Oliva, F. Ecoenzymatic stoichiometry at the extremes: How microbes cope in an ultra-oligotrophic desert soil. Soil Biol. Biochem. 2015, 87, 34–42. [Google Scholar] [CrossRef]
- Tapia-Torres, Y.; López-Lozano, N.E.; Souza, V.; García-Oliva, F. Vegetation-soil system controls soil mechanisms for nitrogen transformations in an oligotrophic Mexican desert. J. Arid Environ. 2015, 114, 62–69. [Google Scholar] [CrossRef]
- García Oliva, F.; Elser, J.; Souza, V. Ecosystem Ecology and Geochemistry of Cuatro Cienegas; Springer: Berlin, Germany, 2018. [Google Scholar]
- Toberman, H.; Evans, C.D.; Freeman, C.; Fenner, N.; White, M.; Emmett, B.A.; Artz, R.R.E. Summer drought effects upon soil and litter extracellular phenol oxidase activity and soluble carbon release in an upland Calluna heathland. Soil Biol. Biochem. 2008, 40, 1519–1532. [Google Scholar] [CrossRef]
- Zhou, X.; Zhang, Y. Temporal dynamics of soil oxidative enzyme activity across a simulated gradient of nitrogen deposition in the Gurbantunggut Desert, Northwestern China. Geoderma 2014, 213, 261–267. [Google Scholar] [CrossRef]
- Gülser, F.; Erdoğan, E. The effects of heavy metal pollution on enzyme activities and basal soil respiration of roadside soils. Environ. Monit. Assess. 2008, 145, 127–133. [Google Scholar] [CrossRef]
- Shaofei, J.; Wang, H. Relationships between soil pH and soil carbon in China’s carbonate soils. Fresenius Environ. Bull. 2018, 27, 605–611. [Google Scholar]
- Zhou, W.; Han, G.; Liu, M.; Li, X. Effects of soil pH and texture on soil carbon and nitrogen in soil profiles under different land uses in Mun River Basin, Northeast Thailand. PeerJ 2019, 7, e7880. [Google Scholar] [CrossRef]
- Moore, J.M.; Klose, S.; Tabatabai, M.A. Soil microbial biomass carbon and nitrogen as affected by cropping systems. Biol. Fertil. Soils 2000, 31, 200–210. [Google Scholar] [CrossRef]
- Yan, P.; Peng, H.; Yan, L.; Zhang, S.; Chen, A.; Lin, K. Spatial variability in soil pH and land use as the main influential factor in the red beds of the Nanxiong Basin, China. PeerJ 2019, 7, e6342. [Google Scholar] [CrossRef] [PubMed]
- Balogh, J.; Pintér, K.; Fóti, S.; Cserhalmi, D.; Papp, M.; Nagy, Z. Dependence of soil respiration on soil moisture, clay content, soil organic matter, and CO2 uptake in dry grasslands. Soil Biol. Biochem. 2011, 43, 1006–1013. [Google Scholar] [CrossRef]
- Grandy, A.S.; Strickland, M.S.; Lauber, C.L.; Bradford, M.A.; Fierer, N. The influence of microbial communities, management, and soil texture on soil organic matter chemistry. Geoderma 2009, 150, 278–286. [Google Scholar] [CrossRef]
- Kögel-Knabner, I.; Amelung, W. Soil organic matter in major pedogenic soil groups. Geoderma 2021, 384, 114785. [Google Scholar] [CrossRef]
Disclaimer/Publisher’s Note: The statements, opinions and data contained in all publications are solely those of the individual author(s) and contributor(s) and not of MDPI and/or the editor(s). MDPI and/or the editor(s) disclaim responsibility for any injury to people or property resulting from any ideas, methods, instructions or products referred to in the content. |
© 2025 by the authors. Licensee MDPI, Basel, Switzerland. This article is an open access article distributed under the terms and conditions of the Creative Commons Attribution (CC BY) license (https://creativecommons.org/licenses/by/4.0/).