Article

Spatial and Seasonal Patterns of Mercury Accumulation in Paddy Soil around Nam Son Landfill, Hanoi, Vietnam

1
Graduate School of Environmental and Symbiotic Sciences, Prefectural University of Kumamoto, 3-1-100 Tsukide, Higashi-ku, Kumamoto 862-8502, Japan
2
Faculty of Environmental and Symbiotic Sciences, Prefectural University of Kumamoto, 3-1-100 Tsukide, Higashi-ku, Kumamoto 862-8502, Japan
3
Research Center for Environmental and Clean Technology, Nasional Research and Innovation Agency, Kawasan Sains Teknologi BJ Habibie Gd.720, Setu, Tangerang Selatan 15314, Indonesia
4
Graduate School of Pharmaceutical Sciences, Kumamoto University, 5-1 Oe-honmachi, Chuo-Ku, Kumamoto 862-0973, Japan
*
Author to whom correspondence should be addressed.
Soil Syst. 2024, 8(1), 30; https://doi.org/10.3390/soilsystems8010030
Submission received: 29 January 2024 / Revised: 29 February 2024 / Accepted: 1 March 2024 / Published: 4 March 2024
(This article belongs to the Special Issue Mercury Biogeochemical Cycling in Soils and Sediments)

Abstract

:
Landfills have the potential to contribute to mercury (Hg) pollution, due to the burial of waste containing mercury. Mercury from domestic waste can enter the soil surrounding landfills through surface runoff and leachate. In this study, we assessed the levels of Hg in the paddy soil around the Nam Son landfill, the largest landfill in the North of Vietnam, during both rainy (September 2021) and dry (January 2022) seasons. The concentration of Hg was in the range of 20.5 to 79.7 μg/kg dry w.t. in Bac Son and Nam Son, and 16.6 μg/kg dry w.t. at a higher reference site. In most of the samples, the rainy season showed higher Hg concentrations than the dry season. Soil samples taken closer to the landfill exhibited higher levels of Hg contamination compared to those in more distant paddy areas, suggesting a decreasing trend of Hg concentration as one moves away from the pollution source. Additionally, Hg concentration was found to decrease vertically from the surface, with the higher value observed in the surface layer (0–5 cm), and the lower in the bottom layer (20–25 cm). The geo-accumulation index showed that all the sampling points were moderately to heavily polluted, indicating that Hg was lost from the waste source in the landfill. This study provides valuable insights into the spatial and vertical distribution of Hg pollution in the topsoil and highlights the importance of managing and assessing the risks of Hg-containing waste.

Graphical Abstract

1. Introduction

Mercury (Hg) emissions are an environmental pollution challenge globally, as mercury is a transboundary pollutant [1]. Unique among heavy metals, Hg exists in gaseous and liquid states under ambient conditions [2], allowing it to persist in the environment and undergo complex distribution processes [3]. In the presence of anaerobic soil environments and microorganisms, Hg can transform into methylmercury (MeHg) through biochemical cycling [4]. The US Environmental Protection Agency (EPA) classifies Hg as a Group D carcinogen, while MeHg is classified as a Group C carcinogen, with detrimental effects primarily observed in the central nervous symptoms and kidneys [5,6]. Individuals exposed to these substances may experience various symptoms, including language impairment, renal damage, tremors, sensory disturbance, unbalanced rigidity, and ataxia [7]. Consequently, on 10 October 2013, the United Nations Environment Program (UNEP) adopted the Minamata Convention on Mercury (“Mercury Convention”), to outline regulations and measures aimed at reducing global mercury emissions [8].
In recent years, the issue of Hg pollution caused by anthropogenic sources has gained significant attention, in addition to Hg emissions from natural sources. Globally, artisanal and small-scale gold mining (ASGM) has been identified as the largest contributor to Hg emission, followed by vinyl chloride monomer (VCM) production, measuring and control equipment, and dental applications [9]. However, in Vietnam, the primary sources of mercury emissions are associated with the use and disposal of Hg-containing products, waste incineration, waste burial, and wastewater treatment [10]. According to data on Vietnam’s sanitary landfills, there are 98 waste landfills operating nationwide, of which only 16 are considered sanitary landfills. Approximately 85% of urban and older towns still rely on unhygienic landfills where waste is not properly separated, leading to the burial of hazardous waste, including Hg-containing waste. The main contributing factor to this situation is the disposal of solid waste containing mercury such as skin care products [11], thermometers, lamps, batteries, watches, and switches [12], which enter landfills for treatment via the waste stream [13]. As a result, landfills in Vietnam have become potential sources of mercury pollution.
For extended periods of time, several studies have investigated the transfer and accumulation of Hg contamination originating from landfills. For instance, Tao et al., 2018, [14] examined the Hg and MeHg concentrations in soil at two landfills, Laogang and Jiangcunggou in China, and found the highest concentrations to be 0.169 ± 0.12 µg/g and 0.107 ± 0.08 ng/g, respectively. In Seoul, South Korea, Kim et al., 2001, [15] measured atmospheric Hg levels at the Nan-Ji-Do landfill ranging from 0.73 to 9.47 ng/m3. Hoai et al., 2021, [16] conducted a study at the Nam Son landfill and evaluated heavy metal concentrations in leachate samples, where they found Hg concentrations to be 0.0061 mg/L and 0.006 mg/L in March 2017 and March 2018, respectively; This concentration exceeded QCVN 40:2011/BTNMT National Technical Regulation on Industrial Wastewater. This landfill serves Hanoi city’s waste treatment needs, but the overloaded treatment facilities increase the potential for environmental pollution [16]. Such elevated levels of Hg in leachate raise concerns about its release into the environment through leachate [17] or dry and wet deposition [18]. Hence, it remains crucial to identify, characterize, and accurately estimate Hg emissions from landfill sources. This study focuses on the Nam Son landfill, the largest landfill in Northern Vietnam, where no clear data on Hg concentration in the agricultural soil surrounding the landfill currently exists. The aim of this study is to investigate Hg concentration in soil layers (0–5 and 20–25 cm) and determine the factors that affect mercury distribution, including geochemical properties such as the distance from landfill, weather conditions, and wind direction.

2. Materials and Methods
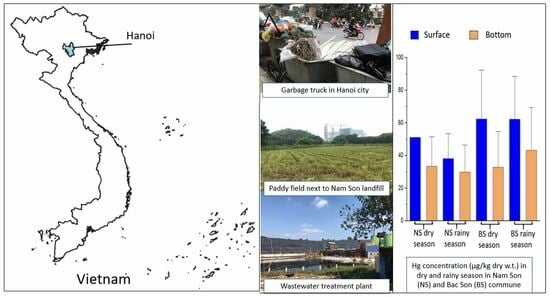
2.1. Sampling Sites

Sampling was conducted at the Nam Son landfill (Soc Son, Hanoi, 21°20′2″ N, 105°50′9″ E), situated in the Red River Delta (RRD), approximately 45 km north of Central Hanoi, Vietnam (Figure 1). The area experiences a subtropical humid monsoon climate with an average annual rainfall of 1670 mm and an annual mean air humidity of 84% [19]. The Nam Son landfill is located in the north of Vietnam; the climate here is distinctive, with cold winters and hot and humid summers. Northern Vietnam has a rainy season stretching from May to October and a dry season from November to April. As for the monsoon, from November to April, there is an active winter wind blowing in the northeast direction, and from May to October, there is an active summer monsoon blowing in the southwest and southeast directions. The Nam Son landfill is part of the Nam Son Waste Treatment Complex, originally covering an area of 83.5 hectares, with the landfill area occupying 53.49 hectares. The Nam Son landfill was initially designed to handle about 2000 tons of waste per day in 1999 (phase 1) but is currently receiving over 5000 tons/day, leading to consistent exceeding of its capacity [19]. Organic waste constitutes the largest portion of waste at the Nam Son landfill (51.9%), along with some inorganic waste such as plastic and nylon (3.0%), paper and carton (2.7%), leather and rubber (1.3%), metals (0.9%), glass (0.5%), inert matter (38.0%), and other materials (1.7%) [20]. In addition to the landfill, the Nam Son Waste Treatment Complex includes a newly operational (since July 2022) waste power plant and a wastewater treatment plant. However, the daily leachate volume of 2500 m3/day exceeds the wastewater treatment plant’s work capacity of 2150 m3/day [21]. As a result, the degradation of the geotextile layer, differences in water flow pressures, and the fissured rock environment create favorable conditions for the pollutants from landfilled wastes to leak into surface water and groundwater [19], causing environmental issues such as foul odors, ecological damage, and environment degradation.
An additional reference sampling site (Ref) was collected in Minh Phu, Soc Son, Hanoi, approximately 9 km away from the Nam Son landfill, in January 2023. This control site was chosen due to its distance from highways, factories, cities, and landfills.

2.2. Sample Collection

The field sampling campaigns for soil contamination around the Nam Son landfill were conducted in September 2021, during the rainy season, and January 2022, during the dry season. A total of 20 soil samples were collected, including duplicates, from two communes, Nam Son (NS1–NS5) and Bac Son (BS1–BS5), situated around the landfill. The sampling locations covered varying distances from the landfill, with some towards the south in the Nam Son commune and others towards the north in the Bac Son commune.
The soil samples were collected using a new stainless steel cylinder with a length of 45 cm and a diameter of 5 cm, thoroughly cleaned with ultrapure water (Milli-Q, Millipore, Burlington, MA, USA) and paper towels after each sampling. Two different layers of paddy soil, 0–5 cm (surface layer) and 20–25 cm (bottom layer), were sampled. The soil sampled was rice paddy soil; the depth of 25 cm from the surface is the topsoil layer that directly affects rice quality. Furthermore, we divided it into the surface layer (0–5 cm) and the bottom layer (20–25 cm) because the soil properties and organic matter composition of these two soil layers are different, which can lead to differences in Hg concentration. Each soil sample was labeled, stored in a polyethylene ziplock bag, and kept at 4 °C for transportation to the laboratory. The soil samples were dried at room temperature [22]. Subsequently, the dried samples were ground using a porcelain mortar and pestle and sifted through a 150 µm mesh size sieve to obtain finer particles. All the soil samples were stored in a −4 °C freezer until they were ready for analysis.

2.3. Sample Analysis

2.3.1. Hg Analysis

The Hg concentration in the soil samples was analyzed by direct thermal decomposition mercury analyzer (MA-3000, Nippon Instruments Corporation, Tokyo, Japan). Approximately 30 mg of each sample was weighed in triplicate and placed into sample boats, which were then loaded into the MA-3000. Calibration curves were generated using standard solutions of Hg2+ at concentrations of 10 µg/L, 100 µg/L, and 1000 µg/L for both low and high calibration curves.

2.3.2. pH Analysis

Soil pH measurements were performed using a pH meter (AS 800, AS ONE Corporation, Osaka, Japan) in triplicate. Approximately 2 g of each sample was weighed into 50 mL polypropylene tubes with screw caps. Then, 50 mL of ultrapure water (Milli-Q, Millipore, Burlington, MA, USA) was added to each tube, and the mixture was shaken for 5 min at a speed of 250 rpm [23].

2.3.3. Determination of SOM in Soil Sample

The soil organic material (SOM) content was estimated by measuring the percent loss on ignition, as described by Lewis et al., 2014 [24]. Approximately 1 g of soil sample was weighed into a ceramic crucible and subjected to burning at 550 °C for 4 h. Each sample was repeated three times. The percentage loss in weight (SOM) was calculated using Equation (1):
(W1 − W2)/ (W1 × 100%) = SOM (%)
where
  • W1: is the weight of the soil sample before burning;
  • W2: is the weight of the soil sample after burning.

2.4. Quality Assurance (QA) and Quality Control (QC)

During the laboratory analysis, stringent measures were taken to ensure a contamination-free environment. An ultra-clean bench was utilized, and all the water used had a high purity level of 18.2 MΩ⸱cm at 25 °C (Millipore, Burlington, MA, USA). Reagents of guaranteed purity (GR) were selected to avoid any contamination or ultra-low blanks.
To establish baseline measurements and guarantee the accuracy of the Hg analyses, additive B was employed as a blank. A comprehensive quality assurance and quality control program was implemented, incorporating method blanks, certified reference materials (CRM), specifically ERM-CC580 (Institute of Reference Materials Measurements, Belgium) for Hg, and triplicated samples. The obtained results from this method demonstrated excellent agreement with the reference values, with a mean value of 132 ± 3 mg/kg. The recovery rates for the certified reference materials ranged from 96.9% to 101.7% for the Hg analysis, and the relative standard deviations were consistently <5% for Hg.

2.5. Geo-Accumulation Index

The degree of soil contamination by Hg was assessed using the geo-accumulation index, calculated according to Equation (2), proposed by Muller et al., 1969 [25]:
Igeo = log2 CHg/1.5 × BHg
where
  • Igeo: geo-accumulation index for Hg;
  • CHg: Hg concentration in the soil (the average Hg concentration in each soil sample);
  • BHg: local Hg background (the Hg concentration (7.47 μg/kg dry w.t.) of the bottom layer from the reference sampling point [26]);
  • 1.5: the factor used to correct lithogenic effects.
The Igeo was divided into seven classes and was shown specifically in Table 1.

2.6. Statistical Analysis

The statistical analysis was conducted using IBM SPSS Statistics SPSS 26.0 software from IBM Corporation, New York, NY, USA. The Shapiro–Wilk test was used to assess whether the data might be well-described by a normal distribution. The Durbin–Watson statistic was used to diagnose the residuals of the linear regression of soil samples in both seasons, there is no autocorrelation. The linear regression analysis was applied between the Hg concentration and SOM and pH, and the significance of the coefficient of determination (R2) was confirmed using OriginLab 2023b (version 10.05) software. Then, Pearson’s analysis was applied to assess the correlation significance of the Hg concentration in the paddy soil relative to the distance to the landfill, between the dry season and the rainy season, and between the two layers (0–5 cm and 20–25 cm). Significance levels were determined based on p values, where values lower than 0.05 were considered statistically significant.

3. Results and Discussion

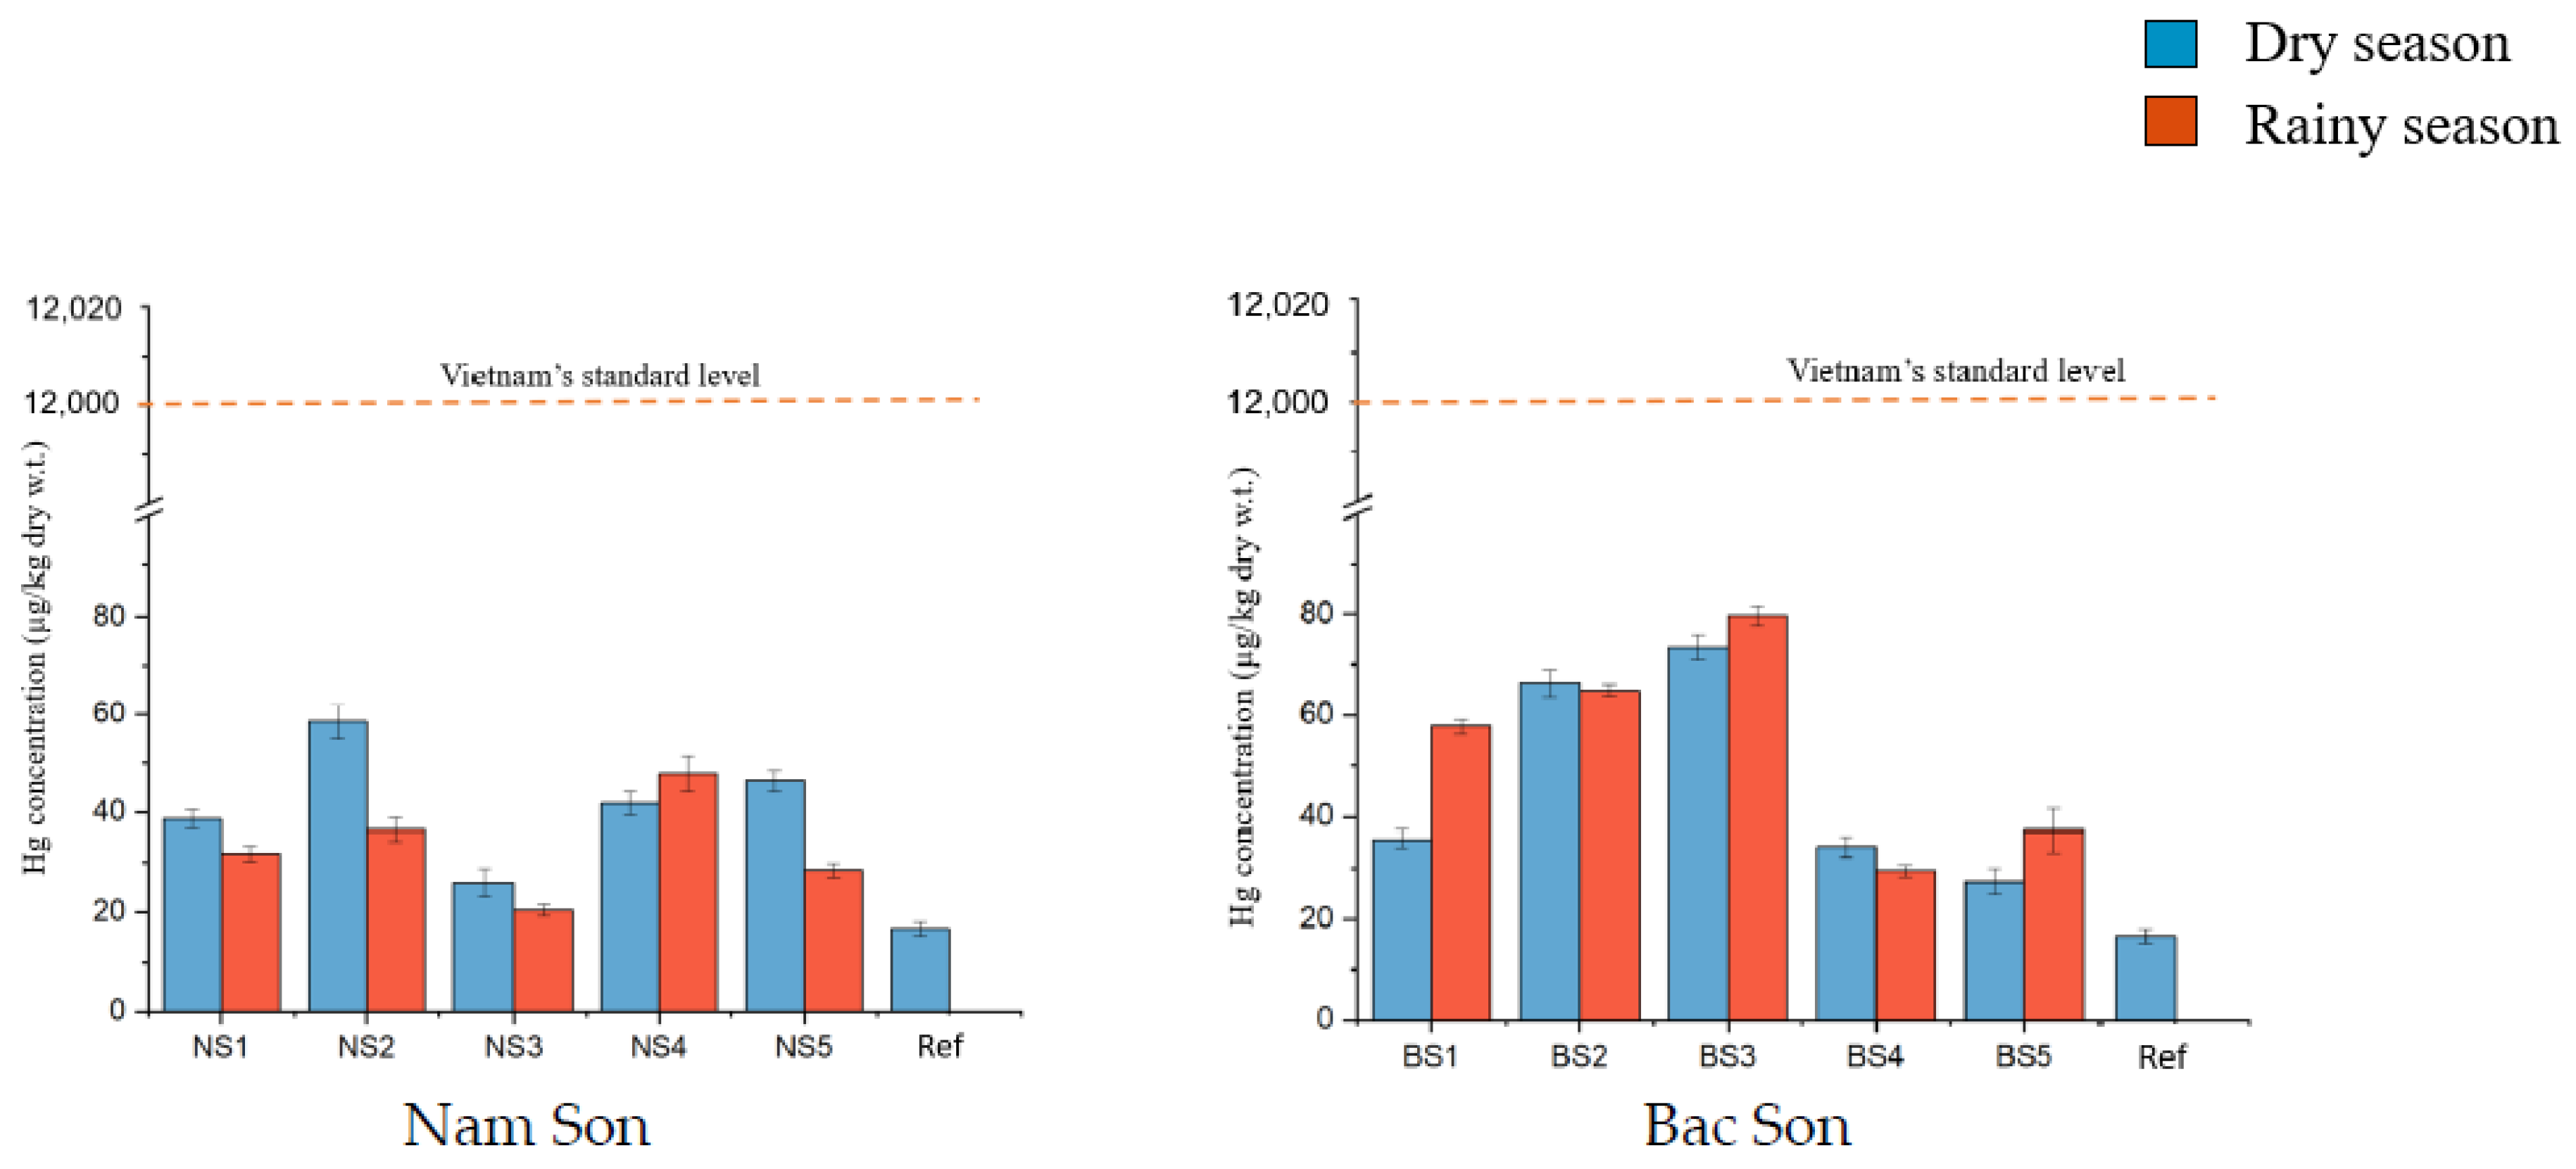
3.1. Hg Concentration in Soil

The concentration of Hg in the soil surrounding the Nam Son landfill area is shown in Figure 2. During the rainy season, Hg concentration ranged from 20.5 ± 1.22 to 47.7 ± 3.60 μg/kg dry w.t. in the Nam Son commune and 29.6 ± 1.19 to 79.7 ± 1.92 μg/kg dry w.t. in the Bac Son commune. In the dry season, the range was 26.0 ± 2.77 to 58.5 ± 3.52 μg/kg dry w.t. in the Nam Son commune and 27.5 ± 2.52 to 73.4 ± 2.51 μg/kg dry w.t. in the Bac Son commune. The average value of all the samples was 44.1 ± 2.20 μg/kg dry w.t., significantly higher than the reference sample concentration in the RRD (16.6 ± 1.48 μg/kg dry w.t.). However, it is important to note that the concentrations of Hg in all the soil samples remained below the standard Hg level for safe agriculture soil (12,000 µg/kg), as recommended by the Vietnamese government [27].
The highest Hg concentration of 78.9 ± 1.91 μg/kg dry w.t. was found in soil sample BS3 (January 2021), located 300 m from the landfill and situated across the Lai Son canal, indicating the direct effect of seepage through the landfill deposits [19]. Conversely, the lowest Hg concentration of 21.3 ± 1.92 μg/kg dry w.t. was observed in soil sample NS3 (September 2021), situated in the Nam Son commune. The difference was not statistically significant (p > 0.05) in the Hg concentrations between the dry and rainy seasons at both the Nam Son and Bac Son communes. However, in most of the samples, the rainy season showed higher Hg concentrations than the dry season. Research by He et al. conducted in the municipal solid waste (MSW) landfill in Nagasaki, Japan also reported the detection of T-Hg concentration in the soils ranged from 0.2270 to 2.9190 mg kg−1 dw (median: 1.1410 mg kg−1 dw) [28]. In addition, research by Wei et al. showed the release of Hg from landfills; the Hg concentration measured in the atmosphere at Shanghai Laogang MSW Landfill was recorded to reach 13.5–25.2 ng m−3 [29]. It indicated that when Hg MSW is buried in the landfill, it will be deposited as a long-term pollutant and can be released into the surrounding air, water, and soil through gas emissions and leachate from the landfill.
Figure 3 shows the correlation between Hg concentrations in the soil and the distance to the Nam Son landfill. A lower correlation was found in the topsoil at the Nam Son commune (R2 = 0.284, p < 0.05). The construction of the Nam Son garbage power plant near the south gate of the landfill from 2017 to 2022, along with the transport of construction materials, may have influenced the distribution of Hg in the southern area of the landfill. Conversely, a positive correlation of Hg concentrations in soil was observed in Bac Son (R2 = 0.799, p < 0.05), suggesting that Hg concentration tends to decrease with increasing distance from the landfill. This trend is in line with findings reported by Li et al., 2020, [30] who observed higher Hg concentrations closer to the pollution source of the Guizhou Organic Chemical Plant.
Most of the sampling points (NS1, NS2, NS3, NS5, BS2, BS3, and BS4) showed higher Hg concentrations in January compared to September, which can be attributed to the sampling time aligning with the dry season in the RRD in January and the rainy season in September [31]. During the rainy season, May to October, both irrigation and rainfall wet the soil surface, leading to increased total gaseous Hg emissions from the soil surface [32]. This is consistent with findings by Barletta et al., 2012, [33], who demonstrated that Hg loading in tropical estuaries is largely influenced by the rainfall regime.
Rice cultivation also affects Hg concentration; September is the harvest season, and Hg can be absorbed by rice plants [34]. Meanwhile, in January, when the soil was left idle before the growing season, the amount of Hg accumulated in the soil was higher.
In contrast, NS4 and BS1 exhibited a different pattern, with higher Hg concentrations in September compared to January. This difference is attributed to the influence of the Southwest Monsoon (SWM) on the Nam Son landfill during September, and the active Northeast Monsoon (NEM) during January 2022 [35,36]. Additionally, the southeasterly trade winds (STW) remain dominant and active year-round. Monsoons have been identified as the primary factor controlling the seasonal variation of total gaseous mercury [37], affecting the movement of Hg in the atmosphere and leading to changes in the accumulated Hg concentration in the soil.
The spatial and seasonal distribution of Hg concentration in the soil is influenced by various physical factors. Monsoons, precipitation regimes, and surface water irrigation movement play a significant role in affecting the distribution of Hg. Additionally, Hg depletion by distance is influenced by factors such as soil water retention and mercury adsorption, which are influenced by the organic carbon content, texture, and other soil properties. Soil mixing activities, such as plowing and tillage, also contribute to the spatial variation of Hg concentration in the soil [38].

3.2. Vertical Distribution of Hg Concentration

The vertical distribution of Hg concentration is shown in Table 2. In January 2022, the highest Hg concentration of 92.2 ± 2.55 μg/kg dry w.t. was observed in the surface layer at BS3, while the bottom layer of BS3 exhibited a lower Hg concentration of 54.6 ± 4.26 μg/kg dry w.t. This decreasing trend in Hg concentration with increasing soil depth was observed at all the sampling points during both January and September, including the Ref, NS1, NS2, NS3, NS4, BS1, BS2, BS3, BS4, and BS5. Additionally, there were significant differences (p < 0.05) in Hg concentrations between the surface and bottom layers during both dry and rainy seasons. These findings indicate that Hg was transported from the surface to the deeper layers, with the surface layer experiencing higher pollutant levels compared to deeper layers [39]. Similar results have been reported in other studies. Wang et al., 2021, [39] found a significant decreasing trend of Hg concentration from the surface to deeper layers in croplands in northern China. Bolaños-Álvarez et al., 2016, [26] observed a continuous increase in Hg concentrations from 15 cm depth to the surface in riverine sediments in Cuba. The distribution of Hg concentration decreasing with soil depth may attributed to the deposition of Hg from the atmosphere through dry and wet processes into the topsoil [40,41,42]. Wet deposition occurs through the fall of liquid phase compounds, including major precipitation events such as rainfall and snowfall. Dry deposition is caused by the settling or falling out of particles due to the influence of gravity, including the deposition of gas-phase compounds and particles too small to be affected by gravity.
Interestingly, the distribution of Hg concentrations at NS5 differed from the general pattern. These sampling points showed noticeably low Hg concentrations. In NS5, the higher Hg concentration was observed in the bottom layer during both September and January, with values of 36.2 ± 0.21 μg/kg dry w.t. and 51.4 ± 0.22 μg/kg dry w.t., respectively. In the RRD, farming activities involve processes like plowing, harrowing, fertilizing, and irrigation with contaminated water from the ditch network. The travel distance of water during irrigation events and the addition of biochar from burning rice straw in fields may also influence the Hg concentration [43,44]. It is possible that NS5 is a field where rice straw is not burned, leading to a larger vertical migration of Hg concentration in the soil compared to other fields. These farming activities and irrigation practices could have influenced the Hg concentration at NS5 during sampling time. In conclusion, the vertical distribution of Hg concentration in soil at NS5 appears to be affected by specific farming practices and irrigation, highlighting the complex interplay of factors influencing Hg distribution in the study area.

3.3. Effect of pH and SOM on Hg Concentration in Soils

The SOM and pH analyses were conducted due to their significance as key soil factors that might affect the availability and mobility of Hg in soils [45] because the content of Hg adsorbed into soil particles may increase or decrease depending on pH and SOM [46]. Hg in soil exists in many different forms, such as organic mercury (MeHg) or free ionic Hg2+, whereas if the soil pH is acidic, it will promote Hg to become soluble (Hg2+) and be easily absorbed. SOM has a high affinity for Hg and shows strong binding; it is a positive factor in Hg methylation in soil, thereby increasing Hg bioavailability to plants [47]. The soil pH ranged from 5.05 to 8.08, and integrating these results indicated that the agricultural soils in the sampling area are slightly acidic. These values were close to neutral pH and typical of the Eutric Fluvisols of the RRD. The SOM varied from 0.77 to 8.32%; the higher C levels observed at the top layer could be a result of irrigation using domestic wastewater with a high organic matter content [48].
The linear regression analysis conducted for both soil layers showed that there were significant correlations between the SOM and Hg concentrations in both the dry and rainy seasons (R2 = 0.723 and 0.575, respectively; p < 0.05) (Figure 4). The Durbin–Watson test was used to diagnose the residuals of the soil samples in both seasons, and the results suggest that there was no autocorrelation (d = 2.14 and d = 1.41 in the dry and rainy seasons, respectively). Thus, the SOM may play an important role in Hg accumulation. In contrast, the soil pH values had no correlations with the Hg concentrations in the soil (p > 0.05) (Figure 4). This result is consistent with another study [49], which indicated that pH had a minor or no significant effect on the accumulation of metals.

3.4. Geo-Accumulation (Igeo) in Soil

The Igeo index was calculated for each sampling point to assess the contamination level of mercury in the soil. Figure 5 shows the Igeo index of Hg in the soil layer at each sampling site in January 2022. For paddy soil around the Nam Son landfill, the Igeo values ranged from 1.2 to 2.7, categorizing it as moderately polluted to heavily polluted according to the geo-accumulation index.
The Igeo values for sampling sites in the Nam Son commune (NS1, NS3, and NS4) and the Bac Son commune (BS1, BS4, and BS5) ranged from 1.2 to 2.4 and 1.3 to 2.7, respectively, suggesting a moderately polluted category. On the other hand, higher Igeo values were observed for sampling sites in Nam Son (NS2 and NS5) and Bac Son (BS2 and BS3), indicating a greater influence from the landfill in the nearby area soil. This finding highlights the potential impact of the landfill on the soil in its surrounding area.

4. Conclusions

Based on the analysis results of soil samples in paddy fields around the Nam Son landfill in Hanoi, Vietnam, this study provides an initial report on the mercury accumulation in agricultural land around the landfill. The paddy fields selected in this study are contaminated with Hg through landfill operations. The geo-accumulation of Hg in paddy fields near landfills is significant. This can lead to a potential risk of Hg contamination in agricultural products grown in such areas. Therefore, strict control measures are needed in classifying and treating waste before it is buried.
The spatial and seasonal distribution of Hg in soil is influenced by physical factors such as monsoons and precipitation regimes. Heavy rainfall in the rainy season increases the evaporation of Hg, leading to the amount of Hg in the soil in the rainy season tending to be lower than in the dry season. SOM has a positive correlation with the amount of Hg in both soil layers (p < 0.05). While this study sheds light on Hg accumulation in agricultural soil around the Nam Son landfill, and the influence of SOM, monsoons, and precipitation regimes on the spatial distribution of Hg in the soil, it is important to note that these are just some of the means of Hg transport and accumulation in the soil. Thus, it is important to keep in mind that more detailed research is needed to further elucidate the factors affecting the distribution and accumulation of Hg in soil in this area, to understand in detail the impact mechanisms of soil properties on Hg accumulation, and then reduce the negative impact of Hg in soil.

Author Contributions

N.T.Q. was involved in conceptualization and methodology, carried out experimental works or investigations, and wrote the original draft; H.J. carried out investigations and data analysis; A.E. conducted data analysis; W.C.N. carried out experimental works; A.E. conducted data analysis; K.A. provided supervision and resources, and validated, reviewed, and edited the original draft; T.A. provided supervision and resources, and validated, reviewed, and edited the original draft; Y.I. was involved in conceptualization, supervision, resource provision, validation, review, and editing of the original draft and a major contributor to the writing of the manuscript. All authors have read and agreed to the published version of the manuscript.

Funding

This research work was supported by the Kumamoto Prefectural Government for International Postgraduate Scholarship for Research on Mercury and carried out in the Prefectural University of Kumamoto, Japan.

Institutional Review Board Statement

Not applicable.

Informed Consent Statement

Not applicable.

Data Availability Statement

The datasets used and/or analyzed in the current study are available from the corresponding author upon reasonable request.

Acknowledgments

The authors are grateful to the Kumamoto Prefectural Government, Japan, and the Prefectural University of Kumamoto, Japan, for their support, commitment, and dedication towards this course.

Conflicts of Interest

The authors declare no competing interests.

References

  1. Dziok, T.; Kołodziejska, E.K.; Kołodziejska, E.L. Mercury content in woody biomass and its removal in the torrefaction process. Biomass Bioenergy 2020, 143, 105832. [Google Scholar] [CrossRef]
  2. Luo, Q.; Ren, Y.; Sun, Z.; Li, Y.; Li, B.; Yang, S.; Zhang, W.; Hu, Y.; Cheng, H. Atmospheric mercury pollution caused by fluorescent lamp manufacturing and the associated human health risk in a large industrial and commercial city. Environ. Pollut. 2021, 269, 116146. [Google Scholar] [CrossRef]
  3. Xu, J.; Zhang, J.; Lv, Y.; Xu, K.; Lu, S.; Liu, X.; Yang, Y. Effect of soil mercury pollution on ginger (Zingiber officinale Roscoe): Growth, product quality, health risks and silicon mitigation. Ecotoxicol. Environ. Saf. 2020, 195, 110472. [Google Scholar] [CrossRef]
  4. Mergler, D.; Anderson, H.A.; Chan, L.H.M.; Mahaffey, K.R.; Murray, M.; Sakamoto, M.; Stern, A.H. Methylmercury exposure and health effects in humans: A worldwide concern. Ambio 2007, 36, 3–11. [Google Scholar] [CrossRef]
  5. Azevedo, B.F.; Furieri, L.B.; Pe, F.M.; Wiggers, G.A.; Vassallo, P.F.; Simões, M.R.; Fiorim, J.; de Batista, P.R.; Fioresi, M.; Rossoni, L.; et al. Toxic effects of mercury on the cardiovascular and central nervous systems. J. Biomed. Biotechnol. 2012, 2012, 949048. [Google Scholar] [CrossRef]
  6. Cariccio, V.L.; Samà, A.; Bramanti, P.; Mazzon, E. Mercury Involvement in Neuronal Damage and in Neurodegenerative Diseases. Biol. Trace Elem. Res. 2019, 187, 341–356. [Google Scholar] [CrossRef] [PubMed]
  7. Pérez-Vázquez, K.S.-V.F.J.; Ávila-García, I.P.; Méndez-Rodríguez, K.B.; Carrizalez-Yáñez, L.; Gavilán-García, A.; Vargas-Morales, J.M.; Van-Brussel, E.; Diaz-Barriga, F. A preliminary study on health impacts of Mexican mercury mining workers in a context of precarious employment. J. Trace Elem. Med. Biol. 2022, 71, 126925. [Google Scholar] [CrossRef]
  8. Liu, S.; Wang, X.; Guo, G.; Yan, Z. Status and environmental management of soil mercury pollution in China: A review. J. Environ. Manag. 2021, 277, 111442. [Google Scholar] [CrossRef] [PubMed]
  9. UN Environment. Global Mercury Supply, Trade and Demand. United Nations Environment Pro-Gramme, Chemicals and Health Branch; UN Environment: Geneva, Switzerland, 2017; Available online: https://www.unep.org/resources/report/global-mercury-supply-trade-and-demand (accessed on 28 January 2024).
  10. Hanoi. Minamata Convention Initial Assessment in Vietnam (Vietnam MIA Project); FINAL REPORT; The Global Environment Facility: Washington, DC, USA, 2017. [Google Scholar]
  11. Hamann, C.R.; Boonchai, W.; Wen, L.; Sakanashi, E.N.; Chu, C.; Hamann, K.; Hamann, C.P.; Sinniah, K.; Hamann, D. Spectrometric analysis of mercury content in 549 skin-lightening products: Is mercury toxicity a hidden global health hazard? J. Am. Acad. Dermatol. 2014, 70, 281–287.e3. [Google Scholar] [CrossRef] [PubMed]
  12. Horowitz, H.M.; Jacob, D.J.; Amos, H.M.; Streets, D.G.; Sunderland, E.M. Historical mercury releases from commercial products: Global environmental implications. Environ. Sci. Technol. 2014, 48, 10242–10250. [Google Scholar] [CrossRef] [PubMed]
  13. Tao, Z.; Dai, S.; Chai, X. Mercury emission to the atmosphere from municipal solid waste landfills: A brief review. Atmos. Environ. 2017, 170, 303–311. [Google Scholar] [CrossRef]
  14. Tao, Z.; Bian, R.; Chai, X. Methylmercury levels in cover soils from two landfills in Xi’an and Shanghai, China: Implications for mercury methylation potentials. Waste Manag. 2018, 78, 331–336. [Google Scholar] [CrossRef]
  15. Kim, K.-H.; Kim, M.-Y.; Lee, G. The soil–air exchange characteristics of total gaseous mercury from a large-scale municipal landfill area. Atmos. Environ. 2001, 35, 3475–3493. [Google Scholar] [CrossRef]
  16. Hoai, S.T.; Lan, H.N.; Viet, N.T.T.; Hoang, G.N.; Kawamoto, K. Characterizing seasonal variation in landfill leachate using leachate pollution index (LPI) at nam son solid waste landfill in Hanoi, Vietnam. Environments 2021, 8, 17. [Google Scholar] [CrossRef]
  17. Jabłońska-Trypuć, A.; Wydro, U.; Wołejko, E.; Pietryczuk, A.; Cudowski, A.; Leszczyński, J.; Rodziewicz, J.; Janczukowicz, W.; Butarewicz, A. Potential toxicity of leachate from the municipal landfill in view of the possibility of their migration to the environment through infiltration into groundwater. Environ. Geochem. Health 2021, 43, 3683–3698. [Google Scholar] [CrossRef] [PubMed]
  18. Sakata, M.; Marumoto, K. Wet and dry deposition fluxes of mercury in Japan. Atmos. Environ. 2005, 39, 3139–3146. [Google Scholar] [CrossRef]
  19. Giang, N.V.; Kochanek, K.; Vu, N.T.; Duan, N.B. Landfill leachate assessment by hydrological and geophysical data: Case study NamSon, Hanoi, Vietnam. J. Mater. Cycles Waste Manag. 2018, 20, 1648–1662. [Google Scholar] [CrossRef]
  20. The World Bank. Assessment of Management of Daily Waste and Hazardous Industrial Waste Options and Actions for Implementation of the National Strategy; The World Bank: Washington, DC, USA, 2018. (In Vietnamese) [Google Scholar]
  21. Hanoi Urban Environment Company (URENCO). Plan on Management and Operation of Nam Son Waste Disposal Area, from 2018–2020; Hanoi Urban Environment Company: Hanoi, Vietnam, 2018. [Google Scholar]
  22. Kodamatani, H.; Maeda, C.; Balogh, S.J.; Nollet, Y.H.; Kanzaki, R.; Tomiyasu, T. The influence of sample drying and storage conditions on methylmercury determination in soils and sediments. Chemosphere 2017, 173, 380–386. [Google Scholar] [CrossRef]
  23. Addai-Arhin, S.; Novirsa, R.; Jeong, H.H.; Phan, Q.D.; Hirota, N.; Ishibashi, Y.; Shiratsuchi, H.; Arizono, K. The human health risks assessment of mercury in soils and plantains from farms in selected artisanal and small-scale gold mining communities around Obuasi, Ghana. J. Appl. Toxicol. 2022, 42, 258–273. [Google Scholar] [CrossRef]
  24. Lewis, D.B.; Brown, J.A.; Jimenez, K.L. Effects of flooding and warming on soil organic matter mineralization in Avicennia germinans mangrove forests and Juncus roemerianus salt marshes. Estuar. Coast. Shelf Sci. 2014, 139, 11–19. [Google Scholar] [CrossRef]
  25. Muller, G. Index of geo-accumulation in sediments of the Rhine River. J. Geol. 1969, 2, 108–118. [Google Scholar]
  26. Bolaños-Álvarez, Y.; Alonso-Hernández, C.M.; Morabito, R.; Díaz-Asencio, M.; Pinto, V.; Gómez-Batista, M. Mercury contamination of riverine sediments in the vicinity of a mercury cell chlor-alkali plant in Sagua River, Cuba. Chemosphere 2016, 152, 376–382. [Google Scholar] [CrossRef] [PubMed]
  27. QCVN 03:2023/BTNMT; National Technical Regulation on Soil Quality. The Ministry of Natural Resources and Environment (MONRE): Hanoi, Vietnam, 2023. Available online: https://datafiles.chinhphu.vn/cpp/files/vbpq/2023/3/01-btnmt-qc03.pdf (accessed on 28 January 2024). (In Vietnamese)
  28. He, C.; Arizono, K.; Ji, H.; Yakushiji, Y.; Zhang, D.; Ishibashi, K.H.Y. Spatial distribution characteristics of mercury in the soils and native earthworms (Bimastos parvus) of the leachate-contaminated zone around a traditional landfill. Sci. Total Environ. 2018, 636, 1565–1576. [Google Scholar] [CrossRef] [PubMed]
  29. Zhu, W.; Li, Z.; Chai, X.; Hao, Y.; Lin, C.; Sommar, J.; Feng, X. Emission characteristics and air-surface exchange of gaseous mercury at the largest active landfill in Asia. Atmos. Environ. 2013, 79, 188–197. [Google Scholar] [CrossRef]
  30. Li, Q.; Tang, L.; Qiu, G.; Liu, C. Total mercury and methylmercury in the soil and vegetation of a riparian zone along a mercury-impacted reservoir. Sci. Total Environ. 2020, 738, 139794. [Google Scholar] [CrossRef] [PubMed]
  31. Raghavan, S.V.; Vu, M.T.; Liong, S.Y. Ensemble climate projections of mean and extreme rainfall over Vietnam. Glob. Planet. Chang. 2017, 148, 96–104. [Google Scholar] [CrossRef]
  32. Gabriel, M.C.; Williamson, D.G.; Brooks, S. Potential impact of rainfall on the air-surface exchange of total gaseous mercury from two common urban ground surfaces. Atmos. Environ. 2011, 45, 1766–1774. [Google Scholar] [CrossRef]
  33. Barletta, M.; Lucena, L.R.R.; Costa, M.F.; Barbosa-Cintra, S.C.T.; Cysneiros, F.J.A. The interaction rainfall vs. weight as determinant of total mercury concentration in fish from a tropical estuary. Environ. Pollut. 2012, 167, 1–6. [Google Scholar] [CrossRef]
  34. Meng, M.; Li, B.; Shao, J.; Wang, T.; He, B.; Shi, J.; Ye, Z.; Jiang, G. Accumulation of total mercury and methylmercury in rice plants collected from different mining areas in China. Environ. Pollut. 2014, 184, 179–186. [Google Scholar] [CrossRef]
  35. Loo, Y.Y.; Billa, L.; Singh, A. Effect of climate change on seasonal monsoon in Asia and its impact on the variability of monsoon rainfall in Southeast Asia. Geosci. Front. 2015, 6, 817–823. [Google Scholar] [CrossRef]
  36. Ashfold, M.J.; Latif, M.T.; Samah, A.A.; Mead, M.I.; Harris, N.R.P. Influence of Northeast Monsoon cold surges on air quality in Southeast Asia. Atmos. Environ. 2017, 166, 498–509. [Google Scholar] [CrossRef]
  37. Chen, L.; Liu, M.; Xu, Z.; Fan, R.; Tao, J.; Chen, D.; Zhang, D.; Xie, D.; Sun, J. Variation trends and influencing factors of total gaseous mercury inthe Pearl River Delta-A highly industrialised region in South China influenced by seasonal monsoons. Atmos. Environ. 2013, 77, 757–766. [Google Scholar] [CrossRef]
  38. Morosini, C.; Terzaghi, E.; Raspa, G.; Zanardini, E.; Anelli, S.; Armiraglio, S.; Petranich, E.; Covelli, S.; Guardo, A.D. Mercury vertical and horizontal concentrations in agricultural soils of a historically contaminated site: Role of soil properties, chemical loading, and cultivated plant species in driving its mobility. Environ. Pollut. 2021, 285, 117467. [Google Scholar] [CrossRef]
  39. Wang, C.; Wang, Z.; Gao, Y.; Zhang, X. Planular-vertical distribution and pollution characteristics of cropland soil Hg and the estimated soil–air exchange fluxes of gaseous Hg over croplands in northern China. Environ. Res. 2021, 195, 110810. [Google Scholar] [CrossRef] [PubMed]
  40. Yu, H.; Li, J.; Luan, Y. Meta-analysis of soil mercury accumulation by vegetables. Sci. Rep. 2018, 8, 1261. [Google Scholar] [CrossRef] [PubMed]
  41. Braaten, H.F.V.; de Wit, H.A. Effects of disturbance and vegetation type on total and methylmercury in boreal peatland and forest soils. Environ. Pollut. 2016, 218, 140–149. [Google Scholar] [CrossRef]
  42. Tomiyasu, T.; Komadatani, H.; Imura, R.; Matsuyama, A.; Miyamoto, J.; Akagi, H.; Kocman, D.; Kotnik, J.; Fajon, V.; Horvat, M. The dynamics of mercury near Idrija mercury mine, Slovenia: Horizontal and vertical distributions of total, methyl, and ethyl mercury concentrations in soils. Chemosphere 2017, 184, 244–252. [Google Scholar] [CrossRef]
  43. Liu, B.; Tian, K.; He, Y.; Hu, W.; Huang, B.; Zhang, X.; Zhao, L.; Teng, Y. Dominant roles of torrential floods and atmospheric deposition revealed by quantitative source apportionment of potentially toxic elements in agricultural soils around a historical mercury mine, Southwest China. Ecotoxicol. Environ. Saf. 2022, 242, 244–252. [Google Scholar] [CrossRef]
  44. Li, Y.; Zhang, F.; Yang, M.; Zhang, J.; Xie, Y. Impacts of biochar application rates and particle sizes on runoff and soil loss in small cultivated loess plots under simulated rainfall. Sci. Total Environ. 2019, 649, 1403–1413. [Google Scholar] [CrossRef]
  45. Yang, Y.-K.; Cheng, Z.; Shi, X.-J.; Tao, L.; Wang, D.-Y. Effect of organic matter and pH on mercury release from soils. J. Environ. Sci. 2007, 19, 1349–1354. [Google Scholar] [CrossRef]
  46. Chang, C.Y.; Yu, H.Y.; Chen, J.J.; Li, F.B.; Zhang, H.H.; Liu, C.P. Accumulation of heavy metals in leaf vegetables from agricultural soils and associated potential health risks in the Pearl River Delta, South China. Environ. Monit. Assess. 2014, 186, 1547–1560. [Google Scholar] [CrossRef]
  47. Natasha; Shahid, M.; Khalid, S.; Bibi, I.; Bundschuh, J.; Niazi, N.K.; Dumat, C. A critical review of mercury speciation, bioavailability, toxicity and detoxification in soil-plant environment: Ecotoxicology and health risk assessment. Sci. Total Environ. 2019, 711, 134749. [Google Scholar] [CrossRef]
  48. Duc, T.A.; Vachaud, G.; Bonnet, M.P.; Prieur, N.; Loi, V.D.; Anh, L.L. Experimental investigation and modelling approach of the impact of urban wastewater on a tropical river; a case study of the Nhue River, Hanoi, Viet Nam. J. Hydrol. 2007, 334, 347–358. [Google Scholar] [CrossRef]
  49. Bortey-Sam, N.; Nakayama, S.M.M.; Akoto, O.; Ikenaka, Y.; Fobil, J.N.; Baidoo, E.; Mizukawa, H.; Ishizuka, M. Accumulation of heavy metals and metalloid in foodstuffs from agricultural soils around Tarkwa area in Ghana, and associated human health risks. Int. J. Environ. Res. Public Health 2015, 12, 8811–8827. [Google Scholar] [CrossRef]
Figure 1. Map of sampling sites in Nam Son, Soc Son, Hanoi.
Soilsystems 08 00030 g001
Figure 2. Hg concentration in both soil sample layers in the Nam Son and Bac Son communes.
Soilsystems 08 00030 g002
Figure 3. Relationship between distance to the Nam Son landfill and Hg concentration in Nam Son and Bac Son.
Soilsystems 08 00030 g003
Figure 4. Relationships between SOM and pH, and Hg concentrations in both soil layers in dry and rainy seasons.
Soilsystems 08 00030 g004
Figure 5. Igeo (value and class) for each sampling point and distance to the landfill (m). In (a) Nam Son and (b) Bac Son.
Soilsystems 08 00030 g005
Table 1. The classes of Igeo.
Class 0Igeo ≤ 0Unpolluted
Class 10 < Igeo ≤ 1Unpolluted to moderately polluted
Class 21 < Igeo ≤ 2Moderately polluted
Class 32 < Igeo ≤ 3Moderately to heavily polluted
Class 43 < Igeo ≤ 4Heavily polluted
Class 54 < Igeo ≤ 5Heavily to extremely polluted
Class 65 < IgeoExtremely polluted
Table 2. Hg concentrations (μg/kg dry w.t.) in surface and bottom layers of soil samples in the Nam Son landfill.
Sampling PointHg Concentration in September 2021Hg Concentration in January 2022
Surface
(0–5 cm)
Bottom
(20–25 cm)
Surface
(0–5 cm)
Bottom
(20–25 cm)
Ref--25.8 ± 2.167.47 ± 0.80
NS134.9 ± 2.0429.7 ± 2.3349.7 ± 2.3327.5 ± 0.71
NS244.9 ± 0.4320.6 ± 0.4187.9 ± 9.2029.0 ± 2.08
NS326.3 ± 3.3116.2 ± 0.5434.2 ± 3.3717.9 ± 1.19
NS453.2 ± 3.8746.3 ± 3.9942.6 ± 2.5441.1 ± 1.88
NS530.7 ± 1.9936.2 ± 0.2141.1 ± 5.1751.4 ± 0.22
BS170.5 ± 0.9645.1 ± 2.2850.1 ± 3.1921.4 ± 0.79
BS265.8 ± 0.9458.6 ± 1.1284.9 ± 4.4147.7 ± 2.59
BS388.4 ± 3.5269.4 ± 0.3192.2 ± 2.5554.6 ± 4.26
BS433.0 ± 1.5024.2 ± 0.5738.4 ± 1.4730.4 ± 2.08
BS553.2 ± 5.4218.2 ± 1.8645.8 ± 1.999.23 ± 1.80
-: No sample.
Disclaimer/Publisher’s Note: The statements, opinions and data contained in all publications are solely those of the individual author(s) and contributor(s) and not of MDPI and/or the editor(s). MDPI and/or the editor(s) disclaim responsibility for any injury to people or property resulting from any ideas, methods, instructions or products referred to in the content.

