Article

A Historically Driven Spinup Procedure for Soil Carbon Modeling

1
Department of Plant Biology, University of Vermont, Burlington, VT 05405, USA
2
Department of Computer Science, University of Vermont, Burlington, VT 05405, USA
3
Gund Institute for Environment, University of Vermont, Burlington, VT 05405, USA
*
Author to whom correspondence should be addressed.
Soil Syst. 2023, 7(2), 35; https://doi.org/10.3390/soilsystems7020035
Submission received: 26 January 2023 / Revised: 27 March 2023 / Accepted: 30 March 2023 / Published: 12 April 2023

Abstract

:
Soil process models such as RothC typically assume soil organic carbon (SOC) is in equilibrium at the beginning of each simulation run. This is not likely to be true in the real world, since recalcitrant SOC pools (notably, humified material) take many decades to re-stabilize after a land use change. The equilibrium assumption stems from a spinup method in which the model is run under a single land use until all SOC pools stabilize. To overcome this, we demonstrate an alternative spinup procedure that accounts for historical land use changes. The “steady-state” and “historical” spinup methods both impute unknown C inputs such that the modeled SOC matches empirical measurements at the beginning of the simulation and set initial SOC fractions. Holding all other parameters equal, we evaluated how each spinup affects SOC projections in simulations of agricultural land use change in the U.S. state of Vermont. We found that projected SOC trajectories for all land use scenarios are sensitive to the spinup procedure. These differences are due to disparities in imputed below-ground plant-derived carbon between the two procedures. Compared to the steady-state, imputed C in the historical spinup is higher for land uses that increase SOC (e.g., adoption of regenerative practices) and lower for land uses that decrease SOC (e.g., a transition from pasture to crops), due to the time window within which land use changes are assumed to have occurred. The novel historical spinup procedure captures important dynamics commonly missing in previous studies, representing an advancement in soil process modeling.

1. Introduction

Topsoil is a major carbon (C) sink, holding over three-times the quantity of atmospheric C [1]. Modeling the flux of C between the soil and atmosphere can provide critical insights to mitigate anthropogenic climate change [2]. Models of soil organic carbon (SOC) can project how land management changes will affect SOC stocks over time. For example, soil process models show that regenerative agricultural practices and afforestation can store, or sequester, significant quantities of SOC [3,4]. On the other hand, land use changes such as clearing forests for agriculture cause large reductions in SOC [5,6,7]. However, obtaining reliable projections from soil process models requires two things: (a) that accurate parameterization data for climate, land use, and soil characteristics are incorporated and (b) that the model is initialized, or “spun up”, such that conditions at the beginning of a simulation mirror current empirical measurements [8,9].
We evaluated two possible spinup procedures for the Rothamsted carbon model (RothC) [8]. The first (“steady-state”) is considered the current best practice; however, it implicitly assumes each parcel of land has been in the same use throughout history [9]. The second (“historical”) is a novel method we developed that accounts for land use changes based on a review of historical data. In both cases, an iterative optimization algorithm aims to hit a target SOC value corresponding to empirical field measurements for a particular geographic location and land use. Both methods provide an imputed quantity of plant-derived C returned to the soil each month such that SOC converges on the real value and the fractional division of total SOC into each of the five pools within the model. We compared simulation runs projecting SOC under varying land use conditions initialized using each spinup procedure.

1.1. Existing RothC Spinup Procedures

Klumpp et al. [9] tested several methods of RothC initialization, validating each method against empirical time series SOC data. The authors identified three approaches used in the literature. The first approach is to use no spinup and, instead, begin the simulation with empirical SOC pool measurements, relying on exogenous estimates of monthly C inputs throughout the simulation. Second is the naive spinup approach, in which the model is run to equilibrium using estimated monthly C inputs, but the total SOC obtained at the end of the spinup is not validated against empirical measurements. The third approach, sometimes called the “inverse RothC” method, is an initialization in which assumed C inputs are adjusted iteratively until the modeled equilibrium total SOC corresponds to empirical measurements at the end of the spinup. This method was used in previous studies by Wiltshire and Beckage [3,4], as well as others [10,11].
The first two methods produce a poorer fit with empirical data than the third because they do not modify assumed C inputs, instead relying on exogenous estimates of C returned to the soil in the form of plant material and manure [9]. Often, a great deal more C input (presumably from unaccounted-for below-ground plant C) is required on top of what is initially estimated in order for the modeled SOC to converge to the empirically measured value.
Methods have also been proposed to initialize RothC without relying on a spinup procedure. One method uses empirically measured SOC fractions to assign initial SOC stocks within specific pools [12]. This method can produce good results in specific contexts, but it is limited to cases in which SOC fractions are known a priori. Another approach proposes using relatively simple pedotransfer functions to assign initial pool values in order to avoid the complexity of the equilibrium spinup process [13].
While the iterative spinup approach is generally considered to be the state-of-the-art, an inherent limitation is that this method implicitly assumes the simulation starts with SOC in an equilibrium state. During the spinup, the model is simply allowed to run with no annual change in either C input or climatological parameters for a very long period (perhaps 1000–10,000 years), sufficient for all SOC pools to fully stabilize. With this spinup procedure, if no changes in land management or climate occur in the simulation runs, SOC stocks will remain steady year-on-year.
In reality, this equilibrium assumption is likely very rare. Given the relatively recent history of massive changes to land use over the last century or so and the fact that certain SOC pools (notably, humified material) can take many decades to stabilize, it is more likely that SOC is currently either decreasing (for example, where previously forested land has been tilled) or increasing (for example, as forests naturally age or under regenerative agricultural practices). Capturing these dynamics requires an initialization approach that (a), at least in a general sense, accounts for historical land use changes and (b) mirrors the basic methodology of the iterative approach, that is adjusts the presumed C inputs by validating post-spinup SOC stocks against empirical data.

1.2. Objectives

In our previous studies [3,4], we used an initialization method similar to the iterative approach used by others [9,10,11]. While this provided good results, here, we explored an alternative spinup method that does not implicitly assume a history of consistent land use. Holding all other parameters equal, we compared the steady-state spinup approach to our novel historically driven procedure. We compared (a) the trajectory of SOC during the spinup runs, (b) the imputed C inputs to the soil under each approach for each land use, and (c) the effects these factors have on simulation runs in which agricultural land use may be either held constant or changed. We found that the simulation results were sensitive to the spinup type, even under the business-as-usual scenario, and comment on the importance of accounting for historical land use changes in SOC models. Finally, we note the limitations arising largely from the lack of fine-grained land use data available for our study area.

2. Materials, Methods, and Results

2.1. RothC Model

This study expanded on our previous SOC modeling methods [3,4]. We used a version of the RothC soil process model [8], ported to the R language [14]. Figure 1 shows the five SOC pools in RothC and the model’s input parameters. The details of the RothC model were given in [8]. The R code used in this experiment is in a public Github repository [15].
RothC is widely utilized and verified [10,16], but it has inherent limitations, including a narrow focus on soil carbon, the assumption that all precipitation infiltrates into the soil [17], no accounting for direct effects from tillage or short-term priming [18], and only the clay percent used to characterize the soil properties [8]. As in our previous studies [3,4], we assumed RothC’s default pool distributions of 59% DPM and 41% RPM for plant inputs; 49% DPM, 49% RPM, and 2% HUM for manure; the default decomposition rate constants for each pool; and the default topsoil depth of 30 cm.

2.2. Land Use History of the Study Area

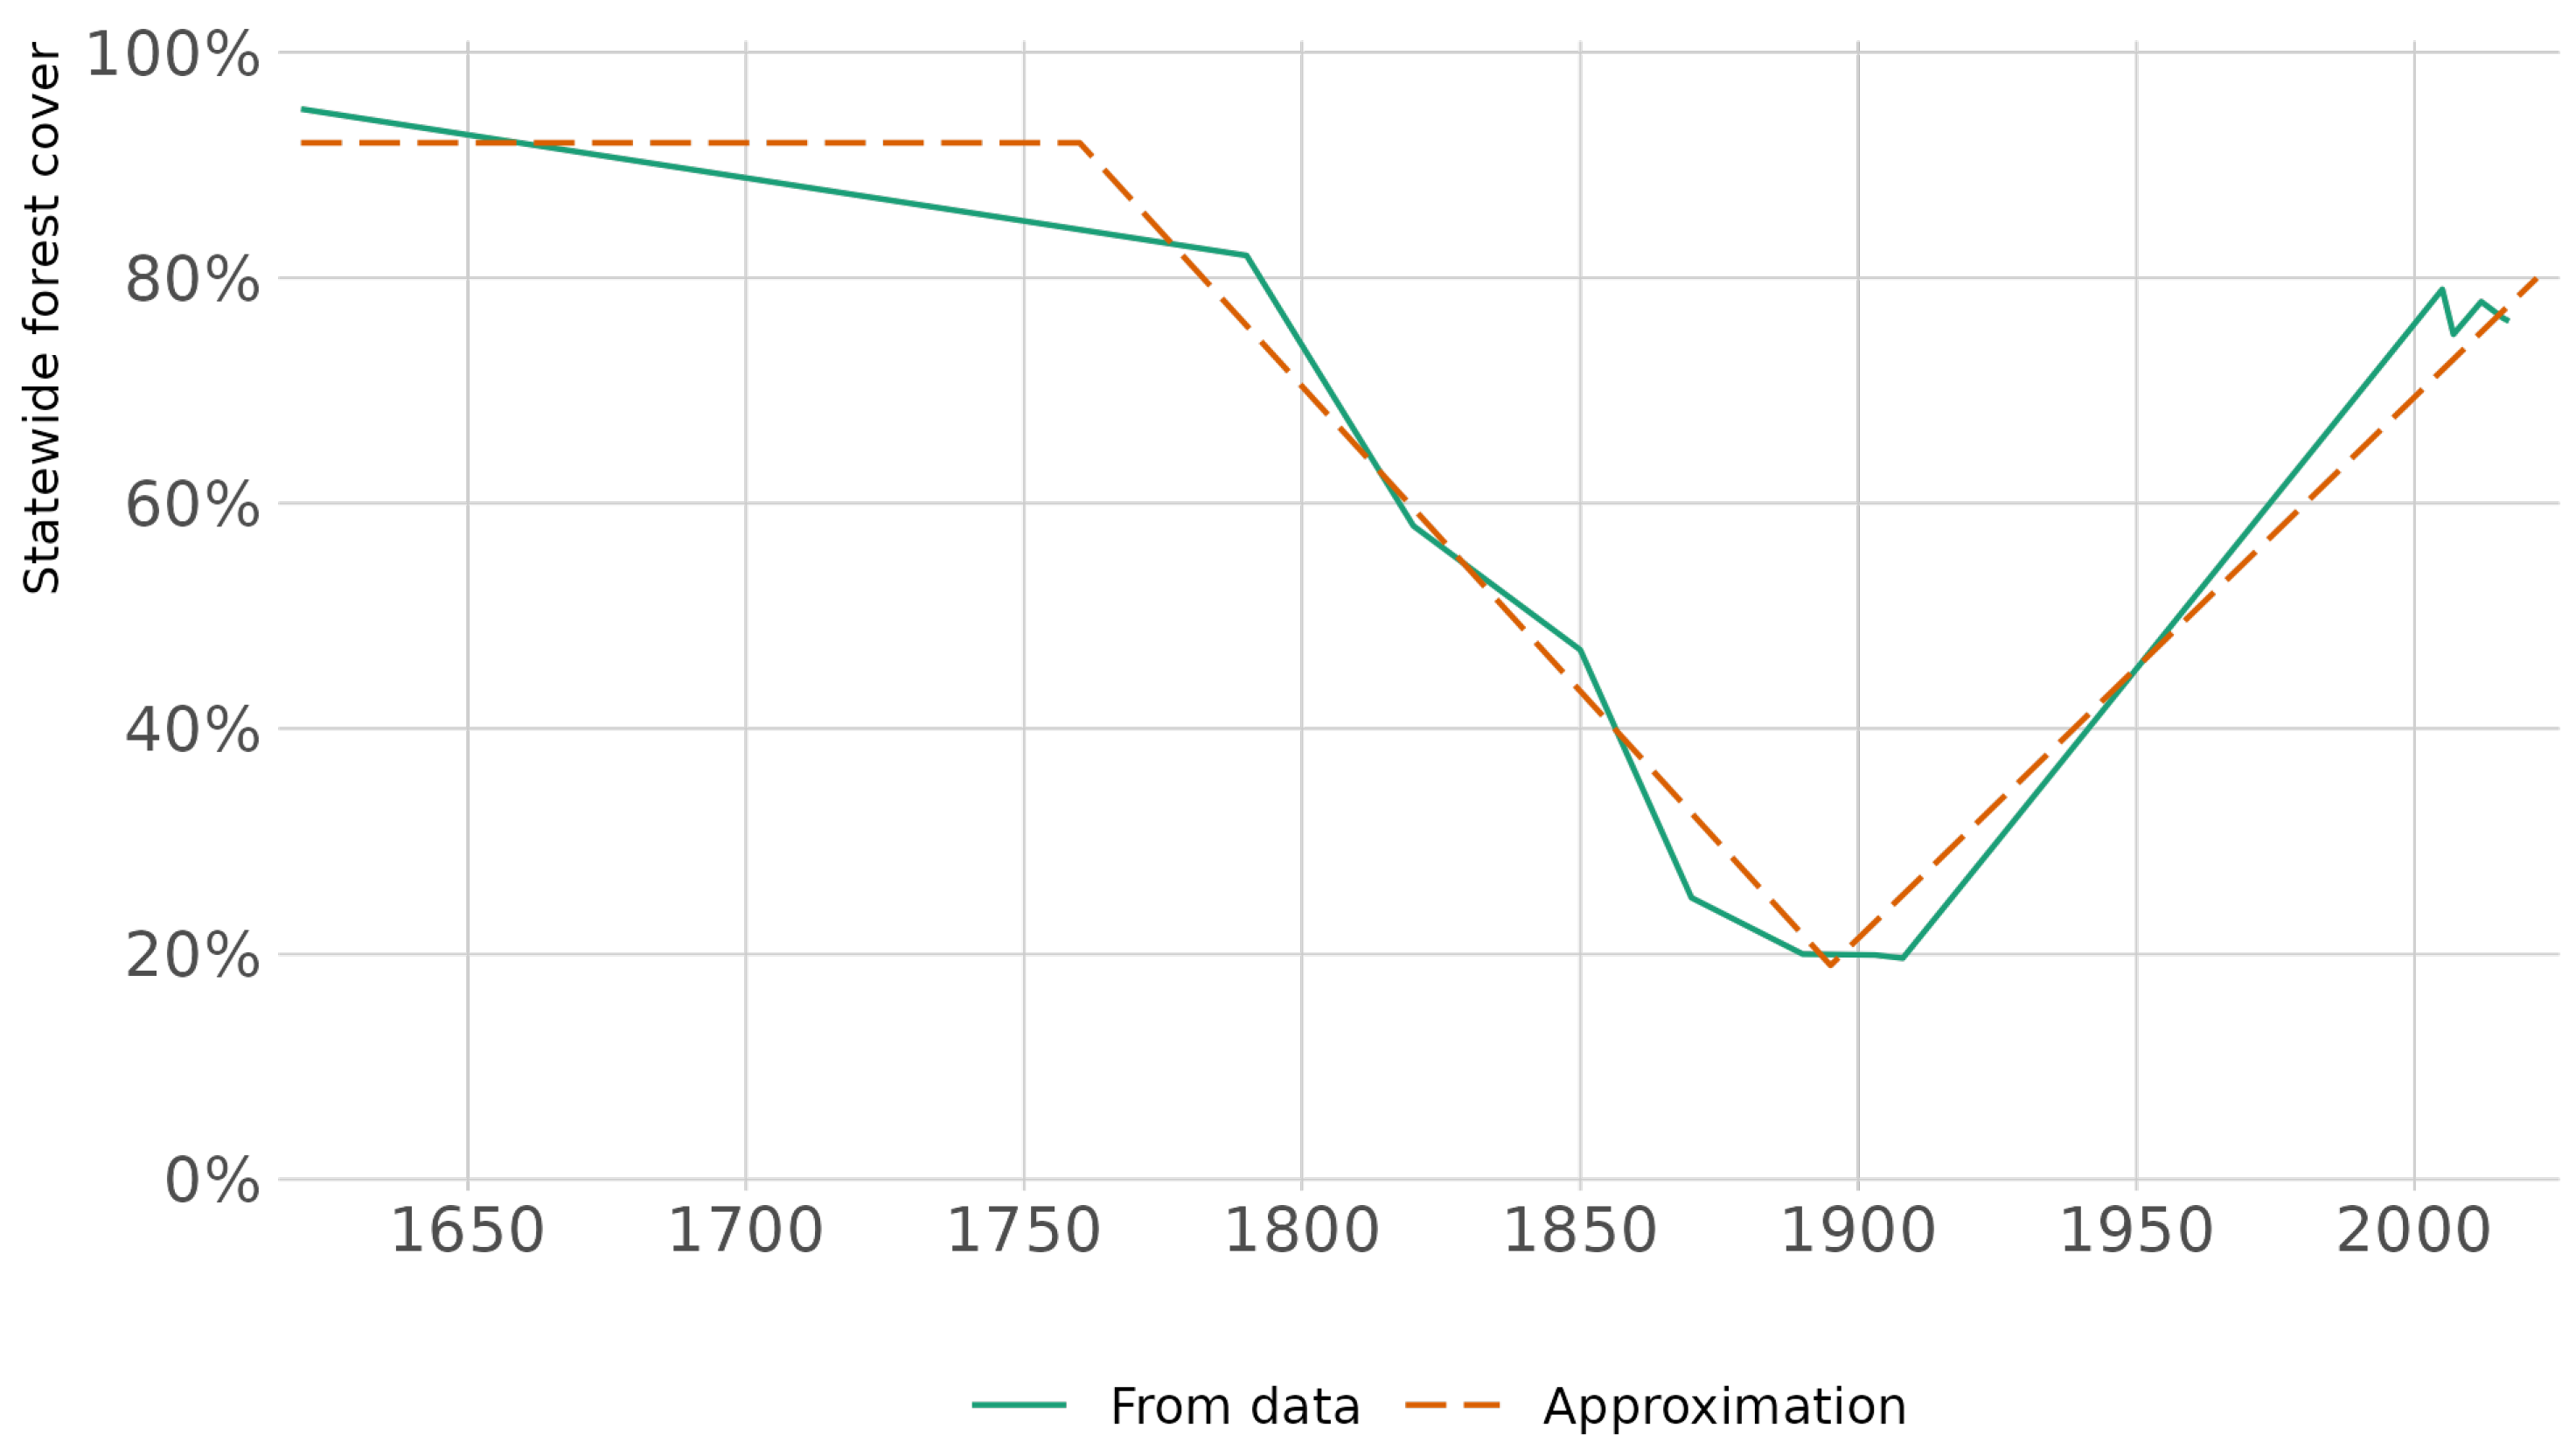
The first step in implementing a historical spinup is to construct an approximate timeline of Vermont’s land use trends. While historical land use data at a fine spatial and temporal scale are not available, there are a great deal of data in the historical literature on the approximate percent of forest cover at specific points in time (Table 1). We used these forest cover data, alongside other historical documents, as a proxy to indicate large-scale land use trends in Vermont.
For use in the model, we distilled the historical data into a simplified timeline of overarching trends. Before being widely settled by Europeans in the mid-1700s, Vermont was mostly forested. The period of 1760 to 1895 marked a mass reduction in forest cover across the state as trees were harvested for timber and the pasturing of sheep exploded in popularity [19,20,26,27]. By the turn of the 20th Century, the state was over 80% deforested. After this pasture boom, the land gradually transitioned to its current uses, which are primarily a mix of second-generation forest, pasture and hayland, and large-scale cropland (primarily for dairy cattle feed) [22,24,25]. Figure 2 shows the historical data from Table 1 in green and the approximation incorporated into the historical spinup in orange.

2.3. Data Sources and Curation

Primary data sources and curation methods for this study were obtained from our previous studies [3,4]. We divided the study area into 13 relatively homogeneous ecoregions using a protocol developed by the U.S. EPA [28]. The input parameters for climate and soil characteristics were averaged within each of these regions. Precipitation, evapotranspiration, and temperature data were from NOAA GHCN-D weather stations and NASA GLDAS remote sensing [29,30]. Soil characteristics were from the 2020 gSSURGO database [31]. For each ecoregion, the area in each major agricultural land use (crops, hay, and pasture) was calculated from the 2016 National Land Cover Database and 2017 Census of Agriculture [32,33].
Farm management parameters appropriate for each agricultural land use were codified in collaboration with local USDA Extension Service experts and a review of the literature [34,35]. SOC target values (in metric tonnes per hectare (t/Ha)) for each ecoregion were derived from an internal University of Vermont Soil Lab sampling dataset, stratified by crops, hay, and pasture, along with values from the literature for forest and regenerative agricultural practices [36,37,38,39,40,41,42]. The UVM Soil Lab does not attempt to correct for gravel content. A currently accepted revision of the van Bemmelen factor (0.5) was used to convert SOM%, as reported by the UVM Soil Lab, to SOC% [43]. Bulk density data from gSSURGO (g/cm3) were then used to convert SOC% to SOC (t/Ha), assuming the default RothC topsoil depth of 30 cm.

2.4. Evaluation of Spinup Procedures

We compared a common steady-state spinup method that implicitly assumes land use has not changed historically [3,4,9,10,11] against a novel historical spinup method that accounts for large-scale land use changes. We tested the spinups across all 13 ecoregions, using identical parameterization data for both methods. Figure 3 shows an example of how SOC in each pool in the model changes over time for each spinup type (for cropland, averaged across all ecoregions). The two procedures are described in detail below.

2.4.1. Steady-State Spinup

The steady-state spinup reflects the iterative procedure that is widely considered current good practice [3,4,9,10,11]. In the steady-state spinup, the assumed quantity of plant-based SOC we obtained was simply that which was required for the five SOC pools to reach equilibrium, assuming the land has always been in its current use. SOC began at zero, and the model was run for 1262 years (an arbitrary time frame sufficient for all pools to stabilize), using the estimates of above-ground monthly C inputs provided by extension experts. The spinup algorithm iteratively adjusts assumed additional monthly below-ground plant-derived C inputs and re-runs the model until SOC matches the empirical level corresponding to the ecoregion and land use at the end of the run. The levels of SOC in each pool become the conditions at  t 0  in the simulations, and the imputed plant-derived C inputs for each land use are stored and used in the appropriate simulation scenarios.

2.4.2. Historical Spinup

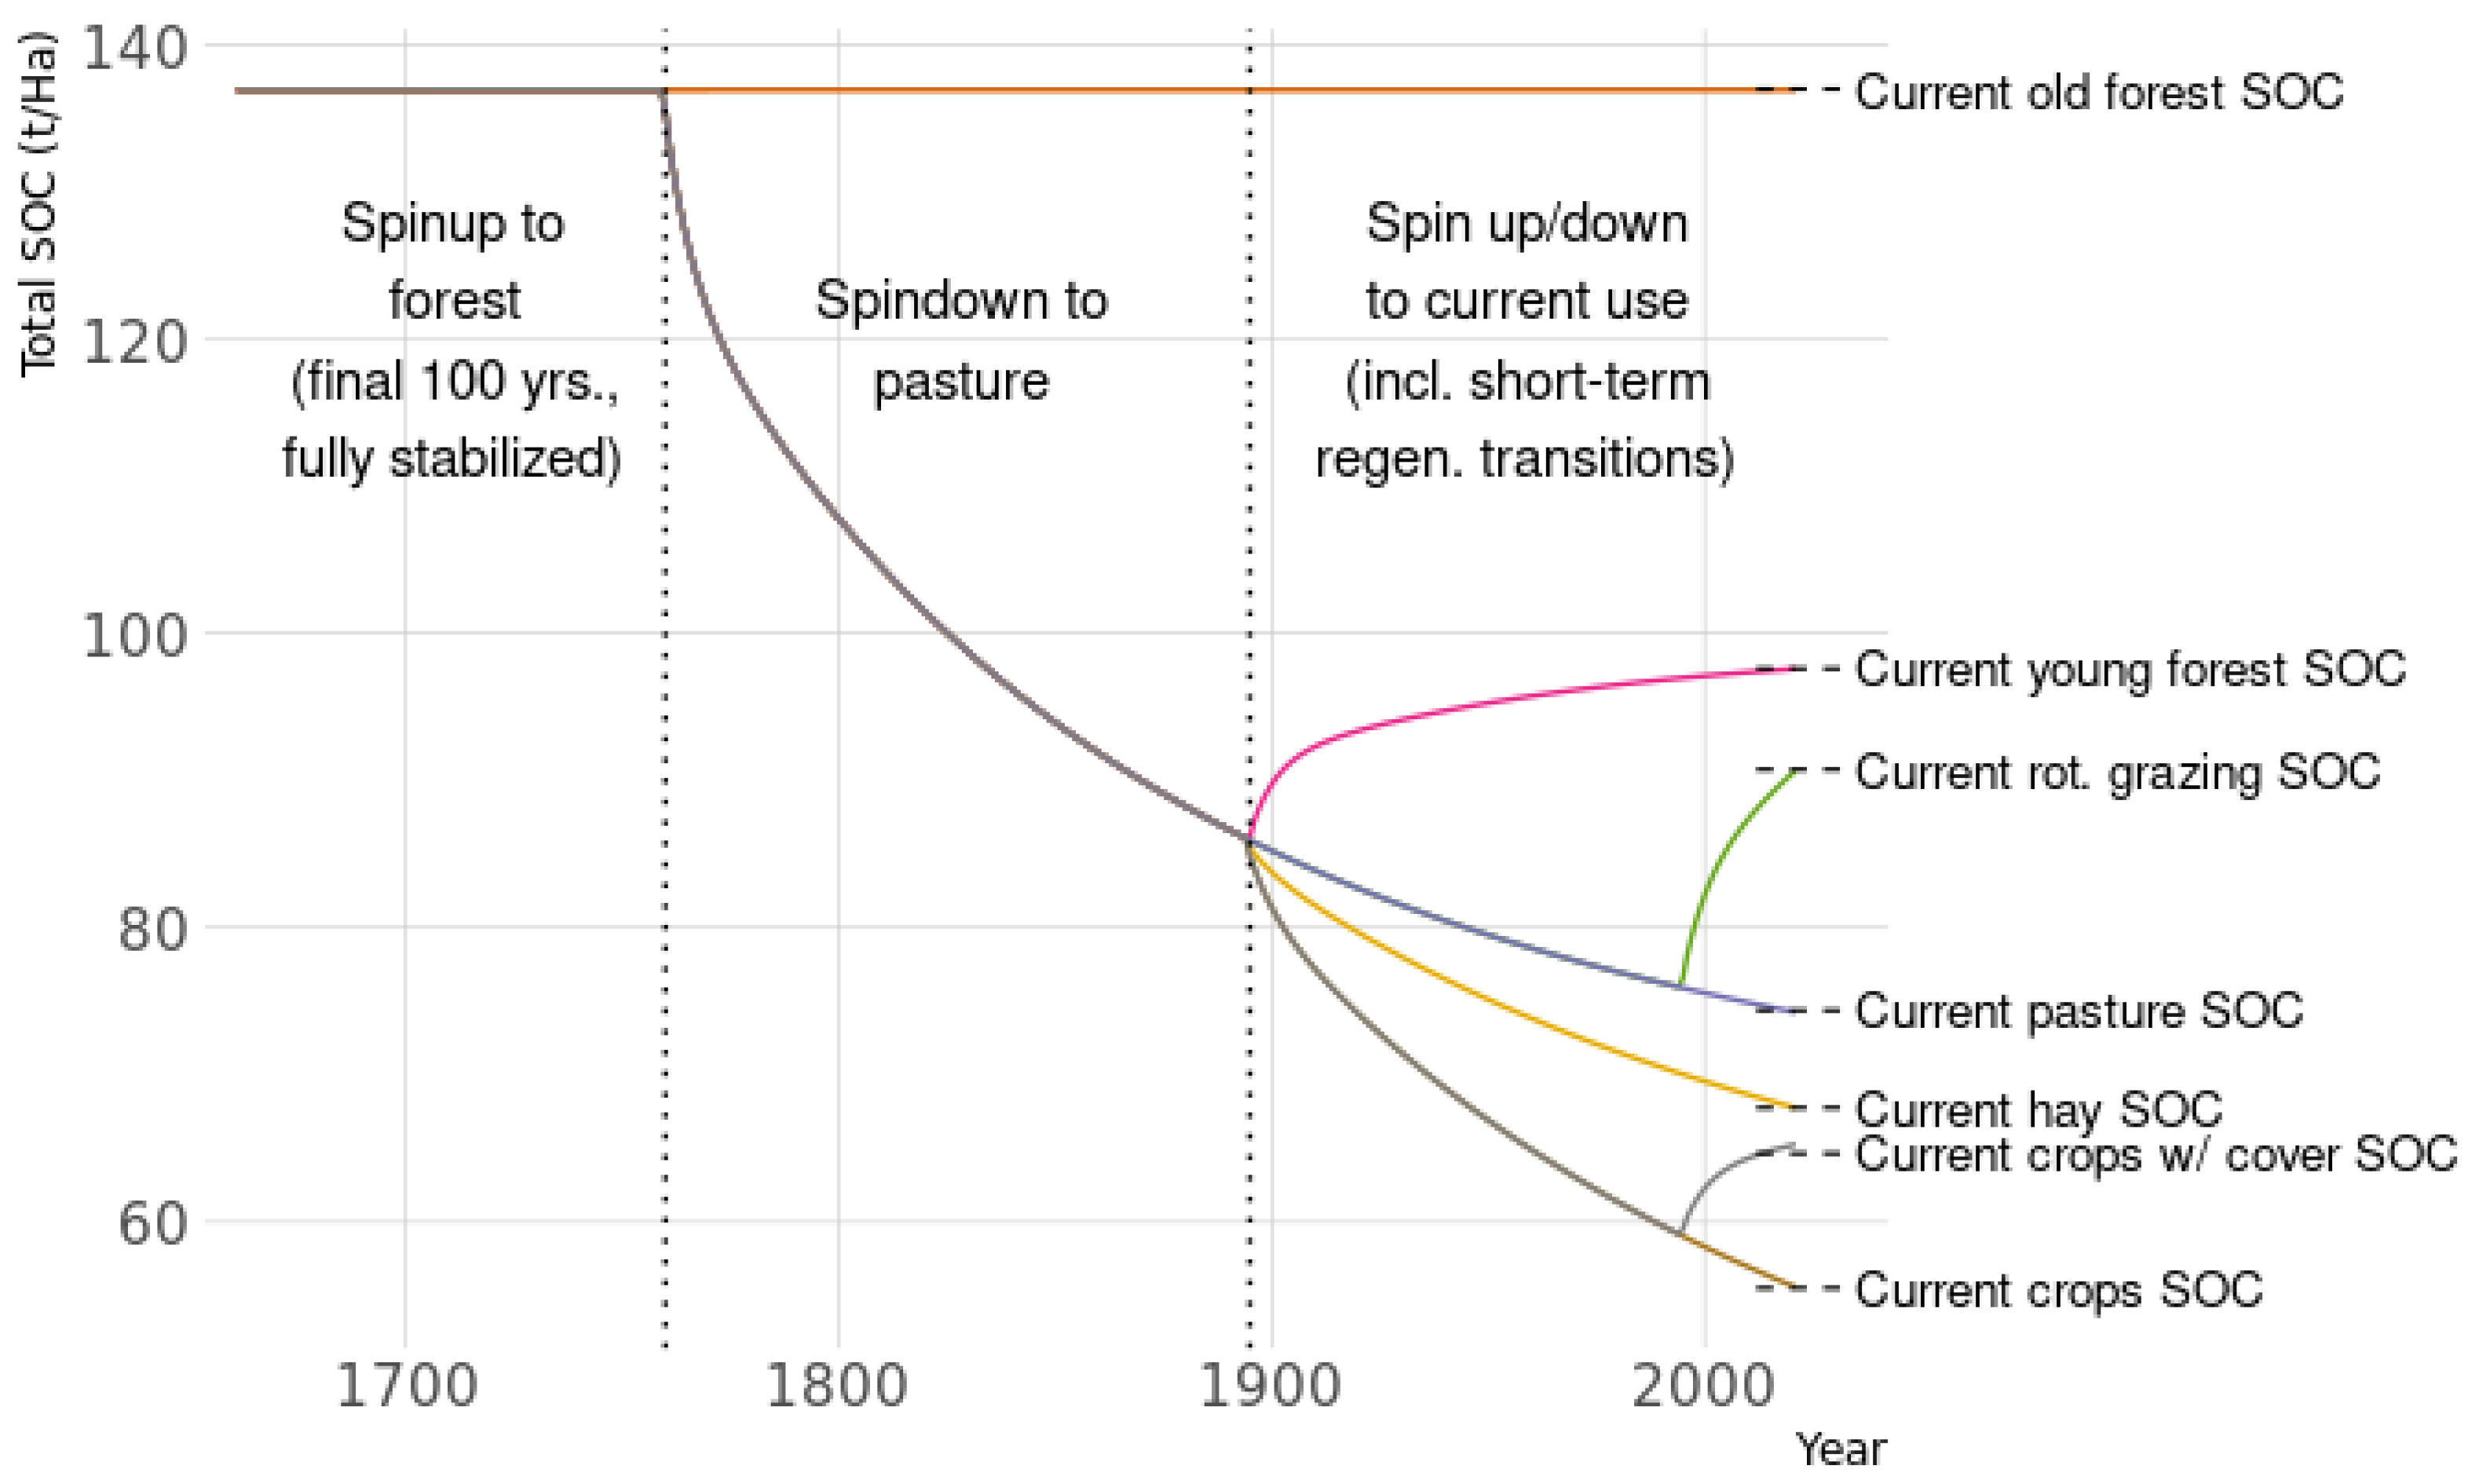
In the historical spinup, the procedure is divided into phases, reflecting the large-scale land use changes in the study area, shown in orange in Figure 2. For each phase—like in the steady-state spinup—we used an optimization process in which assumed below-ground plant C inputs are iteratively adjusted until the SOC in the model hits an empirical target at the end of the spinup. However, in this case, each phase of the spinup begins with SOC values derived from the imputed levels corresponding to the previous phase; the spinup phases are not necessarily long enough for SOC in all pools to stabilize (Figure 4). The phases of the historical spinup are described below.
The first phase (1661–1760) is simply a spinup to forest, which we ran for 750 years (sufficient for SOC in all pools to stabilize), at which point, the total SOC stock must equal empirical measurements for old growth forests. This allowed us to obtain the plant-derived C inputs for old growth forest, as well as the initial SOC stocks in each pool at the start of the next phase.
The second phase (1760–1895) reflects the 135-year transition of the vast majority of land in the study area from forest to pasture. We called this phase a “spindown”, since SOC is lost during the transition. In this phase, the SOC target is the empirical SOC stock found in pastures in the ecoregion. However, it is important to note that these empirically measured values represent the SOC stock of land that we assumed has continuously been in pasture since the 1760 deforestation date. Therefore, while this phase lasted only from 1760–1895, for the iterative optimization procedure, we must use the period from 1760–present. This allowed us to obtain the correct below-ground plant-derived SOC value that causes SOC to fall from forest levels to pasture levels over this 262 year period, as well as the SOC curves over this period.
The third phase (1895–2022) represents the transition from pasture to current land use over the last 127 years. The initial SOC stocks for this phase come from the second phase’s data, but not its final 2022 values. Instead, we began with the SOC stocks in 1895, 135 years after the transition from forest to pasture. At this point, the land was still transitioning; i.e., SOC stocks were somewhere between old-growth forest and current pasture levels. The algorithm finds the plant-derived C inputs necessary to cause stocks to change from these interim 1895 pasture SOC stocks to the SOC level associated with each land use in each ecoregion in 2022.
Finally, for the regenerative agriculture scenarios, a fourth sub-phase was employed (1990–2022). The assumption that the average transition from non-regenerative to regenerative practices occurred in 1990 is a rough estimate, but it serves to illustrate the methodology. In this phase, SOC stocks begin at the 1990 levels corresponding to the non-regenerative version of the applicable agricultural use (i.e., crops without cover cropping and continuous pasture). The model then imputes the necessary plant-derived C such that, over this 32-year period, SOC increases to the current measured values for the regenerative versions of these land uses (i.e., crops with cover cropping and rotational grazing, respectively).
One complication with our historical spinup procedure is that the inert organic matter (IOM) fraction in RothC is assumed to be static, set in advance using the Falloon method [44]. Since the historical spinup procedure has multiple phases, with total SOC changing between each, setting IOM in this way would cause unrealistic nonlinearities as stocks step up or down at each phase. We dealt with this by simply imposing a smooth linear transition between the IOM values associated with each phase (see the bottom panel of Figure 3, blue line). We acknowledge that this is a somewhat naive approach, but it helps to visualize and compare the two spinup types, which was the primary goal of this study.

2.4.3. Imputed C Inputs for Each Spinup

Unlike the steady-state spinup, the historical spinup SOC stocks in 2022 for each land use have not necessarily stabilized. This has profound implications for forward-looking SOC projections. Under the steady-state assumption, for example, if the land is currently in crops, and it stays in crops, by definition, its SOC will neither rise nor fall year-on-year. However, with the historical spinup, SOC is already falling year-on-year in 2022, since certain SOC pools—primarily humified matter—are still “catching up” from the historical transition from forest to pasture to crops.
The mechanism influencing these differences in projected SOC lies in the different imputed values for below-ground plant-derived C inputs generated by each spinup procedure. Figure 5 shows the total annual imputed C inputs for each land use, under each spinup type. C inputs for old-growth forest are identical between the two spinups, since under both methods, sufficient time is allowed for full stabilization. However, C inputs differ for the remaining land uses, primarily as a result of the limited time frame in which it is assumed SOC either accumulated or diminished under the historical approach. Because these imputed C input values are used to parameterize the simulation runs, these differences significantly affect the projected SOC stocks.

2.5. Simulation Results

To conduct the simulations, we ran the model twice for each permutation of the ecoregion, agricultural land use, and scenario, comparing the steady-state to the historical spinup, while holding all other parameters equal. The simulations began in 2022 and were run for 100 years. At the start of each simulation, agricultural land was assumed to be in one of three uses: crops, hay, or pasture. We ran six experimental scenarios: (a) business-as-usual, in which all agricultural land maintains its current use; (b) transition of all farmland to conventional crops (i.e., cattle feed corn); (c) full transition to cropping systems using cover crops; (d) full transition to conventional pasture; (e) full transition to rotationally grazed pasture; (f) full transition to forest.
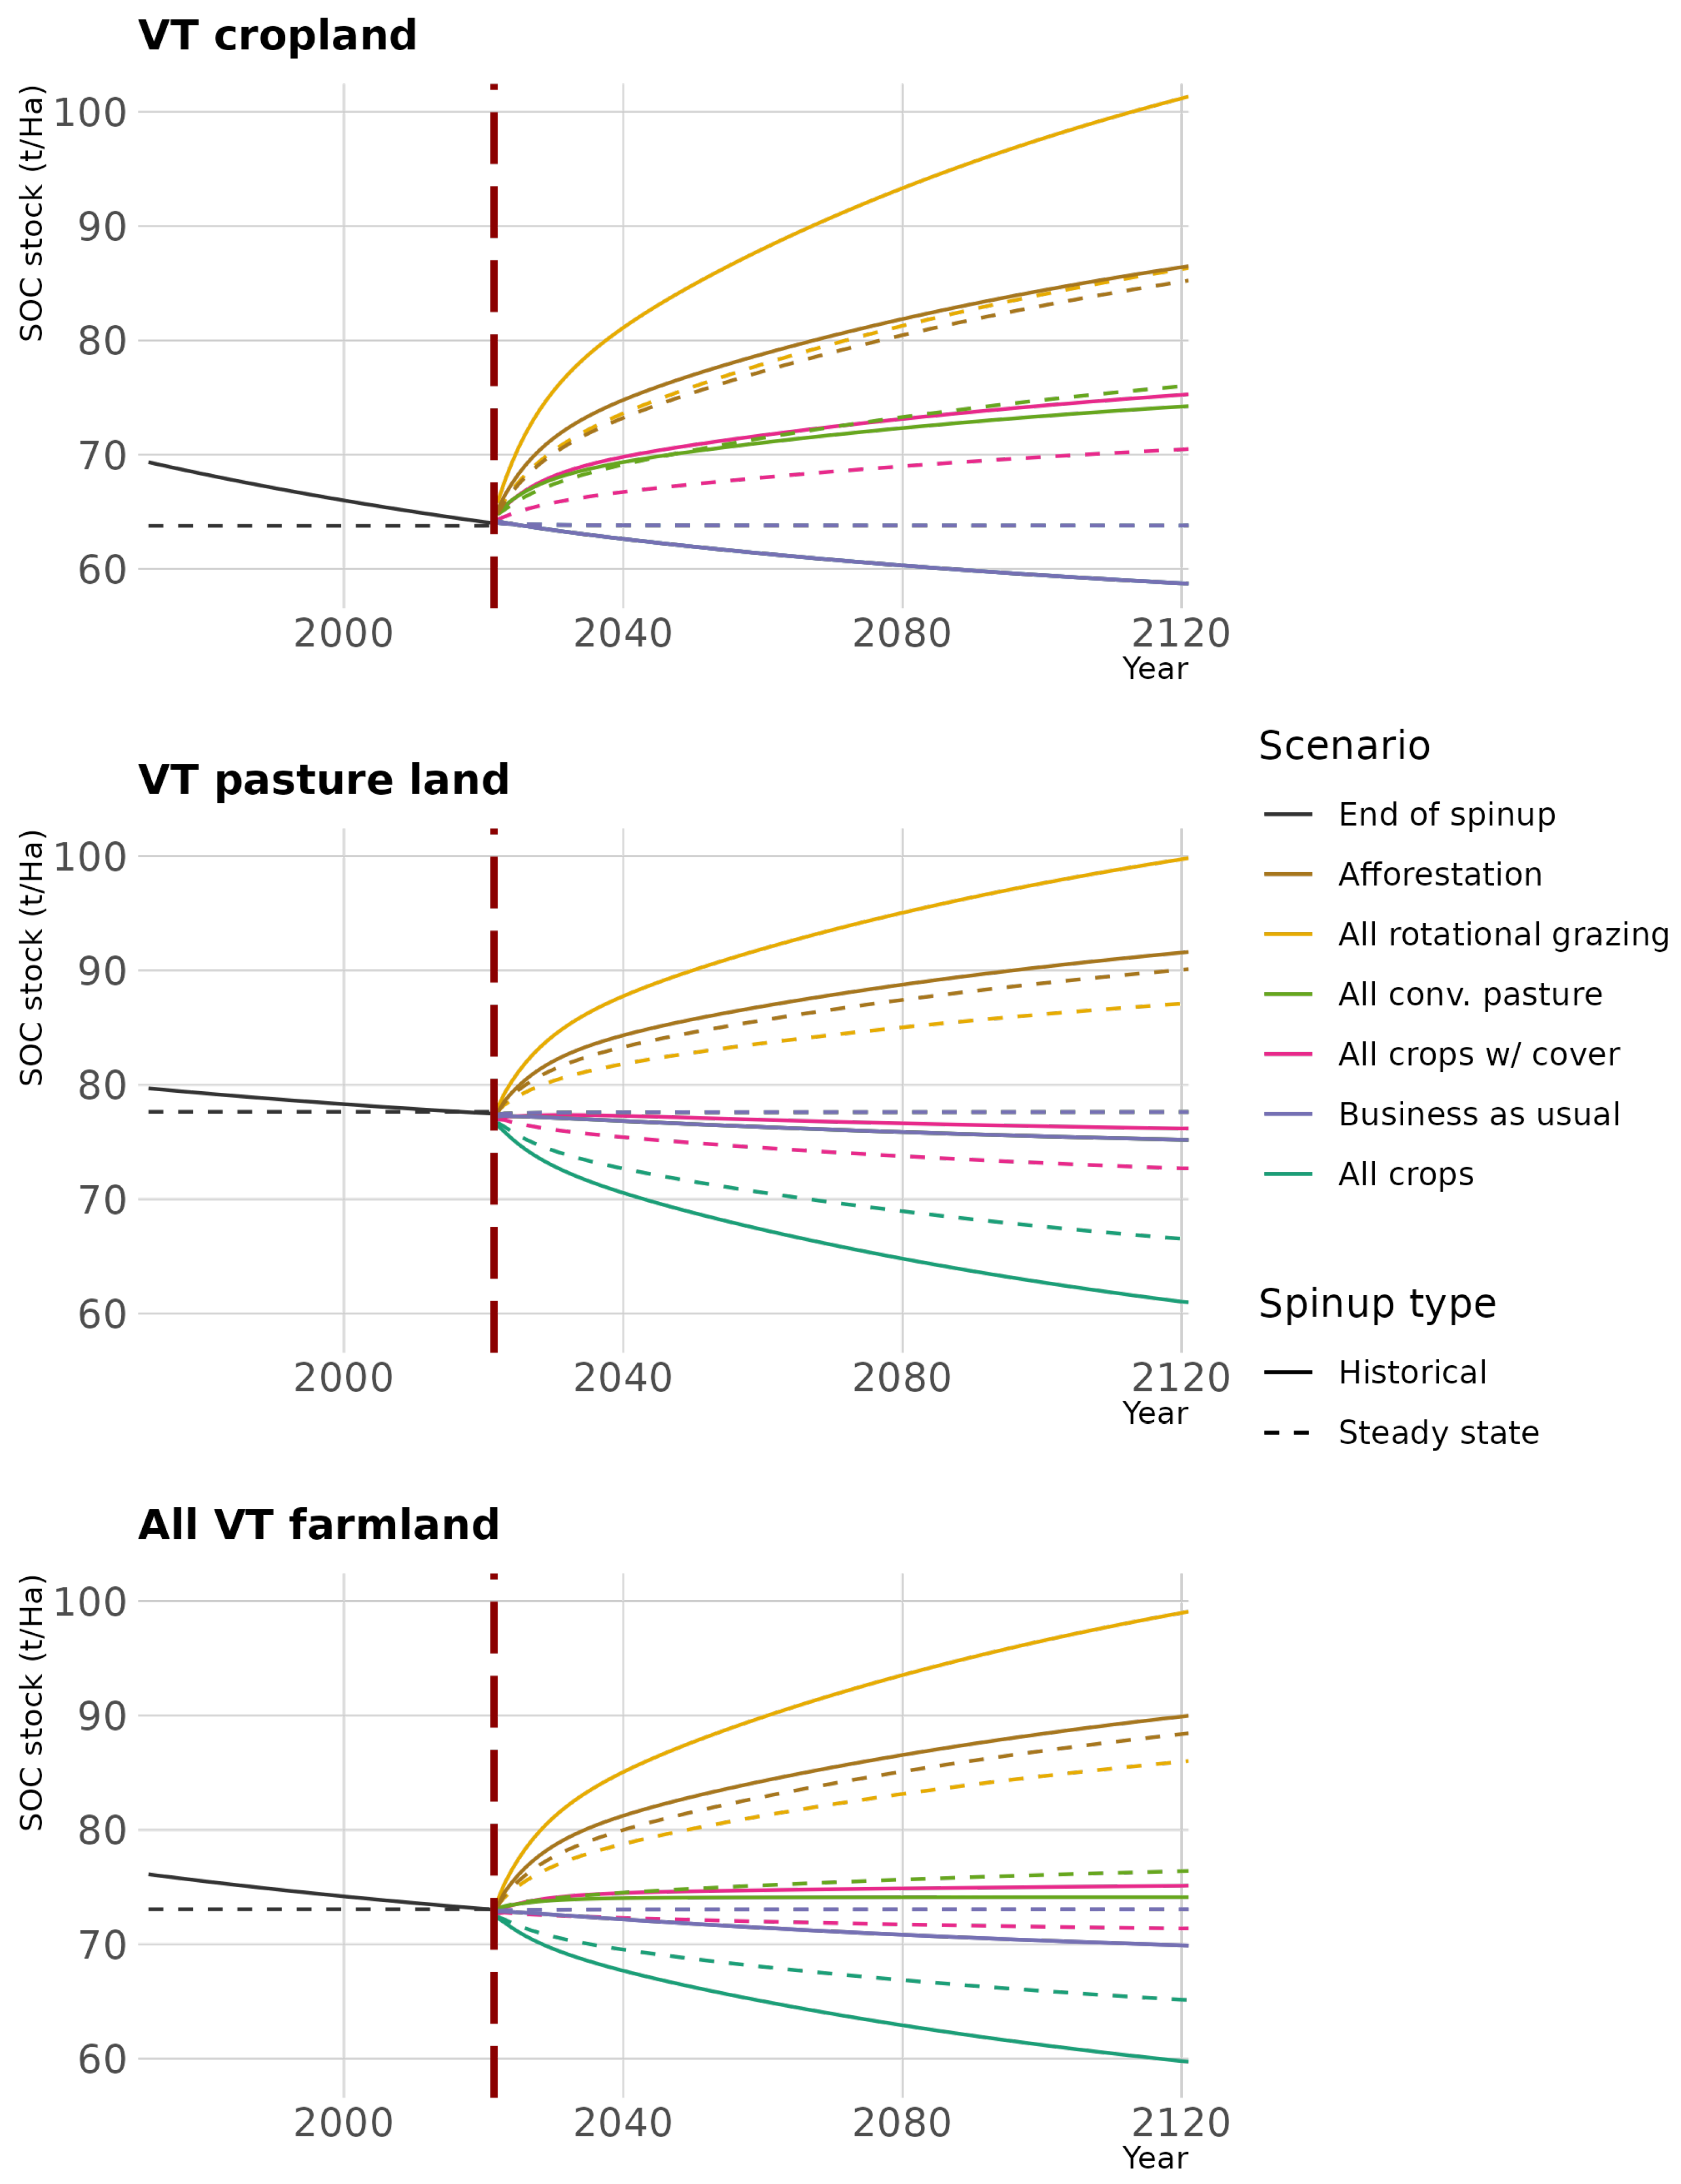
Figure 6 shows the simulation results averaged across the study area, with plots focusing on current cropland, pasture, and total combined farmland in the state. Like in our previous studies [3,4], we found that certain uses, notably tilled cropping systems, lead to comparatively lower SOC stocks when compared to business-as-usual. Others, such as afforestation and rotational grazing (a regenerative pasturing practice), increase SOC over time. Cover cropping and transition to conventional pasture increase SOC on land currently in conventional cropping systems. However, despite these overall trends holding, we note significant nuances between the simulations initialized using the steady-state vs. the historical spinup.
A key finding was that the historical spinup accentuates the effects of SOC changes in both positive and negative directions. Because of the relatively short periods in which SOC changes were assumed to have occurred under the historical spinup, the imputed C inputs in order for those changes to have taken effect within the required time window are magnified in each direction when compared to the steady-state spinup. This means that, when changing to a land use with empirically lower carbon stocks (for example, from pasture to cultivated cropland), the simulations initialized using the historical spinup resulted in a steeper decline in SOC, and ultimately less SOC after a century (a statewide average of 61 t/Ha vs. 66 t/Ha, an 8.3% decrease compared to the steady-state spinup).
The opposite is also true, however. For example, when traditional continuous pasture is converted to rotational grazing, the steady-state spinup projects average stocks of 87 t/Ha after a century, vs. 99 t/Ha for the historical spinup, a 14.6% increase. In this case, the effect is especially marked, since we assumed the transition from continuous to rotational grazing started in 1990. With a relatively short (32-year) period for SOC stocks to grow from the 1990 levels of continuous pastures to the levels observed in rotationally grazed pastures today, the imputed C inputs must be higher (an average of 7.6 t/Ha annual C from both plant residue and manure under the historical spinup, vs. 6.4 t/Ha under the steady-state spinup). Across the board, the choice of spinup procedure caused non-trivial impacts on forward-looking simulation results.

3. Discussion

With a pressing need to identify solutions that mitigate atmospheric C buildup and its resulting climatic disruptions, computational modeling has become a valuable tool to project how land use changes are likely to affect SOC dynamics, including C sequestration. However, to be useful, SOC models like RothC must be carefully parameterized and initialized. We can obtain reasonable data for many of the necessary parameters, including soil characteristics, climate normals, known plant- and manure-derived C inputs from farmland management, and current empirical SOC measurements. However, it is not typically feasible to account for C inputs to the soil from all sources, especially from underground plant-derived sources. The goals of a spinup in RothC are (a) for total SOC across all pools to match empirical measurements at the beginning of the simulation, (b) to divide total SOC into fractions for each pool, and (c) to impute unaccounted-for soil C inputs that cause the model to converge to these empirically measured SOC stocks.
Several variations of the initialization procedure for RothC, ranging in precision and computational complexity, have been explored in the literature [9]. One type initializes SOC stocks by dividing current empirical total SOC into pre-set fractions for each pool and then uses exogenous estimates of soil C inputs throughout the forward-looking simulation. In this case, there is no real spinup, which can cause a nonlinearity in modeled SOC after the simulation begins, since no effort is made to calibrate C inputs to real-world SOC measurements.
Another type uses estimates of monthly C inputs to spin the model up over a long time period (necessary for SOC in all pools to stabilize), but does not verify total SOC at the end of the spinup against empirical measurements. Since these same C input estimates are used in the forward-looking simulation, SOC stocks will not show a nonlinearity at simulation  t 0 , but there is no guarantee that SOC stocks will correspond to real-world measurements at any point throughout the spinup or simulation run.
The current best practice is an iterative optimization method that uses current empirical SOC measurements as a target to impute C inputs [3,4,9,10,11]. In this case, at the end of the spinup, SOC in all pools has stabilized, and total SOC should match the measured target. If total SOC does not match the target, over consecutive runs, assumed C inputs are adjusted incrementally until SOC equals the empirical value. The C input discrepancy is assumed to be due to unaccounted-for C that is returned to the soil via underground plant matter and microbes. Using this method, which we here called a steady-state spinup, total SOC when the simulation begins is accurate, and the model calculates the fraction within each pool. The C inputs imputed by the spinup for each land use are continued throughout the simulations, so no nonlinearity is observed. While this procedure fulfills the basic goals of a RothC spinup, it has a limitation in that total SOC will, by definition, remain steady year-on-year as long as the business-as-usual scenario continues.
The historical spinup expands on these previous methods by incorporating land use trends. Like the steady-state spinup, we aimed for the final total SOC at the end of the spinup to match an empirical target. However, the historical spinup does not assume SOC in each pool has stabilized. Instead, we first spun up the system to match the long-term historical land use (old-growth forest). The next step in this case is to assume a transition from forest to pasture and impute the C inputs necessary for the forest SOC level to reach the currently observed pasture SOC level over the time frame of 1760–present. We then used the interim C pool values from this “spindown” at 1895 as the start of the spinup from pasture to current land use. Once again, monthly C inputs required for total SOC to reach current levels were imputed for each land use. This was repeated in a final phase for regenerative agricultural land use changes, such as cover cropping and rotational grazing, that have been implemented more recently (1990–present in our example). While it is more complex than existing methodologies, the historical spinup has unique advantages: (a) it still causes modeled SOC to match empirical values at simulation start, and (b) in a forward-looking simulation, it realistically allows for SOC to be either rising or falling under the business-as-usual scenario.
This study serves primarily as a proof of concept illustrating the advantages of taking a historical approach to SOC model spinups. Due to the imprecise nature of available historical land use data, we cannot claim the simulation results obtained are strictly accurate. However, the results do paint an interesting picture and add to our understanding of the relationships between agricultural land use and SOC sequestration.
A key takeaway is that it is not necessarily safe to assume that SOC is stabilized at the start of a forward-looking simulation. Some of the SOC pools—primarily humified material—can take on the order of hundreds of years to stabilize. Therefore, even a land use change that happened 200 plus years ago, such as the deforestation of Vermont, may still be causing SOC stocks in Vermont’s farm fields to fall slightly year-on-year today, even where farmland management has not become worse. In short, the system has not necessarily “caught up” with previous large-scale land use changes, and the historical spinup captures this dynamic.
A second important implication of the historical spinup concerns the imputed C inputs associated with different management practices. This especially affects our understanding of regenerative practices such as rotational grazing and cover cropping. In the literature, there has been a great deal of debate about the efficacy of such practices to sequester SOC [45,46]. Among SOC studies using computational modeling to project outcomes from such practices, our findings suggest that the expected level of SOC sequestration is extremely sensitive to assumptions about how long the practices have been in use. For example, if we assume a field changed from continuous pasture to rotational grazing in 1960, there would be over 60 years for SOC stocks to build to current levels, whereas if we assume the transition happened in 1990, only around 30 years would have elapsed. For SOC to mirror the assumed trajectory, the imputed C inputs in the former case must be lower, and thus, the projected SOC sequestration rate if rotational grazing is continued into the future must be lower as well. In the historical spinup example presented here, we assumed that such regenerative transitions happened in 1990. This means that, for SOC stocks to grow from the 1990 level associated with conventional pastures to the level measured in rotationally grazed pastures today, the imputed C inputs, and thus the sequestration rate, would have to be relatively higher (Figure 4 and Figure 5). This higher rate of sequestration will thus be continued throughout the simulation, which causes projections of SOC sequestration for rotational grazing to be much greater under the historical spinup than the steady-state spinup, even outpacing afforestation in our example (Figure 6).

Limitations

While the historical spinup procedure confers advantages over the traditional steady-state method, we note several limitations with the process. A major limitation is the lack of precise data on historical land use change at a fine spatial scale. The best data we had are relatively sketchy estimates of forest cover at the whole-state level. While these presumably correspond to macro-level changes in land use, the precise history of land use change on each individual parcel of farmland is not available. Further, we assumed the transitions happened in the same year on all parcels, which is clearly an oversimplification. Similarly, for purposes of illustration, we naively assumed that transitions to regenerative practices such as rotational grazing and cover cropping happened all at once in 1990. Still, despite this inherent limitation, we contend that accounting for historical land use changes, even in this generalized way, is better than not accounting for them at all. Further, the general approach laid out in this paper could be applied in other contexts in which more fine-grained land use data are available.
Currently, the dataset we used to set SOC targets in the spinups represents essentially a single point in time. The only way to be sure of the extent to which the historical spinup improves upon SOC model predictions would be time series SOC sampling. This would give an indication of the rate at which SOC is accruing or dissipating with different land uses and land use change history, helping to validate the historical spinup approach. Relatedly, the available input data for our study area constrained the spatial scale chosen for units of analysis. It is theoretically ideal to run the model at the smallest possible spatial scale to account for fine-grained variations (computational capacity issues notwithstanding). The spatial scale of available data in our study area led us to adopt ecoregions as our unit of analysis, which represents a compromise to some extent. Hopefully, with increasing interest in SOC sequestration, more fine-scaled longitudinal datasets will become available. With such data, in theory, a further refinement of the historical spinup method could be developed in which the algorithm attempts to fit the assumed SOC trajectory to a series of points, rather than just a single final target.

4. Conclusions

The incorporation of historical land use changes into the spinup represents an advance in soil process models such as RothC. The historical spinup procedure both draws from and expands upon the advantages of the iterative spinup that is currently considered the best practice [9]. While the assumption of a stabilized initial state may be acceptable for shorter-term studies or to highlight differences between scenarios, given the long time period over which SOC pools such as humified material can change after a land use transition, we showed that a historical spinup procedure offers important advantages for the future of SOC modeling.

Author Contributions

Conceptualization, S.W. and B.B.; methodology, S.W.; software, S.W. and S.G.; validation, S.W.; formal analysis, S.W.; investigation, S.W. and S.G.; resources, B.B.; data curation, S.G. and S.W.; writing—original draft preparation, S.W.; writing—review and editing, S.W., B.B. and S.G.; visualization, S.W. and S.G.; supervision, B.B.; project administration, B.B.; funding acquisition, B.B. All authors have read and agreed to the published version of the manuscript.

Funding

This research was funded by the University of Vermont Food Systems Research Center. In addition, Brian Beckage was supported in part by NASA Grant Number 80NSSC20M0122 and by the USDA National Institute of Food and Agriculture Hatch, Project Number 1025208.

Data Availability Statement

The data presented in this study are available upon request from the corresponding author, with the exception of the UVM Soil Lab data, which are not publicly available due to privacy concerns. The R code used in this experiment is in a public Github repository [15].

Acknowledgments

We thank Joshua Faulkner and Juan Alvez of the University of Vermont USDA Extension Service for their expert advice to parameterize the model.

Conflicts of Interest

The authors declare no conflict of interest. The funders had no role in the design of the study; in the collection, analyses, or interpretation of the data; in the writing of the manuscript; nor in the decision to publish the results.

References

  1. Oelkers, E.H.; Cole, D.R. Carbon Dioxide Sequestration A Solution to a Global Problem. Elements 2008, 4, 305–310. [Google Scholar] [CrossRef]
  2. Ontl, T.A.; Schulte, L.A. Soil Carbon Storage. Nat. Educ. Knowl. 2012, 3, 35. [Google Scholar]
  3. Wiltshire, S.; Beckage, B. Soil carbon sequestration through regenerative agriculture in the U.S. state of Vermont. PLoS Clim. 2022, 1, e0000021. [Google Scholar] [CrossRef]
  4. Wiltshire, S.; Beckage, B. Integrating climate change into projections of soil carbon sequestration from regenerative agriculture. PLoS Clim. 2023, 2, e0000130. [Google Scholar] [CrossRef]
  5. Lal, R. Soil Carbon Sequestration Impacts on Global Climate Change and Food Security. Science 2004, 304, 1623–1627. [Google Scholar] [CrossRef] [Green Version]
  6. Lal, R. Carbon sequestration. Philos. Trans. R. Soc. B Biol. Sci. 2008, 363, 815–830. [Google Scholar] [CrossRef] [PubMed]
  7. Paustian, K.; Lehmann, J.; Ogle, S.; Reay, D.; Robertson, G.P.; Smith, P. Climate-smart soils. Nature 2016, 532, 49–57. [Google Scholar] [CrossRef] [PubMed] [Green Version]
  8. Coleman, K.; Jenkinson, D.S. RothC-26.3–A Model for the turnover of carbon in soil. In Evaluation of Soil Organic Matter Models; Powlson, D.S., Smith, P., Smith, J.U., Eds.; Springer: Berlin/Heidelberg, Germany, 1996; pp. 237–246. [Google Scholar] [CrossRef]
  9. Klumpp, K.; Coleman, K.; Dondini, M.; Goulding, K.; Hastings, A.; Jones, M.B.; Leifeld, J.; Osborne, B.; Saunders, M.; Scott, T.; et al. Soil Organic Carbon (SOC) Equilibrium and Model Initialisation Methods: An Application to the Rothamsted Carbon (RothC) Model. Environ. Model. Assess. 2017, 22, 215–229. [Google Scholar] [CrossRef]
  10. Falloon, P.; Smith, P. Simulating SOC changes in long-term experiments with RothC and CENTURY: Model evaluation for a regional scale application. Soil Use Manag. 2002, 18, 101–111. [Google Scholar] [CrossRef]
  11. Bolinder, M.; Janzen, H.; Gregorich, E.; Angers, D.; VandenBygaart, A. An approach for estimating net primary productivity and annual carbon inputs to soil for common agricultural crops in Canada. Agric. Ecosyst. Environ. 2007, 118, 29–42. [Google Scholar] [CrossRef]
  12. Skjemstad, J.O.; Spouncer, L.R.; Cowie, B.; Swift, R.S. Calibration of the Rothamsted organic carbon turnover model (RothC ver. 26.3), using measurable soil organic carbon pools. Soil Res. 2004, 42, 79–88. [Google Scholar] [CrossRef]
  13. Weihermüller, L.; Graf, A.; Herbst, M.; Vereecken, H. Simple pedotransfer functions to initialize reactive carbon pools of the RothC model. Eur. J. Soil Sci. 2013, 64, 567–575. [Google Scholar] [CrossRef]
  14. Sierra, C.A.; Mueller, M.; Trumbore, S.E. Models of soil organic matter decomposition: The SoilR package, version 1.0. Geosci. Model Dev. 2012, 5, 1045–1060. [Google Scholar] [CrossRef] [Green Version]
  15. Serge, W.; Sarah, G.; Brian, B. Github Repository for R Code Used in This Paper. 2023. Available online: https://github.com/brianbeckage/SoilCarbonSpinupPublished (accessed on 19 January 2023).
  16. Zimmermann, M.; Leifeld, J.; Schmidt, M.W.I.; Smith, P.; Fuhrer, J. Measured soil organic matter fractions can be related to pools in the RothC model. Eur. J. Soil Sci. 2007, 58, 658–667. [Google Scholar] [CrossRef]
  17. Jenkinson, D.S.; Andrew, S.P.S.; Lynch, J.M.; Goss, M.J.; Tinker, P.B. The Turnover of Organic Carbon and Nitrogen in Soil [and Discussion]. Philos. Trans. Biol. Sci. 1990, 329, 361–368. [Google Scholar]
  18. Kuzyakov, Y.; Friedel, J.K.; Stahr, K. Review of mechanisms and quantification of priming effects. Soil Biol. Biochem. 2000, 32, 1485–1498. [Google Scholar] [CrossRef]
  19. Klyza, C.; Trombulak, S. The Story of Vermont: A Natural and Cultural History, 2nd ed.; University Press of New England: Hanover, NH, USA, 2015. [Google Scholar]
  20. Merck. History of Vermont Forests & Farmland. 2018. Available online: https://www.merckforest.org/history-of-vermont-forests-farmland/ (accessed on 24 March 2022).
  21. Bushnell, M. Then Again: When the Green Mountains Were Not so Green. 2018. Available online: https://vtdigger.org/2018/07/15/green-mountains-not-green/ (accessed on 25 March 2022).
  22. VT ANR. History of Forestry in Vermont; Department of Forests–Parks and Recreation: Barre, VT, USA, 2022.
  23. Dabritz, C. Where Have All the Forests Gone? A History of Deforestation in Vermont. Available online: https://glcp.uvm.edu/landscape_new/learn/Downloads/scrapbooks/forests2.pdf (accessed on 25 March 2022).
  24. Morin, R.; Domke, G.; Walters, B.; Wilmont, S. Forests of Vermont, 2016; Resource Update FS-119; Technical report; U.S. Department of Agriculture, Forest Service, Northern Research Station: Newtown Square, PA, USA, 2017.
  25. Morin, R. Forests of Vermont, 2017; Resource Update FS-164; Technical report; U.S. Department of Agriculture, Forest Service, Northern Research Station: Newtown Square, PA, USA, 2018.
  26. Wessels, T. Reading the Forested Landscape: A Natural History of New England; Countryman Press: Taftsville, VT, USA, 1999. [Google Scholar]
  27. Albers, J. Hands on the Land: A History of the Vermont Landscape; Orton Family Foundation: Rutland, VT, USA, 2000. [Google Scholar]
  28. Omernik, J.M.; Griffith, G.E. Ecoregions of the Conterminous United States: Evolution of a Hierarchical Spatial Framework. Environ. Manag. 2014, 54, 1249–1266. [Google Scholar] [CrossRef]
  29. Rodell, M.; Houser, P.; Jambor, U.; Gottschalck, J.; Mitchell, K.; Meng, C.J.; Arsenault, K.; Cosgrove, B.; Radakovich, J.; Bosilovich, M.; et al. The global land data assimilation system. Bull. Am. Meteorol. Soc. 2004, 85, 381–394. [Google Scholar] [CrossRef] [Green Version]
  30. ESRI. U.S. Historical Climate–Monthly Averages for GHCN-D Stations for 1981–2010. ArcGIS Living Atlas. 2019. Available online: https://www.arcgis.com/home/item.html?id=ed59d3b4a8c44100914458dd722f054f (accessed on 2 November 2022).
  31. United States Department of Agriculture, Natural Resources Conservation Service. Gridded Soil Survey Geographic (gSSURGO) Database for the Conterminous United States. 2020. Available online: https://gdg.sc.egov.usda.gov/ (accessed on 6 November 2022).
  32. Dewitz, J. National Land Cover Database (NLCD) 2016 Products: Data Release; U.S. Geological Survey: Reston, VA, USA, 2019. [CrossRef]
  33. United States Department of Agriculture, National Agricultural Statistics Service. 2017 Census of Agriculture. 2017. Available online: www.nass.usda.gov/AgCensus (accessed on 4 November 2022).
  34. Olson, K.R.; Al-Kaisi, M.M.; Lal, R.; Lowery, B. Experimental Consideration, Treatments, and Methods in Determining Soil Organic Carbon Sequestration Rates. Soil Sci. Soc. Am. J. 2014, 78, 348–360. [Google Scholar] [CrossRef] [Green Version]
  35. Luo, Z.; Wang, E.; Sun, O.J. Can no-tillage stimulate carbon sequestration in agricultural soils? A meta-analysis of paired experiments. Agric. Ecosyst. Environ. 2010, 139, 224–231. [Google Scholar] [CrossRef]
  36. Conant, R.T.; Six, J.; Paustian, K. Land use effects on soil carbon fractions in the southeastern United States. I. Management-intensive versus extensive grazing. Biol. Fertil. Soils 2003, 38, 386–392. [Google Scholar] [CrossRef]
  37. Smith, J.E. Methods for Calculating Forest Ecosystem and Harvested Carbon with Standard Estimates for Forest Types of the United States; United States Department of Agriculture, Forest Service, Northeastern Research Station: Newtown Square, PA, USA, 2006.
  38. Conant, R.T.; Cerri, C.E.P.; Osborne, B.B.; Paustian, K. Grassland management impacts on soil carbon stocks: A new synthesis. Ecol. Appl. 2017, 27, 662–668. [Google Scholar] [CrossRef] [PubMed] [Green Version]
  39. Neumann, M.; Ukonmaanaho, L.; Johnson, J.; Benham, S.; Vesterdal, L.; Novotný, R.; Verstraeten, A.; Lundin, L.; Thimonier, A.; Michopoulos, P.; et al. Quantifying Carbon and Nutrient Input from Litterfall in European Forests Using Field Observations and Modeling. Glob. Biogeochem. Cycles 2018, 32, 784–798. [Google Scholar] [CrossRef]
  40. Cantazaro, P.; D’Amato, A. Forest Carbon: An Essential Natural Solution for Climate Change; Technical report; University of Massachussets: Amherst, MA, USA, 2019. [Google Scholar]
  41. Chahal, I.; Vyn, R.J.; Mayers, D.; Van Eerd, L.L. Cumulative impact of cover crops on soil carbon sequestration and profitability in a temperate humid climate. Sci. Rep. 2020, 10, 13381. [Google Scholar] [CrossRef]
  42. Seitz, D.; Fischer, L.M.; Dechow, R.; Wiesmeier, M.; Don, A. The potential of cover crops to increase soil organic carbon storage in German croplands. Plant Soil 2022, 1–17. [Google Scholar] [CrossRef]
  43. Rollett, A.; Williams, J. 2018-19 Soil Policy Evidence Programme: Review of Best Practice for SOC Monitoring; Technical report; Soil Policy & Agricultural Land Use Planning Unit; Land, Nature and Forestry Division; Department for Rural Affairs; Welsh Government: Cardiff, UK, 2019.
  44. Falloon, P. How important is inert organic matter for predictive soil carbon modelling using the Rothamsted carbon model? Soil Biol. Biochem. 2000, 32, 433–436. [Google Scholar] [CrossRef]
  45. Poeplau, C.; Don, A. Carbon sequestration in agricultural soils via cultivation of cover crops–A meta-analysis. Agric. Ecosyst. Environ. 2015, 200, 33–41. [Google Scholar] [CrossRef]
  46. Byrnes, R.C.; Eastburn, D.J.; Tate, K.W.; Roche, L.M. A Global Meta-Analysis of Grazing Impacts on Soil Health Indicators. J. Environ. Qual. 2018, 47, 758–765. [Google Scholar] [CrossRef] [Green Version]
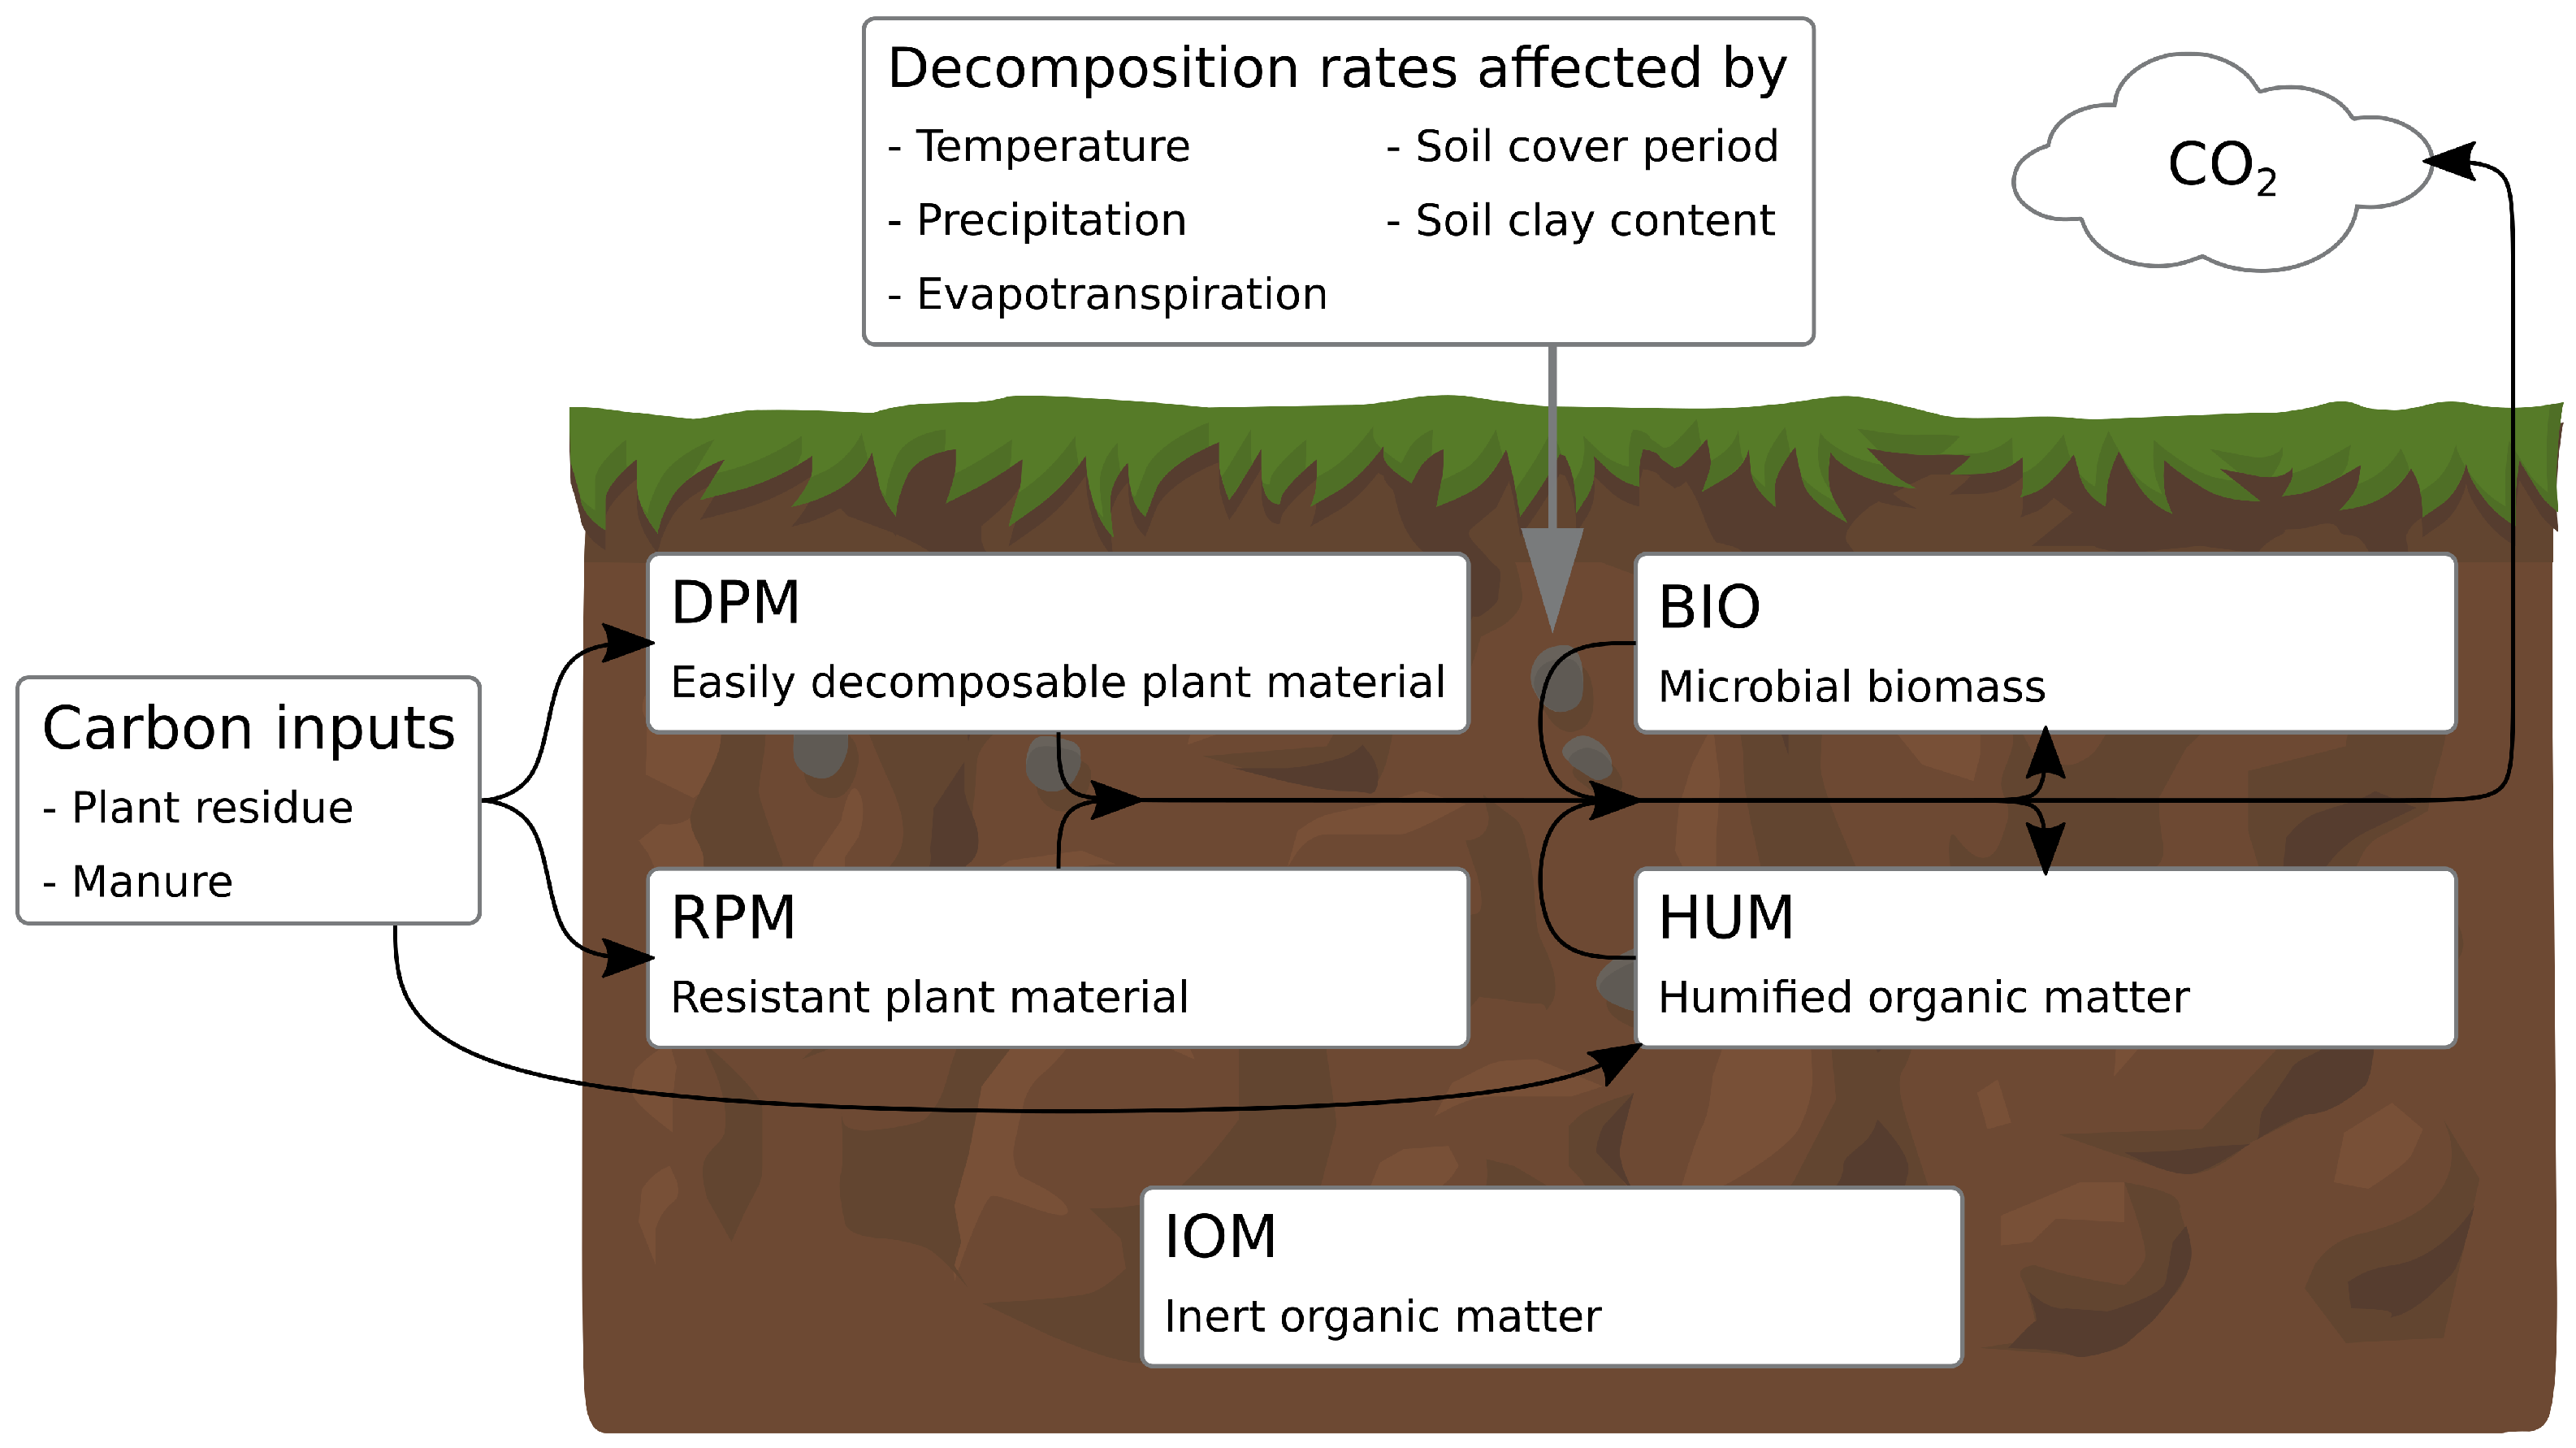
Figure 1. Schematic representation of the RothC model. Depicts the required input data and structure of SOC pools in the model. C enters the system through either plant residue or manure, primarily as either easily decomposable material (DPM) or more resistant material (RPM). Some C is converted to microbial biomass (BIO) at a characteristic rate, while other C decomposes to recalcitrant humus (HUM). HUM and BIO also cycle between one another. Meanwhile, C is also oxidized and exits the system at a characteristic rate. All these rates are modified by specific land management, soil, and climate parameters. Adapted from the RothC manual [8]. This figure was previously printed in [3].
Soilsystems 07 00035 g001
Figure 2. Vermont forest cover over time, using the data from Table 1 (green), and the approximation used in the RothC historical spinup (orange).
Soilsystems 07 00035 g002
Figure 3. Comparison of steady-state vs. historical spinup for cropland (averaged over the study area). Both spinups hit the same SOC target in 2022 (measured empirically). However, in the steady-state spinup, all C pools stabilized, while in the historical spinup, the transition from forest to pasture and eventually to cropland caused the overall trajectory of SOC to be downward under business-as-usual land management.
Soilsystems 07 00035 g003
Figure 4. Total SOC over time for each land use under the historical spinup (averaged across the study area and smoothed by year). Shows distinct spinup phases (spinup to forest, spindown to pasture, spinup to current use, and more recent regenerative practices). Like the steady-state spinup, the modeled SOC in 2022 matched the empirical targets, but here, the trajectories of SOC over time were more complex.
Soilsystems 07 00035 g004
Figure 5. Total annual C inputs to soil (sum of manure-derived, above-ground plant material, and imputed inputs from below-ground plant material) under each land use and spinup type. The bar height indicates the statewide average, with whiskers showing the standard deviation across the 13 ecoregions.
Soilsystems 07 00035 g005
Figure 6. Simulation results for six scenarios, for both historical and steady-state spinups. Panels show results for cropland, pasture, and total farmland (averaged by year across the full study area). With the historical spinup, the trajectory of SOC under business-as-usual is declining, with a steeper decline for cropland compared to pasture. Further, the different levels of imputed C returned to the soil between the two spinup types mean that the simulated land use changes have different effect magnitudes after a century.
Soilsystems 07 00035 g006
Table 1. Estimates of Vermont forest cover over time from the arrival of the Europeans to the present.
YearForest Area (Acres)Forest %Reference
16205,605,00095.00%[19]
17904,838,00082.00%[19]
18203,422,00058.00%[19]
18502,773,00047.00%[19]
18701,475,00025.00%[20]
18901,180,00020.00%[21]
19031,175,00019.92%[22]
19081,159,00019.64%[22]
19251,770,00030.00%[23]
20054,661,00079.00%[22]
20074,425,00075.00%[22]
20124,596,00077.90%[24]
20164,509,00076.42%[24]
20174,494,00076.17%[25]
Disclaimer/Publisher’s Note: The statements, opinions and data contained in all publications are solely those of the individual author(s) and contributor(s) and not of MDPI and/or the editor(s). MDPI and/or the editor(s) disclaim responsibility for any injury to people or property resulting from any ideas, methods, instructions or products referred to in the content.