Article

Optimum Rate and Deep Placement of Nitrogen Fertilizer Improves Nitrogen Use Efficiency and Tomato Yield in Nepal

1
International Maize and Wheat Improvement Center (CIMMYT), Lalitpur 44700, Nepal
2
Nepal Agricultural Research Council (NARC), Surkhet 21700, Nepal
3
Nepal Agricultural Research Council (NARC), National Soil Science Research Center (NSSRC), Lalitpur 44705, Nepal
4
International Fertilizer Development Center (IFDC), Lalitpur 44700, Nepal
*
Author to whom correspondence should be addressed.
Soil Syst. 2022, 6(3), 72; https://doi.org/10.3390/soilsystems6030072
Submission received: 27 July 2022 / Revised: 14 September 2022 / Accepted: 14 September 2022 / Published: 17 September 2022

Abstract

:
In Nepal, blanket fertilizer recommendations without considering diverse soil types, nutrient status, climate and crop management practices along with imbalanced fertilization practices by farmers, mainly “urea fertilizer,” have resulted in reduced nitrogen use efficiency (NUE) and productivity in tomato production. Optimizing the rate of nitrogen (N) fertilizer, application time and improved application methods could increase crop yields and NUE and reduce environmental costs. This study was conducted to identify the optimum N rate and application method for increased tomato yield and NUE. Multilocation trials (n = 28) conducted in a randomized complete block design with nine treatments across five districts included the omission of N, P and K (N0, P0, K0), variable N rates of 100, 150, 200 and 250 kg ha−1 (N-100, N-150, N-200 and N-250), use of urea briquettes (UB) with deep placement (UBN-150) and a control (CK). N input in UB was reduced by 25% from the recommended N rate of 200 kg ha−1 considering its expected higher NUE. Yield responses from an NPK omission plot revealed N as the most limiting plant nutrient. Applications of fertilizer at N-100, N-150, N-200 and N-250 increased tomato yield by 27%, 35%, 43% and 27%, respectively, over N0. Tomato yields responded quadratically to the added N fertilizers with optimum rates ranging from 150 to 200 kg ha−1 across districts. UBN-150 significantly increased tomato yield by 12% over N-150 and produced a similar yield to N-200 (the recommended rate). The highest partial factor productivity of nitrogen (PFPN) was observed at N-100 and the highest agronomic efficiency of N (AEN) was at N-200. Deep placement of UB at-150 increased PFPN by 8% and 21% and AEN by 27% and 21% compared with N-150 and N-200, respectively. These results have positive implications for developing efficient N fertilization strategies to increase tomato yields and reduce environmental impacts in Nepal.

1. Introduction

Tomato is grown as commercial produce by Nepalese famers year-round across different agro-climatic zones under both polyhouse and open-field conditions [1,2]. Tomato ranks third after cauliflower and cabbage in area used (20,000 ha) and production (0.3 million metric tons, t) [1]. Despite the large potential for domestic production, the current production does not satisfy national demand and a large amount of tomatoes are imported from India every year [2,3]. Poor irrigation and inefficient nutrient management practices are among the major reasons for lower productivity in Nepal [3,4,5]. Efficient management of soil nutrients such as nitrogen (N), phosphorous (P), potassium (K) and micronutrients such as zinc (Zn), boron (B) and optimum soil moisture providing timely irrigation play a significant role in improving tomato yield.
The major N fertilizer for tomato is prilled or granular urea, which is highly water-soluble and less efficient, particularly when broadcast—the common practice in Nepal. In the broadcasting method, farmers spread urea manually on the surface of the entire field uniformly during planting time as a basal application and top dressing, resulting in a nitrogen use efficiency (NUE) of 20–35%. This means that more than 50% of the applied N is lost to the environment through leaching, surface run-off, volatilization, nitrification and denitrification [6,7,8]. The official recommendation of the Nepal Agricultural Research Council (NARC) for fertilizer use is a blanket type; that is, a uniform rate of N, P and K across diverse agroecological zones that encompasses varied soil types, climates (rainfall and temperature) and crop management practices. This blanket recommendation is due to the limited number of on-farm fertilizer trials and crop management information practiced by farmers in different agricultural domains in Nepal. The fertilizer rate recommendations were also based on the results of on-station trials, with very few trials conducted on farms, and yield responses and NUE from on-station trials will differ from on-farm results obtained under diverse cropping systems and crop management practices [9]. On-station trials are managed by scientist following best management practices (BMPs): tillage practices using machine (soil tilth improvement), line planting methods to maintain uniform plant density, accurate amount of agri-inputs application (fertilizer, irrigation, pesticides, etc.) and close supervision of the field, whereas on-farm trials are managed by farmers with a lack of proper agronomic practices: broadcasting seed and fertilizers, the use of inaccurate agri-inputs and less supervision of the farm, thus lacking BMPs. These improved crop management practices in on-station trials produced higher crop yields compared with on-farm trials [9]. It is thus critical to measure fertilizer responses in farmers’ fields and recommend site-specific fertilizer rates and BMPs at the local farm level [10].
Nitrogen is one of the most limiting nutrients, affecting plant growth and yield worldwide [11,12] and in Nepal [13]. Optimum N fertilization is integral to meeting plant nitrogen demand and increasing yields. However, rather than increasing yields, N supplies that are beyond plant demands lead to reduced NUE, higher production costs and large N losses to the environment via leaching and emissions of nitric (NO) and nitrous oxides (N2O), the latter a potent greenhouse gas [14,15,16]. Optimizing N fertilization is vital to increase yields and address environmental concerns [17]. Application of N fertilizer at the right rate with multiple splits based on plant nutrient demand has been shown to increase NUE and tomato yields [14,18]. Previous studies have reported that fertilizer management using the 4Rs (right source, right rate, right time and right place) of nutrient stewardship enhances crop productivity and NUE [19].
Recently, improved application methods such as urea deep placement (UDP) or root zone application has been found to increase NUE and yields and reduce N losses to the environment [20,21]. For convenient applications, normal urea is compressed into 1–3 g pellets, commonly called a “urea briquette (UB),” and these are applied in the root zone 7–10 cm below soil surface. Deep placement of UBs retains N longer and releases it slowly over the cropping period, based on the plant nutrient demand [22,23]. UBs can be placed in a single application and at a 20–30% lower N rate than the recommended rate, given its slow release and higher NUE [20,24]. Studies have reported that a single UB application with less N has produced similar or even higher vegetable (tomato, cauliflower, bitter gourd) yields than with the recommended N rate [21,24,25].
Nitrogen is a crucial nutrient for the physiological and metabolic process in a tomato; adequate N availability increases marketable yield [25]. So far, few on-farm studies have explored optimal N rates and practices for tomato production in Nepal. In this study, the agronomic effects of variable N rates and UB with deep placement were tested on tomatoes in farmers fields under polyhouse conditions with drip irrigation across five mid-hill (subtropical climate) districts to identify the most limiting plant nutrient, determine optimal N rates and assess the effects of UB deep placement on increasing tomato yields and NUE across sites.

2. Materials and Methods

2.1. Description of the Study Site

Field trials were conducted under plastic tunnels in five districts (Doti, Palpa, Kavre, Dang and Surkhet) in the mid-hill region (subtropical climate) of Nepal (Figure S1). Average minimum and maximum temperatures during the growing period were 11.9 °C (ranging from 3.6 to 21.5 °C) and 23.3 °C (ranging from 14.4 to 31.0 °C) across districts. During the growing period, temperatures were higher in Dang and Surkhet than the other three districts (Palpa, Doti and Kavre) (Figure S2). Average total rainfall across districts was 365 ± 82 mm, ranging from 251 to 459 mm (Figure S2). Elevation across the study sites ranged from 497 to 1828 meters above sea level.

2.2. Soil properties

Soil samples from three locations in each experimental site were collected at a vertical depth of 10 cm and pooled into a composite sample for each site across districts (n = 28). Crop residues, leaf litter and pebbles were removed from the soil surface before collecting the samples. Collected soil samples were mixed thoroughly, removing the foreign materials (pebbles, stones, roots and other plant parts) and kept in zip-lock plastics with proper labelling (farm ID, GPS location, farmers name). Soil samples were oven-dried at 40 °C for three days and passed through a 2 mm sieve before analysis. Soil pH, organic matter (OM), texture, total N, available P2O5 and available K2O were determined using both wet chemistry and spectroscopy as described by Pandit et al. [24]. Soils were characterized as a moderately acidic silty loam (pH ranging from 5.9 to 6.6). Soil OM ranged from 16.0 to 31.7 g kg−1, total N from 0.1 to 1.7 g kg−1, available P2O5 from 21.3 to 64.6 mg kg−1 and available K2O from 86.3 to 224.6 mg kg−1 (Table 1).

2.3. Farmers Fertilizer Management Practices

After tomato harvesting, households cultivating tomato near the experimental sites were interviewed (n = 93; Doti, 18; Palpa, 17; Kavre, 10; Dang, 36; and Surkhet, 12) to record the farmers’ fertilizer practices and fruit yields. Farmers’ fertilizer rates varied largely across districts (Figure 1). Average rates of N, P2O5 and K2O were 70 kg ha−1 (ranging from 27 to 286 kg ha−1), 41 kg ha−1 (ranging from 0 to 276 kg ha−1) and 32 kg ha−1 (ranging from 0 to 240 kg ha−1) across the district sites (Figure 1), respectively. Farmers’ N, P2O5 and K2O rates were 65%, 73% and 78% less, respectively, than those recommended in Nepal (200:150:150 kg N: P2O5: K2O ha−1). Fertilizer rates were highest in Kavre (182: 106: 110, for N: P2O5: K2O ha−1). Fertilizer rates used by the farmers varied greatly (imbalanced fertilization) due to the lack of information about recommended rates and their knowledge about efficient nutrient management practices. The average tomato yield with the farmers’ fertilizer practices was 37 ± 1.0 t ha−1 (ranging from 16 to 64 t ha−1), with the highest yield in Doti (Figure 1d).

2.4. Fertilizer Treatments, Research Design and Crop Management

Multilocation trials (n = 28) were conducted under plastic tunnels across five districts: Doti (n = 6), Palpa (n = 4), Kavre (n = 6), Dang (n = 6) and Surkhet (n = 6) during September–October 2018 (see supplementary materials). Trials were arranged in a randomized complete block design (RCBD) consisting of nine treatments (Table 2) including a control (CK), three treatments of zero N, P, and K (N0, P0, K0), four treatments of variable N rates (100, 150, 200 and 250 kg ha−1) in the form of normal urea (N−100, N-150, N-200, and N-250) and one treatment of UBs with deep placement applied at 150 kg N ha−1 (UBN-150). Detailed descriptions for each treatment are given in Table 2. The N rate in UB was reduced by 25% from the recommended N (200 kg N ha−1) to account for the expected higher N use efficiency with the deep placement of UB [20,24].
During land preparation, a trial plot in a plastic tunnel (12 m × 5 m) was plowed 2–3 times and pulverized well before planting. The plot size was 4.8 m2 (4 m × 1.2 m). Phosphorous and Potassium fertilizers were applied as a basal dose at a rate of 150 kg ha−1 each (5 cm depth and 5 cm apart from planting line) in the form of DAP and MOP, respectively. Each plot was mulched with UV plastics and holes were made to transplant seedlings (25–30-day-old seedlings at the 3–4 leaf stages) at a spacing of 60 cm x 40 cm. In each plot, 20 plants were grown. The hybrid tomato variety Srijana was used. The Srijana variety is recommended for the tropical (terai) and sub-tropical (mid hills) climates in Nepal with 70–80 days maturity and has a yield potential of 105 to 110 ton ha−1. Urea-N was top-dressed in two equal splits as per treatment (Table 2) 20 days after transplanting and fruit bearing. In UB treatments, two UBs of 2.7 g (total 5.4 g) were applied to each plant at a depth of 7–10 cm and 5 cm apart during the first top dressing 20 days after transplanting. Drip irrigation was provided immediately after transplanting and sufficient moisture maintained until two weeks after transplanting. Later, irrigation was provided as needed and during critical moisture requirement stages (flowering and fruiting). Staking (bamboo sticks of 170 cm long) was provided in each row between four plants for support and to promote growth. Pruning was carried out, allowing one stem (single central stem) or two stems (double stem) for fruit production. For single central stems, buds coming from the nodes were continuously removed and, for double stems, all buds below 30–40 cm were removed, allowing one bud to grow at 40–45 cm above the ground in addition to the central steam. Hand weeding, earthing up and pest disease management were conducted as required.

2.5. PFPN and AEN

Tomatoes were harvested manually when the fruit turned yellow-red from three quadrants of 1 m2 (3 m2 in total) in each treatment plot. Fruit was harvested 5–6 times per plant and the yield measured in each harvest. Total yield was recorded after final harvest in each plot.
Partial factor productivity (PFPN; kg tomato yield per kg N applied) and agronomic use efficiency of nitrogen (AEN; kg tomato yield increases per kg N applied) were calculated for all N treatments (N-100, N-150, N-200, N-250, UBN-150). PFPN and AEN were calculated as per Dhakal et al. and Elia et al. [13,24].

2.6. Statistical Analysis

Data were analyzed using R software, version 3.6.2 (R Core Team 2019, Vienna, Austria). A linear mixed-effect model was used to test the effect of fertilizer treatments (fixed factor) on tomato yields across districts (random factor) using the ‘lmer’ function in the ‘lme4’ package, fitted by the Restricted Maximum Likelihood (REML) model. One-way ANOVA was performed to assess the fixed effect of variable N rates applied in the form of conventional urea and UBs at 150 kg N ha−1 on PFPN and AEN. A post hoc Tukey test (p = 0.05) was performed to identify the least significant differences between treatment means for tomato yield, PFPN and AEN. Model checking was performed through basic diagnostic plots (normal Q-Q and residuals plots). Quadratic regression was performed to identify the relationships between various N rates and tomato yields. Prior, linear regression was also tested to see which model fit the data well, and then quadratic regression was used based on the fitted line with a higher coefficient of determination (R2) value over the linear model to explain the relationship between N fertilizer supply and yields. The N-response curve (N rate vs yield) was used to identify the right rate of N fertilizer to produce the highest yield across districts. A linear regression model was fitted to identify the relationship between various soil chemical parameters (pH, OM, total N, available P and K) and tomato yield across districts.

3. Results

3.1. Tomato Yield

Both fertilizer treatments (Figure 2) and location (Figure 3) had significant effects on the tomato yield. There was no interaction between the fertilizer practice and district locations.

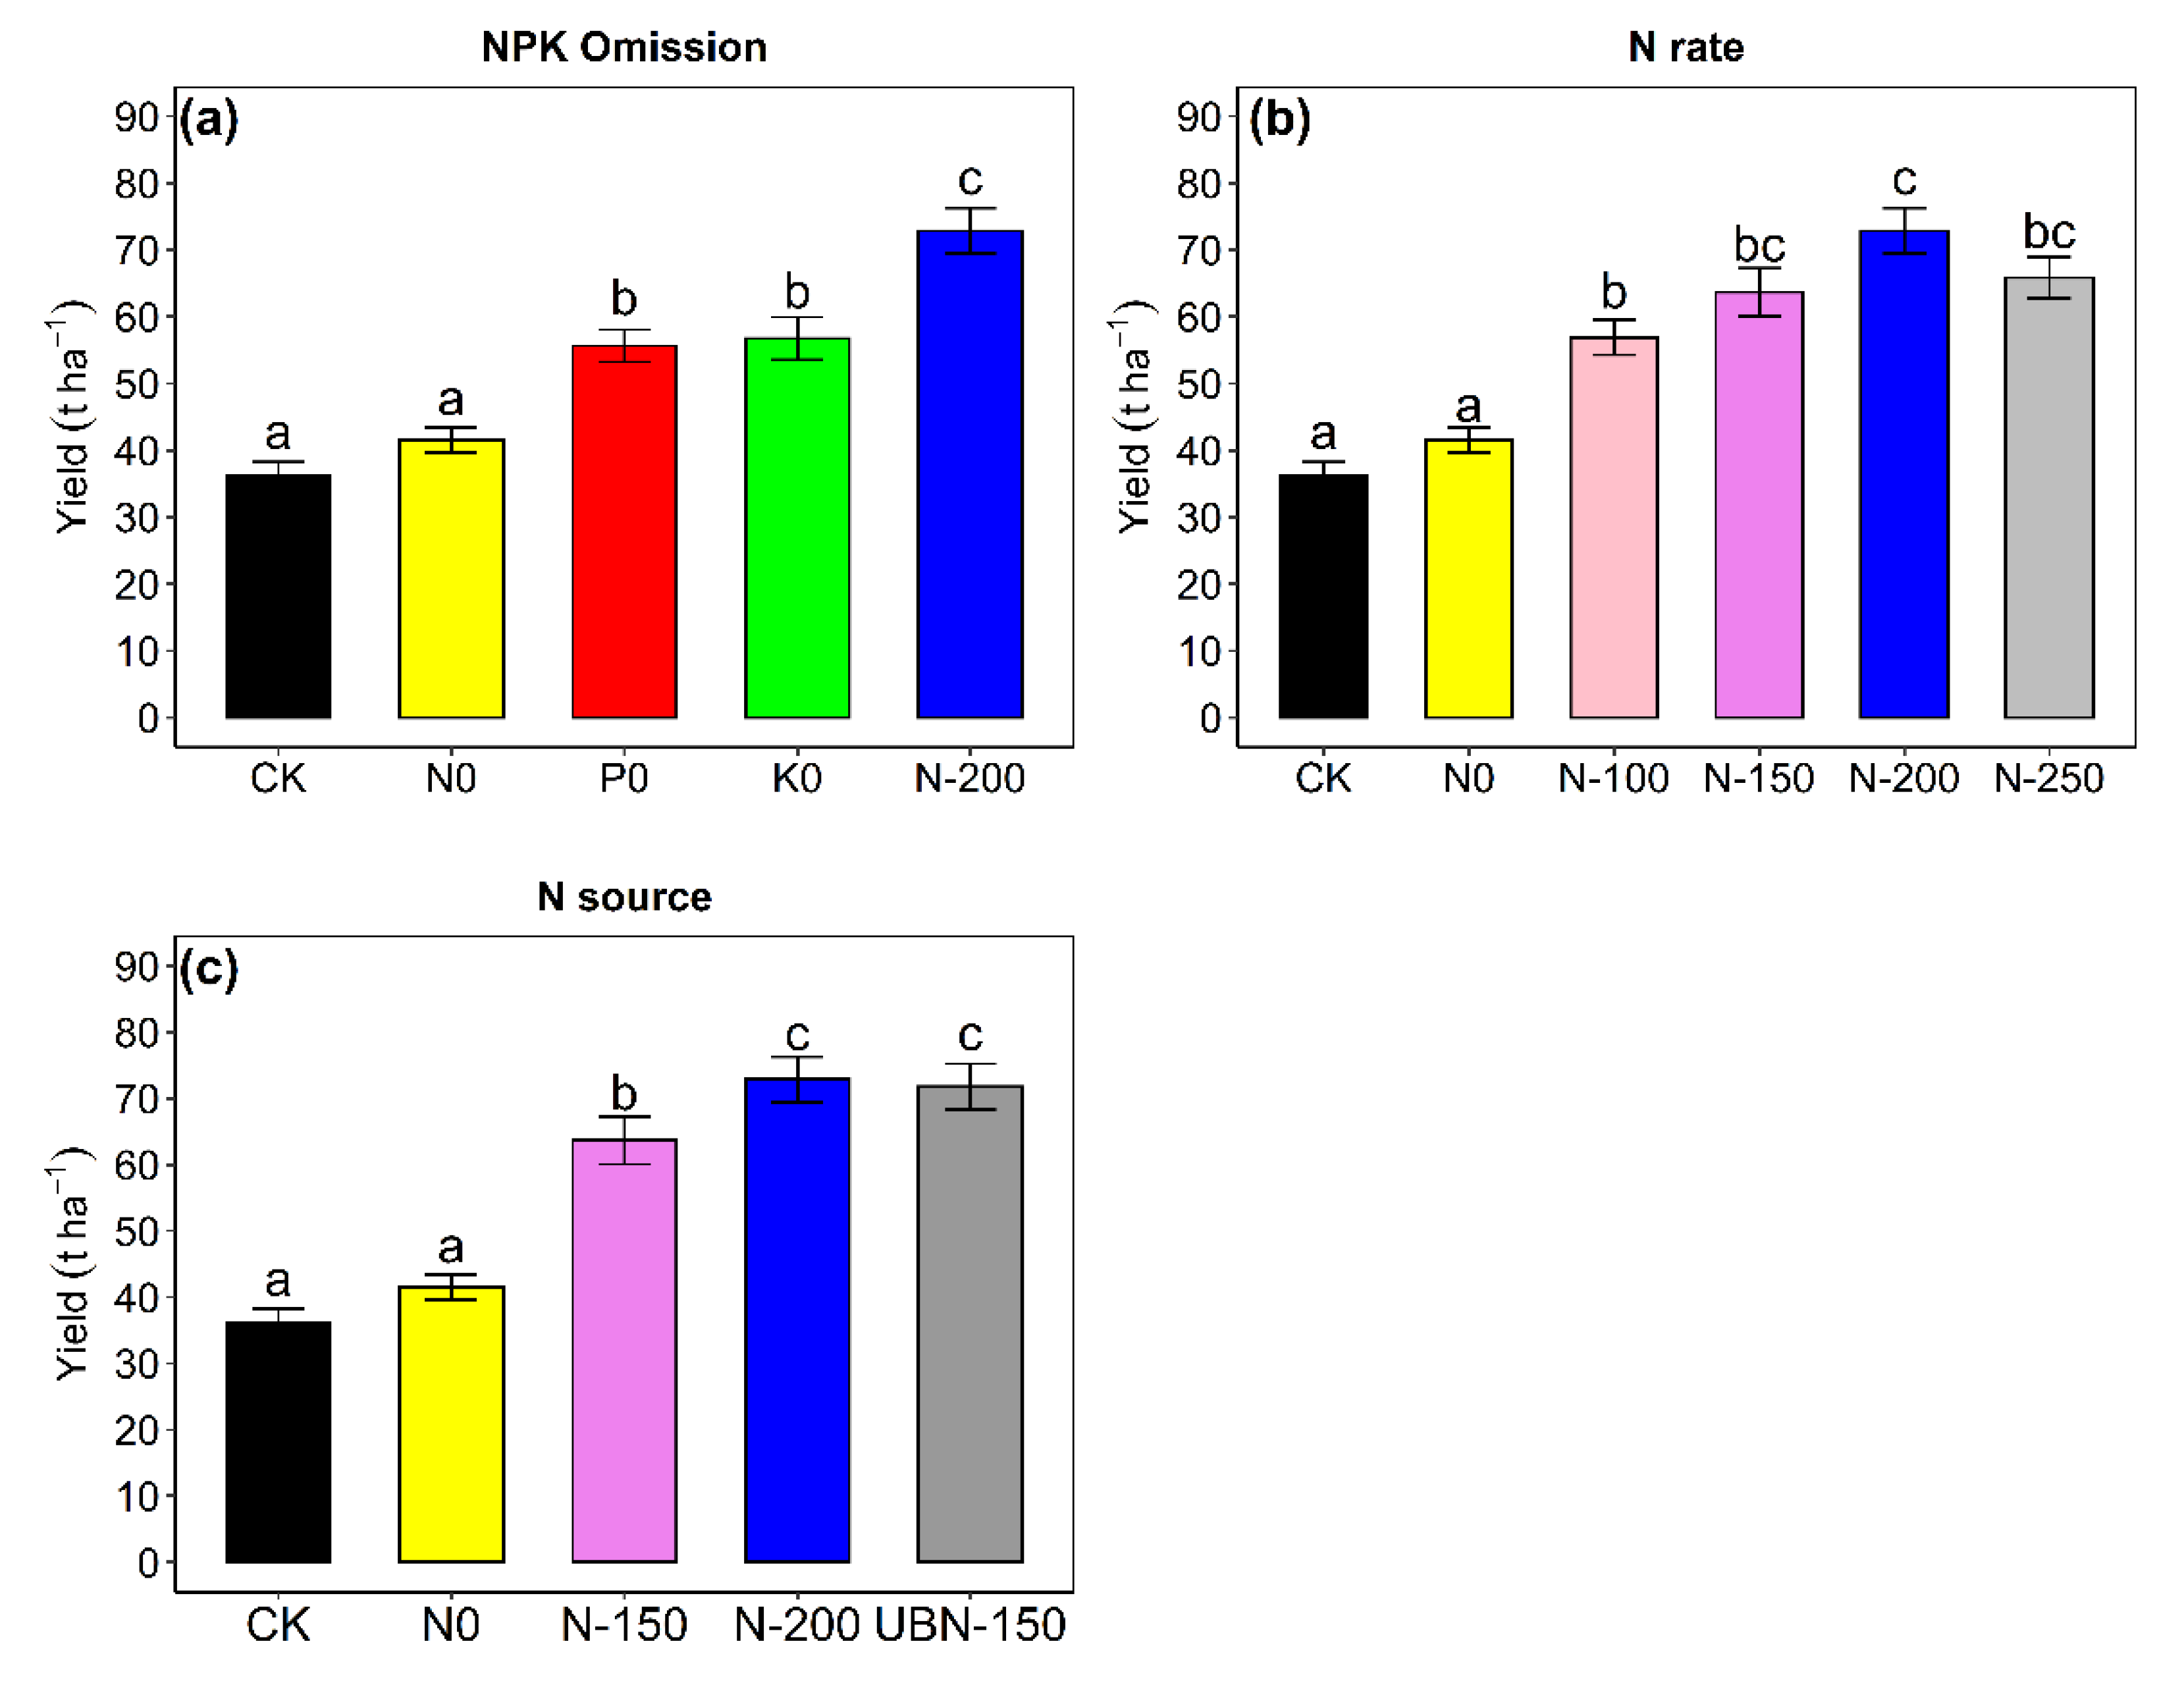
3.1.1. Effects of Nutrient Omission

The tomato yield was significantly affected by nutrient omission across the districts (Figure 2a). To identify the limiting nutrient for yield, NPK omission was compared with the recommended NPK fertilizer (RP: N200 treatment) and a control (without NPK fertilizer: CK). On average, nitrogen omission (N0) reduced the tomato yield by 43% (41.5 ± 1.9 t ha−1) compared with RP (72.8 ± 3.5 t ha−1). P omission (P0) and K omission (K0) reduced the yield by 23% and 22% compared with RP. There was no significant difference between N0 and CK, while a significant difference was observed with P0 and K0 over CK, illustrating that N was the most limiting nutrient.

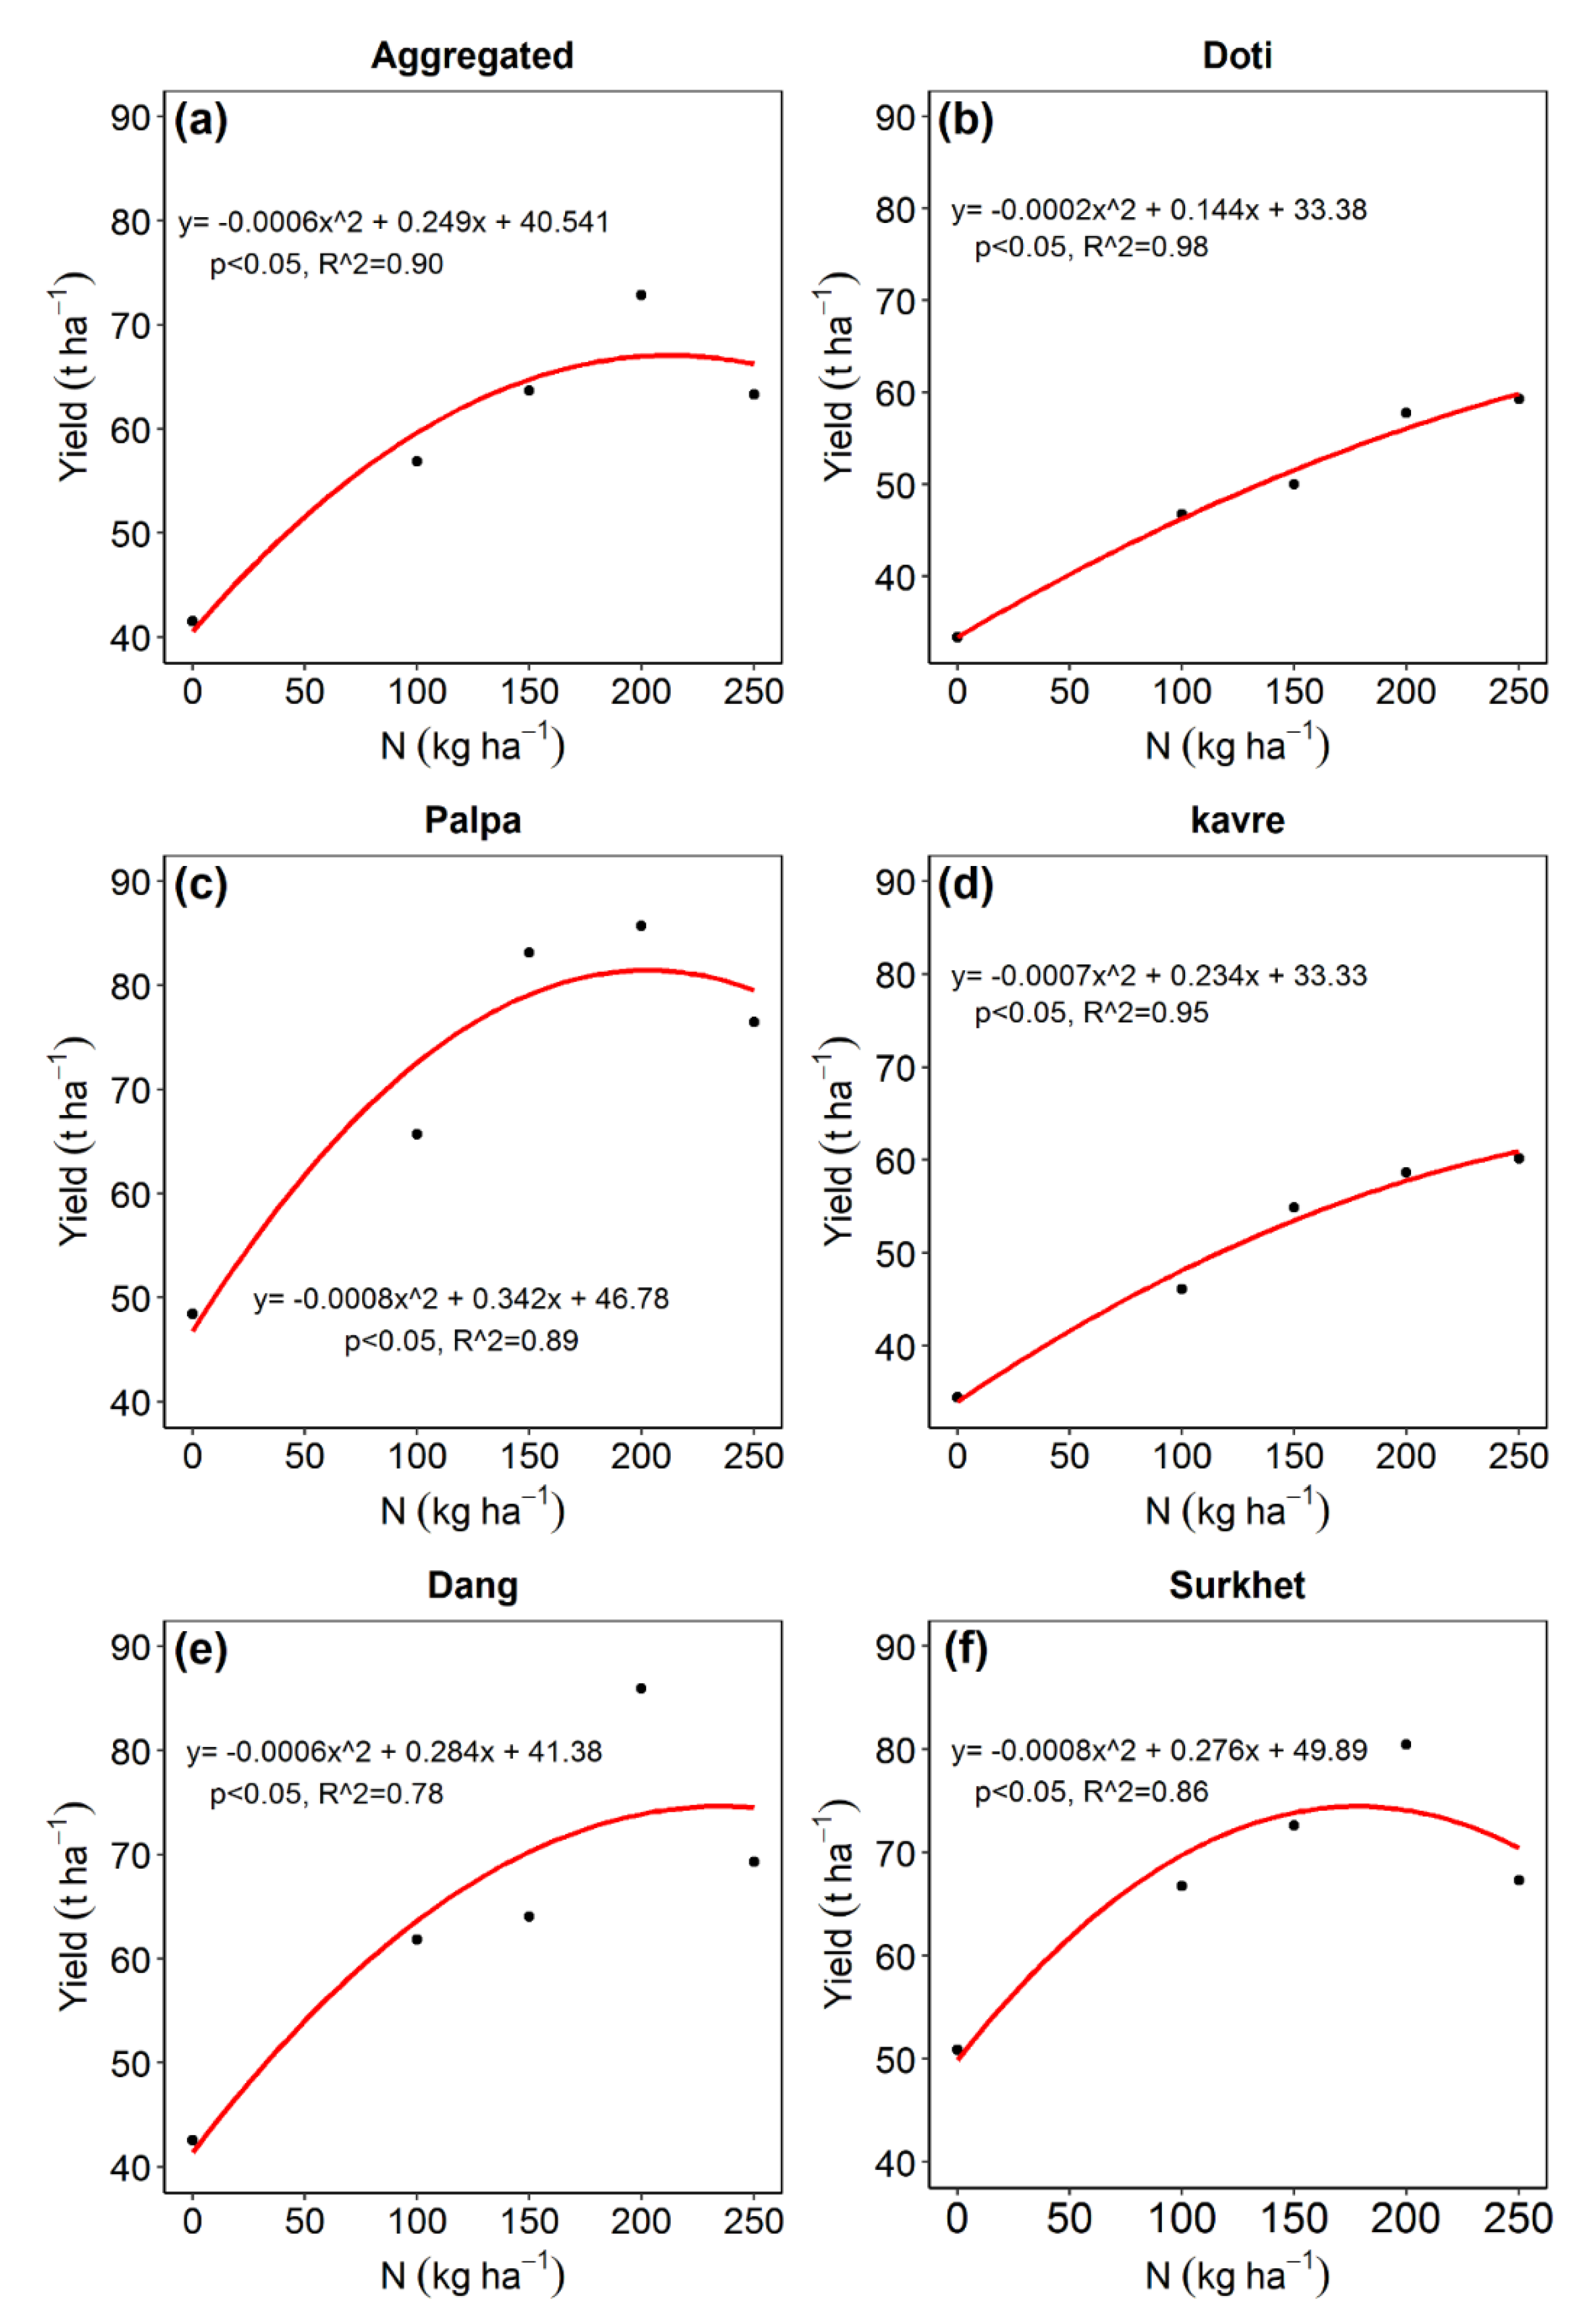
3.1.2. Variable N Rates

Different N rates had significant effects (p < 0.05) on the tomato yield across the districts (Figure 2b). Application of N at 100, 150, 200 and 250 kg ha−1 increased yields by 27% (56.8 ± 2.6), 35% (63.6 ± 3.6 t ha−1), 43% (72.8 ± 3.4 t ha−1) and 27% (65.8 ± 3.1 t ha−1), respectively, compared with the treatment without N fertilizer (N0: 41.5 ± 1.9 t ha−1) (Figure 2b). Similarly, N applied at 100, 150, 200 and 250 kg ha−1 increased yields by 36%, 43%, 50% and 49% over CK (36 t ha−1) (Figure 2b). The maximum yield was observed with N-200. The tomato yield responded quadratically to the added N fertilizer rates across the districts (Figure 4). Based on the N-response curve, the optimum N rates for tomato yield could range between 150–200 kg N ha−1 across districts (Figure 4). The addition of N fertilizer beyond 200 kg ha−1 reduced the average yield by up to 10% (Figure 4a).

3.1.3. N source and Placement
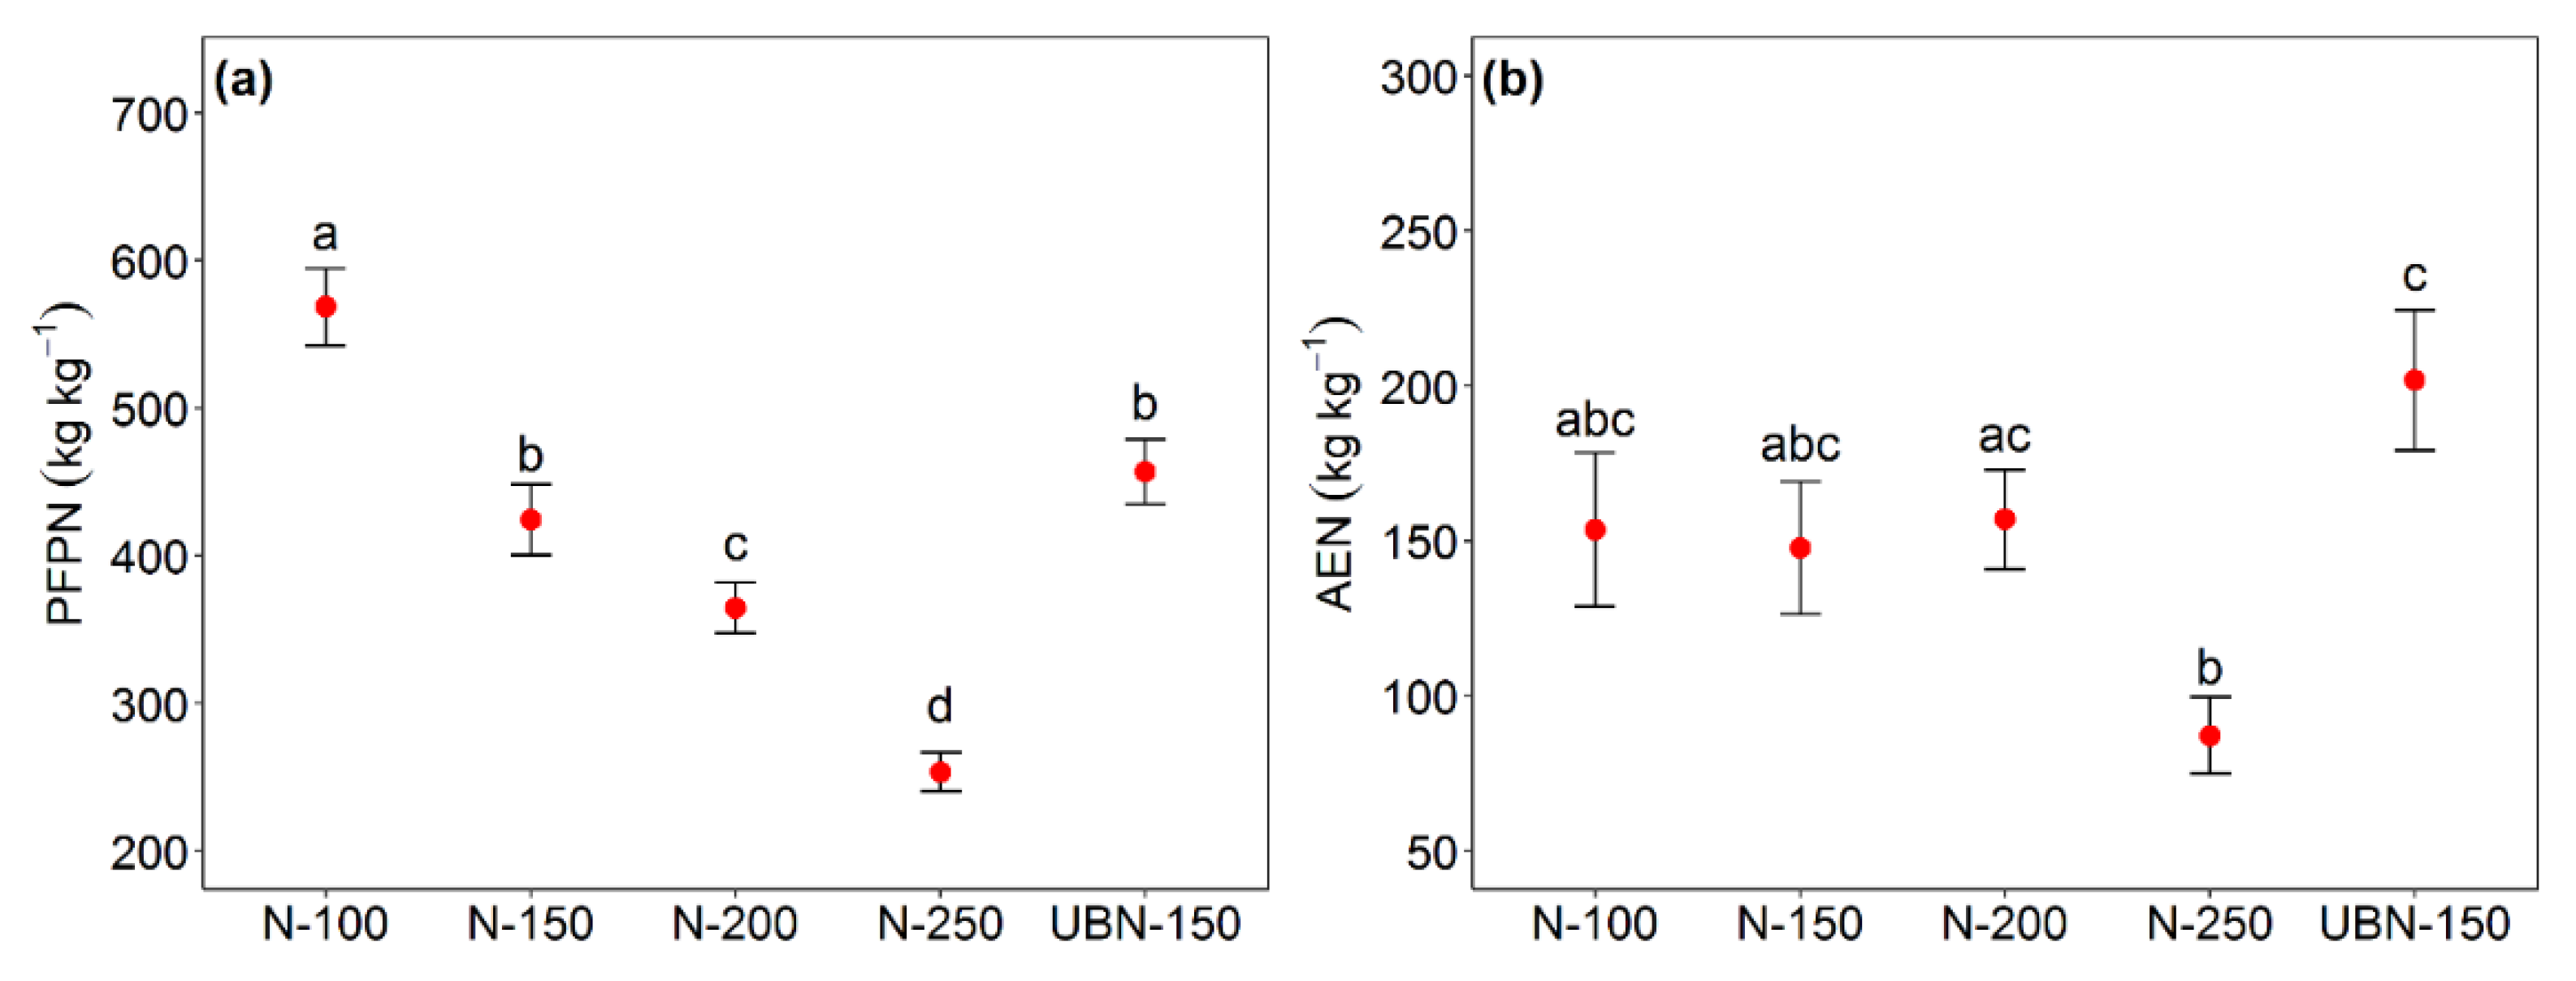
The agronomic effect of UB deep placement was compared with conventional urea use and practices. N-200 (the recommended rate) and N-150 (the same rate as UB) were compared with UB deep placement applied at 150 kg N ha−1 (UBN-150). N-150, N-200 and UBN-150 increased the yield (p < 0.05) by 43%, 50% and 49% over CK and by 35%, 43 %, and 42% over N0 (Figure 2c). The application of UB and CU at 150 kg N ha−1 showed a significant effect on the tomato yield with an average increase of 12% (71.9 ± 3.4 t ha−1) over CU (63.6 ± 3.6 t ha−1) (Figure 2c).

3.2. PFPN and AEN

Significant differences were observed among the N fertilizer treatments (N-100, N-150, N-200, N-250 and UBN-150) in the PFPN and AEN (Figure 5). PFPN and AEN were calculated to identify the efficiency of the added fertilizer in raising tomato yields.
PFPN was the highest for N-100 (568 ± 26 kg kg−1) followed by UBN-150 (457 ± 22 kg kg−1), N-150 (424 ± 24 kg kg−1), N-200 (364 ± 17 kg kg−1) and N-250 (253 ± 13 kg kg−1) (Figure 5a). A similar trend was observed for PFPN in these N fertilizer treatments in all the districts (Table 3). AEN was highest for UBN-150 (202 ± 23 kg kg−1), followed by N-200 (157 ± 16 kg kg−1), N-100 (154 ± 25 kg kg−1), N-150 (148 ± 21 kg kg−1) and N-250 (87 ± 2 kg kg−1) (Figure 5b). We found significant differences between N-250 and UBN-150 in AEN, with an average increase of 57% with UBN-150 over N-250 (Figure 5b) and saw similar trends for AEN in all districts (Table 3).

4. Discussion

Nitrogen fertilizer strongly influenced the tomato yields across the district sites (Figure 2). The omission of N fertilizer (N0) reduced the yield by twice as much as omission of P (P0) and K (K0) (Figure 2a), illustrating that N was the most limiting plant nutrient for tomato growth and development in those study districts, corroborating the results of previous studies in Nepal [13,23]. The fact that we found no significant differences between N0 (receiving a full dose of P and K) and CK indicates that there were no significant effects of P and K addition on the tomato yield. However, when compared with full NPK (recommended rate), on an average, there were significant differences in the tomato yield with P0 and K0 (Figure 2a), possibly due to synergistic effects among N, P and K [26,27]. Positive interactions (synergistic) among applied fertilizers increase nutrient use efficiency and yields [27]. The results from the NPK omission plot indicate that farmers should focus on optimizing N fertilizer management and adopt a balanced fertilization to have a synergistic effect and obtain higher tomato yields across the study sites.
After identifying N as the most important yield-limiting nutrient, the next step is to find strategies to increase NUE and achieve a better yield. Optimizing N fertilizer is an integral contributor to crop yield [15,25]. Our study identified the optimal N rate based on the yield response of tomato, which varied across the districts (Figure 4). Tomato yield increased with increasing N rate up to 200 kg N ha−1 [28] and began to decline beyond that rate (Figure 4a). When the rate was increased from 200 to 250 kg N ha−1, the yield was reduced from 11 to 16% in Palpa, Dang and Surkhet, whereas negligible yield increases (parabolic) were observed in Doti and Kavre with an average of 2.5% (Figure 4b–f). Earlier studies have reported parabolic quadratic responses to different N rates, but the optimum rate varied in different studies based on different agro-ecological domains [11,12,14,15,29]. Li et al. [12] reported 300 kg N ha−1 to be the optimum for tomato yield (110 t ha−1), beyond which there was no yield increase and the yield declined when N rates were raised to 450 kg ha−1. Similarly, another study [30] showed optimum tomato yields at 180 kg N ha−1, beyond which the yield increment was negligible up to 300 kg N ha−1. In our study, the yield increased by 43% at the optimum N rate of 200 kg ha−1 (Figure 4a). This is in close agreement with the meta-analysis conducted by Cheng et al. [25], where the optimal N rate ranged from 230 to 345 kg ha−1, with an average increase of 59% in tomato yields (Figure 4a). In addition to its agronomic benefits, the identification of an optimum N rate is of high economic value in terms of reducing fertilizer costs and increasing profits, as well as environmental benefits in the form of greater NUE and reduced N leaching and nitrous oxide emissions [7,30].
Improved N application methods also increase NUE and help to better meet crop nutrient demand [28,31]. In our study, single UB applications of 150 kg N ha−1 with deep placement increased yields by 12% over conventional urea applied at the same N rate. UB with 25% less N produced similar tomato yields as conventional urea applied at the recommended rate (200 kg N ha−1). Few studies have assessed the agronomic effect of UB on vegetables, and markedly not on tomato. Thus, our results are discussed in reference to the agronomic effect observed in other vegetable and crops. In line with our results, Akter et al. [31] reported a 7.4% increase in bitter gourd yields with use of UB instead of the recommended conventional urea. In our previous studies, the application of UB increased cauliflower yield by 24% over the recommended CU [24]. The benefits of UB for cereal crops such as maize and rice are well documented [20,32,33].
The characteristics of the experimental sites, including the varied soil characteristics and biophysical factors such as temperature and rainfall, exerted significant and varied effects on the tomato yields, which were higher in Dang, Surkhet and Palpa and lower in Doti and Kavre (Figure 3) [34,35,36]. However, in our study, moderate variation in soil characteristics across districts (Table 1) did not exert a significant effect on tomato yield (Figure S3). Across the districts, soil pH, OC, total N, and available P and K were within the optimum range required for better tomato growth and development. Temperature variations might have affected yields, as temperature significantly influences leaf growth, truss appearance, pollination and fruiting [36]. Higher temperatures also favor early growth and enhanced photosynthesis under regularly irrigated conditions [35,36]. Higher tomato yields in Dang and Surkhet could thus be due to the higher temperatures at the experimental sites than at those in Doti and Kavre (Figure S2). In Palpa, higher yields may owe to a greater amount of available P (Table 1), which plays a significant role in root and shoot growth and fruit development [37].
PFPN and AEN are important indices that help farmers and commercial growers to gauge the efficiency of added N fertilizer and its contributions to marketable yield [14]. PFPN decreased drastically with an increasing N rate (Figure 5a). AEN was found consistent while adding N from 100 kg ha−1 to 200 kg ha−1, after which it decreased drastically with further N up to 250 kg ha−1 (Figure 5b). The decreased PFPN and AEN with excessive N fertilizer was in line with earlier studies [12,14]. UBN-150 increased PFPN by 8% and 21% and AEN by 22% and 27% over conventional urea applied at same rate (N-150) and the recommended N practice (N-200) (Figure 5). In accordance with this, previous studies have reported significant benefits of UB with deep placement in increasing NUE [13,38] and reducing N losses to the environment [6,20].
Considering the associated tomato yield increases (Figure 2b,c and Figure 4a) and AEN (Figure 5), the application of 200 kg N ha−1 in the form of CU and UB with 25% less N input (UBN-150) seems promising for achieving optimum tomato yields. Based on the yield response across the districts (Figure 4b–f), N could be applied at a rate of 150 kg ha−1 in Palpa and Kavre, and 200 kg ha−1 in Dang, Surkhet and Doti. The application of N fertilizer beyond this rate would not increase yield, and would reduce NUE and increase N losses through leaching and nitrous oxide emissions [6,19].
The average N use by farmers across the districts was 70 kg ha−1 (ranging from 27 to 286 kg ha−1) with an average tomato yield of 37 t ha−1 (ranging from 16 to 64 t ha−1) (Figure 1). In our result, N applied at a rate of 200 kg N ha−1 (recommended N) following improved management practices and UB with deep placement produced an average yield of 72.4 t ha−1 (Figure 2c), an increase of around 35.4 t ha−1. This indicates that the use of the optimum N rate and an efficient N source with improved technology along with balanced fertilization (P and K addition) can increase the tomato yield by 49% over farmers’ current fertilizer management practices. Moreover, considering the cost of urea (0.18 US$ kg−1) and UB (0.22 US$ kg−1) and keeping other input and management (seed and labor) costs constant, the use of 200 kg N in the form of CU and 150 kg N in the form of UB can provide a savings of around US $15,500 per hectare over farmers’ current nutrient management practices.

5. Conclusions

Our study suggests that nitrogen is the most important factor among the primary nutrients affecting tomato yields. Optimizing N fertilization appears to be crucial for increasing yield, NUE and tomato farmers’ profits. However, optimum N rates can vary across soil types and agro-ecologies and ranged from 150 to 200 kg N ha−1. An N rate beyond 200 kg N ha−1 decreased yields and NUE. This study is representative of a sub-tropical climate; thus, future studies should be focused in tropical, temperate and other agro-ecological zones to recommend N fertilization across Nepal. Moreover, the right timing of N fertilization can substantially increase NUE and yields and reduce environmental pollution, thus future studies should be focused on investigating the right time for N fertilization to achieve higher yields and a healthy ecosystem.
The use of UB allowed the use of up to 25% less N (150 kg N ha−1) than the conventional urea dose of 200 kg N ha−1 without reducing yields. UB showed the highest AEN among the various N treatments, illustrating that deep placement or root zone applications are efficient in increasing yields and reducing environmental costs. Our results suggest the advisability of government policy support for large-scale production and distribution of UB in Nepal and the need to scale out the optimization of N fertilization and UB with deep placement at the farm level for sustainable agronomic and economic development in tomato farming.

Supplementary Materials

The following supporting information can be downloaded at: https://www.mdpi.com/article/10.3390/soilsystems6030072/s1, Figure S1: Field trial locations across five districts in Nepal (Source: Department of Survey, Nepal); Figure S2: Annual minimum, maximum temperatures, and precipitation during growing period of tomato across five districts in the year 2018. Temperature and rainfall data were extracted from National Oceanic and Atmospheric Administration (NOAA; https://psl.noaa.gov) and rainfall estimates from Rain Gauze and Satellite Observations (CHIRPS; ftp://ftp.chg.ucsb.edu/pub/org/chg/products/CHIRPS-2.0) respectively; Figure S3: Relationship between soil chemical properties and yield to identify indigenous soil nutrient supply across the districts (n = 28).

Author Contributions

Conceptualization, N.R.P., Y.K.G., D.C., S.P.V., S.M. and K.D.; methodology, N.R.P., Y.K.G., D.C., K.D. and S.P.V.; formal analysis, N.R.P.; data curation, N.R.P. and S.M; writing—original draft preparation, N.R.P.; writing—review and editing, N.R.P., Y.K.G., D.C., S.P.V., K.D. and S.M; supervision, D.C. and Y.K.G. All authors have read and agreed to the published version of the manuscript.

Funding

This research was funded by the United States Agency for International Development through the project Feed the Future Nepal Seed and Fertilizer [cooperative Agreement number AID-367-IO-16-00001].

Institutional Review Board Statement

Not applicable.

Informed Consent Statement

Not applicable.

Data Availability Statement

Not applicable.

Acknowledgments

We acknowledge the USA Agency for International Development (USAID) for providing the research support through the Feed the Future Nepal Seed and Fertilizer Project (Cooperative Agreement number AID-367-IO-16-00001). We thank cooperative members across the districts for their help in selecting farmers’ field to conduct the trials. We thank Krishna Kafle from CIMMYT for providing the temperature and weather data. Moreover, we thank our colleagues (Surya Bahadur Thapa, Roshan Subedi, Dilli Chalisey, Srijana Poudel, Kedar Nepal, Uttam Kunwar, Roshan Shah and Rajendra Upadhyaya) for their technical and practical assistance and field supervision during the study period. We are grateful to George Michael Listman for editing to improve language usage and clarity.

Conflicts of Interest

Authors declare no conflict of interest.

References

  1. Magar, D.B.; Gauchan, D.; Timsina, K.P.; Ghimire, Y.N. Srijana Hybrid Tomato: A Potential Technology for Enterprise Development in Nepal; Socioeconomics & Agricultural Research Policy Division, Nepal Agricultural Research Council: Lalitpur, Nepal, 2016. [Google Scholar]
  2. Ghimire, N.P.; Kandel, M.; Aryal, M.; Bhattarai, D. Assessmentof Tomato Consumption and Demand in Nepal. J. Agric. Environ. 2017, 18, 83–94. [Google Scholar] [CrossRef]
  3. Joshi, N.P.; Piya, L. Determinants of Small-Scale Commercial Vegetable Farming among Vegetable Growers in Nepal. Sage Open 2021, 11, 21582440211010170. [Google Scholar] [CrossRef]
  4. Devkota, K.P.; McDonald, A.J.; Khadka, L.; Khadka, A.; Paudel, G.; Devkota, M. Fertilizers, Hybrids, and the Sustainable Intensification of Maize Systems in the Rainfed Mid-Hills of Nepal. Eur. J. Agron. 2016, 80, 154–167. [Google Scholar] [CrossRef]
  5. Brown, S.; Schreier, H.; Shah, P.B.; Lavkulich, L.M. Modelling of Soil Nutrient Budgets: An Assessment of Agricultural Sustainability in Nepal. Soil Use Manag. 1999, 15, 101–108. [Google Scholar] [CrossRef]
  6. Gaihre, Y.K.; Singh, U.; Islam, S.M.M.; Huda, A.; Islam, M.R.; Satter, M.A.; Sanabria, J.; Islam, M.R.; Shah, A.L. Impacts of Urea Deep Placement on Nitrous Oxide and Nitric Oxide Emissions from Rice Fields in Bangladesh. Geoderma 2015, 259, 370–379. [Google Scholar] [CrossRef]
  7. Naz, M.Y.; Sulaiman, S.A. Slow Release Coating Remedy for Nitrogen Loss from Conventional Urea: A Review. J. Control. Release 2016, 225, 109–120. [Google Scholar] [CrossRef]
  8. Kokare, V.G.; Kasture, M.C.; Palsande, V.N.; Mhalshi, R.M. Effect of Different Fertilizer Briquettes and Organic Manures on Yield, Nutrients Uptake and Chemical Properties of Soil in Chilli (Capsicum annuum L.) in Lateritic Soils of Konkan. Int. J. Agric. Sci. Res. 2015, 5, 13–18. [Google Scholar]
  9. Mugwe, J.; Mugendi, D.; Kungu, J.; Muna, M.-M. Maize Yields Response to Application of Organic and Inorganic Input under On-Station and On-Farm Experiments in Central Kenya. Exp. Agric. 2009, 45, 47–59. [Google Scholar] [CrossRef]
  10. Witt, C.; Dobermann, A. A Site-Specific Nutrient Management Approach for Irrigated, Lowland Rice in Asia. Better Crops Int. 2002, 16, 20–24. [Google Scholar]
  11. Du, Y.; Cao, H.; Liu, S.; Gu, X.; Cao, Y. Response of Yield, Quality, Water and Nitrogen Use Efficiency of Tomato to Different Levels of Water and Nitrogen under Drip Irrigation in Northwestern China. J. Integr. Agric. 2017, 16, 1153–1161. [Google Scholar] [CrossRef]
  12. Li, H.; Liu, H.; Gong, X.; Li, S.; Pang, J.; Chen, Z.; Sun, J. Optimizing Irrigation and Nitrogen Management Strategy to Trade off Yield, Crop Water Productivity, Nitrogen Use Efficiency and Fruit Quality of Greenhouse Grown Tomato. Agric. Water Manag. 2021, 245, 106570. [Google Scholar] [CrossRef]
  13. Dhakal, K.; Baral, B.R.; Pokhrel, K.R.; Pandit, N.R.; Gaihre, Y.K.; Vista, S.P. Optimizing N Fertilization for Increasing Yield and Profits of Rainfed Maize Grown under Sandy Loam Soil. Nitrogen 2021, 2, 359–377. [Google Scholar] [CrossRef]
  14. Elia, A.; Conversa, G. Agronomic and Physiological Responses of a Tomato Crop to Nitrogen Input. Eur. J. Agron. 2012, 40, 64–74. [Google Scholar] [CrossRef]
  15. Du, Y.-D.; Zhang, Q.; Cui, B.-J.; Sun, J.; Wang, Z.; Ma, L.-H.; Niu, W.-Q. Aerated Irrigation Improves Tomato Yield and Nitrogen Use Efficiency While Reducing Nitrogen Application Rate. Agric. Water Manag. 2020, 235, 106152. [Google Scholar] [CrossRef]
  16. Chen, Z.; Wang, Q.; Ma, J.; Zou, P.; Jiang, L. Impact of Controlled-Release Urea on Rice Yield, Nitrogen Use Efficiency and Soil Fertility in a Single Rice Cropping System. Sci. Rep. 2020, 10, 10432. [Google Scholar] [CrossRef] [PubMed]
  17. Dhital, S.; Raun, W.R. Variability in Optimum Nitrogen Rates for Maize. Agron. J. 2016, 108, 2165–2173. [Google Scholar] [CrossRef]
  18. Zhang, T.Q.; Tan, C.S.; Liu, K.; Drury, C.F.; Papadopoulos, A.P.; Warner, J. Yield and Economic Assessments of Fertilizer Nitrogen and Phosphorus for Processing Tomato with Drip Fertigation. Agron. J. 2010, 102, 774–780. [Google Scholar] [CrossRef]
  19. Jones, J.D. Nutrient Use Efficiency—A Metric to Inform 4R Nutrient Stewardship. Crops Soils 2021, 54, 42–48. [Google Scholar] [CrossRef]
  20. Agyin-Birikorang, S.; Winings, J.H.; Yin, X.; Singh, U.; Sanabria, J. Field Evaluation of Agronomic Effectiveness of Multi-Nutrient Fertilizer Briquettes for Upland Crop Production. Nutr. Cycl. Agroecosyst. 2018, 110, 395–406. [Google Scholar] [CrossRef]
  21. Singh, U.; Wilkens, P.; Jahan, I.; Sanabria, J.; Kovach, S. Enhanced Efficiency Fertilizers. In Proceedings of the World Congress of Soil Science, Soil Solutions for a Changing World, Brisbane, Australia, 1–6 August 2010; Volume 16. [Google Scholar]
  22. Bowen, W.T.; Diamond, R.B.; Singth, U.; Thompson, T.R. Urea Deep Placement Increases Yield and Saves Nitrogen Fertilizer in Farmers’ Fields in Bangladesh. In Rice is Life Scientific Perspectives for the 21st Century; International Rice Research Institute: Los Baños, Philippines, 2005. [Google Scholar]
  23. Baral, B.R.; Pande, K.R.; Gaihre, Y.K.; Baral, K.R.; Sah, S.K.; Thapa, Y.B.; Singh, U. Increasing Nitrogen Use Efficiency in Rice through Fertilizer Application Method under Rainfed Drought Conditions in Nepal. Nutr. Cycl. Agroecosyst. 2020, 118, 103–114. [Google Scholar] [CrossRef]
  24. Pandit, N.R.; Gaihre, Y.K.; Gautam, S.; Maharjan, S.; Vista, S.P.; Choudhary, D. Enhanced-Efficiency Nitrogen Fertilizer Boosts Cauliflower Productivity and Farmers’ Income: Multi-Location and Multi-Year Field Trials across Nepal. Exp. Agric. 2022, 58, E14. [Google Scholar] [CrossRef]
  25. Akter, H.; Tarafder, S.K.; Huda, A.; Mahmud, A.A. Effect of Prilled Urea, Urea and NPK Briquettes on the Yield of Bitter Gourd in Two Upazillas of Jessore District. J. Environ. Sci. Nat. Resour. 2015, 8, 157–160. [Google Scholar] [CrossRef]
  26. Cheng, M.; Wang, H.; Fan, J.; Xiang, Y.; Tang, Z.; Pei, S.; Zeng, H.; Zhang, C.; Dai, Y.; Li, Z. Effects of Nitrogen Supply on Tomato Yield, Water Use Efficiency and Fruit Quality: A Global Meta-Analysis. Sci. Hortic. 2021, 290, 110553. [Google Scholar] [CrossRef]
  27. Akinnifesi, F.K.; Makumba, W.; Sileshi, G.; Ajayi, O.C.; Mweta, D. Synergistic Effect of Inorganic N and P Fertilizers and Organic Inputs from Gliricidia Sepium on Productivity of Intercropped Maize in Southern Malawi. Plant Soil 2007, 294, 203–217. [Google Scholar] [CrossRef]
  28. Rietra, R.P.J.J.; Heinen, M.; Dimkpa, C.O.; Bindraban, P.S. Effects of Nutrient Antagonism and Synergism on Yield and Fertilizer Use Efficiency. Commun. Soil Sci. Plant Anal. 2017, 48, 1895–1920. [Google Scholar] [CrossRef]
  29. Cheng, Y.; Wang, H.-Q.; Liu, P.; Dong, S.-T.; Zhang, J.-W.; Zhao, B.; Ren, B.-Z. Nitrogen Placement at Sowing Affects Root Growth, Grain Yield Formation, N Use Efficiency in Maize. Plant Soil 2020, 457, 355–373. [Google Scholar] [CrossRef]
  30. Badr, M.A.; Abou-Hussein, S.D.; El-Tohamy, W.A. Tomato Yield, Nitrogen Uptake and Water Use Efficiency as Affected by Planting Geometry and Level of Nitrogen in an Arid Region. Agric. Water Manag. 2016, 169, 90–97. [Google Scholar] [CrossRef]
  31. Thompson, R.B.; Martínez-Gaitan, C.; Gallardo, M.; Giménez, C.; Fernández, M.D. Identification of Irrigation and N Management Practices That Contribute to Nitrate Leaching Loss from an Intensive Vegetable Production System by Use of a Comprehensive Survey. Agric. Water Manag. 2007, 89, 261–274. [Google Scholar] [CrossRef]
  32. Dhakal, K.; Baral, B.R.; Pokhrel, K.R.; Pandit, N.R.; Thapa, S.B.; Gaihre, Y.K.; Vista, S.P. Deep Placement of Briquette Urea Increases Agronomic and Economic Efficiency of Maize in Sandy Loam Soil. Agrivita 2020, 42, 499–508. [Google Scholar] [CrossRef]
  33. Pandit, N.R.; Gaihre, Y.K.; Choudhary, D.; Subedi, R.; Thapa, S.B.; Maharjan, S.; Khadka, D.; Vista, S.P.; Rusinamhodzi, L. Slow but Sure: The Potential of Slow-Release Nitrogen Fertilizers to Increase Crop Productivity and Farm Profit in Nepal. J. Plant Nutr. 2022, 1–18. [Google Scholar] [CrossRef]
  34. Ojeniyi, S.O. Effect of Poultry Manure on Selected Soil Physical and Chemical Properties, Growth, Yield and Nutrient Status of Tomato. Afr. J. Agric. Res. 2008, 3, 612–616. [Google Scholar]
  35. Helyes, L.; Lugasi, A.; Pek, Z. Effect of Irrigation on Processing Tomato Yield and Antioxidant Components. Turk. J. Agric. For. 2012, 36, 702–709. [Google Scholar] [CrossRef]
  36. Van Ploeg, D.; Heuvelink, E. Influence of Sub-Optimal Temperature on Tomato Growth and Yield: A Review. J. Hortic. Sci. Biotechnol. 2005, 80, 652–659. [Google Scholar] [CrossRef]
  37. Zhu, Q.; Ozores-Hampton, M.; Li, Y.; Morgan, K.; Liu, G.; Mylavarapu, R.S. Effect of Phosphorus Rates on Growth, Yield, and Postharvest Quality of Tomato in a Calcareous Soil. HortScience 2017, 52, 1406–1412. [Google Scholar] [CrossRef]
  38. Gautam, S.; Tiwari, U.; Sapkota, B.; Sharma, B.; Parajuli, S.; Pandit, N.R.; Gaihre, Y.K.; Dhakal, K. Field Evaluation of Slow-Release Nitrogen Fertilizers and Real-Time Nitrogen Management Tools to Improve Grain Yield and Nitrogen Use Efficiency of Spring Maize in Nepal. Heliyon 2022, 8, e09566. [Google Scholar] [CrossRef]
Figure 1. N (a), P (b) and K (c) fertilizers used by farmers across the study districts i.e., Doti (n = 18), Palpa (n = 17), Kavre (n = 10), Dang (n = 36) and Surkhet (n = 12); mean ± SE. The red dashed lines in a, b and c indicate the recommended N, P and K fertilizer rates in Nepal, respectively. Tomato yields (d) were from farmers’ fields with their own fertilization practices.
Soilsystems 06 00072 g001
Figure 2. Average tomato yield (mean ± SE) under zero NPK (a), variable N rate (b) and N source (urea vs UB) plots (c): CK = control, N0 = nitrogen omission, P0 = Phosphorus omission, K0 = Potassium omission, N-100, N-150, N-200 and N-250 represent the N fertilizer applied at rates of 100, 150, 200 and 250 Kg ha−1, respectively, in the form of regular urea; UBN-150 represents the urea briquette fertilizer applied at 150 kg N ha−1. Different letters inside a bar denote significant differences between the treatments (post hoc Tukey test, p < 0.05).
Soilsystems 06 00072 g002
Figure 3. Effect of location (districts) on tomato yield following the mixed effect model (n = 28). Different letters inside a bar represent significant differences in tomato yield across the district locations.
Soilsystems 06 00072 g003
Figure 4. Relationship between nitrogen fertilizer applied at five different rates and tomato yield across aggregated districts (a) and disaggregated by districts: Doti (b), Palpa (c), Kavre (d), Dang (e) and Surkhet (f). Each data point for aggregated and disaggregated districts is the average of five different N rates.
Soilsystems 06 00072 g004
Figure 5. Average partial factor productivity of N (PFPN (a)) and agronomic N use efficiency (AEN (b)) of various N rates and sources across districts; mean ± SE. Different letters above an error bar represent significant differences between different N treatments (post hoc Tukey test, p < 0.05).
Soilsystems 06 00072 g005
Table 1. Soil properties—texture, pH, organic matter (OM), total nitrogen (N), available phosphorous (P2O5) and available potassium (K2O) across districts (mean ± standard error (SE)).
Districts Texture (%)Textural
Class
pHOM Total N P2O5K2O
Sand Silt Clay g kg−1g kg−1(mg kg−1)(mg kg−1)
Doti46 ± 138 ± 216 ± 1loam6.42 ± 0.1231.10 ± 3.54 1.74 ± 0.2261.62 ± 15.91134.65 ± 27.92
Palpa44 ± 241 ± 115 ± 1loam6.51 ± 0.1331.73 ± 2.431.62 ± 0.1621.34 ± 4.84224.68 ± 70.35
Kavre45± 138 ± 117 ± 1loam5.89 ± 0.0316.05 ± 0.450.97 ± 0.0454.92 ± 9.32185.54 ± 30.05
Bardiya40 ± 240 ± 120 ± 1Loam6.75 ± 0.1419.20 ± 2.511.13 ± 0.1353.43 ± 9.7186.32 ± 16.03
Dang42 ± 137 ± 121 ± 0loam6.42 ± 0.0226.35 ± 0.531.35 ± 0.0447.79 ± 6.86158.48 ± 15.66
Surkhet40 ± 245 ± 115 ± 1loam6.60 ± 0.0829.28 ± 3.121.65 ± 0.1664.67 ± 15.62134.36 ± 11.90
Table 2. Description of the treatments.
TreatmentDescriptionNPKUrea/UBDAP/SSPMOPUrea/UBDAP/SSPMOP
kg ha−1kg ha−1g plot−1
CKControl000000000
N0Nitrogen omission01501500937250072120
P0Phosphorous omission200015043502502080120
K0Potassium omission200150030932601481570
N-100Nitrogen applied at 100 kg ha-11001501509232625045157120
N-150Nitrogen applied at 150 kg ha−115015015020032625096157120
N-200Nitrogen applied at 200 kg ha−1200150150309326250148157120
N-250Nitrogen applied at 250 kg ha−1250150150417326250200157120
UBN-150Nitrogen applied in the form of Urea briquette at 150 kg ha−115015015020032625096157120
Table 3. Partial factor productivity of N (PFPN) and agronomic N use efficiency (AEN) across districts; mean ± SE. Means followed by different letters within a column of each district represent significant differences between the treatments (post hoc Tukey test, p < 0.05).
Treatments DotiPalpaKavreDangSurkhet
PFPN (kg kg−1)
N-100468 ± 32 a657 ± 53 a462 ± 56 a619 ± 62 a668 ± 7 a
N-150334 ± 22 b555 ± 97 b366 ± 30 b427 ± 58 b484 ± 23 b
N-200289 ± 17 bc429 ±53 b293 ± 23 bc430 ± 38 b403 ± 14 b
N-250237 ± 15 c306 ± 48 c194 ± 22 c277 ± 36 c269 ± 12 c
UBN-150391 ± 15 b561 ± 71 b346 ± 30 b551 ± 49 a471 ± 14 b
AEN (kg kg−1)
N-100134 ± 26 ab172 ± 97 a117 ± 70 ab193 ± 66 ab158 ± 32 a
N-150111 ± 15 ab231 ± 107 a136 ± 31 a143 ± 61 ab145 ± 26 a
N-200122 ± 13 ab187 ± 65 a121 ± 37 ab217 ± 37 bc148 ± 22 a
N-250104 ± 14 a112 ± 53 a57 ± 20 b107 ± 38 a65 ± 15 b
UBN-150168 ± 20 b239 ± 86 a139 ± 50 a300 ± 37 c176 ± 47 a
Publisher’s Note: MDPI stays neutral with regard to jurisdictional claims in published maps and institutional affiliations.

