Article

Flood Pulse Irrigation of Meadows Shapes Soil Chemical and Microbial Parameters More Than Mineral Fertilization

1
Group of Environmental and Soil Chemistry, iES Landau, Institute for Environmental Sciences, University of Koblenz-Landau, Fortstraße 7, 76829 Landau, Germany
2
Group of Ecosystem Analysis, iES Landau, Institute for Environmental Sciences, University of Koblenz-Landau, Fortstraße 7, 76829 Landau, Germany
3
Group of Geoecology & Physical Geography, iES Landau, Institute for Environmental Sciences, University of Koblenz-Landau, Fortstraße 7, 76829 Landau, Germany
*
Author to whom correspondence should be addressed.
Soil Syst. 2021, 5(2), 24; https://doi.org/10.3390/soilsystems5020024
Submission received: 1 February 2021 / Revised: 28 March 2021 / Accepted: 29 March 2021 / Published: 2 April 2021

Abstract

:
While mineral fertilization increases agricultural yields, it also bears the risk of contaminating non-target ecosystems and negatively affecting soil chemical parameters and microbial communities. This calls for alternative and more sustainable agricultural practices that reduce the use of fertilizers. Flood pulse irrigation could be an alternative to mineral fertilization of hay meadows, since it increases the yield with little or no application of fertilizer. However, the positive and negative implications of flood pulse irrigation on soil chemical parameters and particularly soil microbial communities are still largely unknown. In this study, we assessed shifts in soil microbial communities (SMC) as a response to changes in soil chemical parameters after flood pulse irrigation and/or fertilization of meadows. We determined soil chemical (Corg, Ntot, water extractable N, P, K, pH) and microbial (phospholipid-derived fatty acids, PLFA) parameters of 12 meadows in a 2 × 2 factorial design, comprising flood pulse irrigation and fertilization. Corg, Ntot, and water content as well as microbial biomass were higher in flood-irrigated than in non-flooded soils. Soil microbial biomass positively correlated with Corg, Ntot, and water extractable N. Gram-negative bacteria significantly increased, whereas the fungi/bacteria ratio significantly decreased in flood-irrigated soils compared to non-flooded soils. Arbuscular mycorrhizal fungi were positively correlated with soil pH. Flood pulse irrigation seemed to promote the build-up of a larger soil carbon and nitrogen pool as well as higher water content and microbial biomass. By this, it potentially mitigated negative mineral fertilization effects such as changed soil pH and reduced carbon use efficiency. We conclude that flood pulse irrigation may represent a sustainable alternative to mineral fertilization.

1. Introduction

Flood pulse irrigation is a traditional method to increase the yields of hay meadows using the water of adjacent streams for a short-term (i.e., 2–4 day) flood pulse [1]. Reactivation of old flood irrigation systems can be a more sustainable alternative to the conventional practice using mineral fertilizer [2]. Flood pulses have a positive effect on plant growth due to introduced nutrients and increased water availability during dry periods [1]. Furthermore, additional nutrients may be released due to increased microbial activity followed by accelerated recycling of nutrients. Introduced nutrients, as, for example, dissolved organic matter in flooding water, and increased water availability are generally beneficial for microbial growth. Flooding is generally beneficial for carbon input and may increase soil organic carbon and nitrogen content [3,4]. This can be caused either by an improved plant growth and, respectively, increased root carbon deposition and litter input [3], or by organic matter accumulation due to reduced degradation efficiency of microbial communities if large soil zones become anaerobic [5]. However, the latter would significantly reduce the hay yield due to oxygen deficiencies for plant roots. Therefore, an optimal water management would keep the water content in a range that plant available water capacity can be maximal exhausted, while oxygen supply keeps soil conditions in an oxic state. These optimal conditions also support microbial carbon mineralization, which may level out an increased carbon input [6]. It is well known that soil microbial communities (SMC) are sensitive to soil water regime [7,8,9,10,11]. Soil fungi have been shown to be less dominant in soils with high water availability [10,12] or high nutrient contents [13]. Thus, also, the negative effects of flood pulse irrigation on certain groups within the SMC are possible, even when anoxic conditions are not reached.
Compared to flood pulse irrigation, there are much more investigations about the consequences of conventional agricultural practice on soil chemical and biological parameters. Long-term application of mineral fertilization can increase soil organic carbon (Corg) and soil microbial biomass [14]. However, it can also reduce soil pH, which is a key predictor for soil bacterial community structure and function [15], and could reduce soil microbial biomass. Additionally, important microbial plant symbionts, i.e., arbuscular mycorrhizal fungi (AMF; Glomeromycota, Fungi), are sensitive to mineral fertilizer application and decrease with increasing soil nitrogen content [16].
Soil microorganisms depend on Corg and nitrogen content as a source of energy and nutrient. However, besides Corg, microorganisms also depend on water availability [6,10,17], and hence, a more pronounced positive effect on microbial biomass is possible when both factors are combined (i.e., interaction effect) [18].
The response of the SMC structure to drying and re-wetting cycles depends on the duration and frequency of inundation [19,20,21]. Furthermore, SMC shifts are likely to occur once anoxic conditions are reached [9]. However, there is to our knowledge no study about the SMC response to a 2–4 day flood pulse that avoids stagnant water and thereby anoxic conditions. This study was carried out to better understand how meadow SMC structure changes in response to soil chemical parameters after long-term yearly flood pulse irrigation and fertilization. Assuming that flood pulse irrigation and mineral fertilization have distinct effects on soil chemical properties, we hypothesize (I) an interaction effect when both practices are combined. Moreover, we hypothesize (II) that such changes in soil chemical parameters would be reflected in SMC shifts. The interaction of flood pulse irrigation with mineral fertilization may intensify positive (increased Corg, microbial biomass) and mitigate negative effects (extreme pH-values, loss of AMF) of the respective practices on soil chemical parameters and SMC structures. Understanding the interplay of both practices may lead to an optimized and more sustainable agricultural land use management with reduced fertilizer application. In order to assess the changes in SMCs under different agricultural practice regimes, we analyzed phospholipid fatty acids (PLFA; [22]) as a fingerprint for SMC structure [23].

2. Materials and Methods

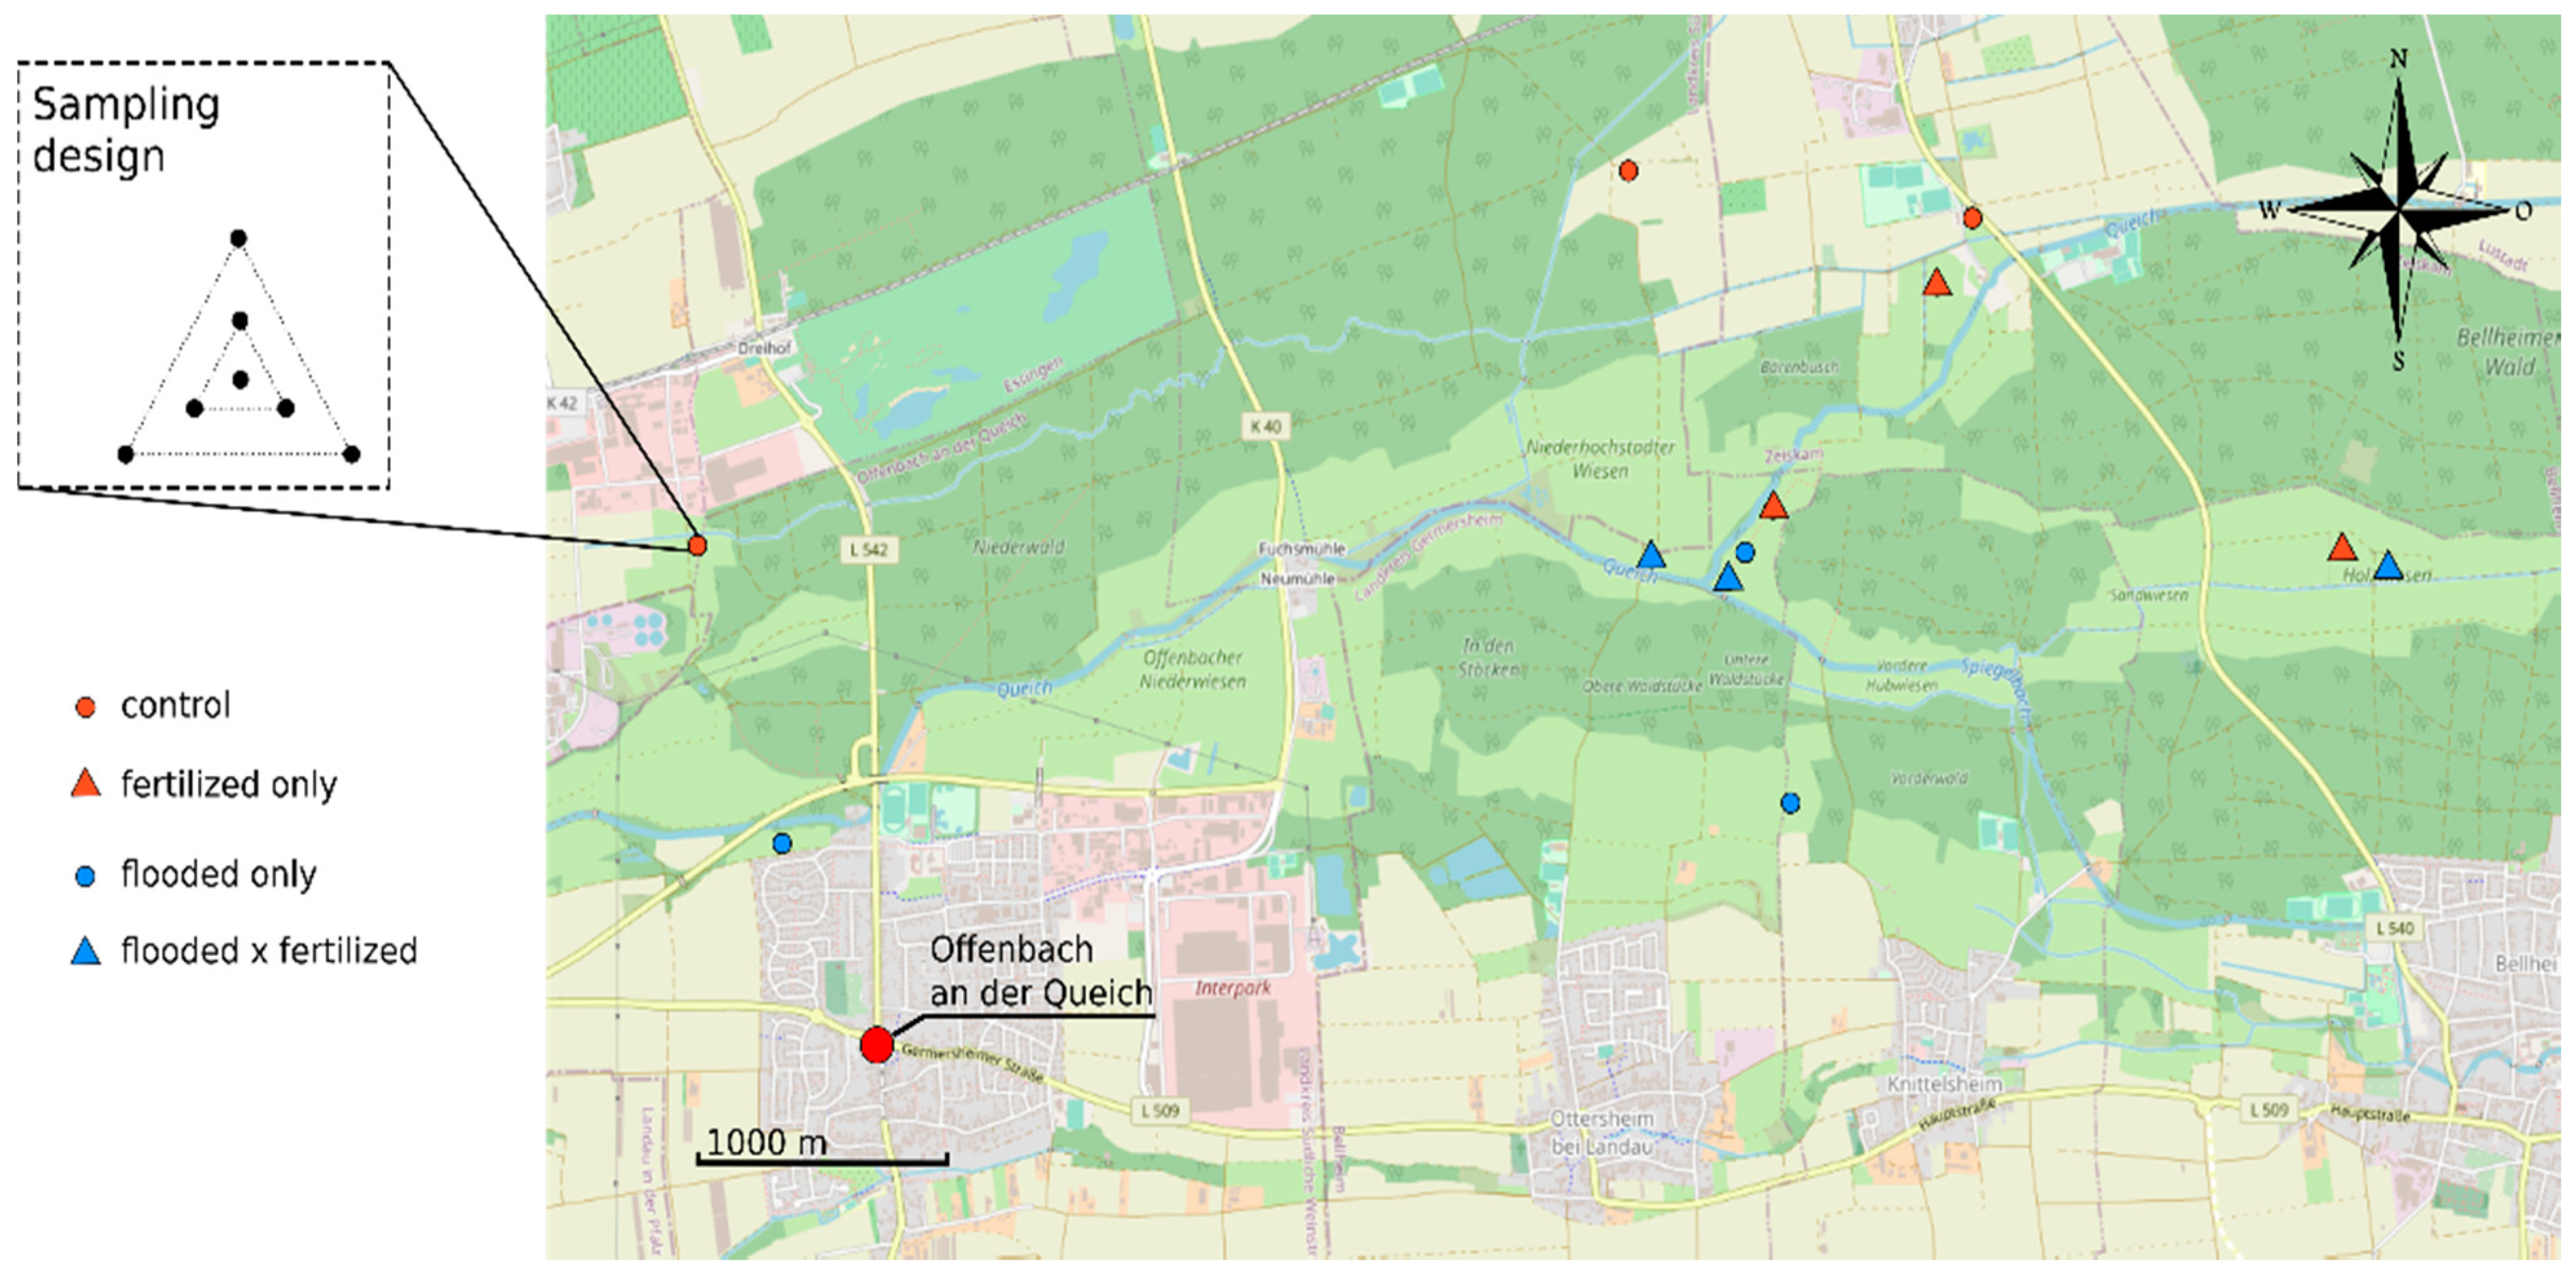
2.1. Study Area and Agricultural Practice

The sample sites were located on the meadows adjacent to the Queich river between Landau and Lustadt, Rhineland–Palatinate, Germany (Figure 1; 49°11′52.9″ N, 8°7′34.2″ O, mean annual temperature/precipitation 10.5 °C/667 mm). The grassland is predominantly used for hay production [24,25]. A web of ditches and weirs is used for an annual flood pulse irrigation for 2 to 3 days in spring and late summer. While irrigation was abandoned in the 1950s–1970s, it has been reactivated in several parts of the grassland during the last 15 years [24]. The extensively fertilized meadows investigated in this study receive nitrogen–phosphate–potassium (NPK) or calcium–ammonium–nitrate (CAN) fertilizer applications ranging from 40 to 52 kg N ha−1 a−1 [25]. This creates a mosaic of agricultural practice combinations comprising both agricultural practices, i.e., flood pulse irrigation and fertilization (see Figure 1). CAN was applied on one flooded and two non-flooded meadows; NPK was applied on one non-flooded and two flooded meadows. The practice combinations are further referred to and discussed as control (non-flooded and non-fertilized), flooded only (flooded and non-fertilized), fertilized only (non-flooded and fertilized), and flooded × fertilized (flooded and fertilized).

2.2. Experimental Design and Soil Characterization

After interviews with the farmers, sampling sites were selected with respect to the following criteria: Flooded sites need to have been flooded at least in the last 5 years three to four times per year. Fertilization should have been only inorganic during the last 50 years and at a similar intensity (40–75 kg N). The non-flooded sites should not have been flooded artificially for the last 50 years [24]. For this study, on all sites, Holcus lanatus L. (Poaceae) should be present in a sufficient amount for soil sampling only under this species. By these criteria, 12 sampling sites were selected according to flooding (yes/no) and fertilization (yes/no, 40 to 52 kg ha−1 a−1). The soil samples were taken 8 to 10 weeks after the last flooding event of the year (October 2015). Three plots per agricultural practice combination, i.e., control, flooded only, fertilized only, flooded × fertilized, were sampled. Within each plot, seven samples were taken in the centroid and the vertexes of two concentrically oriented equilateral triangles (n = 7, see Figure 1) leading to a total number of 84 analyzed samples. In order to reduce the plant-induced variability in SMCs, all samples were taken from beneath tussocks of H. lanatus. Random samples beneath various plants would have led to biases due to species composition changes triggered by the agricultural practice [24,25] and consecutive non-random species-specific impacts on microbes [26]. Holcus lanatus was chosen because it is abundant on all plots irrespective of the agricultural practice and is large enough for soil sampling with soil sampling rings beneath the plant. Furthermore, this species is regularly associated with arbuscular mycorrhizal fungi (AMF; [27]), which are of special interest due to their ecological role. Samples were taken from the upper 7 cm of the soil using autoclaved stainless steel rings. After removing roots using a two mm sieve, homogenized fresh soil was further analyzed or stored at −20 °C until further analysis. Top soil was chosen, since it is known to be the zone with the highest microbial activity, where the most pronounced effects can be expected. All physicochemical and microbiological analysis were obtained from the same topsoil samples to allow a direct comparability of the observed effects.

2.3. Soil Chemical Parameters and Texture

Total soil carbon and nitrogen (Ntot) content were measured by dry combustion in tin foils using elemental analyzer (vario MicroCUBE, Elementar Analysensysteme GmbH, Langenselbold, Germany). Thermogravimetric analysis of soil samples from the same plots showed that no carbonate was present (data not shown), thus, soil total carbon from elemental analysis may be considered as Corg. Water extractable nutrients were extracted from 20 g of air dried soil shaken with 100 mL distilled water for 2 h. After centrifugation, the concentration of nitrate (NO3), ammonium (NH4+), phosphate (PO4), and potassium (K+) were measured in the supernatant by ion chromatography (ionchromatograph 881 Compact IC Pro, Metrohm, Herisau, Switzerland). Soil pH was measured electrochemically in a 0.01 M CaCl2 solution. The soil water content at the time of sampling was measured as the weight loss of fresh soil samples after 24 h at 105 °C in an oven. Soil texture of a pooled soil sample of each plot was analyzed according to DIN ISO 11277: 2002–08.

2.4. PLFA Analysis

Prior to the PLFA analysis, soil samples were freeze-dried to a constant weight at −40 °C. The extraction was performed in accordance with Bligh and Dyer [22] and White et al. [28]. Briefly, 2 g of the freeze dried sample was weighed in a 15 mL centrifuge glass tube, and lipids were extracted with a mixture of phosphate buffer: chloroform: methanol (1.6:2:4 v/v/v). The sample was shaken for one hour and centrifuged for 15 min at 2000 rpm. The supernatant was transferred to a fresh glass tube and mixed with 1.6 mL of phosphate buffer and 2 mL of chloroform to allow phase separation. The upper layer was discarded, and the lower layer was dried under a gentle nitrogen stream at 30 °C. Lipids were redissolved in 1 mL chloroform and transferred to solid-phase extraction cartridges (Chromabond Easy, Marchery-Nagel, Düren, Germany). Phospholipids were separated from the neutral and glyco lipids using 5 mL chloroform and 10 mL acetone and eluted with 6 mL methanol. The eluate was evaporated and redissolved in 0.2 mL methanol. The lipids were transesterified by mixing 20 μL of the sample with a 0.25 M methanolic trimethylsulfonium hydroxide solution [29,30]. The samples were analyzed by gas chromatography with flame ionization detector (Varian CP-3800, Varian Inc, Palo Alto, CA, USA) equipped with a 60 m DB-5 column (Phenomenex, Torrance, CA, USA) and a glass wool liner. A sample volume of 1 μL was injected at 250 °C splitless. Carrier gas was N2 at 0.7 mL min−1 constant column flow. The oven program was 3 min at 150 °C, with 5 °C min−1 to 190 °C and hold for 5 min, with 2.5 °C min−1 to 240 °C and hold for 5 min, with 20 °C min−1 to 280 °C and hold for 3 min. The following PLFAs were used as quantitative standards and as biomarkers for SMC groups: i15:0, i17:0 (Gram-positive; [31]); 16:1ω7, 18:1ω9c, 18:1ω7c (Gram-negative; [31]); 16:1ω5c (AMF; [32,33]); 18:2ω6c (Fungi; [34,35]). The sum of all PLFA was used as a proxy for soil microbial biomass. The standards were ordered from Larodan AB (Solna, Sweden) and VWR International GmbH (Darmstadt, Germany).

2.5. Data Analysis

Statistical analysis was conducted using R 3.4.3 [36]. Correlations between variables were analyzed using linear regression. In order to evaluate the community structure independent of the community size, the microbial PLFA contents were normalized on the total molar PLFA content (mol%). The sum of the respective microbial biomarkers was used for statistical evaluation of the microbial groups. Since microbial biomass is correlated with Corg, we also evaluated the microbial biomass to Corg ratio to see agricultural practice effects on microbial biomass independent of Corg differences. The Shapiro–Wilk test and Levene’s test were used to examine normal distribution and equality of group variances. Mean and standard deviation are given when not stated otherwise. Two-way analysis of variance (F-ANOVA) was used to test for significant effects and interaction of flooding and fertilizing. All tested models included the factor “Plot” as random effect to account for multiple samples per plot. Normality and homoscedasticity of residuals were evaluated with Q-Q and residuals vs. fitted plots. A χ2-ANOVA on ranks was applied to variables that did not meet parametric assumptions using linear mixed-effect models in the package lme4 [37].

3. Results

3.1. Soil Chemical Properties and Texture

In all soils, water extractable PO3, K+, and NH4+ were not increased but below the limit of quantification in most of the samples and were, therefore, excluded from further evaluation. Irrespective of fertilization, the Ntot, average water extractable NO3 and Corg appeared to be higher in all flooded soils compared to the non-flooded counterparts, irrespective of fertilization (Table 1). Fertilization seemed to have no effect on these parameters. Yet, no significant differences in soil chemical parameters between agricultural practices were observed due to the large variability between the plots within the same agricultural practice. However, the significantly higher water content together with a trend of increased Corg content suggests that, in the long term, amount and quality of organic matter improved the water holding capacity in the flood-irrigated meadows. An increasing nutrient gradient from control to flooded × fertilized soils or an interaction of flooding and fertilization was not observed but a general trend towards differences between flooded and non-flooded soils.
Fertilization without flooding seemed to affect soil pH, with higher pH values in CAN fertilized plots and the lowest pH value in the NPK fertilized plot resulting in a considerably high standard deviation (Table 1). Flooded soils had intermediate pH values around 5.3, irrespective of fertilization. Control soils had slightly lower pH values.
Although the flooding event had occurred 8 to 10 weeks before sampling, the water content was still significantly increased by flooding (p < 0.001, χ2-ANOVA) but not affected by fertilization (p = 0.12, χ2-ANOVA). The soils of the investigated meadows are classified as Stagnosols. However, due to human activities to adjust the slope for the irrigation system, some of them could also be classified as Anthrosols. Most of the soil types were loam and sandy loam; one of the flooded only soils was silty clay. Since there was no systematic difference in soil texture between differently treated soils, the higher water content on the flooded soils is not caused by a higher water holding capacity of the mineral part of the soil.

3.2. Total PLFA Content

Total PLFA contents were significantly higher in flooded soils (8 ± 3 nmol g−1) compared to non-flooded soils (5 ± 1 nmol g−1; Figure 2A). Contrary, there was a trend of reduced total PLFA content when soils were fertilized (6 ± 3 nmol g−1) compared to non-fertilized soils with 7 ± 2 nmol g−1 (Figure 2A). The positive effect of flooding on total PLFA content was not reflected in the relative PLFA content, i.e., when the PLFA content was related to Corg (PLFA/Corg, Figure 2B).

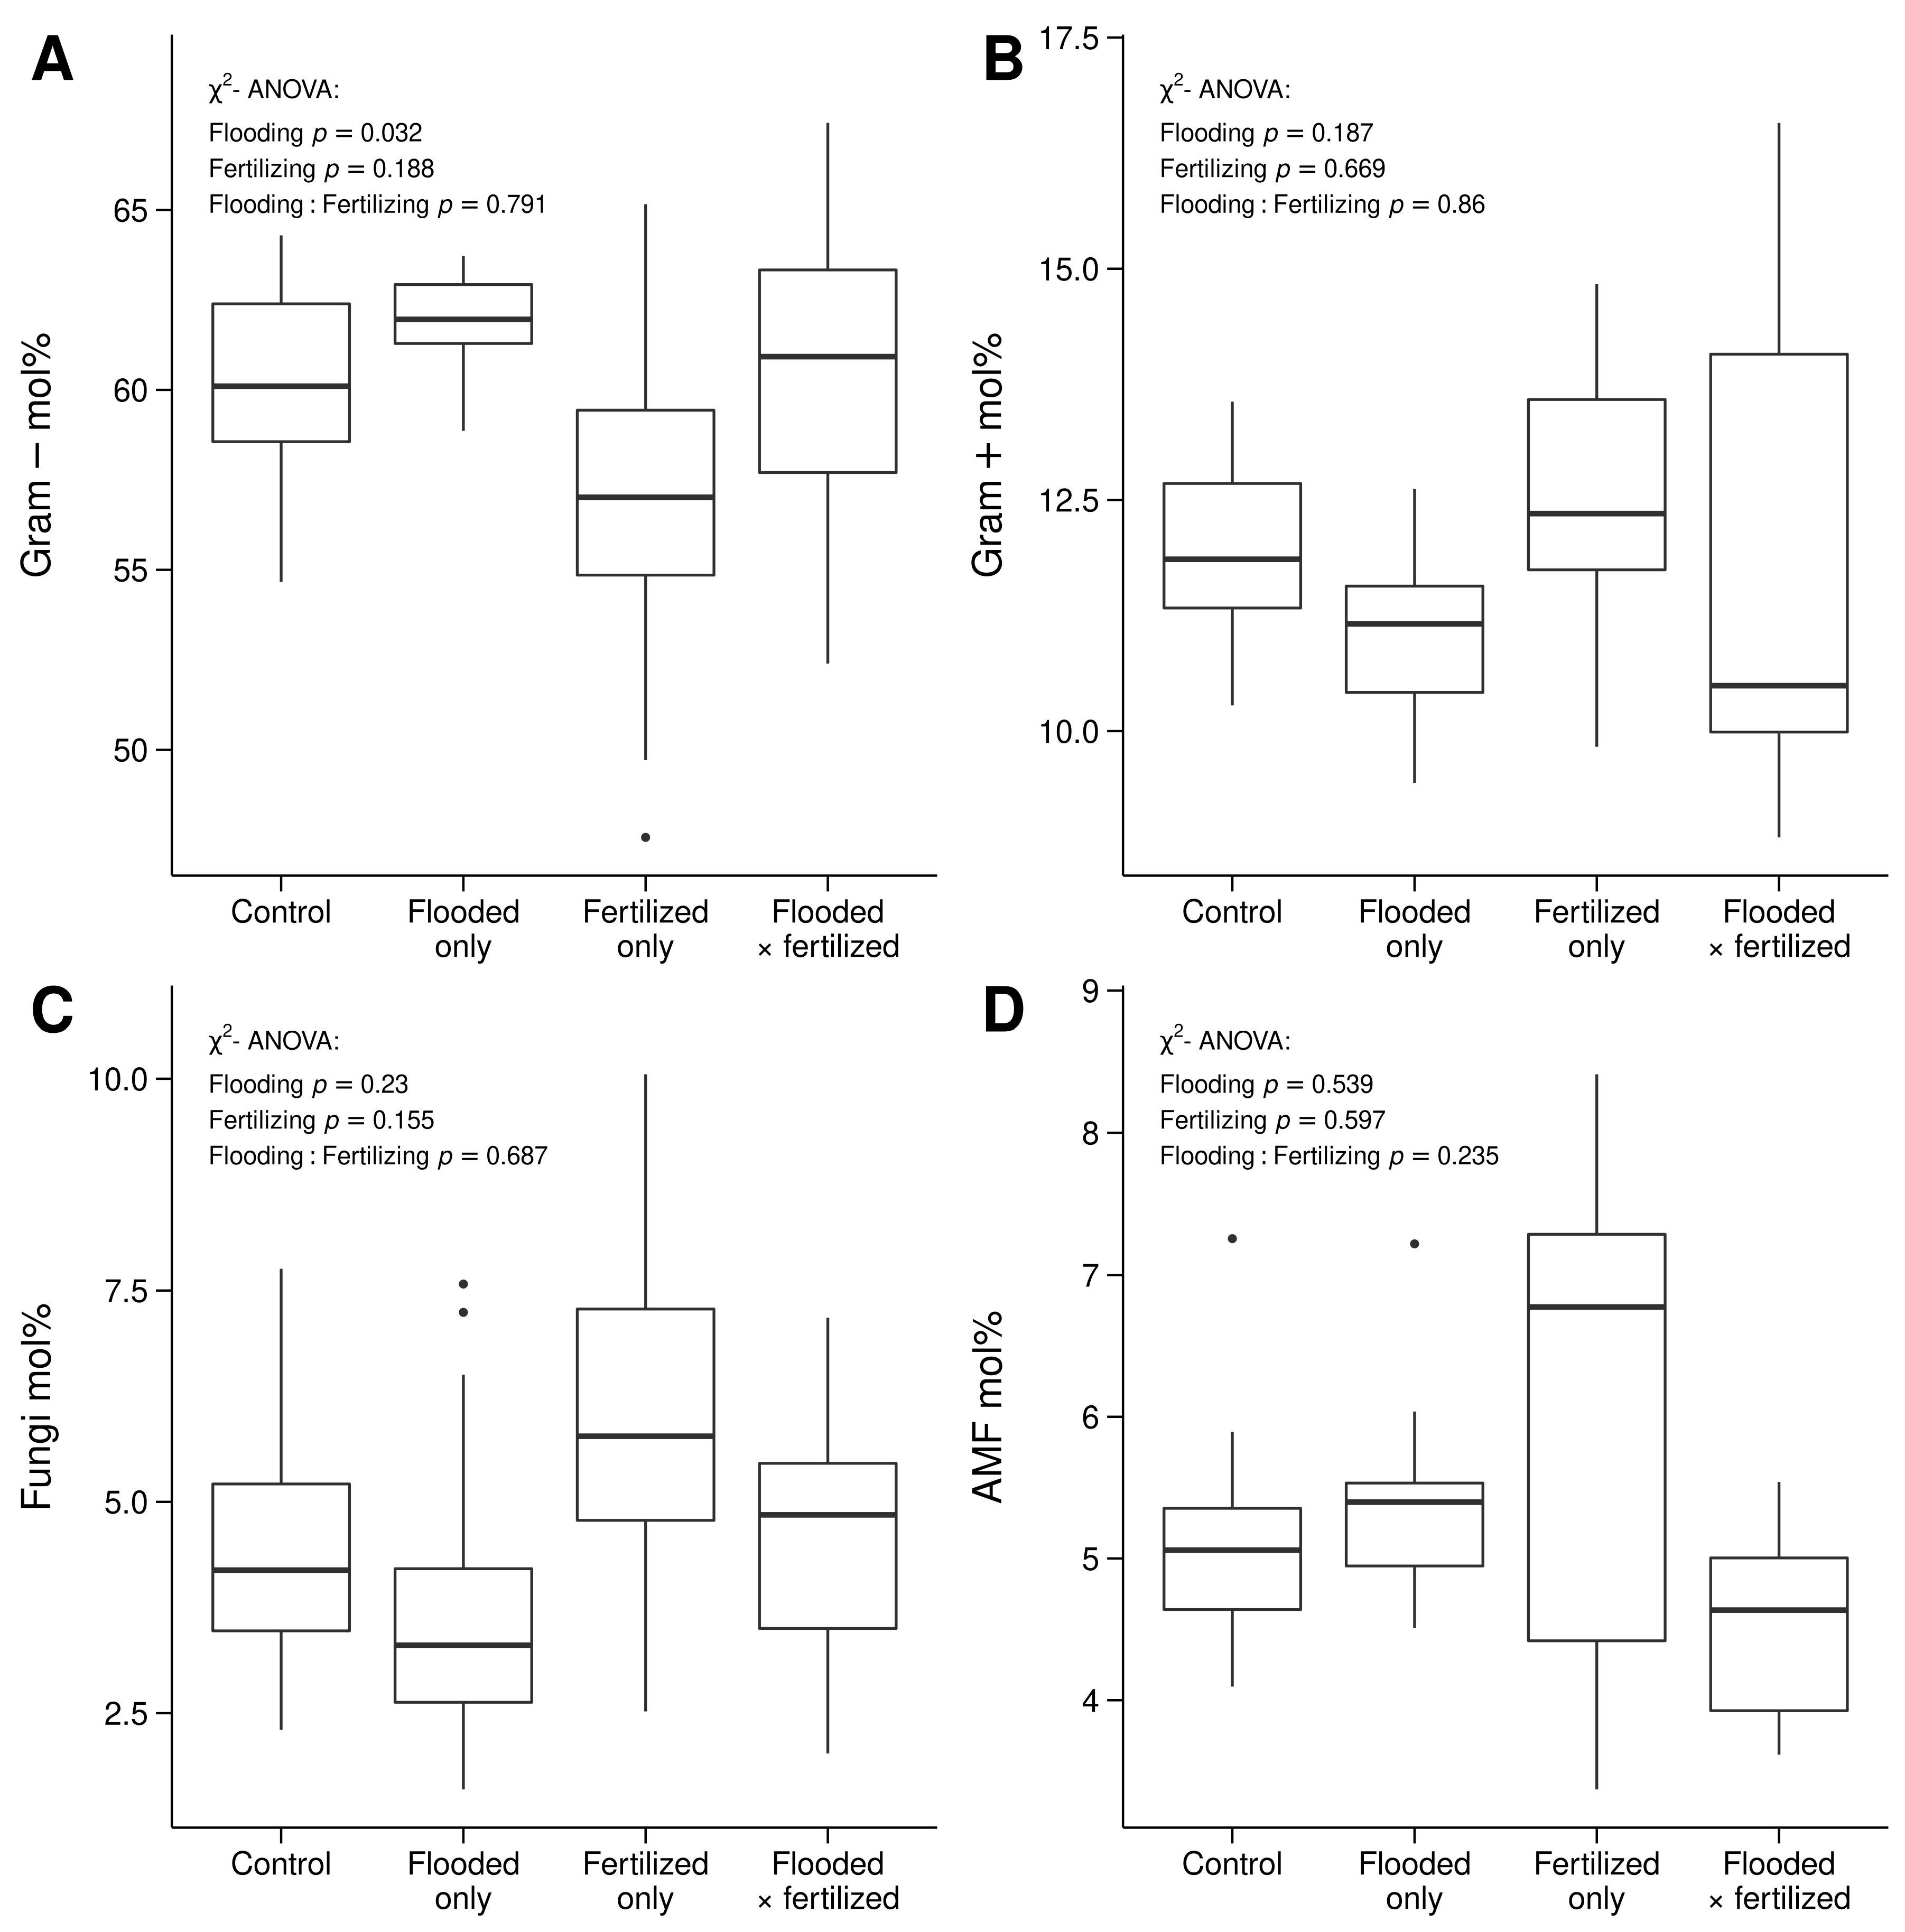
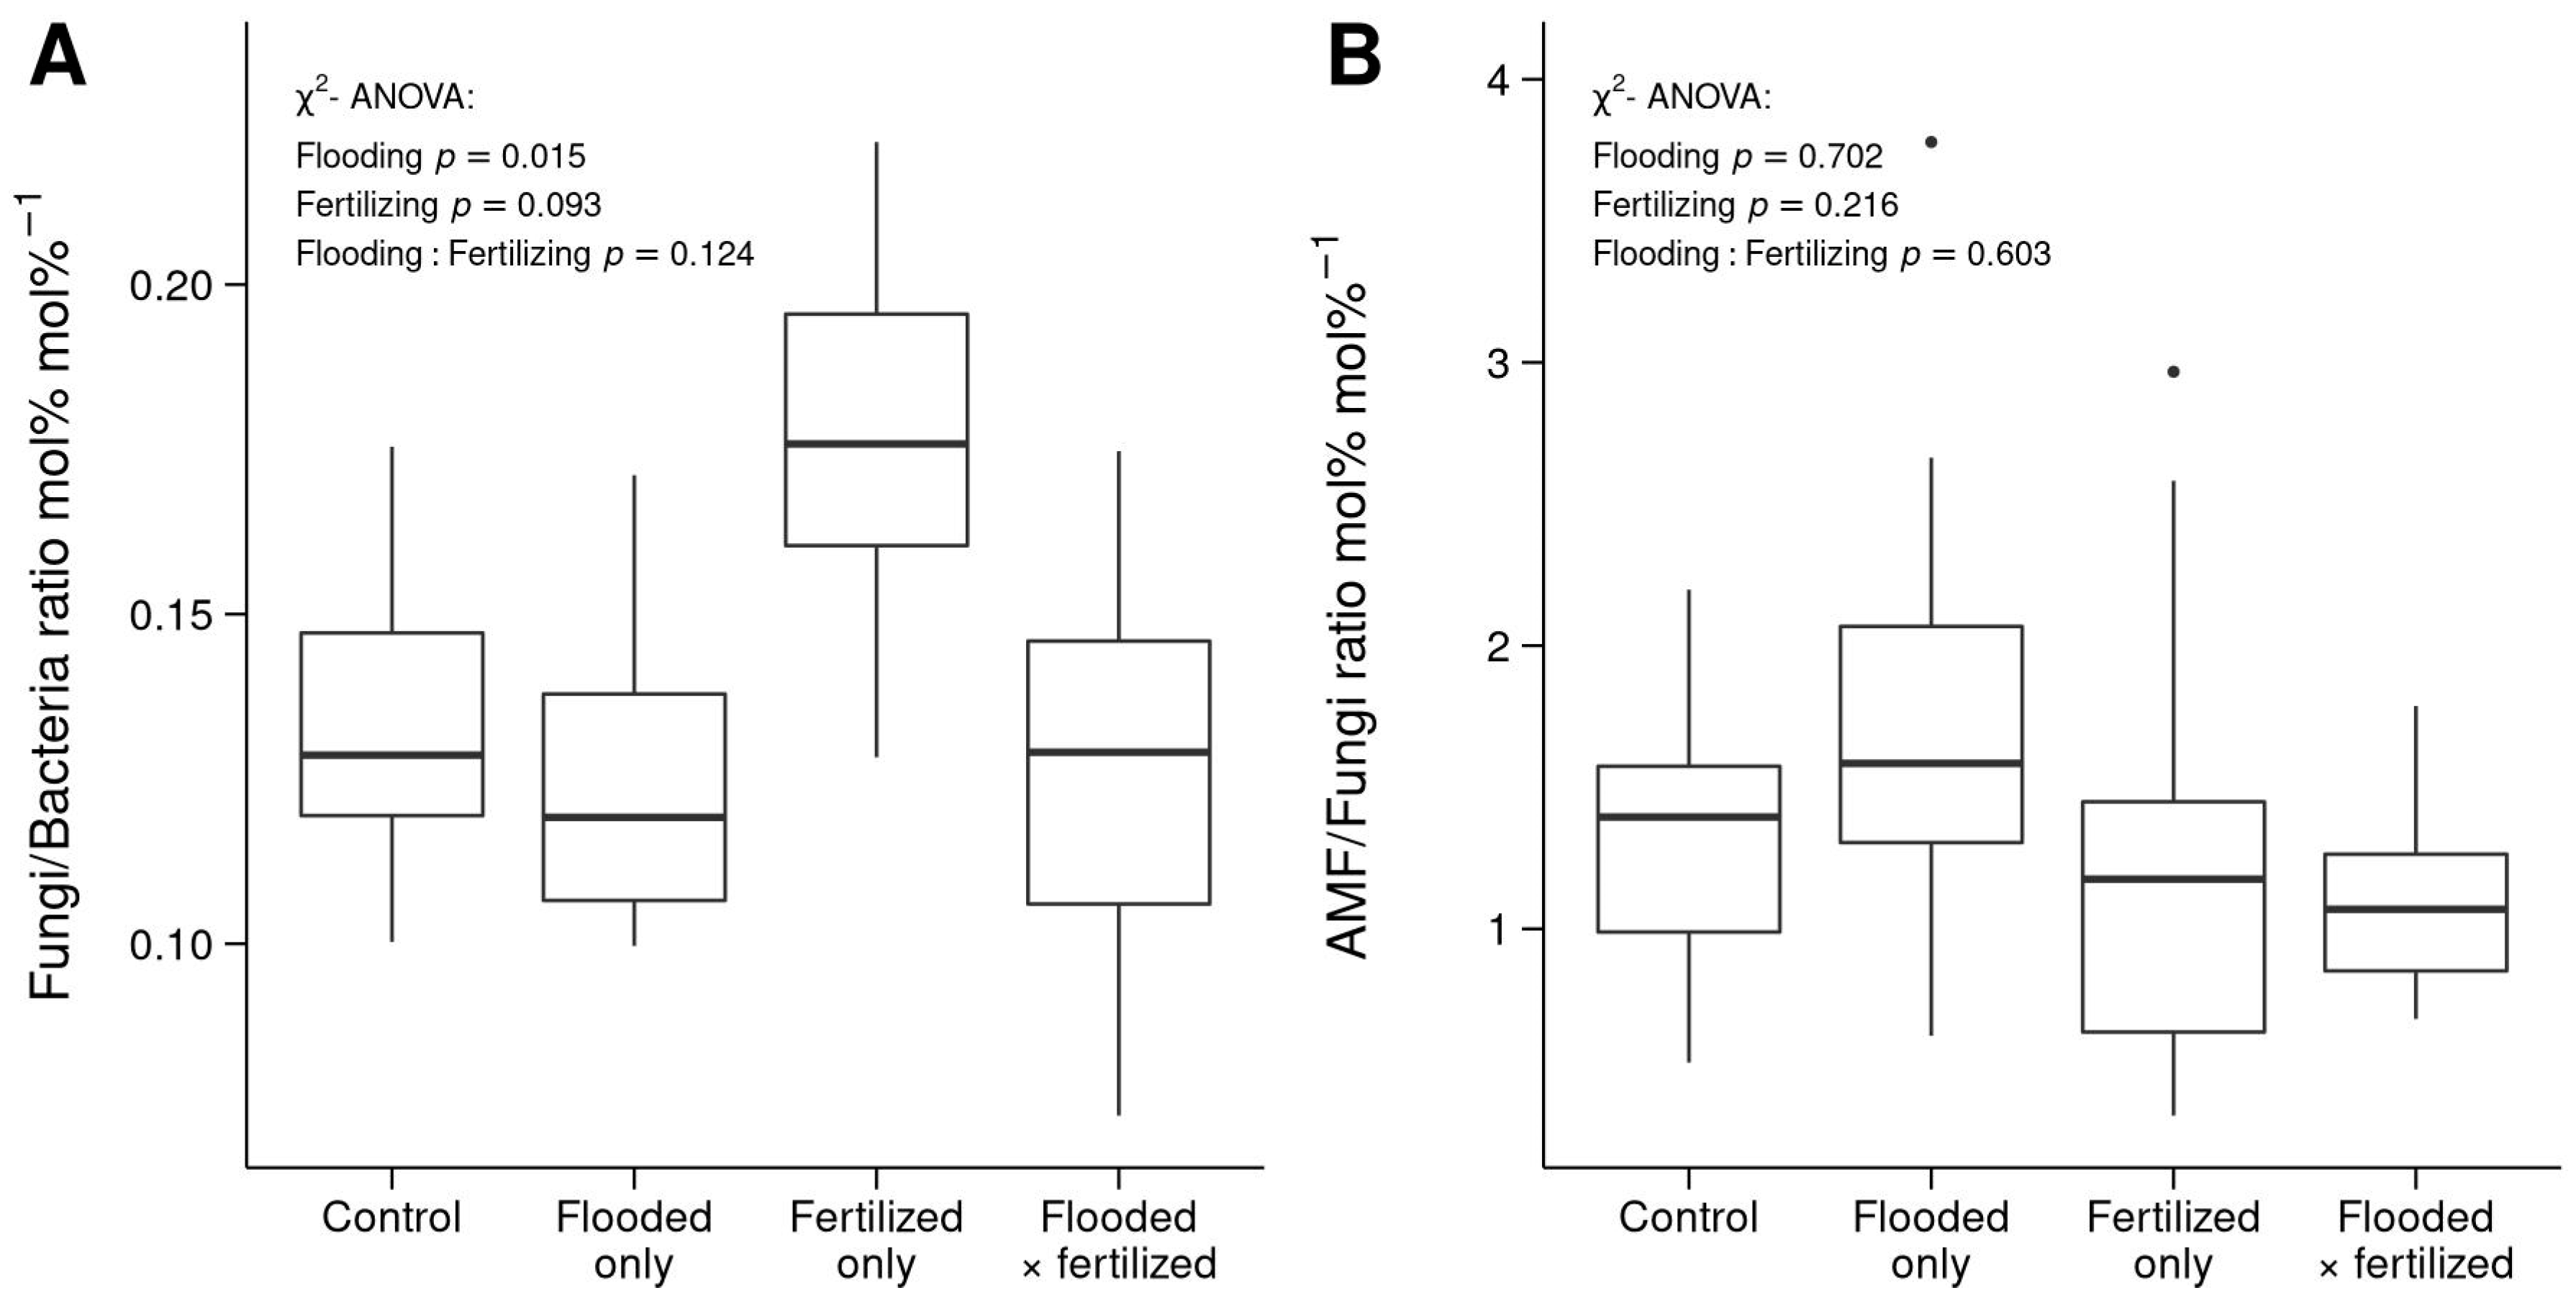
3.3. Differences in Microbial Community Structure

Flooding and fertilization seemed to have opposing effects on Gram-positive bacteria, fungi, and Gram-negative bacteria, respectively. The proportions of Gram-negative bacteria were significantly increased by flooding to 61 ± 3 mol% compared to the non-flooded counterparts with 58 ± 4 mol% (p = 0.032, χ2-ANOVA; Figure 3A). The proportion of Gram-positive bacterial PLFA seemed to be lower in flooded only soils with 11.1 ± 0.9 mol% compared to the fertilized only and control soils with each 12 ± 1 mol% (Figure 3B). The sum of Gram-positive and Gram-negative bacteria PLFA proportion was significantly increased by flooding (p = 0.009, χ2-ANOVA) and tended to be lower in fertilized only soil (p = 0.083, χ2-ANOVA; data not shown).
With 6 ± 2 mol%, the proportion of fungal PLFA tended to be higher in fertilized only soils than in flooded only soils with 4 ± 2 mol%, while the agricultural practices seemed to cancel out in flooded × fertilized soils being similar to control soils, each at 5 ± 1 mol% (Figure 3C). The proportion of AMF PLFA showed no trend for any agricultural practice. An extreme variance in AMF PLFA proportion was found in fertilized only soils, including the highest and lowest values of all soils (Figure 3D).
Flooding also significantly reduced the fungi/bacteria ratio from 0.16 ± 0.03 to 0.13 ± 0.03 (Figure 4A). Furthermore, there was a trend towards higher fungi/bacteria ratios in fertilized soils (0.15 ± 0.04) compared to non-fertilized soils.
The highest mean AMF/fungi ratio was found in flooded only soils with 1.7 ± 0.8 followed by control with 1.3 ± 0.4, fertilized only with 1.2 ± 0.7 and flooded × fertilized with 1.1 ± 0.3. These differences were not significant (Figure 4B).

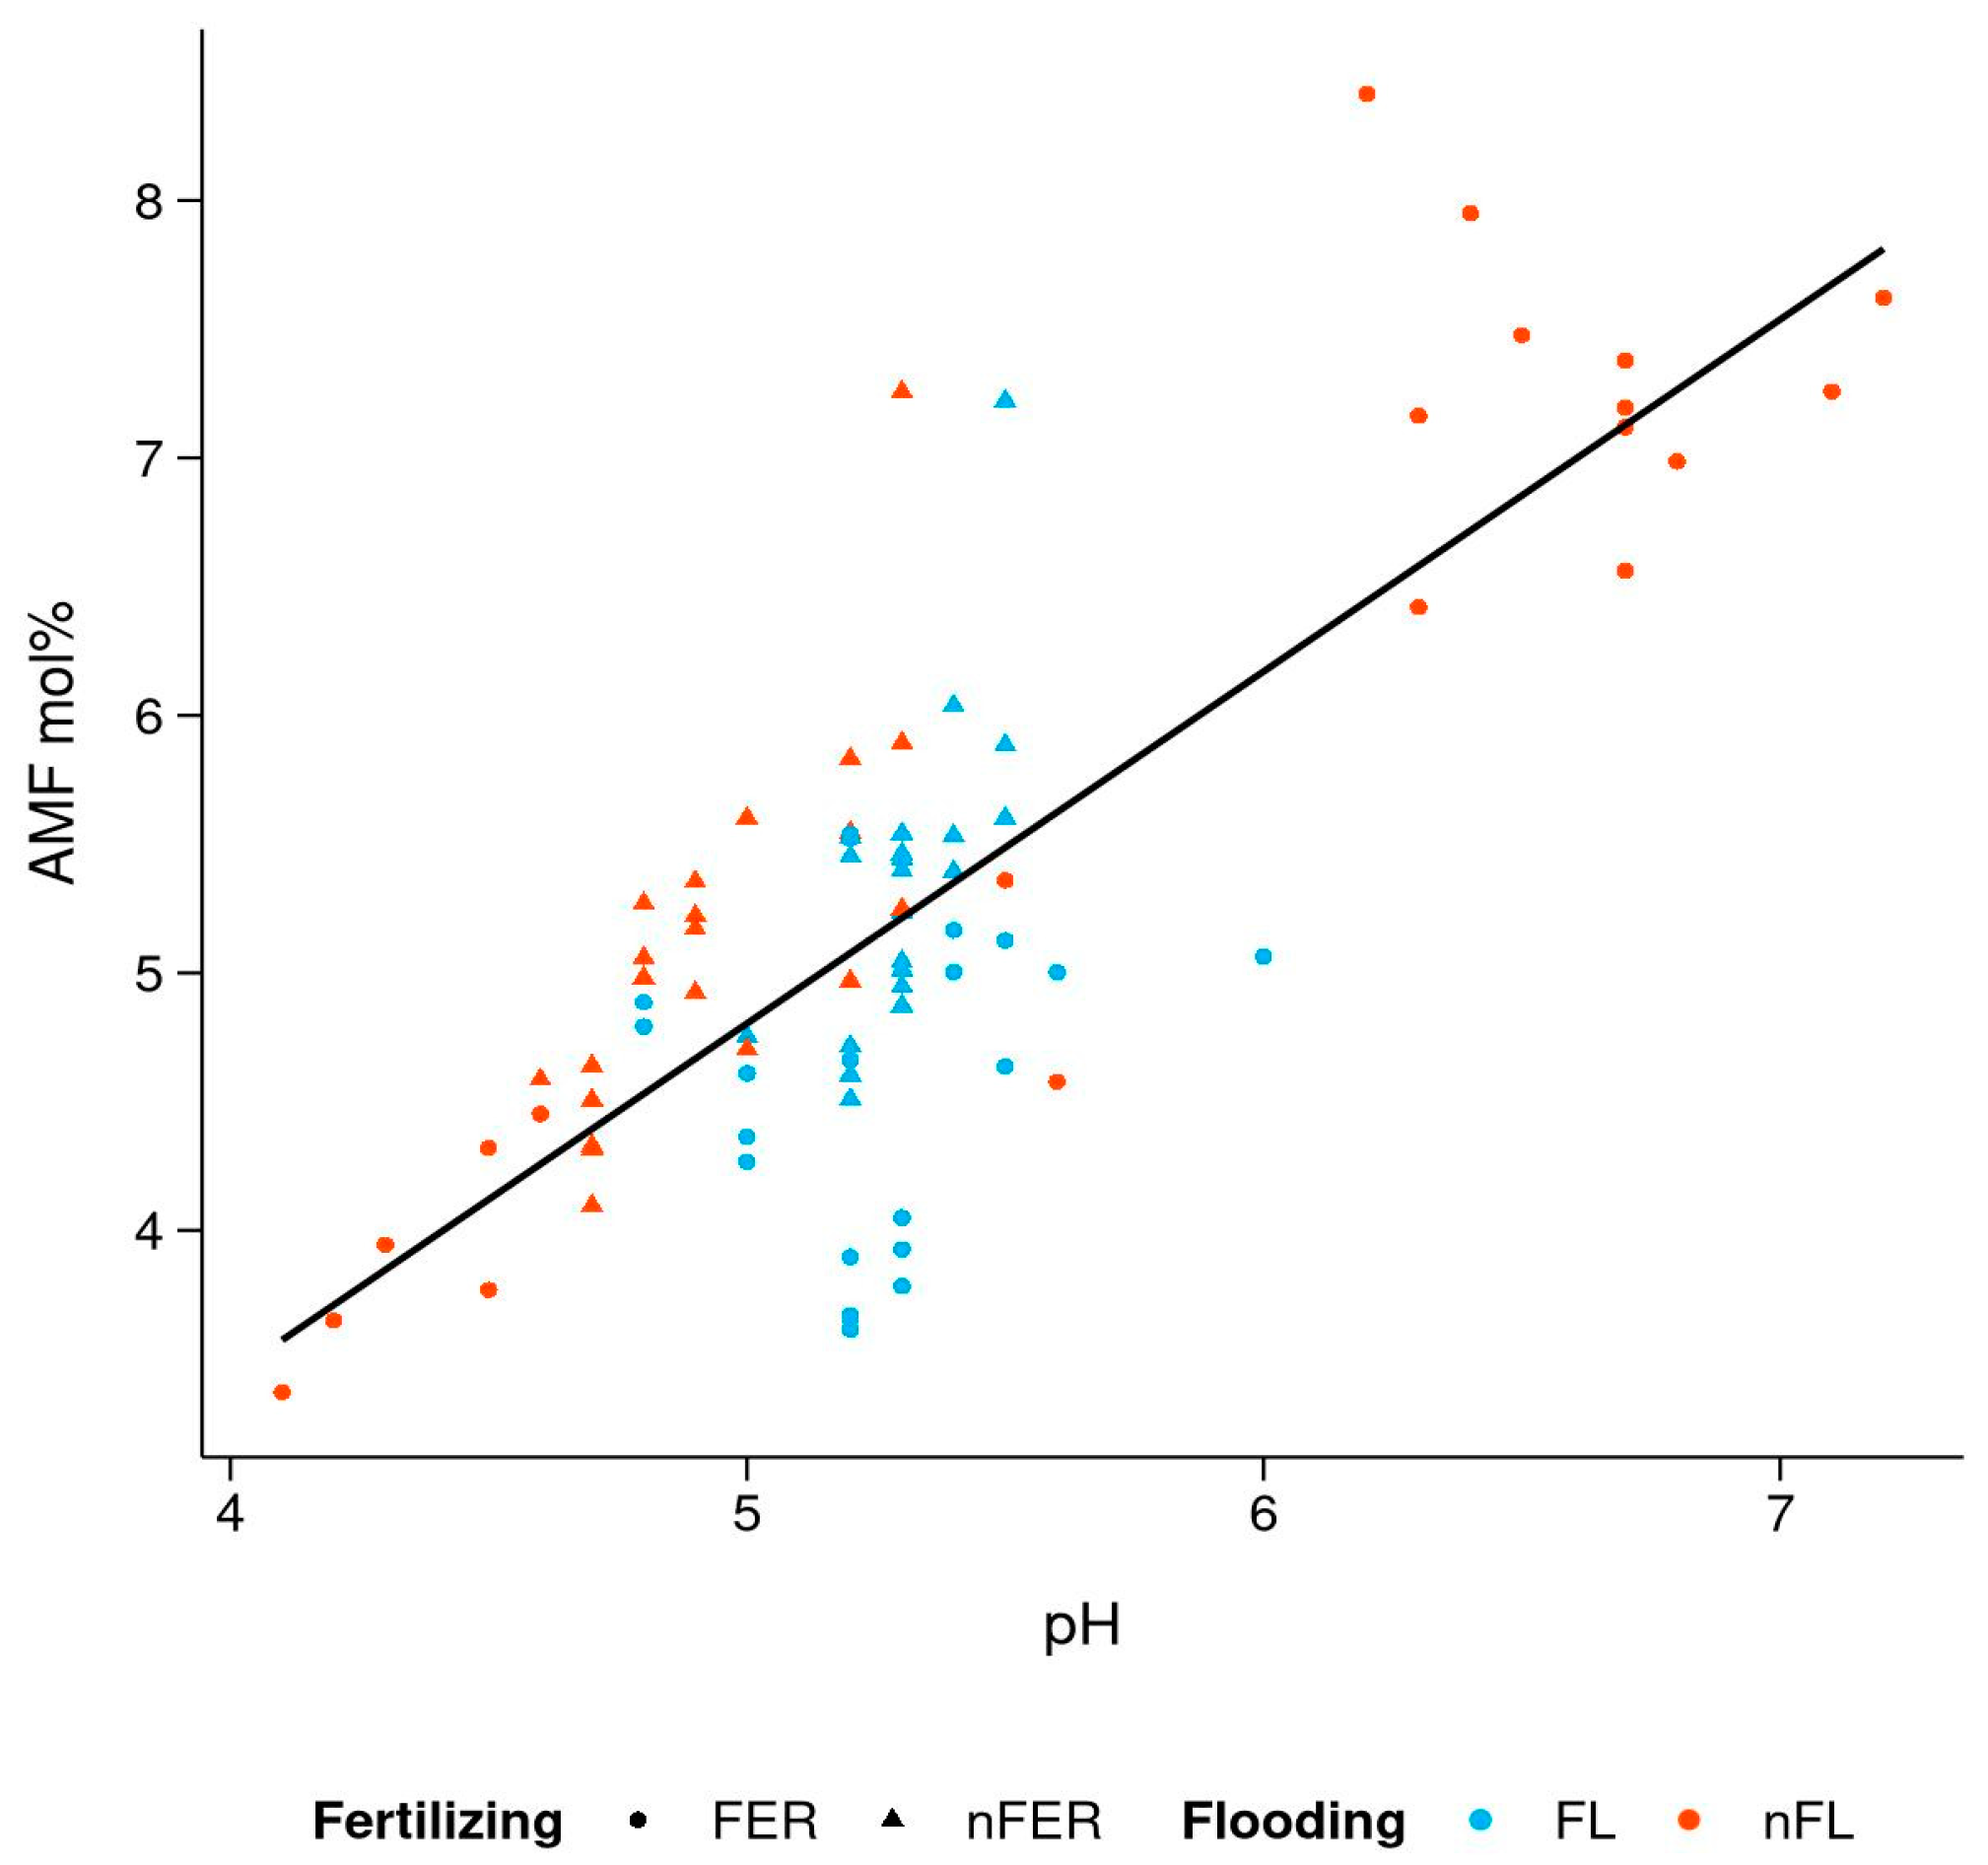
3.4. Effect of Soil Chemistry on PLFA Biomarkers

The sum of PLFA was positively correlated with Corg and Ntot, independent of the agricultural practice (adj. R2 = 0.78, p < 0.001, for both). The proportion of fungal PLFA tended to decrease with logarithmic Ntot (R2 = 0.47, p < 0.001) and Corg (R2 = 0.37, p < 0.001) but not with water extractable NO3. The proportion of AMF PLFA was positively correlated with pH. Thus, in the fertilized only soils, the highest and lowest AMF proportion was observed, which fits to the different pH values in CAN and NPK fertilized soils (Figure 5).
With increasing water content, the total PLFA content was generally increased (Figure 6A). However, changes in individual community groups with water content was contrasting: proportion of fungi tended to decrease, while proportion of bacteria tended to increase with increasing water content, which is also seen in lower fungi/bacteria ratios at high water contents (Figure 6B–D). There was no clear correlation, and assumptions for linear modeling were not met.

4. Discussion

4.1. Soil Chemical Parameter under the Influence of Irrigation and Fertilization

In contrast to our expectations and to findings of some studies [14,38,39], we found no indication that mineral fertilizer application is associated with increased Corg, Ntot, and water extractable NO3 content. However, other studies also found the opposite effects, e.g., accelerated humus mineralization after long-term application of mineral NPK fertilizers [40] or only a minor influence of mineral fertilization on Corg [41]. The lack of an overall fertilization effect on soil chemical parameters can be best explained with the extensive agricultural practice of the meadows. With 40 to 52 kg ha−1 a−1, the application rate of mineral fertilizer on the investigated meadows is low compared to over 120 kg ha−1 a−1 of fertilizer applied on conventionally managed grassland cut twice a year [42]. This may result in only moderate increases in plant biomass production and, consequently, no significant effects on Corg. Furthermore, the fertilizer is usually applied once per year in spring or early summer. Therefore, the remaining effects on soil nutrient contents (N, P, K) in autumn may be small, especially compared to the more recent flooding events. However, we found indication that the types of fertilizers, i.e., NPK and CAN, have contrasting effects on soil pH if soils are not flooded, which can explain the high variation. The long-term input of ammonium with NPK fertilization is known to reduce soil pH, with potentially adverse effects on bacterial soil community [14]. Contrary, the application of the carbonate containing CAN fertilizers [43] buffers soil acidification. However, this effect cannot be judged by the current experimental design because it is not balanced for the type of fertilizer. Thus, a mitigation by flood pulse irrigation of altered soil pH in fertilized soil remains unclear.
In contrast to fertilized soils, the trend towards higher Corg, Ntot, and water extractable NO3 concentration in flooded soils indicated that the long-term flood pulse irrigation, as practiced in the traditionally managed meadows of this study, supports the buildup of a soil carbon and nitrogen pool. Increased plant biomass production upon flood pulse irrigation as shown by Buhk et al. [2] for the same study area increases soil organic matter content due to higher rhizodeposition and litter production. However, it remains unclear why fertilization, which also increased plant productivity, showed no such effects. Here, biological parameters come into play, as discussed in the next chapters.
In sum and based on our findings, we have to reject hypothesis I that the application of mineral fertilizer and flood pulse irrigation have significantly distinct effects or interactions with regard to the soil chemical parameters. The soil chemical parameters are predominantly shaped by flood pulse irrigation and, thus, better distinguished by flooding, i.e., flooded vs. non-flooded soils.

4.2. Interactions between Microbial Biomass and Corg

Total microbial biomass seemed to respond positively to the increased Corg contents in flood-pulse-irrigated soils. Zak et al. [44] linked higher plant productivity to increased Corg and, consequently, higher microbial biomass. This is in line with our findings and supports the idea that flood pulse irrigation has a positive effect on soil microbial biomass due to increased plant productivity followed by increased Corg. However, causal relations are still not fully understood. An explanation might be a tendentiously elevated plant species richness on the flooded meadows [24]. Lange et al. [45] found in a long-term diversity experiment that microbial respiration increased less pronounced than microbial carbon, i.e., carbon use efficiency increased with increasing plant diversity. As a mechanism of the increased carbon use efficiency, they proposed that a shift in the metabolic activity of soil microbes towards higher anabolic activity upon higher levels of root exudation leads to an increased microbial necromass accumulation in high diversity spots resulting in increased Corg [45]. Beside plant diversity, water availability for plants is also improved by flood pulse irrigation [1], which is another important factor supporting microbial biomass [10,46]. The increased Corg on the flood-irrigated meadows additionally may have improved soil water retention presenting a positive feedback on water supply for both plants and microbial biomass in a long term. However, a higher carbon loss due to prolonged favorable conditions for microbial activities did probably not compensate for the increased carbon input by enhanced plant growth.
Studies on the effect of mineral fertilization on microbial biomass showed contrasting results: While Geisseler and Scow [14] found an increased microbial biomass and attributed this to an increased Corg, Treseder [47] showed that fertilization with N can reduce microbial biomass by an average of 15%. The latter is in line with our findings, i.e., a tendency for a comparable microbial biomass reduction of 14% upon fertilization. However, this negative tendency was not as clearly related to Corg or Ntot content as was the positive flooding effect. This implies that different mechanisms may have caused these effects. Beside a reduced Corg, a possible explanation for a reduced microbial biomass due to fertilization may be reduced plant diversity on the fertilized plots [24,45]. Taking into account the earlier described mechanisms proposed by Lange et al. [45], reduced plant diversity in fertilized soils may have reduced microbial carbon use efficiency, which in turn increased soil carbon mineralization. This could also explain a tendency towards lower microbial biomass per Corg content in the fertilized only soils compared to the control. However, since this effect was not significant, further conclusions remain speculative.

4.3. Differences in Community Structures

The significantly higher proportion of Gram-negative bacteria in flood-pulse-irrigated soils compared to non-flooded soils is indicative for copiotrophic, i.e., nutrient rich, soil conditions [8,48,49] and fits with the observed higher Corg, Ntot, and water extractable NO3 content in flood-pulse-irrigated soils compared to the non-flooded soils. Additionally, copiotrophic bacteria such as Proteobacteria have been shown to be sensitive to drought stress, which is more likely to occur on non-flooded sites. [1,8,10,50].
Anoxic conditions due to saturated soil and stagnating water can negatively affect Gram-negative bacteria [8,10]. Our results, with slightly higher Gram-negative proportions, indicate that the flood pulse irrigation method avoids anoxic conditions as reported in [1] or promotes a resilient Gram-negative bacterial community that recovers within 8 to 10 weeks [11]. Although it has been shown that bacteria can be negatively affected by fertilization followed by reduced soil pH [14], we did not find such correlation. However, the effect of mineral fertilization on soil pH may also depend on composition and amount of applied fertilizer [51]. Therefore, the extensive management and the previously mentioned variation in soil pH observed in this study can explain why the relationship of soil pH and bacteria were not observed here.
Fungi decrease in soils with high water availability [8,10,18] and are often favored by nutrient poor soils [13]. The first is coherent with the trend we observed that flood pulse irrigation decreases absolute fungal content, while the latter seems in contrast to our observation that fertilization tends to increase the fungal content. However, as discussed above, mineral fertilization had a lower effect on soil fertility than flood irrigation in the present study, thus, not being in contrast to the observed trend of increased fungal abundance.
The shift towards lower fungi/bacteria ratios in flood-irrigated soils was caused by both a smaller fungal and a larger bacterial community. We observed the trend that fungal abundance decreases with increasing soil water content. However, the effect of flooding on Gram-negative bacteria is significant and in absolute values higher than the reducing trend on fungi, which indicates that this community shift is stronger driven by changes in the bacterial than by the fungal community. Probably, the higher carbon content in flood-pulse-irrigated soil had a positive effect on both bacteria and fungi, which mitigated the negative effects of higher water content on fungi. Nonetheless, our findings support hypothesis II that changes in soil chemical parameters induced by agricultural practice, i.e., flood pulse irrigation, are reflected in SMC shifts, i.e., reduced fungi/bacteria ratio.
Although soil fertility (i.e., Corg, Ntot, NO3) was increased by flood pulse irrigation, the AMF proportion of the soil fungal community was not negatively affected. This is contrary to Egerton-Warbuton et al. [52], Gryndler et al. [53], and Wang et al. [7], who showed that higher soil nitrogen contents (due to fertilization) reduce the AMF abundance in grassland. Additionally, AMF are known to be negatively affected by extreme weather conditions, such as, for example, long-term flooding [54]. However, instead of reduced AMF proportions, we found slightly higher AMF proportions in flood-irrigated soils. One explanation of the apparently robust AMF community could be the higher plant diversity, which was shown by Müller et al. [24] on the same plots. A higher diversity of host plants positively affects AMF community composition, promotes fungal growth [55,56,57], and may, thus, mitigate negative flooding effects for AMF, such as, for example, high water availability. Overall, flooding seems to have a positive effect on soil fertility without negative effects on AMF biomass. Furthermore, AMF was the only group that clearly increased with soil pH, which is one of the key drivers of SMC structure [15]. Dumbrell et al. [58] have shown that abiotic soil factors, and in particular soil pH, structure the AMF community more strongly than host plant species. Since the pH seems to be influenced by the type of mineral fertilizer, the AMF may be indirectly affected by the type of fertilization [59]. However, the current experimental design was not aimed at and is, thus, not appropriate for a test of the effect of different fertilizer types. Therefore, the hidden effects of the fertilizers with respect to their type cannot be excluded, and a future study balanced for the fertilizer types might shed more light on this question.

5. Conclusions

Our results suggest that flood pulse irrigation in extensively used hay meadows has a positive effect on soil fertility. The tendency of an enhanced build-up of soil organic carbon and nitrogen pool and significantly higher water contents are accompanied by significant effects on the microbial community composition upon flood pulse irrigation. Beside an increased soil microbial biomass, a greater fraction of rather copiotrophic Gram-negative bacteria within the soil microbial community also characterizes the flooded compared to non-flooded soils. In contrast, extensive mineral fertilization seems not to improve the nutrient status of soils in a long-term experiment. However, our results also suggest that additional investigations with respect to different fertilizer types are required before an effect of mineral fertilization can be finally judged. However, flood pulse irrigation may be a sustainable alternative to mineral fertilization.
The suggested positive effects of flooding can be explained as a consequence of more continuous nutrient cycling combined with a more intensive root growth under nutrient-poor situations during the growth season. A potential explanation could also be related to the contrasting effects of flooding and fertilizing on plant diversity, which might cause an improved (flooding) or reduced (fertilizing) microbial carbon use efficiency. However, in order to prove the suggested explanations, investigations over a whole growth season are needed that relate the plant diversity and productivity to the below ground microbial diversity and root and microbial growth and activity.

Author Contributions

Conceptualization, G.E.S., C.B. and D.D.; formal analysis, K.G.J.K., K.M., C.B. and D.D.; funding acquisition, G.E.S.; investigation, K.G.J.K. and D.D.; methodology, K.G.J.K. and K.M.; project administration, C.B. and D.D.; supervision, D.D.; visualization, K.G.J.K. and K.R.; writing—original draft, K.G.J.K. and K.R.; writing—review and editing, K.R., K.M., G.E.S., C.B. and D.D. All authors have read and agreed to the published version of the manuscript.

Funding

This study was carried out in the framework of the research initiative AufLand, financed by the Ministerium für Bildung, Wissenschaft, Weiterbildung, und Kultur Rheinland-Pfalz, Germany. In addition, the publication was supported with a scholarship by the same institution. The publication was funded by the Open Access Fund of the University of Koblenz-Landau. The sponsor had no role in study design, collection, analysis and interpretation of data, or writing of the report.

Institutional Review Board Statement

Not applicable.

Informed Consent Statement

Not applicable.

Data Availability Statement

The data presented in this study are available on request from the corresponding author.

Acknowledgments

We thank the landowners for the permission to work on their meadows and for the provision of information about the agricultural practice. Thanks to Z. Steinmetz for the never ending discussions.

Conflicts of Interest

The authors declare no conflict of interest.

References

  1. Leibundgut, C.; Kohn, I. European traditional irrigation in transition part I: Irrigation in times past—A historic land use practice across Europe. Irrig. Drain. 2014, 63, 273–293. [Google Scholar] [CrossRef]
  2. Buhk, C.; Schirmel, J.; Rebekka, G.; Frör, O. Traditional water meadows: A sustainable management type for the future? In Irrigation in Agroecosystems; IntechOpen: London, UK, 2019. [Google Scholar]
  3. Trost, B.; Ellmer, F.; Baumecker, M.; Meyer-Aurich, A.; Prochnow, A.; Drastig, K. Effects of irrigation and nitrogen fertilizer on yield, carbon inputs from above ground harvest residues and soil organic carbon contents of a sandy soil in Germany. Soil Use Manag. 2014, 30, 209–218. [Google Scholar] [CrossRef]
  4. Trost, B.; Prochnow, A.; Drastig, K.; Meyer-Aurich, A.; Ellmer, F.; Baumecker, M. Irrigation, soil organic carbon and N2O emissions. A review. Agron. Sustain. Dev. 2013, 33, 733–749. [Google Scholar] [CrossRef] [Green Version]
  5. Sun, S.; Che, T.; Gentine, P.; Chen, Q.; Wang, L.; Yan, Z.; Chen, B.; Song, Z. Shallow groundwater inhibits soil respiration and favors carbon uptake in a wet alpine meadow ecosystem. Agric. For. Meteorol. 2021, 297, 108254. [Google Scholar] [CrossRef]
  6. Austin, A.T.; Yahdjian, L.; Stark, J.M.; Belnap, J.; Porporato, A.; Norton, U.; Ravetta, D.A.; Schaeffer, S.M. Water pulses and biogeochemical cycles in arid and semiarid ecosystems. Oecologia 2004, 141, 221–235. [Google Scholar] [CrossRef] [PubMed]
  7. Wang, Y.; Huang, Y.; Qiu, Q.; Xin, G.; Yang, Z.; Shi, S. Flooding greatly affects the diversity of arbuscular mycorrhizal fungi communities in the roots of wetland plants. PLoS ONE 2011, 6, e24512. [Google Scholar] [CrossRef]
  8. Bossio, D.A.; Scow, K.M. Impacts of carbon and flooding on soil microbial communities: Phospholipid fatty acid profiles and substrate utilization patterns. Microb. Ecol. 1998, 35, 265–278. [Google Scholar] [CrossRef]
  9. De-Campos, A.B.; Huang, C.; Johnston, C.T. Biogeochemistry of terrestrial soils as influenced by short-term flooding. Biogeochemistry 2012, 111, 239–252. [Google Scholar] [CrossRef]
  10. Drenovsky, R.E.; Steenwerth, K.L.; Jackson, L.E.; Scow, K.M. Land use and climatic factors structure regional patterns in soil microbial communities. Glob. Ecol. Biogeogr. 2010, 19, 27–39. [Google Scholar] [CrossRef] [Green Version]
  11. Siebielec, S.; Siebielec, G.; Klimkowicz-Pawlas, A.; Gałązka, A.; Grządziel, J.; Stuczyński, T. Impact of water stress on microbial community and activity in sandy and loamy soils. Agronomy 2020, 10, 1429. [Google Scholar] [CrossRef]
  12. Hawkes, C.V.; Kivlin, S.N.; Rocca, J.D.; Huguet, V.; Thomsen, M.A.; Suttle, K.B. Fungal community responses to precipitation. Glob. Chang. Biol. 2011, 17, 1637–1645. [Google Scholar] [CrossRef]
  13. Millard, P.; Singh, B.K. Does grassland vegetation drive soil microbial diversity? Nutr. Cycl. Agroecosyst. 2010, 88, 147–158. [Google Scholar] [CrossRef]
  14. Geisseler, D.; Scow, K.M. Long-term effects of mineral fertilizers on soil microorganisms—A review. Soil Biol. Biochem. 2014, 75, 54–63. [Google Scholar] [CrossRef]
  15. Kaiser, K.; Wemheuer, B.; Korolkow, V.; Wemheuer, F.; Nacke, H.; Schöning, I.; Schrumpf, M.; Daniel, R. Driving forces of soil bacterial community structure, diversity, and function in temperate grasslands and forests. Sci. Rep. 2016, 6, 33696. [Google Scholar] [CrossRef] [PubMed] [Green Version]
  16. Bradley, K.; Drijber, R.A.; Knops, J. Increased N availability in grassland soils modifies their microbial communities and decreases the abundance of arbuscular mycorrhizal fungi. Soil Biol. Biochem. 2006, 38, 1583–1595. [Google Scholar] [CrossRef]
  17. Williams, M.A.; Rice, C.W. Seven years of enhanced water availability influences the physiological, structural, and functional attributes of a soil microbial community. Appl. Soil Ecol. 2007, 35, 535–545. [Google Scholar] [CrossRef]
  18. Drenovsky, R.E.; Vo, D.; Graham, K.J.; Scow, K.M. Soil water content and organic carbon availability are major determinants of soil microbial community composition. Microb. Ecol. 2004, 48, 424–430. [Google Scholar] [CrossRef]
  19. Fierer, N.; Schimel, J.P.; Holden, P.A. Influence of drying-rewetting frequency on soil bacterial community structure. Microb. Ecol. 2003, 45, 63–71. [Google Scholar] [CrossRef] [PubMed]
  20. Bapiri, A.; Bååth, E.; Rousk, J. Drying-rewetting cycles affect fungal and bacterial growth differently in an arable soil. Microb. Ecol. 2010, 60, 419–428. [Google Scholar] [CrossRef] [PubMed]
  21. Wilson, J.S.; Baldwin, D.S.; Rees, G.N.; Wilson, B.P. The effects of short-term inundation on carbon dynamics, microbial community structure and microbial activity in floodplain soil. River Res. Appl. 2011, 27, 213–225. [Google Scholar] [CrossRef]
  22. Bligh, E.G.; Dyer, W.J. A rapid method of total lipid extraction and purification. Can. J. Biochem. Physiol. 1959, 37, 911–917. [Google Scholar] [CrossRef] [Green Version]
  23. Zelles, L. Fatty acid patterns of phospholipids and lipopolysaccharides in the characterisation of microbial communities in soil: A review. Biol. Fertil. Soils 1999, 29, 111–129. [Google Scholar] [CrossRef]
  24. Müller, I.B.; Buhk, C.; Alt, M.; Entling, M.H.; Schirmel, J. Plant functional shifts in Central European grassland under traditional flood irrigation. Appl. Veg. Sci. 2016, 19, 122–131. [Google Scholar] [CrossRef]
  25. Müller, I.B.; Buhk, C.; Lange, D.; Entling, M.H.; Schirmel, J. Contrasting effects of irrigation and fertilization on plant diversity in hay meadows. Basic Appl. Ecol. 2016, 17, 576–585. [Google Scholar] [CrossRef]
  26. Bardgett, R.D.; van der Putten, W.H. Belowground biodiversity and ecosystem functioning. Nature 2014, 515, 505. [Google Scholar] [CrossRef] [PubMed]
  27. Geue, H.; Hock, B. Determination of Acaulospora Longula and Glomus Subgroup Aa in plant roots from grassland using new primers against the large subunit ribosomal DNA. Mycol. Res. 2004, 108, 76–83. [Google Scholar] [CrossRef]
  28. White, D.C.; Davis, W.M.; Nickels, J.S.; King, J.D.; Bobbie, R.J. Determination of the sedimentary microbial biomass by extractible lipid phosphate. Oecologia 1979, 40, 51–62. [Google Scholar] [CrossRef]
  29. Butte, W. Rapid method for the determination of fatty acid profiles from fats and oils using trimethylsulphonium hydroxide for transesterification. J. Chromatogr. A 1983, 261, 142–145. [Google Scholar] [CrossRef]
  30. Gómez-Brandón, M.; Lores, M.; Domínguez, J. A new combination of extraction and derivatization methods that reduces the complexity and preparation time in determining phospholipid fatty acids in solid environmental samples. Bioresour. Technol. 2010, 101, 1348–1354. [Google Scholar] [CrossRef]
  31. Ratledge, C.; Wilkinson, S.G. Microbial Lipids; Academic Press: London, UK; San Diego, CA, USA, 1988; ISBN 978-0-12-582304-3. [Google Scholar]
  32. Olsson, P.A.; Bååth, E.; Jakobsen, I.; Söderström, B. The use of phospholipid and neutral lipid fatty acids to estimate biomass of arbuscular mycorrhizal fungi in soil. Mycol. Res. 1995, 99, 623–629. [Google Scholar] [CrossRef]
  33. Van Aarle, I.M.; Olsson, P.A. Fungal lipid accumulation and development of mycelial structures by two arbuscular mycorrhizal fungi. Appl. Environ. Microbiol. 2003, 69, 6762–6767. [Google Scholar] [CrossRef] [Green Version]
  34. Frostegård, A.; Bååth, E. The use of phospholipid fatty acid analysis to estimate bacterial and fungal biomass in soil. Biol. Fertil. Soils 1996, 22, 59–65. [Google Scholar] [CrossRef]
  35. Kaiser, C.; Frank, A.; Wild, B.; Koranda, M.; Richter, A. Negligible contribution from roots to soil-borne phospholipid fatty acid fungal biomarkers 18:2ω6,9 and 18:1ω9. Soil Biol. Biochem. 2010, 42, 1650–1652. [Google Scholar] [CrossRef] [PubMed] [Green Version]
  36. R Team. Core. R: A Language and Environment for Statistical Computing; R Foundation for Statistical Computing: Vienna, Austria, 2018. [Google Scholar]
  37. Bates, D.; Mächler, M.; Bolker, B.; Walker, S. Fitting linear mixed-effects models using Lme4. J. Stat. Softw. 2015, 67, 48. [Google Scholar] [CrossRef]
  38. Körschens, M.; Albert, E.; Armbruster, M.; Barkusky, D.; Baumecker, M.; Behle-Schalk, L.; Bischoff, R.; Čergan, Z.; Ellmer, F.; Herbst, F.; et al. Effect of mineral and organic fertilization on crop yield, nitrogen uptake, carbon and nitrogen balances, as well as soil organic carbon content and dynamics: Results from 20 European long-term field experiments of the twenty-first century. Arch. Agron. Soil Sci. 2013, 59, 1017–1040. [Google Scholar] [CrossRef]
  39. Francioli, D.; Schulz, E.; Lentendu, G.; Wubet, T.; Buscot, F.; Reitz, T. Mineral vs. organic amendments: Microbial community structure, activity and abundance of agriculturally relevant microbes are driven by long-term fertilization strategies. Front. Microbiol. 2016, 7, 1446. [Google Scholar] [CrossRef] [Green Version]
  40. Menšík, L.; Hlisnikovský, L.; Pospíšilová, L.; Kunzová, E. The effect of application of organic manures and mineral fertilizers on the state of soil organic matter and nutrients in the long-term field experiment. J. Soils Sediments 2018, 1–10. [Google Scholar] [CrossRef]
  41. Nardi, S.; Morari, F.; Berti, A.; Tosoni, M.; Giardini, L. Soil organic matter properties after 40 years of different use of organic and mineral fertilisers. Eur. J. Agron. 2004, 21, 357–367. [Google Scholar] [CrossRef]
  42. Zechmeister, H.G.; Schmitzberger, I.; Steurer, B.; Peterseil, J.; Wrbka, T. The influence of land-use practices and economics on plant species richness in meadows. Biol. Conserv. 2003, 114, 165–177. [Google Scholar] [CrossRef]
  43. Federal Ministry of Food and Agriculture (Germany). German Fertilizer Enactment Verordnung Über Das Inverkehrbringen von Düngemitteln, Bodenhilfsstoffen, Kultursubstraten Und Pflanzenhilfsmitteln. Bundesgesetzblatt 2012, 58, 2482–2544. [Google Scholar]
  44. Zak, D.R.; Holmes, W.E.; White, D.C.; Peacock, A.D.; Tilman, D. Plant diversity, soil microbial communities, and ecosystem function: Are there any links? Ecology 2003, 84, 2042–2050. [Google Scholar] [CrossRef] [Green Version]
  45. Lange, M.; Eisenhauer, N.; Sierra, C.A.; Bessler, H.; Engels, C.; Griffiths, R.I.; Mellado-Vázquez, P.G.; Malik, A.A.; Roy, J.; Scheu, S.; et al. Plant diversity increases soil microbial activity and soil carbon storage. Nat. Commun. 2015, 6, 6707. [Google Scholar] [CrossRef] [PubMed]
  46. Xue, R.; Shen, Y.; Marschner, P. Soil water content during and after plant growth influence nutrient availability and microbial biomass. J. Soil Sci. Plant. Nutr. 2017, 17, 702–715. [Google Scholar] [CrossRef] [Green Version]
  47. Treseder, K.K. Nitrogen additions and microbial biomass: A meta-analysis of ecosystem studies. Ecol. Lett. 2008, 11, 1111–1120. [Google Scholar] [CrossRef] [Green Version]
  48. Yao, H.; He, Z.; Wilson, M.J.; Campbell, C.D. Microbial biomass and community structure in a sequence of soils with increasing fertility and changing land use. Microb. Ecol. 2000, 40, 223–237. [Google Scholar] [CrossRef]
  49. Stagnari, F.; Perpetuini, G.; Tofalo, R.; Campanelli, G.; Leteo, F.; della Vella, U.; Schirone, M.; Suzzi, G.; Pisante, M. Long-term impact of farm management and crops on soil microorganisms assessed by combined DGGE and PLFA analyses. Front. Microbiol. 2014, 5, 644. [Google Scholar] [CrossRef] [Green Version]
  50. Tian, J.; Dippold, M.; Pausch, J.; Blagodatskaya, E.; Fan, M.; Li, X.; Kuzyakov, Y. Microbial response to rhizodeposition depending on water regimes in paddy soils. Soil Biol. Biochem. 2013, 65, 195–203. [Google Scholar] [CrossRef]
  51. Bååth, E.; Anderson, T.-H. Comparison of soil fungal/bacterial ratios in a PH gradient using physiological and PLFA-based techniques. Soil Biol. Biochem. 2003, 35, 955–963. [Google Scholar] [CrossRef]
  52. Egerton-Warburton, L.M.; Johnson, N.C.; Allen, E.B. Mycorrhizal community dynamics following nitrogen fertilization: A cross-site test in five grasslands. Ecol. Monogr. 2007, 77, 527–544. [Google Scholar] [CrossRef] [Green Version]
  53. Gryndler, M.; Larsen, J.; Hršelová, H.; Řezáčová, V.; Gryndlerová, H.; Kubát, J. Organic and mineral fertilization, respectively, increase and decrease the development of external mycelium of arbuscular mycorrhizal fungi in a long-term field experiment. Mycorrhiza 2006, 16, 159–166. [Google Scholar] [CrossRef]
  54. Mentzer, J.L.; Goodman, R.M.; Balser, T.C. Microbial response over time to hydrologic and fertilization treatments in a simulated wet prairie. Plant Soil 2006, 284, 85–100. [Google Scholar] [CrossRef]
  55. Burrows, R.L.; Pfleger, F.L. Arbuscular mycorrhizal fungi respond to increasing plant diversity. Can. J. Bot. 2002, 80, 120–130. [Google Scholar] [CrossRef]
  56. Morris, E.K.; Buscot, F.; Herbst, C.; Meiners, T.; Obermaier, E.; Wäschke, N.W.; Wubet, T.; Rillig, M.C. Land use and host neighbor identity effects on arbuscular mycorrhizal fungal community composition in focal plant rhizosphere. Biodivers. Conserv. 2013, 22, 2193–2205. [Google Scholar] [CrossRef]
  57. Chen, Y.-L.; Zhang, X.; Ye, J.-S.; Han, H.-Y.; Wan, S.-Q.; Chen, B.-D. Six-year fertilization modifies the biodiversity of arbuscular mycorrhizal fungi in a temperate steppe in inner mongolia. Soil Biol. Biochem. 2014, 69, 371–381. [Google Scholar] [CrossRef]
  58. Dumbrell, A.J.; Nelson, M.; Helgason, T.; Dytham, C.; Fitter, A.H. Relative roles of niche and neutral processes in structuring a soil microbial community. ISME J. 2010, 4, 337–345. [Google Scholar] [CrossRef] [PubMed] [Green Version]
  59. Alt, M.; Buhk, C.; Diehl, D.; Gerlach, R.; Rudolph, I.; Schirmel, J.; Theissinger, K.; Schaumann, G.E. Historical irrigated meadows at the river Queich, Rhineland-Palatinate. In Jahrestagung der DBG 2013: Böden-Lebensgrundlage und Verantwortung; Jahrestagung der DBG: Rostock, Germany, 2013. [Google Scholar]
Figure 1. Map of the sampling area and the sampling design. Symbols show the positions of meadows that were flooded (blue), non-flooded (red), fertilized (circles), and non-fertilized (triangles). Top left shows the sampling pattern with black dots referring to the sampling points within the respective sampling plots. The edge length of the outer and inner triangle of the sampling design were 4 and 1.25 m, respectively. Map source: © OpenStreetMap contributors.
Soilsystems 05 00024 g001
Figure 2. Boxplots of (A) total phospholipid fatty acids (PLFA) content and (B) PLFA relative to the organic carbon content (PLFA/Corg) in meadow soil of different agricultural practices. Analysis was done using n = 7 samples × 12 plots, including “Plot” as a random effect.
Soilsystems 05 00024 g002
Figure 3. Boxplots of (A) Gram-negative bacteria, (B) Gram-positive bacteria, (C) fungi, and (D) arbuscular mycorrhizal fungi (AMF) PLFA proportions in meadow soil of different agricultural practices. Analysis was done using n = 7 samples × 12 plots, including “Plot” as a random effect.
Soilsystems 05 00024 g003
Figure 4. Boxplots of (A) the fungi/bacteria and (B) arbuscular mycorrhizal fungi (AMF)/fungi ratio in meadow soil of different agricultural practices. Analysis was done using n = 7 samples × 12 plots, including “Plot” as a random effect.
Soilsystems 05 00024 g004
Figure 5. Linear trend line of arbuscular mycorrhizal fungi (AMF) PLFA proportion and soil pH (adjusted R2 = 0.62, p < 0.001) in meadows that were flooded (FL, blue), non-flooded (nFL, red), fertilized (FER, circles), and non-fertilized (nFER, triangles).
Soilsystems 05 00024 g005
Figure 6. Trend lines for the relationship between (A) total PLFA content, (B) fungi/bacteria ratio, (C) fungal PLFA proportion, (D) bacterial PLFA proportion, and the soil water content at sampling time in meadows that were flooded (FL, blue), non-flooded (nFL, red), fertilized (FER, circles), and non-fertilized (nFER, triangles).
Soilsystems 05 00024 g006
Table 1. Soil chemical parameters and soil texture of meadows that were neither flooded nor fertilized (control), flooded only, fertilized only, and flooded × fertilized shown as means and standard deviation. Analysis was done using n = 7 samples × 12 plots, including “Plot” as a random effect.
ParameterControlFlooded OnlyFertilized OnlyFlooded × Fertilized
Corg (%)3.8 ± 0.65 ± 13 ± 15 ± 2
Ntot (%)0.35 ± 0.050.5 ± 0.10.30 ± 0.090.5 ± 0.2
pH4.9 ± 0.25.3 ± 0.16 ± 15.3 ± 0.3
Water extractable NO3 (µg g−1)90 ± 30120 ± 9090 ± 60110 ± 80
Water content (g g−1 soil)0.29 ± 0.040.46 ± 0.090.22 ± 0.040.4 ± 0.2
Sand (%)50 ± 1040 ± 2057 ± 650 ± 10
Silt (%)27 ± 530 ± 828 ± 429 ± 5
Clay (%)21 ± 730 ± 1016 ± 323 ± 7
Publisher’s Note: MDPI stays neutral with regard to jurisdictional claims in published maps and institutional affiliations.

