
Drought and Anthropogenic Effects on Acacia Populations: A Case Study from the Hyper-Arid Southern Israel


 and
and
Abstract
1. Introduction
2. Materials and Methods
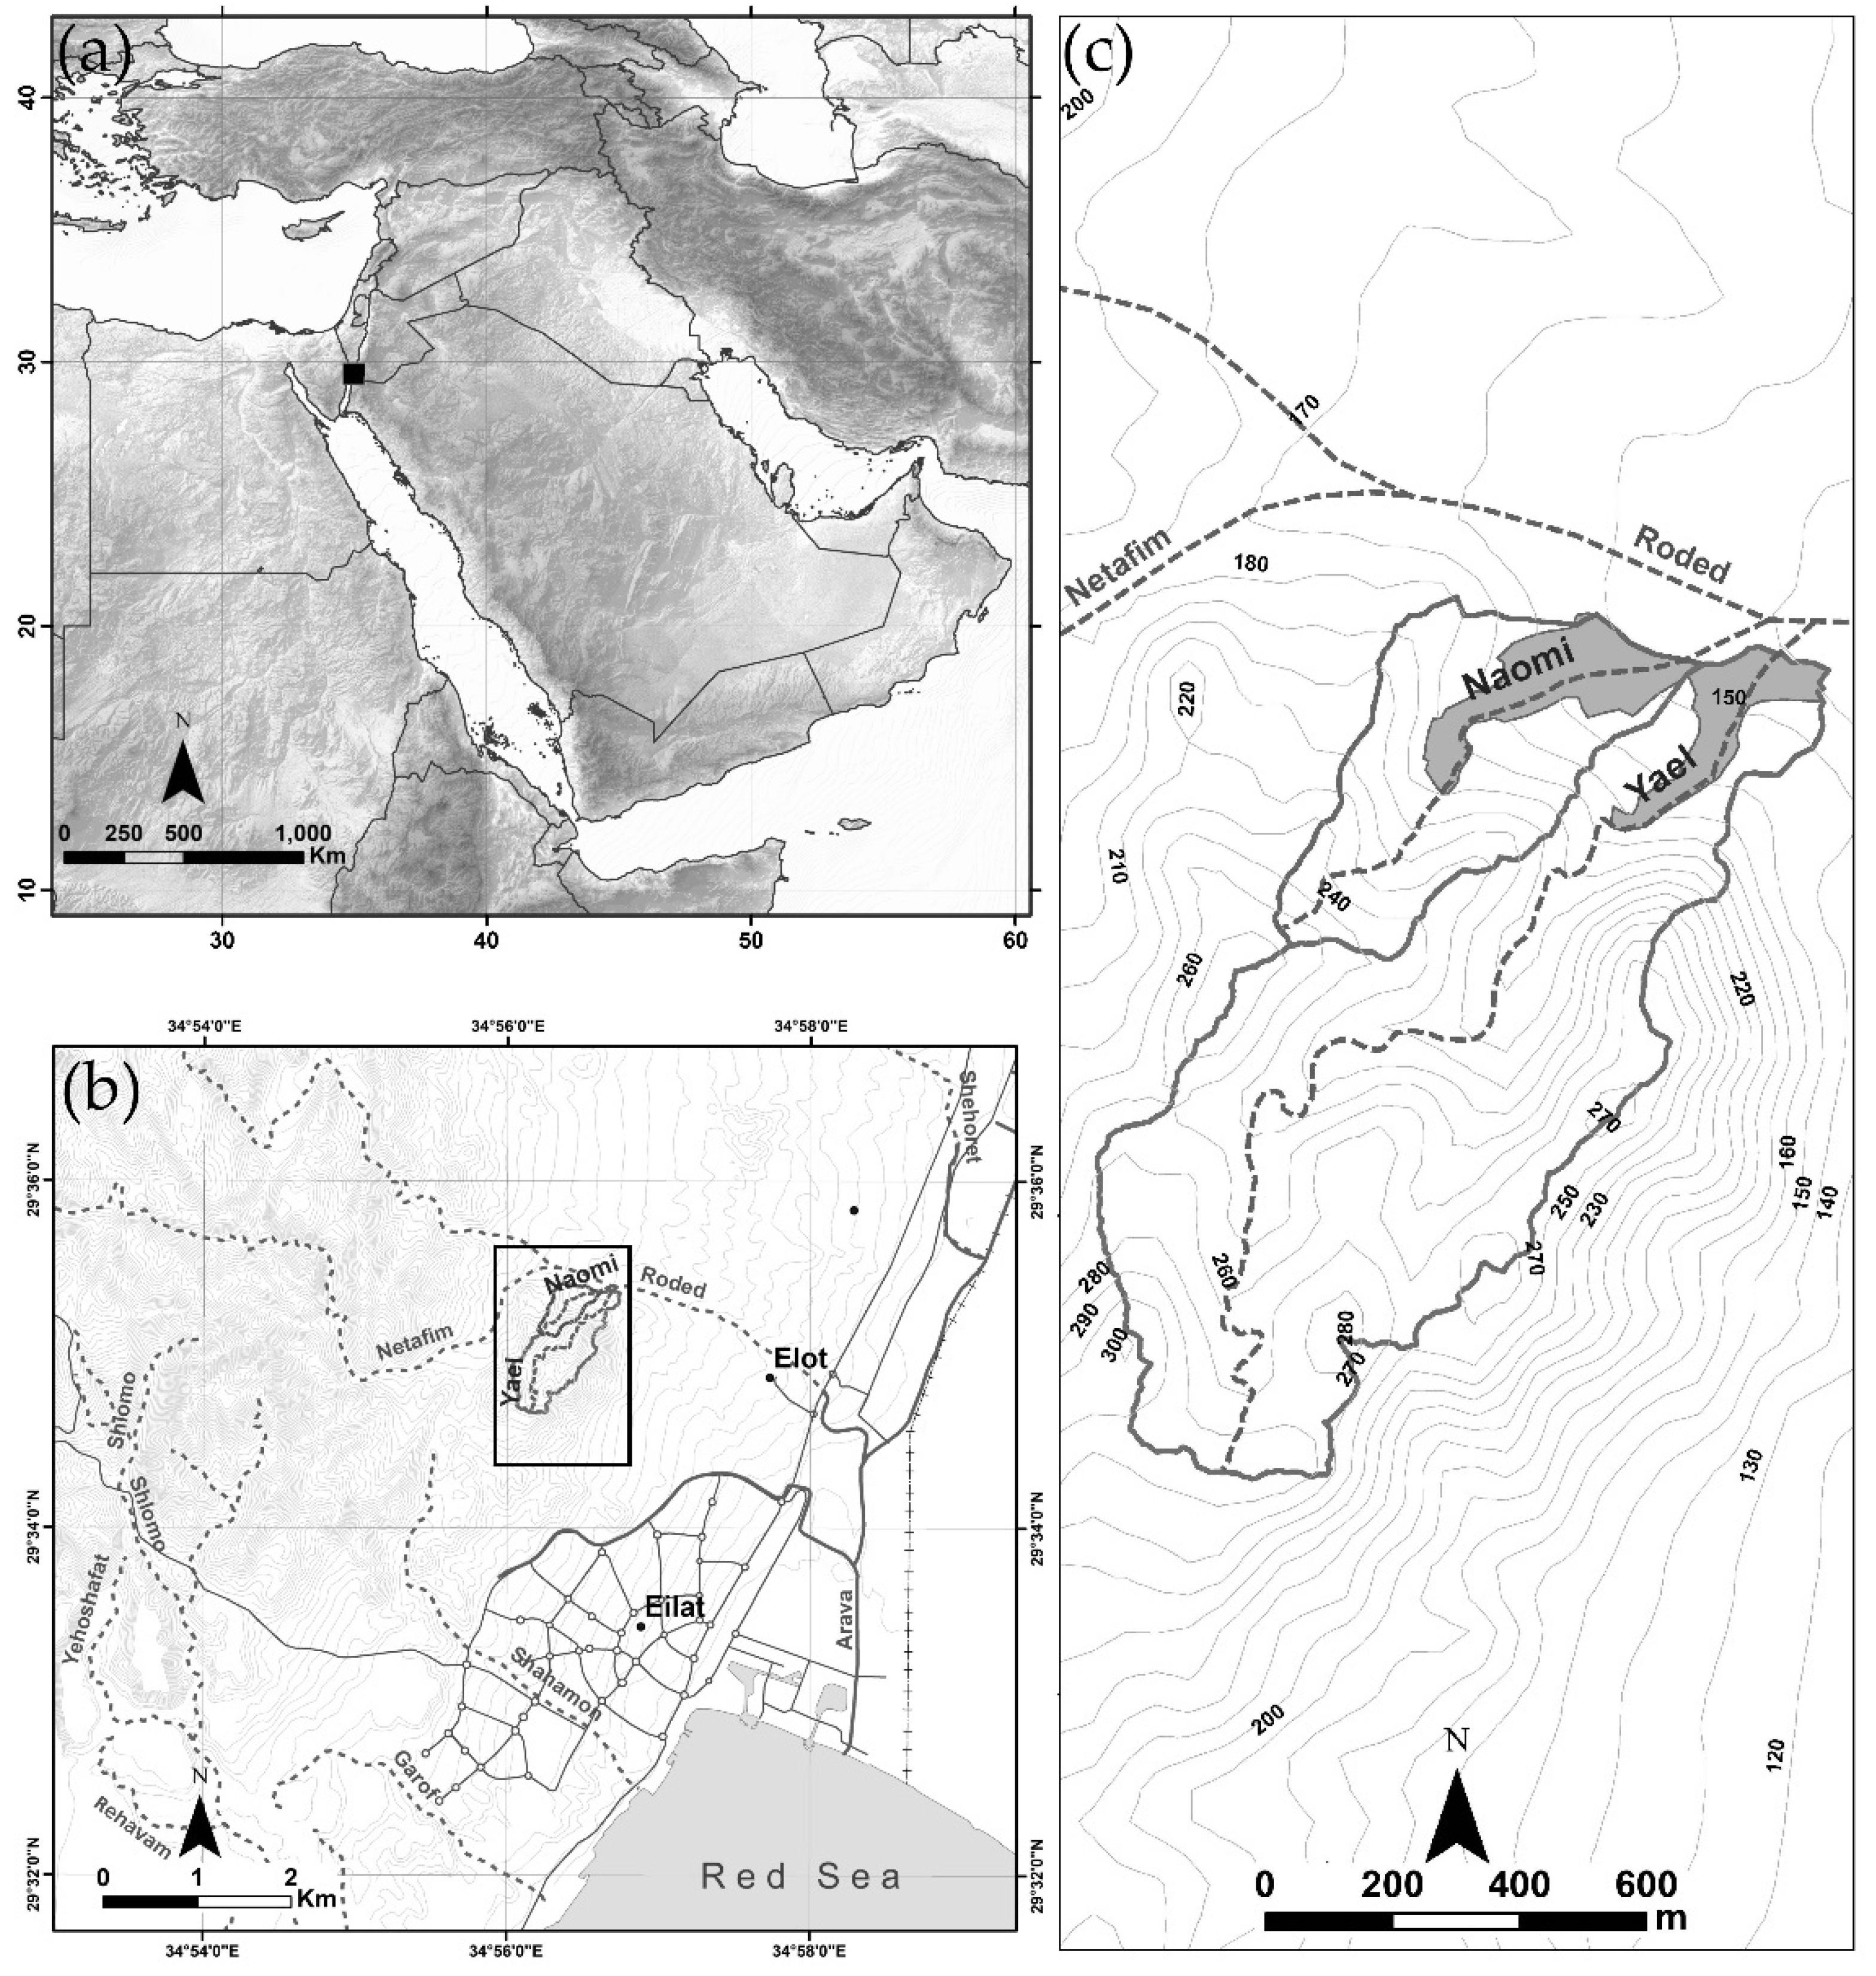
2.1. Regional Settings
2.2. Field Work and Data Analysis
3. Results
4. Discussion
5. Conclusions
Author Contributions
Funding
Institutional Review Board Statement
Informed Consent Statement
Data Availability Statement
Acknowledgments
Conflicts of Interest
References
- Andersen, G.L. Vegetation and management regime continuity in the cultural landscape of the Eastern Desert. In The History of the Peoples of the Eastern Desert; Barnard, H., Duistermaat, K., Eds.; Cotsen Institute of Archaeology University of California: Los Angeles, CA, USA, 2012; pp. 126–139. [Google Scholar]
- Andersen, G.L.; Krzywinski, K.; Talib, M.; Saadallah, A.E.M.; Hobbs, J.J.; Pierce, R.H. Traditional nomadic tending of trees in the Red Sea Hills. J. Arid Environ. 2014, 106, 36–44. [Google Scholar] [CrossRef]
- Andersen, G.L.; Krzywinski, K. Mortality, recruitment and change of desert tree populations in a hyper-arid environment. PLoS ONE 2007, 2, e208. [Google Scholar] [CrossRef]
- Chaudhary, S.A. Destructions of Acacia woodlands and juniper forests in Asia and eastern Africa. Pak. J. Bot. 2010, 42, 259–266. [Google Scholar]
- Dean, W.R.J.; Milton, S.J.; Jeltsch, F. Large trees, fertile islands, and birds in arid savanna. J. Arid Environ. 1999, 41, 61–78. [Google Scholar] [CrossRef]
- Hackett, T.D.; Korine, C.; Holderied, M.W. The importance of Acacia trees for insectivorous bats and arthropods in the Arava Desert. PLoS ONE 2013, 8, e52999. [Google Scholar] [CrossRef]
- Hobbs, J.J.; Krzywinski, K.; Andersen, G.L.; Talib, M.; Pierce, R.H.; Saadallah, A.E.M. Acacia trees on the cultural landscapes of the Red Sea Hills. Biodivers. Conserv. 2014, 23, 2923–2943. [Google Scholar] [CrossRef]
- Krzywinski, K.; Pierce, R.H. Deserting the Desert, A Threatened Cultural Landscape between the Nile and the Sea; Alvheim og Eide Akademisk Forlag: Bergen, Norway, 2001. [Google Scholar]
- Munzbergova, Z.; Ward, D. Acacia trees as keystone species in the Negev desert ecosystems. J. Veg. Sci. 2002, 13, 227–236. [Google Scholar] [CrossRef]
- Wickens, G.E.; Seif El Din, A.G.; Sita, G.; Nahal, I. Role of Acacia Species in the Rural Economy of Dry Africa and the Near East; FAO Conservation Guide 27: Rome, Italy, 1995. [Google Scholar]
- Huang, J.; Ji, M.; Xie, Y.; Wang, S.; He, Y.; Ran, J. Global semi-arid climate change over last 60 years. Clim. Dyn. 2016, 46, 1131–1150. [Google Scholar] [CrossRef]
- Ward, D.; Rohner, C. Anthropogenic causes of high mortality and low recruitment in three Acacia tree taxa in the Negev desert, Israel. Biodivers. Conserv. 1997, 6, 877–893. [Google Scholar] [CrossRef]
- Peled, Y. Mortality of Acacia Trees in the Southern Arava. Master’s Thesis, Hebrew University, Rehovot, Israel, 1988. [Google Scholar]
- Bendavid-Novak, H.; Schick, A.P. The response of Acacia tree populations on small alluvial fans to changes in the hydrological regime: Southern Negev Desert, Israel. Catena 1997, 29, 341–351. [Google Scholar] [CrossRef]
- Stavi, I.; Silver, M.; Avni, Y. Latitude, basin size, and microhabitat effects on the viability of Acacia trees in the Negev and Arava, Israel. Catena 2014, 114, 149–156. [Google Scholar] [CrossRef]
- Lahav-Ginott, S.; Kadmon, R.; Gersani, M. Evaluating the viability of Acacia populations in the Negev Desert: A remote sensing approach. Biol. Conserv. 2001, 98, 127–137. [Google Scholar] [CrossRef]
- Isaacson, S.; Ephrath, J.E.; Rachmilevitch, S.; Maman, S.; Ginat, H.; Blumberg, D.G. Long and short term population dynamics of acacia trees via remote sensing and spatial analysis: Case study in the southern Negev Desert. Remote Sens. Environ. 2017, 198, 95–104. [Google Scholar] [CrossRef]
- Perleberg, A.; Ron, M.; Ramon, U. Acacia Survey in the Arava; Hakeren Hakayemet LeIsrael and Open Landscape Institute: Tel Aviv, Israel, 2013. [Google Scholar]
- Moustakas, A.; Wiegand, K.; Getzin, S.; Ward, D.; Meyer, K.M.; Guenther, M.; Mueller, K.l.-H. Spacing patterns of an Acacia tree in the Kalahari over a 61-year period: How clumped becomes regular and vice versa. Acta Oecol. 2008, 33, 355–364. [Google Scholar] [CrossRef]
- Andersen, G.L.; Krzywinski, K. Longevity and growth of Acacia tortilis; insights from 14C content and anatomy of wood. BMC Ecol. 2007, 7, 4. [Google Scholar] [CrossRef]
- Goslar, T.; Andersen, G.; Krzywinski, K.; Czernik, J. Radiocarbon determination of past growth rates of living Acacia tortilis trees from two arid sites in Eastern Sahara. Radiocarbon 2013, 55, 1683–1692. [Google Scholar] [CrossRef]
- Stavi, I.; Shem-Tov, R.; Shlomi, Y.; Bel, G.; Yizhaq, H. Recruitment and decay rate of Acacia seedlings in the hyper-arid Arava Valley, Israel. Catena 2015, 131, 14–21. [Google Scholar] [CrossRef]
- Wiegand, K.; Ward, D.; Thulke, H.-H.; Jeltsch, F. From snapshot information to long-term population dynamics of Acacias by a simulation model. Plant. Ecol. 2000, 150, 97–114. [Google Scholar] [CrossRef]
- Wiegand, K.; Jeltsch, F.; Ward, D. Minimum recruitment frequency in plants with episodic recruitment. Oecologia 2004, 141, 363–372. [Google Scholar] [CrossRef]
- Isaacson, S. Monitoring Drought Stress in Acacia Trees in Hyper-Arid Zones: Geo-Ecophysiology Aspects. Ph.D. Thesis, Ben-Gurion University of the Negev, Beer Sheva, Israel, 2017. [Google Scholar]
- Andersen, G.L.; Krzywinski, K.; Gjessing, H.K.; Pierce, R.H. Seed viability and germination success of Acacia tortilis along land-use and aridity gradients in the Eastern Sahara. Ecol. Evol. 2016, 6, 256–266. [Google Scholar] [CrossRef]
- Blanco, J.; Genin, D.; Carrière, S. The influence of Saharan agro-pastoralism on the structure and dynamics of acacia stands. Agric. Ecosyst. Environ. 2015, 213, 21–31. [Google Scholar] [CrossRef]
- Ginat, H.; Shlomi, Y.; Batarseh, S.; Vogel, J. Reduction in precipitation levels in the Arava Valley (Southern Israel and Jordan), 1949–2009. J. Dead-Sea Arava Res. 2011, 1, 1–7. [Google Scholar]
- Katz, T.; Ginat, H.; Eyal, G.; Steiner, Z.; Braun, Y.; Shalev, S.; Goodman-Tchernov, B.N. Desert flash floods form hyperpycnal flows in the coral-rich Gulf of Aqaba, Red Sea. Earth Planet. Sci. Lett. 2015, 417, 87–98. [Google Scholar] [CrossRef]
- Ashkenazi, S. Acacia Trees in the Negev and Arava, Isral—A Review Following Reported Large-Scale Mortality; Hakeren Hakayemet LeIsrael: Jerusalem, Israel, 1995. [Google Scholar]
- Groner, E.; Rapaport, A.; Segev, N.; Ragolsky, G.; Nelvitsky, R.; Alexander, K.; Rabinowitz, O.; Grunfeld, M.; Shalmon, B.; Tsoar, A.; et al. A standardized protocol to monitor Acacia trees in the Arava. Negev. Dead Sea Arava Stud. 2017, 9, 1–14. [Google Scholar]
- Shrestha, M.K.; Stock, W.D.; Ward, D.; Golan-Goldhirsh, A. Water status of isolated Negev desert populations of Acacia raddiana with different mortality levels. Plant. Ecol. 2003, 168, 297–307. [Google Scholar] [CrossRef]
- Enzel, Y.; Amit, R.; Grodek, T.; Ayalon, A.; Lekach, J.; Porat, N.; Bierman, P.; Blum, J.D.; Erel, Y. Late Quaternary weathering, erosion, and deposition in Nahal Yael, Israel: An “impact of climatic change on an arid watershed”? Geol. Soc. Am. Bull. 2012, 124, 705–722. [Google Scholar] [CrossRef]
- Schick, A.P.; Lekach, J. An evaluation of two ten-year sediment budgets, Nahal Yael, Israel. Phys. Geogr. 1993, 14, 225–238. [Google Scholar] [CrossRef]
- Kyalangalilwa, B.; Boatwright, J.S.; Daru, B.H.; Maurin, O.; Van Der Bank, M. Phylogenetic position and revised classification of Acacia s.l. (Fabaceae: Mimosoideae) in Africa, including new combinations in Vachellia and Senegalia. Bot. J. Linn. Soc. 2013, 172, 500–523. [Google Scholar] [CrossRef]
- Israel Meteorological Service Data Base, Eilat Station 1972–2017. Available online: https://ims.data.gov.il/he/ims-results (accessed on 5 April 2018).
- Noy-Meir, I. Desert ecosystems: Environment and producers. Annu. Rev. Ecol. Syst. 1973, 4, 25–51. [Google Scholar] [CrossRef]
- Ogen, G. Acacia Trees at Nahal Shlomo after 18 Years of Drought. In Final Thesis in Biology and Earth Science; Maale Shaharut School: Yotvata, Israel, 2012. [Google Scholar]
- Stavi, I.; Shem-Tov, R.; Gourjon, E.; Ragolski, G.; Shlomi, Y.; Ginat, H. Effects of ‘red unit’ deposit on Acacia trees in the hyper-arid southern Israel. Catena 2016, 145, 316–320. [Google Scholar] [CrossRef]
- Stavi, I.; Gusarov, Y.; Shem-Tov, R.; Lekach, J. Pseudo soil in hyper-arid ephemeral stream channel beds: Geo-ecological implications of the fluvio-pedogenic unit (FPU). Catena 2019, 173, 505–510. [Google Scholar] [CrossRef]
- Sher, A.A.; Wiegand, K.; Ward, D. Do Acacia and Tamarix trees compete for water in the Negev desert? J. Arid Environ. 2010, 74, 338–343. [Google Scholar] [CrossRef]
- Winters, G.; Ryvkin, I.; Rudkov, T.; Moreno, Z.; Furman, A. Mapping underground layers in the super arid Gidron Wadi using electrical resistivity tomography (ERT). J. Arid Environ. 2015, 121, 79–83. [Google Scholar] [CrossRef]


| >45 Years Old | 45–22 Years Old | <22 Years Old | |
|---|---|---|---|
| (N = 8) | (N = 10) | (N = 8) | |
| Average height (m) | 4.1 ± 0.5 | 2.7 ± 0.4 | 0.9 ± 0.2 |
| Average canopy area (m2) | 23.7 ± 7.6 | 15.6 ± 7.3 | 1.8 ± 0.7 |
| Nahal Naomi | Nahal Yael | ||||
|---|---|---|---|---|---|
| Mortality | Recruitment | Mortality | Recruitment | ||
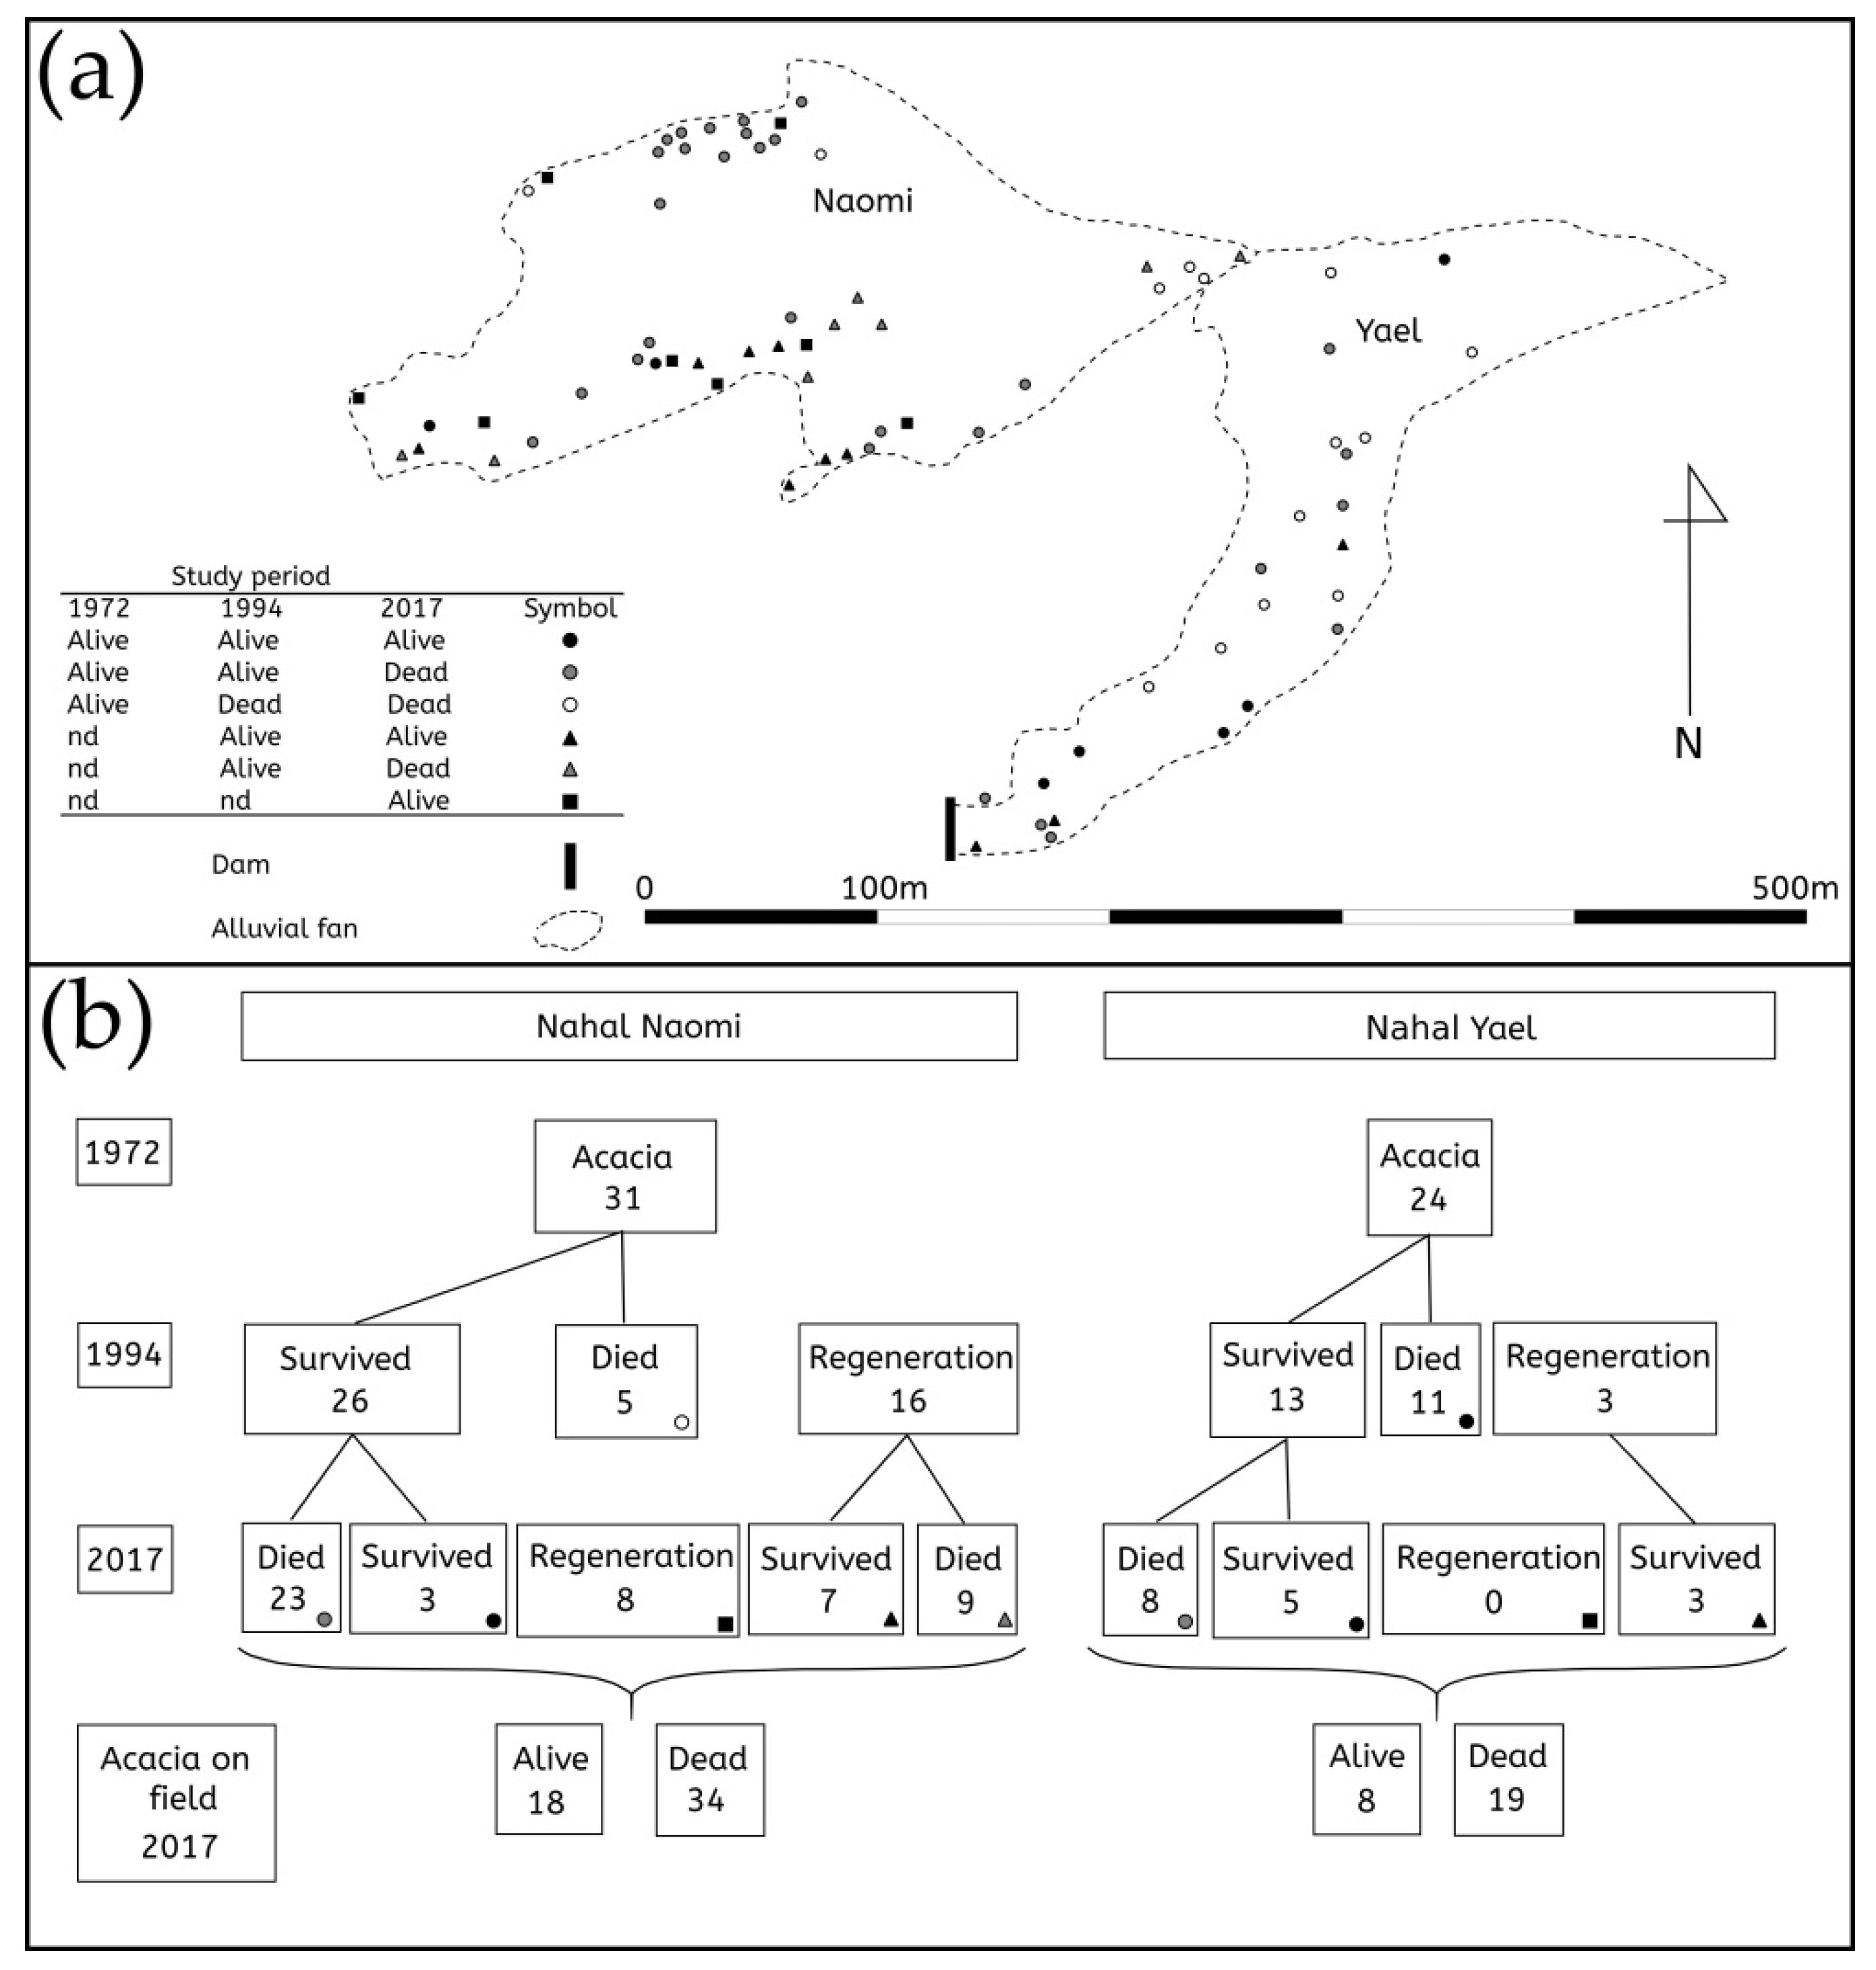
| 1972–1994 | Total percentage | 17% | 51% | 46% | 12% |
| Bendavid-Novak and Schick [14] | Percentage per year | 0.7% y−1 | 2.3% y−1 | 2% y−1 | 0.5% y−1 |
| Net change per year | 1.5% y−1 | −1.5% y−1 | |||
| 1994–2017 | Total percentage | 76% | 19% | 50% | 0% |
| Percentage per year | 3.2% y−1 | 0.8% y−1 | 2% y−1 | 0% y−1 | |
| Net change per year | −2.4% y−1 | −2% y−1 | |||
| Rate of Change (% year−1) | −2.5 * | −2 * | −1.5 * | −1 | −0.5 | 0 | 0.5 | 1 | 1.5 * | |
|---|---|---|---|---|---|---|---|---|---|---|
| Change in population size (%) | After 10 y | 75 | 80 | 85 | 90 | 95 | 100 | 105 | 110 | 115 |
| After 20 y | 50 | 60 | 70 | 80 | 90 | 100 | 110 | 120 | 130 | |
| After 30 y | 25 | 40 | 55 | 70 | 85 | 100 | 115 | 130 | 145 | |
| Mortality Ratio | ||||||||
|---|---|---|---|---|---|---|---|---|
| Date of Survey | Sites not Affected by Anthropogenic Disturbances | Site Affected by Anthropogenic Disturbances | Ref. | |||||
| Timna | Raham | Roded | Shlomo | Naomi | Yael | |||
| Pre-drought | 1981 | 16.7% (N = 174) | 22.1% (N = 149) | 16.6% (N = 217) | 0% (N = 66) | Peled [13] | ||
| 1994 | 11.9% (N = 42) | 40.7% (N = 27) | Bendavid-Novak and Schick [14] | |||||
| 1995 | 10% (N?) | 9% (N?) | Ward and Rohner [12] | |||||
| Mean mortality ratio across the Eilat region in the pre-drought period (1972–1994): 12.3 ± 7% (mean ± SD, N = 7) | ||||||||
| Pre-drought | 2011 | 54.1% (N = 159) | Ogen [38] | |||||
| 25% (N = 180) | 60% (N = 180) | 22% (N = 180) | Stavi et al., [15] | |||||
| 2016 | 55% (N = 48) | 28% (N = 77) | Isaacson [25] | |||||
| 2017 | 65.4% (N = 52) | 70.4% (N = 27) | This study | |||||
| Mean mortality ratio across the Eilat region over the post-drought period (2010–2017): 44.2 ± 18% (mean ± SD, N = 7) | ||||||||
Publisher’s Note: MDPI stays neutral with regard to jurisdictional claims in published maps and institutional affiliations. |
© 2021 by the authors. Licensee MDPI, Basel, Switzerland. This article is an open access article distributed under the terms and conditions of the Creative Commons Attribution (CC BY) license (https://creativecommons.org/licenses/by/4.0/).
Share and Cite
Armoza-Zvuloni, R.; Shlomi, Y.; Shem-Tov, R.; Stavi, I.; Abadi, I. Drought and Anthropogenic Effects on Acacia Populations: A Case Study from the Hyper-Arid Southern Israel. Soil Syst. 2021, 5, 23. https://doi.org/10.3390/soilsystems5020023
Armoza-Zvuloni R, Shlomi Y, Shem-Tov R, Stavi I, Abadi I. Drought and Anthropogenic Effects on Acacia Populations: A Case Study from the Hyper-Arid Southern Israel. Soil Systems. 2021; 5(2):23. https://doi.org/10.3390/soilsystems5020023
Chicago/Turabian StyleArmoza-Zvuloni, Rachel, Yanai Shlomi, Rachamim Shem-Tov, Ilan Stavi, and Itay Abadi. 2021. "Drought and Anthropogenic Effects on Acacia Populations: A Case Study from the Hyper-Arid Southern Israel" Soil Systems 5, no. 2: 23. https://doi.org/10.3390/soilsystems5020023
APA StyleArmoza-Zvuloni, R., Shlomi, Y., Shem-Tov, R., Stavi, I., & Abadi, I. (2021). Drought and Anthropogenic Effects on Acacia Populations: A Case Study from the Hyper-Arid Southern Israel. Soil Systems, 5(2), 23. https://doi.org/10.3390/soilsystems5020023