Article

Biogeochemical Controls on the Potential for Long-Term Contaminant Leaching from Soils Developing on Historic Coal Mine Spoil

1
Department of Geology, Kent State University, Kent, OH 44242, USA
2
Department of Biology, University of Akron, Akron, OH 44325, USA
3
Department of Geosciences, University of Akron, Akron, OH 44325, USA
4
Integrated Biosciences, University of Akron, Akron, OH 44325, USA
5
Department of Geology, University of Vermont, Burlington, VT 05405, USA
*
Author to whom correspondence should be addressed.
Current address: Oak Ridge National Laboratory, 1 Bethel Valley Rd, Oak Ridge, TN 37830, USA.
Soil Syst. 2021, 5(1), 3; https://doi.org/10.3390/soilsystems5010003
Submission received: 23 October 2020 / Revised: 18 December 2020 / Accepted: 28 December 2020 / Published: 30 December 2020

Abstract

:
Coal mine spoil is widespread in US coal mining regions, and the potential long-term leaching of toxic metal(loid)s is a significant and underappreciated issue. This study aimed to determine the flux of contaminants from historic mine coal spoil at a field site located in Appalachian Ohio (USA) and link pore water composition and solid-phase composition to the weathering reaction stages within the soils. The overall mineralogical and microbial community composition indicates that despite very different soil formation pathways, soils developing on historic coal mine spoil and an undisturbed soil are currently dominated by similar mineral weathering reactions. Both soils contained pyrite coated with clays and secondary oxide minerals. However, mine spoil soil contained abundant residual coal, with abundant Fe- and Mn- (oxy)hydroxides. These secondary phases likely control and mitigate trace metal (Cu, Ni, and Zn) transport from the soils. While Mn was highly mobile in Mn-enriched soils, Fe and Al mobility may be more controlled by dissolved organic carbon dynamics than mineral abundance. There is also likely an underappreciated risk of Mn transport from coal mine spoil, and that mine spoil soils could become a major source of metals if local biogeochemical conditions change.

1. Introduction

Coal mine spoil is an obligate waste product of coal extraction and contains a mixture of residual, non-economically viable mined rock or sediment and overburden material. The approximately 150 years of unregulated mining in the United States (US) (i.e., prior to the enactment of the Clean Water Act in 1972 and the Surface Mining Control and Reclamation Act (SMCRA) of 1977) resulted in severe negative impacts on the environment that included both physical hazards (e.g., dangerous mine openings, landslides, high walls, impoundments, highly erodible lands, clogged stream lands, and subsidence) and chemical hazards (e.g., toxic mine waste, and acid mine drainage (AMD)) [1]. In particular, mine waste (e.g., spoil) was often left abandoned after cessation of coal production, resulting in an on-going and critical need to continue reclamation and restoration in these regions [2]. These mine spoil piles can be a source of AMD which is generated through the microbially-mediated oxidative dissolution of pyrite, remnant coal, and other reduced phases [3,4]. Generation of AMD liberates acidic, metal(loid)-rich (e.g., Al, Cu, Fe, Mn, Ni, and Zn) materials that are primarily released during oxidative dissolution of pyrite (FeS2) and other sulfide phases. [5,6,7]. Contaminant leaching from historical coal mine spoil represents a more geographically diffuse problem compared to point sources (e.g., abandoned mine ponds and underground tunnels) and remains difficult and expensive to address. In Ohio alone, it has been estimated that there are approximately 36 billion tons of known coal mine spoil [8]. These materials are widespread in US coal mining regions, and the potential long-term leaching of AMD and toxic metal(loid)s to surface and groundwater is a significant and underappreciated issue.
Recent work has shown that μm-scale pyrite and other metal sulfide grains can be present in soils developing on coal mine spoil even after decades since emplacement [8]. The potential for continued oxidative dissolution and leaching of metal(loid)s from historic coal mine spoil could represent a long-term source of slowly diffusing contaminants into surface and groundwater [9]. However, the actual flux of contaminants through soils developing on coal mine spoil and the relationship between current mineral weathering reactions and solute release has not been fully examined. The potential for continued oxidative dissolution of reduced phases and contaminant production and transport is related to both (bio)geochemical and physical properties of soils developing on mine spoil. For example, fracturing and cracking of remnant coal material during spoil emplacement can increase exposed surface area resulting in enhanced water infiltration and chemical weathering, and this process can continue deeper in spoil piles [10]. The total flux of dissolved solutes is typically dominated by Ca2+, Mg2+, SO42−, and HCO3 but can also include other major and trace ions, and streams in Appalachian coal mining-impacted areas adjacent to soils developing on coal mine spoil can have specific conductance values greater than 1000 μS cm−1 [11,12]. Further, post-mining landscapes can have gentler slopes, increased water storage potential, and altered hydrologic flow paths, which can increase weathering rates and solute release and transport [13]. However, secondary mineral precipitation as a result of primary mineral weathering can produce phases such as Fe(III)- and Mn-(oxy)hydroxides and clay mineral, which can limit the transport of released metal(loid)s [14,15,16,17]. It is therefore critical to evaluate metal(loid) leaching from soils developing on coal mine spoil and link solute transport to mineral weathering reactions in order to determine the potential long-term risk of contaminant transport from these materials.
The objective of the current study was to link pore water composition and solid-phase composition in weathering coal mine spoil at a field site located in Appalachian Ohio (US) to assess the potential for historic spoil piles to release AMD-associated contaminants. It was hypothesized that metal(loid) release from remnant pyrite (and other sulfide phases) in mine spoil could potentially be mitigated by sequestration of secondary weathering products. Untangling this dynamic relationship can bridge hydrobiogeochemical processes from the pore scale to the pedon scale to aid in developing a more unified understanding of contaminant transport in these settings. The project objectives were accomplished by comparing soil pore water composition between soil developing on historic coal mine spoil and soil weathering from undisturbed but similar lithology in Appalachian Ohio. Both soils contain pyrite and remnant coal, although the mine spoil has a much high amount of these potential contaminant sources. Suction lysimeters were installed at four depths at each site to monitor pore water composition, which was linked to solid-phase properties determined in the extracted soil cores. Solid-phase characterization included a full (bio)geochemical and mineralogical suite of techniques to evaluate the potential importance of AMD generation from non-point sources, and the potential for long-term ecosystem impairment.

2. Materials and Methods

2.1. Site Description

The study site is located in the Huff Run Watershed (31.9 km2) and is an unglaciated section of the Appalachian Plateau in northeast Ohio (USA) (Figure 1A). The lithology of the watershed consists primarily of a coal-shale (of the Pennsylvanian Allegheny group) as well as siltstone, sandstone, thinly bedded limestone, and 0.3–1.5 m thick coal seams [18,19]. The region’s biome is defined as Temperate Deciduous Forest [20], and previously reported data on the climate of the watershed, and contaminant transport potential and remediation activities of the Huff Run Watershed can be found in [9,21,22]. With respect to the mining history of the watershed, underground coal mining in the region began as early as 1810, and surface mining became dominant in the late 1940s [23]. Active surface mining is believed to have ceased in the late 1970s as a result of the passage of the SMCRA.
Soil samples were collected from sub-watershed #25 (HR-25) (Figure 1B). It has been estimated that approximately one-third of the surface area of HR-25 has been impacted by surface mining activities (Figure 1C) (from active mining and/or emplacement of mine spoil), and this fraction of impacted land area is similar through the lower half of the watershed where mining activities occurred. The topography of HR-25 is consistent with contour mining that took place prior to the passage of the SMCRA [24], which resulted in major changes to mining and reclamation methods used in Appalachian coal surface mining. Pre-SMCRA mining, sometimes referred to as the “shoot and shove”, resulted in an exposed high wall directly above a level to gently rolling bench covered with varying depths of blasted/bulldozed rocky spoils, and a steep outslope composed of spoils that had been bulldozed over the edge of the bench over the pre-existing slope [24,25]. In general, no effort was made to control spoil composition, and the final surface on these areas consisted of a roughly graded, heterogeneous, mixture of all overburden strata [26].
The high wall is located at 40°36′20″ N, 81°20′40″ W, at an elevation of 326 m (Figure S1A–C). The mine spoil pile is located at 40°36′17″ N, 81°20′40″ W, at an elevation of 305 m (Figure S1C,D). Soil cores were taken at the peak of each hill to eliminate the mixing of soil from more than one location on the hill. Mine spoil soil samples were collected from the first “shoot and shovel” bench beneath the high wall. The mine spoil location had characteristic coal spoil properties: thin topsoil, presence of large (up to 100 cm in diameter) shale fragments, steeper slopes compared to non-impacted land area within the watershed; and contained heterogeneous, complex soil aggregates that often contained a mixture of clastic sediments and coal-rich material (Figure S1B). Soil cores were collected from both locations in 2015. An estimate for a minimum time since spoil emplacement of the mine spoil site was determined by counting rings in tree cores collected from the largest trees on top of the mine spoil pile [8], which yielded ages of approximately 40 years. This age is consistent with the cessation of surface mining and the end of mine spoil emplacement in the late 1970s, although it is possible that the spoil pile in the current study was emplaced at an earlier time.

2.2. Soil Sampling and Suction Lysimeter Installation

Suction lysimeters (1900 Soil Water samplers, Soil Moisture Corp.) were installed 13 May 2015, following soil extraction (Figure S1). The outer diameter of the lysimeters (4.8 cm) was slightly smaller than the soil auger (5.5 cm). The lysimeters consisted of PVC tubes with a 200 kPa porous ceramic cup (~2 µm pore size), Santoprene stopper, and Neoprene access tube used for evacuation. Sampling depths were chosen based on color changes through the mine spoil pile: 10 cm (organic-rich A horizon), 40 cm (a transition from orange-colored soil to more clay-rich), 80 cm (dark, clay-rich soil with dark-brown to black soil aggregates), and 120 cm (maximum depth of penetration of the auger). Equivalent color changes were not observed with depth in the high wall soil cores, which had a 5–10 cm organic-rich A horizon above a more uniform sandy, orange-brown soil to 120 cm depth. Lysimeters were installed in the high wall soil at the same depths to provide a comparable vertical profile.
Soil samples were collected in 10 cm increments from the soil core into which the longest (120 cm) lysimeter was installed at each site. Following coring, each augured hole was filled with approximately 10 cm of silica slurry to act as a clean contact between the lysimeter and the adjacent soil. The lysimeters were then placed into the silica slurry, with more silica flower added to exceed the height of the ceramic cup, followed by bentonite clay pellets to seal the silica from vertical flow paths and water infiltration from overlying soil. The remaining vertical space between the lysimeter and soil core was then backfilled with sieved soil (ASTM E-11 standard 0.5 inch) to remove pebbles and rocks. The soil was packed firmly around the lysimeters using a meter stick, and another bentonite seal was poured around the lysimeters near the surface to avoid rainwater contamination. Excess soil was used to cover the bentonite, and slightly mounded and tampered down along the top of the lysimeter. Suction was applied on the lysimeter using a 2005G2 vacuum hand pump at a pressure of 60 kPa to create a negative pressure inside the soil water sampler. Samples intended for microbial community analysis were collected from the mine spoil and high wall soils at depths of approximately 0–5, 35–40, 75–80, and 115–120 cm using a flame-sterilized hand auger. These samples were transported to The University of Akron on ice and then stored in a −80 °C before further processing (described in 2.7). A summary of the total number of solid and aqueous samples analyzed is shown in Table S1.

2.3. Solid-Phase Characterization

Soil samples were dried for 24 h at 70 °C, and then sieved using a 2 mm sieve. The particle size distribution of sieved samples was determined using a Malvern Mastersizer 2000 Laser Particle Size Analyzer, using approximately 100 mg of soil suspended in distilled water. The particle size ranges for sand, silt, and clay were defined as 63 μm to 1 mm, 2 μm to 63 μm, and less than 2 μm, respectively. Sieved soil samples were pulverized to silt-sized particles (10–75 μm) with a SPEX-8000M ball mill using tungsten carbide ball bearings. The bulk mineralogy of the powdered samples was determined using a Rigaku DMaxB with a scan range of 3° to 70°, 0.02° per step, 2 s per point. Glass slides were washed with acetone between samples. Background subtraction and peak identification were performed using JADE v 6.5 (Materials Data Inc., Livermore, CA, USA) to determine the dominant mineral phases present in the samples. Using the initial peak identification, a quantitative phase analysis was performed using the Rietveld module included in the X’Pert HighScore Plus software. Phase mixtures were then extracted from the literature as well as the AMCSD and COD databases [28,29,30] and modeled for scale factor, preferred orientation, and peak shape (including March-Dollase factor). This approach has been shown to be accurate for phases approximately > 0.5% by mass [31].
Scanning electron microscopy (SEM) with energy dispersive spectroscopy (EDS) analyses were conducted on soil samples from the depths where the lysimeters were installed. A subset of these soils was air-dried and passed through a 1 mm sieve, then embedded in epoxy (EPO-TEK 301-2FL) and polished using kerosene instead of water in order to prevent redox changes from occurring during thin section preparation. The samples were cut to ~30 µm thick and mounted onto high-purity quartz-glass slides (Spectrum Petrographics, Inc., Vancouver, WA, USA). Grain size, texture, morphology, and composition of soil minerals was determined using a Hitachi Benchtop TM3030 SEM equipped with Quantax70 EDS, operated at 15 keV voltage, spot size of 10 nm and a detector-to-sample working distance typically of 10 mm.
Loss on ignition (LOI), as a proxy for organic matter content, was performed with 1 g of milled sample added to a ceramic cup and heated to 550 °C for four hours in a muffle furnace and then re-weighed. Given the soil pore water pH and XRD results (discussed below), it is unlikely that significant amounts of carbonate were present, and only 2–4% of additional mass loss at 950 °C in similar soils has been reported [9], therefore loss on ignition at higher temperatures was not performed.

2.4. Pore Water Analyses

Soil pore water was sampled weekly between 20 May 2015 and 27 August 2015. A 60 mL syringe connected with a three-way valve to long plastic tubing was inserted into the lysimeter to extract water out from the ceramic cup at the bottom of the lysimeter. Prior to sampling, 5 mL of water was pulled into the syringe and used as a rinse, which was discarded before sampling each lysimeter. The total volume removed varied between lysimeters and sampling dates, with the shallow lysimeter typically collecting less soil pore water over the course of the field season. During field sampling, pH, dissolved oxygen (DO), electrical conductivity (EC), and temperature were measured using a HACH Waterproof Handheld H160, Pro1020 YSI, and HM Digital aquapro water tester, respectfully. Water samples were then filtered using a Target 2 nylon 0.45 µm filter into three separate vials for a given sampling depth for: (A) metals for analysis by inductively coupled plasma optical emission spectroscopy (ICP-OES) using acid-washed HDPE plastic vials and acidified with 1–2 drops of ultrapure concentrated nitric acid (~70%); (B) anions for analysis by ion chromatography (IC) using plastic vials and not acidified; and (C) dissolved organic carbon (DOC) using combusted glass vials (caps were rinsed with Milli-Q, Q-POD Millipore 0.22 µm water) and 1–2 drops of concentrated hydrochloric acid (~35%). Residual water remaining in the lysimeter was removed after sampling prior to putting the lysimeter under negative pressure.
A Perkin-Elmer 8000 ICP-OES was used to analyze pore water samples for the following elements, with their detection limits noted in parentheses, using SPEX CertiPrep trace metal standards: Al (5 µg/L), Fe (0.3 µg/L), Mn (0.7 µg/L), Cu (0.4 µg/L), Ni (0.3 µg/L), and Zn (0.3 µg/L). Anions (chloride and sulfate) were analyzed using a Thermo Scientific Ion Chromatographer (IC), using a 1:20 dilution. Dissolved organic carbon (DOC) was analyzed using a Shimadzu Scientific Total Organic Carbon analyzer. All samples were analyzed undiluted, with the exception of the 0–10 cm high wall samples, which were diluted with 2% nitric acid at a factor of 1:10. For all analytes, the error is reported as the analytical error for individual values and standard deviation for averaged values.

2.5. Sequential Extraction

A sequential extraction procedure was used to determine the distribution of elements in four operationally defined fractions: (1) exchangeable (metals bound to the surfaces of minerals and organic matter); (2) carbonates (metals co-precipitated with carbonate minerals); (3) reducible (metals bound within Fe- and Mn-(oxy)hydroxides); and (4) oxidizable (metals bound within complex organic matter and sulfide minerals). The sequential extraction protocol was used previously by our group [21], and modified after [32,33]. The inclusion of a step targeting carbonates was performed prior to determining that solid-phase carbonates are not present at detectable levels within the soils; in the absence of a significant carbonate fraction, metals removed during this steps could also potentially be bound with occluded pore spaces and represent a slightly more recalcitrant portion of the extractable fraction. For this procedure, one gram of soil was sequentially exposed to the following conditions: (1) 1 M sodium chloride at pH 7 for 1 h with continuous agitation; (2) 1 M sodium acetate buffered to a pH of 5 using acetic acid with continuous agitation for five hours; (3) 0.04 M hydroxylamine hydrochloride and 25% acetic acid at a temperature of 95° (±5 °C) for six hours; (4) 0.02 M nitric acid with 20% hydrogen peroxide, buffered to a pH of 2 and heated to 85 °C (±2 °C) for two hours with occasional agitation, followed by a second allotment of 30% hydrogen peroxide buffered to pH 2 and heated to 85 °C (±2 °C) for three hours with occasional agitation, and a final addition of 3.2 M ammonium acetate in 20% (v/v) nitric acid diluted to 20 mL and agitated for 30 min. After each extraction step, the samples were centrifuged for 20 min at 10,000 rpm and the decanted solution was passed through a 0.45µm filter. All reagents used were of analytical grade and solutions were prepared with distilled-deionized water (DDI-H2O) (18.2 MΩ; Milli-Q Direct-Q 3UV-R). The remaining sediments were then washed using 8 mL of DDI-H2O and centrifuged again before the next extraction was performed. The residual fraction, consisting of metals tightly bound within aluminosilicate minerals, was not analyzed as it is unlikely that this pool of metals interacts with materials derived from AMD inputs. Extraction solutions were analyzed for Al, Fe, and Mn by ICP-OES.

2.6. Microbial Community Analysis

DNA was extracted from approximately 0.5 g soil samples using MoBio (Carlsbad, CA, USA) Power Biofilm DNA isolation kit, and quantified using a Nano-drop ND-1000 spectrophotometer (Thermo Scientific). Illumina MiSeq sequencing was performed at Molecular Research LP (Shallowater, TX, USA) to obtain partial 16S rRNA gene sequences. The 515F and 806R primers were used to amplify DNA through a 28 cycle PCR with HotStarTaq Plus Master Mix Kit (Qiagen USA, Valencia, CA, USA) with melting at 94° (3 min), 28 cycles of 94° (30 s), 53° (40 s), and 72° (1 min), followed by an elongation step at 72° (5 min). The resulting samples were pooled and an Illumina DNA library was prepared from calibrated Ampure XP bead-purified samples. DNA was sequenced by Illumina MiSeq (San Diego, CA, USA) following the manufacturer’s instructions. Sequences were joined and barcodes were depleted. Short (<150 bp) sequences and sequences with unreliable base calls were removed from the library, and these sequences were then denoised and chimeras were removed. QIIME scripts [34] were then used in the MacQIIME environment (http://www.wernerlab.org/software/macqiime) to further process the sequence libraries. De novo operational taxonomic unit (OTUs) picking was performed based on 97% sequence similarity, and OTUs were assigned to taxonomic groups using the RDP classifier 2.2 with the SILVA database [35,36,37,38]. OTUs were aligned to the SILVA database using the PyNAST algorithm [39], and a phylogenetic tree was constructed. Selected OTUs were further compared to sequences in the National Center for Biotechnology Information (NCBI) database, using the Basic Local Alignment Search Tool (BLASTn) [40].

3. Results

3.1. Bulk Composition and Analysis of Particle Size, Textures, and Morphology

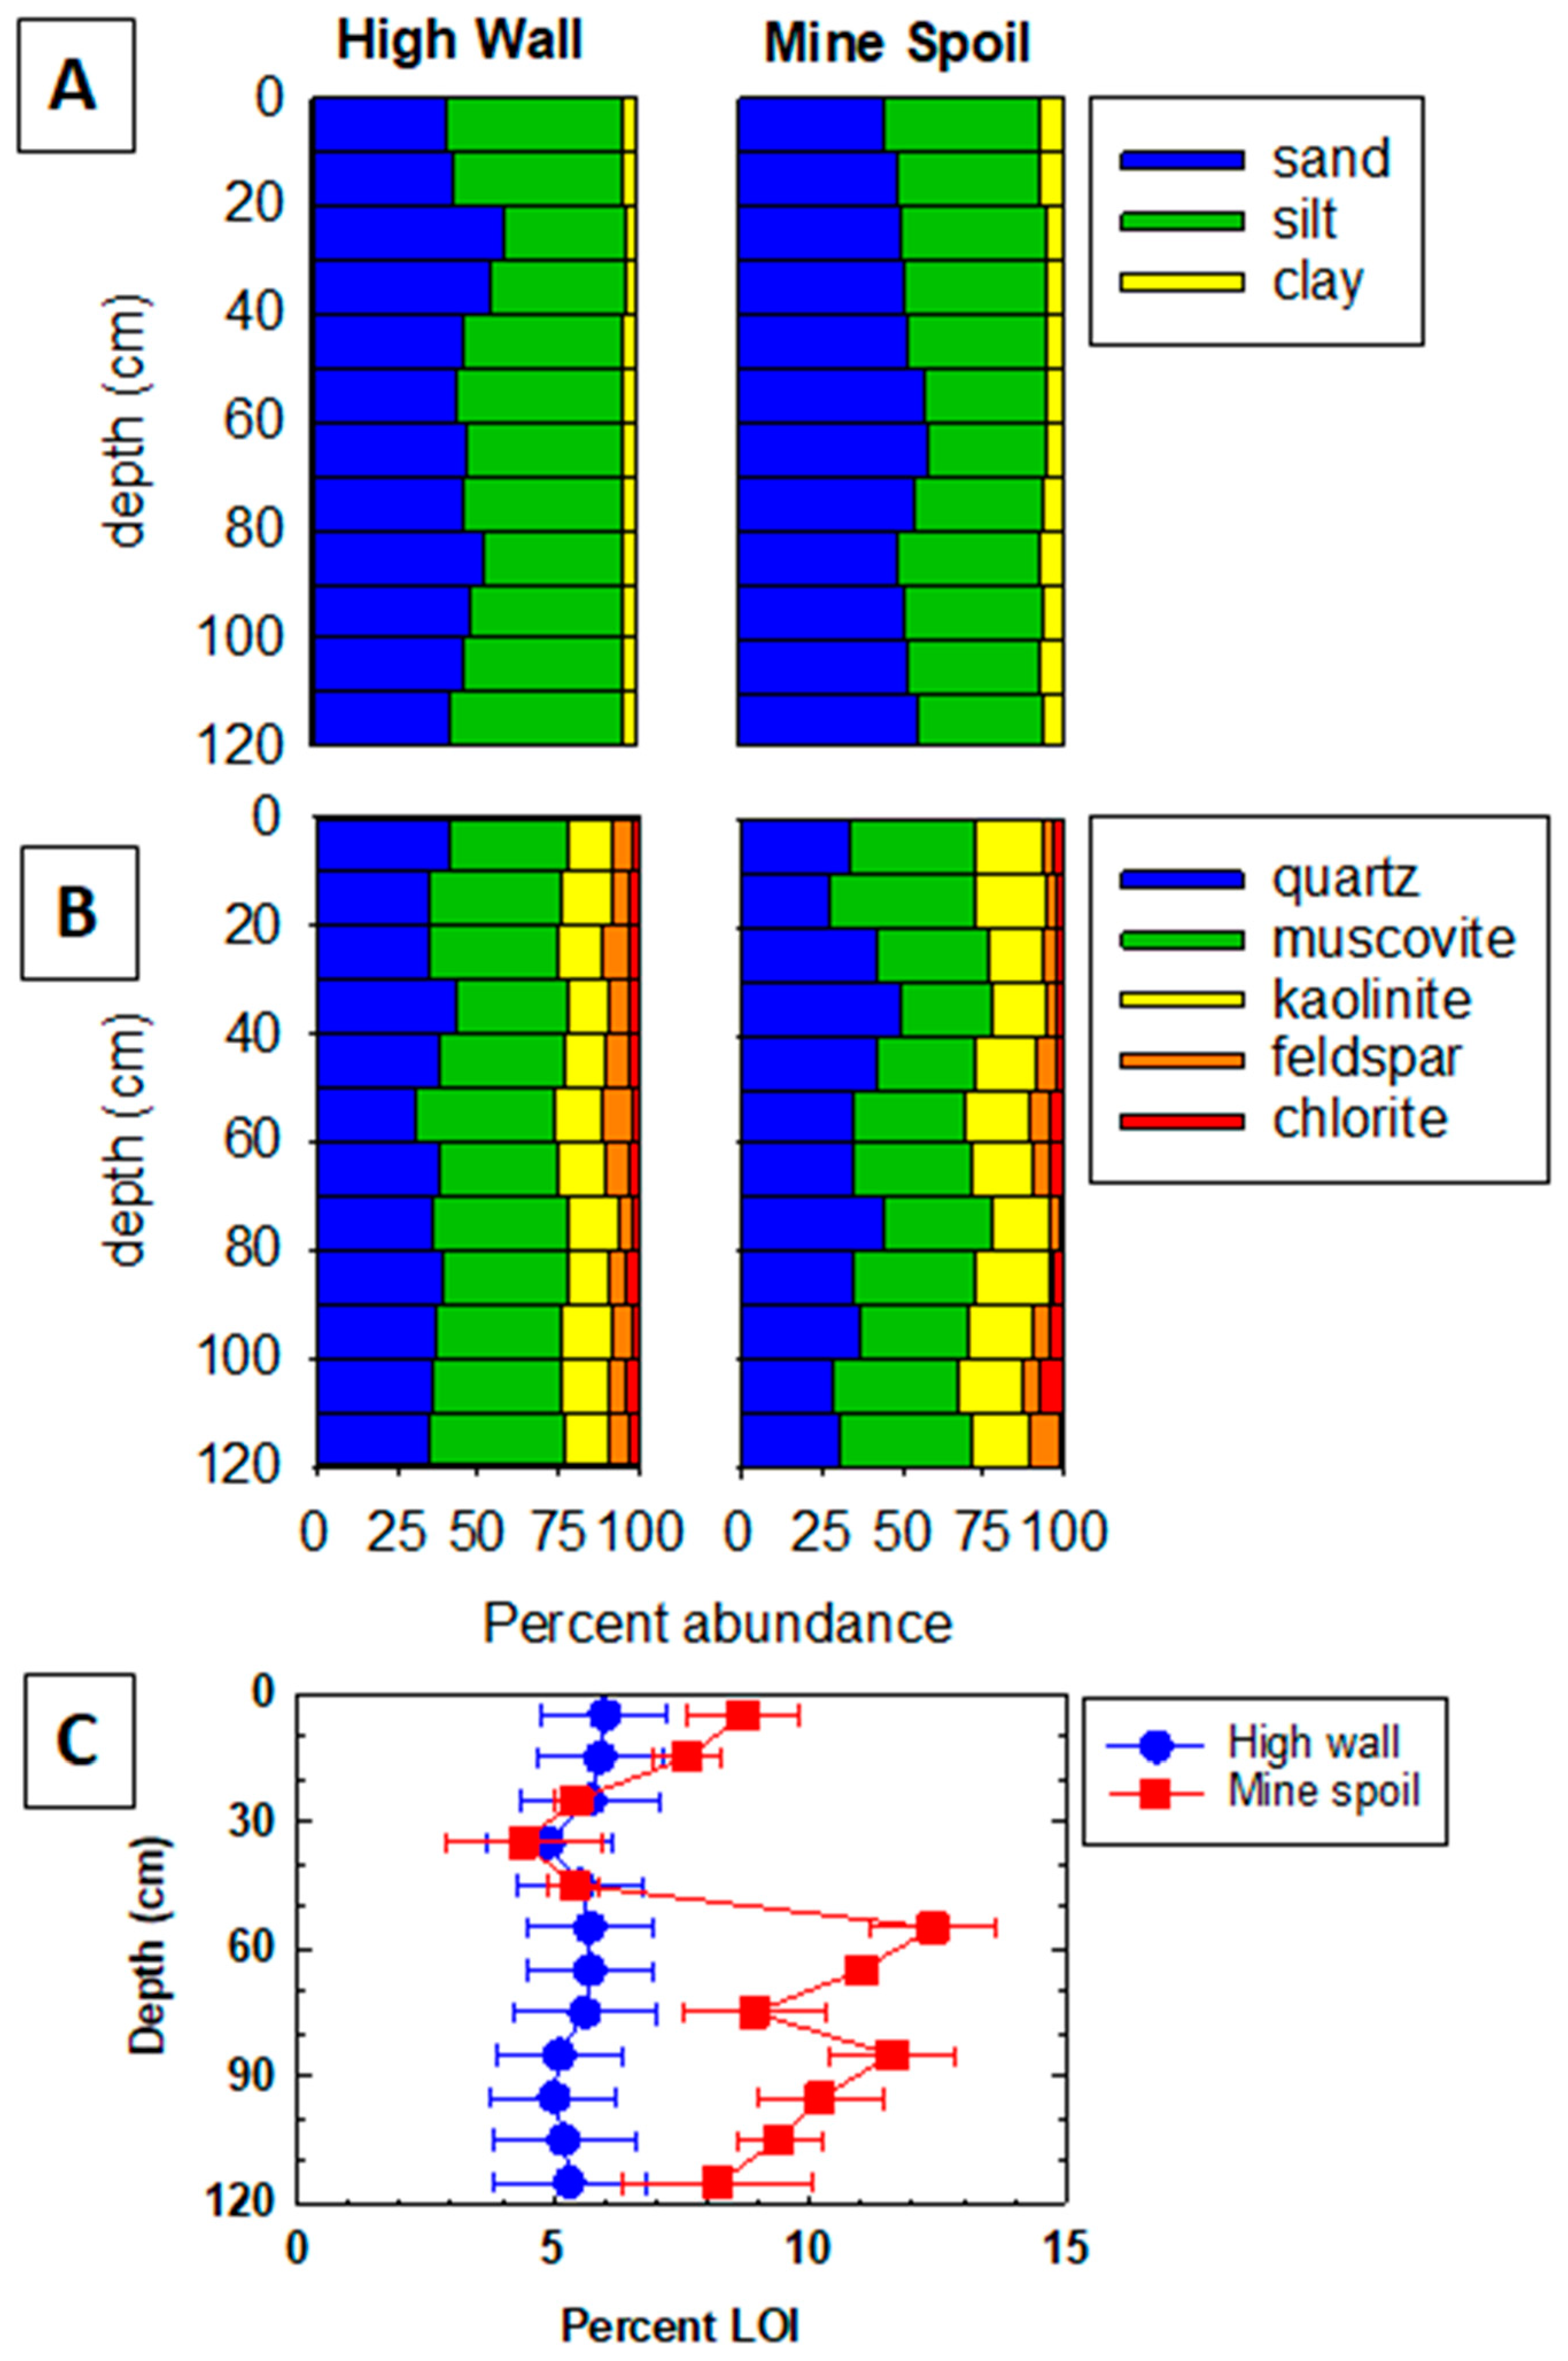
The high wall spoil soil core did not exhibit an observable change in particle size distribution with depth (Figure 2). The average percent abundance and standard deviation values of clay, silt, and sand were 4.4 ± 0.5%, 47.7 ± 4.9%, and 47.9 ± 5.3%, respectively (i.e., consistent with a sandy loam). The mine spoil soil core showed a slight increase in the contribution of sand-sized particles with depth and a slightly higher clay content, although the overall particle size distribution was similar to the high wall. Within the mine spoil, the average amounts of clay, silt, and sand were 6.3 ± 0.9%, 41.8 ± 3.5%, and 51.9 ± 3.9%, respectively (i.e., a sandy loam).
The bulk mineralogical composition of the high wall soil core was nearly constant with depth (Figure 2, Table S2, and Figure S2). The average composition and standard deviation values of the high wall soils were 37.0 ± 3.3% quartz, 6.4 ± 1.3% felspars (the sum of anorthite, albite, and orthoclase), 14.3 ± 1.0% kaolinite, 39.2 ± 2.4% muscovite, and 3.2 ± 0.6% chlorite. The mineralogical composition of the mine spoil soil core did not exhibit any substantial changes with depth but had a more variable composition compared to the high wall soil core. The average composition of the mine spoil soils was 36.6 ± 6.5% quartz, 4.8 ± 2.0% felspars, 19.3 ± 1.9% kaolinite, 36.1 ± 4.3% muscovite, and 3.3 ± 1.9% chlorite. The overall mineralogical composition was also consistent with the particle size analysis based on the sum of minerals that are typically present as clay-sized particles (kaolinite, muscovite, and kaolinite). The sum of these minerals in the high wall and mine spoil was 56.7% and 58.7%, respectively.
The percent LOI of the high wall soil core exhibited little change with depth (5.5 ± 0.7%) (Figure 2). In contrast, the LOI for the mine spoil soils exhibited an increase below 50 cm depth from approximately 6% LOI above and 10% LOI below. This was consistent with the presence of dark black to brown soil aggregates observed in the soil cores (Figure S1) and is likely residual coal material left over from surface mining.
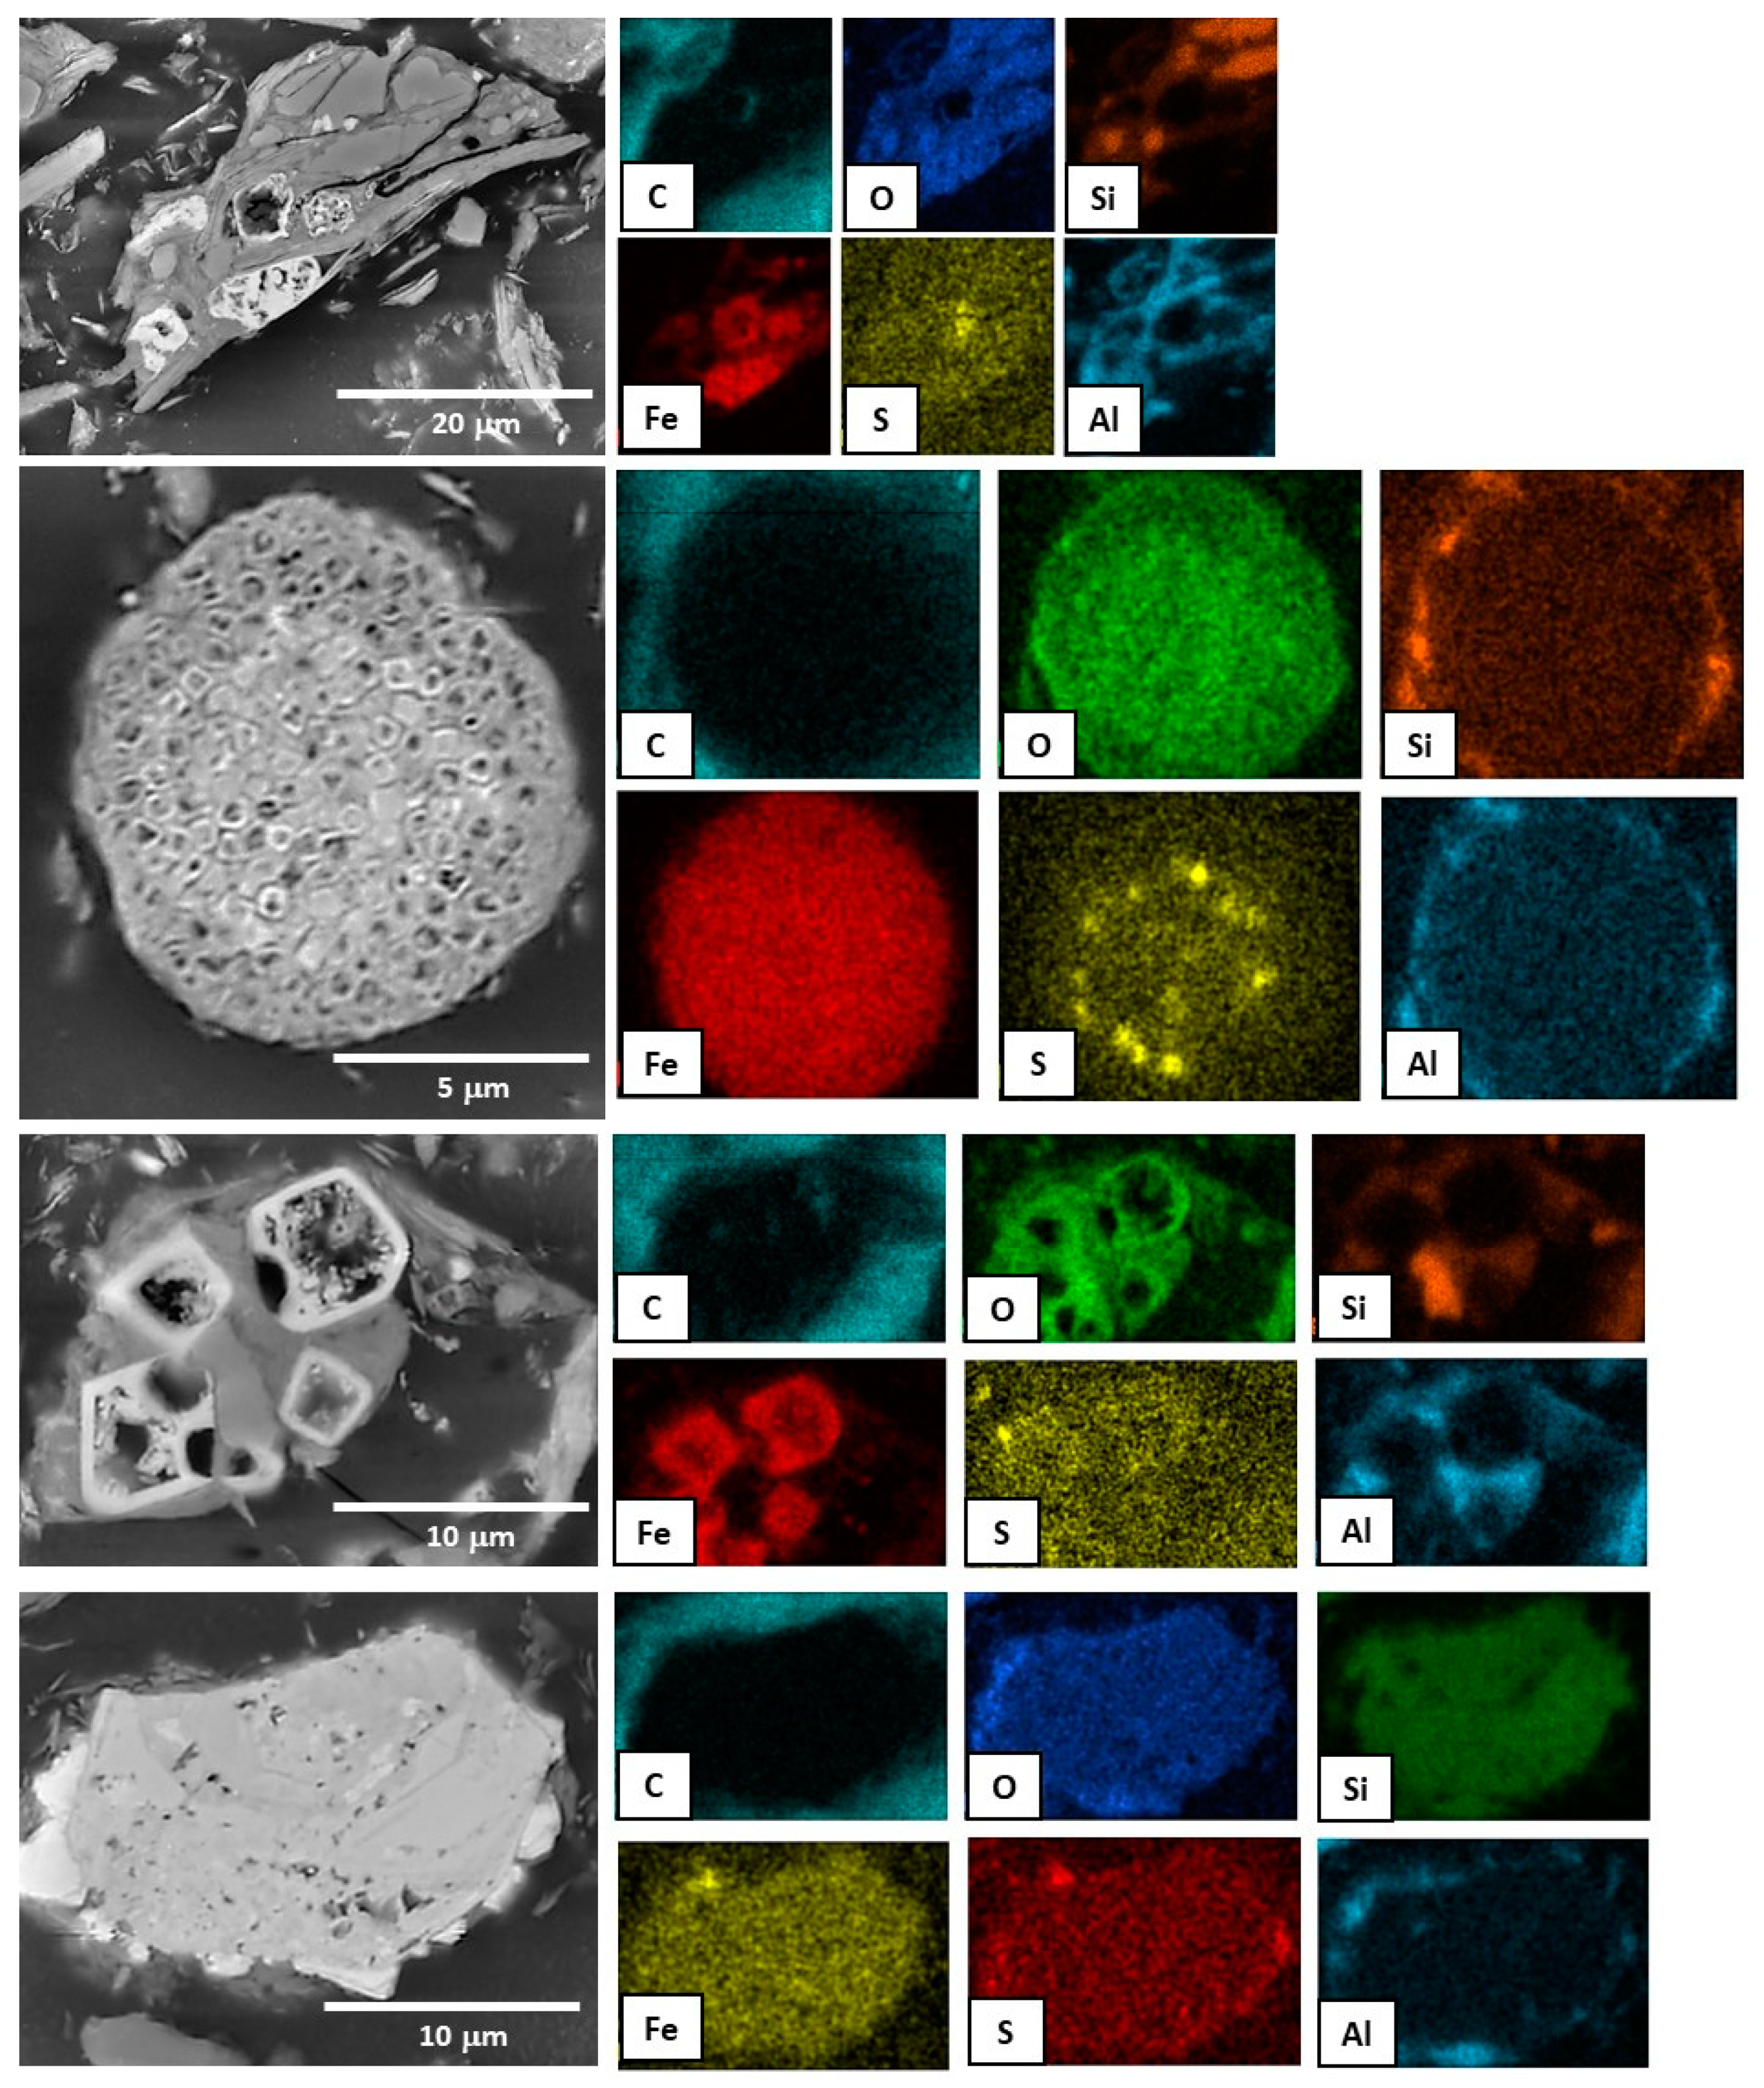
Particle size, composition, texture, and morphology were also determined using SEM-EDS (Figure 3 and Figure 4, and Figure S3). A slight increase in the abundance of clay-size particles was observed by low magnification SEM imaging (Figure S3), consistent with the particle size and bulk XRD analyses. Scanning electron microscopy analyses revealed that soils from all depths within both the high wall and mine spoil soils contained grains with composition and morphology consistent with pyrite (Figure 3 and Figure 4). These Fe-S-rich grains were observed as framboid-like aggregates or particle morphologies similar to what has been observed in the primary coal shale from this locality [22]. Lower-magnification SEM images (Figure S3) suggest that pyrite particles (i.e., the brighter grains in the BSE image) are more abundant in the mine spoil soils, although particles with broadly similar morphologies and textures could be found in both the mine spoil and high wall soils. Further, in both the high wall and mine spoil soils, the pyrite grains were typically observed to be surrounded by secondary mineral coatings that were dominated either by Fe-O-bearing and/or Si-Al-O-bearing phases (Figure 3 and Figure 4). The composition and texture of these phases are consistent with secondary Fe(III)-(oxy)hydroxides and clay minerals, and similar observations from this field site have been previously reported [8].

3.2. Lysimeter Pore Water Composition

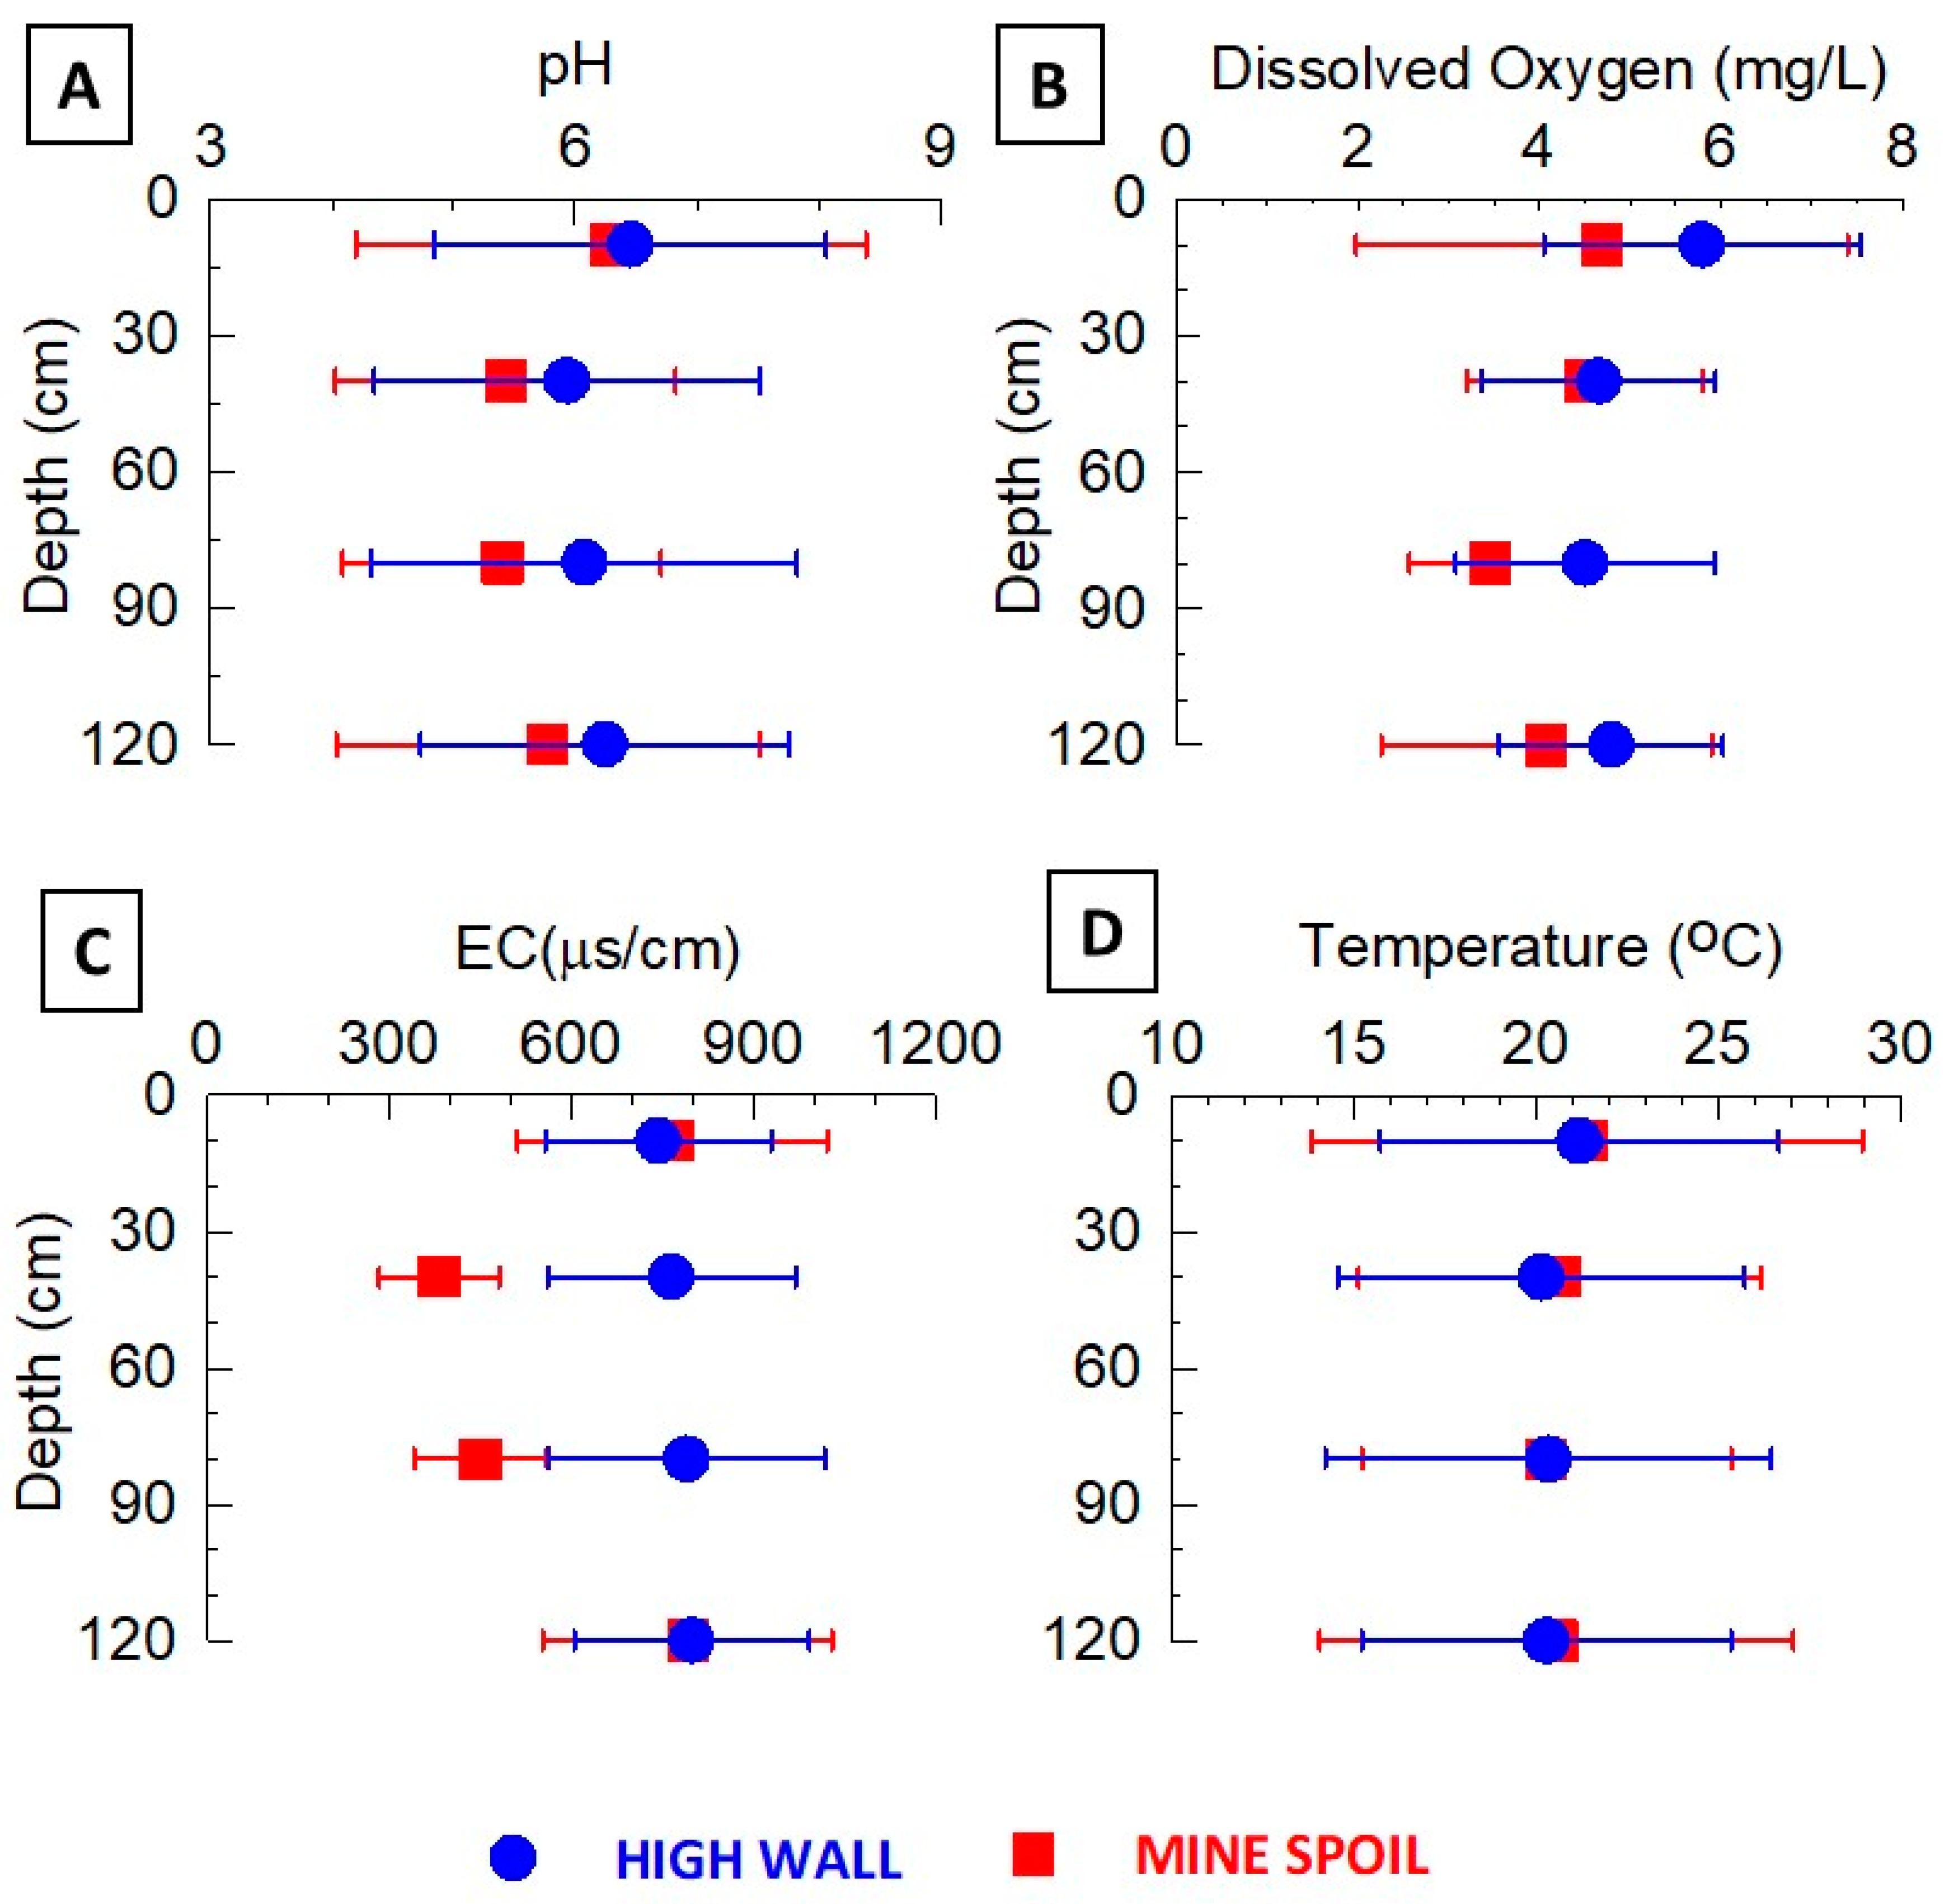
Soil pore water pH, DO, EC, and temperature did not show any significant trends with depth in either the high wall or mine spoil soil cores (Figure 5). The average pH values over the field season were slightly higher in the high wall soils (ranging from 5.93 to 6.45) compared to the mine spoil soils (pH ranging from 5.39 to 6.29) (Figure 5A). There was no significant change in soil pore water pH over time in any of the lysimeter depths from either the high wall or mine spoil soils (Figure S4). The amount of DO was also slightly higher in the high wall soils (ranging from 2.94 to 8.79 mg/L) compared to the mine spoil soils (ranging from 2.00 to 6.80 mg/L). The amount of DO in both the high wall and mine spoil soils decreased in all depths over the course of the field season (Figure S4). The decrease in DO is likely related to the increase in pore water temperature during the field season (Figure S4). However, the average temperature of the high wall and mine spoil soils were the same at each depth and over time (Figure 5D and Figure S4). Therefore, the differences in DO between the two sites is likely related to differences in local (bio)geochemical conditions, discussed below. The values for EC were the same for the high wall and mine spoil soils at the shallow and deepest lysimeters. However, the EC values were lower by approximately 300–400 μS/cm in the intermediate depths (Figure 5C). Over the course of the field season, EC in the high wall initially increased rapidly to 2000 μS/cm within a month of sampling, followed by a decrease through the rest of the field season before remaining constant at approximately 500 μS/cm (Figure S4). The EC of the mine spoil pore water also increased initially although not as high was the high wall, with a maximum of approximately 1500 μS/cm, followed by a decrease to 500 μS/cm (Figure S4).
Metal concentrations in both the high wall and mine spoil pore water were slightly higher in the shallow lysimeters and tended to decrease with depth (Figure 6). There were also differences in metal concentrations between the two sites. Within the shallow soil, Al and Fe were >10× higher in the high wall pore water (45 and 5 μM, respectively) than in the mine spoil pore water (1 and 0.5 μM, respectively). Within the intermediate and deepest lysimeters, Al and Fe concentrations were similar (<10 and <1.5 μM, respectively). The Cu concentration profile was similar to Fe and Al; much higher in the shallow high wall soil pore water than in the shallow mine spoil. In contrast, Mn was higher in the mine spoil pore water at all depths compared to the high wall. The profiles for Zn and Ni also indicate slightly higher pore water concentrations in the mine spoil compared to the high wall. Changes in metal pore water concentration over time were metal and site dependent (Figure S5); Al, Fe, and Cu increased over the field season in the shallow high wall lysimeters but remained nearly constant in the other depths, and remained nearly constant in all depths in the mine spoil pore water. In contrast, Ni and Mn pore water concentrations decreased over time in both sites and in all depths. The concentration of Zn did not exhibit any significant trend over time at either site.
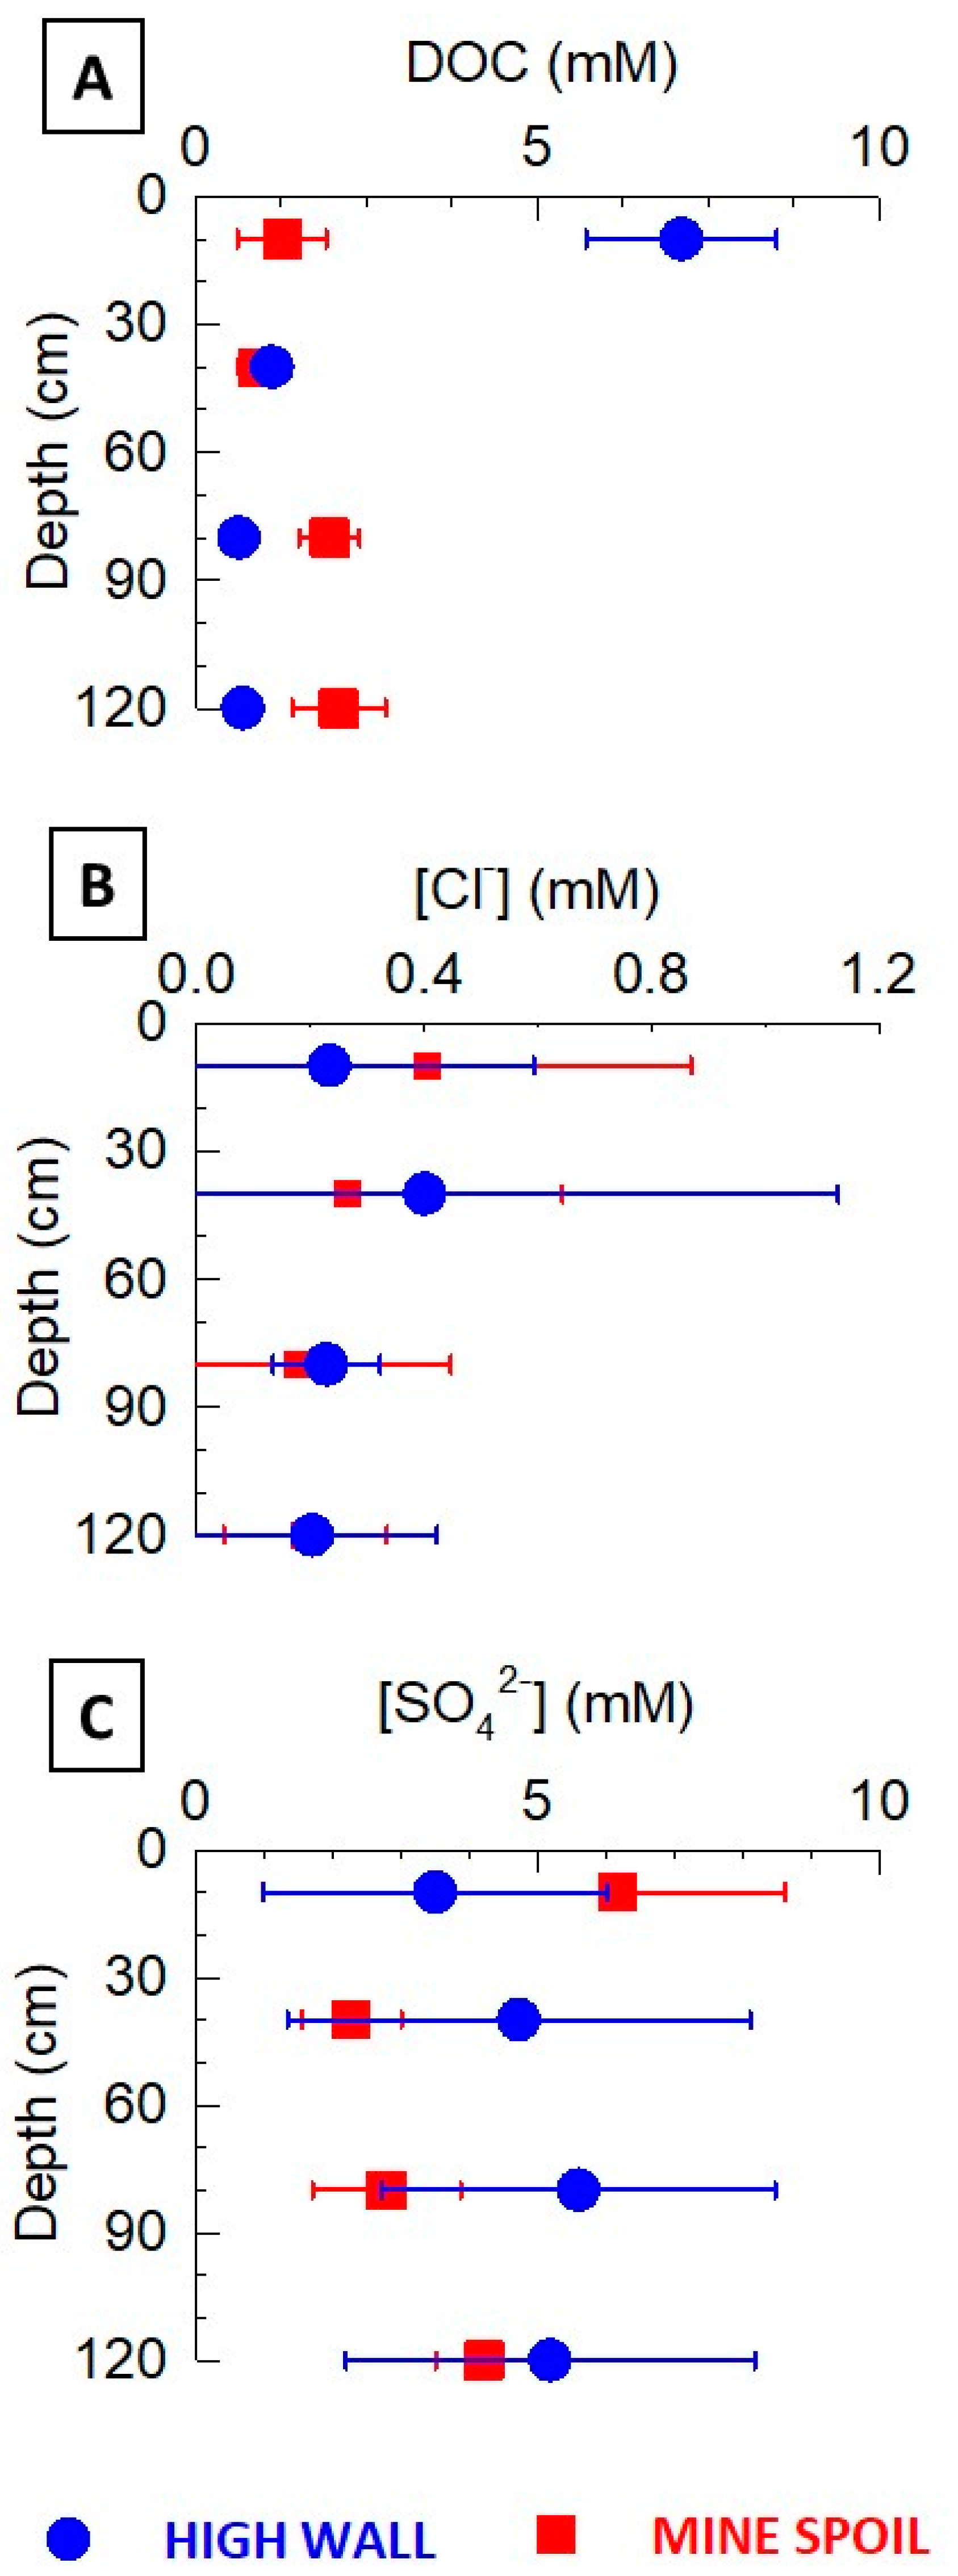
The concentration of DOC was much higher in the shallow high wall lysimeter (7 mM) compared to the shallow mine spoil lysimeter (1 mM) (Figure 7A). However, DOC was higher in the intermediate and deep lysimeters in the mine spoil lysimeters (2 mM) compared to the high wall lysimeters (0.7 mM). DOC increased slightly over the field season in the shallow high wall lysimeter (Figure S6) but remained nearly constant within all other depths at both sites. The concentrations of both chloride and sulfate did not exhibit any notable differences between the two sites or with depth (Figure 5B,C), although both chloride and sulfate decreased at both sites over time (Figure S6).

3.3. Extractable Al, Fe, and Mn

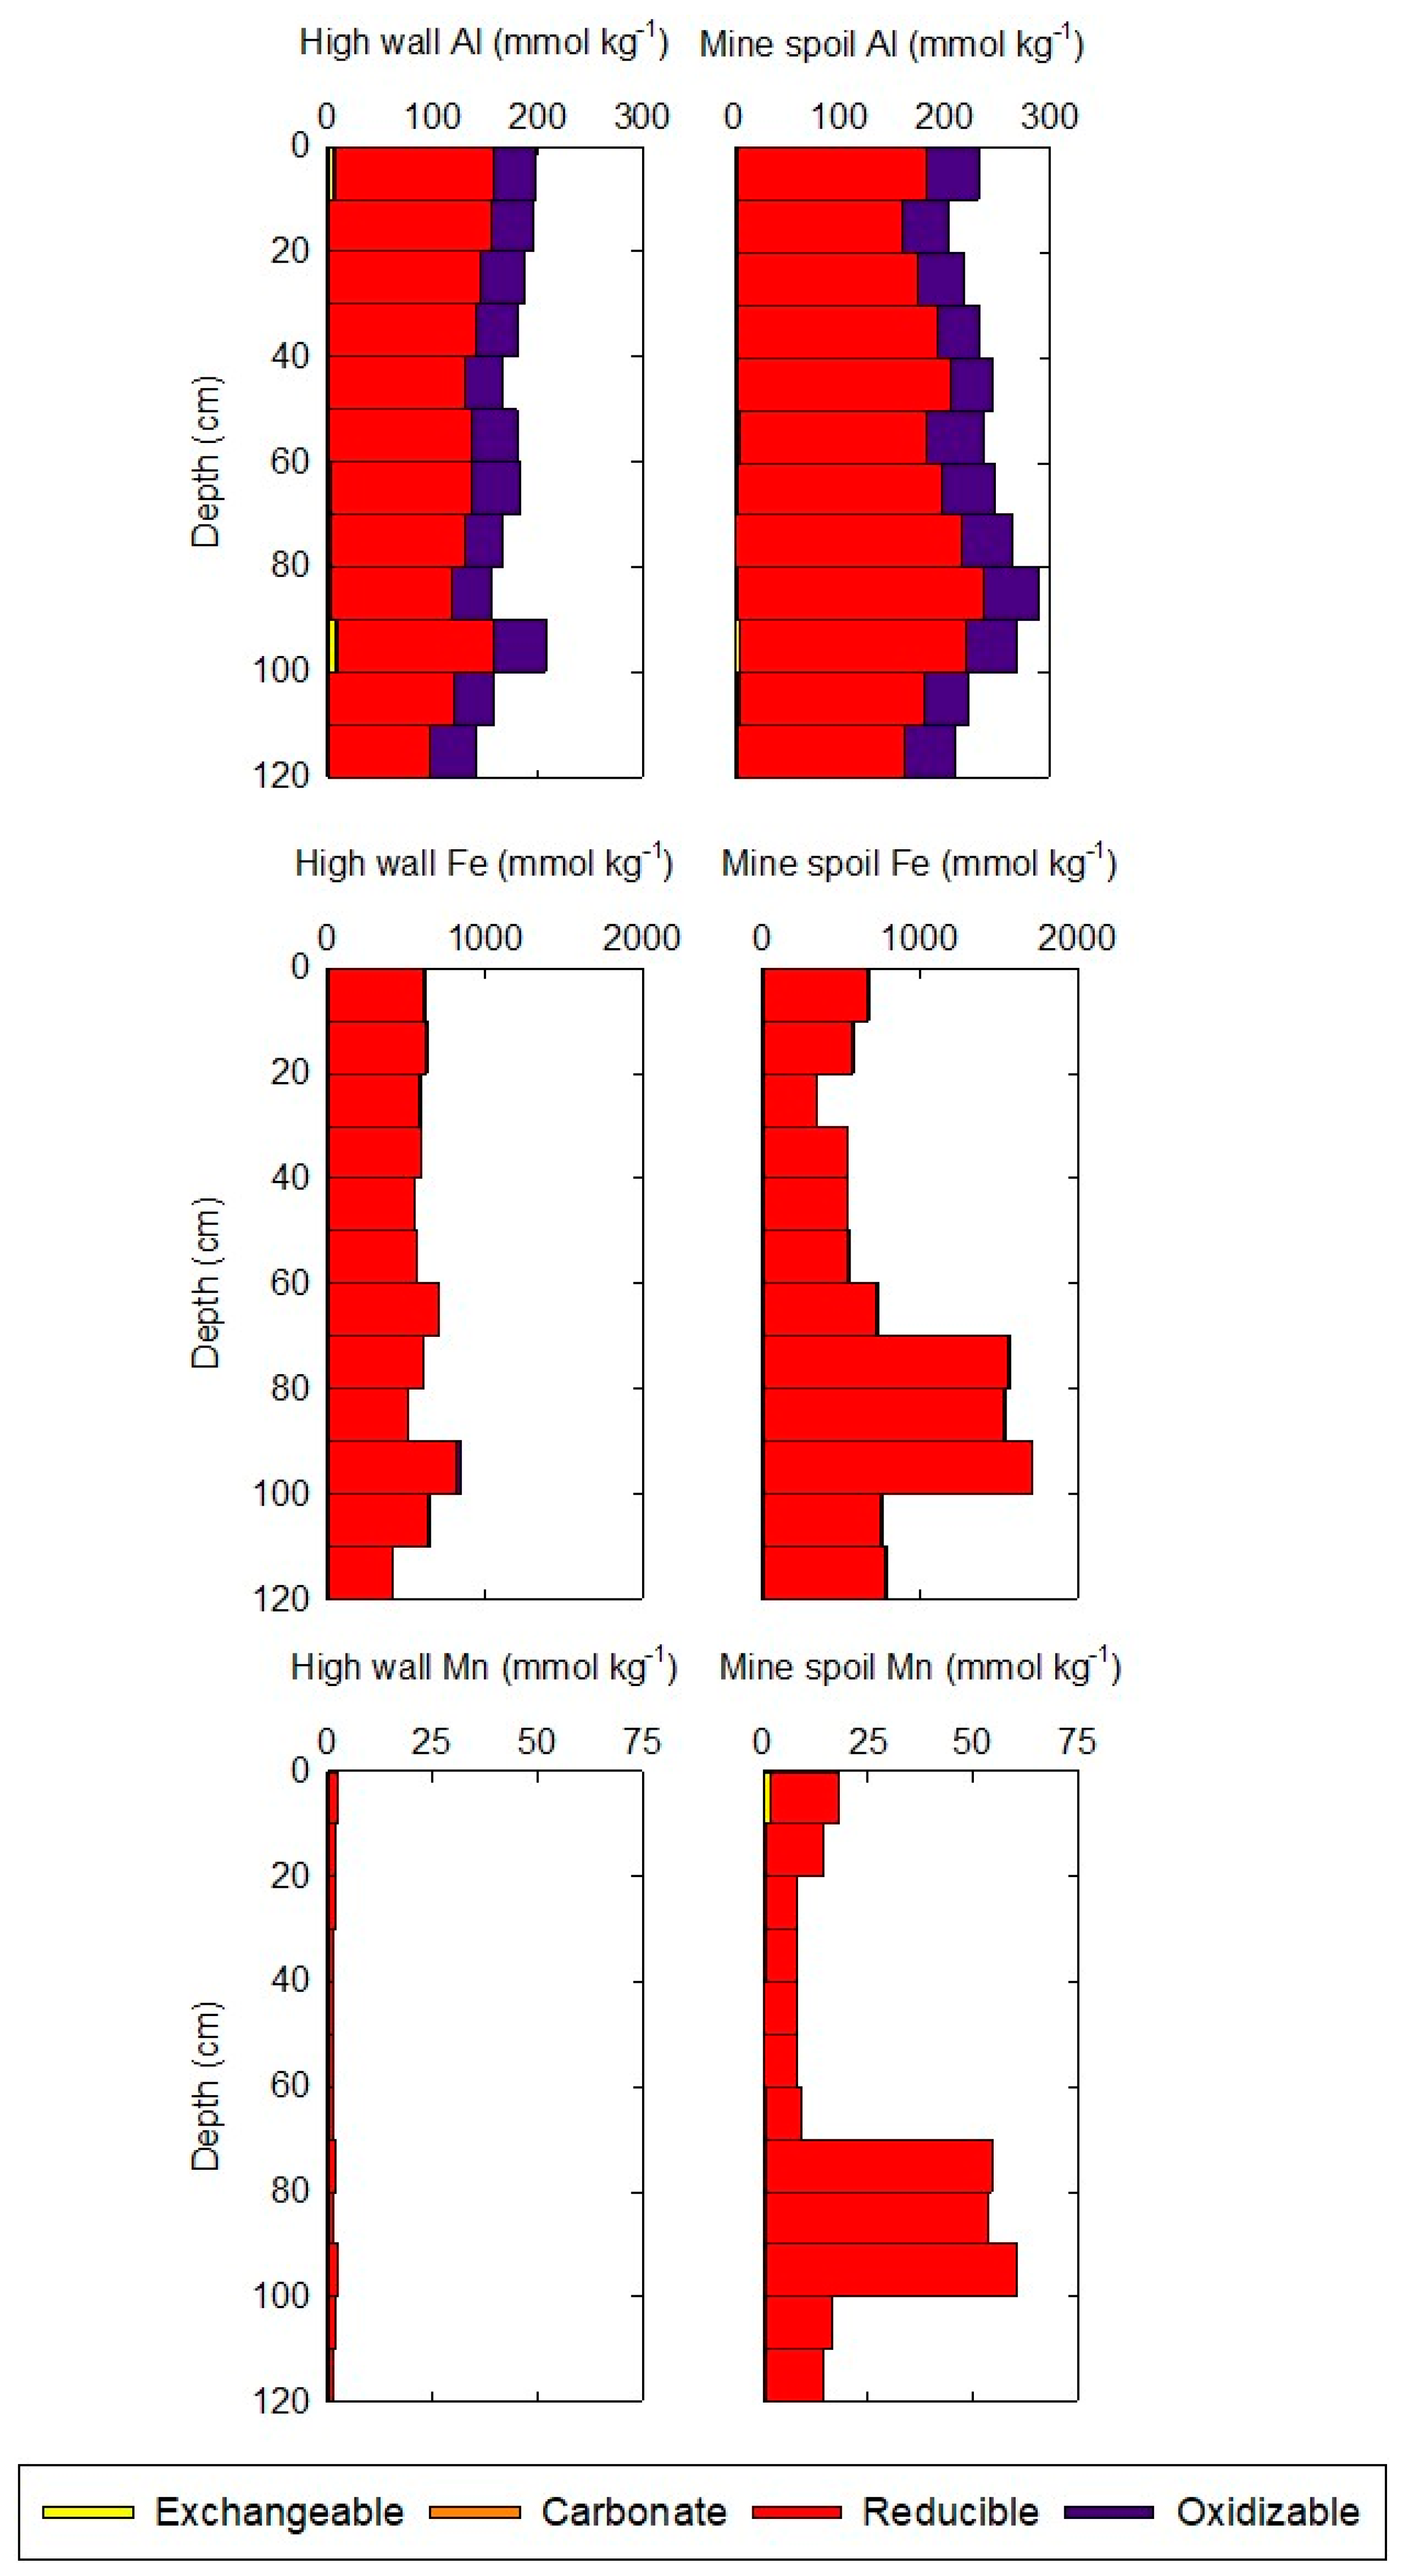
Total extractable Al, Fe, and Mn and contributions from individual fractions are shown in Figure 8; individual extractions are shown in Figure S7. Extractable Mn showed the largest contrast between the high wall and mine spoil soils (Figure 8, bottom). Extractable Mn in the high wall soil was on average 1 mmol kg−1 and did not change with depth. Manganese in the reducible fraction was the dominant fraction, followed by exchangeable and carbonate fractions (Figure S7); Mn in the oxidizable fraction was below detection limit. In contrast, the average amount of total extractable Mn in the mine spoil soil ranged from 10 to 60 mmol kg−1. Similar to Fe, Mn was also enriched in the mine spoil soils between 60 and 100 cm depth. Similar to Mn in the high wall, Mn in the reducible fraction was the dominant fraction, followed by the exchangeable and carbonate fractions (Figure S7); Mn in the oxidizable fraction was below detection limit. The average amount of exchangeable Mn was higher in the mine spoil (0.5 mmol kg−1) compared to the high wall (near or below the detection limit) and showed a slight enrichment near the surface (approximately 1.5 mmol kg−1).
Total extractable Al in the high wall soil core (Figure 8, top left) exhibited an overall decreasing trend with depth, from 200 to 100 mmol kg−1. Extractable Al in the high wall was dominated by Al in the reducible (approximately 75%) and oxidizable (approximately 25%) fractions, with minor amounts of Al in the carbonate fraction (<1%) and exchangeable Al (<1%) (Figure S7). The amount of Al in the carbonate extractable fraction remained nearly constant with depth. Exchangeable Al in the mine spoil was 2 mmol kg−1 on average, with a spike to 9 mmol kg−1 at 90 cm depth. Total extractable Al was higher in the mine spoil soil core compared to the high wall (Figure 8, top right), and ranged from 200 to 300 mmol kg−1, with a maximum at 80 cm depth. Extractable Al in the mine spoil was also dominated by reducible Al (approximately 80%) and oxidizable Al (approximately 20%), with minor amounts of carbonate Al (<1%) and exchangeable Al (<1%) (Figure S7). In the mine spoil soil core, the amount of carbonate and exchangeable Al remained relatively constant with depth.
Total extractable Fe in the high wall soil core decreased slightly with depth (Figure 8, middle left), from 800 to 500 mmol kg−1 and was dominated by the reducible fraction (approximately 99%). Extractable Fe from the oxidizable and carbonate fractions averaged approximately 1% and 0.1%, respectively (Figure S7), and did not change with depth. Exchangeable Fe was below detection limits. Extractable Fe from the mine spoil core ranged from 800 to 1900 mmol kg−1, with a significant enrichment between 60 and 100 cm depth (Figure 8, middle right). Similar to the high wall soils, extractable Fe in the mine spoil soil was dominated by reducible Fe (approximately 99%). Extractable Fe in the mine spoil from the oxidizable and carbonate fractions was also on average approximately 1% and 0.1%, respectively (Figure S7), and did not change significantly with depth, and no exchangeable Fe was detected.

3.4. Microbial Community Analysis

Microbial communities in mining-disturbed soils develop similarities with adjacent undisturbed soil post-mining [41,42,43], so we compared microbial communities at discrete depths in both the high wall and mine spoil. The most abundant phyla (Acidobacteria, Alphaproteobacteria, and Actinobacteria) varied little with depth and location (Figure S8). Similarly, the most abundant taxa within these phyla varied little with depth and location (Figure S8), and these phylotypes were attributable to lineages that are frequently encountered in soils (e.g., [44,45,46,47]). These observations indicate that the microbial communities of mine spoil have developed some characteristics of those in the undisturbed high wall soil since the time that reclamation began. The most pronounced differences in microbial community composition between the high wall and mine spoil were observed in the Deltaproteobacteria and Chlroflexi (Figure 9). In the high wall, Deltaproteobacteria comprised approximately 4% of the microbial community, regardless of depth, and were mostly attributable to the families Syntrophobacteraceae and order Myxococcales (Figure 9). In contrast, Deltaproteobacteria-attributable phylotypes increased in relative abundance with depth (Figure 9) Phylotypes attributable to Myxococcales and Geobacter were abundant in libraries from shallow parts of the mine spoil and decreased with depth, while phylotypes attributable to Snytrophobacteriaceae increased in relatively abundance in the deeper portions of the mine spoil (Figure 9). The Syntrophobacteriaceae includes syntrophic and sulfate-reducing genera [48]. Myxococcales are aerobic and frequently encountered in soil [49]. The Geobacter are a group of strictly anaerobic or oxygen sensitive Fe(III) and Mn(III/IV) reducing bacteria [50]. In this case, it is likely that O2 limited activities of Myxococcales, while inducing Fe(II) oxidation and Fe(III) (hydr)oxide availability [i.e., rinds that developed on pyrite grains (Figure 3 and Figure 4)] that could be reduced by Geobacter in anoxic microzones (e.g., [51,52]). Isolation from O2 in deeper soils likely enhanced the activities of anaerobic, and potentially sulfate reducing Syntrophobacteriaceae.
Similar to the Deltaproteobacteria, Chloroflexi in the high wall comprised approximately 2.5% of the microbial community (Figure 9), with phylotypes attributable to the Ktedonobacteriaceae, Ellin 6529, and Thermogemmatisporaceae being the most abundant (Figure 9). The Chloroflexi lineages Ellin6259 and TK17 are not well characterized, but are detected in soils and sediments [53,54,55]. Organisms in the Ktedobacteraceae lineage are also aerobic and found in soil [56,57]. Microorganisms in the Thermogemmatisporacea are generally thermophilic organotrophic aerobes [58], but are also relatively closely related to the mesophilic Ktedonobacteriaceae [59], so the relatively high abundances of Thermogemmatisporaceae and Ktedonobacteraceae in shallower tailings could be a reflection of the relatively high availability of O2 in these soils. Indeed, few Ktedonobacteria have been cultured, and related phylotypes have been detected at high relative abundances in Fe(III)-rich AMD soils [60].

4. Discussion

4.1. Indicators of Mineral Weathering Reaction Progress

The overall similarity of the high wall and mine spoil soils with respect to the particle size distribution (Figure 2A), bulk mineral composition (Figure 2B), and microbial community composition (Figure S8) indicates that despite very different soil formation pathways, the soils in the two locations are currently dominated by similar mineral weathering reactions. Although the parent material of the mine spoil was lithologically similar to the high wall, it is possible that additional overburden material was mixed in. Therefore, the mine spoil soil does not necessarily represent a direct pedogenic trajectory from soils on the high wall with respect to soil formation and evolution. However, the overall mineral composition and texture of soil developing on the mine spoil are currently similar to undisturbed soils developing on related material on the high wall. The similarity in clay content is surprising given that coal processing and waste material production typically results in clay production and initial accumulation [61,62]. The primary control on particle size distribution during weathering of coal mine spoil is related to formation and transport of clay-sized particles. Fresh coal shale waste can have a similar particle size distribution compared to overburden of different lithologies, although clay content can increase with depth within the mine spoil pile [63]. Aging of coal mine spoil has been shown to result in a decrease in coarser particles and an increase in sub-0.1 mm particles [64], which has been attributing to a higher susceptibility to slaking in coal shales compared to other lithologies [63]. In contrast, some highly weathered coal mine spoils show little clay content following release and transport [65]. Within the mine spoil soils, there was a slight increase in sand-sized particles at the expense of silt-sized particles, which could represent the transport of smaller particles out of the mine spoil.
The bulk mineralogy of the parent shale, which is the dominant source of the mine spoil waste, was dominated by quartz (45%), kaolinite (16%), muscovite (21%), and pyrite (18%) [22]. The presence of feldspars and chlorite in both the mine spoil (4.8% and 3.3% on average, respectively) and high wall (6.4% and 3.2%, on average, respectively) soils (Figure 2B and Table S1) indicates that some additional lithologies beyond the coal shale are the source of soil minerals at both sites. As noted in Section 2.1, the lithology of the watershed is dominated by the Lower Kittanning coal member of the Pennsylvanian Allegheny group; however, other lithologies including siltstones and sandstones surround the coal and are in close physical proximity [18,19] which are the likely source of the feldspar and chlorite. Further, chlorite has been found to be depleted in soils over time following shale weathering [66], especially in shallow soils [67]. Although feldspars were not present in the parent coal shale, their presence can be a primary driver of soil weathering within both the high wall and mine spoil soils and can influence water infiltration; water infiltration and transformation of feldspars results in clay and secondary metal-(oxy)hydroxides which decrease porosity [68]. This decrease in porosity can be offset by oxidation of organic matter and/or pyrite resulting in increased porosity and water penetration [68].
In contrast to the primary coal shale, pyrite was only detected by SEM-EDS analyses and was below the detection limit of the XRD analyses. Further, the remaining pyrite in both sites was dominated by grains with core-rim textures with secondary mineral coatings (Figure 3 and Figure 4). Surface coatings of just a few micrometers in thickness can effectively prevent further oxidative dissolution of pyrite [69]. This pyrite protection could be further enhanced by Fe(III) reducing bacterial activities, where biogenic Fe(II) serves as a redox buffer [70]. It is therefore likely that the bulk of the pyrite in the soils has been removed via oxidative dissolution, and the remaining pyrite has effectively been passivated. The presence of Fe(III)-(oxy)hydroxide rims present on pyrite in aged dump materials has been shown to prevent further oxidation [71].
The primary difference in the bulk solid composition between the mine spoil and high wall soils was the amount of residual coal in soils developing on the mine spoil as evidenced by the higher LOI values (Figure 2C) and presence of coal in mine spoil aggregates (Figure S1). However, despite the higher organic carbon content in the mine spoil soils, pore water DO and pH values were only slightly lower or within the standard deviation of the high wall soil pore water. This also suggests that despite the presence of a large source of oxidizable material in the mine spoil soils, the oxidative weathering of the material is low relative to oxygen availability, potentially due to passivation. Here, higher organic carbon (OC) may have supported activities of anaerobic Deltaproteobacteria (and perhaps Chloroflexi), which could use Fe(III) or Mn(III/IV) as electron acceptors (whether directly or indirectly) in anoxic microzones [51,52,72], or it could support microbial respiration [73]. Then, biogenic Fe(II) could be oxidized by the available O2, which, at a macro scale was high throughout the soils (Figure 5B). This OC-supported microscale redox cycling of Fe could serve to limit oxidation of pyrite grains [70].
Parallel trends are observed in the distributions of extractable Fe and Mn (Figure 8 and Figure S7); nearly all of the solid-phase Fe and Mn not bound in residual silicates is associated with the reducible fraction dominated by metal (oxy)hydroxides. Further, the highest concentrations of extractable Fe and Mn were present in the organic-rich region of the mine spoil soils. The primary source of Fe and Mn is from pyrite and other sulfide minerals in the coal shale, and (oxy)hydroxides form via oxidative dissolution of those phases [4,74]. Oxidizable Fe accounted for less than three percent of the total extractable Fe and oxidizable Mn was not detected (Figure S7). The primary source of Fe and Mn in coal shales is typically sulfide phases [22,75], and the small amount of Fe in the oxidizable fraction, which tracks with the LOI values in the mine spoil soil, is likely primarily associated with the residual pyrite identified (Figure S5). More recently, deposited spoil pile at the same site had greater proportion of Fe in the oxidizable fraction, consistent with less weathering [9].
These results indicate that the sulfide phases have been nearly completely oxidized, with Fe and Mn accumulating as secondary (oxy)hydroxides. In contrast to Fe and Mn, up to 20% of the extractable Al was associated with the oxidizable fraction and the rest primarily in the reducible fraction. Although a small amount of Al could be sourced from sulfide phases in the coal shale, the majority likely comes from aluminosilicate phases [76]. The release of Al from these phases would result in the formation of secondary Al (oxy)hydroxides and clay minerals. However, Al can be stabilized by soil organic matter [77,78]. Although continued oxidative dissolution of these phases is expected, the formation of complex, heterogenous aggregates may limit the release of Al. Ultimately, the overall similarly in bulk properties and trace solid-phase composition between the mine spoil and high wall soils indicates that the bulk of weathering in the mine spoil dominated by oxidative dissolution (i.e., pyrite and coal) has either occurred and/or been passivated, and that mineral weathering and pore water composition is largely controlled by a similar set of minerals between the two sites.

4.2. Relationship between Soil Pore Water and Solid-Phase Composition

Aqueous Al, Fe, and Cu in the shallow high wall soil were consistently higher than other depths from that location and compared to the mine spoil (Figure 6). The shallow high wall also exhibited consistently high DOC concentrations (Figure 5) despite low LOI values (Figure 5), suggesting that this organic carbon may be more labile because it is plant derived. Within deeper portions of the soil profiles, DOC was higher in the high-LOI mine spoil soils, consistent with organic matter derived from remnant coal material which is more recalcitrant [79]. It is likely that the more carbon-rich topsoil at the high wall location contains more plant-derived organic carbon, which can mobilize Al and Fe from the shallow high wall soils despite the slightly higher pH compared to the mine spoil soil [80]. Although high DOC can result in leaching of Cu and Zn [81], only elevated Cu was detected in the shallow high wall soil pore water. It is possible that lower soil pore water pH values might be required to promote DOC-leaching of Zn [82]. Some metals (Mn and Ni) exhibited a similar gradual decrease over the sampling period before reaching a constant value, and it is unclear if these trends reflect changes in metal flux due to disturbances during lysimeter installation and/or broader (bio)geochemical processes within the soils.
The lower electrical conductivity (EC) values in the organic-rich portions of the mine spoil soil, compared to the high wall soil, could be the result of accelerated weathering within those soil regions. Although weathering of coal mine spoil can result in higher peak EC values during weathering compared to overburden material, long-term leachate has been observed to be lower and can be less than 500 μS/cm, a proposed regulatory limit [83]. In contrast, higher EC values in coal mine spoil compared to pore water in overburden has also been observed after decades since emplacement [63], and the observation of low EC soil pore water in organic-rich soils developing on mine spoil may not be related. It is also possible that variations and short-term trends in EC values could be due soil property changes during lysimeter installation. Using native soils to back-fill the lysimeter is intended to minimize disturbances to the soil profile and soil water and solute flow [84]. However, following lysimeter installation, decreasing pore water EC over time has been observed and has been linked to differences in the source of sampled soil water, from macropores or micropore [85]. Although the initial decrease in soil pore water EC (Figure S4) could be related to this effect, the EC values reached a nearly constant value over time by the end of the field season of approximately 350 μS/cm. Freshly crushed, unweathered soil has been shown to have rapidly decreasing EC in pore water until reaching a near constant value of approximately 500 μS/cm [86]. These changes in pore water EC have been attributed to two stages of mineral weathering, where the first is dominated by oxidative dissolution of sulfide minerals and organic matter following by longer term weathering of aluminosilicates [65], providing further support that the bulk of the pyrite and remnant coal material in the mine spoil soils has either been weathered and/or passivated with respect to additional weathering. This is also supported by the trends in pH and sulfate in the two sites which were nearly the same, despite significant amounts of remnant coal in the mine spoil. Low pH and high concentrations of aqueous sulfate would be characteristic of mineral weathering dominated by pyrite oxidative dissolution, indicating that these conditions no longer dominate pore water composition in the mine spoil. Further, gypsum or other sulfate-bearing mineral phases were not identified, which suggests that there is a high degree of water input and flux through the soils [10]. Ultimately, the relationship between hydrologic and biogeochemical factors that may control EC and carbon retention/release in these soil pore waters warrants further investigation.
Similar to the DOC-rich shallow high wall soils, it would be expected that decomposition of organic carbon from coal would release organic molecules and higher DOC, and that this DOC could chelate with metals and result in metal leaching [68]. However, higher aqueous concentrations of Fe, Al, and Cu are not observed at depth within the mine spoil soils. It is possible that secondary metal (oxy)hydroxides, which were abundant at depth in the mine spoil soil based on extractable Fe and Mn, may limit the transport of leached metals. The role of secondary Fe(III)-bearing phases in adsorbing released trace metal(loid)s is well established, and can profoundly influence the transport of these elements [14,15,16,17,87]. Further, secondary Fe- and Mn-bearing phases have been shown to sequester metal(loids) such as As and Se released from primary sulfides at this field site [8], and sequestration by these phases may outcompete leaching by DOC.
In addition to the high abundance of reducible Mn in the mine spoil soils compared to the high wall, there was also slightly higher aqueous Mn (Figure 6) and exchangeable Mn (Figure S7) in the mine spoil soils compared to the high wall soil. This was not observed for Fe and Al, despite similar trends in the higher amounts of reducible Fe and Al in the mine spoil soils. The highest concentrations of aqueous Mn and exchangeable Mn were highest in the shallow portion of the mine spoil soil. The enrichment of Mn in the shallow surface could be due to biocycling which is driven by the accumulation of litter-derived organic matter in shallow soils [88,89]. Aqueous Mn concentrations and the abundance of solid-phase Mn consistent with Mn oxides was also high below the deep organic-rich layer, from which we infer that aqueous Mn at depth was leached from Mn-bearing pyrite in the organic-rich layer [9]. Higher amounts of exchangeable Mn soils developing on shale can also be the result of a high abundances of clay minerals which can leach Mn [90]; however, there was no evidence for significant differences in clay mineralogy between the mine spoil and high wall soils. Ultimately, in contrast to Fe and Al, a greater amount of labile Mn is present in soils developing on coal mine spoil.

5. Conclusions and Implications

We have shown that biogeochemical processes control the potential for long-term contaminant leaching from soils developing on historic coal mine spoil. Soils developing on historic coal mine spoil can contain organic-rich zones where pyrite is weathering to form secondary Fe- and Mn-(oxy)hydroxides, and that the formation of these phases likely mitigates trace metal transport out of these soils. Broadly, soils in abandoned mine lands contain complex zones of metal mobilization and sequestration. In soils developing on nearby undisturbed but similar lithologies, high concentrations of labile, plant-derived DOC can complex and mobilize Fe and Al. Solid-phase characterization indicated that the bulk of pyrite oxidative dissolution has likely already occurred and mineral weathering is now dominated by aluminosilicates. Remnant pyrite is coated with secondary phases which likely limits complete oxidative dissolution. However, significant fluxes of pyrite-derived solutes persist. In particular, these spoil materials are a potentially larger source of Mn to nearby streams. The peak concentrations of dissolved Mn (0.33 mg/L), Al (0.3 mg/L), and SO42− (480 mg/L) are all above the US EPA secondary maximum contaminant levels (0.05, 0.2, and 250 mg/L, respectively), and there is an underappreciated risk particularly of Mn transport from coal mine spoil. Further, a shift to reducing conditions could liberate contaminants (e.g., Fe and Mn) that are currently bound to oxyhydroxides that also passivate remnant reduced phases. Future work should examine changes over distance (i.e., up a transect) as a proxy for changes in age and determine changes over time to better estimate the potential for long-term metal transport.

Supplementary Materials

The following are available online at https://www.mdpi.com/2571-8789/5/1/3/s1, Table S1. Summary of the number of samples (N) for all analyses, with technique or instrument used in parentheses, Table S2. Particle size distribution (percent) and bulk mineralogical composition (weight percent) of the soil samples, Figure S1. Photographs of the two soil sampling locations and post-installation lysimeters for the mine spoil (A and B) and high wall (C and D). The insert photograph (E) shows a characteristic mine spoil aggregate recovered during soil coring, Figure S2. Background subtracted, normalized bulk XRD patterns (black solid lines) and fits (red dashed lines), Figure S3. SEM images of High Wall (left) and Mine Spoil (right) soils from the four sampling depths. The scale bar for all images is 100 µm, Figure S4. Field measurements of pH, dissolved oxygen (DO), electrical conductivity (EC), and temperature collected from lysimeters installed in High Wall soils (blue circles, left) and Mine Spoil soils (red squares, center) over the sampling season for lysimeters installed at 10 cm (open), 40 cm (cross), 80 cm (hour glass), and 120 cm (filled), Figure S5. Aqueous concentrations of Al (A and B), Fe (C and D), Mn (E and F), Cu (G and H), Ni (I and J), and Zn (K and L) collected from lysimeters installed in high wall soils (blue symbols) and mine spoil soils (red symbols) over the sampling season for lysimeters installed at 10 cm (open), 40 cm (cross), 80 cm (hour glass), and 120 cm (filled) depth, Figure S6. Aqueous concentrations of dissolved organic carbon (DOC) (A), chloride (B), and sulfate (C) collected from lysimeters installed in High Wall soils (blue circles, left) and Mine Spoil soils (red squares, center) over the sampling season for lysimeters installed at 10 cm (open), 40 cm (cross), 80 cm (hour glass), and 120 cm (filled), Figure S7. Sequential extraction scatter plot for Al (top), Fe (middle), and Mn (bottom) for the High Wall (red squares) and Mine Spoil (blue circles) for operationally defined exchangeable (closed), carbonate (hourglass), reducible (dotted), and oxidizable (open) components. Exchangeable Fe and reducible Mn were below detection limits for both soil cores, and Figure S8. Relative abundances of phyla (and classes in the case of Proteobacteria) detected at different depths in High Wall and Mine Tailing samples. The table shows the mean relative abundances (within phylum or class) of most abundant taxa detected within the Acidobacteria, Alphaproteobacteria, and Actinobacteria.

Author Contributions

Conceptualization, D.S. and E.H.; Methodology, D.S., E.H., and L.Z.; Formal Analysis, D.S., E.H., L.Z., K.C., T.S., J.S., and N.P.; Data Curation, D.S.; Writing—Original Draft Preparation, D.S., E.H., L.Z., J.S., and N.P.; Writing—Review and Editing, D.S., E.H., J.S., and N.P.; Project Administration, D.S.; Funding Acquisition, D.S. All authors have read and agreed to the published version of the manuscript.

Funding

This research was funded by Ohio Water Research Center: 15040198.

Institutional Review Board Statement

Not applicable.

Informed Consent Statement

Not applicable.

Data Availability Statement

The data presented in this study are available in the supplementary material.

Acknowledgments

This research was supported by Kent State University (DMS) and the Ohio Water Research Center (grant #15040198 to DMS). We thank KSU students Jonathan Mills and Mikala Coury for assistance in soil collection and particle size analyses. We also thank Marissa Lautzenheiser (Huff Run Watershed Restoration Partnership) for logistical support at the study site.

Conflicts of Interest

The authors declare no conflict of interest. The funders had no role in the design of the study; in the collection, analyses, or interpretation of data; in the writing of the manuscript, and in the decision to publish the results.

References

  1. ODNR. Economic Impact Analysis of the Ohio Abandoned Mine Land Program; Ohio Department of Natural Resources Division of Mineral Resources Management, Ohio University’sVoinovich School of Leadership and Public Affairs: Athens, GA, USA, 2014.
  2. Griffith, M.B.; Norton, S.B.; Alexander, L.C.; Pollard, A.I.; LeDuc, S.D. The effects of mountaintop mines and valley fills on the physicochemical quality of stream ecosystems in the central Appalachians: A review. Sci. Total Environ. 2012, 417, 1–12. [Google Scholar] [CrossRef] [PubMed]
  3. Sánchez España, J. Chapter 7—The Behavior of Iron and Aluminum in Acid Mine Drainage: Speciation, Mineralogy, and Environmental Significance. In Thermodynamics, Solubility and Environmental Issues; Letcher, T.M., Ed.; Elsevier: Amsterdam, The Netherlands, 2007; pp. 137–150. [Google Scholar]
  4. Nordstrom, D.K. Aqueous pyrite oxidation and the consequent formation of secondary iron minerals. Acid Sulfate Weather. 1982, 10, 37–56. [Google Scholar]
  5. Abraitis, P.; Pattrick, R.; Vaughan, D. Variations in the compositional, textural and electrical properties of natural pyrite: A review. Int. J. Miner. Process. 2004, 74, 41–59. [Google Scholar] [CrossRef]
  6. Cravotta, C.A.; Dugas, D.L.; Brady, K.B.; Kovalchuk, T. Effects of Selective Handling of Pyritic, Acid-Forming Materials on the Chemistry of Pore Gas and Ground Water at A Reclaimed Surface Coal Mine, Clarion County, PA. USA Bur. Mines Spec. Publ. SP A 1994, 6, 365–374. [Google Scholar] [CrossRef]
  7. Cravotta, C.A. Dissolved metals and associated constituents in abandoned coal-mine discharges, Pennsylvania, USA. Part 1: Constituent quantities and correlations. Appl. Geochem. 2008, 23, 166–202. [Google Scholar] [CrossRef]
  8. Singer, D.M.; Herndon, E.; Cole, K.; Koval, J.; Perdrial, N. Formation of secondary mineral coatings and the persistence of reduced metal-bearing phases in soils developing on historic coal mine spoil. Appl. Geochem. 2020, 121, 104711. [Google Scholar] [CrossRef]
  9. Herndon, E.; Yarger, B.; Frederick, H.; Singer, D.M. Iron and Manganese Biogeochemistry in Forested Coal Mine Spoil. Soil Syst. 2019, 3, 13. [Google Scholar] [CrossRef] [Green Version]
  10. Clark, E.V.; Daniels, W.L.; Zipper, C.E.; Eriksson, K. Mineralogical influences on water quality from weathering of surface coal mine spoils. Appl. Geochem. 2018, 91, 97–106. [Google Scholar] [CrossRef]
  11. Hartman, K.J.; Kaller, M.D.; Howell, J.W.; Sweka, J.A. How much do valley fills influence headwater streams? Hydrobiologia 2005, 532, 91–102. [Google Scholar] [CrossRef]
  12. Evans, D.M.; Zipper, C.E.; Donovan, P.F.; Daniels, W.L. Long-Term Trends of Specific Conductance in Waters Discharged by Coal-Mine Valley Fills in Central Appalachia, USA. JAWRA J. Am. Water Resour. Assoc. 2014, 50, 1449–1460. [Google Scholar] [CrossRef]
  13. Ross, M.R.; Nippgen, F.; Hassett, B.A.; McGlynn, B.L.; Bernhardt, E.S. Pyrite oxidation drives exceptionally high weathering rates and geologic CO2 release in mountaintop-mined landscapes. Glob. Biogeochem. Cycles 2018, 32, 1182–1194. [Google Scholar] [CrossRef]
  14. Förstner, U. Metal speciation and contamination of soil. Land contamination by metals: Global scope and magnitude of problem. Metal. Speciat. Contam. Soil 1995, 1, 1–33. [Google Scholar]
  15. Mccarty, D.K.; Moore, J.N.; Marcus, W.A. Mineralogy and trace element association in an acid mine drainage iron oxide precipitate; comparison of selective extractions. Appl. Geochem. 1998, 13, 165–176. [Google Scholar] [CrossRef]
  16. Blowes, D.; Ptacek, C.; Jambor, J.; Weisener, C. The geochemistry of acid mine drainage. Treatise Geochem. 2003, 9, 612. [Google Scholar]
  17. Schaider, L.A.; Senn, D.B.; Estes, E.R.; Brabander, D.J.; Shine, J.P. Sources and fates of heavy metals in a mining-impacted stream: Temporal variability and the role of iron oxides. Sci. Total Environ. 2014, 490, 456–466. [Google Scholar] [CrossRef] [Green Version]
  18. Lamborn, R.E. Geology of Tuscarawas County; Division of Geological Survey: Columbus, OH, USA, 1956; Volume 55.
  19. DeLong, R.M. Geology of the Malvern Quadrangle; Division of Geological Survey: Columbus, OH, USA, 1965.
  20. White, D.; Johnston, K.; Miller, M. Ohio river basin. Rivers N. Am. 2005, 1, 374–424. [Google Scholar] [CrossRef]
  21. Singer, D.M.; Jefferson, A.J.; Traub, E.L.; Perdrial, N. Mineralogical and geochemical variation in stream sediments impacted by acid mine drainage is related to hydro-geomorphic setting. Elementa 2018, 6, 16. [Google Scholar] [CrossRef]
  22. Singer, D.M.; Herndon, E.; Cole, K.; Burkey, M.; Morisson, S.; Cahill, M.; Bartucci, M.A. Micron-scale distribution controls metal(loid) release during simulated weathering of a Pennsylvanian coal shale. Geochim. Cosmochim. Acta 2020, 269, 117–135. [Google Scholar] [CrossRef]
  23. Wise, M. Huff Run Watershed Plan; Huff Run Watershed Restoration Partnership, Inc.: Mineral City, OH, USA, 2005. [Google Scholar]
  24. Haering, K.C.; Daniels, W.L.; Galbraith, J.M. Appalachian Mine Soil Morphology and Properties. Soil Sci. Soc. Am. J. 2004, 68, 1315–1325. [Google Scholar] [CrossRef]
  25. Daniels, W.L.; Haering, K.; Galbraith, J.; Thomas, J. Mine soil classification and mapping issues on pre- and post-smcra appalachian coal mined lands. Proc. Am. Soc. Min. Reclam. 2004, 2004, 450–479. [Google Scholar] [CrossRef]
  26. Daniels, W.L.; Zipper, C.E. Improving coal surface mine reclamation in the Central Appalachian region. Rehabil. Damaged Ecosyst. 1988, 1, 139–162. [Google Scholar]
  27. ODNR. Huff Run Watershed Acid Mine Drainage Abatement and Treatment Plan. Prepared for Ohio DNR by Gannett Fleming. Available online: Watersheddata.com (accessed on 29 October 2020).
  28. Downs, R.T.; Hall-Wallace, M. The American Mineralogist crystal structure database. Am. Mineral. 2003, 88, 247–250. [Google Scholar]
  29. Gražulis, S.; Chateigner, D.; Downs, R.T.; Yokochi, A.; Quirós, M.; Lutterotti, L.; Manakova, E.; Butkus, J.; Moeck, P.; le Bail, A. Crystallography Open Database—An open-access collection of crystal structures. J. Appl. Crystallogr. 2009, 42, 726–729. [Google Scholar] [CrossRef]
  30. Gražulis, S.; Daškevič, A.; Merkys, A.; Chateigner, D.; Lutterotti, L.; Quirós, M.; Serebryanaya, N.R.; Moeck, P.; Downs, R.T.; Le Bail, A. Crystallography Open Database (COD): An open-access collection of crystal structures and platform for world-wide collaboration. Nucleic Acids Res. 2011, 40, D420–D427. [Google Scholar] [CrossRef] [PubMed]
  31. Perdrial, N.; Rivera, N.; Thompson, A.; O’Day, P.A.; Chorover, J. Trace contaminant concentration affects mineral transformation and pollutant fate in hydroxide-weathered Hanford sediments. J. Hazard. Mater. 2011, 197, 119–127. [Google Scholar] [CrossRef] [PubMed]
  32. Tessier, A.; Campbell, P.G.C.; Bisson, M. Sequential extraction procedure for the speciation of particulate trace metals. Anal. Chem. 1979, 51, 844–851. [Google Scholar] [CrossRef]
  33. Gault, A.G.; Polya, D.A.; Lythgoe, P.R.; Farquhar, M.L.; Charnock, J.M.; Wogelius, R.A. Arsenic speciation in surface waters and sediments in a contaminated waterway: An IC-ICP-MS and XAS based study. Appl. Geochem. 2003, 18, 1387–1397. [Google Scholar] [CrossRef]
  34. Caporaso, J.G.; Kuczynski, J.; Stombaugh, J.; Bittinger, K.; Bushman, F.D.; Costello, E.K.; Fierer, N.; Peña, A.G.; Goodrich, J.K.; Gordon, J.I.; et al. QIIME allows analysis of high-throughput community sequencing data. Nat. Methods 2010, 7, 335–336. [Google Scholar] [CrossRef] [Green Version]
  35. Wang, Q.; Garrity, G.M.; Tiedje, J.M.; Cole, J.R. Naive Bayesian classifier for rapid assignment of rRNA sequences into the new bacterial taxonomy. Appl. Environ. Microbiol. 2007, 73, 5261–5267. [Google Scholar] [CrossRef] [Green Version]
  36. Edgar, R.C. Search and clustering orders of magnitude faster than BLAST. Bioinformatics 2010, 26, 2460–2461. [Google Scholar] [CrossRef] [Green Version]
  37. Werner, J.J.; Koren, O.; Hugenholtz, P.; DeSantis, T.Z.; Walters, W.A.; Caporaso, J.G.; Angenent, L.T.; Knight, R.; Ley, R.E. Impact of training sets on classification of high-throughput bacterial 16s rRNA gene surveys. ISME J. 2012, 6, 94–103. [Google Scholar] [CrossRef] [PubMed] [Green Version]
  38. Quast, C.; Pruesse, E.; Yilmaz, P.; Gerken, J.; Schweer, T.; Yarza, P.; Peplies, J.; Glöckner, F.O. The SILVA ribosomal RNA gene database project: Improved data processing and web-based tools. Nucleic Acids Res. 2012, 41, D590–D596. [Google Scholar] [CrossRef] [PubMed]
  39. Caporaso, J.G.; Bittinger, K.; Bushman, F.D.; DeSantis, T.Z.; Andersen, G.L.; Knight, R. PyNAST: A flexible tool for aligning sequences to a template alignment. Bioinformatics 2010, 26, 266–267. [Google Scholar] [CrossRef] [PubMed] [Green Version]
  40. Altschul, S.F.; Madden, T.L.; Schäffer, A.A.; Zhang, J.; Zhang, Z.; Miller, W.; Lipman, D.J. Gapped BLAST and PSI-BLAST: A new generation of protein database search programs. Nucleic Acids Res. 1997, 25, 3389–3402. [Google Scholar] [CrossRef] [Green Version]
  41. Li, Y.; Wen, H.; Chen, L.; Yin, T. Succession of Bacterial Community Structure and Diversity in Soil along a Chronosequence of Reclamation and Re-Vegetation on Coal Mine Spoils in China. PLoS ONE 2014, 9, e115024. [Google Scholar] [CrossRef]
  42. Poncelet, D.M.; Cavender, N.; Cutright, T.J.; Senko, J.M. An assessment of microbial communities associated with surface mining-disturbed overburden. Environ. Monit. Assess. 2013, 186, 1917–1929. [Google Scholar] [CrossRef]
  43. Brooks, J.P.; Adeli, A.; Smith, R.K.; McGrew, R.; Lang, D.J.; Read, J.J. Bacterial Community Structure Recovery in Reclaimed Coal Mined Soil under Two Vegetative Regimes. J. Environ. Qual. 2019, 48, 1029–1037. [Google Scholar] [CrossRef]
  44. Youssef, N.H.; Elshahed, M.S. Diversity rankings among bacterial lineages in soil. ISME J. 2009, 3, 305–313. [Google Scholar] [CrossRef]
  45. Youssef, N.; Sheik, C.S.; Krumholz, L.R.; Najar, F.Z.; Roe, B.A.; Elshahed, M.S. Comparison of Species Richness Estimates Obtained Using Nearly Complete Fragments and Simulated Pyrosequencing-Generated Fragments in 16S rRNA Gene-Based Environmental Surveys. Appl. Environ. Microbiol. 2009, 75, 5227–5236. [Google Scholar] [CrossRef] [Green Version]
  46. Sheik, C.S.; Beasley, W.H.; Elshahed, M.S.; Zhou, X.; Luo, Y.; Krumholz, L.R. Effect of warming and drought on grassland microbial communities. ISME J. 2011, 5, 1692–1700. [Google Scholar] [CrossRef] [Green Version]
  47. Sharma, S.; Lee, M.; Reinmann, C.S.; Pumneo, J.; Cutright, T.J.; Senko, J.M. Impact of acid mine drainage chemistry and microbiology on the development of efficient Fe removal activities. Chemosphere 2020, 249, 126117. [Google Scholar] [CrossRef] [PubMed]
  48. Kuever, J.; Rainey, F.; Widdel, F. The family syntrophobacteraceae. Prokaryot. Deltaproteobact. Epsil. 2014, 1, 289–299. [Google Scholar]
  49. Garcia, R.; Müller, R. The Family Myxococcaceae. Prokaryotes 2014, 10, 191–212. [Google Scholar] [CrossRef]
  50. Roling, W. 12 The family Geobacteraceae. Prokaryot. Deltaproteobact. Epsil. 2014, 157–172. Available online: https://www.narcis.nl/publication/RecordID/oai:research.vu.nl:publications%2F617baa81-4beb-4ae2-b352-6b0db777a8d5 (accessed on 29 October 2020).
  51. King, G.M.; Garey, M.A. Ferric Iron Reduction by Bacteria Associated with the Roots of Freshwater and Marine Macrophytes. Appl. Environ. Microbiol. 1999, 65, 4393–4398. [Google Scholar] [CrossRef] [Green Version]
  52. Küsel, K.; Wagner, C.; Trinkwalter, T.; Gößner, A.S.; Bäumler, R.; Drake, H.L. Microbial reduction of Fe (III) and turnover of acetate in Hawaiian soils. FEMS Microbiol. Ecol. 2002, 40, 73–81. [Google Scholar]
  53. Lopes, A.R.; Bello, D.; Prieto-Fernández, Á.; Trasar-Cepeda, C.; Manaia, C.M.; Nunes, O.C. Relationships among bulk soil physicochemical, biochemical, and microbiological parameters in an organic alfalfa-rice rotation system. Environ. Sci. Pollut. Res. 2015, 22, 11690–11699. [Google Scholar] [CrossRef]
  54. Lopes, A.R.; Manaia, C.M.; Nunes, O.C. Bacterial community variations in an alfalfa-rice rotation system revealed by 16S rRNA gene 454-pyrosequencing. FEMS Microbiol. Ecol. 2014, 87, 650–663. [Google Scholar] [CrossRef] [Green Version]
  55. Walsh, F.; Smith, D.P.; Owens, S.M.; Duffy, B.; Frey, J.E. Restricted streptomycin use in apple orchards did not adversely alter the soil bacteria communities. Front. Microbiol. 2014, 4, 383. [Google Scholar] [CrossRef]
  56. Cavaletti, L.; Monciardini, P.; Bamonte, R.; Schumann, P.; Rohde, M.; Sosio, M.; Donadio, S. New Lineage of Filamentous, Spore-Forming, Gram-Positive Bacteria from Soil. Appl. Environ. Microbiol. 2006, 72, 4360–4369. [Google Scholar] [CrossRef] [Green Version]
  57. Yabe, S.; Sakai, Y.; Abe, K.; Yokota, A.; Také, A.; Matsumoto, A.; Sugiharto, A.; Susilowati, D.; Hamada, M.; Nara, K. Dictyobacter aurantiacus gen. nov., sp. nov., a member of the family Ktedonobacteraceae, isolated from soil, and emended description of the genus Thermosporothrix. Int. J. Syst. Evol. Microbiol. 2017, 67, 2615–2621. [Google Scholar] [CrossRef] [PubMed]
  58. Yabe, S.; Aiba, Y.; Sakai, Y.; Hazaka, M.; Yokota, A. Thermogemmatispora onikobensis gen. nov., sp. nov. and Thermogemmatispora foliorum sp. nov., isolated from fallen leaves on geothermal soils, and description of Thermogemmatisporaceae fam. nov. and Thermogemmatisporales ord. nov. within the class Ktedonobacteria. Int. J. Syst. Evol. Microbiol. 2011, 61, 903–910. [Google Scholar] [CrossRef] [PubMed] [Green Version]
  59. Hanada, S.; Sekiguchi, Y. The Phylum Gemmatimonadetes. Prokaryotes 2014, 11, 677–681. [Google Scholar] [CrossRef]
  60. Leitholf, A.M.; Fretz, C.E.; Mahanke, R.; Santangelo, Z.; Senko, J.M. An integrated microbiological and electrochemical approach to determine distributions of Fe metabolism in acid mine drainage-induced “iron mound” sediments. PLoS ONE 2019, 14, e0213807. [Google Scholar] [CrossRef] [Green Version]
  61. Wiggering, H. Weathering of clay minerals in waste dumps of Upper Carboniferous coal-bearing strata, the Ruhr area, West Germany. Appl. Clay Sci. 1987, 2, 353–361. [Google Scholar] [CrossRef]
  62. Vigil de la Villa, R.; Frías, M.; García-Giménez, R.; Martínez-Ramirez, S.; Fernández-Carrasco, L. Chemical and mineral transformations that occur in mine waste and washery rejects during pre-utilization calcination. Int. J. Coal Geol. 2014, 132, 123–130. [Google Scholar] [CrossRef]
  63. Miller, J.O.; Barton, C.; Agouridis, C.T.; Fogel, A.; Dowdy, T.; Angel, P. Evaluating Soil Genesis and Reforestation Success on a Surface Coal Mine in Appalachia. Soil Sci. Soc. Am. J. 2012, 76, 950–960. [Google Scholar] [CrossRef]
  64. Jha, A.; Singh, J. Spoil characteristics and vegetation development of an age series of mine spoils in a dry tropical environment. Vegetatio 1991, 97, 63–76. [Google Scholar]
  65. Dang, Z.; Liu, C.; Haigh, M.J. Mobility of heavy metals associated with the natural weathering of coal mine spoils. Environ. Pollut. 2002, 118, 419–426. [Google Scholar] [CrossRef]
  66. Tuttle, M.L.; Breit, G.N. Weathering of the New Albany Shale, Kentucky, USA: I. Weathering zones defined by mineralogy and major-element composition. Appl. Geochem. 2009, 24, 1549–1564. [Google Scholar] [CrossRef]
  67. Jin, L.; Ravella, R.; Ketchum, B.; Bierman, P.R.; Heaney, P.; White, T.; Brantley, S.L. Mineral weathering and elemental transport during hillslope evolution at the Susquehanna/Shale Hills Critical Zone Observatory. Geochim. Cosmochim. Acta 2010, 74, 3669–3691. [Google Scholar] [CrossRef]
  68. Jin, L.; Mathur, R.; Rother, G.; Cole, D.R.; Bazilevskaya, E.; Williams, J.; Carone, A.; Brantley, S.L. Evolution of porosity and geochemistry in Marcellus Formation black shale during weathering. Chem. Geol. 2013, 356, 50–63. [Google Scholar] [CrossRef]
  69. Kang, C.-U.; Jeon, B.-H.; Park, S.-S.; Kang, J.-S.; Kim, K.-H.; Kim, D.-K.; Choi, U.-K.; Kim, S. Inhibition of pyrite oxidation by surface coating: A long-term field study. Environ. Geochem. Health 2016, 38, 1137–1146. [Google Scholar] [CrossRef] [PubMed]
  70. Lee, A.K.; Newman, D.K. Microbial iron respiration: Impacts on corrosion processes. Appl. Microbiol. Biotechnol. 2003, 62, 134–139. [Google Scholar] [CrossRef]
  71. Essilfie-Dughan, J.; Hendry, M.J.; Dynes, J.J.; Hu, Y.; Biswas, A.; Barbour, S.L.; Day, S. Geochemical and mineralogical characterization of sulfur and iron in coal waste rock, Elk Valley, British Columbia, Canada. Sci. Total Environ. 2017, 586, 753–769. [Google Scholar] [CrossRef]
  72. Keiluweit, M.; Wanzek, T.; Kleber, M.; Nico, P.; Fendorf, S. Anaerobic microsites have an unaccounted role in soil carbon stabilization. Nat. Commun. 2017, 8, 1–10. [Google Scholar] [CrossRef]
  73. Roden, E.E.; Kappler, A.; Bauer, I.; Jiang, J.; Paul, A.; Stoesser, R.; Konishi, H.; Xu, H. Extracellular electron transfer through microbial reduction of solid-phase humic substances. Nat. Geosci. 2010, 3, 417–421. [Google Scholar] [CrossRef]
  74. Nordstrom, D.K. Hydrogeochemical processes governing the origin, transport and fate of major and trace elements from mine wastes and mineralized rock to surface waters. Appl. Geochem. 2011, 26, 1777–1791. [Google Scholar] [CrossRef]
  75. Pandey, B.; Agrawal, S.; Singh, S. Ecological risk assessment of soil contamination by trace elements around coal mining area. J. Soils Sediments 2016, 16, 159–168. [Google Scholar] [CrossRef]
  76. Schatzel, S.J.; Stewart, B.W. Rare earth element sources and modification in the Lower Kittanning coal bed, Pennsylvania: Implications for the origin of coal mineral matter and rare earth element exposure in underground mines. Int. J. Coal Geol. 2003, 54, 223–251. [Google Scholar] [CrossRef]
  77. Scheel, T.; Dörfler, C.; Kalbitz, K. Precipitation of Dissolved Organic Matter by Aluminum Stabilizes Carbon in Acidic Forest Soils. Soil Sci. Soc. Am. J. 2007, 71, 64–74. [Google Scholar] [CrossRef]
  78. Berggren, D.; Mulder, J. The role of organic matter in controlling aluminum solubility in acidic mineral soil horizons. Geochim. Cosmochim. Acta 1995, 59, 4167–4180. [Google Scholar] [CrossRef]
  79. McDowell, W.H. Dissolved organic matter in soils—future directions and unanswered questions. Geoderma 2003, 113, 179–186. [Google Scholar] [CrossRef]
  80. Mastný, J.; Kaštovská, E.; Bárta, J.; Chroňáková, A.; Borovec, J.; Šantrůčková, H.; Urbanová, Z.; Edwards, K.R.; Picek, T. Quality of DOC produced during litter decomposition of peatland plant dominants. Soil Biol. Biochem. 2018, 121, 221–230. [Google Scholar] [CrossRef]
  81. Fisher-Power, L.M.; Cheng, T.; Rastghalam, Z.S. Cu and Zn adsorption to a heterogeneous natural sediment: Influence of leached cations and natural organic matter. Chemosphere 2016, 144, 1973–1979. [Google Scholar] [CrossRef]
  82. Toribio, M.; Romanyà, J. Leaching of heavy metals (Cu, Ni and Zn) and organic matter after sewage sludge application to Mediterranean forest soils. Sci. Total Environ. 2006, 363, 11–21. [Google Scholar] [CrossRef]
  83. Castillo-Meza, L.; Cravotta, C.; Tasker, T.; Warner, N.; Daniels, W.; Orndorff, Z.; Bergstresser, T.; Douglass, A.; Kimble, G.; Streczywilk, J.; et al. Batch extraction method to estimate total dissolved solids (TDS) release from coal refuse and overburden. Appl. Geochem. 2020, 115, 104540. [Google Scholar] [CrossRef]
  84. Singh, G.; Kaur, G.; Williard, K.; Schoonover, J.; Kang, J. Monitoring of Water and Solute Transport in the Vadose Zone: A Review. Vadose Zone J. 2017, 17, 160058. [Google Scholar] [CrossRef]
  85. Swistock, B.R.; Yamona, J.J.; Dewalle, D.R.; Sharpe, W.E. Comparison of soil water chemistry and sample size requirements for pan vs tension lysimeters. Water Air Soil Pollut. 1990, 50, 387–396. [Google Scholar] [CrossRef]
  86. Agouridis, C.T.; Angel, P.N.; Taylor, T.J.; Barton, C.; Warner, R.C.; Yu, X.; Wood, C. Water Quality Characteristics of Discharge from Reforested Loose-Dumped Mine Spoil in Eastern Kentucky. J. Environ. Qual. 2012, 41, 454–468. [Google Scholar] [CrossRef]
  87. Mayanna, S.; Peacock, C.L.; Schäffner, F.; Grawunder, A.; Merten, D.; Kothe, E.; Büchel, G. Biogenic precipitation of manganese oxides and enrichment of heavy metals at acidic soil pH. Chem. Geol. 2015, 402, 6–17. [Google Scholar] [CrossRef]
  88. Herndon, E.M.; Jin, L.; Andrews, D.M.; Eissenstat, D.M.; Brantley, S.L. Importance of vegetation for manganese cycling in temperate forested watersheds. Glob. Biogeochem. Cycles 2015, 29, 160–174. [Google Scholar] [CrossRef]
  89. Keiluweit, M.; Nico, P.S.; Harmon, M.E.; Mao, J.; Pett-Ridge, J.; Kleber, M. Long-term litter decomposition controlled by manganese redox cycling. Proc. Natl. Acad. Sci. USA 2015, 112, E5253–E5260. [Google Scholar] [CrossRef] [PubMed] [Green Version]
  90. Larsen, D.; Mann, R. Origin of high manganese concentrations in coal mine drainage, eastern Tennessee. J. Geochem. Explor. 2005, 86, 143–163. [Google Scholar] [CrossRef]
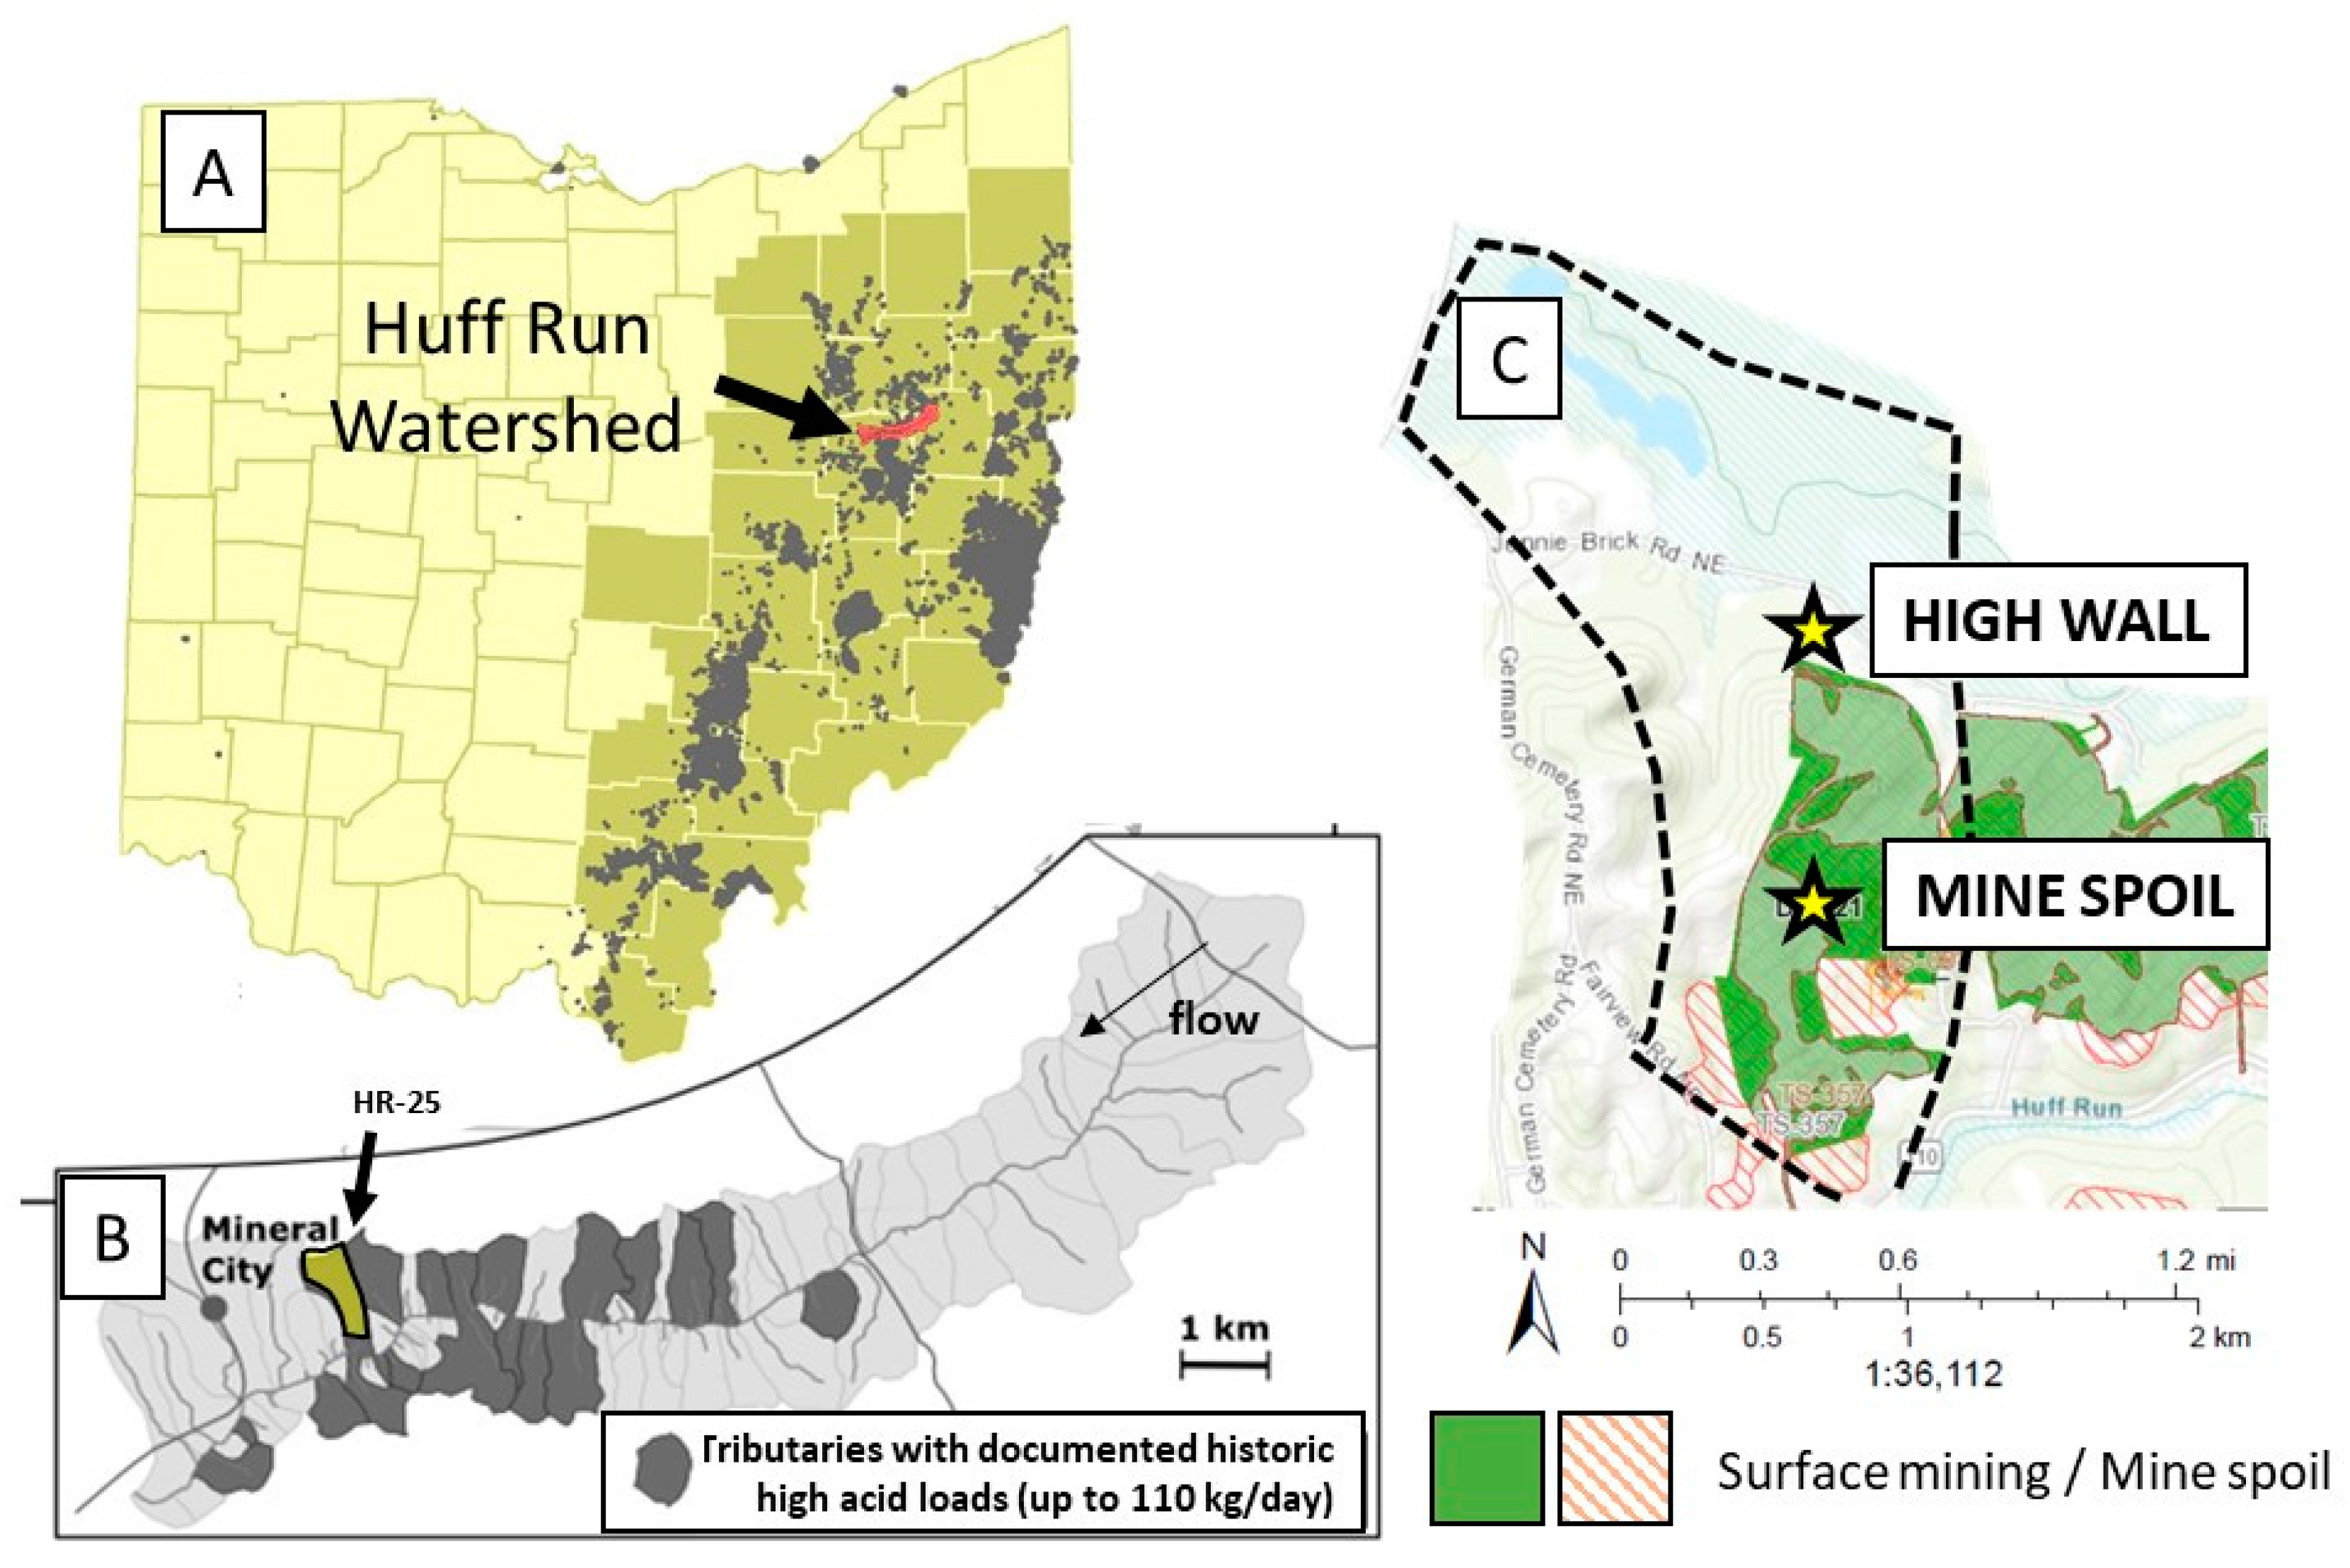
Figure 1. (A) Location of the Huff Run Watershed (in red), with Ohio coal counties shown in tan and known abandoned coal mines in gray [1]; (B) Watershed map [27] showing location of sub-watershed HR-25 (in yellow), stream flow direction, and acid loads in portions of the watershed (C) spatial extent of known surface area within HR-25 (the dashed outline) affected by coal surface mining (green) and mine spoil emplacement (hatched orange). Location, watershed, and sub-watershed maps modified after [8,22]. The stars mark the locations of the high wall and mine spoil sites. Coal mining data from: https://gis.ohiodnr.gov.
Soilsystems 05 00003 g001
Figure 2. Comparison of high wall (left) and mine spoil (right) particle size analysis (A) and mineralogical composition (B); the bottom panel (C) shows loss on ignition (LOI) (error bars that represent one standard deviations for data points collected in triplicate).
Soilsystems 05 00003 g002
Figure 3. Representative SEM images collected in the backscattered mode and EDS element maps from the high wall soil samples from 0–10, 30–40, 70–80, and 110–120 cm (in descending order).
Soilsystems 05 00003 g003
Figure 4. Representative SEM images collected in the backscattered mode and EDS element maps from the mine spoil soil samples from 0–10, 30–40, 70–80, and 110–120 cm (in descending order).
Soilsystems 05 00003 g004
Figure 5. Average values for field measurements of (A) pH, (B) dissolved oxygen (DO), (C) electrical conductivity (EC), and (D) temperature collected from lysimeters installed in high wall soils (blue circles, left) and mine spoil soils (red squares, center) over the sampling season for lysimeters installed at 10, 40, 80, and 120 cm. Errors represent one standard deviation of the averaged values over the sampling period.
Soilsystems 05 00003 g005
Figure 6. Average concentrations for Al (A), Fe (B), Mn (C), Cu (D), Zn (E), and Ni (F) collected from lysimeters installed in high wall soils (blue circles, left) and mine spoil soils (red squares, center) over the sampling season for lysimeters installed at 10, 40, 80, and 120 cm. Errors represent one standard deviation of the averaged values over the sampling period.
Soilsystems 05 00003 g006
Figure 7. Average concentrations for (A) dissolved organic carbon (DOC), (B) chloride, and (C) sulfate collected from lysimeters installed in high wall soils (blue circles, left) and mine spoil soils (red squares, center) over the sampling season for lysimeters installed at 10, 40, 80, and 120 cm. Errors represent one standard deviation of the averaged values over the sampling period.
Soilsystems 05 00003 g007
Figure 8. Total extractable Al (top), Fe (middle), and Mn (bottom) showing contributions of exchangeable (yellow), carbonate (orange), reducible (red), and oxidizable (blue) components from the high wall (left) and mine spoil (right) soil cores. Individual extractions, including the analytical error, are shown in Figure S7.
Soilsystems 05 00003 g008
Figure 9. Relative abundances of Deltaproteobacteria (cool colors) and Chloroflexi (warm columns) at varying depths in high wall and mine tailings. The key on the bottom of the panel indicates the highest-resolution taxonomic assignments of the most abundant phylotypes within the Deltaproteobacteria and Chloroflexi.
Soilsystems 05 00003 g009
Publisher’s Note: MDPI stays neutral with regard to jurisdictional claims in published maps and institutional affiliations.