Article

Water Table Dynamics Control Carbon Losses from the Destabilization of Soil Organic Matter in a Small, Lowland Agricultural Catchment

1
Géosciences Rennes, UMR 6118, CNRS, Univ Rennes, F-35000 Rennes, France
2
UMR SAS, INRA, AGROCAMPUS OUEST, F-35000 Rennes, France
*
Author to whom correspondence should be addressed.
Present address: UMR ECOSYS, INRA, AgroParisTech, Université Paris-Saclay, F-78850 Thiverval-Grignon, France.
Soil Syst. 2020, 4(1), 2; https://doi.org/10.3390/soilsystems4010002
Submission received: 23 July 2019 / Revised: 17 December 2019 / Accepted: 18 December 2019 / Published: 20 December 2019

Abstract

:
The biogeochemistry of soil organic matter (SOM) is driven by a combination of stabilization and destabilization mechanisms. Among the various ways in which SOM is lost, soil moisture controls the leaching of dissolved organic and inorganic carbon (DOC and DIC) and CO2 fluxes (FCO2). The aim of this study was to investigate the impact of naturally occurring water table dynamics on the couplings between these three types of C losses. The DIC and DOC concentrations in the soil solutions and the FCO2 values at the soil surface were collected fortnightly over a nine-month period at four sampling points located along two topographic transects characterized by different water table dynamics. The water table depth, soil temperature and water-filled pore space (WFPS) were monitored at each site. Linear and nonlinear regressions were used to explore the couplings between C losses, WFPS and soil temperature. The dynamics of the water table seem to drive DOC solubilization, diffusion, and export mechanisms in addition to microbial processes and the equilibrium between DIC and CO2. The main descriptors of this water table dynamic were the residence time, return time and number of oscillations of the water table. Considering both transects, FCO2 was positively correlated with DOC, which highlights the importance of substrate accessibility for SOM mineralization. This paper emphasizes the importance of the water table dynamic for the coupling between SOM carbon losses.

1. Introduction

Soil organic matter (SOM) is the source of energy for terrestrial heterotrophic organisms. It interacts with metallic and organic micropollutants and, with an estimated stock of 1600 PgC, it represents twice as much C as stored in the atmosphere in the form of CO2 [1]. Consequently, SOM is of particular interest in biodiversity, ecotoxicology, and climatology. As a result, considerable efforts continue to be made to understand SOM biogeochemistry and, more specifically, the mechanisms responsible for its stabilization and destabilization are still under debate [2,3].
In the late 1990s, SOM destabilization was defined as “the increase in the potential for organic carbon to be respired, eroded, or leached” [4]. Twenty years later, the exact nature of the overall process was one of the topics of the “Advancing Soil Carbon Cycle Science” workshop held in Boulder (Colorado, USA) in 2016. In the scientific report of this workshop, SOM vulnerability is used as a synonym of destabilization and is assumed to increase “when intrinsic soil properties, environmental conditions, and perturbations reduce the amounts of stable aggregates, soil microbes, particulate C, and mineral-associated and sorbed C, leading to greater proportions of leached C and greenhouse gas emissions (carbon dioxide and methane)” [5]. Based on these definitions, SOM stored in a specific volume of soil can be conceptualized as a reactor receiving natural inputs, such as plant-derived organic matter coming from the fixation of atmospheric CO2 and anthropogenic inputs such as organic waste products. The biotic and abiotic reactivity of SOM results in C losses. Leaching losses, including dissolved organic carbon and dissolved inorganic carbon (DOC and DIC, respectively), are considered to be an important fraction of the carbon budget of ecosystems [6]. Gaseous losses, primarily CO2, but also methane and volatile organic compounds, have been estimated to represent an annual flux of 68 GtC-CO2 at the global scale [7]. At the landscape scale, erosion is responsible for the redistribution of SOM stocks from elevated topographic positions to floodplains and rivers [8,9].
Among the various relevant environmental conditions, the water-filled pore space (WFPS) impacts SOM destabilization in several ways. First, WFPS controls the solid/liquid ratio in soils, and therefore affects the solubilization of SOM. Solubilization must occur first in order to form the highly reactive and mobile pool of dissolved organic matter (DOM, often quantitatively characterized by DOC).
Second, WFPS is expected to control DOM transport at various spatial scales. At the slope to catchment scale, DOC and DIC are transported through the soil macropores, defined as cavities that are larger than 75 µm [10] where water moves freely under the effect of gravity, with hydrological fluxes [11], and are exported from soils to streams, both below and aboveground via percolation and surface runoff, respectively [12,13,14]. At microscopic scales, water may be retained by adhesive intermolecular forces thereby allowing DOM diffusion through the soil pores and ensuring availability of C to the micro-organisms by controlling the likelihood of encounters between these organisms and their substrates [15].
WFPS also controls soil respiration, which is assumed to be regulated by (i) the accessibility of micro-organisms to dissolved oxygen as an electron acceptor for SOM aerobic respiration [16,17] and (ii) the possibility for the produced CO2 to directly reach the atmosphere, mainly via diffusion through the gaseous phase in the soil pores [18]. High WFPS values are associated with low soil respiration fluxes; it is assumed that this is due to the decreased biodegradation of SOM driven by low dissolved oxygen availability [19].
From an abiotic point of view, WFPS also controls the abiotic CO2 processes by dissolving CO2 under the forms of carbonic acid (H2CO3), bicarbonate acid (HCO3) and carbonate acid (CO32−) [20], which forms the DIC pool. The equilibriums between the dissolved and gaseous inorganic C are affected by the pH, temperature and WFPS [20,21]. According to Chapin et al. [22], substantial amounts of respiration derived DIC may be transferred to aquatic ecosystems through runoff and groundwater transport.
Finally, when the soil is saturated (WFPS around 100%) and the water velocity of lateral flow is low, which is common in lowland areas during the wet season, the development of anaerobic conditions may result in microbial iron reduction [23,24,25]. These periods are associated with increased DOC concentrations, up to four times, in the soil macropores, due to the release of OM previously adsorbed to iron oxides [26,27].
Consequently, reactivity and the C losses from the destabilization of SOM are partly driven by WFPS, which depends on the season which impacts the water table depth and on the topographic position. The aim of this study was to test the control of topography on C losses from SOM destabilization, by considering the impact of the water table dynamics on the soil-to-atmosphere CO2 efflux and the leaching of DIC and DOC in soil macropores. More precisely, the present work investigated the following questions: Does the DOC concentration exert a primary control on the soil CO2 efflux (FCO2)? Is there a coupling between the FCO2, DIC and DOC concentrations and how may water table dynamics drive this coupling? What is the impact of anaerobic conditions on this coupling?
To answer these questions, the DIC and DOC concentrations were quantified by sampling the soil solutions moving freely in the soil macropores using zero-tension lysimeters [28] and the soil CO2 efflux was monitored from the soil surface. This study took advantage of the long-term research program on SOM biogeochemistry [13,14,26,29,30,31,32,33,34] at the Kervidy-Naizin catchment which is part of the AgrHys Critical Zone Observatory [35], within the French Critical Zone Observatory research infrastructure OZCAR [36] and can be considered as representative of lowland agricultural sites under temperate climate. In order to ascertain how the topography and water table dynamics control the coupling between FCO2, DIC and DOC, sampling campaigns were performed fortnightly during one hydrological year from October to June, when water moves freely in the soil macropores leading to SOM destabilization through the export of gaseous and dissolved products.

2. Material and Methods

2.1. Description of the Study Area and Sampling Sites

The study area is the Kervidy-Naizin agricultural catchment (≈ 5 km2), located in north-western France (48°00′ N 2°50′ W) (http://www.rennes.inra.fr/oreagrhys/). More details about the catchment can be found in Humbert et al. [13]. The climate is temperate and the mean annual temperature and precipitation as observed over the 1994–2013 period are 11 °C and 830 mm, respectively.
The soils have a predominantly silty loam texture. They are mainly formed from schist residuum at backslope positions and are colluvial in nature at footslope positions. They differ mainly in their drainage characteristics and are highly organized based on the topography (elevation range: 98–140 m): well-drained Cambisols [37] develop in the upslope domain (50% of the hillslope length) whereas poorly-drained soils classified as epistagnic Haplic Albeluvisols develop in the lowest elevation zones. The parent material consists of schist with the addition of fluvial deposits in the valleys. The study area is an intensive mixed agricultural catchment for livestock and industrial vegetable production with a well-documented land-use history and farm practices. French Brittany has been one of the most productive agricultural regions in Europe since the Second World War.
The present study focuses on the lower part of two topographic transects with gentle slopes. Each lower part was equipped with two sampling sites (Figure 1), one located close to the stream (downslope site) and one further up, just below the topographic inflexion point, at the transition between the concave and convex parts of the transect (upslope site). The radiocarbon dating of organic C in SOM and DOM in the lower parts of this catchment resulted in an age posterior to 1950 (unpublished data). In the Kerolland (K) transect, the mean slope is 2.5%. The downslope site (Kdown) was located in a poplar grove and the upslope site (Kup) was in a crop field that was left bare during the sampling campaign (only a small amount of maize crop residu was present). In the Guériniec (G) transect, the mean slope is 4.1%. Both sites were located in a grassy buffer strip. Gdown was the lowest position, close (roughly 10 m) to the stream, and Gup was located further upslope, just below the adjacent crop field. The differences in elevation between the upslope and downslope sites were 0.8 and 5.5 m for transects G and K, respectively. These sites were selected because they provide a gradient in soil wetness and drainage conditions and are equipped with deep piezometers monitoring the water table dynamics since 1999. The main soil and hydrological characteristics of the sites are given in Table 1.

2.2. Analytical Methods

2.2.1. Soil CO2 Efflux Measurements

The measurements were taken manually and randomly in time once every ten to fifteen days over a nine-month period from 30 October 2014 until 27 May 2015 at the four sites during the daytime. At each site, an area of approximately 4 m2 was devoted to the soil CO2 efflux (FCO2) measurements by means of three PVC collars (20 cm in diameter) inserted into the soil, at least 50 cm apart. The collars were placed two weeks before the measurements started. The collar insertion depth was 5–6 cm. When present, vegetation inside the collars was removed manually and vegetation-free conditions were maintained in all collars throughout the entire study period. The collars were left in place for the whole experimental period. On each date, FCO2 was measured once on each collar at all of the sites provided that this was allowed by the agricultural management constraints (19 measurement dates for Gup, Gdown and Kdown, and 16 measurement dates for Kup).
FCO2 was measured with an automated closed dynamic chamber system consisting of an infrared gas analyzer (LI-8100A, Li-COR, Lincoln, NE, USA) connected to a soil chamber (8100–10,320 cm Survey Chamber, Li-COR, Lincoln, NE, USA). The duration of the measurement was 2 min, in addition to a 30 s pre-measurement equilibration phase.

2.2.2. Physical Parameters

The soil temperature (T, 5 cm deep, LI-COR 8100-201 Omega soil temperature probe) and soil water content (SWC) (0–6 cm deep, Thetaprobe ML2x Delta-T Devices Ltd.) were measured next to each collar each time FCO2 was measured.
The water table depth was monitored in piezometers that are between 3 (Kdown, Gdown) and 4 m (Kup, Gup) deep. They are composed of PVC tubes with a well screen pierced with 1 mm slots at a height of 0.5 m from the base. The space around the PVC tube is backfilled with sand, bentonite and concrete. The water table level is measured every 15 min using automatic transducer sensors.

2.2.3. Soil Solution Measurements

The soil pore water was sampled at a depth of −10 cm in triplicates using zero-tension lysimeters on the same dates as the FCO2 measurements, except for three dates. This device samples water that is moving freely in the soil macropores. Then, the sampled volume was dependent on the rainfall and water table depth and ranged from 0 to several hundred of mL. Samples were taken at the exact same location as the FCO2 measurements for all sites (Figure 1). For the DOC and DIC analysis, the solutions were brought back to the lab and filtrated through a 0.2 µm cellulose acetate membrane on the same day that the samples were taken, with filters that had previously been washed with 500 mL of ultrapure water (electrical resistivity: 18.2 MΩ·cm) to prevent organic contamination. The DOC and DIC concentrations were measured with a total organic C analyzer (Shimadzu TOC-VCSH, accuracy ±5%). DIC was determined by sparging the acidified sample with carrier gas (purified air), meaning that not only dissolved CO2 is quantified but also the other forms of DIC as well (carbonic acid, bicarbonate and carbonate), while DOC was calculated from the difference between the total dissolved C, determined at 680 °C via a combustion catalytic oxidation method, and DIC. The ferrous cation (Fe2+) concentrations, used to evaluate the redox conditions, were quantified using the 1.10 phenanthroline colorimetric method with AFNOR standard NF T90-017 and using a UV-visible spectrophotometer (Perkin Elmer, Lambda 25). The complexation between phenanthroline and ferrous cations was performed on site by adding 5 mL of soil solution to a known volume of reaction solution. The spectroscopic measurement was taken in the lab at 510 nm on the day of the sample was taken. The uncertainties were below ±5% for Fe.

2.3. Modeling the Control of Abiotic Parameters on the DIC/DOC Concentrations and FCO2

The correlations between the different variables including (i) abiotic parameters (WFPS and temperature) and (ii) chemical analyses (Fe2+, DIC, DOC and FCO2) were searched using the rcorr function of the Hmisc package in R (R Development Core Team, 2005) which calculates a matrix of Pearson’s rank correlation coefficients. The relationships between DIC and both soil temperature and WFPS were modeled using linear regressions. In previous studies, the link between DOC and temperature was modeled using a linear regression [38] or exponential equation [39]. In this latter article, the exponential model was close to a linear model over the analyzed range (see in [39]). Consequently, DOC versus soil temperature was modeled using linear regression. The link between DOC and WFPS was modeled using a linear regression according to Christ and David [39]. Similar to DOC, it is well-known that FCO2 is controlled by soil temperature and soil moisture. Consequently, FCO2 was modeled using an empirical equation that is the product of an exponential Q10-like temperature function [40] and a parabolic WFPS function [16,19] (Equation (1)):
F CO 2   =   Q 10 T 10 10 × ( a   × W F P S 2 +   b   × W F P S )
where CO2 is the soil CO2 efflux (µmolC/(m2·s)), Q10 is the CO2 temperature sensitivity factor, T is the measured soil temperature (°C, at a depth of 5 cm), WFPS is the water-filled pore space (%) calculated from measured volumetric soil water content (% vol.; 0–6 cm depth) and soil bulk density (g/cm3) at each site, and a and b are the fitted parameters of the parabolic function.
The goodness-of-fit of the model was assessed with (i) the root mean square error (RMSE) and (ii) the slope and linearity of the measured vs. modeled values graph (r2).

2.4. Modeling the Coupling between DIC, DOC and FCO2

The potential coupling between (i) DIC and DOC and (ii) DIC and FCO2 was modeled using linear regressions. The relationship between DOC and FCO2 was modeled using an exponential function according to Creed et al. [41] (Equation (2)):
F CO 2 =   e a + b   ×   DOC
The natural logarithm transformation of this equation results in Equation (3) that can be tested as a linear regression between ln (FCO2) and DOC.
ln ( F CO 2 ) = a   + b   × DOC
For the linear regressions, both the goodness-of-fit and significance of the relationships are given by Pearson’s r rank correlation and the associated p-value calculated using the rcorr function in R.

3. Results

3.1. Temporal Dynamics of the Hydrological Variables and Soil Temperature

Between September 2014 and June 2015 (i.e., the study period), the total precipitation was 641.5 mm, which is in the lower part of the 95% confidence interval of the average precipitation over the 2000–2016 precipitation data collection period (723.2 ± 93.8 mm; mean ± 95%CI). Over the 2000–2016 period, the precipitation values from September to June ranged from 410.5 (2004–2005) to 1176.5 mm (2000–2001). In the oceanic temperate climate of western France, this period represents 87 ± 3% of the annual precipitation. Unless otherwise specified, all of the dates provided below fall within the September 2014 to June 2015 period. From September to June, there were 161 rainy days (53%) (Table S1). Further, in this period, there were 55 days with only 0.5 mm and six events with more than 20 mm (considered as extreme storms in this region): 12 October (37 mm), 2 and 11 November (31.5 and 32.5 mm), 12 December (22.5 mm), and 17 and 29 April (22.5 and 23 mm).
This precipitation pattern combined with the geology and topography of the sites created different water table dynamics over the two altitudinal transects (Figure 2, Table S1). At Kdown, located in a riparian wetland, these dynamics divided the hydrological year into four periods that control the biogeochemistry of the dissolved organic matter and phosphorous [29,42]. During period A (water table rise), when the precipitation is relatively high and there is low evapotranspiration, the water table rose in the organic matter-rich surface horizons. The first sampling occurred during this period. On 3 November, the organic rich horizons became filled with water and remained higher than the lysimeters up to 20 May (Period B, defined as the period when the water table is fluctuating in the surface horizons), when the drawdown of the water table began (Period C). Period B was divided into two sub-periods, B1, where ferrous iron was absent in the macropores, and B2 (from 17 March to 27 May), where ferrous cations characterizing reducing conditions were present and DOC increased. At Kdown the water table oscillated four times around the depth of the lysimeters (10 cm). Its mean residence time (number of consecutive days with a water table level above the depth of the lysimeters) over the 2000–2016 period was 38 ± 63 days (from 1 to 225 days) with five periods each year and its mean return time (number of consecutive days with a water table level below the depth of the lysimeters) was 7 ± 6 days (1 to 30 days). At Kup, located higher along the slope, the average number oscillations per year around the depth of the lysimeters was lower (3) than at Kdown. Its mean residence time was 24 ± 38 days and its mean return time was 13 ± 18 da ys (from 1 to 106 days). The Guériniec transect is characterized by a steeper slope (mean slope 4.1% versus 2.5% for the Kerolland transect), which decreased the mean residence time to 5 ± 6 and 2 ± 4 days at Gdown and Gup, respectively. The mean number of oscillations of the water table per year around the depth of the lysimeters was nine at Gdown and five at Gup. The average return time was 11 ± 18 and 12 ± 19 days at Gdown and Gup, respectively (mean ± standard deviation).
Combined with the soil porosity, these precipitation and water table dynamics induced different WFPS temporal courses (Figure S1). At Kdown, WFPS increased from 92 to 100% at the beginning of period B and then remained close to 100% up to 27 May when it decreased to 90%. At Kup, WFPS was 75% at the beginning of the investigated period. It increased to 85% from January to the beginning of April and then dropped back to 70%. In addition to this general tendency, three peaks were recorded on 11 December, 20 January, and 3 March. At Gdown, WFPS increased from 79 to approximately 95% at the beginning of November, and then remained stable until mid-January, when it increased to 100%. It remained stable until early March when it decreased steadily to 73% up to the end of May. The temporal course of WFPS was similar at Gup but with lower values (from 1 to 8%, mean difference: 4%). The mean annual WFPS decreased from Kdown (99 ± 3%), to Gdown (91 ± 8%), Gup (87 ± 7%), and finally Kup (83 ± 8%).
The soil temperature followed a similar temporal course at the four stations with small absolute differences (Supplementary Figure S1). First it slowly decreased from approximately 15 °C to 8 °C up to the beginning of January. Then it dropped and remained constant up to the beginning of February at Kerolland and mid-February at Guériniec. During this period, the soil temperatures were lower in Kerolland (1.9 ± 1.0 °C) than in Guériniec (4.7 ± 0.4 °C). Then, the soil temperature increased up to the beginning of April, where it remained stable up to the end of April and returned to values of approximately 15 °C in mid-May.

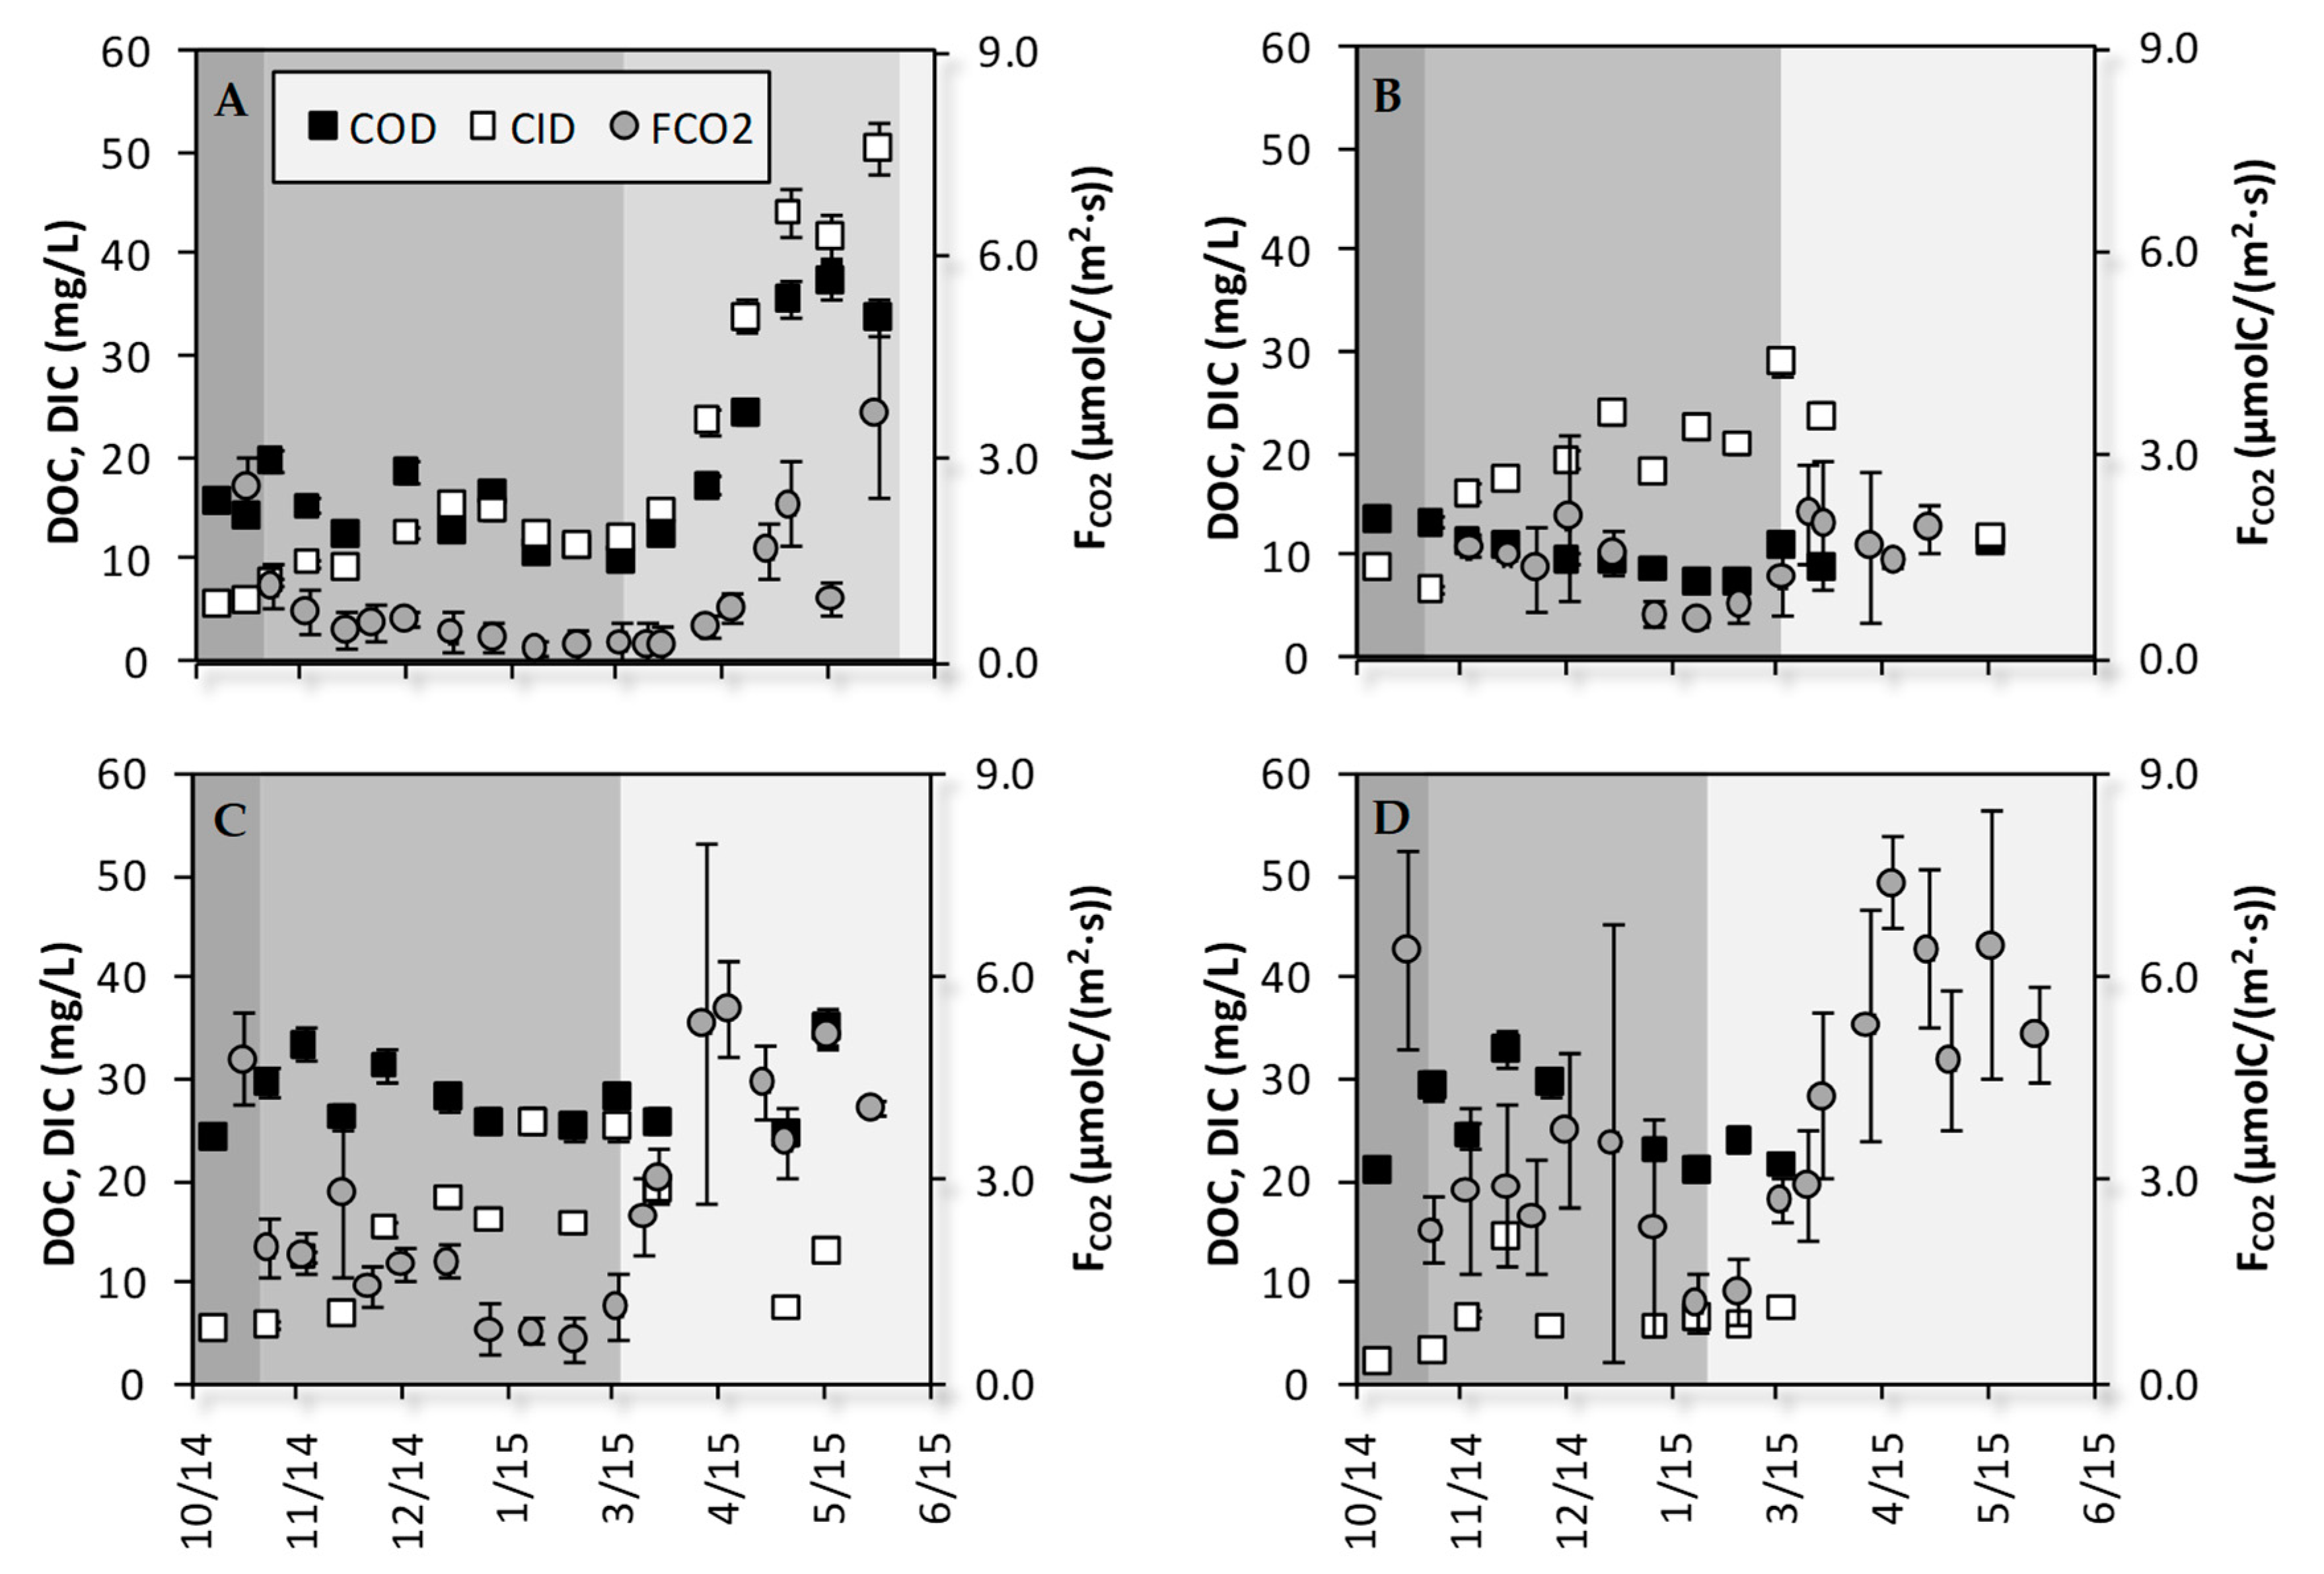
3.2. Temporal Dynamics of DIC, DOC Concentrations and FCO2

Over the sampling period, the DIC concentration was higher in transect K (18.8 ± 11.6 mg/L) than in transect G (11.1± 6.8 mg/L). Moreover, the DIC concentration was higher at Gdown (14.3 ± 6.8 mg/L) than at Gup (6.5 ± 3.5 mg/L). Three different DIC temporal evolutions can be highlighted among the four sampling stations (Figure 3, white squares). First, at Kdown, DIC increased from the end of October (5.5 mg/L) to the beginning of January (15.4 mg/L), then it decreased up to the beginning of March (12.1 mg/L) and finally it sharply increased during Period B2 up to the end of May (50.6 mg/L). A second evolution was recorded at Kup and Gdown. At these stations, DIC increased from the end of October (9.2 and 5.3 mg/L at Kup and Gdown, respectively) to the beginning of March (29.3 and 25.3 mg/L at Kup and Gdown, respectively). Then it decreased up to the end of May to return to values close to the end of October. The third temporal course was recorded at Gup, where DIC increased from the end of October (2.3 mg/L) to mid-November (6.8 mg/L) and then remained stable, ranging from 5.7 to 7.5 mg/L up to the beginning of March with the exception of 2 December with a high value of 14.7 mg/L. After 3 March, no soil solutions were sampled in the lysimeters at Gup.
Over the sampling period, the DOC concentration was higher in transect G (26.9 ± 4.0 mg/L) than in transect K (15.3 ± 8.0 mg/L). Moreover, the DOC concentration was higher at Kdown (18.8 ± 8.8 mg/L) than at Kup (10.4 ± 2.1 mg/L). At Kdown, DOC decreased from 15.8 to 10.1 mg/L during periods A and B1 with three peaks on 7 November, 22 December, and 20 January linked to precipitation events. During period B2, DOC increased from 10.1 to 37.5 mg/L. The last sampling date was still during this period as highlighted by the ferrous iron concentration (15.0 mg/L, Table S2). At Kup, DOC decreased from the end of October (13.8 mg/L) to mid-February (7.5 mg/L) and then it increased to approximately 10 mg/L. From mid-March to mid-May, no solutions were sampled in the soil macropores at this station. In mid-May, the DOC concentration was 11.5 mg/L, which is slightly lower than the initial concentration in October. The temporal variations in DOC were similar at Gdown and Gup. First, DOC increased from the end of October (24.3 and 21.1 mg/L at Gdown and Gup, respectively) to the end of November (33.4 and 32.9 mg/L at Gdown and Gup, respectively). Then it decreased up to March (Gup; 21.7 mg/L) and the end of April (Gdown; 24.6 mg/L). The DOC in the soil solutions sampled at Gdown mid-May (last sampling date at this site) increased sharply to 35.2 mg/L.
Over the sampling period, FCO2 was higher in transect G (3.4 ± 1.8 µmolC/(m2·s)) than in transect K (1.2 ± 0.8 µmolC/(m2·s)). Moreover, FCO2 was higher at Kup (1.5 ± 0.5 µmolC/(m2·s) than at Kdown (1.0 ± 1.0 µmolC/(m2·s)). Similar to DOC and DIC, FCO2 exhibited three different temporal evolutions, and similarly to DOC, Gdown and Gup grouped together. At Kdown, FCO2 was 2.6 µmolC/(m2·s) at the end of October and decreased sharply at the beginning of period B. Then it decreased slowly from 1.1 to 0.3 µmolC/(m2·s) during period B1. Finally, it increased up to 3.7 µmolC/(m2·s) during period B2. At Kup, FCO2 was recorded from mid-November up to the end of April due to agricultural constraints. It decreased from the beginning of the sampling period to the beginning of February. Then it increased to mid-March (2.1 µmolC/(m2·s)) and remained stable up to the end of April. Along the Gueriniec transect, FCO2 decreased at the end of October and then remained almost stable up to the end of January. The FCO2 values were minimal in February (0.8 and 1.3 µmolC/(m2·s) at Gdown and Gup, respectively) and then they increased from March to April up to 5.5 and 7.4 µmolC/(m2·s) at Gdown and Gup, respectively. Then, the FCO2 values fluctuated up to the end of May around these maximum values.

3.3. Correlations between DIC, DOC, FCO2, WFPS and Soil Temperature

The correlations between DIC, DOC, FCO2, Fe2+, WFPS and soil temperature were investigated using the available information in the literature about potential mechanistic relationships between these variables. The linear correlations between FCO2 and (i) WFPS and (ii) soil temperature are not described since they are better described by a parabolic WFPS function and a Q10-like temperature function (Equation (1)). The linear correlations between DOC and FCO2 are not described since this relationship is better described by an exponential DOC function (Equation (3)). FCO2 was modeled using Equation (1) over the entire period without investigation of seasonal effects. The correlations were first investigated by analyzing the four points together and then at the scale of individual sampling points. Moreover, for Kdown, periods B1 and B2 were differentiated. Pearson’s rank correlation coefficients and the p-values are summarized in Table S3 and significant correlations are illustrated in Figure S2.
When the four points were analyzed together, DOC was positively correlated with soil temperature (r = 0.32, p-value = 0.035) and Fe2+ (r = 0.35, p-value = 0.031). Fe2+ was also positively correlated with DIC (r = 0.68, p-value < 0.001) and WFPS (r = 0.34, p-value < 0.037). Moreover, WFPS was negatively correlated to soil temperature (r = −0.40, p-value < 0.001). The linear regression between ln (FCO2) and DOC showed a positive relationship (r = 0.56, p-value < 0.0001). The modeling of FCO2 was characterized by RMSE = 1.3 and the regression between the observed and modeled FCO2 resulted in a slope = 0.43 and r2 = 0.47 (p-value < 0.0001). The RMSE, slope, and r2 values obtained with Equation (1) are listed in Table 2.
At Gup, the only significant linear correlations were found between FCO2, WFPS and soil temperature. These relationships were also found at Gdown. The dependency of FCO2 on soil temperature and WFPS is better described by Equation (1) than by the linear regressions. These relationships were also found at Gdown, as well as an additional positive linear correlation between DIC and WFPS (r = 0.66, p-value = 0.02).
At Kup, DOC was negatively correlated to DIC (r = −0.68, p-value = 0.014) and DIC was positively correlated to WFPS (r = 0.68, p-value = 0.045). The modeling of FCO2 was improved by using Equation (2) with a decrease in RMSE and an increase in R2 while the slope increased from 0.55 to 0.84. However, the increase in the number of modeling parameters induced a slight increase in AICc. At Kdown, during period B1, when the riparian wetland was waterlogged with a hydrologic gradient causing the water to move into the macropores, DIC was linearly and negatively correlated with FCO2 (r = −0.75, p-value = 0.012) and soil temperature (r = −0.71, p-value = 0.022), while it was positively correlated to WFPS (r = 0.73, p-value = 0.017). Fe2+ was negatively correlated with FCO2 (r = −0.76, p-value = 0.048) and soil temperature (r = −0.93, p-value = 0.002). DOC was positively correlated with ln (FCO2) with r = 0.84 (p-value <0.005). During period B2, when this riparian wetland was waterlogged with a decrease in the water velocity due to the decrease in the hydrologic gradient, the linear correlation between DIC and FCO2 became positive (r = 0.93, p-value = 0.023). In the same period, DIC and DOC were positively correlated (r = 0.94, p-value < 0.005) and DOC was positively correlated with ln (FCO2) with r = 0.87 (p-value = 0.011). Moreover DIC, DOC and FCO2 were positively correlated with Fe2+ (r = 0.89, 0.92 and, 0.99; p-value = 0.017, < 0.01, = 0.002; respectively). FCO2 was modeled without differentiating between periods B1 and B2. The use of Equation (1) resulted in a RMSE = 0.76 and a linear regression characterized by a slope close to one (0.97) and r2 = 0.79. Using Equation (1), the sensitivity of FCO2 to the soil temperature was characterized by Q10 = 5.36.

4. Discussion

4.1. Does the DOC Concentration Control the Soil CO2 Efflux?

FCO2 was positively correlated to the DOC concentration using an exponential function when all four points were analyzed together as well as at Kdown. This is in accordance with the results of Creed et al. [41] that described, at the catchment scale, a positive correlation using an exponential function between the soil CO2 emissions and the DOC concentrations. This type of positive relationship between DOC and FCO2 has also been observed experimentally in rain simulations [43] and soil incubations [44].
The modeling of FCO2 using WFPS and soil temperature as variables resulted in fairly good correlations between the observed and modeled values with r2 ranging from 0.47 (all points) to 0.79 (Kdown). However, at Kdown, this modeling resulted in a Q10 value higher than 5. This value is 2.4 times higher than the mean Q10 calculated for poorly drained soils in this catchment [45] and 2.7 times higher than the mean Q10 calculated for Stagnosol soil under a grassland from the Rur catchment in Germany [46]. This high Q10 value and the increase in FCO2 at Kdown during the period B2 cannot only be explained by an increase in the frequency of collisions between microorganisms and substrates due to the rise in temperature. It has been suggested that abiotic factors such as flooding, drought, or adsorption to mineral surfaces that control substrate availability induced an increase in the Q10 values by modifying the activation energy [47,48]. In Kdown, during period B2, reducing conditions in the soil macropores resulted in the solubilization of increasing amounts of DOC and led to a 13-fold increase in FCO2, while the soil temperature increased by only 4 °C and WFPS remained stable. The bioreduction of iron oxides in the soil macropores, by increasing substrate accessibility [49], could be one of the processes leading to apparently high Q10 values as suggested by Davidson and Janssens [47].
As a consequence, similarly to the improvement of the modeling of soil heterotrophic respiration as a function of soil moisture by the explicit representation of the DOC biogeochemistry, i.e., its solubilization, diffusion and mineralization [17], the modelling of FCO2 may be improved by using the DOC concentration as a variable along with WFPS and soil temperature. Larger datasets combining DOC concentrations in soil solutions with FCO2, WFPS and soil temperature would be required necessary to test this assumption.

4.2. How Do the Water Table Dynamics Drive the Coupling between DIC, DOC and FCO2?

Significant differences in DIC, DOC, and FCO2 between the two topographic transects were highlighted, as well as between the upslope and downslope positions for DOC and FCO2 in transect K and for DIC in transect G. The higher FCO2 and DOC values and lower DIC values in transect G than in transect K may be the result of a combination of SOM destabilization drivers controlled by the water table dynamics. The increase in the frequency of drying/rewetting soils has been shown to increase FCO2 due to a more efficient diffusion of oxygen in the soil [50]. The decreased residence times of the water table above the investigated depth may decrease the transfer of DOC thereby causing it to accumulate [51] as well as to an increase in the likelihood of encounters between this substrate and soil heterotrophic microorganisms [15]. In this catchment, where the bedrock is composed of Brioverian shales, DIC is the by-product of DOC mineralization that accumulates in the soil solution. With slightly higher pH in the soil solutions in transect K (Table 1), the proportion of dissolved CO2 was lower at these locations, which may decrease its transfer to the gaseous phase. Moreover, increasing residence times of the water table may decrease the exchange area between the liquid and gaseous phases, which could decrease the transfer of DIC to CO2 gas. The combination of these mechanisms driving the accessibility of DOC and oxygen, as well as the transfer of DIC to the atmosphere may explain the higher DOC and FCO2 and lower DIC in transect G compared with transect K.
In transect K, FCO2 was lower at Kdown than at Kup, which could be due to the higher water content at Kdown characterized by a larger average number of days per year where the water table was above −10 cm (Table 1) and by a longer mean residence time of the water table above −10 cm. Water logging is known to decrease FCO2 and it is assumed to be due to removing the supply of oxygen from the atmosphere [19].
The soil organic carbon (SOC) content is a first order parameter driving DOC solubilization [52], which could explain the higher DOC at Kdown than at Kup. However, this seems to contradict the higher DOC concentrations at Gup-Gdown than at Kdown since SOC is higher at Kdown (Table 1). Differences in the water table dynamics between transects G and K may explain this apparent discrepancy. The solubilization of organic carbon is a chemical equilibrium. The shorter residence times and longer return times of the water table in transect G associated with WFPS values higher than 70% over the investigated period may increase the concentration of DOC before its export when the hydrologic connections are efficient through the soil porosity [51]. This could result in the higher DOC concentrations in transect G. Another assumption comes from the density of the rhizosphere. It is assumed that soil pores may be divided into micropores, where water may be retained by adhesive intermolecular forces, and macropores, where water moves freely under the effect of gravity. The proportion of micropores may be higher along transect G under grass strips than at Kdown located in a riparian area where there are trees. In that case, the connectivity between macro- and micropores could be less effective, favouring C solubilization rather than C export in solution, which could also result in higher DOC in transect G.
In transect G, DIC was lower at Gup than at Gdown. The average residence and return times of the water table during the 2000–2016 period were similar at these points but the average number of oscillations per year and the average number of days with the water table above −10 cm were lower at Gup than at Gdown. This results in lower WFPS values (Student paired t-test; p-value < 0.0001) at Gup than at Gdown. With lower WFPS values, the exchange area between the liquid and gaseous phases was large and DIC, produced by heterotrophic respiration in the soil solution, could equilibrate with CO2 gas, while with higher WFPS values, DIC could accumulate in the soil solution. This type of relationship between DIC and soil moisture has already been identified in a peatland in Germany [53] as the result of the water table dynamics.
Along topographic gradients, the differences in the water table dynamics may explain the differences in FCO2, DOC and DIC thereby highlighting its importance in the implied SOM destabilizationmechanisms.

4.3. Even if FCO2 Decreases, OM Mineralization Can Continue

DIC and WFPS were positively correlated at Kup, Kdown (period B1) and Gdown. This impact of the soil moisture dynamics on DIC production has also been identified in a German peatland [53] and was attributed to the water table dynamics. In the paper published by Estop-Aragonès et al. [53], the negative relationship between the DIC and CO2 concentrations in the soil pores is assumed to be linked to the water table. This is in accordance with the negative correlation between DIC and FCO2 found at Kdown (period B1). At Kup and Gdown, the correlations were also negative but nonsignificant. This absence of significance at Gdown and Kup could be due to the fact that (i) FCO2 is not only controlled by the DIC concentration but also by WFPS, soil temperature and DOC concentration and (ii) the number of sampling dates where soil solutions were found in the lysimeters was low when the water table drew down at these sites starting from 3 March. However, the dynamics of the DIC concentration and FCO2 emissions made sense compared to the work of Estop-Aragonés et al. [53]. At Kup and Gdown during period B1 (up to 17 February) when the water table fluctuated in the organic horizon at these sampling sites, DIC increased whereas FCO2 decreased. During period B2 (starting from 3 March), when the water table drew down at these sites, DIC decreased and FCO2 increased. As a consequence, the decreasing FCO2 may be due not only to decreasing soil heterotrophic respiration but also less DIC being transferred from the liquid phase to the gaseous phase.

4.4. Reducing Periods: A Time for Soil Heterotrophic Respiration?

From early March to the end of May, the water table was still above the soil surface at Kdown but drew down at Kup leading to a decrease in the hydrologic gradient and then to a decrease in the water velocity at Kdown. These hydrological conditions prevented the renewal of dissolved oxygen and induced the use of other electron acceptors (nitrate, manganese oxides, iron oxides, sulfates). The increase in the Fe2+ concentration at Kdown from March to May in the soil solutions sampled with zero-tension lysimeters highlights that reducing conditions causing the bioreduction of iron oxides occurred in the soil macropores. This is not the first time this kind of reducing condition is described in wetlands [26,27,29]. Similar to previous studies, this period was characterized by a large increase in the DOC concentration from 10 to 38 mg/L. In a nearby wetland located 160 m from Kdown, the recorded increase in the DOC concentration during the 2010–2011 hydrological year was similar (from 12 to 37 mg/L in [26]). It has been suggested that this increase in DOC was due to a combination of (i) the dissolution of iron oxides, leading to the solubilization of previously adsorbed OM and (ii) an increase in pH, leading to a higher surface charge of OM, improving its solubilization [25].
The onset of reducing conditions induced a shift in the sign of the correlation between DOC and DIC in the soil solutions at Kdown. The increase in DOC was highly and positively correlated to the DIC increase. Using the catalytic oxidation combustion methodology, DIC is a combination of dissolved carbonic acid, bicarbonate acid and carbonate acid; their relative proportion is driven by the pH of the soil solution. It comes from the solubilization of CO2. The production of CO2 in reducing conditions has been reported during soil incubation experiments [54]. In the present study, the increase in DIC was concomitant to the increase in Fe2+. The bioreduction of iron oxides has been identified as the main pathway of OM mineralization in anoxic sediments [55] and in a freshwater wetland [56].
This reducing period was also characterized by a 12-fold increase in FCO2. The positive correlation between DOC and FCO2 was already highlighted in experiments carried out in reducing conditions due to flooding [57]. When the reducing period was longer, the DOC and CO2 productions were higher. In an experiment designed to separate the effects of flooding and anaerobiosis on the biogeochemistry of redox sensitive elements, McNicol and Silver [58] assumed that these increases were due to modifications in the bioavailability of nutrients. Moreover, the OM consumed in such reducing conditions is assumed to come from the dissolution of iron oxides [59].
During reducing conditions, the use of Fe3+ as an electron acceptor resulted in the dissolution of iron oxides and to the solubilization of previously adsorbed OM. At the same time, OM is oxidized into inorganic carbon. This mechanism occurred during a decrease in the hydrological gradient and therefore the water velocity was low. These conditions increased the likelihood of encounters between substrate and heterotrophic microorganisms [15], which resulted in increasing Fe2+ and DIC concentrations and FCO2. Consequently, although WFPS was at its maximum given that the water table was above the soil surface, SOM mineralization may occur during reducing periods in wetlands. This result seems to contradict the importance of anaerobic conditions in soil microsites for SOM preservation [60]. This apparent contradiction could be due to the experimental design used by Keiluweit et al. [60], where reducing conditions in soil microsites were created by changing the soil granulometry. In these experiments the mineralization decreased by 37% from coarse to fine soil structures. When the results of Keiluweit et al. and the present data are considered together, it can be assumed that when the redox front moved from the microsites to the soil macropores, reducing conditions may switch from SOM preservation to SOM vulnerability.

5. Conclusions

The investigation of C losses due to SOM destabilization along soil wetness transects was used to highlight the key-role of water table dynamics in the coupling between DIC, DOC and FCO2.
Under the generic term of water table dynamics, three parameters are highly important: residence time, return time and water velocity. Since these parameters changed along the topography, the investigation of the couplings between DIC, DOC and FCO2 provide information about the mechanisms implied in SOM destabilization. The residence and return times quantify the water table oscillations at the investigated depth. When the water table is below this depth, water remains immobile in the soil pores. Oxygen can diffuse into the soil and soil solution, DOC may accumulate and diffuse into the soil pores, the likelihood of encounters between the substrate and heterotrophic microorganisms may increase resulting in high DIC and, if the return time is long enough, high FCO2. When the water table is above the investigated depth, water moves freely implying diffusion and advection. DOC decreased when the residence time was long enough, highlighting that carbon solubilization is more of a limiting process than carbon export. The reduction of the exchange area between the liquid phase and gaseous phase may favor the export of DIC with regard to the export of FCO2.
Decreasing the water velocity in waterlogged conditions favors the occurrence of reducing conditions in the soil macropores, which results in increasing (i) DOC concentrations by previously adsorbed SOM solubilization, (ii) DIC concentrations by DOM mineralization and (iii) soil CO2 emissions (FCO2) through the equilibrium between the liquid phase and gaseous phase. Consequently, increasing WFPS may result in a decrease in soil CO2 emissions but organic matter biodegradation could continue. Reducing conditions, when they occur in soil macropores in riparian wetlands, increased the availability of the substrate. Consequently, the Q10 value could be misinterpreted. This period of reducing conditions could be considered as a hot moment for SOM mineralization.
In order to determine how riparian areas of soil will respond to modified precipitation patterns within the context of global changes, it is important to investigate how the water table dynamics drive the mechanisms of SOC destabilization. In particular, the oxygen diffusion, DOC solubilization and transfer, DOC mineralization, and DIC-CO2 gas equilibrium mechanisms are of primary importance.

Supplementary Materials

The following materials are available online at https://www.mdpi.com/2571-8789/4/1/2/s1, Figure S1: (A) Temporal variations of WFPS and (B) soil temperature during the 2014–2015 hydrological year, Figure S2: Graphic representation of the significant correlations between DIC, DOC, FCO2, Fe2+, WFPS and Soil temperature highlighted in Table S3, Table S1: Daily rain and water table depth data at Kdown, Kup, Gdown and Gup, Table S2: DOC, DIC, Fe2+, CO2 (mean ± SD), WFPS and soil temperature data, Table S3: Pearson’s rank correlation coefficients and p-values between DOC, DIC, Fe2+, FCO2, WFPS and soil temperature.

Author Contributions

L.J., A.J., V.V., C.F. and G.G. designed the sampling strategy; L.J., P.B., M.D. and P.P. performed the sampling campaigns; P.B. analyzed the soil CO2 fluxes, while M.D. and P.P. analyzed the composition of the soil solutions. L.J., P.B. and V.V. analyzed the data and wrote the paper that was improved by comments from G.G., A.J. and C.F. All authors have read and agreed to the published version of the manuscript.

Funding

This research was funded by the National Research Agency (France) within the MOSAIC project (ANR-12-AGRO-0005).

Acknowledgments

This research was funded by the National Research Agency (France) within the MOSAIC project (ANR- 12-AGRO-0005). The French Ministry of Higher Education, Research and Innovation funded Marie DENIS’ PhD grant. The investigations received support from INRA and CNRS for the Research Observatory ORE AgrHys, and from Allenvi for the IR OZCAR. The data are available at http://geowww.agrocampus-ouest.fr/web/. Moreover, the authors thank the three anonymous reviewers whose comments helped to improve this manuscript. The English content of this work was edited by S. Mullin.

Conflicts of Interest

The authors declare no conflict of interest.

References

  1. Batjes, N.H. Total carbon and nitrogen in the soils of the world. Eur. J. Soil Sci. 1996, 47, 151–163. [Google Scholar] [CrossRef]
  2. Lehmann, J.; Kleber, M. The contentious nature of soil organic matter. Nature 2015, 528, 60–68. [Google Scholar] [CrossRef] [PubMed]
  3. Schmidt, M.W.I.; Torn, M.S.; Abiven, S.; Dittmar, T.; Guggenberger, G.; Janssens, I.A.; Kleber, M.; Kogel-Knabner, I.; Lehmann, J.; Manning, D.A.C.; et al. Persistence of soil organic matter as an ecosystem property. Nature 2011, 478, 49–56. [Google Scholar] [CrossRef] [PubMed] [Green Version]
  4. Sollins, P.; Homann, P.; Caldwell, B.A. Stabilization and destabilization of soil organic matter: Mechanisms and controls. Geoderma 1996, 74, 65–105. [Google Scholar] [CrossRef]
  5. Mayes, M.A.; Lajtha, K.; Bailey, V. Advancing soil carbon cycle science. EOS 2016, 97. [Google Scholar] [CrossRef]
  6. Kindler, R.; Siemens, J.; Kaiser, K.; Walmsley, D.; Bernhofer, C.; Buchmann, N.; Cellier, P.; Eugster, W.; Gleixner, G.; Grünwald, T.; et al. Dissolved carbon leaching from soil is a crucial component of the net ecosystem carbon balance. Glob. Chang. Biol. 2011, 17, 1167–1185. [Google Scholar] [CrossRef] [Green Version]
  7. Raich, J.W.; Schlesinger, W.H. The global carbon dioxide flux in soil respiration and its relationship to vegetation and climate. Tellus B Chem. Phys. Meteorol. 1992, 44, 81–99. [Google Scholar] [CrossRef] [Green Version]
  8. Thompson, J.A.; Kolka, R.K. Soil carbon storage estimation in a forested watershed using quantitative soil-landscape modeling. Soil Sci. Soc. Am. J. 2005, 69, 1086–1093. [Google Scholar] [CrossRef] [Green Version]
  9. Wang, X.; Cammeraat, E.L.H.; Romeijn, P.; Kalbitz, K. Soil organic carbon redistribution by water erosion—The role of CO2 emissions for the carbon budget. PLoS ONE 2014, 9, e96299. [Google Scholar] [CrossRef]
  10. Brewer, R. Fabric and Mineral Analysis of Soils; John Wiley & Sons: New York, NY, USA, 1964. [Google Scholar]
  11. Fahey, T.J.; Siccama, T.G.; Driscoll, C.T.; Likens, G.E.; Campbell, J.; Johnson, C.E.; Battles, J.J.; Aber, J.D.; Cole, J.J.; Fisk, M.C.; et al. The biogeochemistry of carbon at hubbard brook. Biogeochemistry 2005, 75, 109–176. [Google Scholar] [CrossRef]
  12. Neff, J.C.; Asner, G.P. Dissolved organic carbon in terrestrial ecosystems: Synthesis and a model. Ecosystems 2001, 4, 29–48. [Google Scholar] [CrossRef] [Green Version]
  13. Humbert, G.; Jaffrezic, A.; Fovet, O.; Gruau, G.; Durand, P. Dry-season length and runoff control annual variability in stream DOC dynamics in a small, shallow-groundwater-dominated agricultural watershed. Water Resour. Res. 2015, 51, 7860–7877. [Google Scholar] [CrossRef] [Green Version]
  14. Denis, M.; Jeanneau, L.; Petitjean, P.; Murzeau, A.; Liotaud, M.; Yonnet, L.; Gruau, G. New molecular evidence for surface and sub-surface soil erosion controls on the composition of stream DOM during storm events. Biogeosciences 2017, 14, 5039–5051. [Google Scholar] [CrossRef] [Green Version]
  15. Dungait, J.A.J.; Hopkins, D.W.; Gregory, A.S.; Whitmore, A.P. Soil organic matter turnover is governed by accessibility not recalcitrance. Glob. Chang. Biol. 2012, 18, 1781–1796. [Google Scholar] [CrossRef]
  16. Luo, Y.; Zhou, X. (Eds.) Soil Respiration and the Environment; Academic Press: London, UK, 2006; ISBN 978-0-12-088782-8. [Google Scholar]
  17. Yan, Z.; Bond-Lamberty, B.; Todd-Brown, K.E.; Bailey, V.L.; Li, S.; Liu, C.; Liu, C. A moisture function of soil heterotrophic respiration that incorporates microscale processes. Nat. Commun. 2018, 9, 2562. [Google Scholar] [CrossRef] [PubMed]
  18. Fang, C.; Moncrieff, J.B. A model for soil CO2 production and transport 1: Model development. Agric. For. Meteorol. 1999, 95, 225–236. [Google Scholar] [CrossRef]
  19. Moyano, F.E.; Manzoni, S.; Chenu, C. Responses of soil heterotrophic respiration to moisture availability: An exploration of processes and models. Soil Biol. Biochem. 2013, 59, 72–85. [Google Scholar] [CrossRef]
  20. Langmuir, D. Aqueous Environmental Geochemistry; Prentice Hall: Upper Saddle River, NJ, USA, 1997. [Google Scholar]
  21. Stumm, W.; Morgan, J.J. Aquatic Chemistry: Chemical Equilibria and Rates in Natural Waters, 3rd ed.; Wiley: New York, NY, USA, 2012. [Google Scholar]
  22. Chapin, F.S.; Woodwell, G.M.; Randerson, J.T.; Rastetter, E.B.; Lovett, G.M.; Baldocchi, D.D.; Clark, D.A.; Harmon, M.E.; Schimel, D.S.; Valentini, R.; et al. reconciling carbon-cycle concepts, terminology, and methods. Ecosystems 2006, 9, 1041–1050. [Google Scholar] [CrossRef] [Green Version]
  23. Lovley, D.R. Organic matter mineralization with the reduction of ferric iron: A review. Geomicrobiol. J. 1987, 5, 375–399. [Google Scholar] [CrossRef]
  24. Weber, K.A.; Achenbach, L.A.; Coates, J.D. Microorganisms pumping iron: Anaerobic microbial iron oxidation and reduction. Nat. Rev. Microbiol. 2006, 4, 752. [Google Scholar] [CrossRef] [Green Version]
  25. Grybos, M.; Davranche, M.; Gruau, G.; Petitjean, P.; Pédrot, M. Increasing pH drives organic matter solubilization from wetland soils under reducing conditions. Geoderma 2009, 154, 13–19. [Google Scholar] [CrossRef]
  26. Lambert, T.; Pierson-Wickmann, A.-C.; Gruau, G.; Jaffrezic, A.; Petitjean, P.; Thibault, J.-N.; Jeanneau, L. Hydrologically driven seasonal changes in the sources and production mechanisms of dissolved organic carbon in a small lowland catchment. Water Resour. Res. 2013, 49, 1–12. [Google Scholar] [CrossRef] [Green Version]
  27. Knorr, K.-H. DOC-dynamics in a small headwater catchment as driven by redox fluctuations and hydrological flow paths-are DOC exports mediated by iron reduction/oxidation cycles? Biogeosciences 2013, 10, 891–904. [Google Scholar] [CrossRef] [Green Version]
  28. Dupas, R.; Gruau, G.; Gu, S.; Humbert, G.; Jaffrézic, A.; Gascuel-Odoux, C. Groundwater control of biogeochemical processes causing phosphorus release from riparian wetlands. Water Res. 2015, 84, 307–314. [Google Scholar] [CrossRef] [PubMed]
  29. Jeanneau, L.; Jaffrezic, A.; Pierson-Wickmann, A.-C.; Gruau, G.; Lambert, T.; Petitjean, P. Constraints on the sources and production mechanisms of dissolved organic matter in soils from molecular biomarkers. Vadose Zone J. 2014, 13. [Google Scholar] [CrossRef]
  30. Lambert, T.; Pierson-Wickmann, A.-C.; Gruau, G.; Jaffrezic, A.; Petitjean, P.; Thibault, J.N.; Jeanneau, L. DOC sources and DOC transport pathways in a small headwater catchment as revealed by carbon isotope fluctuation during storm events. Biogeosciences 2014, 11, 3043–3056. [Google Scholar] [CrossRef] [Green Version]
  31. Lambert, T.; Pierson-Wickmann, A.-C.; Gruau, G.; Thibault, J.-N.; Jaffrezic, A. Carbon isotopes as tracers of dissolved organic carbon sources and water pathways in headwater catchments. J. Hydrol. 2011, 402, 228–238. [Google Scholar] [CrossRef]
  32. Denis, M.; Jeanneau, L.; Pierson-Wickman, A.-C.; Humbert, G.; Petitjean, P.; Jaffrézic, A.; Gruau, G. A comparative study on the pore-size and filter type effect on the molecular composition of soil and stream dissolved organic matter. Org. Geochem. 2017, 110, 36–44. [Google Scholar] [CrossRef] [Green Version]
  33. Jeanneau, L.; Denis, M.; Pierson-Wickmann, A.-C.; Gruau, G.; Lambert, T.; Petitjean, P. Sources of dissolved organic matter during storm and inter-storm conditions in a lowland headwater catchment: Constraints from high-frequency molecular data. Biogeosciences 2015, 12, 4333–4343. [Google Scholar] [CrossRef] [Green Version]
  34. Morel, B.; Durand, P.; Jaffrezic, A.; Gruau, G.; Molenat, J. Sources of dissolved organic carbon during stormflow in a headwater agricultural catchment. Hydrol. Process. 2009, 23, 2888–2901. [Google Scholar] [CrossRef]
  35. Fovet, O. ORE AgrHys. Vadose Zone J. 2018. [Google Scholar] [CrossRef] [Green Version]
  36. Gaillardet, J. RI OZCAR. Vadose Zone J. 2018. [Google Scholar] [CrossRef] [Green Version]
  37. IUSS Working Group WRB World Reference base for Soil Resources; FAO: Rome, Italy, 2006.
  38. Clark, J.M.; Ashley, D.; Wagner, M.; Chapman, P.J.; Lane, S.N.; Evans, C.D.; Heathwaite, A.L. Increased temperature sensitivity of net DOC production from ombrotrophic peat due to water table draw-down. Glob. Chang. Biol. 2009, 15, 794–807. [Google Scholar] [CrossRef]
  39. Christ, M.J.; David, M.B. Temperature and moisture effects on the production of dissolved organic carbon in a Spodosol. Soil Biol. Biochem. 1996, 28, 1191–1199. [Google Scholar] [CrossRef]
  40. Kätterer, T.; Reichstein, M.; Andrén, O.; Lomander, A. Temperature dependence of organic matter decomposition: A critical review using literature data analyzed with different models. Biol. Fertil. Soils 1998, 27, 258–262. [Google Scholar] [CrossRef]
  41. Creed, I.F.; Webster, K.L.; Braun, G.L.; Bourbonnière, R.A.; Beall, F.D. Topographically regulated traps of dissolved organic carbon create hotspots of soil carbon dioxide efflux in forests. Biogeochemistry 2013, 112, 149–164. [Google Scholar] [CrossRef]
  42. Gu, S.; Gruau, G.; Dupas, R.; Rumpel, C.; Crème, A.; Fovet, O.; Gascuel-Odoux, C.; Jeanneau, L.; Humbert, G.; Petitjean, P. Release of dissolved phosphorus from riparian wetlands: Evidence for complex interactions among hydroclimate variability, topography and soil properties. Sci. Total Environ. 2017, 598, 421–431. [Google Scholar] [CrossRef]
  43. Deng, Q.; Hui, D.; Chu, G.; Han, X.; Zhang, Q. Rain-induced changes in soil CO2 flux and microbial community composition in a tropical forest of China. Sci. Rep. 2017, 7, 5539. [Google Scholar] [CrossRef] [Green Version]
  44. Chow, A.T.; Tanji, K.K.; Gao, S.; Dahlgren, R.A. Temperature, water content and wet–dry cycle effects on DOC production and carbon mineralization in agricultural peat soils. Soil Biol. Biochem. 2006, 38, 477–488. [Google Scholar] [CrossRef]
  45. Buysse, P.; Flechard, C.R.; Hamon, Y.; Viaud, V. Impacts of water regime and land-use on soil CO2 efflux in a small temperate agricultural catchment. Biogeochemistry 2016, 130, 267–288. [Google Scholar] [CrossRef]
  46. Meyer, N.; Welp, G.; Amelung, W. The temperature sensitivity (q10) of soil respiration: Controlling factors and spatial prediction at regional scale based on environmental soil classes. Glob. Biogeochem. Cycles 2018, 32, 306–323. [Google Scholar] [CrossRef]
  47. Davidson, E.A.; Janssens, I.A. Temperature sensitivity of soil carbon decomposition and feedbacks to climate change. Nature 2006, 440, 165. [Google Scholar] [CrossRef] [PubMed]
  48. Davidson, E.A.; Janssens, I.A.; Luo, Y. On the variability of respiration in terrestrial ecosystems: Moving beyond Q10. Glob. Chang. Biol. 2005, 12, 154–164. [Google Scholar] [CrossRef]
  49. Ruamps, L.S.; Nunan, N.; Pouteau, V.; Leloup, J.; Raynaud, X.; Roy, V.; Chenu, C. Regulation of soil organic C mineralisation at the pore scale. FEMS Microbiol. Ecol. 2013, 86, 26–35. [Google Scholar] [CrossRef] [PubMed]
  50. Fierer, N.; Schimel, J.P. Effects of drying–rewetting frequency on soil carbon and nitrogen transformations. Soil Biol. Biochem. 2002, 34, 777–787. [Google Scholar] [CrossRef]
  51. Worrall, F.; Gibson, H.S.; Burt, T.P. Production vs. solubility in controlling runoff of DOC from peat soils—The use of an event analysis. J. Hydrol. 2008, 358, 84–95. [Google Scholar] [CrossRef]
  52. Kalbitz, K.; Solinger, S.; Park, J.-H.; Michalzik, B.; Matzner, E. Controls on the Dynamics of Dissolved Organic Matter in Soils: A Review. Soil Sci. 2000, 165, 277–304. [Google Scholar] [CrossRef]
  53. Estop-Aragonés, C.; Knorr, K.-H.; Blodau, C. Controls on in situ oxygen and dissolved inorganic carbon dynamics in peats of a temperate fen. J. Geophys. Res. Biogeosciences 2012, 117. [Google Scholar] [CrossRef]
  54. Tété, E.; Viaud, V.; Walter, C. Organic carbon and nitrogen mineralization in a poorly-drained mineral soil under transient waterlogged conditions: An incubation experiment. Eur. J. Soil Sci. 2015, 66, 427–437. [Google Scholar] [CrossRef] [Green Version]
  55. Thomsen, U.; Thamdrup, B.; Stahl, D.A.; Canfield, D.E. Pathways of organic carbon oxidation in a deep lacustrine sediment, Lake Michigan. Limnol. Oceanogr. 2004, 49, 2046–2057. [Google Scholar] [CrossRef]
  56. Roden, E.E.; Wetzel, R.G. Organic carbon oxidation and suppression of methane production by microbial Fe(III) oxide reduction in vegetated and unvegetated freshwater wetland sediments. Limnol. Oceanogr. 1996, 41, 1733–1748. [Google Scholar] [CrossRef] [Green Version]
  57. De-Campos, A.B.; Huang, C.; Johnston, C.T. Biogeochemistry of terrestrial soils as influenced by short-term flooding. Biogeochemistry 2012, 111, 239–252. [Google Scholar] [CrossRef]
  58. McNicol, G.; Silver, W.L. Separate effects of flooding and anaerobiosis on soil greenhouse gas emissions and redox sensitive biogeochemistry. J. Geophys. Res. Biogeosciences 2014, 119, 557–566. [Google Scholar] [CrossRef] [Green Version]
  59. Huang, W.; Hall, S.J. Elevated moisture stimulates carbon loss from mineral soils by releasing protected organic matter. Nat. Commun. 2017, 8, 1774. [Google Scholar] [CrossRef]
  60. Keiluweit, M.; Wanzek, T.; Kleber, M.; Nico, P.; Fendorf, S. Anaerobic microsites have an unaccounted role in soil carbon stabilization. Nat. Commun. 2017, 8, 1771. [Google Scholar] [CrossRef]
Figure 1. (A). Location of the Kervidy-Naizin catchment (AgrHys Critical Zone Observatory). The gray areas located along the stream on the map represent the maximum extent of the riparian wetlands. (B). Location of the sampling points along the altitudinal transects K and G and the water table level (median, max, min, q25, and q75 calculated using 15 years of data) monitored with deep piezometers (vertical black lines).
Soilsystems 04 00002 g001
Figure 2. Daily rain (secondary Y axes) and temporal variations in the water table depth at Kdown (thick solid line), Kup (thin solid line), Gdown (thick dashed line) and Gup (thin dashed line) during the hydrological year 2014–2015. The sampling dates are illustrated by crosses and the sampling depth by the horizontal dotted line at −0.1 m, which is the depth at which the soil solutions were sampled.
Soilsystems 04 00002 g002
Figure 3. Temporal variations of DIC (white square), DOC (black square) and FCO2 (gray circles) in Kdown (A), Kup (B), Gdown (C) and Gup (D) during the hydrological year 2014–2015. The gray scale in the background indicates the succession of the hydrological phases: A, B1, B2, C for Kdown, and A, B, C for Kup, Gdown and Gup. The uncertainties for FCO2 are the standard deviations of the three sampling replicates. The uncertainties for DIC and DOC are the analytical reproducibility.
Soilsystems 04 00002 g003
Table 1. Land-use and soil characteristics of the studied sites in both transects.
KdownKupGdownGup
Land-useRiparian areaCropland (maize) aGrass stripGrass strip
Soil type (WRB 2006)Haplic AlbeluvisolCambisolHaplic AlbeluvisolHaplic Albeluvisol
Clay-Silt-Sand (%)29–60–1121–69–1024–60–1623–61–16
Soil bulk density (g cm−3)1.22 ± 0.161.30 ± 0.07NA1.14 ± 0.04
(mean ± s. d.)
Drainage classbGWDGPD
Number of days where the water table was above a soil depth of 10 cmc181803911
Corg (g kg−1)60.218.837.623.7
Ntotal (g kg−1)4.661.743.382.3
C:N ratio12.910.811.110.3
pH of soil solutionsd6.9 ± 0.3 *7.0 ± 0.3 *6.6 ± 0.3 **6.6 ± 0.4 **
Fe total (g 100 g−1 soil)0.7710.6030.4530.491
a Maize residues were left on the ground after the harvest on 30 October 2014. b WD: well-drained, PD: poorly-drained, G: very poorly-drained. c Average of 15 years of data (2000–2015). d The soil solutions were sampled in the soil macropores. The values reported for the hydrologic year 2014–2015 are the average values with the standard deviation. * and ** correspond to significant differences between the points (Student’s t-test). WBR 2006: World reference base for soil resources 2006. World Soil Resources Reports No. 103. FAO, Rome.
Table 2. Results of the modeling of FCO2 using Equation (1) with WFPS and soil temperature as variables.
R2SlopeRMSEQ10abN
All points0.470.441.32.06 ± 0.470.00130.14571
Kdown0.790.970.765.36 ± 2.900.00130.14219
Kup0.630.550.311.87 ± 0.350.00020.03714
Gdown0.730.651.482.32 ± 0.970.00130.15119
Gup0.720.681.013.14 ± 1.040.00090.12219
NB: Given the small dataset, the values of constants a and b must be considered carefully.

