Article

Effect of Biochar on TDR-Based Volumetric Soil Moisture Measurements in a Loamy Sand Podzolic Soil

by
Dinushika Wanniarachchi
,
Mumtaz Cheema
,
Raymond Thomas
and
Lakshman Galagedara
*
School of Science and the Environment, Memorial University of Newfoundland, Corner Brook, NL A2H 5G4, Canada
*
Author to whom correspondence should be addressed.
Soil Syst. 2019, 3(3), 49; https://doi.org/10.3390/soilsystems3030049
Submission received: 20 June 2019 / Revised: 27 July 2019 / Accepted: 30 July 2019 / Published: 5 August 2019

Abstract

:
Considering the increased interests in biochar (BC) as a soil amendment and a growing media substrate in agriculture, we evaluated the effect of BC incorporation on TDR (time-domain reflectometer)-based volumetric soil moisture content (VSMC) estimations in a loamy sand podzolic soil. Two commercial BC types (powdered—BCP, and granular—BCG) were mixed in different rates (w/w) with a podzolic soil. The dielectric constants measured using a TDR cable tester (MOHR CT 100) were converted to VSMC. Three commonly used models: (i) Topp’s equation, M-1; (ii) mixing model, M-2; and (iii) the forest soil model, M-3, were used. The accuracy of the estimated VSMC using these three models was statistically compared with measured VSMC. BCP at lower rates produced very similar results to the actual VSMC with M-1 and M-2 but deviated with increasing rates. The M-3 showed a non-linear relationship with measured VSMC. In BCG treatments, all models overestimated the VSMC. BCG rates higher than 15% (w/w) resulted in highly attenuated TDR waveforms and the signal was completely dissipated when rates higher than 50% (w/w) were used (typical application for field soils is less than 5% w/w). These results showed that predictions of the soil moisture content based on the soil dielectric constant might not be feasible for tested podzolic soils amended at high BC rates.

1. Introduction

Among the techniques used in measuring volumetric soil moisture content (VSMC), time domain reflectometry (TDR) is the most widely used method in agriculture, forestry, hydrology, and allied disciplines. The TDR technique has rapidly become a method of choice for field research as it offers accurate results (usually within 2% of the VSMC). Furthermore, the ability to obtain real-time repeated measurements with minimal efforts and that it does not pose the radiation hazards associated with neutron probe or gamma-ray attenuation methods also adds to the popularity and widespread use of this method [1]. Automating TDR measurements using multiplexers and data storage devices [2] allows continuous spatial and temporal monitoring of VSMC. For instance, studies on water movement and solute transport [3] or plant water availability can be achieved [4]. In addition, TDR can be used to monitor water levels [5], the position of advancing frost levels in freezing soils [6], and the water table in the subsurface of contaminated lands [7].
The TDR technique is based on the travel time analysis of electromagnetic (EM) wave propagation in a metallic waveguide of a known length inserted into the soil. The EM frequencies range from 1 MHz to 1 GHz at a speed of 30 cm ns−1. The soil is a complex system having solid, liquid, and air components. However, water has a much higher dielectric constant, Kw (81 at 20 °C), than both the solid (2–7) fraction, Ks, which is composed of mineral and organic soil particles, and the air (1) fraction, Ka [8,9,10,11]. Therefore, water has the highest influence on the dielectric constant of bulk soil, Kb, of the soil, and it is possible to estimate the VSMC of a given soil sample from estimates of its Kb [8,9,10,11]. The EM wave propagation time increases (low EM velocity) with increasing soil moisture content [12,13] and TDR provides the average VSMC over the probe length for a certain radius immediately around the probe [11,14].
TDR measurements can be converted to VSMC using different calibration models, including empirical calibrations and multiphase mixing models [8,10,15,16,17,18]. Empirical models that relate VSMC and soil Kb were found to be useful for the determination of TDR calibration curves [19,20]. Several adjusted models for specific conditions, such as variable soil electrical conductivity (EC), amount of clay, quartz, or organic matter (OM) content and peat, have also been evaluated [21,22,23,24]. Nevertheless, while TDR technology is extensively employed, research on the influence of non-uniform soil properties on its measurement accuracy is very limited [11,25].
Biochar (BC) is a carbonaceous porous material obtained by pyrolysis using various biomass sources. It shows immense potential in improving soil properties and fertility. Amending soil with BC has also been recognized as a possible method to address issues related to atmospheric carbon increase, global warming, and food insecurity [26]. Extensive studies have been conducted to investigate the utilization of BC as a soil amendment to improve soil physical properties [27,28,29,30]. Despite the number of studies dealing with BC’s role in soil fertility, the mechanisms of its action in the environment are still poorly understood. Considering the BC’s porous structure, the incorporation of BC in agricultural soils can change the soil’s physical properties, such as porosity, pore size distribution, and bulk density (BD) [31], consequently altering the soil’s hydraulic properties, such as soil water retention and permeability [32]. It is important to note that the physicochemical properties, EC, and electrostatic properties, and thus water repellency [33], of BC vary with the feedstock, pyrolysis temperature, and holding time [31].
The application of BC to agricultural soils or to soil-based or non-soil-based growing media (such as coir or compost) requires further understanding of its effects on the physiochemical properties of the soil or the media. One important step towards understanding these effects would be to develop accurate methods for the measurement of VSMC in BC-amended soils. Even though the TDR technique is widely used to measure the VSMC of mineral soils, based on our understanding, the effect of BC amendments on the accuracy of VSMC estimation models using the TDR method has not been evaluated extensively. A study by Dettmann and Bechtold [25] reported that a commercially available TDR probe (TRIME—PICO64) increased the accuracy of Kb estimation with a new calibration (RMSE = 3.55) from the manufacturer’s calibration (RMSE = 18.73) under mineral to peat soil conditions. Although Kameyama et al. [34] used the TDR for monitoring VSMC and water availability for plants in BC-amended soils, they did not necessarily offer any evidence for a thorough evaluation of dielectric-based calibration equations for BC-amended soils. Therefore, the objective of this study was to determine the effects of BC incorporation on the uncertainty of TDR-based VSMC estimations. We hypothesized that the incorporation of BC affects the measurements of Kb as obtained with TDR. The study evaluated three existing calibration models that link VSMC and the Kb obtained from TDR, and the applicability of these models for agriculturally important BC-amended soils. Such clarification is paramount to the further applicability of these models, which in turn can save time and efforts required to determine a complete TDR calibration curve.

2. Materials and Methods

2.1. Soil

Soil samples were obtained randomly at a 0 to 20 cm soil depth from an experimental silage corn (Zea mays L.) field located at Pynn’s Brook Research Station (PBRS), Department of Fisheries and Land Resources, Government of Newfoundland and Labrador, Pasadena (49°04’22.6“ N; 57°33’38.9“ W), Canada. The samples were air-dried for 72 h, sieved (<2 mm), and thoroughly mixed by hand. According to the Canadian soil taxonomy, the texture of the soil was gravelly loamy sand having 82.0 ± 3.4% sand, 11.6 ± 2.4% silt, and 6.4 ± 1.2% clay [35].

2.2. Preparation of BC: Soil Mixtures

We used two different BC types, i.e., powdered (BCP) and granular (BCG) obtained from two commercial suppliers (BCP—ABRI Tech Inc., Quebec, Canada and BCG—Air Terra Inc., Alberta, Canada) and their basic properties are given in Table 1. The two different BC were mixed with soils separately at rates (w/w) of 0% (only soil), 1%, 5%, 10%, 15%, 20%, 40%, 50%, and 100% (only BC) w/w by air dry mass (moisture factor of air dried samples was used to calculate the oven dry masses). Soils without BC (0%) acted as the control, resulting in a total of 16 treatments (2 BC types × 8 different BC incorporation rates). The BC incorporation rates were equivalent to approximately 0, 131, 262, 393, 524, 1048, 1310, and 2620 Mg ha−1, respectively, at a depth of 0 to 20 cm and for a BD of 1.31 g cm−3 [35]. Often, BC application experiments have been conducted for a wide range of application rates; for instance, 1 to 135 Mg ha−1 in pot and field experiments, as a soil amendment [36], 0% to 50% w/w in greenhouse experiments [37], and 10% to 100% v/v in growing media experiments as a substrate for soil-free nursery plants and a substitute for peat [38,39]. It is important to note that when using field application of BC, it becomes a smaller percentage (w/w) in shallower soils (0–5 cm) than deeper soils (10–20 cm) since the BD of soil increases with depth. Even though the studied rates were comparatively higher than the actual field application of BC rates, we aimed to evaluate the full range of BC mixing rates in this laboratory experiment by giving special attention to the use of BC in the horticultural industry.
The BD of the mixtures of soil and BC was calculated as in Equation (1)
ρ b =   100 [ ( x ρ 1   ) +   ( 100 x ρ 2   ) ] ,
where ρb, ρ1, and ρ2 are the bulk densities (g cm−3) of the BC:soil mixtures, BC only, and soil only, respectively and x is the BC rate (%) by weight [40].
The bulk densities of 0.75 g cm−3 for powdered BC, 0.20 g cm−3 for granular BC, and 1.25 g cm−3 for the tested mineral soil were used for calculation. Each of the BC:soil mixture and the soil was packed (based on the bulk densities above) into 750 mL plastic containers (approximately 13.2 cm height, 10.6 cm top diameter, 8.0 cm bottom diameter) with drainage holes in the bottom. The packing process was consistent and added approximately 25 to 35 g of BC:soil mixture for every packing segment. After each addition of the mixture, the container was tapped down four times to achieve the desired BD. Following the packing, the samples were saturated by keeping the containers in a water tub and gradually raising water levels through the bottom holes via capillarity. This process helped to reach full saturation with minimum air trapped in each sample.

2.3. Estimation of Volumetric Soil Moisture Content Using Kb

The measurements of soil’s Kb are influenced by several soil physical properties, such as porosity, BD, OM, temperature, soil water (free and bound), soil air, and mineral/clay fractions [8,10,16,17]. By considering the above factors, several empirical and mixing models have been developed to relate soil moisture content to soil Kb [41].
Topp et al. [8] proposed one of the most widely used calibration equations (Equation (2)) for estimating VSMC:
θ v = 4.3   ×   10 6 K b 3 5.5 × 10 4 K b 2 + 2.92 × 10 2 K b 5.3 × 10 2 ,   ( M - 1 )
Although this relationship fairly estimates the VSMC with an error of 1.3%, it fails to describe the θv–Kb relationship for moisture contents higher than 50%, as may be found in organic soils and in soils with high clay contents [10].
The mixing models are based on the volume fractions of solids, water, and air of soils to obtain a relationship, and therefore they use the composite (bulk) dielectric constant (Kb) [15,16,42,43].
According to Roth et al. [16], Kb is expressed as:
K b =   [ θ v K w β + ( 1 n ) K s β + ( n θ v ) K a β ] 1 / β ,
where n is the soil’s porosity; 1−n, θv, and n−θv are fractions of the volume for each component of soil solids, water, and air, respectively; and, Ks, Kw, and Ka are the respective dielectric constants.
Rearranging Equation (3) and solving for θv gives:
θ v = K b β ( 1 n ) K s β n K a β K w β K a β .   ( M - 2 )
Previous studies have used β = 0.5 [16] to obtain a calibration curve for VSMC.
Introducing known values (β = 0.5, Ka = 1, Ks = 4, and Kw = 81) for the various constituents, into (4) [8,9,10,11] gives:
θ v = K b ( 2 n ) 8 .
Soils with a higher OM content and many horticultural growth media have distinct properties from typical mineral soils, such as higher porosity, low BD, substantial amounts of bound water fraction, and limited clay amounts, all of which can affect the dielectric signatures. By considering these factors, Schaap et al. [17] obtained an empirical expression for organic forest soil horizons (Equation (6)). Therefore, we tested this model given that: (1) BC has been proposed as an amendment for improving horticultural media, particularly under greenhouse conditions, and (2) TDR is the most commonly used method to measure VSMC in this industry. Also, accurate estimation of VSMC and EC is essential for the efficiency level expected in the greenhouse industry compared to field crop production:
θ v = ( 0.133 K b 0.146 ) 0.885 .   ( M - 3 )
Although, consideration of the soil BD should improve calibration models, the influences of the bound water fraction, which mostly correlated to the surface area of the soil/media particles, may not be easily resolved due to large variations in each soil type and local conditions, including the origin of the OM and degree of decomposition [44]. Since BC incorporation can change the Kb of the soil and thus the estimated VSMC using TDR, we used these three commonly used models (M-1; M-2; and M-3) to evaluate the effect of BC on the accuracy of VSMC estimated using the TDR method.

2.4. Measurements of Volumetric Soil Moisture Content

The measurements began with the saturated samples and afterwards, the TDR measurements were obtained every 6 h while keeping the samples in a laboratory drying oven (forced air) at 30 °C to maintain constant equal drying conditions for each sample. The containers were weighed soon after obtaining TDR measurements to calculate gravimetric moisture contents. Three replicates were performed for each measurement and TDR measurements were done individually in each container. VSMC was estimated using the measured Kb obtained from a TDR cable tester (MOHR CT 100; MOHR Test and Measurement LLC, Richland, WA 99354, USA), with a three-rod vertically installed TDR waveguide of 10 cm. The three commonly used models of (i) Topp’s equation—M-1 [8], (ii) mixing model—M-2 [16], and (iii) the forest soil model—M-3 [17] were used to estimate VSMC. The models were compared with a standard VSMC (M0) calculated using the gravimetric moisture content and BD for each treatment.

2.5. Statistical Analysis

Data were first checked for normality and possible outliers. The accuracy of VSMC estimated using each model were evaluated by coefficients of determination (R2), root mean square error (RMSE), and comparison between the observed (measured) and model-estimated data using the 1:1 line and statistical testing of the significant changes in the slope and intercept of each relationship compared to the slope (1) and intercept (0) of the 1:1 line. The significance level was p = 0.05. All statistical analyses were performed with Minitab 17® statistical software.

3. Results and Discussion

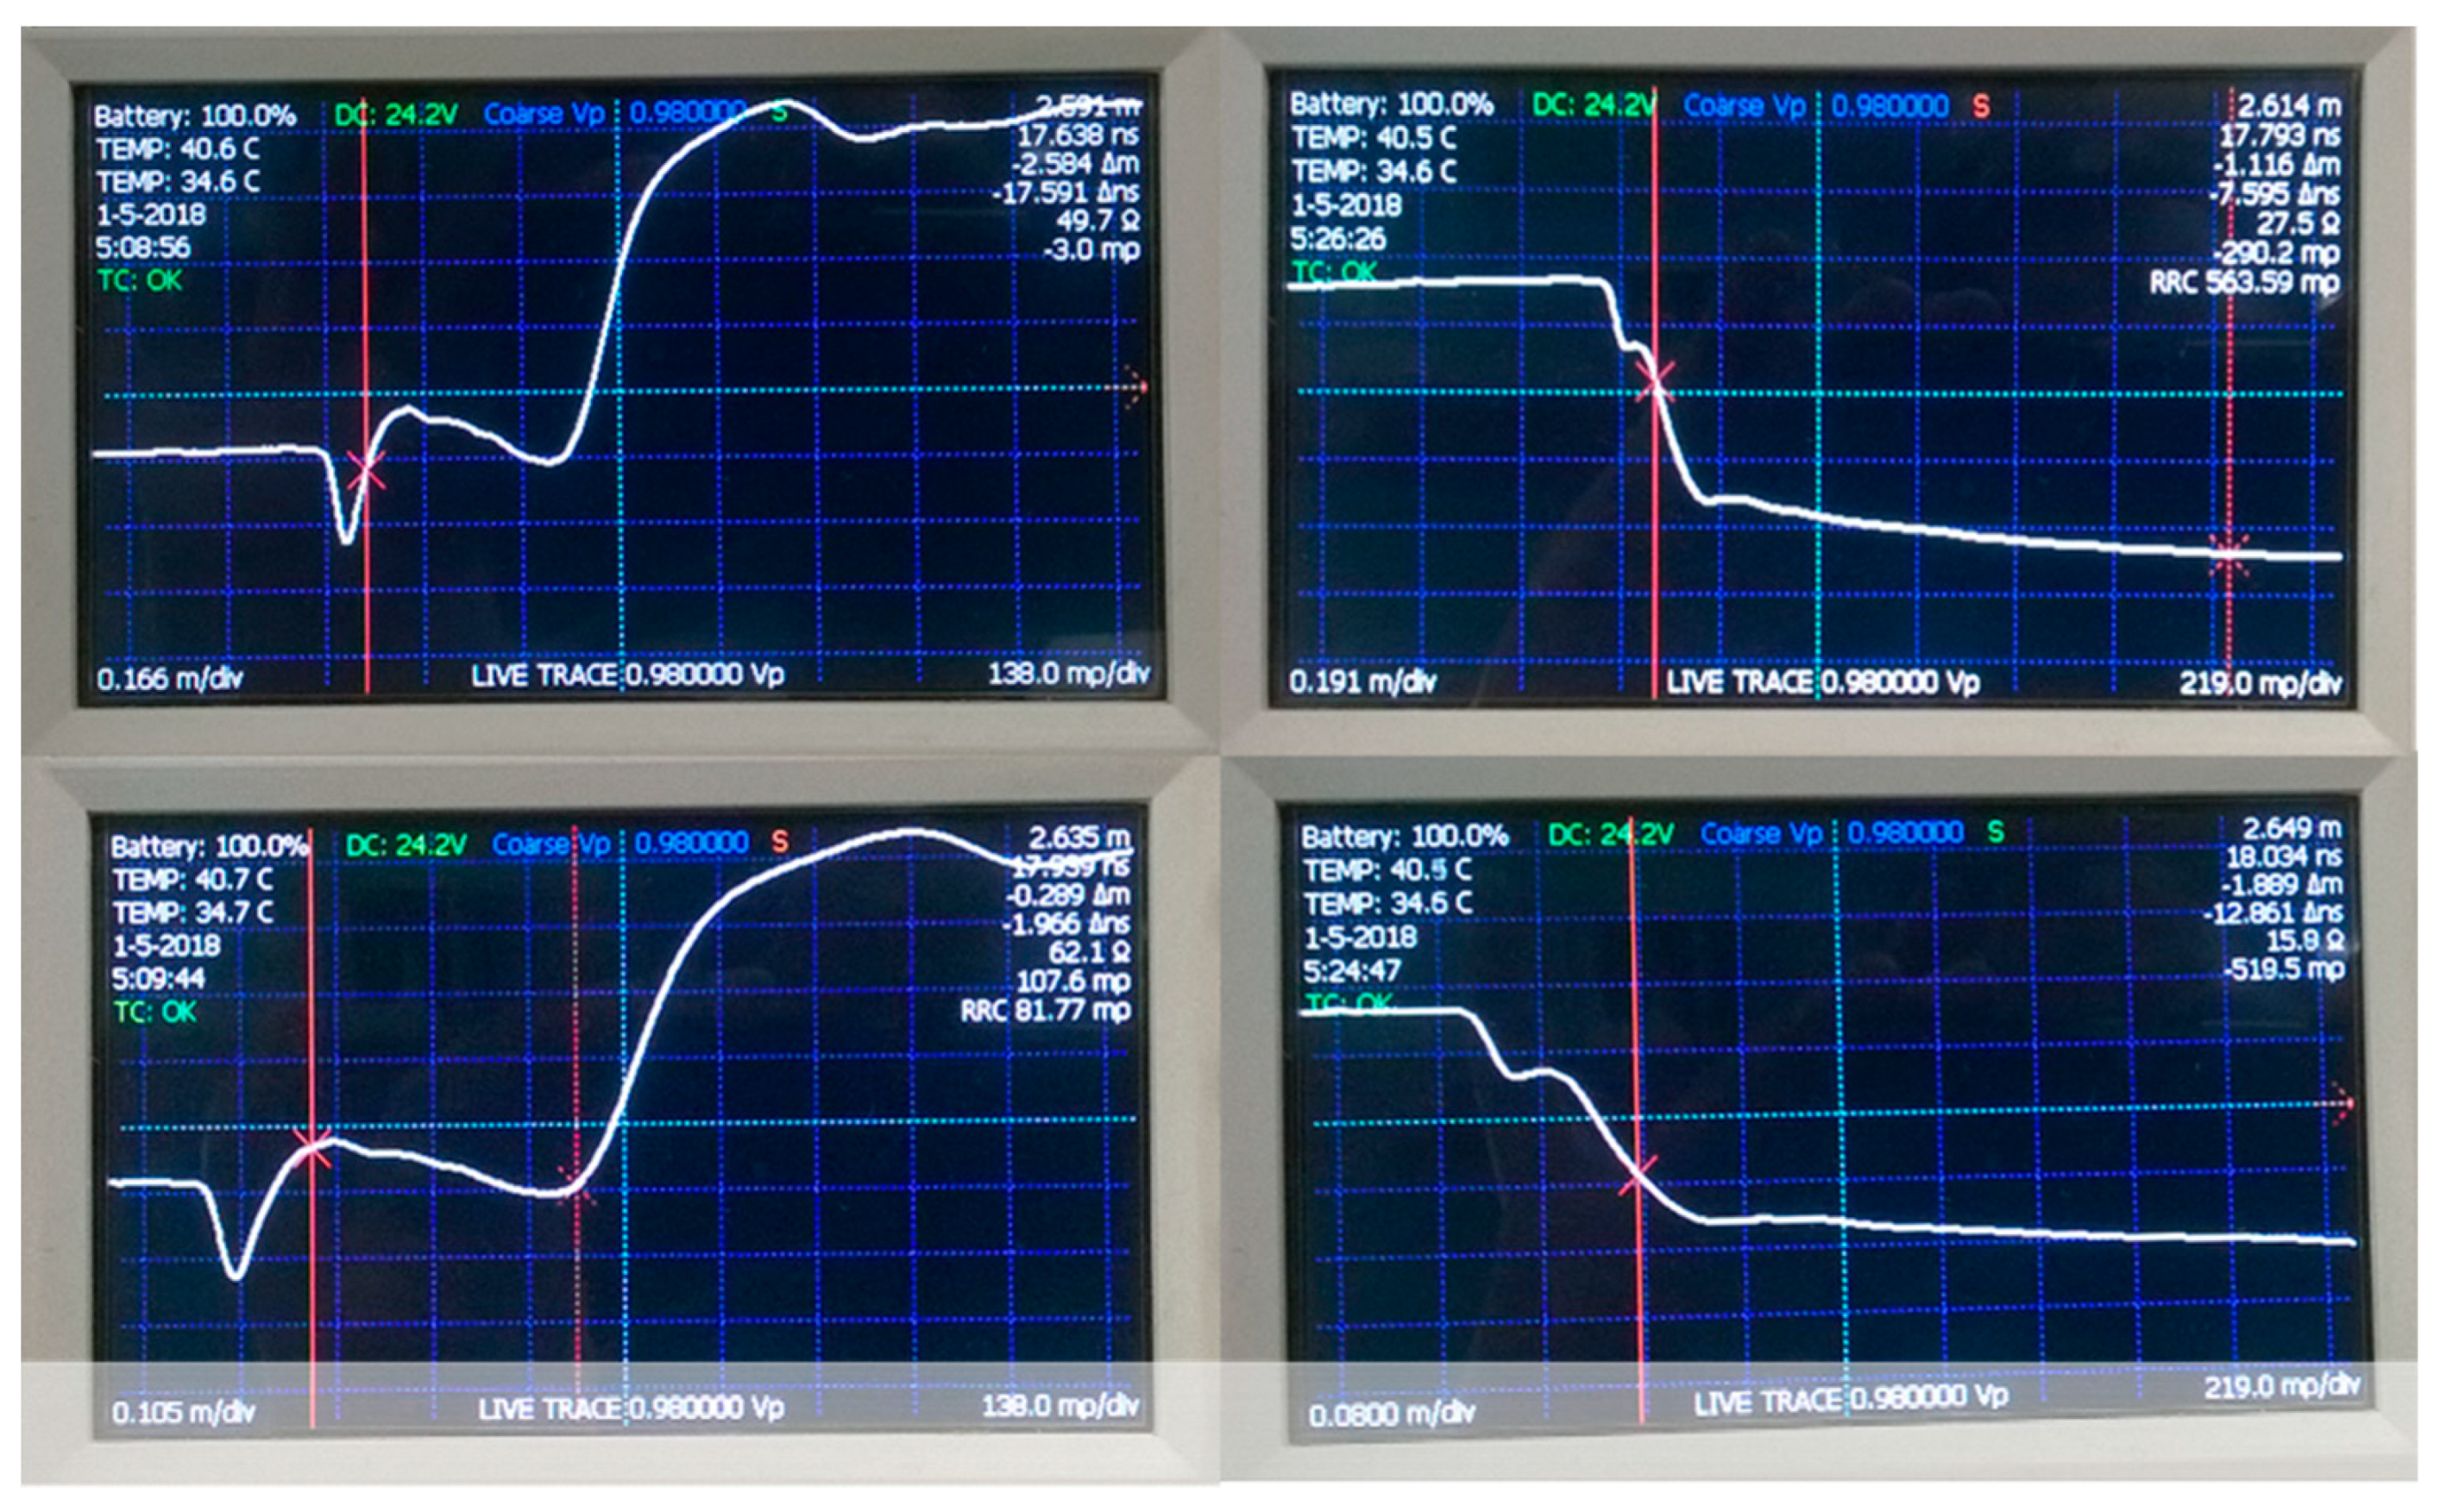
3.1. Effects of BC on TDR Measurement

The decrease in BD with increasing BC rate was observed for both BCP and BCG, as expected. Also, BCG had lower BD than BCP, hence BCG-amended soils were also observed to have lower BD compared to both the non-amended soil and BCP-amended soils (Table 2). For the studied BC rates, Kb varied over a range from 8 to 35 for the change in the measured VSMC (gravimetrically measured) from 25% to 65% for the BCp-amended soil, while it was from 10% to 80% and from 28% to 43% for BCG-amended soils.
Of the two BC types, the TDR measurements could be obtained only up to the rate of 10% BC for soils amended with BCG. BC rates > 15% led to highly attenuated waves or did not show any reflection (Figure 1). However, this behavior was not observed for BCP. Moreover, at the dry end (less than 20%) in BCG samples, the travel time of the EM wave increased with an increasing BC rate, with a gradual reduction of the strength of the reflected signal. On the other hand, the travel time decreased with an increasing BC rate at the dry end for BCp-amended soil. A similar observation of a decreasing travel time was previously reported when soil was incorporated with less-conductive sugarcane bagasse BC [34]. The measured VSMC values and their respective ranges at different BC incorporation rates are given in Table 3. TDR-estimated VSMC values using all three models tested could not be obtained, with rates of more than 15% for BCG, and therefore are not reported in Table 2.
Models selected in this study and other studies show that the Kb (with respect to the vacuum) of soils increases with increasing moisture content. The other variables that affect the electrical response in soils are texture, structure, soluble salts, temperature, density, and measurement frequency [8,10,11,45,46,47].
Hook et al. [48] reported that the travel time of an EM wave increases with an increasing EC of pore water, resulting in an overestimation of VSMC. Robinson et al. [49] reported that the reflected signals stretch to the right when soils contain iron minerals, as they increase the conductivity and magnetism of the medium. The EC values of the two BC types tested were different, BCP = 1.3 dS m−1 and BCG = 5.2 dS m−1. The higher EC and the increased travel time observed in BCG are also in agreement with previous findings of high EC values causing an increase of the travel time and overestimation of VSMC [48,50]. Therefore, apart from the high moisture content, the highly conductive solid phase and the high EC in soil solution might have played a role in the increased travel time of EM waves.
Also, the reflection of EM waves only takes place when the pulse signal enters the soil and arrives at the end of the waveguide. Therefore, the reflection of the EM wave might be attenuated rapidly in BCG-amended soils as the sample’s porosity and EC increases, which prevented the measurements (Table 1). This inability to interpret TDR waveforms by the travel time analysis was also reported by Chen et al. [5], who applied the TDR to measure moisture content in municipal solid wastes. Dettmann and Bechtold [25] evaluated two commercially available moisture probes covering mineral to peat soils and found that the uncertainty of measurements increases with increasing Kb.
Previous studies [34,51] reported the decrease in Kb with decreasing BD, and hence increasing porosity, in low moisture soils. The waveforms at the dry end of the soils amended with BCP in our experiment can be explained by the decrease in BD [51], and thus low dielectric values resulting from a greater underestimation of the VSMC at the dry end. Though soils with BCG also have lower BD, this reduction in Kb might be masked by the high EC of BCG as explained above.

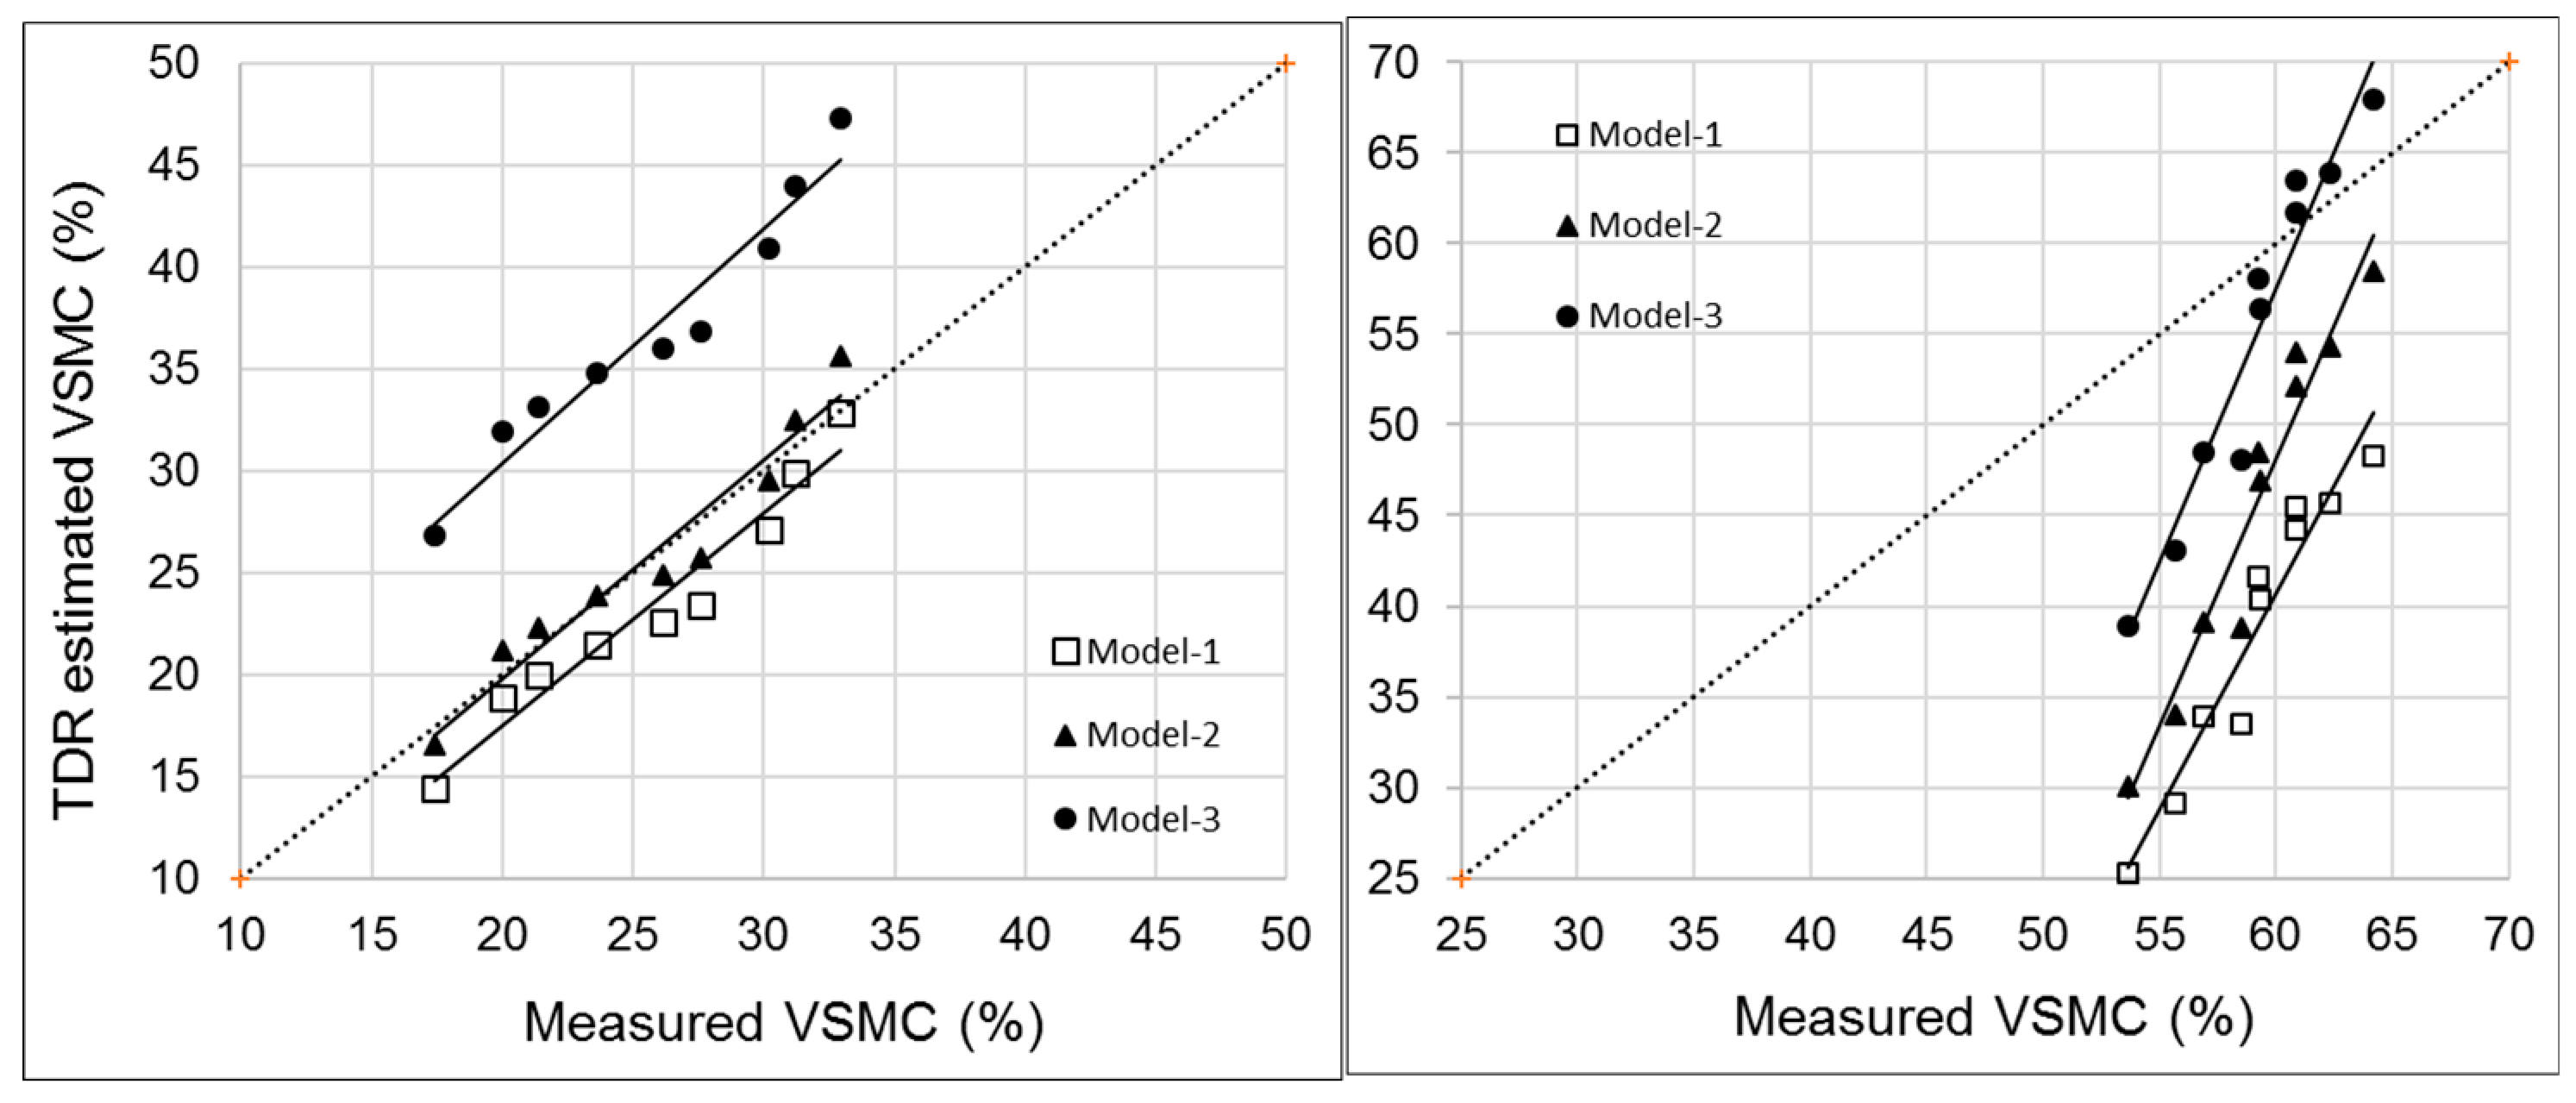
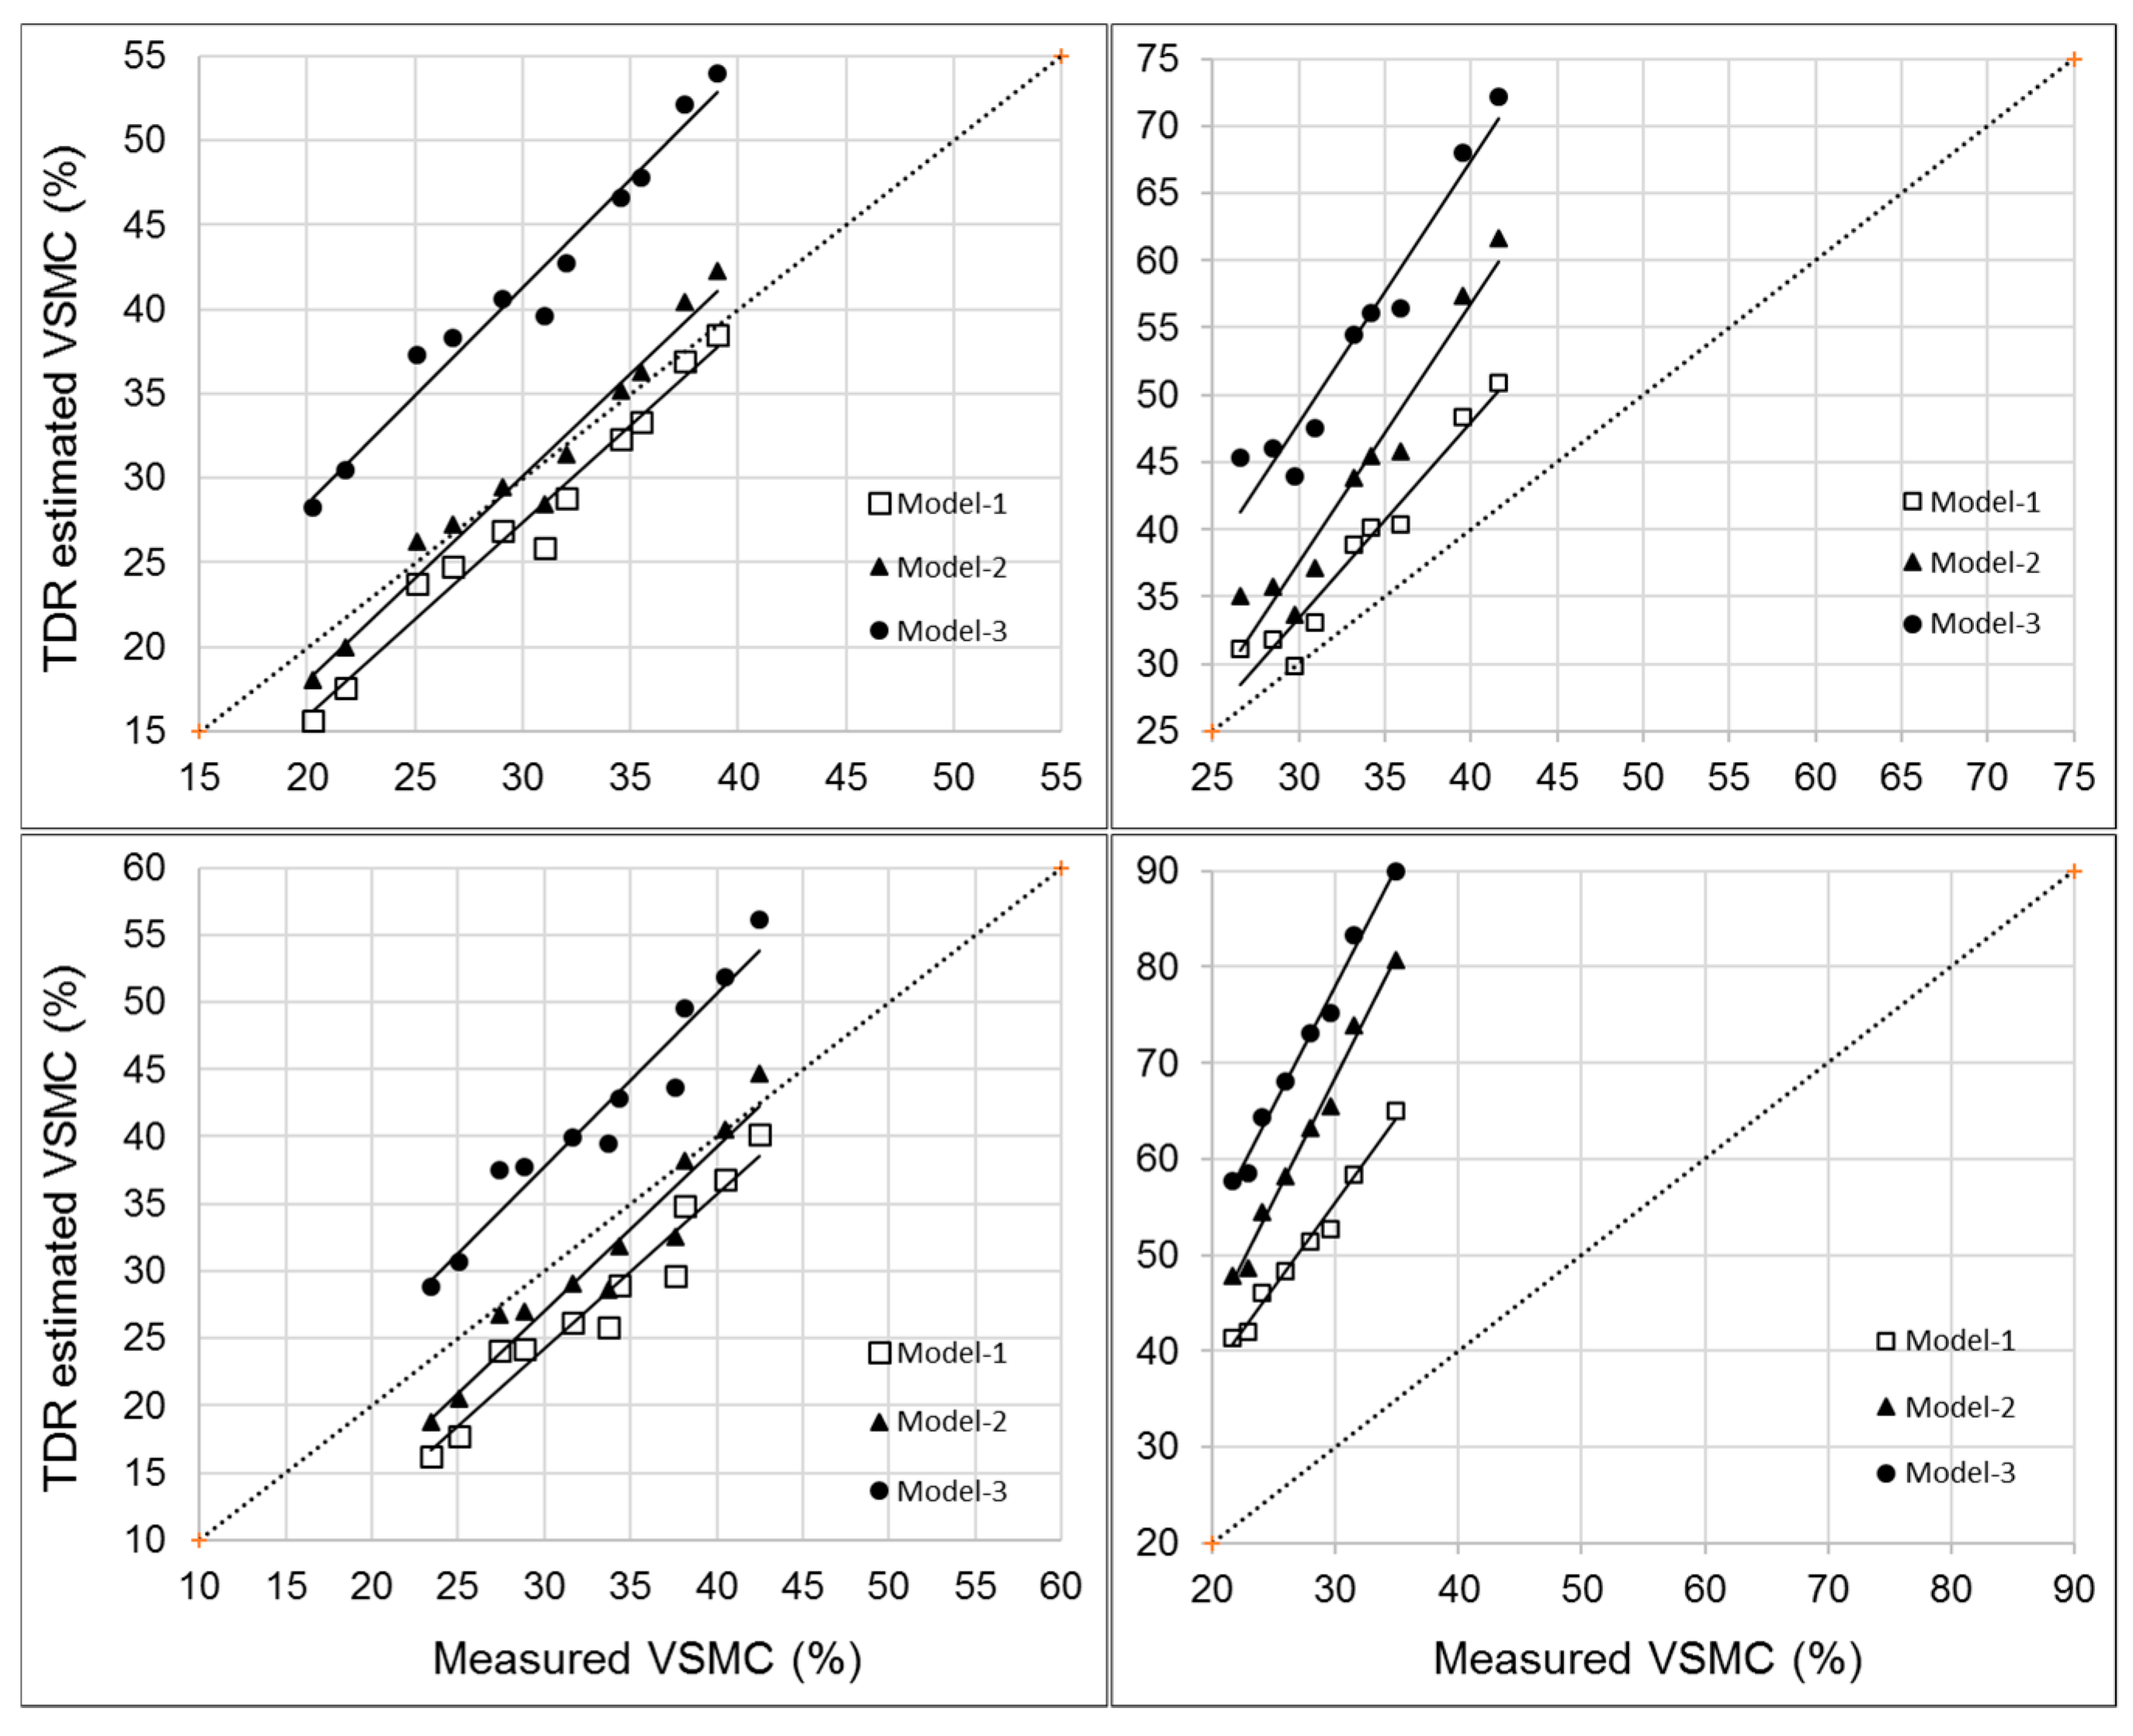
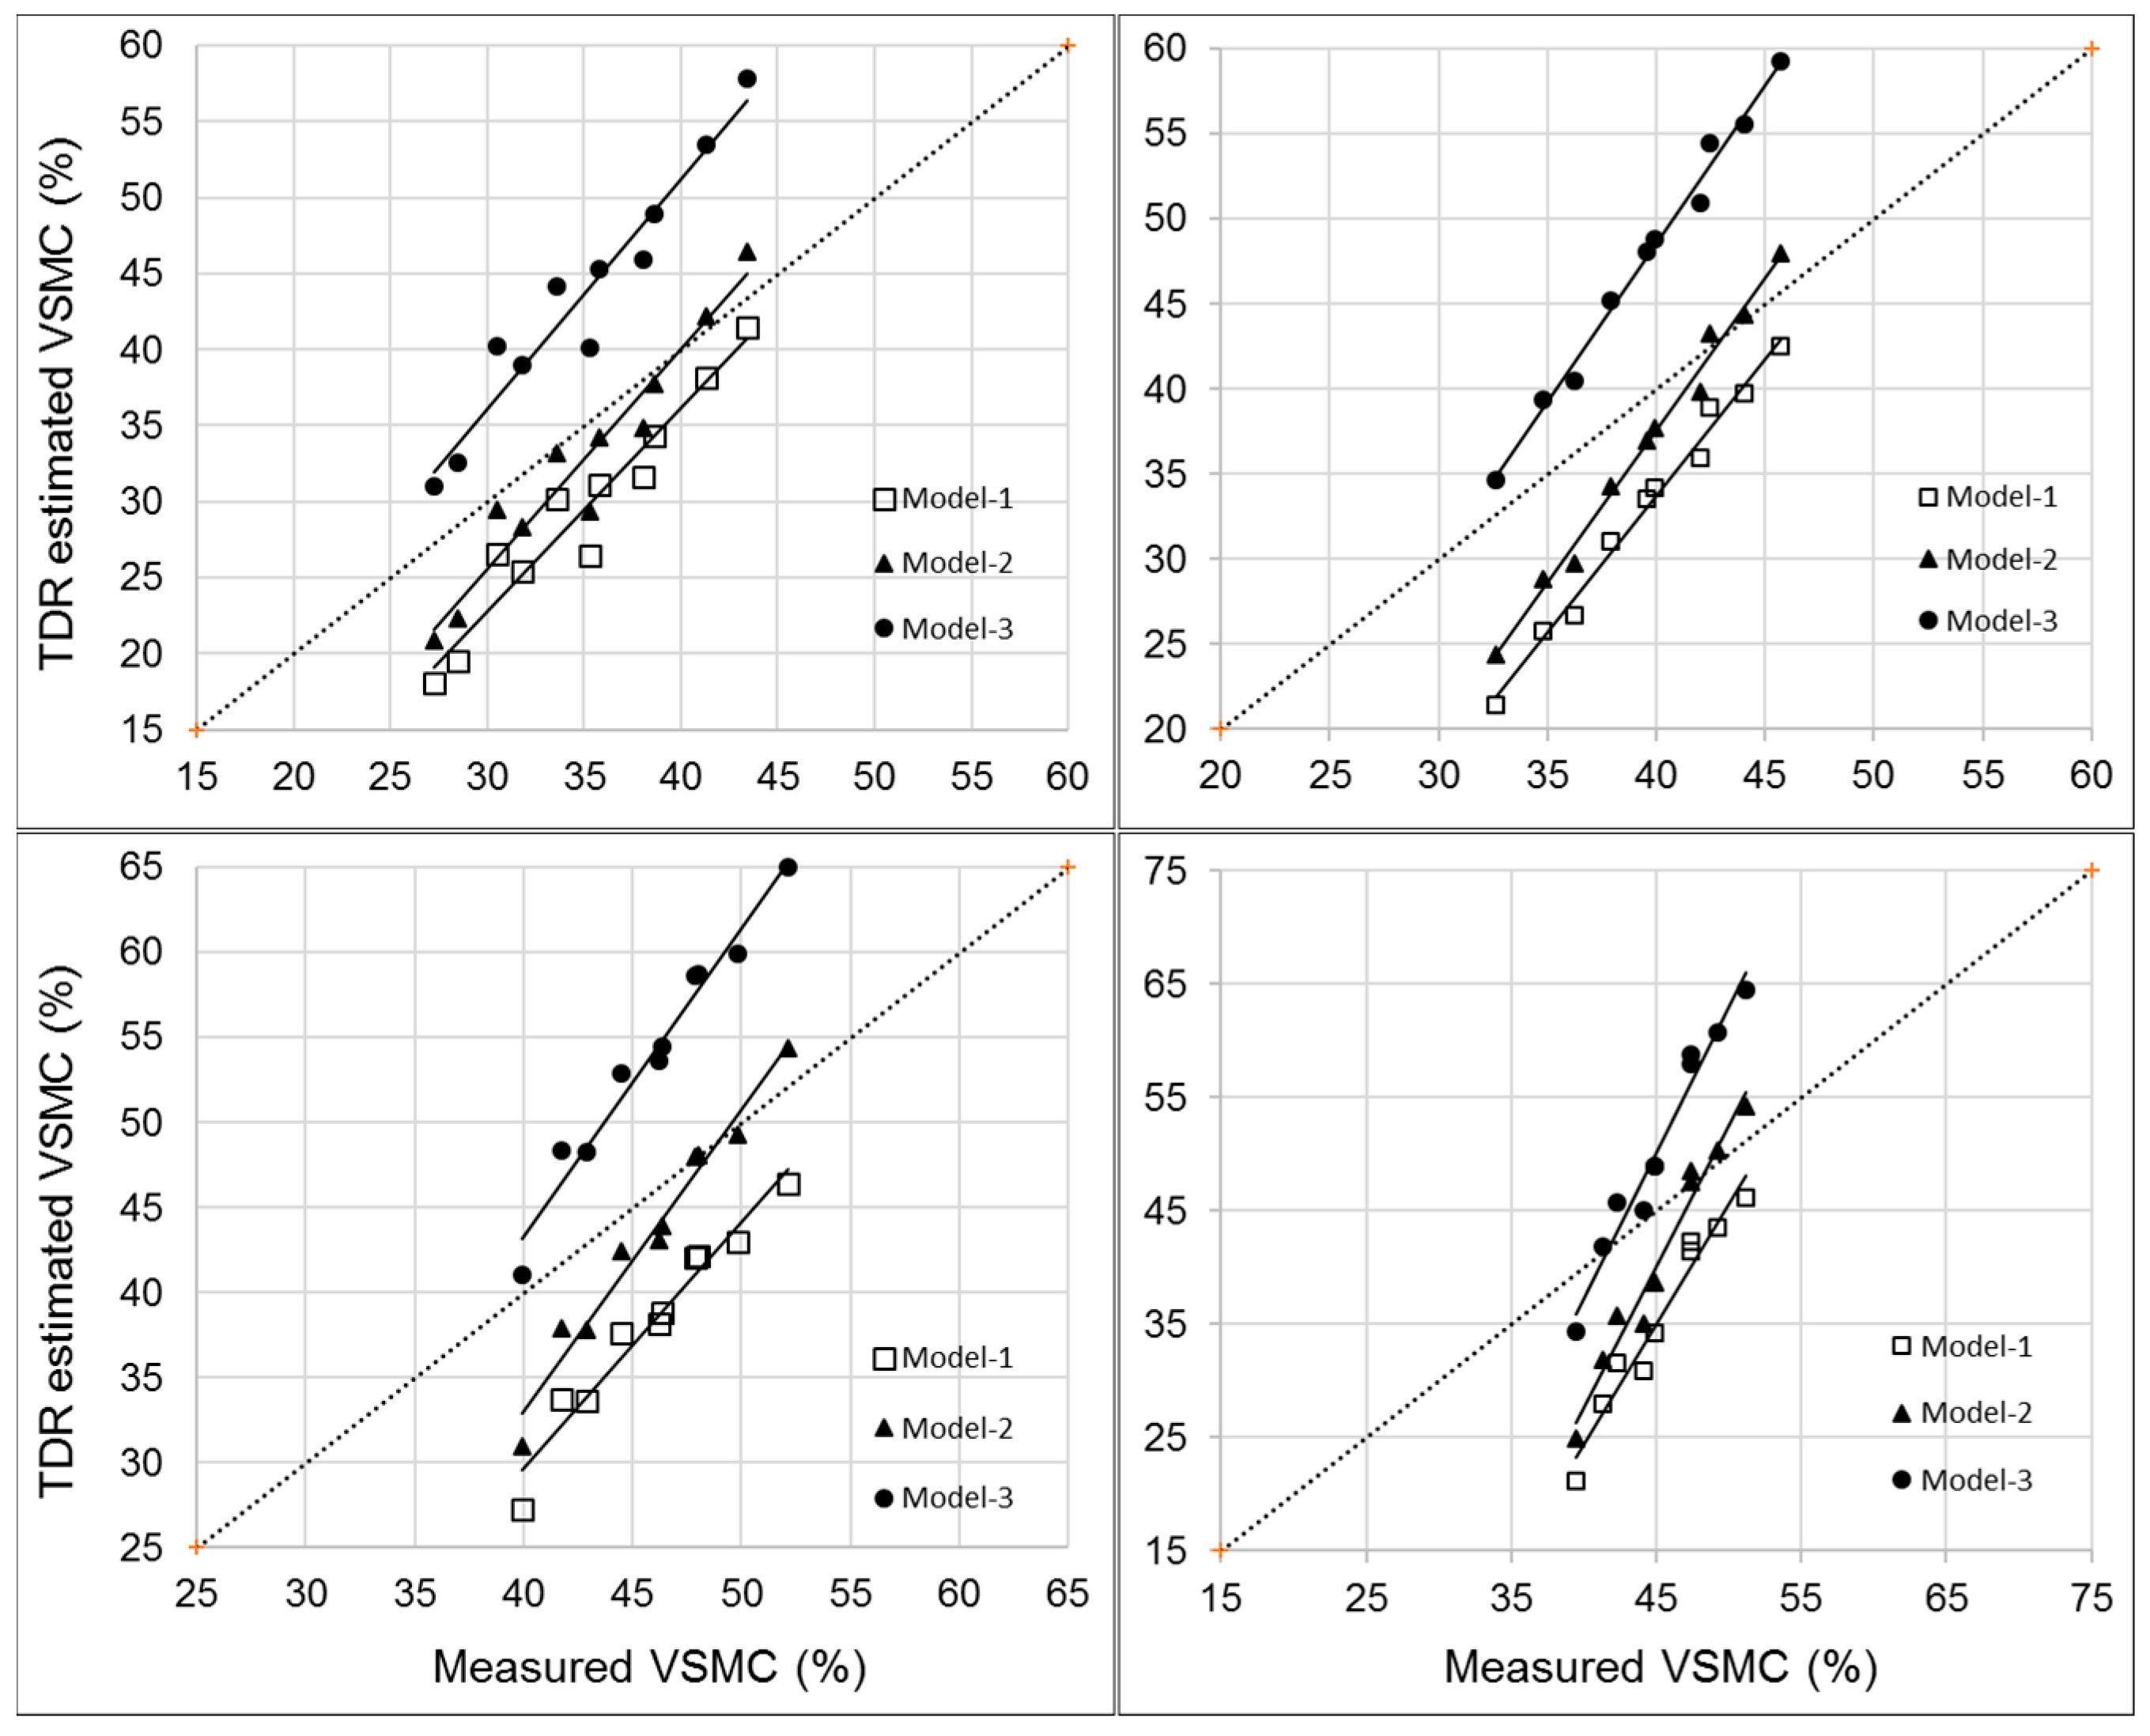
3.2. Evaluation of Three Models Based on Estimated VSMC

The 1:1 comparison of the estimated and measured VSMC of 0% BC is shown in Figure 2. While the results for all three models are almost parallel to the 1:1 line, the Topp’s equation (M-1) and mixing model (M-2) data are aligned very close to the 1:1 line. This shows a lower dispersion and better accuracy in the estimation of VSMC using M-1 and M-2 for the tested loamy sand soil. Even though the M-1 model slightly underestimated the VSMC, it was not statistically significant (p = 0.497). However, the forest soil model (M-3) significantly (p = 0.032) overestimated the VSMC for the control (0% BC). This observation confirmed the empirical polynomial equation (M-1) proposed by Topp et al. [3] and the mixing model theory by Roth et al. [16] and Birchak et al. [42], which postulates that the correlate of Kb with VSMC is applicable for the tested loamy sand soil (podzol). These two models have been confirmed by several researchers and are widely accepted and applicable for different soils [34,52].
When it comes to 100% BCP (Figure 2), the slopes of all three models were significantly increased (p = 0.00) and varied away from the 1:1 line (slope ≠ 1). Both the M-1 and M-2 model significantly underestimated VSMC (p = 0.000). The M-3 model underestimated the VMSC, as BC had relatively low moisture contents (less than 55%) but showed less dispersion and more similarity to the 1:1 line when BC was hydrated (wetted). The increase in slopes was directly related to the increase in BC rates for both BCP and BCG. Figure 3 and Figure 4 and Table 3 and Table 4 show the relationships between the measured and model-estimated values for VSMC for each studied BC rate.
The M-1 model [3] underestimated VSMC for all BCP:soil mixtures throughout the range observed, but the estimated VSMC values were better represented at the wet end (VSMC from 30% to 60%). The same behavior was observed for M-2 [16]. On the other hand, in BCP:soil mixtures, the results obtained with the forest soil model (M-3; 17) gradually migrated from overestimation towards underestimation as the BCP rates increased. The opposite was found for BCG:soil mixtures, as all the models overestimated the VSMC when the moisture content was increased (Figure 2, Figure 3 and Figure 4).
Although the change in intercept values was significant (p < 0.05) for all BC-amended samples, the slope for the M-1 model was not significant (slope = 1 of the 1:1 line) up to 20% of the BCP-amended samples and up to 5% of the BCG-amended samples. On the other hand, both the M-2 and M-3 models showed significant changes in the slopes (Table 4 and Table 5). Therefore, this analysis shows that the commonly used Topp’s equation (M-1) performed slightly better for the BCp:soil mixtures up to 20% and BCG:soil mixtures up to 5% of the w/w incorporation rates used in this study for a sandy loam podzolic soil. Though the M-1 model underestimates the VSMC, the model seemed to be fairly stable up to these rates.
When compared the measured and TDR-estimated VSMC values, RMSE values changed between 0.8% to 2.1%, 1.1% to 2.5%, and 1.1% to 2.5% for M-1, M-2, and M-3, respectively, in BCp-treated soils. As for BCG-treated soils, RMSE values ranged from 1.8% to 5.5% for M-1, 1.7% to 2.9% for M-2, and 1.6% to 2.9% for M-3 models. These results may suggest that BC-amended soils tend to behave differently from both typical mineral soils and soils with high clay or OM contents. For instance, unlike soils with higher OM contents and soil porosity, low BD, and substantial amounts of bound water fraction. BC-amended soils (high porosity and low BD) did not perform well (TDR-estimated values deviated from the standard) when porosity and OM content with bound water fractions were considered using the M-2 and M-3 models.
Considering that BC is known to absorb water apart from pore and hygroscopic water, BC-amended soils may have absorbed water by BC particles. Soil Kb is affected mostly by loosely held water [53]. However, calculation of VSMC from the measured gravimetric moisture does include the weight of absorbed water, causing the original models applied to mineral soil to shift. Also, increased porosity and surface area, and hence bound water fraction and decreased BD, may have affected the estimated values using the M-2 and M-3 models. These results suggest that most of the water held in BC-amended soils may be absorbed via capillarity into BC particles and less of it can be found as pore water and bound water.

4. Conclusions

This study carried out a preliminary evaluation on the influence of non-uniform soil conditions resulting from the application of BC on the accuracy of TDR-based VSMC estimation using three commonly used models originally developed for uniform (M-1), non-uniform (M-2), and forest (M-3) soils. Analyses of the experimental data indicated that the Topp’s model (M-1) and the mixing model (M-2) provided a reasonably accurate estimation of the VSMC of loamy sand podzolic soil. The M-1 model showed slightly better performances and resolutions for BC:soil mixtures (w/w) up to 20% of BCP and 5% of BCG (w/w) incorporation rates used in this study. On the other hand, the forest soil model (M-3) showed mixed results, with less accuracy than the other two models tested. Therefore, these results indicate that for agricultural purposes (less than 5% (w/w) BC rates), the measured VSMC of the studied BC-amended soils are reasonably close to the values obtained from the Topp’s model (M-1). The low accuracy of the VSMC estimation using the mixing (M-2) and forest soil (M-3) models suggests that BC-amended soils tend to behave differently from both typical mineral soils and soils with high clay or OM contents. This could be due to the fact that BC-amended soils with high porosity and low BD did not estimate VSMC accurately when porosity or OM content-bound water fractions were considered. Therefore, the commonly used Topp’s model (M-1) can thus be used to determine the VSMC of BC-amended soils in rates not exceeding 5% without significantly compromising the accuracy. This rate is within the typical application rate (1–131 Mg ha−1) of BC in field soils. However, it needs to be pointed out that due to the limited scope of this experimental study, the conclusion might not be inclusive of different BC types and for soils showing high heterogeneities, including the influence of BC on the water repellency of soils. Therefore, further investigations along with the underlying mechanisms using different soil types are needed.

Author Contributions

Conceptualization, L.G.; methodology, D.W., and L.G.; software, D.W.; validation, L.G., M.C., and R.T.; formal analysis, D.W.; resources, L.G. and M.C.; data curation, D.W.; writing—original draft preparation, D.W.; writing—review and editing, D.W., M.C., R.T., and L.G.; visualization, D.W. and L.G.; supervision, L.G. and M.C.; project administration, L.G.; funding acquisition, L.G.

Funding

This research was funded by Research and Development Corporation of Newfoundland and Labrador, grant number 5404-1962-101 (Ignite R&D) and the Research Office of Grenfell Campus, Memorial University of Newfoundland through stat-up fund 20160160.

Acknowledgments

Constructive comments and conceptual inputs given by Adrian Unc during the study are greatly appreciated. The Department of Fisheries and Land Resources of the Government of Newfoundland and Labrador for providing access to the experimental site at Pasadena, NL.

Conflicts of Interest

The authors declare no conflict of interest. The funders had no role in the design of the study; in the collection, analyses, or interpretation of data; in the writing of the manuscript, and in the decision to publish the results.

References

  1. Nagare, R.; Schincariol, R.; Quinton, W.; Hayashi, M. Laboratory calibration of time domain reflectometry to determine moisture content in undisturbed peat samples. Eur. J. Soil. Sci. 2011, 62, 505–515. [Google Scholar] [CrossRef]
  2. Baker, J.; Allmaras, R. System for automating and multiplexing soil moisture measurement by time domain reflectometry. Soil Sci. Soc. Am. J. 1990, 54, 1–6. [Google Scholar] [CrossRef]
  3. Topp, C.; Davis, L.; Annan, P. Electromagnetic determination of soil water content using TDR: I. Applications to wetting fronts and steep gradients. Soil Sci. Soc. Am. J. 1982, 46, 672–678. [Google Scholar] [CrossRef]
  4. Jackson, N.; Wallace, J. Analysis of soil water dynamics in an agroforestry system based on detailed soil water records from time domain reflectometry. Hydrol. Earth Syst. Sci. 1999, 3, 517–527. [Google Scholar] [CrossRef]
  5. Moret, D.; Lopez, M.; Arrúe, J. TDR application for automated water level measurement from Mariotte reservoirs in tension disc infiltrometers. J. Hydrol. 2004, 297, 229–235. [Google Scholar] [CrossRef] [Green Version]
  6. Overduin, P.; Kane, D. Frost boils and soil ice content: Field observations. Permafr. Periglac. 2006, 17, 291–307. [Google Scholar] [CrossRef]
  7. Gaur, A.; Hortona, R.; Jaynes, B.; Lee, J.; Al-Jabrid, S. Using surface time domain reflectometry measurements to estimate subsurface chemical movement. Vadose Zone J. 2003, 2, 539–543. [Google Scholar] [CrossRef]
  8. Topp, C.; Davis, L.; Annan, P. Electromagnetic determination of soil water content: Measurement in coaxial transmission lines. Water Resour. Res. 1980, 16, 574–582. [Google Scholar] [CrossRef]
  9. Cassel, D.; Kachanoski, G.; Topp, C. Practical considerations for using a TDR cable tester. Soil Technol. 1994, 7, 113–126. [Google Scholar] [CrossRef]
  10. Jones, S.; Wraith, J.; Or, D. Time domain reflectometry measurement principles and applications. Hydrol. Process. 2002, 16, 141–153. [Google Scholar] [CrossRef]
  11. Yu, X.; Yu, X. Time Domain Reflectometry Tests of Multilayered Soils. Proceedings of TDR 2006, Paper ID 3; Purdue University: West Lafayette, IN, USA, 2006; p. 16. [Google Scholar]
  12. Gao, Q.; Yu, X. Design and evaluation of a high sensitivity spiral TDR scour sensor. Smart Mater. Struct. 2015, 24, 085005. [Google Scholar] [CrossRef] [Green Version]
  13. Gasvoda, D. Campbell Water Content Reflectometer: Evaluation in Compacted Road Soils; USDA-Forest Service: Missoula, MT, USA, 1998. [Google Scholar]
  14. Ferre, A.; Knight, H.; Rudolph, D.; Kachanoski, G. The sample areas of conventional and alternative Time Domain Reflectometry probes. Water Resour. Res. 1998, 34, 2971–2979. [Google Scholar] [CrossRef]
  15. Dobson, C.; Ulaby, T.; Hallikainen, T.; El-Rayes, A. Microwave dielectric behavior of wet soil—Part II: Dielectric mixing models. IEEE Trans. Geosci. Remote Sens. 1985, 1, 35–46. [Google Scholar] [CrossRef]
  16. Roth, K.; Schulin, R.; Fluhler, H.; Attinger, W. Calibration of time domain reflectometry for water content measurement using a composite dielectric approach. Water Resour. Res. 1990, 26, 2267–2273. [Google Scholar] [CrossRef]
  17. Schaap, M.; De Lange, L.; Heimovaara, T. TDR calibration of organic forest floor media. Soil Technol. 1996, 11, 205–217. [Google Scholar] [CrossRef]
  18. Drnevich, P.; Siddiqui, I.; Lovell, J.; Yi, Q. Water Content and Density of Soil In-Situ by the Purdue TDR Method; Purdue University: West Lafayette, IN, USA, 2001. [Google Scholar]
  19. Kaiser, D.; Reinert, D.; Reichert, J.; Minella, J. Dielectric constant obtained from TDR and volumetric moisture of soils in southern Brazil. Rev. Bras. Ciênc. Solo. 2010, 34, 649–658. [Google Scholar] [CrossRef] [Green Version]
  20. Teixeira, W.; Schroth, G.; Marques, J.; Huwe, B. Sampling and TDR probe insertion in the determination of the volumetric soil water. Rev. Bras. Ciênc. Solo. 2003, 27, 575–582. [Google Scholar] [CrossRef]
  21. Pepin, M.C.; Pothier, F.; Barden, N. Impaired type II glucocorticoid-receptor function in mice bearing antisense RNA transgene. Nature 1992, 355, 725–728. [Google Scholar] [CrossRef]
  22. Kellner, E.; Lundin, L.-C. Calibration of time domain reflectometry for water content in peat soil. Hydrol. Res. 2001, 32, 315–332. [Google Scholar] [CrossRef]
  23. Yoshikawa, K.; Overduin, P.; Harden, W. Moisture content measurements of moss (Sphagnum spp.) using commercial sensors. Permafr. Periglac. 2004, 15, 309–318. [Google Scholar] [CrossRef]
  24. Pumpanen, J.; Ilvesniemi, H. Calibration of time domain reflectometry for forest soil humus layers. Boreal Environ. Res. 2005, 10, 589–595. [Google Scholar]
  25. Dettmann, U.; Bechtold, M. Evaluating commercial moisture probes in reference solutions covering mineral to peat soil conditions. Vadose Zone J. 2018, 17, 170208. [Google Scholar] [CrossRef]
  26. Lopez, V. Biochar as a Soil Amendment: Impact on Hydraulic and Physical Properties of an Arable Loamy Sand Soil. Master’s Thesis, University of California, Merced, CA, USA, 2014. [Google Scholar]
  27. Chan, Y.; Van Zwieten, L.; Meszaros, I.; Adriana, D.; Joseph, S. Agronomic values of greenwaste biochar as a soil amendment. Aust. J. Soil Res. 2007, 45, 629–634. [Google Scholar] [CrossRef]
  28. Novak, J.; Busscher, W.; Watts, D.; Amonette, J.; Ippolito, J.; Lima, I.; Gaskin, J.; Steiner, S.; Ahmedna, M.; Rehrah, D.; et al. Biochars impact on soil-moisture storage in an Ultisol. Soil Sci. 2012, 177, 310–320. [Google Scholar] [CrossRef]
  29. Abel, S.; Peters, A.; Trinks, S.; Schonsky, H.; Facklam, M.; Wessolek, G. Impact of biochar and hydrochar addition on water retention and water repellency of sandy soil. Geoderma 2013, 202, 183–191. [Google Scholar] [CrossRef]
  30. Mukherjee, A.; Lal, R. Biochar impacts on soil physical properties and greenhouse gas emissions. Agronomy 2013, 3, 313–339. [Google Scholar] [CrossRef]
  31. Lehmann, J.; Czimczik, C.; Laird, D.; Sohi, S. Stability of biochar in soil. In Biochar for Environmental Management: Science and Technology; Lehmann, J., Joseph, S., Eds.; Earthscan: London, UK, 2009; pp. 183–205. [Google Scholar]
  32. Kameyama, K.; Miyamoto, T.; Shiono, T.; Shinogi, Y. Influence of sugarcane bagasse-derived biochar application on nitrate leaching in calcaric dark red soil. J. Environ. Qual. 2012, 41, 1131–1137. [Google Scholar] [CrossRef] [PubMed]
  33. Kinney, T.; Masiello, C.; Dugan, B.; Hockaday, W.; Dean, M.; Zygourakis, K.; Barnes, R. Hydrological properties of biochars produced at different temperatures. Biomass Bioenergy 2012, 41, 34–43. [Google Scholar] [CrossRef]
  34. Kameyama, K.; Miyamoto, T.; Shiono, T. Influence of biochar incorporation on TDR-based soil water content measurements. Eur. J. Soil Sci. 2014, 65, 105–112. [Google Scholar] [CrossRef]
  35. Badewa, E.; Unc, A.; Cheema, M.; Kavanagh, V.; Galagedara, L. Moisture mapping using multi-frequency and multi-coil electromagnetic induction sensors on managed podzols. Agronomy 2018, 8, 224. [Google Scholar] [CrossRef]
  36. Jeffery, S.; Verheijen, F.; Van Der Velde, M.; Bastos, A. A quantitative review of the effects of biochar application to soils on crop productivity using meta-analysis. Agric. Ecosyst. Environ. 2011, 144, 175–187. [Google Scholar] [CrossRef]
  37. Schulz, H.; Dunst, G.; Glaser, B. Positive effects of composted biochar on plant growth and soil fertility. Agron. Sustain. Dev. 2013, 33, 817–827. [Google Scholar] [CrossRef] [Green Version]
  38. Kaudal, B.; Chen, D.; Madhavan, D.; Downie, A.; Weatherley, A. An examination of physical and chemical properties of urban biochar for use as growing media substrate. Biomass Bioenergy 2016, 84, 49–58. [Google Scholar] [CrossRef]
  39. Margenot, A.; Griffin, D.; Alves, B.; Rippner, D.; Li, C.; Parikh, S. Substitution of peat moss with softwood biochar for soil-free marigold growth. Ind. Crop. Prod. 2018, 112, 160–169. [Google Scholar] [CrossRef] [Green Version]
  40. Adams, W. The effect of organic matter on the bulk and true densities of some uncultivated podzolic soils. Eur. J. Soil. Sci. 1973, 24, 11–17. [Google Scholar] [CrossRef]
  41. Jones, S.; Or, D. Surface area, geometrical and configurational effects on permittivity of porous media. J. Non Cryst. Solids 2002, 305, 247–254. [Google Scholar] [CrossRef]
  42. Birchak, J.; Gardner, D.; Hipp, J.; Victor, J. High dielectric constant microwave probes for sensing soil moisture. Proc. IEEE 1974, 62, 93–98. [Google Scholar] [CrossRef]
  43. Friedman, P. A saturation degree-dependent composite spheres. Water Resour. Res. 1998, 34, 2949–2961. [Google Scholar] [CrossRef]
  44. Oleszczuk, P.; Baran, S.; Baranowska, E. Influence of long-term soils flooding by distilled and post-sewage water on Polycyclic Aromatic Hydrocarbons (PAHs) changes. Water Air Soil Pollut. 2007, 180, 237–248. [Google Scholar] [CrossRef]
  45. Bridge, B.; Sabburg, J.; Habash, K.; Ball, J.; Hancock, N. The dielectric behaviour of clay soils and its application to time domain reflectometry. Aust. J. Soil Res. 1996, 34, 825–835. [Google Scholar] [CrossRef]
  46. Wyseure, L.; Mojid, A.; Malik, A. Measurement of volumetric water content by TDR in saline soils. Eur. J. Soil Sci. 1997, 48, 347–354. [Google Scholar] [CrossRef]
  47. Bittelli, M.; Salvatorellii, F.; Pisa, P. Correction of TDR based soil water content measurements in conductive soils. Geoderma 2008, 143, 133–142. [Google Scholar] [CrossRef]
  48. Hook, R.; Ferré, T.; Livingston, J. The effects of salinity on the accuracy and uncertainty of water content measurement. Soil Sci. Soc. Am. J. 2004, 68, 47–56. [Google Scholar] [CrossRef]
  49. Robinson, D.; Bell, J.; Batchelor, C. Influence of iron minerals on the determination of soil water content using dielectric techniques. J. Hydrol. 1994, 161, 169–180. [Google Scholar] [CrossRef]
  50. Chen, R.; Chen, Y.; Chen, W.; Chen, Y. Time domain reflectometry for water content measurement of municipal solid waste. Environ. Eng. Sci. 2012, 29, 486–493. [Google Scholar] [CrossRef]
  51. Miyamoto, T.; Chikushi, J. Time domain reflectometry calibration for typical upland soils in Kyushu, Japan. Jpn. Agric. Res. Q. 2006, 40, 225–231. [Google Scholar] [CrossRef]
  52. Wesenbeeck, J.; Kachanoski, G. Spatial and temporal distribution of soil water in the tilled layer under a corn crop. Soil Sci. Soc. Am. J. 1988, 52, 363–368. [Google Scholar] [CrossRef]
  53. Gihlar, J.; Ulaby, F.T. Dielectric Properties of Soils as a Function of Moisture Content; The University of Kansas: Lawrence, KS, USA, 1974; pp. 1–68. [Google Scholar]
Figure 1. Time-domain reflectometer (TDR) waves obtained from samples containing different granular biochar (BCG) rates (VSMC was trying to be maintained closer to the field capacity of 30%). Up left: 0%; down left: 5%; up right: 50%; down right: 100%. Y-axis is wave amplitude (mV) and X-axis is travel time (nS). Two vertical lines in down left figures shows the two-way travel time of the electromagnetic (EM) wave along the 10 cm probe and was used to calculate the EM wave velocity and then dielectric constant of bulk soil (Kb) and volumetric soil moisture content (VSMC). Detailed analysis of this wave propagation and calculation can be found in Topp et al. (1980) [8].
Soilsystems 03 00049 g001
Figure 2. Relationship (1:1 graph) between the measured and TDR (Time-domain reflectometer)-estimated volumetric soil moisture content (VSMC) using three models; M-1, M-2, and M-3 for powdered biochar—BGp (left—0%; right—100%).
Soilsystems 03 00049 g002
Figure 3. Relationship (1:1 graph) between the measured and TDR (Time-domain reflectometer)-estimated volumetric soil moisture content (VSMC) using three models; M-1, M-2, and M-3, for powdered (left) and granular (right) biochar (BC) at 5% (top) and 10% (bottom).
Soilsystems 03 00049 g003
Figure 4. Relationship (1:1 graph) between the measured and TDR (Time-domain reflectometer)-estimated volumetric soil moisture content (VSMC) using three models; M-1, M-2, and M-3, for powdered biochar (BCP) at 15% (top-left), 20% (top-right), 40% (bottom-left), and 50% (bottom-right) rates (NOTE: No data are available for granular biochar (BCG) with these corresponding rates).
Soilsystems 03 00049 g004
Table 1. Basic properties of two types of biochar (BC) used for the study.
PropertyUnitPowdered #Granular $
Feedstock Mix softwoodYellow pine wood (Pinus taeda)
Pyrolysis Temperature°C450–500500
Durationmin3030
Particle sizemm<0.51–6
Bulk density(g cm−3)0.750.20
Moisture content(%)5.015.2
pH (1:10 BC:water) 8.99.0
ECa at 21–22 °C(dS m−1)1.35.2
Fixed carbon%6987.3
Volatile carbon (600 °C)%2212.7
Ash content%4.06.0
# ABRI Tech Inc., Quebec, Canada; $ Air Terra Inc., Alberta, Canada.
Table 2. Bulk densities (BDs) for each biochar (BC):soil mixture of both powdered (BCP) and granular (BCG) biochar.
BC Rate (%)051015204050100
BDP (g cm−3)1.251.211.171.141.100.990.940.75
BDG (g cm−3)1.250.990.820.700.610.400.340.20
Table 3. Volumetric soil moisture contents (VSMCs) measured using the standard method (M-0) for each BC:soil mixture of both powdered (BCP) and granular (BCG) biochar.
BC Rate (%)VSMCPVSMCG
MinMaxAvgMinMaxAvg
017.432.925.617.432.925.6
120.838.430.025.139.631.3
520.239.030.226.641.633.3
1023.442.533.021.634.927.3
1527.343.434.914.422.518.1
2032.645.739.5n/an/an/a
3030.945.038.6n/an/an/a
4040.052.145.9n/an/an/a
5039.551.245.2n/an/an/a
10053.664.259.2n/an/an/a
Min—Minimum; Max—Maximum; Avg—Average; n/a—Values are not available for tested models.
Table 4. Regression equations (Reg. Eq.) and coefficients of determination (R2) between measured and TDR-measured volumetric soil moisture content (VSMC) for studied powdered biochar (BCP) rates (corresponding graphical representations are given in Figure 2, Figure 3 and Figure 4).
BC (%)M-1M-2M-3
Reg. Eq.R2Reg. Eq.R2Reg. Eq.R2
0 Y = 1.001 × x 2.54 0.91 Y = 1.026 × x 0.78 0.91 Y = 1.100 × x 8.32   # 0.91
5 Y = 1.152 × x 7.50   # 0.96 Y = 1.216   # × x 6.67   # 0.96 Y = 1.287   # × x 2.30 0.96
10 Y = 1.198 × x 11.13   # 0.96 Y = 1.281   # × x 10.73   # 0.96 Y = 1.351   # × x 2.08 0.96
15 Y = 1.297 × x 16.13   # 0.92 Y = 1.397   # × x 16.38   # 0.92 Y = 1.467   # × x 7.93 0.92
20 Y = 1.537   # × x 27.85   # 0.99 Y = 1.720   # × x 31.31 # 0.98 Y = 1.786   # × x 23.00   # 0.98
40 Y = 1.676   # × x 39.51   # 0.96 Y = 2.033   # × x 50.73   # 0.97 Y = 2.082   # × x 42.51   # 0.97
50 Y = 2.039   # × x 56.88   # 0.96 Y = 2.366   # × x 66.37   # 0.96 Y = 2.444   # × x 59.78   # 0.96
100 Y = 2.326   # × x 99.00   # 0.95 Y = 2.796   # × x 120.00   # 0.95 Y = 2.871   # × x 115.00   # 0.95
# Significant (p < 0.05) changes in slope (slope ≠ 1) and intercept (intercept ≠ 0) compared to the slope and the intercept from the 1:1 line. All regressions lines are significant with p < 0.000.
Table 5. Regression equations (Reg. Eq.) and coefficients of determination (R2) between measured and TDR-estimated volumetric soil moisture content (VSMC) for studied granular biochar (BCG) rates (corresponding graphical representations are given in Figure 2, Figure 3 and Figure 4). No data for BCG rates > 15%.
BC (%)M-1M-2M-3
Reg. Eq.R2Reg. Eq.R2Reg. Eq.R2
0 Y = 1.001 × x 2.54 0.91 Y = 1.026 × x 0.78 0.91 Y = 1.100 × x 8.32   # 0.91
5 Y = 1.333 × x 6.88 0.93 Y = 1.691   # × x 13.27   # 0.92 Y = 1.722   # × x 3.86 0.92
10 Y = 2.400   # × x 12.22   # 0.88 Y = 2.501   # × x 5.21 0.99 Y = 2.432   # × x 6.32 0.99
# Significant (p < 0.05) changes in slope (slope ≠ 1) and intercept (intercept ≠ 0) compared to the slope and the intercept of the 1:1 line. All regressions lines are significant with p < 0.000.

