Article

Multireaction Modeling of Lead (Pb) and Copper (Cu) Sorption/Desorption Kinetics in Different Soils

School of Plant, Environmental and Soil Sciences, Louisiana State University, Baton Rouge, LA 70803, USA
*
Authors to whom correspondence should be addressed.
Soil Syst. 2019, 3(2), 38; https://doi.org/10.3390/soilsystems3020038
Submission received: 30 April 2019 / Revised: 24 May 2019 / Accepted: 28 May 2019 / Published: 31 May 2019

Abstract

:
Batch kinetic experiments were carried out to quantify and describe the sorption/desorption of Cu and Pb in ten soils that exhibited a wide range of properties. Sorption isotherms were quantified using the Langmuir equation, whereas modeling of sorption/desorption kinetics was described using multireaction model (MRM). Results revealed the nonlinear sorption behavior of Cu and Pb in all soils. The ten soils exhibited higher affinity to Pb (6.4 to 36.5 mmol kg−1) in comparison to Cu (3.6 to 22.4 mmol kg−1). Simulation of Cu and Pb kinetic data indicated that the rate of sorption reaction was two orders of magnitude higher than the rate of release. Considering one irreversible site in addition to one-reversible kinetic site improved the estimation of rates of reaction for both Cu and Pb in acidic and alkaline soils. All soils exhibited sorption/desorption hysteresis where Pb-releases ranged between <0.2% and 14.4% of the total sorbed. The respective Cu releases ranged from <0.85% and 23.4%. The multireaction model, which was successful in describing Cu and Pb for all ten soils, provided insight into the processes of sorption/desorption of Cu and Pb in all soils.

1. Introduction

Sorption/desorption reactions in soils control the availability of copper (Cu) and lead (Pb) to plants and their mobility into the ground and surface waters. Entering of Cu into agricultural soils includes applications of micronutrient-Cu fertilizers, soils amendments such as biosolids, and Cu-pesticides. However, Cu is a trace element essential to plant growth. Excessive Cu supply causes potential toxicity and yield depression [1]. Lead is well known as a major soil contaminant and potentially toxic element that adversely affect human and animal health [2]. Tóth et al. [3] recounted the threshold values for Cu and Pb in agricultural soils as 100 and 60 mg kg−1, respectively, according to their ecological or health risks. Due to varying soil characteristics, wide-ranging soil guideline values have been reported especially for Pb [1,4,5,6]. The reactivities of Cu and Pb depend on various soil characteristics such as pH, cation exchange capacity (CEC), and soil contents of clay minerals, carbonates, oxides, and organic matter (OM). In addition to soil properties, environmental soil conditions, as well as physiochemical characteristics of the trace elements control the fate and behavior in soils [7,8]. Accurate prediction of Cu and Pb sorption/desorption in soils requires evaluation of numerous experimental data that are derived from various soils.
Soil heterogeneity results in the occurrence of multiple available sites to interact with Pb and Cu. Such diverseness initiates a complex system of sorption/desorption reactions on soil matrix surfaces. For instance, Martínez-Villegas and Martínez [9] showed that iron oxides exhibited the highest affinity to sorb Cu than both OM and montmorillonite as a subsequent to the equilibration time of one month; whereas a redistribution was followed afterward an additional 8-months of equilibration, then OM exhibited the highest affinity to retain Cu. Moreover, Cerqueira et al. [10] emphasized the positive correlation of increasing acidic soils affinities to sorb Cu and Pb with increasing clay fractions of vermiculite and chlorite, as well as the elevated level of Fe and Mn oxides. The binding strength of specific soil constituent to sorb Cu or Pb varies among different soils based on soil pH. Specifically, Peng et al. [11] applied a comprehensive modeling study using a chemical speciation model and revealed that soil OM was governing Cu sorption across a wide range of pH with a weak competition from Fe (hydr)oxide. Nevertheless, results of the speciation model revealed that Pb sorption depended on pH where clay minerals and OM controlled Pb sorption at low pH, but Fe (hydr)oxide was more significant at high pH.
Studies on the sorption/desorption of trace element in soils provide insight into their fate and potential mobility in the soil–water environment. Slow sorption reactions often result in high mobility of chemicals in soils, whereas slow desorption or release results in their immobility. Due to soil heterogeneity, several attempts to describe sorption/desorption kinetics coupled with chemical speciation equilibrium models were achieved. For example, Shi et al. [12] implied soil OM as the dominant adsorbent by considering two groups of sites to describe Cu and Pb sorption/desorption kinetics. They found that sites of bi- and tri-dentate group control desorption process on the long-term, whereas the monodentate sites did not. Peng et al. [13] considered OM, ferrihydrite, and goethite as binding phases. They reported that Pb exhibited fast kinetic sorption in acidic soils in less than 10 hours and that sorption was mainly controlled by soil OM and pH. Moreover, Undabeytia et al. [14] elucidated the role of the heterogeneity of retention sites for Cu on montmorillonite clay. These geochemical speciation models require a large number of parameters and a wide range of reaction databases [15]. It is impractical to comprise speciation of all soil constituents and their specific sites heterogeneity to quantify the kinetics of trace elements reactions in soils. In the current study, we considered a kinetic multi-reaction/site model with minimum fitting parameters to describe Cu and Pb sorption/desorption in ten different soils. The implemented multireaction model (MRM) was widely applied for simulating the kinetic behavior of different chemicals in soil [16,17,18,19]. The MRM examines various sorption/desorption processes, including reversible and irreversible reactions to describe trace elements kinetics in soils.
Hysteresis of trace elements sorption/desorption is a challenging phenomenon used to accurately predict kinetic chemicals behavior in soils. Such a non-singularity of sorption/desorption isotherms occurred due to the difference between forward and backward rate of reactions that varied for soil organic and inorganic phases under certain circumstances of pH and/or oxidation/reduction. Hysteresis can be observed for metals (e.g., Cu and Zn), metalloids (e.g., As), and even for ion exchange of some cations [20]. A literature review revealed that sorption reactions of Cu and Pb are relatively rapid compared with desorption rate under natural conditions [21,22,23].
However, numerous studies investigated the sorption/desorption of Cu and Pb in soils. Most of these studies were focused on reactivity of specific soil constituent such as ferrihydrite [24], goethite [25], and clay minerals [26,27]. Further studies investigated the effect of different levels/contents of soil constituent on sorption/desorption processes such as OM [28], both of OM and redox gradient [29], Fe hydroxides and clay minerals [30]. Each soil constituent exhibits a specific rate and binding strength affinity to retain a chemical from the aquatic phase, which could vary by changing the ambient soil circumstances. Eventually, total sorption of a chemical in the soil is a sum of all fractions that are retained into different soil constituents. A literature review revealed that few studies examined the sorption/desorption of Cu and Pb for soils having distinctly different properties. The aim of this study was to quantify and model the sorption/desorption of Cu and Pb on ten soils that exhibited a wide range of properties. We considered the dissimilarities of major soil characteristics such as pH, soil particle size distribution, total carbon (TC), and CEC. Our specific objectives were: (i) evaluating Cu and Pb sorption capacity after 1- and 7-days of equilibration; (ii) quantifying major differences between Cu and Pb sorption/desorption among the different soils; and (iii) using model simulations to describe retention kinetics of Cu and Pb for all ten soils.

2. Materials and Methods

2.1. Sorption/Desorption Experiments

Quantifying Cu and Pb sorption/desorption was carried out using batch kinetic experiments for ten different soils. Soil texture among chemical properties such as pH, total carbon (TC), cation exchange capacity (CEC), and CaCO3 content are given in Table 1. Soil taxonomy, particles size distribution and methodology of soil analyses were presented in a previous study [31]. For sorption/desorption studies, reagent grade of Cu(NO3)2 and Pb(NO3)2 were applied for preparing a series of 0.239, 0.538, 0.966, and 1.473 mmol L−1 of Cu and 0.287, 0.657, 1.483, 1.823 mmol L−1 of Pb. All solutions were prepared using 5 mmol L−1 KNO3 as a background solution. In duplicated Teflon centrifuge tubes, 3 g of each soil was mixed with 30 mL Cu or Pb solution. The tubes were shaken on a reciprocal shaker for one day that was followed by seven days at 150 rpm. Subsequently, tubes were centrifuged for 10 min at 1300× g. For each sorption time (1-day and 7-days), a 5 mL aliquot was sampled to quantify the residual Cu or Pb concentrations in the aquatic phase. After the second sorption step, the remaining solution in each tube was replaced with 30 mL of the background solution, 5 mmol L−1 KNO3, to initiate five desorption kinetic steps. For each step, after shaking the tubes for 2–4 days equilibration time, a 5 mL aliquot was sampled then the remaining solution was replaced with 30 mL of 5 mmol L−1 KNO3. Inductively coupled plasma–atomic emission spectrometry (ICP–AES; Spectro Citros CCD) was used for measuring Cu and Pb concentration in the collected aliquot samples.

2.2. Modeling and Data Analyses

Sorption isotherm, relation between the sorbed amount (S) after 1-day or 7-days vs. the respective solution concentration at equilibrium Ce of Cu or Pb, was quantified using Langmuir equation ( S S m a x = k L C e 1 + k L C e , where Smax is the sorption capacity (mmol kg−1), and kL (L mmol−1) is the Langmuir coefficient). Fitting was performed using nonlinear least square optimization method by coding Langmuir equation via SigmaPlot 11.2 software package (Systat Software, San Jose, CA, USA).
To describe sorption/desorption kinetic data, a multireaction model (MRM) was utilized to simulate the kinetics of the sorbed Cu or Pb for each soil. The MRM is a module of Chem-Transport software package [32]. A single reversible nonlinear kinetic site (S1) was tested according to:
S 1 t = k 1 ( θ ρ ) C n k 2   S 1
where, ρ and θ are the soil bulk density (g cm−3) and the water content (cm3 cm−3), respectively. The parameter n is a dimensionless reaction order estimated using 1-day sorption data set fitted by Freundlich equation (S = kf Cn, where kf is Freundlich parameter, L kg−1) (see [31]). The variable “t” represents the reaction time (h). The parameters k1, and k2 are the forward and backward rates of reactions. For evaluating the role of irreversible reaction/site, two scenarios were tested. First, we considered a consecutive irreversible reaction on (Ss) site in addition to the reversible site S1. Here, the simulation was realized according to:
S 1 t = k 1 ( θ ρ ) C n ( k 2 + k 3 ) S 1
S s t = k 3 S 1
where, k3 represent the consecutive-irreversible rate of reaction. For the second scenario, a concurrent irreversible site (Sirr) in addition to the reversible site, S1, were considered according to Equation (1) and the following equation:
S i r r t = k irr ( θ ρ ) C
where, kirr represent the concurrent-irreversible rate of reaction.

3. Results and Discussion

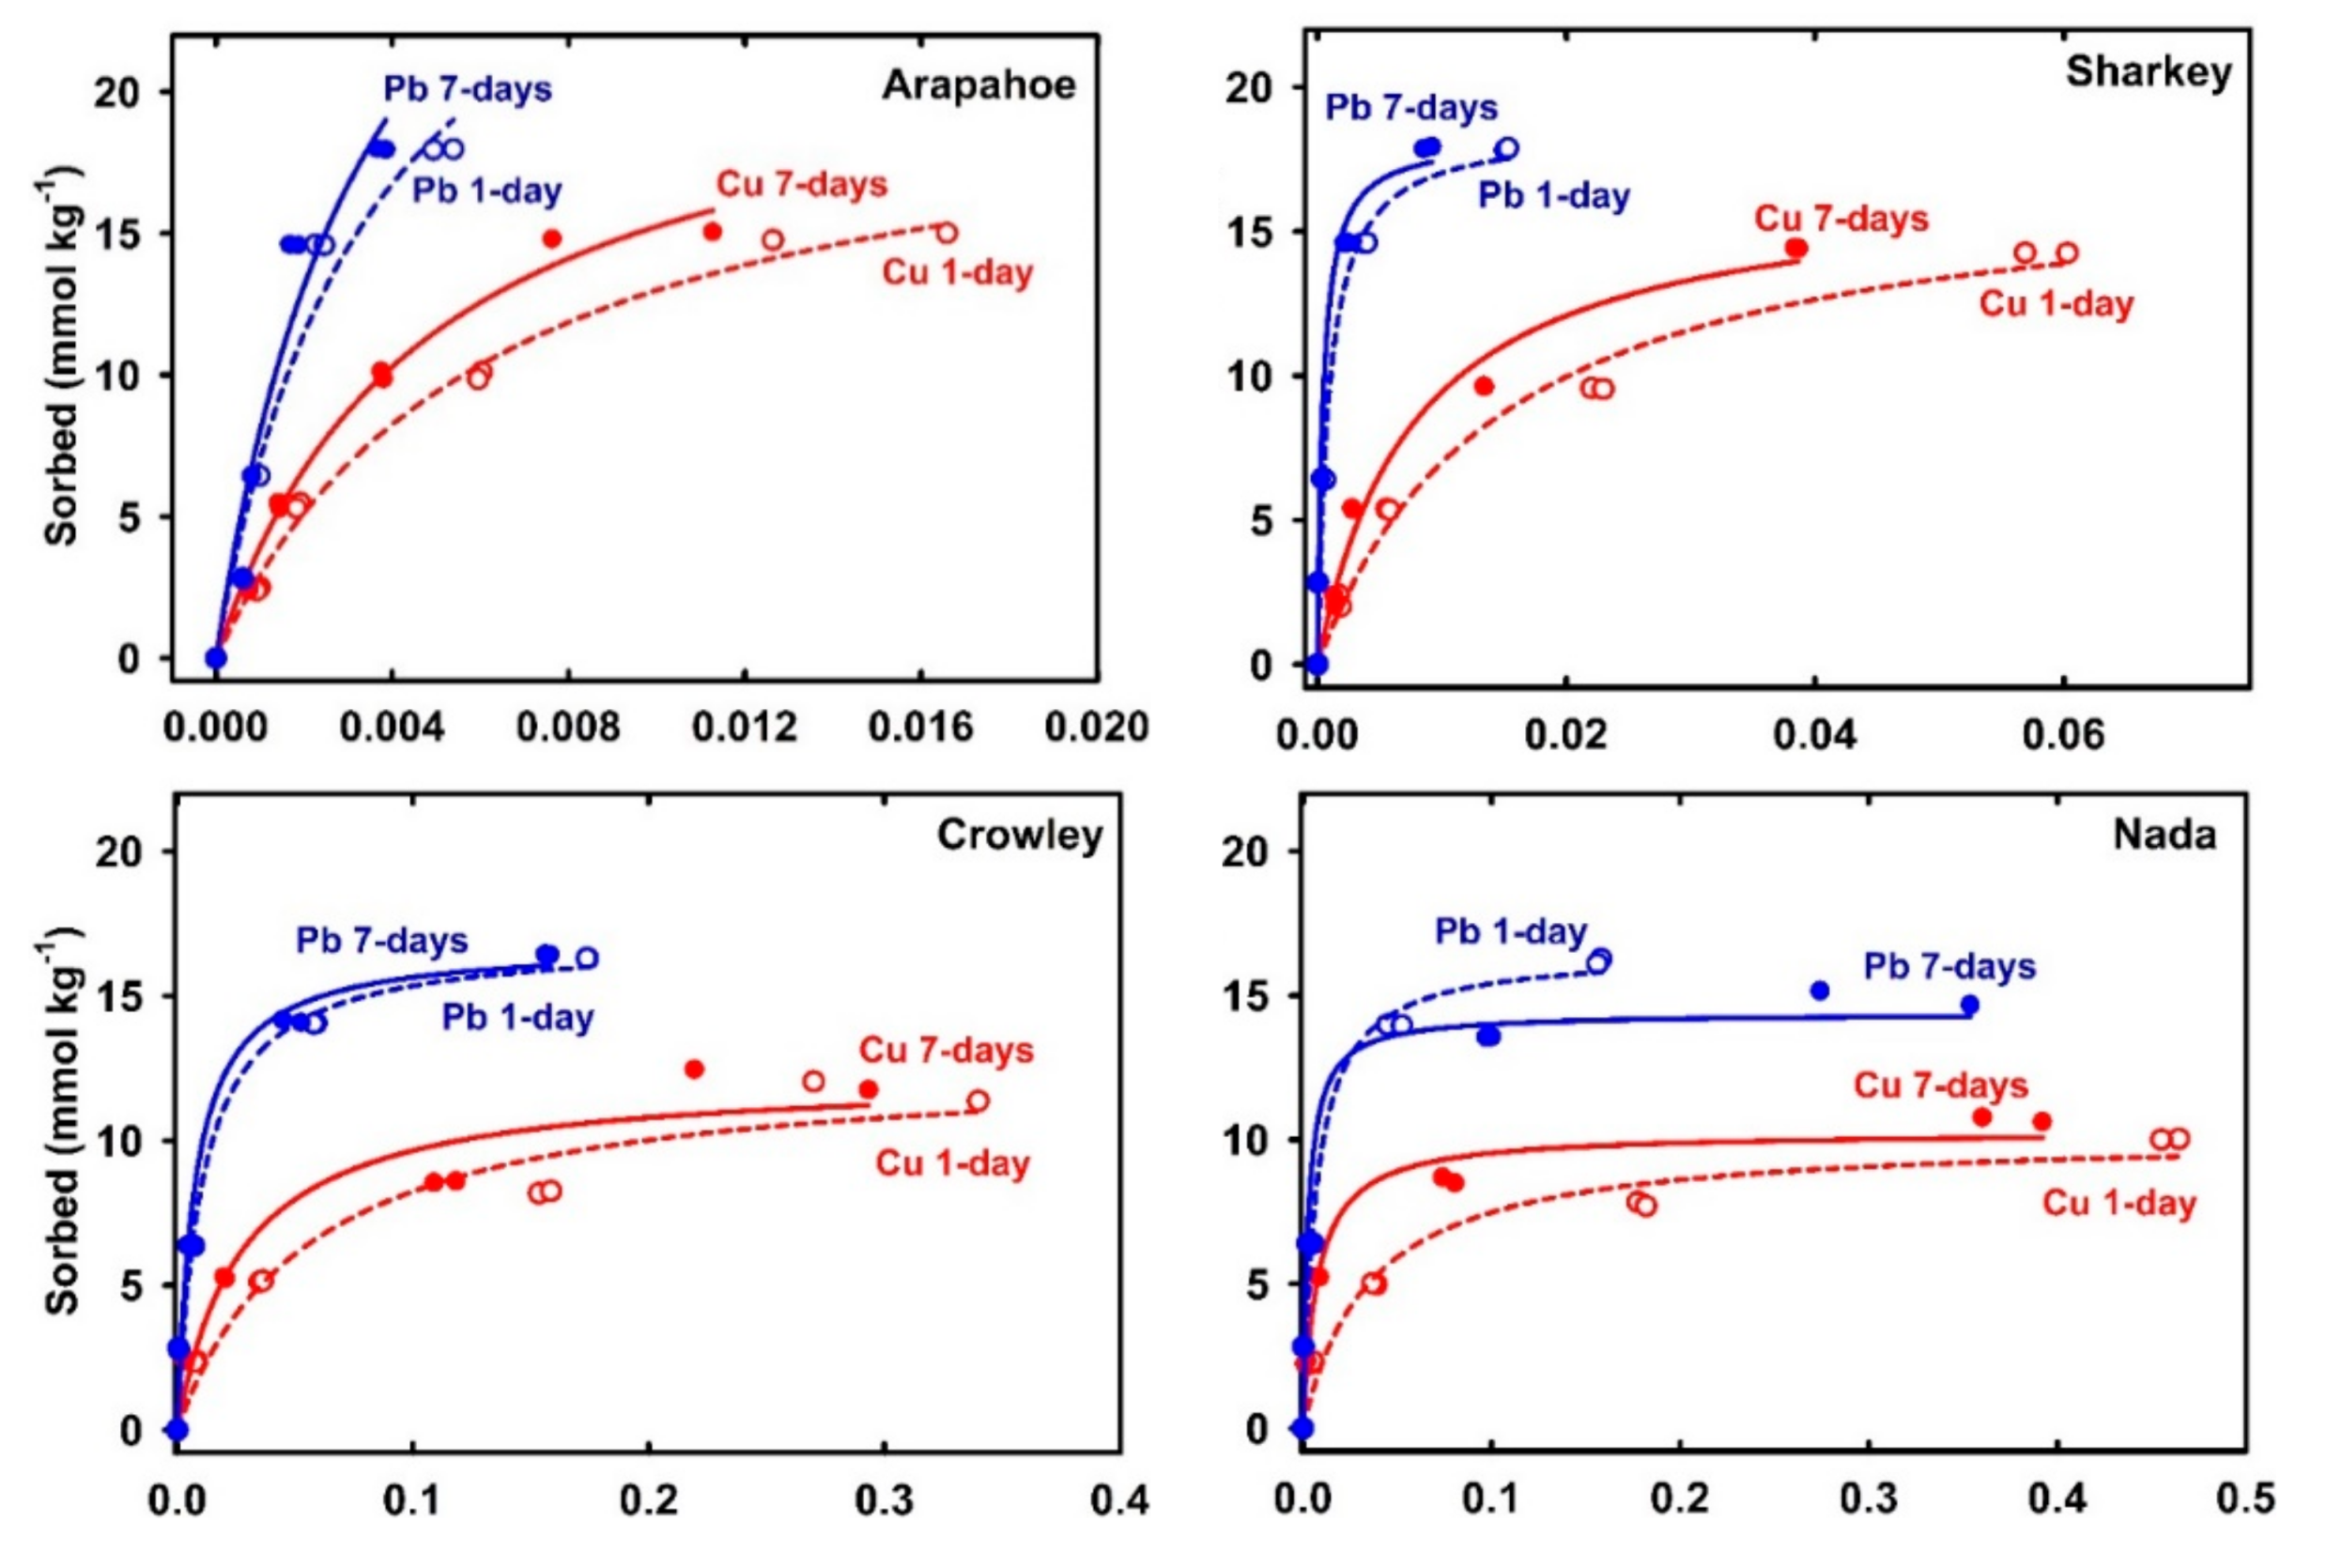
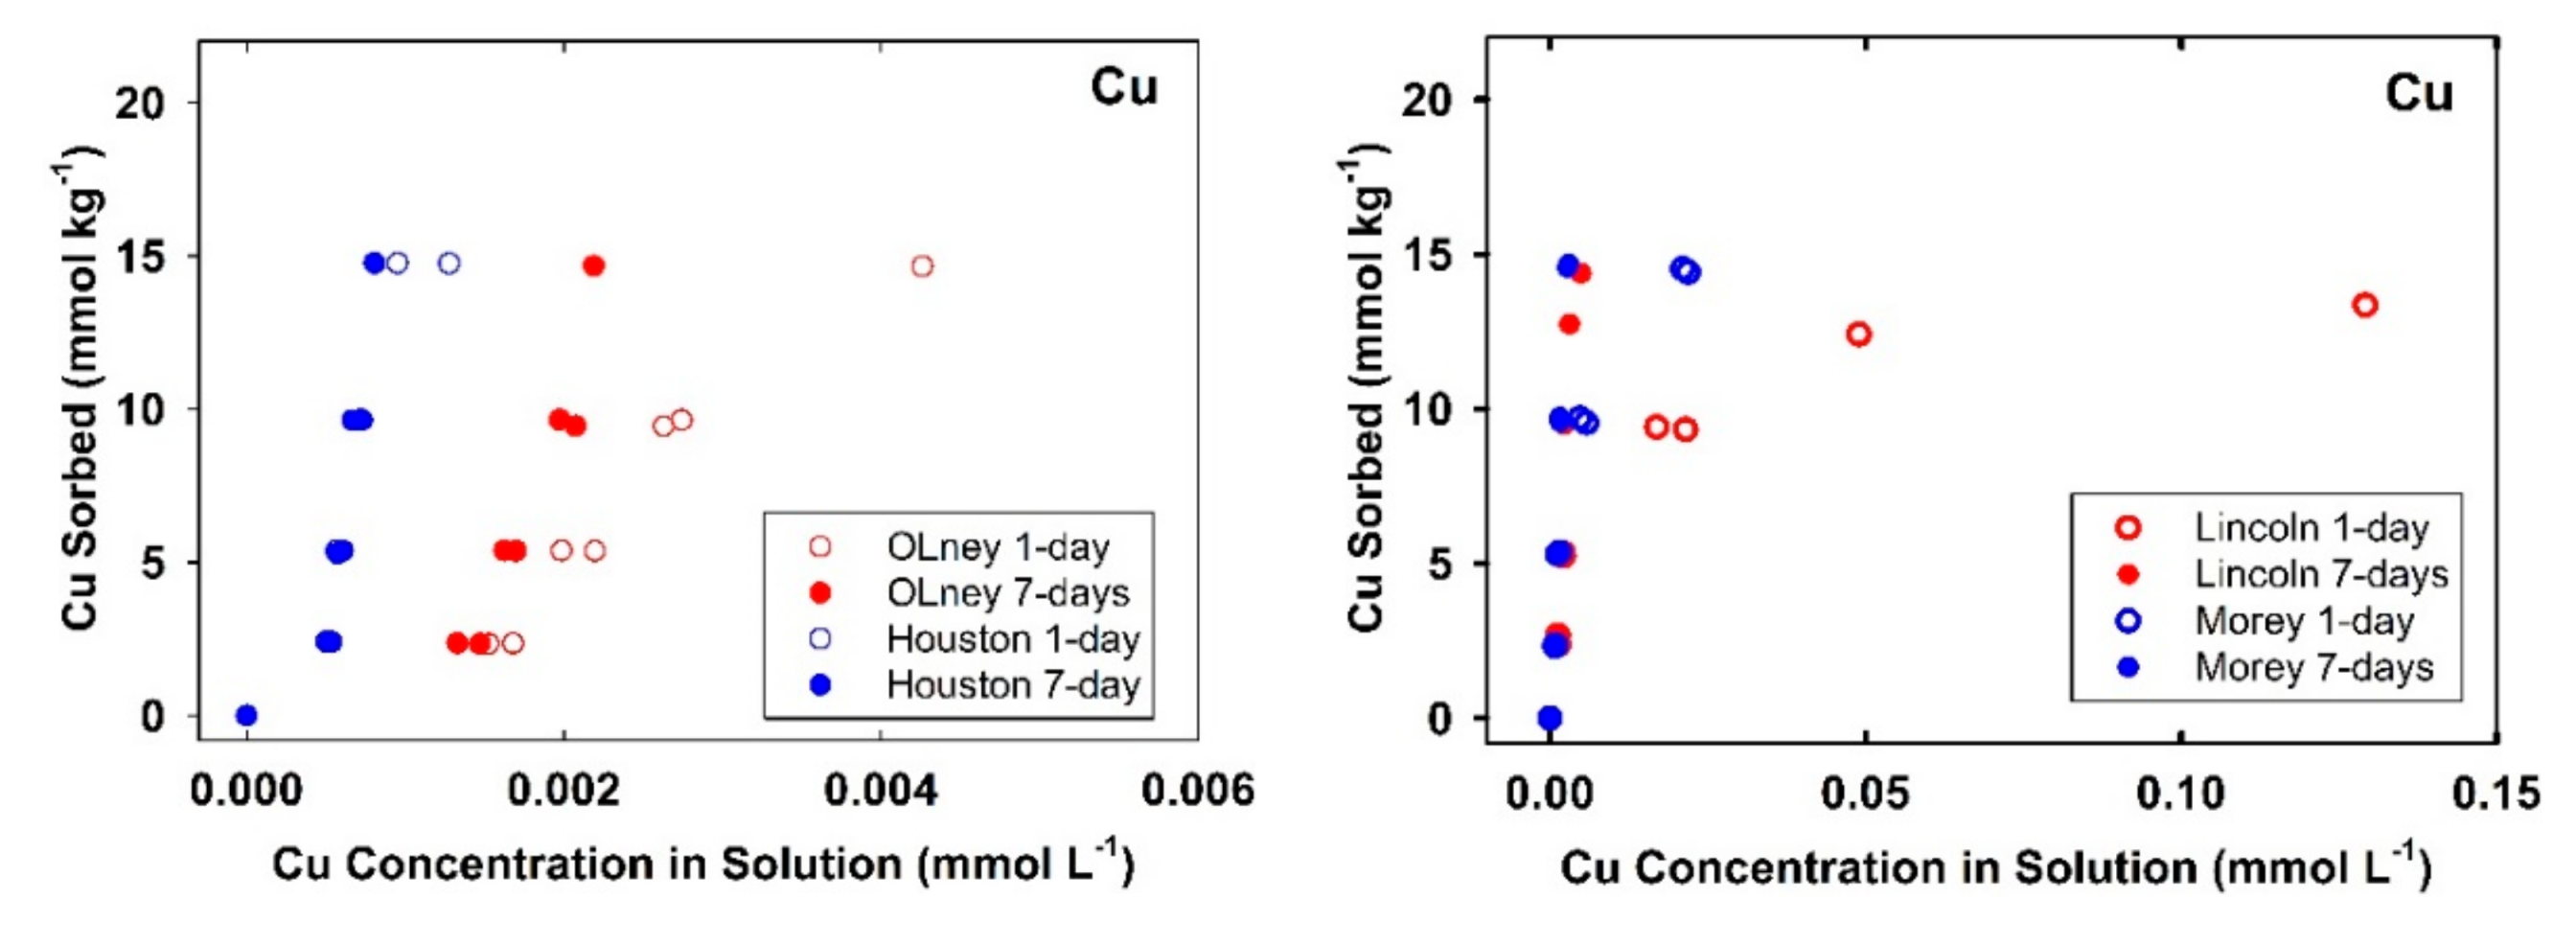
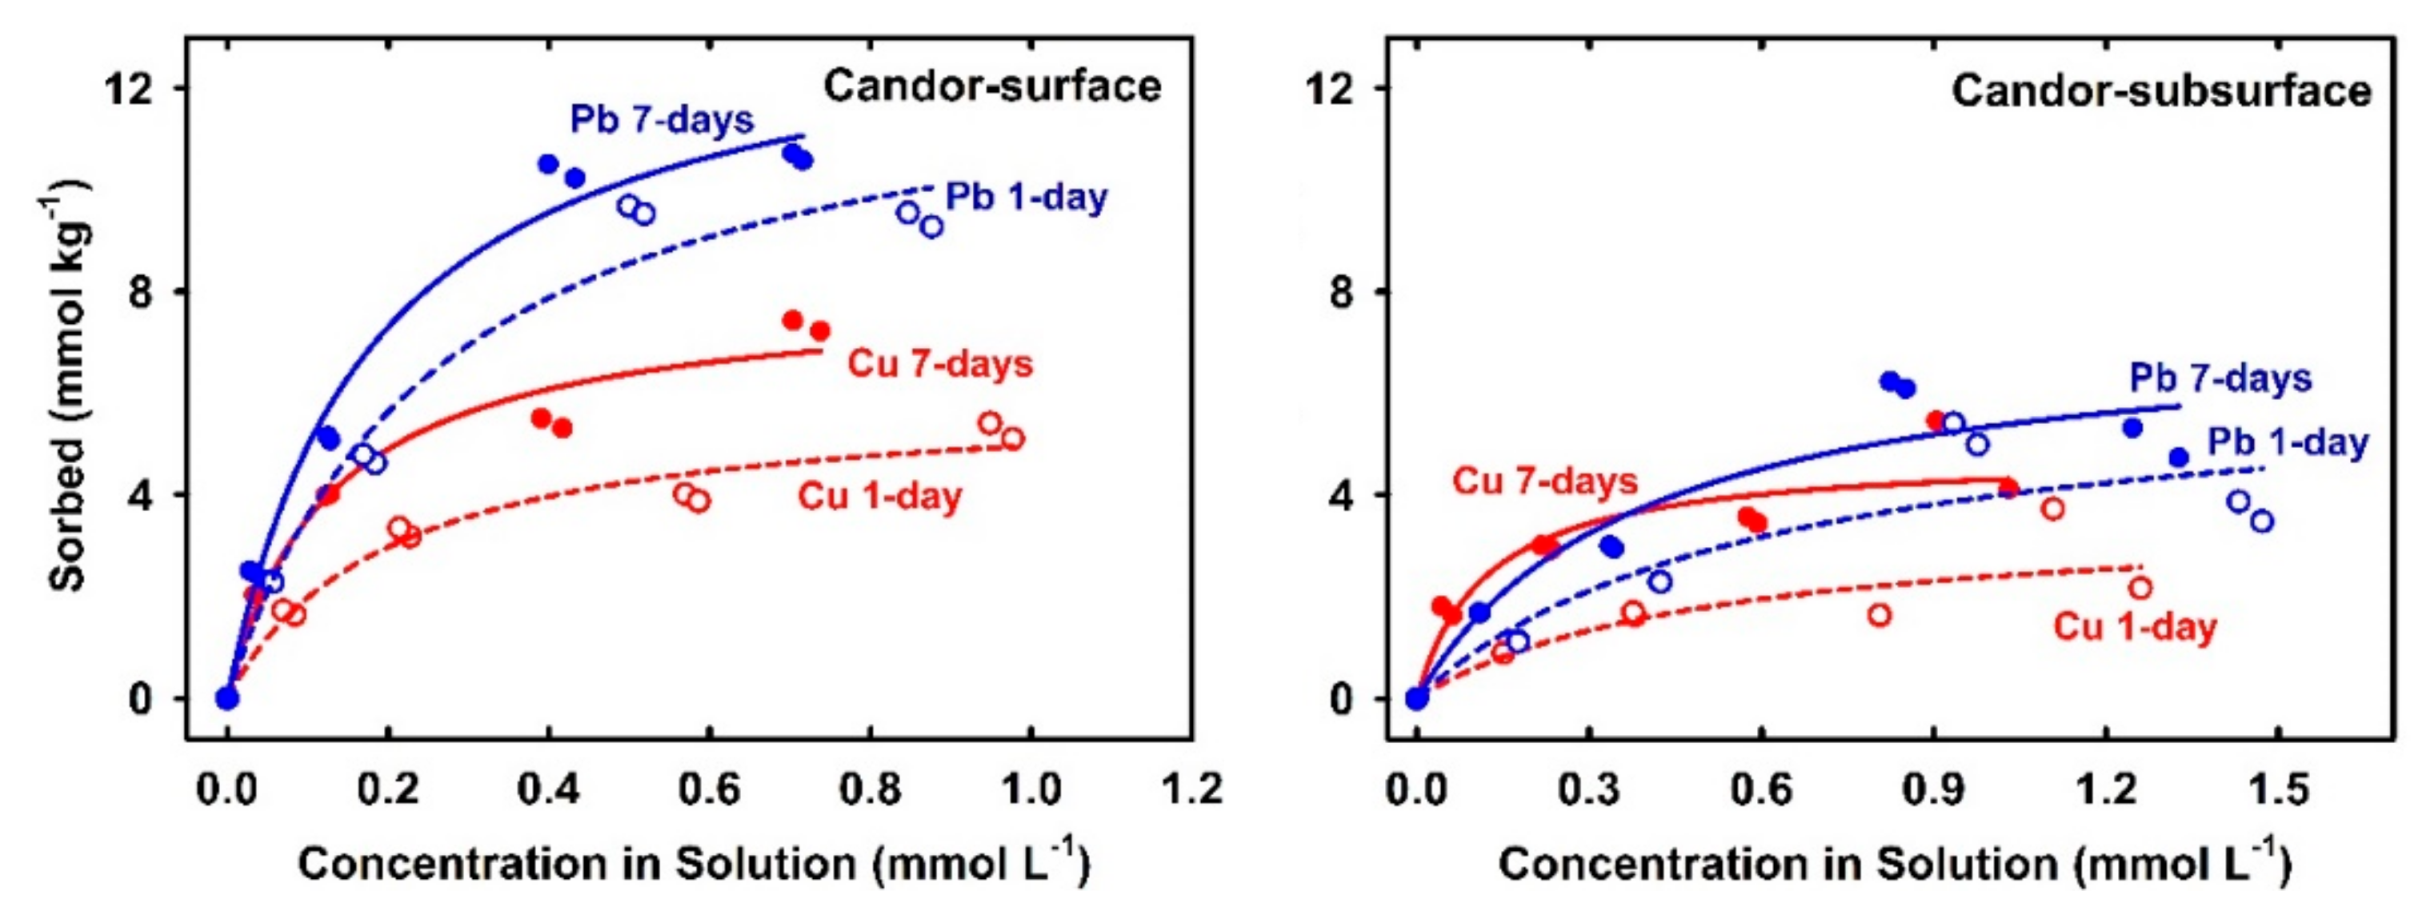
3.1. Sorption Isotherm

Sorption isotherm for any chemical signifies the relationship between the sorbed amount on soil and the associated concentration in solution after specific equilibration time. Figure 1 represents Cu and Pb sorption isotherms for acidic soils after 1-day and 7-days. All isotherms indicated strong nonlinear behavior with higher soil affinity for Pb in comparison to Cu. Furthermore, the sorbed amount tended to reach a plateau, i.e., a maximum sorption level. On the other hand, isotherms for alkaline soils (Olney, Houston, Lincoln, and Morey) indicated that Cu and Pb did not reach a maximum sorption capacity (Figure 2). Such behavior was confirmed by the results of Langmuir simulations presented in Table 2. Specifically, Cu-maximum sorption capacities in the acidic soils extended from 3.6 mmol kg−1 (Candor-subsurface) to 22.4 mmol kg−1 (Arapahoe). The high Cu sorption capacity in these soils associated mainly with the high level of CEC that deduces the role of soil OM and clay contents. Soil OM exhibits high affinity to sorb Cu by forming strong inner-sphere surface complexes [22,33]. Based on chemical speciation modeling, Peng et al. [13] elucidate that bidentate sites were mostly governing Cu sorption on soil OM, whereas tridentate sites may be dominant at low Cu concentration.
Langmuir simulations of sorption isotherms shown in Figure 1 verify the distinct sorption behavior on each acidic soil. For instance, soils with low sorption capacity such as Candor-surface and Candor-subsurface soils exhibited a gradual increase of the sorbed Cu, whereas soil with high sorption capacity such as Arapahoe exposed a sharp rise by increasing the applied Cu concentration. Alkaline soils exhibited a higher affinity for Cu than the acidic soils as indicated by the low Cu concentration in solution of <5 µmol L−1 at equilibrium for Olney and Houston soils (Figure 2). Langmuir fitting did not converge data for Cu sorption isotherm for all alkaline soils after 7-days and that for Olney and Houston after 1-day (Table 2). The non-convergence is due to the absence of the sorption plateau of those sorption isotherms despite the applied high initial Cu concentration (1.473 mmol L−1). Elbana and Selim [19] confirmed the higher Cu-affinity of alkaline soils than acidic soils by miscible displacement studies where alkaline soils sequestrated 40–73% and 99% for long and short applied-pulses, respectively.
Results of sorption experiments for 1-day and 7-days revealed a strong Cu sorption kinetic behavior on all soils. Specifically, results in Figure 1 and Figure 2 illustrate the increases of Cu sorption with increasing equilibration time. Based on standard error values of Langmuir parameters for all acidic soils, no significant increase in maximum sorption capacity, Smax, was observed except for Candor surface and subsurface soils. However, the affinity or binding strength parameter, KL increased by increasing equilibration time (Table 2). Alkaline soils exhibited stronger kinetic behavior than the acidic soils where Cu concentrations in solution sharply decreased to <2 µmol L−1 after 7-days equilibration time (Figure 2). Cu-sorption isotherms of the alkaline soils exhibited a strong deviation from the Langmuir model by increasing equilibration time (Figure 2). Such a deviation is indicative of the heterogeneity of sorption sites as well as the sorption on alkaline soils did not endorse a monolayer reaction, which are underlying assumptions for Langmuir isotherm.
Results of maximum sorption capacities for Pb on the alkaline soils after 1-day ranged from 7.7 mmol kg−1 (Morey) to 36.0 mmol kg−1 (Houston), whereas most applied Pb was sorbed after 7-days. Elbana et al. [8] reported that Pb exhibited the highest nonlinear sorption on several Egyptian calcareous soils compared with Cu, Zn, Cd, and Ni. Our results of Pb-maximum sorption capacities in the acidic soils extended from 6.4 mmol kg−1 (Candor-subsurface) to 36.5 mmol kg−1 (Arapahoe). Elbana et al. [23] reported similar high sorption capacities maxima for a nonlinear Pb retention in range of 19.37 to 24.77 mmol kg−1 for two acidic soils. As indicated in Figure 1, the lowest Pb retention for Candor-subsurface soil was doubled for Candor-surface. Such intensification in the sorbed amount for the surface layer can be ascribed to the fact of its four times TC content higher than that of the subsurface layer (Table 1). This TC in acidic soils can be considered as organic carbon where no carbonates were detected. Strawn and Sparks [28] stated that removing OM from an acidic soil reduced total sorbed Pb by 40% compared to the untreated soil with 2.1% OM. Sorption isotherms of Arapahoe and Sharkey soils exhibited accelerated sorbed amounts that did not reach a specific level or maximum sorption by increasing applied concentration. Nada and Crowley soils exhibited a steep sorption isotherm that was terminated with well-defined Pb sorption maxima (Figure 1).
Based on values of stander errors, acidic soils exhibited insignificant numerical variation in Pb-maximum sorption capacities between 1-day and 7-days equilibration times (Table 2). However, Langmuir affinity parameter, KL increased with equilibration time for Crowley, Sharkey, and Nada soils (Table 2). The Pb-Sorption isotherms of alkaline soils exhibited a sharp deviation from the Langmuir model as contact time increased (Figure 2). Such divergence of soil affinity behavior indicates a time-dependent effect on Pb-sorption particularly for Lincoln and Morey soils. Low Pb concentrations in the solution at equilibrium associated with Olney and Houston soils revealed the higher affinity to retain Pb than Lincoln and Morey soils. In general, results of Pb sorption isotherms revealed that each soil exhibited higher affinity to sorb Pb than Cu. The only exception is that for Morey soil where Pb sorption was lower for Cu after 1-day reaction (Table 2). However, the sorbed amount on Morey soil of Pb (15.76 ± 0.03 mmol kg−1) was slightly higher than the sorbed Cu (14.62 ± 0.07 mmol kg−1) for the highest applied initial concentration after 7-days of equilibration time. Slow sorption kinetics of Pb on Morey soil in contrast with Houston, Olney, and Lincoln soils, can be attributed to the absence of CaCO3 (Table 1). In fact, precipitation of PbCO3 in calcareous soils is anticipated because of the reaction of Pb with the dissolved carbonate as confirmed by X-ray diffraction, scanning electron microscopic, and thermogravimetric studies [34].

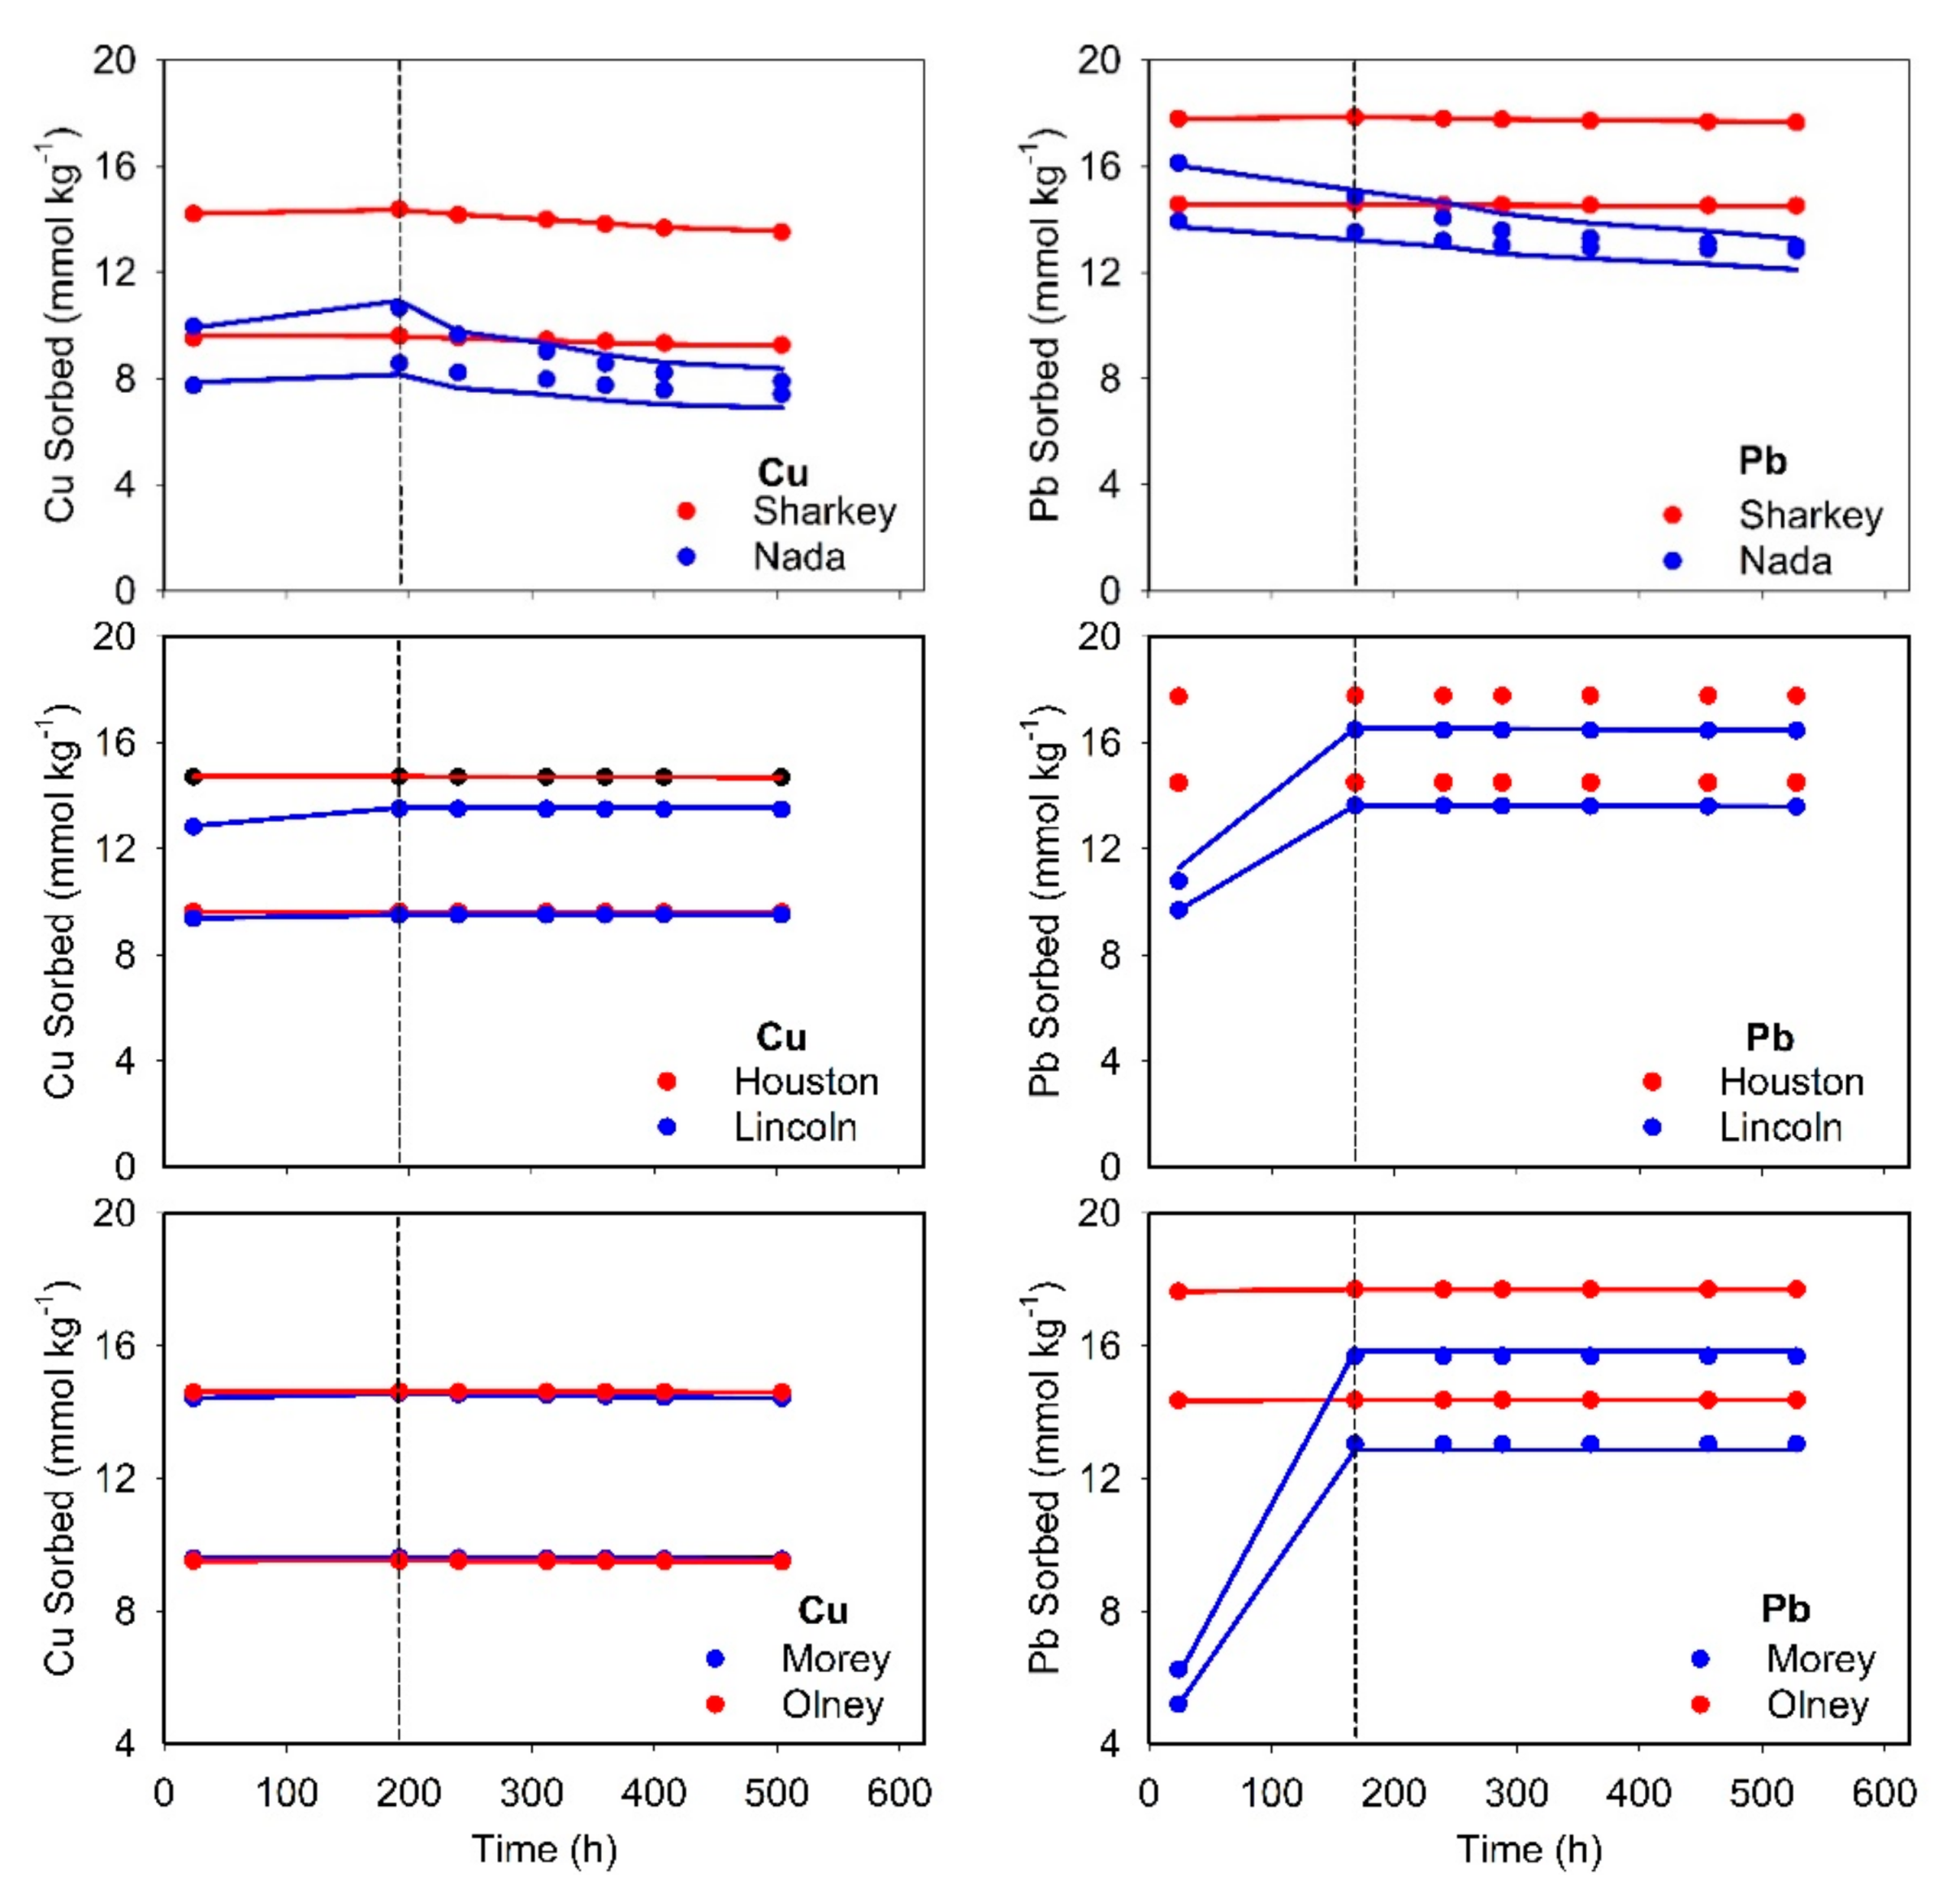
3.2. Sorption/Desorption Kinetics

Kinetics of the sorbed Cu and Pb versus time during sorption/desorption reactions are shown in Figure 3. Different scenarios were evaluated using MRM in an effort to describe the kinetic behavior of both elements. All experimental data for sorption and desorption were treated as one-data set for MRM simulations to arrive at best estimated of kinetic rate-parameters [32]. First, the one-reversible kinetic site was assumed to simulate Cu or Pb chemical behavior. Results for Cu revealed that the forward rate of reaction (k1, sorption) is, at least, higher by two orders of magnitude than the rate of backward reaction (k2, desorption) (Table 3). For instance, the highest ratios (k1/k2 of >3500) were associated with the alkaline Houston and Olney soils, whereas a value of only 12 was associated with acidic Condor-surface and subsurface soils. The respective ratios for the alkaline Lincoln and Morey soils were 177 and 183, respectively. The large ratio indicated the limited reversibility of Cu sorption. For acidic soils, Arapahoe soil exhibited the maximum ratio, k1/k2, of 160 despite that Sharkey soil was characterized by the highest forward rate of reaction (Table 3). In agreement with our results, Bearup et al. [35] reported Cu desorption rates from acid and neutral soils that varied between 1.4 × 10⁻³ and 5.6 × 10⁻³ min−1.
The simulation results shown in Figure 3 signify the necessity of considering additional irreversible reaction. Therefore, two other scenarios were evaluated: (i) one-reversible kinetic site and one-concurrent irreversible site (S1 and Sirr); and (ii) one-reversible kinetic site and one-consecutive irreversible site (S1 and Ss). Based on the statistical parameters, fitting of Cu-kinetic data using these two conditions improved the simulations (Table 3). Only for Candor soils, considering the additional irreversible site did not improve the estimation of the kinetic parameters. The simulations of Cu-kinetics shown in Figure 3 were carried out by assuming the additional consecutive irreversible reaction that provided the best fitting of the experimental data. Such behavior of redistributing among sorption sites can be elucidated as an influence of dissolved Cu-organic complexes [9,12].
Estimated Pb kinetic parameters are presented in Table 4. The MRM simulation of Pb using one-reversible kinetic site revealed limited reversibility of Pb on our soils. Houston soil did not indicate the release of Pb sorbed after 7-days, whereas Olney soil exhibited limited desorption (small k2 value). The k1/k2 ratios for Lincoln and Morey soils were 1647 and 383, respectively. For acidic soils, the k1/k2 ratio ranged between 620 for Arapahoe soil and <1 for Candor-subsurface soil. A wide-ranging for k1/k2 ratios of 321 to 5369 have been reported for Pb reactivity in aquifer gravel material [36].
The results of Pb kinetics indicated the significant role of irreversible reaction in both alkaline and acidic soils. Therefore, two additional scenarios, comparable with Cu simulations, were considered for fitting Pb-kinetic experimental data. Assuming multi-reaction/sites for Pb sorption is highly acknowledged in the scientific literature. For instance, Elbana and Selim [37] found that calcareous soils exhibit strong affinity to retain Pb (>99.5 of the applied Pb) mainly on oxidizable, carbonates, and oxides soil constituents. According to the statistical parameters shown in Table 4, considering one-reversible kinetic site and the one-concurrent irreversible site provide the best-fit simulations for alkaline soils (Figure 3). Here, solute concentration in the solution phase was assumed to control directly irreversible- and kinetically reversible-sorbed Pb on alkaline soils. The best fit of Pb kinetic data on acidic soils was realized by accounting for one-reversible kinetic site and one-consecutive irreversible site scenario (S1 and Ss) (Figure 3). Such results for acidic soils can be speculated as to the occurrence of Pb outer-sphere reaction on the soil surface that followed by an inner-sphere complexation. Strawn and Sparks [28] emphasized the existence of two reactions for Pb in soil, where a fast reaction was in control for 78% of the total sorbed Pb followed by a rate-limited reaction. Based on spectroscopic studies, Pb tends to form an inner-sphere bidentate complex on soil minerals at high pH condition, whereas the formation of inner-sphere monodentate ternary is expected at low pH [38].

3.3. Cu and Pb Hysteresis

The variation of Cu and Pb sorbed amounts on soil with its associated equilibrium concentrations in solution during sorption and desorption processes are shown in Figure 4. Nonsingularities of Cu and Pb sorption/desorption isotherms signify the role of hysteresis reactions in our soils. Discrepancy between sorption from the desorption isotherms is indicative of kinetic as well as possible irreversible retention [39]. For the acidic soils, the average Cu released by the end of sorption/desorption experiments as a relative-fraction from 7-days sorbed amount were found to be in order of Candor-surface (23.4%) > Crowley (21.2%) > Nada (19.7%) > Sharkey (4.7%) > Candor-subsurface (4.2%) > Arapahoe (1.18%). Such a variation between Candor soils can be attributed to lower sorption capacity after 7-days for the subsurface soil (4.8 mmol kg−1) compared to the surface soil (8.0 mmol kg−1) (see Table 2, Figure 1). However, the respective Cu released from the alkaline soils was less than 0.85%. As expected, all soils exhibited lower released fractions of Pb compared with Cu (Figure 4).
The average Pb released from the acidic soils were found to be in descending order as Candor-surface (14.4%) > Candor-subsurface (11.0%) > Nada (8.8%) > Crowley (7.8%) > Sharkey (0.77%) > Arapahoe (0.41%). The releases of Pb from alkaline soils did not exceed 0.2% of the total sorbed after 7-days. Such strong hysteresis indicate the absence of ion-exchange reaction between Pb cations and protons on the studied soils. In agreement with our findings, Cerqueira et al. [10] found that soils with high to moderate pH, high effective CEC, and elevated levels of Mn/Fe oxides exhibited the highest Cu and Pb sorption irreversibility. Moreover, with experimental circumstance of low pH < 5, Gao et al. [21] showed substantial deviation between Pb sorption/desorption isotherms by replacing the supernatant with free Pb solution and the hysteresis was increased upon aging.

4. Summary and Conclusions

The study of Cu and Pb sorption/desorption was conducted by batch experiments and modeling of their kinetic behavior on ten soils. Sorption isotherms of Cu and Pb indicated nonlinear chemical behavior and strong retention of both elements. Each soil exhibited higher affinity to sorb and to retain Pb than Cu. The results revealed the increase of binding strength of Cu and Pb with soil by increasing equilibration period. Sorption/desorption isotherms of Cu and Pb exhibited hysteresis phenomenon that indicated substantial irreversibility of Cu and Pb in the studied soils. The highest fraction of the desorbed Pb as a portion of the total sorbed was less than 15%, whereas the respective value for Cu was 23.4%. Soil OM and CaCO3 contents control sorption/desorption for acidic and alkaline soils, respectively. Furthermore, the multireaction model provided the best fit of kinetic parameters by considering the irreversible reaction/site beside kinetic reversible one for both acidic and alkaline soils. The obtained kinetic data can be applied to assess leaching and availability of Cu and Pb in soils.

Author Contributions

Conceptualization: T.A.E. and H.M.S.; methodology: H.M.S.; formal analysis: T.A.E. and H.M.S.; investigation: T.A.E. and H.M.S.; resources: H.M.S.; data curation: T.A.E.; writing—original draft preparation: T.A.E.; writing—review and editing: T.A.E. and H.M.S.; supervision: H.M.S.; project administration: H.M.S.; funding acquisition: H.M.S.

Funding

This work was funded by the Louisiana Agricultural Experimental Station, LSU and in part by a grant from USDA-ARS, Tempe, TX.

Acknowledgments

The authors would like to thank Scott Senseman of Texas A&M who provided several soils used in this research. The authors would also like to thank Nazanin Akrami and April Newman for their help in the laboratory.

Conflicts of Interest

The authors declare no conflict of interest. The funders had no role in the design of the study; in the collection, analyses, or interpretation of data; in the writing of the manuscript, or in the decision to publish the results.

References

  1. Alloway, B.J. Heavy metals and metalloids as micronutrients for plants and animals. In Heavy Metals in Soils: Trace Metals and Metalloids in Soils and their Bioavailability, Environmental Pollution, 3rd ed.; Alloway, B.J., Trevors, J.T., Eds.; Springer: Dordrecht, The Netherlands, 2013; Volume 22, pp. 195–210. [Google Scholar]
  2. Hough, R.L. Copper and lead. In Trace Elements in Soils; Hooda, P.S., Ed.; Blackwell Publishing Ltd.: Oxford, UK, 2010; pp. 421–640. [Google Scholar]
  3. Tóth, G.; Hermann, T.; Da Silva, M.R.; Montanarella, L. Heavy metals in agricultural soils of the European Union with implications for food safety. Environ. Int. 2016, 88, 299–309. [Google Scholar] [CrossRef] [PubMed]
  4. Dorsey, A.; Ingerman, L.; Swarts, S. Toxicological Profile for Copper; Department of Health and Human Services, Public Health Service, Agency for Toxic Substances and Disease Registry: Atlanta, GA, USA, 2004. [Google Scholar]
  5. Abadin, H.; Ashizawa, A.; Stevens, Y.; Llados, F.; Diamond, G.; Sage, G.; Citra, M.; Quinones, A.; Bosch, S.J.; Swarts, S.G. Toxicological Profile for Lead; Department of Health and Human Services, Public Health Service, Agency for Toxic Substances and Disease Registry: Atlanta, GA, USA, 2007. [Google Scholar]
  6. Kabata-Pendias, A.; Mukherjee, A.B. Trace Elements from Soil to Human; Springer-Verlag: Berlin/Heidelberg, Germany, 2007; 556p. [Google Scholar]
  7. OECD. Guidelines for the Testing of Chemicals. Test Number 106, Adsorption—Desorption Using a Batch Equilibrium Method; Organization for Economic Co-operation and Development, OECD: Paris, France, 2000; 44p. [Google Scholar] [CrossRef]
  8. Elbana, T.; Gaber, H.M.; Kishk, F.M. Soil chemical pollution and sustainable agriculture. In The Soils of Egypt; El-Ramady, H., Alshaal, T., Bakr, N., Elbana, T., Mohamed, E., Belal, A.A., Eds.; World Soils Book Series; Springer: Basel, Switzerland, 2019; pp. 187–200. [Google Scholar] [CrossRef]
  9. Martínez-Villegas, N.; Martínez, C.E. Importance of dynamic soil properties in metal retention: An example from long-term Cu partitioning and redistribution studies using model systems. Environ. Sci. Technol. 2012, 46, 8069–8074. [Google Scholar] [CrossRef]
  10. Cerqueira, B.; Covelo, E.F.; Andrade, M.L.; Vega, F.A. Retention and mobility of copper and lead in soils as influenced by soil horizon properties. Pedosphere 2011, 21, 603–614. [Google Scholar] [CrossRef]
  11. Peng, S.; Wang, P.; Peng, L.; Cheng, T.; Sun, W.; Shi, Z. Predicting heavy metal partition equilibrium in soils: roles of soil components and binding sites. Soil Sci. Soc. Am. J. 2018, 82, 839–849. [Google Scholar] [CrossRef]
  12. Shi, Z.; Di Toro, D.M.; Allen, H.E.; Sparks, D.L. A general model for kinetics of heavy metal adsorption and desorption on soils. Environ. Sci. Technol. 2013, 47, 3761–3767. [Google Scholar] [CrossRef] [PubMed]
  13. Peng, L.; Liu, P.; Feng, X.; Wang, Z.; Cheng, T.; Liang, Y.; Lin, Z.; Shi, Z. Kinetics of heavy metal adsorption and desorption in soil: Developing a unified model based on chemical speciation. Geochim. Cosmochim. Acta 2018, 224, 282–300. [Google Scholar] [CrossRef]
  14. Undabeytia, T.; Nir, S.; Rytwo, G.; Serban, C.; Morillo, E.; Maqueda, C. Modeling Adsorption−Desorption Processes of Cu on Edge and Planar Sites of Montmorillonite. Environ. Sci. Technol. 2002, 36, 2677–2683. [Google Scholar] [CrossRef] [PubMed]
  15. Di Bonito, M.; Lofts, S.; Groenenberg, J.E. Models of geochemical speciation: Structure and applications. In Environmental Geochemistry; De Vivo, B., Belkin, H.E., Lima, A., Eds.; Elsevier: Amsterdam, The Netherlands, 2018; pp. 237–305. [Google Scholar] [CrossRef]
  16. Amacher, M.C.; Selim, H.M.; Iskandar, I.K. Kinetics of chromium(VI) and cadmium retention in soils; A nonlinear multireaction model. Soil Sci. Soc. Am. J. 1988, 52, 398–408. [Google Scholar] [CrossRef]
  17. Liao, L.; Selim, H.M.; DeLaune, R.D. Mercury adsorption-desorption and transport in soils. J. Environ. Qual. 2009, 38, 1608–1616. [Google Scholar] [CrossRef]
  18. Zhang, H.; Selim, H.M. Kinetics of arsenate adsorption-desorption in soils. Environ. Sci. Technol. 2005, 39, 6101–6108. [Google Scholar] [CrossRef] [PubMed]
  19. Elbana, T.A.; Selim, H.M. Copper Mobility in Acidic and Alkaline Soils: Miscible Displacement Experiments. Soil Sci. Soc. Am. J. 2011, 75, 2101–2110. [Google Scholar] [CrossRef]
  20. Selim, H.M. Nonlinear behavior of heavy metals in soils: Mobility and bioavailability. In Dynamics and Bioavailability of Heavy Metals in the Rootzone; Selim, H.M., Ed.; CRC/Taylor and Francis: Boca Raton, FL, USA, 2011; pp. 1–36. [Google Scholar]
  21. Gao, Y.; Kan, A.T.; Tomson, M.B. Critical evaluation of desorption phenomena of heavy metals from natural sediments. Environ. Sci. Technol. 2003, 37, 5566–5573. [Google Scholar] [CrossRef]
  22. Liu, P.; Wang, P.; Lu, Y.; Ding, Y.; Lu, G.; Dang, Z.; Shi, Z. Modeling kinetics of heavy metal release from field-contaminated soils: Roles of soil adsorbents and binding sites. Chem. Geol. 2019, 506, 187–196. [Google Scholar] [CrossRef]
  23. Elbana, T.A.; Sparks, D.L.; Selim, H.M. Adsorption-desorption of lead and tin in soils: Experimental and second-order modeling. Soil Sci. 2013, 178, 425–435. [Google Scholar] [CrossRef]
  24. Tian, L.; Liang, Y.; Lu, Y.; Peng, L.; Wu, P.; Shi, Z. Pb(II) and Cu (II) adsorption and desorption kinetics on Ferrihydrite with different morphologies. Soil Sci. Soc. Am. J. 2018, 82, 96–105. [Google Scholar] [CrossRef]
  25. Roe, A.L.; Hayes, K.F.; Chisholm-Brause, C.; Brown, G.E., Jr.; Parks, G.A.; Hodgson, K.O.; Leckie, J.O. In situ x-ray absorption study of lead ion surface complexes at the goethite-water interface. Langmuir 1991, 7, 367–373. [Google Scholar] [CrossRef]
  26. Rybicka, H.E.; Calmano, W.; Breeger, A. Heavy metals sorption/desorption on competing clay minerals; An experimental study. Appl. Clay Sci. 1995, 9, 369–381. [Google Scholar] [CrossRef]
  27. Hizal, J.; Apak, R.; Hoell, W.H. Modeling competitive adsorption of copper(ii), lead(ii), and cadmium(ii) by kaolinite-based clay mineral/humic acid system. Environ. Prog. Sustain. Energy 2009, 28, 493–506. [Google Scholar] [CrossRef]
  28. Strawn, D.G.; Sparks, D.L. Effects of soil organic matter on the kinetic and mechanisms of Pb(II) sorption and desorption in soil. Soil Sci. Soc. Am. J. 2000, 64, 144–156. [Google Scholar] [CrossRef]
  29. Mehlhorn, J.; Besold, J.; Pacheco, J.S.L.; Gustafsson, J.P. Copper mobilization and immobilization along an organic matter and redox gradient-insights from a Mofette site. Environ. Sci. Technol. 2018, 52, 13698–13707. [Google Scholar] [CrossRef] [PubMed]
  30. Sipos, P.; Tóth, A.; Kis, V.K.; Balázs, R.; Kovács, I.; Németh, T. Partition of Cd, Cu, Pb and Zn among mineral particles during their sorption in soils. J. Soils Sediments 2018, 19, 1775–1787. [Google Scholar] [CrossRef]
  31. Elbana, T.A.; Selim, H.M.; Akrami, N.; Newman, A.; Shaheen, S.; Rinklebe, J. Freundlich sorption parameters for cadmium, copper, nickel, lead, and zinc for different soils: Influence of kinetics. Geoderma 2018, 324, 80–88. [Google Scholar] [CrossRef]
  32. Selim, M. Chem_Transport Software Models for Chemical Kinetic Retention and Transport in Soils and Geological Media User’s Manual; School of Plant, Environmental and Soil Science, LSU-Agcenter: Baton Rogue, LA, USA, 2016; Available online: http://www.spess.lsu.edu/chem_transport/ (accessed on 25 March 2019).
  33. Basta, N.T.; Ryan, J.A.; Chaney, R.L. Trace element chemistry in residual-treated soil: Key concepts and metal bioavailability. J. Environ. Qual. 2005, 34, 49–63. [Google Scholar] [CrossRef] [PubMed]
  34. Hu, H.; Zhang, Q.; Yuan, W.; Li, Z.; Zhao, Y.; Gu, W. Efficient Pb removal through the formations of (basic) carbonate precipitates from different sources during wet stirred ball milling with CaCO3. Sci. Total Environ. 2019, 664, 53–59. [Google Scholar] [CrossRef] [PubMed]
  35. Bearup, L.A.; Navarre-Sitchler, A.K.; Maxwell, R.M.; McCray, J.E. Kinetic metal release from competing process in aquifers. Environ. Sci. Technol. 2012, 46, 6539–6547. [Google Scholar] [CrossRef] [PubMed]
  36. Pang, L.; Close, M.; Schneider, D.; Stanton, G. Effect of pore-water velocity on chemical nonequilibrium transport of Cd, Zn, and Pb in alluvial gravel columns. J. Contam. Hydrol. 2002, 57, 241–258. [Google Scholar] [CrossRef]
  37. Elbana, T.A.; Selim, H.M. Lead mobility in calcareous soils: Influence of cadmium and copper. Soil Sci. 2013, 178, 417–424. [Google Scholar] [CrossRef]
  38. Usiyama, T.; Fukushi, K. Predictive model for Pb(II) adsorption on soil minerals (oxides and low-crystalline aluminum silicate) consistent with spectroscopic evidence. Cosmochim. Acta 2016, 190, 134–155. [Google Scholar] [CrossRef]
  39. Selim, H.M. Sorption-desorption of trace elements in soils influence of kinetics. In Trace Elements in Waterlogged Soils and Sediments, 1st ed.; Rinklebe, J., Knox, A.S., Paller, M., Eds.; CRC Press, Taylor & Francis Group: Boca Raton, FL, USA, 2014; pp. 53–74. [Google Scholar]
Figure 1. Sorption isotherms of Cu and Pb for acidic soils. The dashed and solid curves are Langmuir simulation for 1- and 7-days, respectively.
Soilsystems 03 00038 g001aSoilsystems 03 00038 g001b
Figure 2. Experimental 1- and 7-days-sorption isotherms of Cu and Pb for alkaline soils.
Soilsystems 03 00038 g002aSoilsystems 03 00038 g002b
Figure 3. Sorbed Cu and Pb vs. time during sorption/desorption on different studied soils. Solid curves represent multireaction model simulations and the vertical dashed line shows beginning of desorption process.
Soilsystems 03 00038 g003aSoilsystems 03 00038 g003b
Figure 4. Hysteresis of Cu and Pb sorption/desorption on different studied soils. Curves represent multireaction model simulations.
Soilsystems 03 00038 g004
Table 1. Soil texture and selected chemical soil properties.
Soil SeriesSoil Texture pHTC (%)CEC (coml kg−1)Carbonates (%)
ArapahoeSandy Loam5.0210.2230.100.0
Candor-surfaceLoamy Sand4.392.245.300.0
Candor-subsurfaceSand4.050.561.700.0
CrowleySilt Loam5.221.1616.500.0
SharkeySilty Clay5.492.7639.700.0
NadaSandy Loam6.610.766.300.0
OlneySandy Loam8.121.1410.103.32
HoustonSilty Clay7.784.2647.7026.0
LincolnSandy Loam7.541.273.003.60
MoreyLoam7.741.0527.800.0
Soil texture according to USDA soil classification.
Table 2. Estimated Langmuir Cu and Pb sorption parameters ± standard errors and coefficients of determination (R2) for different soils after 1- and 7-days.
SoilSorption TimeCuPb
SmaxkLR2SmaxkLR2
(mmol kg−1)(L mmol−1)(mmol kg−1)(L mmol−1)
Arapahoe1d21.1 ± 1.1161.3 ± 18.70.99331.1 ± 5.2290.9 ± 93.30.958
7d22.4 ± 1.5211.9 ± 30.00.99036.5 ± 10.0281.2 ± 129.70.933
Candor-surface1d6.0 ± 0.45.0 ± 1.10.96513.08 ± 1.23.8 ± 0.90.970
7d8.0 ± 0.57.9 ± 1.80.96513.8 ± 0.95.6 ± 1.10.981
Candor-subsurface1d3.6 ± 1.31.9 ± 1.70.7106.4 ± 1.91.7 ± 1.20.803
7d4.8 ± 0.58.3 ± 3.60.8827.4 ± 1.22.6 ± 1.20.895
Crowley1d12.8 ± 1.118.2 ± 5.30.95416.9 ± 0.896.3 ± 20.90.976
7d12.2 ± 1.037.4 ± 11.80.94416.8 ± 0.9135.8 ± 36.40.964
Sharkey1d17.3 ± 1.068.0 ± 11.00.98618.6 ± 1.01098.1 ± 283.50.968
7d16.8 ± 1.0128.9 ± 23.80.98018.2 ± 0.62288.1 ± 370.80.986
Nada1d10.1 ± 0.628.2 ± 7.80.95616.5 ± 0.9141.1 ± 38.20.963
7d10.3 ± 0.4131.1 ± 25.00.97414.4 ± 0.9362.8 ± 133.30.934
Olney1dNC 17.9 ± 0.62391.6 ± 399.90.985
7dNC
Houston1dNC36.0 ± 10.0282.5 ± 133.40.930
7dNC
Lincoln1d12.8 ± 0.7238.6 ± 51.90.96314.1 ± 0.95.5 ± 1.10.982
7dNC
Morey1d16.8 ± 0.8270.7 ± 37.30.9857.7 ± 1.22.6 ± 1.10.904
7dNC
: Langmuir fitting did not converge.
Table 3. Multireaction kinetic model (MRM) parameter estimates for Cu sorption/desorption of reaction rates (k1, k2, k3, and kirr) ± their standard errors, with coefficient of determination (R2) and root mean square error (RMSE) values.
Soilk1 (h−1)k2 (h−1)k3 (h−1)kirr (h−1)R2RMSE
One reversible kinetic site
Arapahoe0.74 ± 0.010.0046 ± 0.0002----0.8490.09
Candor-surface0.32 ± 0.030.0265 ± 0.0026----0.9813.10
Candor-subsurface0.02 ± 0.000.0019 ± 0.0008----0.9814.12
Crowley0.91 ± 0.040.0296 ± 0.002----0.9191.58
Sharkey0.96 ± 0.010.0127 ± 0.0004----0.9300.24
Nada1.24 ± 0.050.0356 ± 0.002----0.9661.71
Olney0.19 ± 0.010.0001 ± 0----0.5910.04
Houston0.31 ± 0.010.0001 ± 0----0.4340.01
Lincoln1.46 ± 0.050.0083 ± 0.0022----0.7840.69
Morey1.08 ± 0.010.0059 ± 0.0003----0.9340.08
One reversible kinetic site and one concurrent irreversible site
Arapahoe0.48 ± 0.030.007 ± 0.001--0.0683 ± 0.01010.8990.07
Candor-surface32.87 ± 1.925.813 ± 0.211--0.0032 ± 0.00020.9832.42
Candor-subsurface11.55 ± 1.3310.545 ± 0.567--0.0024 ± 0.00020.9873.00
Crowley1.14 ± 0.120.052 ± 0.008--0.0058 ± 0.00080.9611.09
Sharkey0.88 ± 0.020.016 ± 0.001--0.0192 ± 0.00310.9600.19
Nada1.28 ± 0.070.041 ± 0.005--0.0015 ± 0.00110.9661.69
Olney4.73 ± 5.650.018 ± 0.012--1.5818 ± 0.26150.7720.04
Houston11.68 ± 0.160.009 ± 0.001--2.3836 ± 0.24770.6270.01
Lincoln0.63 ± 0.140.009 ± 0.005--0.0591 ± 0.01040.8200.63
Morey0.48 ± 0.030.008 ± 0.001--0.0877 ± 0.00610.9630.06
One reversible kinetic site and one consecutive irreversible site
Arapahoe0.8 ± 0.020.0065 ± 0.00050.0008 ± 0.0002--0.9140.07
Candor-surface0.38 ± 0.030.043 ± 0.0050.0023 ± 0.0004--0.9911.69
Candor-subsurface0.23 ± 0.370.1893 ± 0.34960.0123 ± 0.0033--0.9932.08
Crowley1.12 ± 0.080.0449 ± 0.00460.0009 ± 0.0002--0.9621.09
Sharkey1.05 ± 0.020.0163 ± 0.00080.0006 ± 0.0001--0.9670.17
Nada1.5 ± 0.110.0528 ± 0.00590.001 ± 0.0002--0.9771.26
Olney0.3 ± 0.080.0006 ± 0.00030.0074 ± 0.0009--0.8130.03
Houston0.35 ± 0.030.0001 ± 0.00000.0016 ± 0.0005--0.6420.01
Lincoln2.65 ± 0.090.0551 ± 0.00220.0126 ± 0.0008--0.8200.64
Morey1.09 ± 0.020.0061 ± 0.00080.0001 ± 0.0003--0.9340.08
Table 4. Multireaction kinetic model (MRM) parameter estimates for Pb sorption/desorption of reaction rates (k1, k2, k3, and kirr) ± their standard errors, with coefficient of determination (R2) and root mean square error (RMSE) values.
Soilk1 (h−1)k2 (h−1)k3 (h−1)kirr (h−1)R2RMSE
One reversible kinetic site
Arapahoe1.01 ± 0.010.0016 ± 0.0001----0.8730.09
Candor-surface0.33 ± 0.040.0243 ± 0.0042----0.92221.40
Candor-subsurface0.02 ± 0.0040.0262 ± 0.0073----0.96925.07
Crowley5.24 ± 0.160.0313 ± 0.0014----0.9103.42
Sharkey5.31 ± 0.030.014 ± 0.0002----0.9330.21
Nada17.91 ± 7.140.0979 ± 0.0388----0.9284.93
Olney7.17 ± 0.0100.000 ± 0.000----0.9230.21
Houston------------
Lincoln3.68 ± 0.060.0022 ± 0.0005----0.9746.66
Morey3.21 ± 0.170.0084 ± 0.0009----0.97711.66
One reversible kinetic site and one concurrent irreversible site
Arapahoe0.73 ± 0.120.002 ± 0.0002--0.0609 ± 0.02620.8770.09
Candor-surface31.05 ± 5.354.8184 ± 0.9139--0.0057 ± 0.00050.96012.57
Candor-subsurface5.34 ± 0.3015.0795 ± 0.6076--0.0022 ± 0.00030.97715.95
Crowley5.36 ± 0.260.0371 ± 0.0042--0.0059 ± 0.00290.9203.29
Sharkey4.88 ± 0.030.0145 ± 0.0002--0.0114 ± 0.00020.9280.22
Nada37.03 ± 0.870.207 ± 0.0055--0.001 ± 00.9235.10
Olney1.08 ± 0.0040.0089 ± 0.000--0.1491 ± 0.00030.9950.03
Houston------------
Lincoln1.65 ± 0.220.0094 ± 0.0036--0.0253 ± 0.00250.9845.07
Morey1.1 ± 0.20.005 ± 0.0029--0.012 ± 0.00140.9897.65
One reversible kinetic site and one consecutive irreversible site
Arapahoe1.05 ± 0.010.0021 ± 0.00010.0007 ± 0.0002--0.9260.07
Candor-surface115.76 ± 2.952.2015 ± 0.04130.0026 ± 0.0001--0.9828.15
Candor-subsurface4.84 ± 0.7514.0651 ± 0.3030.0077 ± 0.0012--0.97915.85
Crowley6.11 ± 0.320.0424 ± 0.00330.0006 ± 0.0001--0.9512.41
Sharkey5.38 ± 0.050.0147 ± 0.00040.0001 ± 0.0001--0.9310.21
Nada21.81 ± 2.510.1233 ± 0.01420.0002 ± 0.0001--0.9324.61
Olney9.2 ± 0.010.0172 ± 0.00010.0000 ± 0.0000--0.8520.17
Houston------------
Lincoln4.58 ± 0.240.021 ± 0.00430.0041 ± 0.0007--0.9746.72
Morey3.2 ± 0.170.0092 ± 0.00120.0014 ± 0.0003--0.97811.78

