Article

Phosphate Sorption Speciation and Precipitation Mechanisms on Amorphous Aluminum Hydroxide

1
Key Laboratory of Arable Land Conservation (Middle and Lower Reaches of Yangtze River), Ministry of Agriculture and Rural Affairs, College of Resources and Environment, Huazhong Agricultural University, Wuhan 430070, China
2
Department of Ecosystem Science and Management, University of Wyoming, Laramie, WY 82071, USA
3
Department of Geosciences, Stony Brook University, Stony Brook, New York, NY 11794-2100, USA
4
Department of Chemistry, Umeå University, SE-901 87 Umeå, Sweden
5
Canadian Light Source, University of Saskatchewan, Saskatoon, SK S7N 2V3, Canada
6
X-ray Science Division, Advanced Photon Source, Argonne National Laboratory, Argonne, IL60439, USA
*
Author to whom correspondence should be addressed.
Soil Syst. 2019, 3(1), 20; https://doi.org/10.3390/soilsystems3010020
Submission received: 14 January 2019 / Revised: 27 February 2019 / Accepted: 13 March 2019 / Published: 20 March 2019
(This article belongs to the Special Issue Using Synchrotron Radiation to Perform Phosphate Speciation in Soils)

Abstract

:
Aluminum (Al) oxides are important adsorbents for phosphate in soils and sediments, and significantly limit Phosphate (P) mobility and bioavailability, but the speciation of surface-adsorbed phosphate on Al oxides remains poorly understood. Here, phosphate sorption speciation on amorphous Al hydroxide (AAH) was determined under pH 3–8 and P concentration of 0.03 mM–15 mM using various spectroscopic approaches, and phosphate precipitation mechanisms were discussed as well. AAH exhibits an extremely high phosphate sorption capacity, increasing from 3.80 mmol/g at pH 7 to 4.63 mmol/g at pH 3. Regardless of reaction pH, with increasing P sorption loading, the sorption mechanism transits from bidentate binuclear (BB) surface complexation with dP-Al of 3.12 Å to surface precipitation of analogous amorphous AlPO4 (AAP), possibly with ternary complexes, such as (≡Al-O)2-PO2-Al, as intermediate products. Additionally, the percentage of precipitated phosphate occurring in AAP linearly and positively correlates with P sorption loading. Compared to phosphate reaction with ferrihydrite, phosphate adsorbs and precipitates more readily on AAH due to the higher solubility product (Ksp) of AAH. The formation of AAP particles involves AlIII release, which is promoted by phosphate adsorption, and its subsequent precipitation with phosphate at AAH surfaces or in the bulk solution.

Graphical Abstract

1. Introduction

Phosphorus (P) is one of the most limiting soil nutrients for agricultural and ecosystem productivity. To maintain or increase the crop productivity, massive phosphorus (P) fertilizers are applied into soils, while the utilization efficiency of P is low, usually less than 20% [1], since the majority of P was strongly sorbed by soil minerals, e.g., clay minerals, aluminum (Al) and iron (Fe) oxides [2,3,4,5]. This excess P could be a potential risk to the surface water quality due to transportation of P-sorbed colloidal particles by surface runoff and soil erosion [6]. The interactions between P and soil minerals are controlled by various physiochemical factors, such as pH, P loadings, and mineral phases. The prediction and assessment of P fate and bioavailability require the detailed knowledge of P speciation on mineral surface, which still remains poorly understood for phosphate sorption on Al oxides, a common mineral in acidic soils.
Phosphate mainly forms inner-sphere complexes on Fe and Al oxide surfaces via ligand exchange reaction [7,8,9,10,11,12,13,14,15]. That phosphate formed bidentate-binuclear (BB) complexes on ferrihydrite surfaces is based on the P–Fe interatomic distance (3.23 Å) of the complexes determined by differential atomic pair distribution function (d-PDF) analysis [15,16]. Additionally, Li et al. (2010 and 2013) investigated the adsorption mechanisms of phosphate on various Al minerals including gibbsite, boehmite (γ -AlOOH), corundum (α-Al2O3), and γ -Al2O3 by combining 31P solid state NMR and ATR-FTIR spectroscopy and quantum chemical calculations [17,18,19], and proposed a BB surface complex under various solution conditions, probably with minor monodentate-mononuclear (MM) complexes when samples were wet. However, the binding geometries of phosphate on Al minerals in those studies were inferred via indirect analytical approaches, and need to be confirmed. In addition, it remains unclear how the binding geometries of phosphate on Al minerals change with solution conditions.
Besides surface adsorption, phosphate can also form surface precipitates on Fe and Al oxide surfaces [16,17,20,21,22,23,24,25]. High-resolution solid-state NMR spectroscopy can be used to distinguish surface adsorption and precipitation of phosphate on Al oxides based on chemical shifts. By using 27Al and 31P NMR spectroscopy, a few studies have identified the formation of surface precipitates when phosphate adsorbs on various Al (hydr)oxides, including AAH, gibbsite, boehmite (γ-AlOOH), corundum (α-Al2O3), and γ-Al2O3. The precipitation is favored at higher P loadings, longer reaction time, and lower pH [17,22,23,24,25]. Phytate, an organic phosphate, also can form precipitates on AAH surfaces, probably involving ternary complexes as intermediate products [21]. However, the previous studies only describe the surface precipitates qualitatively, while the quantitative information about the precipitation with various environmental conditions remains unknown.
As a common Al mineral in soils and sediments, AAH can form at the earlier weathering process of K-feldspar and is a superior sorbent compared to other Al minerals because of its higher surface site density and reactivity [13,26,27]. Thus, we aim to determine the effects of pH and P loading on the structure of phosphate complexes and the amount of surface precipitates on AAH surfaces, and the nature and the formation mechanisms of surface precipitates. To reach these aims, interactions between phosphate and AAH were studied over wide pH (pH 3–8) and P concentration ranges (0.03–15 mM). The experimental conditions bracket variations in P concentration and soil pH in natural and agricultural soils. For example, the high P concentration (15 mM) used in the experiment can occur in the proximity of P fertilizer grains right after P fertilizer application [28]. The surface species, i.e., surface complexes and precipitates, were thoroughly characterized by synchrotron-based XRD, (d)-PDF, 31P and 27Al NMR, P K-edge XANES, and ATR-FTIR spectroscopy.

2. Materials and Methods

2.1. Synthesis of Amorphous Al(OH)3 and Amorphous AlPO4

Amorphous Al(OH)3 (AAH) was synthesized by dropwise adding of 0.5 M NaOH into 300 mL of 0.167 M AlCl3 solution until pH 6 under stirring conditions at room temperature (21 ± 0.5 °C). After the suspension pH stabilized, the suspension was further stirred for 24 h. Amorphous AlPO4 (AAP) was prepared at room temperature by adding dropwise 0.5 M NaOH into 1 L deionized water containing 5 g AICI3·6H2O and 9 g KH2PO4 until pH 3.8 was reached. The suspension was then further stirred at room temperature overnight [22]. The obtained AAH and AAP solids were washed with deionized water until the electric conductivity of the supernatant dropped below 20 µS/cm and then air dried and stored at 4 °C in a refrigerator.

2.2. Phosphate Sorption Isotherms and Kinetics

The sorption isotherms were obtained by reacting 2 g/L AAH with 0.03–15 mM phosphate in 10 mM NaNO3 solution at pH 3–8 and room temperature. The P solution was taken from a stock solution of 25 mM Na3PO4 that was stored at 4 °C and used within one day. The total suspension volume was 40 mL. Each P-loaded suspension was shaken for 24 h, during which the pH was maintained at the target value by adding 0.1 or 1 M HNO3 or NaOH solution. After that, each suspension was vacuum filtered through 0.22 μm membrane to minimize the residual P solution. The obtained wet solids on the membrane were air-dried, ground, and stored at 4 °C for the following characterizations. The sorption samples were air dried because wet samples cannot be used for the PDF analysis. Vacuum filtration was used to minimize the amount of the residual solution to mitigate the potential precipitation of P from the solution during drying. Total dissolved P and Al concentration in the filtrates was measured by inductively coupled plasma optical emission spectrometer (ICP-AES).
The sorption kinetics were evaluated by reacting 2 g·L−1 AAH with 8 mM P in 10 mM NaNO3 solution at pH 5 and room temperature. The total volume of the suspension was 200 mL and the reaction lasted for 96 h under stirring conditions. At pre-determined time intervals, a 3 mL suspension was sampled and immediately filtered through a 0.22 μm membrane syringe filter, and the dissolved P and Al in the filtrate were measured by ICP-AES. Each isotherm and kinetic run was made in duplicates. At selected time points, a 20 L suspension was withdrawn and vacuum filtered through 0.22 μm membrane, and the membrane-loaded wet solids were treated as the isotherm samples for subsequent P speciation and solid characterizations.

2.3. XRD, PDF and Infrared Spectroscopy

Total X-ray scattering data for the air-dried isotherm samples were collected using X-rays of 58.66 keV (λ = 0.2114 Å) for both XRD and PDF analyses at beamline 11-ID-B at the Advanced Photon Source (APS), Argonne National Laboratory. The procedures for data collection and processing were described previously [29]. d-PDFs were obtained by subtracting the PDF of the unreacted AAH from the PDF of each sorption sample by minimizing the intensity of edge-sharing Al-Al peak at 2.85 Å. We did not minimize the Al–O peak intensity at 1.89 Å to get d-PDFs because precipitates and the ternary complexes, if present, also contain the Al–O peak; otherwise, these species cannot be identified [16]. The XRD patterns of the dried and wet kinetic samples were collected using X-rays of 28.84 keV (λ = 0.4521 Å) at beamline 17-BM-B at APS. The detailed methods and procedures are described in the Supporting Information (SI-1).
Attenuated total reflectance Fourier transform infrared (ATR-FTIR) spectra of the dried isotherm samples were collected with a PerkinElmer spectrometer using the single bounce model with a diamond internal reflection element (IRE) at ambient temperature. The samples were coated directly on the diamond crystal surface and pressed tightly by a pressure head. Thirty-two scans (~1.5 min) were collected against air and the diamond background for each sample with a resolution of 4 cm−1.
Multivariate curve resolution (MCR) [30] analyses of both PDFs and ATR-FTIR spectra were carried out to assist in our further interpretation of the experimental data by extracting linearly-independent components explaining the variance in the data. All calculations were made using the program MCR-ALS [30] in the computational environment of MATLAB 2016 (The Mathworks, Inc., Natick, MA, USA). The detailed methods and procedures are similar as those described in our recent study [31].

2.4. Phosphorus K-Edge XANES Spectroscopy

Phosphorus K-edge X-ray absorption spectra of the dried isotherm samples and AAP were collected at the soft X-ray microcharacterization beamline (SXRMB) equipped with Si (111) and InSb (111) double-crystal monochromators at the Canadian Light Source (CLS), Saskatoon, Canada. The operating condition of the storage ring in CLS was 2.9 GeV with a maximum current of 250 mA. The AAP and phosphate sorption samples were spread on P free carbon tape adhered to a copper stick and measured in vacuum. The spectra were collected in fluorescence mode using a four-element Si-drift fluorescence detector. Multiple scans were collected for each sample. The program SixPack [32] was used to average the XAS spectra, whereas background removal and post-edge normalization of the averaged spectra, as well as XANES linear combination fitting (LCF) analysis in the energy range of 2132–2182 eV, were performed with the program Athena [33].

2.5. 27Al and 31P NMR Spectroscopy

Solid-state 27Al and 31P single-pulse MAS (SP/MAS) NMR spectra of the dried isotherm samples and references were collected on a 500 MHz (11.7 T) Varian Infinity-plus spectrometer. The 31P and 27Al SP/MAS NMR spectra were collected at operating frequencies of 202.32 MHz and 130.23 MHz respectively using Varian/Chemagnetics T3-type sample probe assemblies, with samples contained in 4 mm (o.d.) ZrO2 rotors at a spinning rate of 15 kHz for the 27Al experiments and 10 kHz for 31P. The 31P chemical shifts (δP) are reported relative to an external 85% H3PO4 solution, and the 27Al chemical shifts (δAl) relative to Al(OH2)63+ (aq) in the form of a 0.1 M AlCl3 solution. The 27Al SP-MAS spectra were acquired under quantitative acquisition conditions, using 0.5 μs pulses (B1 field corresponding to 4.5 μs non-selective 90° pulse) and 0.5 s relaxation delays. Acquired with these parameters, the spectra were fully relaxed. Complete relaxation under these conditions was verified by acquiring a series of spectra with longer pulses (1 μs) and relaxation delays varying from 0.5 to 20 s, which showed no significant change in intensity. The 31P spectra were acquired using 5 μs 90° pulse and relaxation delays of 80–120 s. The 31P relaxation was estimated from saturation-recovery experiments which yielded T1 values that varied from 17 s to 34 s among the samples. These acquisition conditions correspond to approximately 95% recovery, but no differential relaxation effects were observed in the spectra profiles.

3. Results

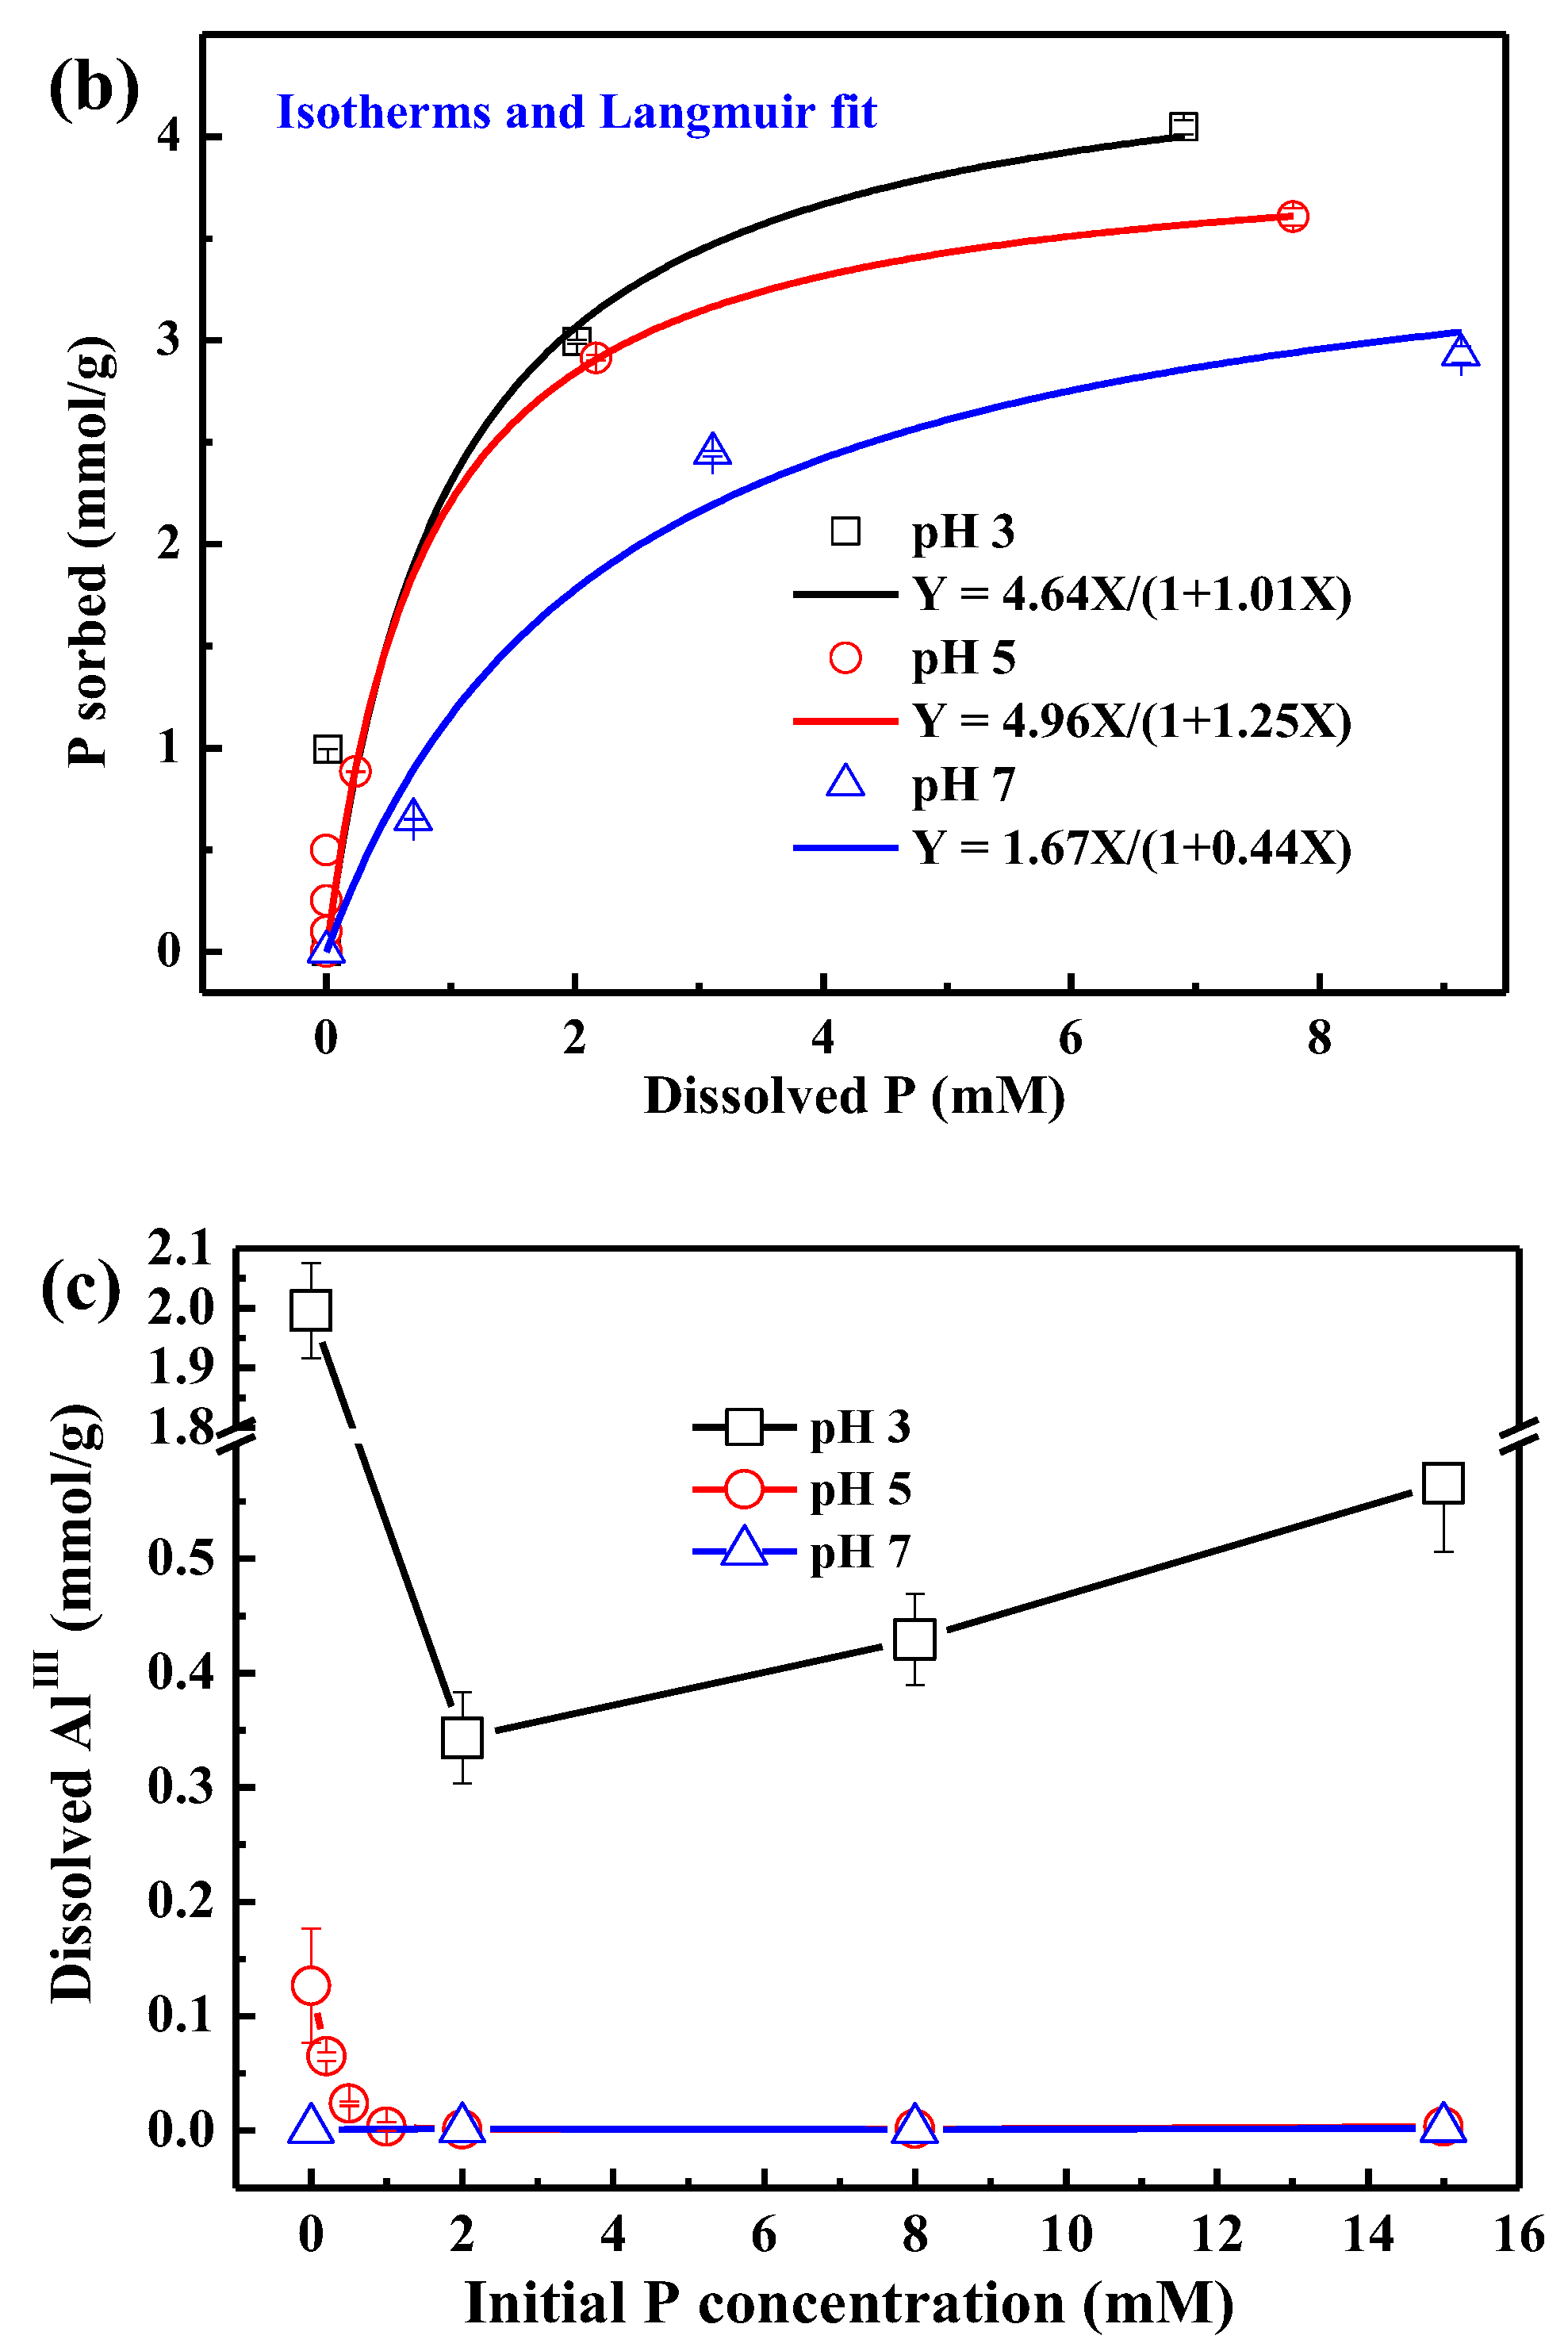
3.1. Sorption Kinetics and Isotherms

For the sorption kinetics at pH 5, phosphate sorption increases sharply within the first 10 h but slowly afterwards (Figure 1a). The phosphate 24 h isotherms at various pH values indicate that phosphate sorption is favored at lower pH. The 24-h sorption capacities (Qmax) obtained from the Langmuir model are 4.63, 3.97, and 3.80 mmol/g at pH 3, 5, and 7, respectively (Figure 1b).
In the absence of phosphate, the dissolved AlIII in the bulk solution decreases with increasing pH and is not detectable at pH 7 (Figure 1c, see the first point of each condition). In the presence of phosphate, the dissolved AlIII versus initial P concentration differs remarkably at different pH (Figure 1c). At pH 7, dissolved AlIII is not detected in the presence of phosphate. At pH 5, the dissolved AlIII decreases with increasing initial P concentration and is undetectable when the initial P concentration is higher than 1 mM P, suggesting that phosphate inhibits AlIII release into the bulk solution. At pH 3, the dissolved AlIII firstly decreases and then increases with increasing initial P concentration, indicating that low P loading inhibits the release of AlIII into the solution, while high P loading promotes it. The increase of dissolved AlIII at high P loading and pH 3 might indicate the formation of more soluble Al-phosphate complexes.

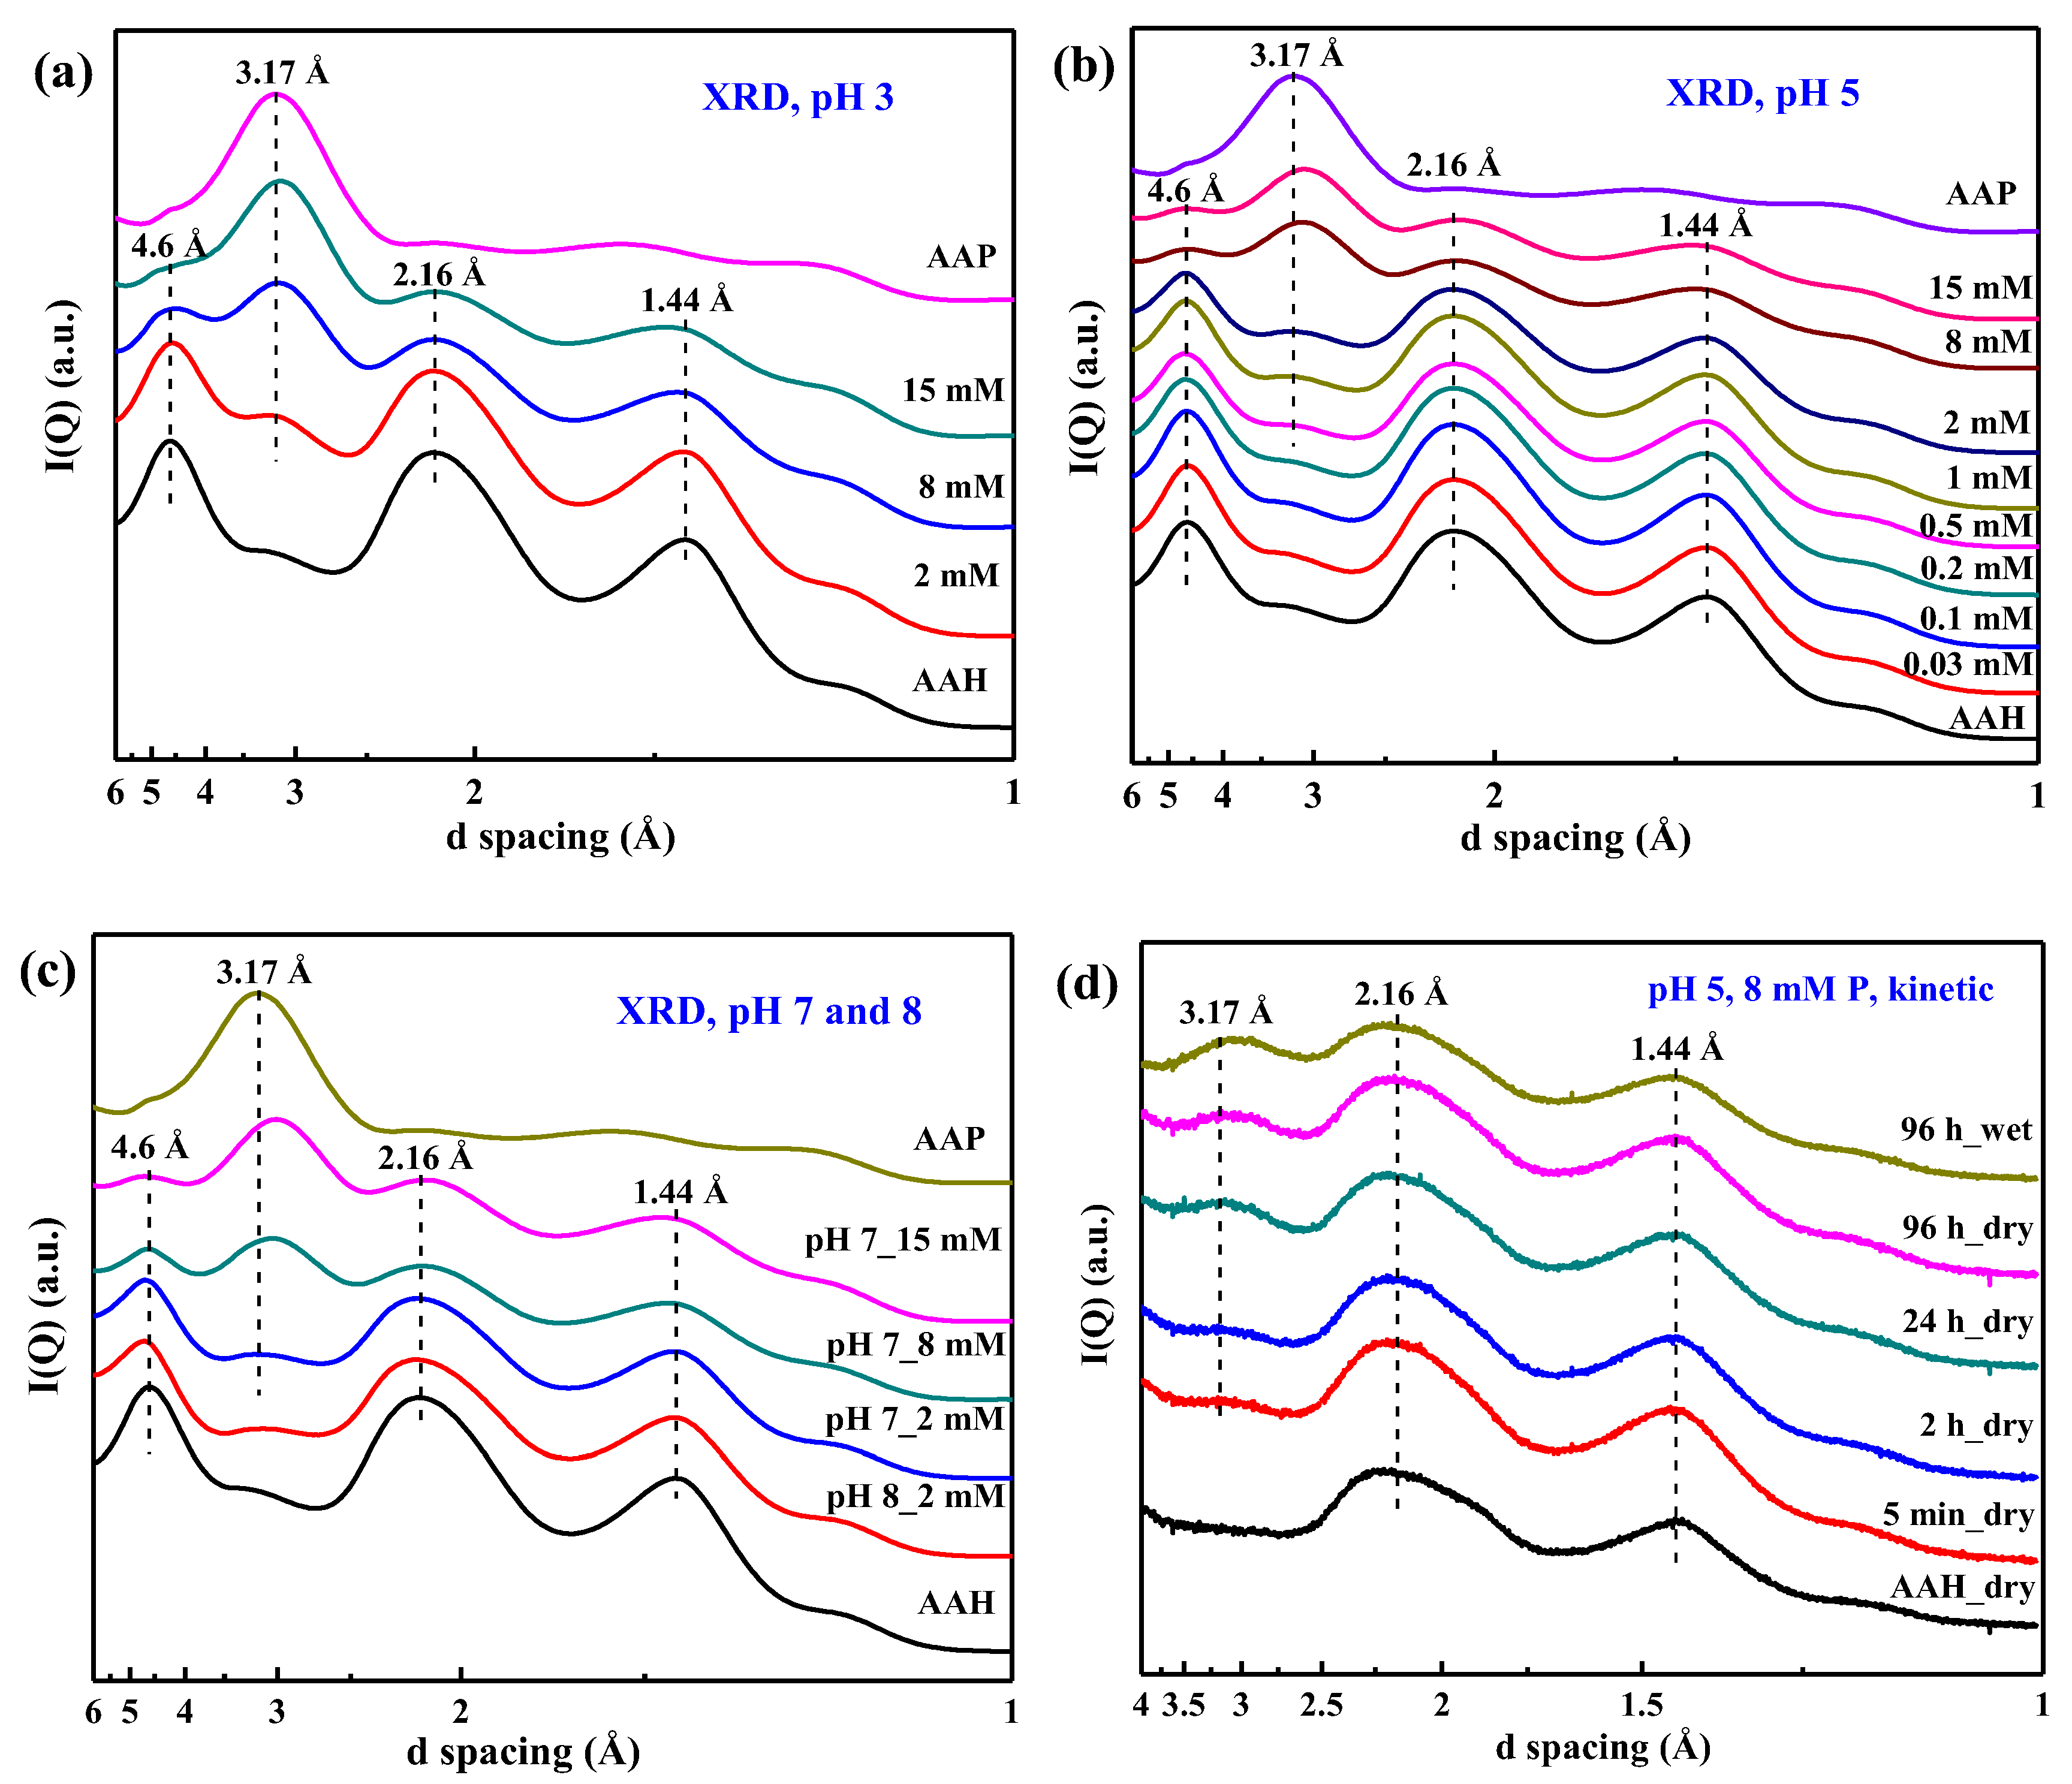
3.2. X-ray Diffraction

The synchrotron-based XRD patterns of the air dried sorption isotherm samples and the references are shown in Figure 2a–c. With increasing P sorption at pH 3, 5, and 7, a new broad diffraction peak appears and grows, suggesting formation of increasingly more surface precipitates. The peak position is close to that of the characteristic peak for AAP (~3.17 Å) but not the same value, suggesting that the structure of the precipitates differs slightly from that of AAP. The peak position of the precipitate at lower pH is more similar to that of AAP, indicating that the precipitate formed at lower pH is more similar to AAP. Additionally, the diffraction peaks of AAH at ~2.16 Å and ~1.44 Å gradually decrease with increasing P loading, which can be ascribed to the formation of precipitates by the consumption of AAH.
The XRD patterns of selected kinetic samples are given in Figure 2d. With increasing sorption time, the XRD peak at ~3.17 Å becomes increasingly pronounced, suggesting formation of more precipitates. Additionally, this broad peak is also present for the wet sample at 96 h (Figure 2d), indicating that the precipitates already formed under the wet conditions prior to air drying.

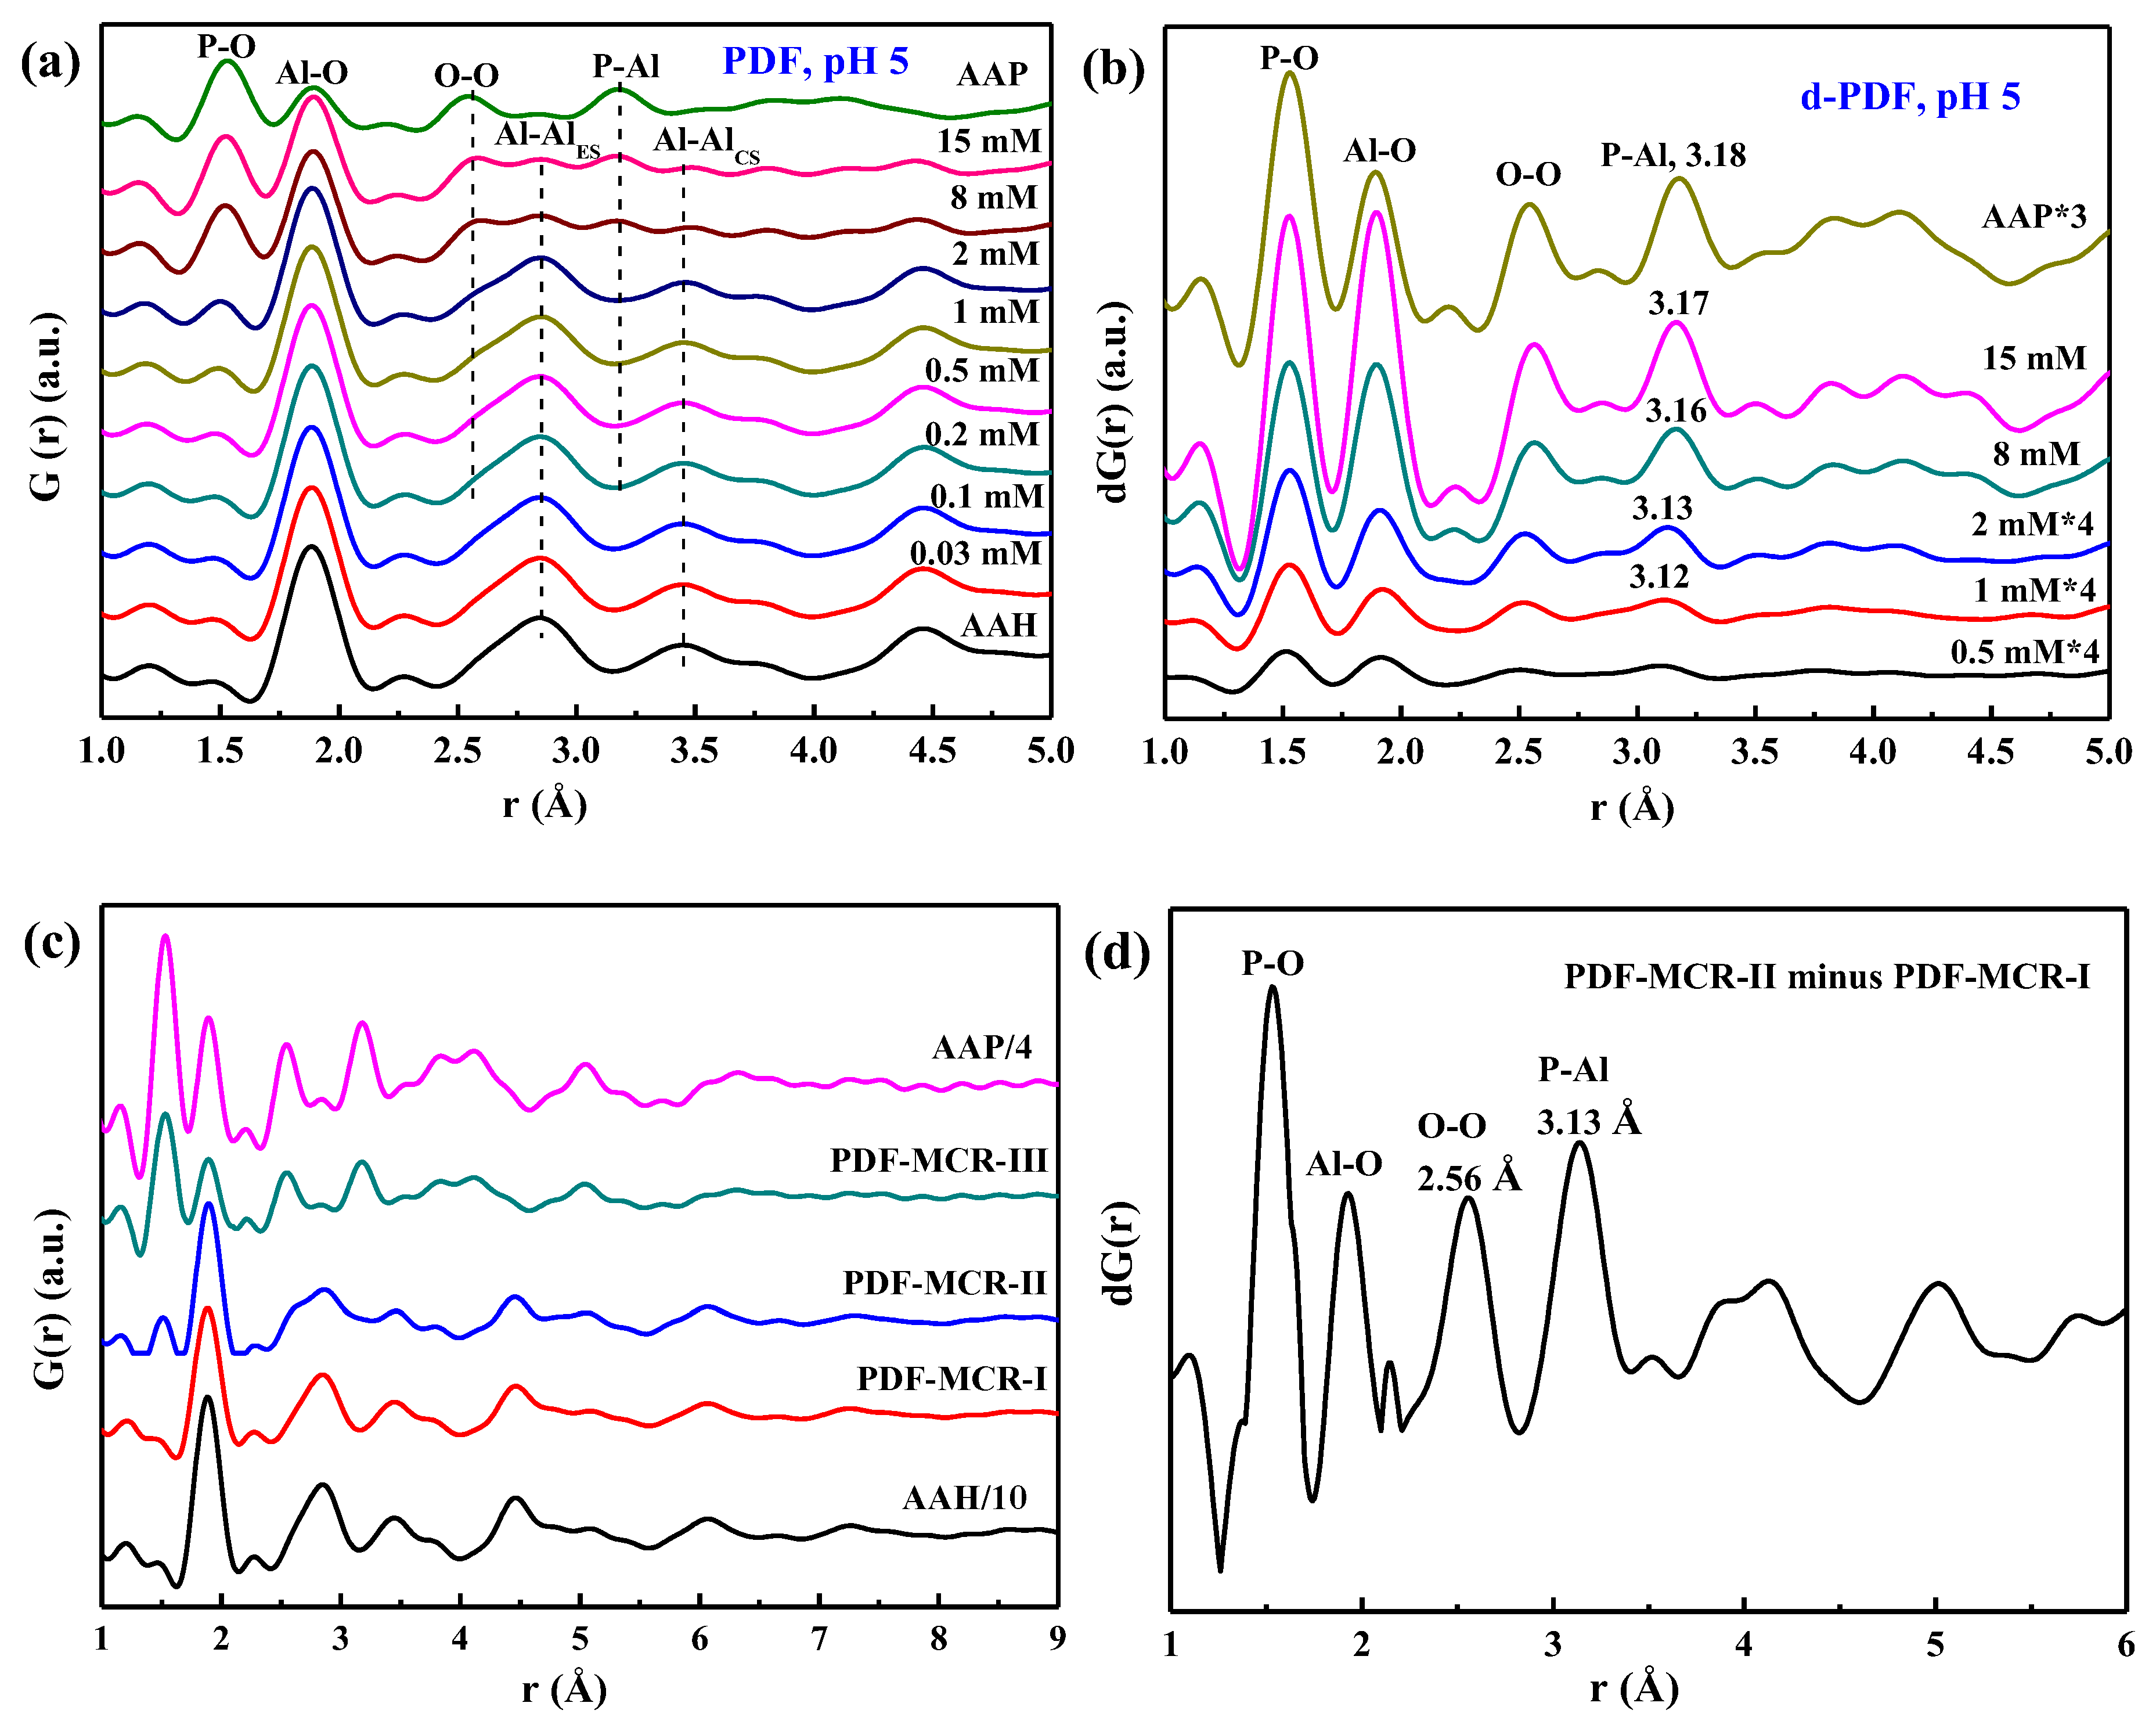
3.3. Pair Distribution Function Analyses

The PDFs of the dried sorption isotherm samples at pH 3, 5, and 7 and the references are shown in Figure 3a and Figure S1a,c. With increasing P sorption, the P–O peak at 1.53 Å and O-O peak at 2.56 Å grow, while the Al–O peak at 1.89 Å and edge-sharing Al–Al peak at 2.85 Å and corner-sharing peak Al–Al at 3.45 Å attenuate, which are caused by more phosphate sorbed on AAH. The following d-PDF analysis is conducted to obtain the structure of the sorbed P species.
The d-PDFs of the sorption samples (Figure 3b and Figure S1b,d) indicate that, with increasing P loading, the intensities of the P–O peak, Al–O peak, and the O–O peak all increase with relatively constant peak positions, and the P–Al peak grows but its peak position shifts from ~3.12 Å to ~3.17 Å, i.e., towards the P–Al peak at 3.18 Å of AAP. In addition, the whole profile increasingly resembles that of AAP. Therefore, these results suggest a transition from phosphate surface complexes, with a P–Al distance of ~3.12 Å, to surface precipitates with a P–Al distance similar to that of AAP with increasing P sorption, consistent with the XRD analysis. Additionally, the MCR analysis of PDF data for all sorption samples extracts three components, i.e., PDF-MCR-I, -II, and -III, corresponding to AAH, phosphate adsorption on AAH, and AAP precipitation, respectively (Figure 3c). The P–Al distance, obtained from the difference PDF profile of PDF-MCR-II and PDF-MCR-I (i.e., PDF-MCR-II–PDF-MCR-I) (Figure 3d), is similar to those of the sorption samples prepared at low P concentration or high pH. This similarity further confirms that the PDF-MCR-II component corresponds to phosphate adsorption complexes on AAH.

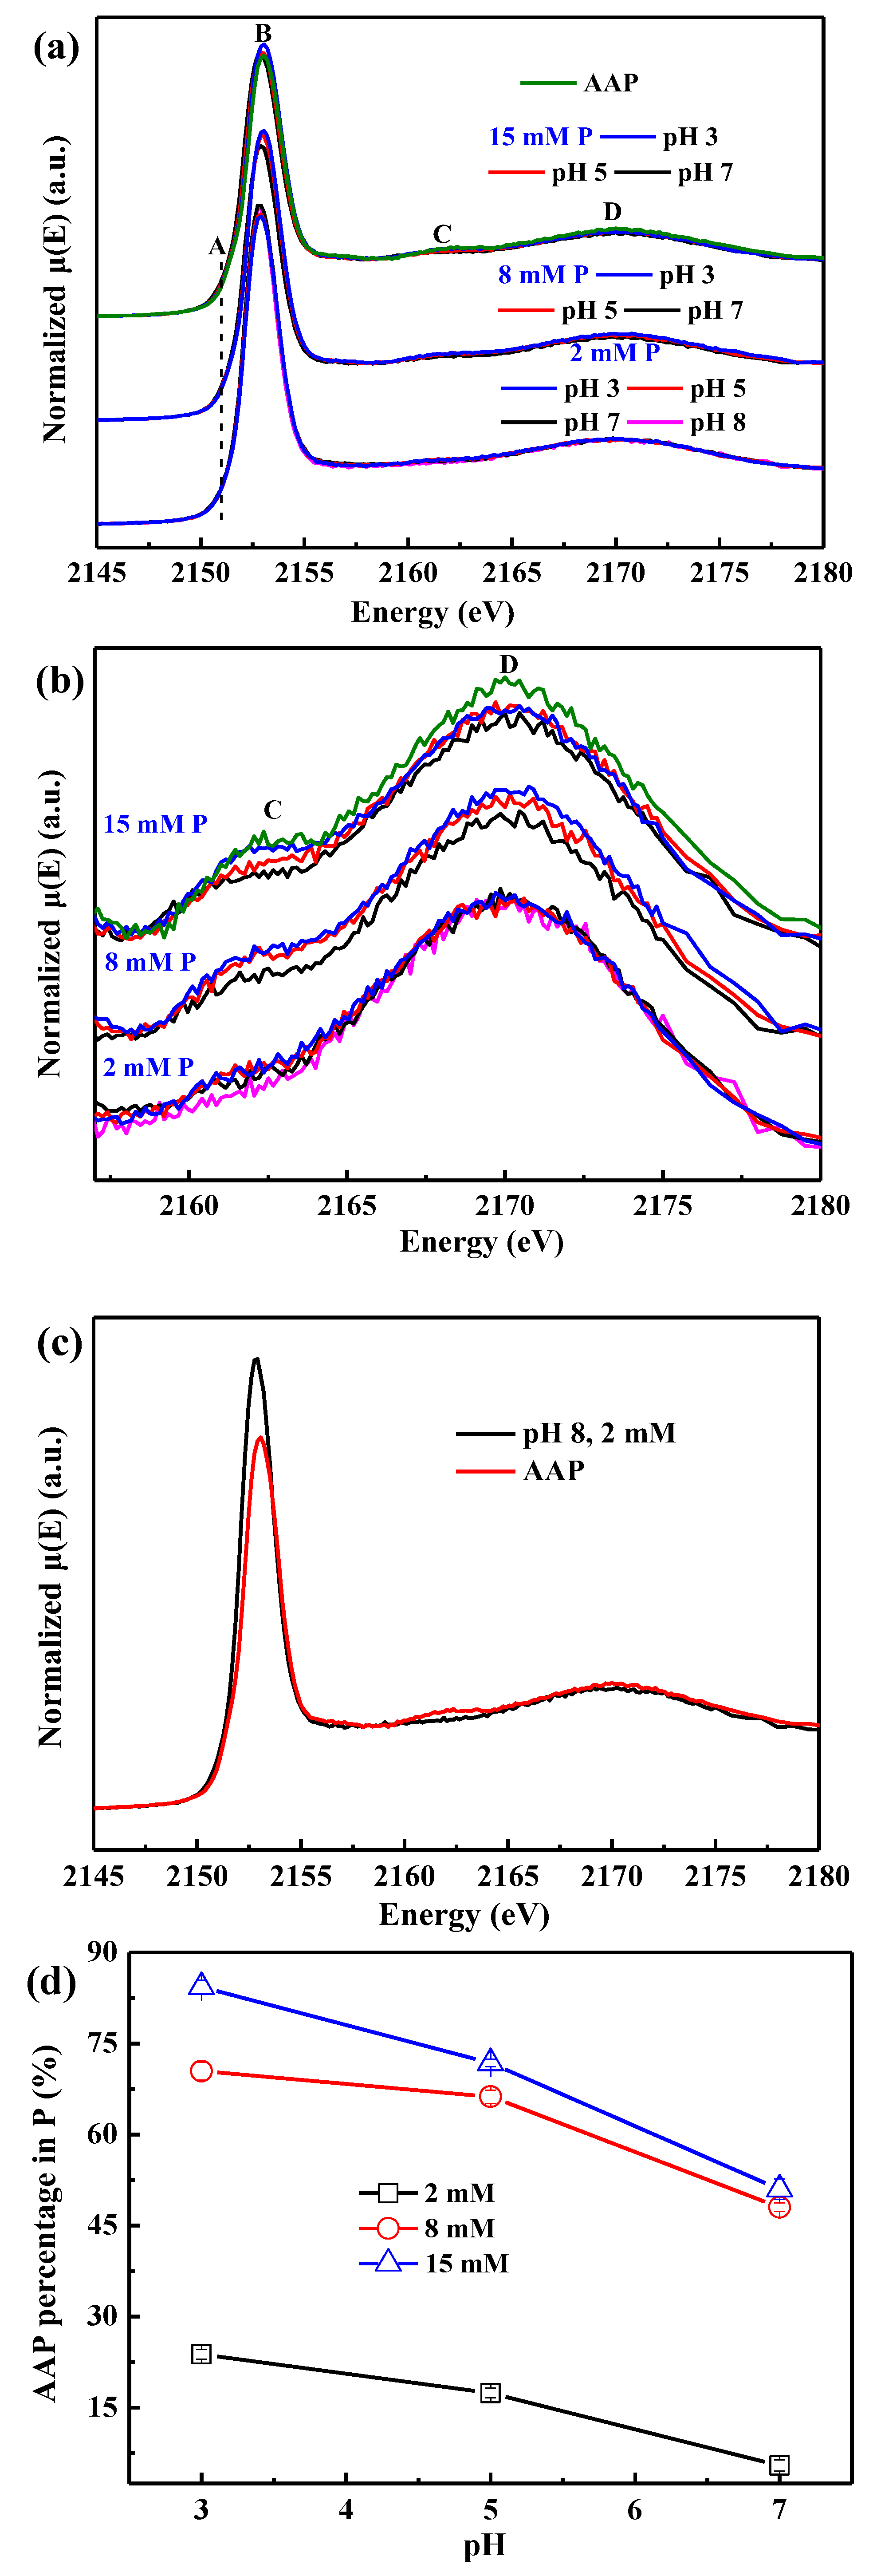
3.4. Phosphorus K-Edge XANES Spectroscopy

All sorption samples and AAP exhibit a very weak pre-edge feature at ~2151 eV (peak A) (Figure 4a and Figure S1a) [34], and its intensity remains almost constant at different conditions. In contrast, phosphate sorption on ferrihydrite shows a pronounced pre-edge peak, the intensity of which positively correlates with the number of Fe atoms bound to each PO4 [35,36]. With increasing P loading on AAH or decreasing pH, the white-line peak B slightly shifts to a higher energy, and a shoulder peak at ~2162 eV (peak C) gradually appears and grows, increasingly resembling that of AAP. In addition, the pH and initial P concentration both show remarkable effects on the intensity and energy shift of peak C, exhibiting an obvious trend with the change of pH value (Figure 4a,b) and initial P concentration (Figure S2a,b), suggesting that lower pH and higher initial P concentration favor the formation of surface precipitates.
The LCF analysis of P K-edge XANES spectroscopy is used to quantify the proportions of the adsorbed P and precipitated P with the sorption sample at pH 8 with 2 mM P and AAP as the end members, respectively (Figure 4c). The high goodness of fit (Figure S3) suggests that a physical mixture of the two P standards can account for the P speciation variation. The AAP proportion in P decreases from 84.3% to 5.5% as the condition changes from pH 3 with 15 mM P to pH 7 with 2 mM P (Figure 4d).

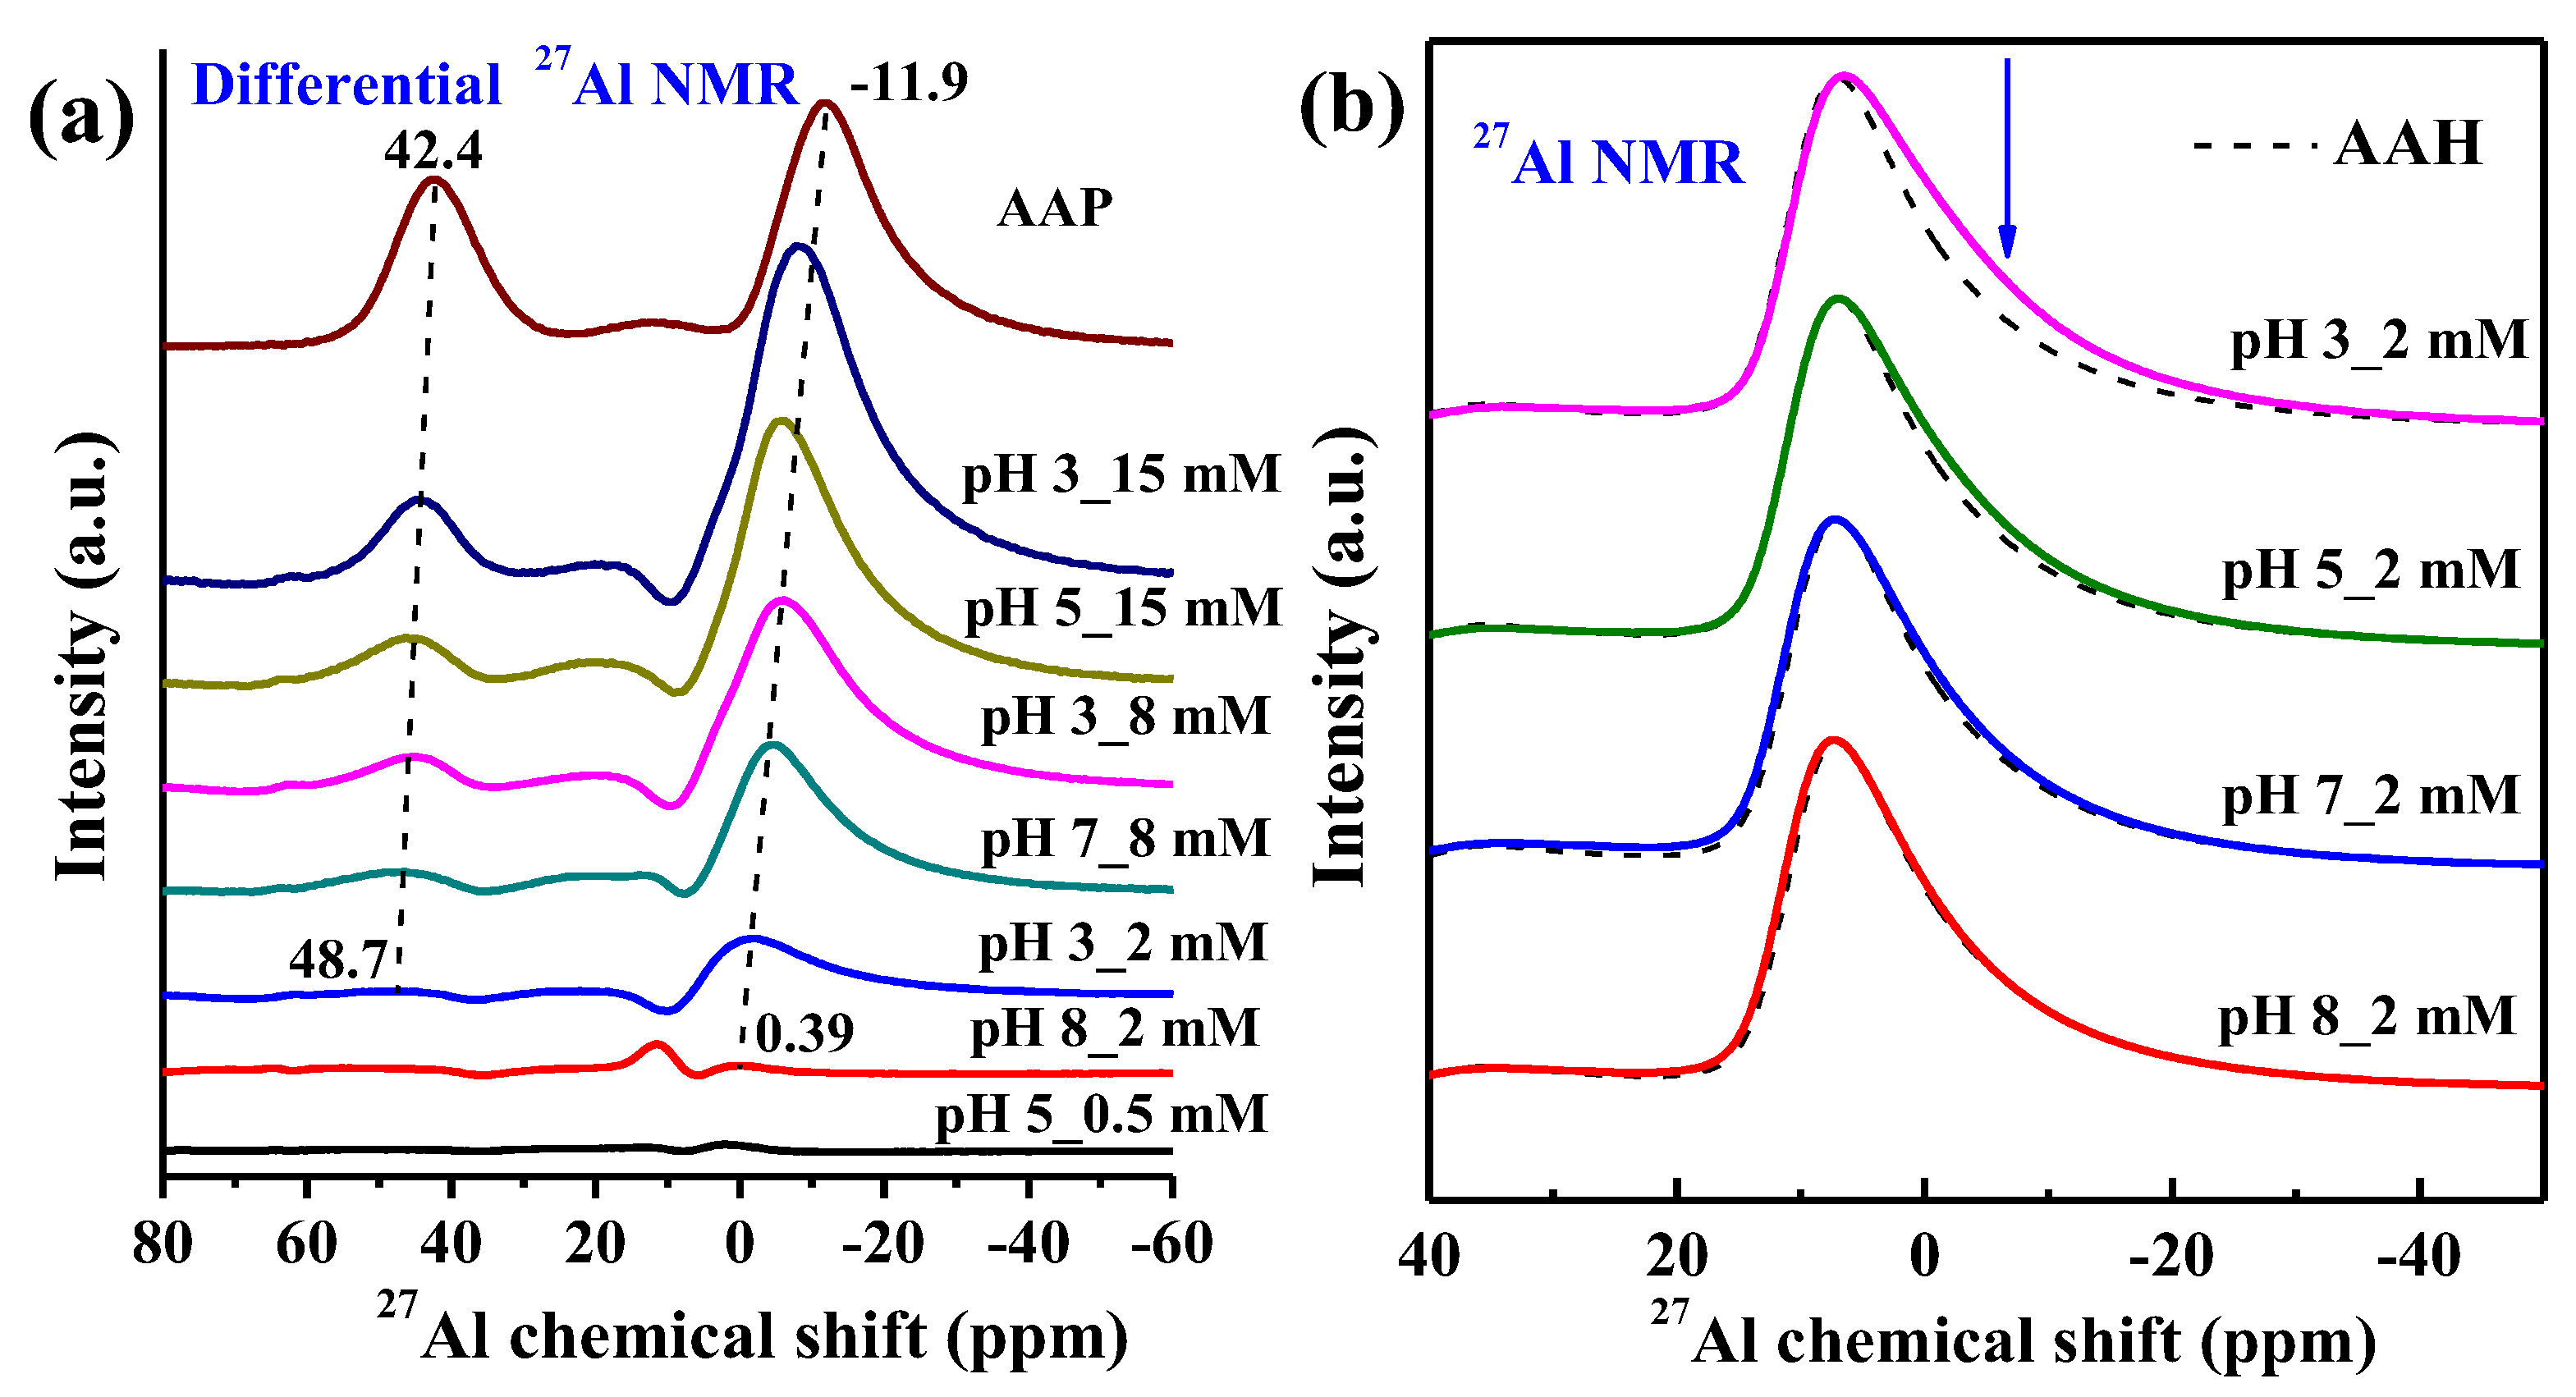
3.5. 31P and 27Al NMR Spectra

The 31P NMR spectra of phosphate sorption on AAH as a function of P loading at different pH are shown in Figure 5a–c. The unreacted phosphate species has a chemical shift (δP) of +4–+5.5 ppm [37], which decreases after phosphate sorption on AAH. For the sorption samples with a lower P loading or higher pH, a broad peak with δP at −7.4 ppm appears and the δP values are similar with P sorption loading increasing from 0.25 mmol/g (pH 5, 0.5 mM P) (Figure 5b) to 0.52 mmol/g (pH 8, 2 mM P) (Figure 5c). As the P sorption loading continues increasing to 4.05 mmol/g (pH 3, 15 mM P) (Figure 5a), the peak becomes broader, and δP shifts from −7.5 ppm to −12.8 ppm, increasingly close to δP (−15.5 ppm) of AAP, indicating formation of more surface precipitates. The precipitates have more negative δP values than adsorption complexes likely due to the more P–O–Al linkages per PO4 tetrahedron involved in the structure of the precipitates [22]. Additionally, for the 2 mM P systems with different pH values (Figure 5a–c), δP decreases with decreasing pH, suggesting lower pH favors the formation of surface precipitates.
The 27Al NMR spectra in Figure 5d–f further confirms the above variation of P speciation with P loading and pH. The 27Al NMR spectrum of the sample prepared at pH 8 and 2 mM is similar to that of the pristine AAH (Figure 6b), indicating no or very little surface precipitates at this condition. With increasing P loading and decreasing pH (Figure 5d–f), the peak at +6.9 ppm becomes broader and a shoulder at ~−2.3 ppm gradually appears and shifts to a lower value, and a new weak peak at ~+42.4 ppm gradually appears. The differential 27Al NMR spectra (Figure 6a) show that with increasing P loading these two new peaks gradually grow and shift to lower values, increasingly approaching those of AAP, suggesting the formation of more surface precipitates. Additionally, for the 2 mM P systems with different pH values (Figure 6b), the spectrum shows increased intensity from 0 to −10 ppm at lower pH compared to that of AAH, consistent with presence of precipitates at lower pH.
The pristine AAH shows a major peak at δAl = +6.9 ppm and two small peaks at δAl = +35.0 ppm and +62.3 ppm (bottom of Figure 5d–f), respectively, corresponding to AlO6, AlO5, and AlO4 coordination [38]. In contrast, AAP shows two strong peaks at −11.9 and +42.4 ppm, respectively, corresponding to AlO6 octahedra and AlO4 tetrahedra bonded to phosphate [22]. According to the relative peak intensities or peak areas, AAP shows a much higher proportion of AlO4 than AAH. Thus, the formation of surface precipitates from AAH in the presence of phosphate involves the transformation of AlO6 octahedra to AlO4 tetrahedra. The asymmetric peak for the AlO6 in AAH structure is due to a wide distribution of second-order quadrupolar effects [22].

3.6. ATR-FTIR Spectroscopy

With decreasing pH or increasing initial P loading (Figure 7a–c), the IR spectra of the dried isotherm samples evolve from that of pristine AAH towards spectra increasingly resembling those of AAP. Specifically, the intensities of the P–O stretching bands at ~1070 cm−1, 925 cm−1, and 627 cm−1 of AAP gradually increase, while the intensities of bulk OH deformation bands at 526 cm−1 and 952 cm−1 of AAH become lower. These trends reveal that more surface precipitates formed at lower pH or higher P loading.
The MCR analysis of the ATR-FTIR spectra of phosphate sorption on AAH extracted three components that best represent the pH and surface loading dependence of adsorbed and precipitated phosphate (Figure 7d), and their P loading-dependent fractions are shown in Figure S4. The IR-MCR-I component with the ~952 cm−1 and ~529 cm−1 band corresponds to the pure AAH, the fraction of which dominates at low P loadings. As the P sorption loading increases to ~1 mmol/g, it is gradually replaced by IR-MCR-II with bands centered at ~1040 cm−1 and 529 cm−1, corresponding to phosphate surface complexes. With further increase of P sorption loadings, i.e., >1 mmol/g, the fraction of adsorbed species increases at pH 3, remains almost constant at pH 5, but decreases at pH 7. In contrast, the IR-MCR-III with bands centered at 1060 cm−1, 915 cm−1, 610 cm−1, and 517 cm−1, corresponding to the precipitates, generally increase in prominence with increased P loading, and lower pH.

4. Discussion

4.1. Structure of Phosphate Surface Complexes on AAH

The d-PDF analysis has been demonstrated to be an effective approach to determine element binding geometries on poorly-crystalline minerals [15,16,39,40]. Li et al. [39] used d-PDF analysis for the first time in anion (arsenate) adsorption on an Al oxide to characterize structures of sorption complexes. In the present study, based on the d-PDF analysis, the P–Al distance of the phosphate complexes on AAH surface is determined to be ~3.12 Å (Figure 3b and Figure S1b,d), in agreement with the calculated distance for BB complexes formed on Al oxides [18]. Such complexes were also consistent with phosphate adsorption on other Al oxides [17,18,19]. We do not observe a dependence of the binding geometry on either pH or P loading, consistent with previous studies [17,18], although a wet sample was found to possibly include minor (<3%) MM surface complexes in addition to the majority of BB complexes [18].
Moreover, the d-PDFs of the phosphate sorption samples prepared at low P loadings or high pH contain a strong peak at ~1.90 Å (Figure 3b and Figure S1d), likely corresponding to the Al–O pair of AlO6. Such a peak also occurs in the differential PDF of PDF-MCR-II minus PDF-MCR-I (Figure 3d). If phosphate only forms binary surface complexes, AlO6 should be absent in the complexes. The presence of this peak suggests that PO4–AlIII ternary surface complexes form besides the binary surface complexes. This peak is more significant for the adsorption sample prepared at pH 5 than at pH 8, consistent with lower pH favoring AAH dissolution, hence the formation of the ternary surface complexes. Similar ternary complexes also occur with phosphate sorption by ferrihydrite [16], but not for sulfate adsorption on ferrihydrite [41].

4.2. Quantitative Relationship between P Sorbed and P Precipitated

The phosphate exhibits a slowly increasing sorption process after 10 h (Figure 1a), which is probably due to micropore diffusion and/or the formation of precipitates [16,42]. The Qmax at different pHs (Figure 1b) are comparable with the reported values of phosphate sorption on AAH [43,44], but obviously higher than those of phosphate sorption on other Al minerals [17,18,26].
Interestingly, regardless of the sample preparation conditions, the percentage of precipitated P almost linearly correlates with the amount P sorbed for phosphate sorption on AAH or ferrihydrite surfaces [16] (Figure 8). At a given P sorption loading below 3.4 mmol/g, phosphate more readily precipitates on AAH surfaces than on ferrihydrite, which can be ascribed to the higher solubility product of AAH (Ksp = 1.3 × 10⁻³³) than that of ferrihydrite (Ksp = 2.79 × 10−39) [43,45]. However, at a given P sorption loading above 3.4 mmol/g, the result is contrary, i.e., phosphate more readily precipitates on ferrihydrite surfaces. The reason might be that the amorphous FePO4 (AFP, Ksp = 9.92 × 10⁻²⁹) is easier to form due to its lower solubility product than AAP (Ksp = 9.83 × 10⁻²¹) [46] at such high P loading. Thus, the solubility of both bulk material and the precipitated P-bearing phase control the amount of surface precipitates. In addition, the linear relationship indicates that the precipitate starts to form once the 24 h P sorption loading reaches ~0.248 mmol/g, which can be used to approximately estimate the threshold P loading for the formation of AAP on AAH surfaces, but precipitation is hard to detect at low P sorption loading. This threshold value of phosphate precipitation on AAH is lower than that (~0.945 mmol/g) for ferrihydrite [16], meaning that the P–Al precipitates preferentially form compared to the P–Fe phases in soils and sediments.

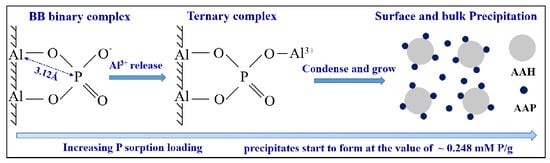
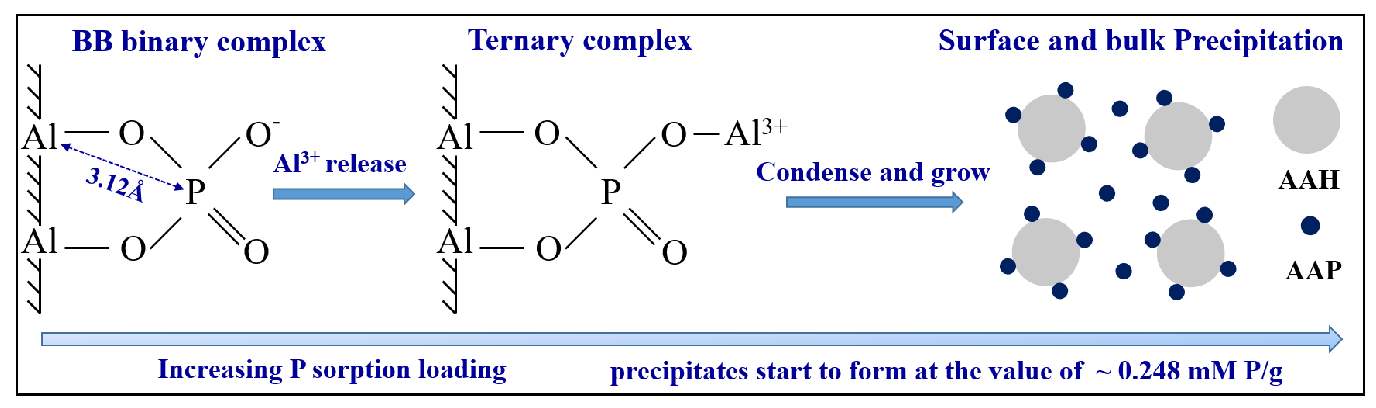
4.3. AlIII Release during Phosphate Sorption and Formation Mechanisms of AAP

Besides the dissolved AlIII detected in the bulk solution (Figure 1c), a large amount of AlIII released from AAH occurs in the form of surface precipitates analogous to AAP (Figure 9a). Therefore, the total AlIII released from AAH should include both dissolved AlIII in the bulk solution and precipitated AlIII. The released AlIII increases with increasing initial P concentration at both pH 5 and pH 7 (Figure 9b), suggesting that phosphate adsorption promotes the AlIII release. In contrast, the total released AlIII at pH 3 firstly decreases and then increases with increasing initial P concentration (Figure 9b), similar to the variation of dissolved AlIII (Figure 1c). These observations might be related to two processes. On one hand, phosphate surface complexes could block the dissolution of active surface sites [11,47,48,49], thus inhibiting AlIII release at a low P concentration and pH 3. On the other hand, the formation of AAP could consume the released AlIII, promoting further AlIII release at a high P concentration.
The formation of the surface precipitates of analogous AAP could involve two pathways, including precipitation of dissolved AlIII with soluble phosphate, like HPO42− and H2PO4, in the bulk solution and precipitation of the released AlIII with sorbed P on AAH surfaces. Both pathways should occur at pH 3 and pH 5 where AAH solubility is relatively high, while the later pathway dominates at pH 7 because of the very low AAH dissolution. For the conditions under which precipitates occur at the mineral surfaces, the surfaces are likely covered by a mixture of bidentate-binuclear complexes, ternary surface complexes, probably pre-nucleation clusters [50], and surface precipitates with structure similar to that of AAP. The formed AAP might be more stable at ~pH 4 than other pH values because it was usually synthesized at this pH [22]. The co-existence of various P and Al species can explain similar but different 31P and 27Al NMR spectra of the sorption products compared to those of AAP (Figure 5 and Figure 6). These species of increasing condensation degree likely form sequentially with increasing reaction time and sorption loading [21,35]. Within the mineral-water interface, P firstly forms surface complexes, inducing AAH dissolution. The sorbed P then provides sorption sites for the released AlIII, resulting in the formation of (i) ternary complexes (e.g., (≡Al-O)2-PO2-Al), as well as (ii) pre-nucleation clusters that further condense to precipitates [16,21], a mechanism similar to those proposed for the formation of aluminum phytate by phytate sorption on AAH [21], and the formation of AFP during phosphate sorption on ferrihydrite. The formation rate and amount of AAP depends on the saturation state of the interfacial solution with respect to the solid phases [20,51], which favors at a higher initial P loading and a lower reaction pH. Such a coupled dissolution and precipitation mechanism is commonly used to explain surface precipitation at mineral-water interfaces, including of phosphate and other ions sorbed by various natural and synthetic Fe and Al oxides [20,21,51,52,53,54].

5. Conclusions

Compared to other Al oxides and most synthesized or natural minerals, AAH shows a much higher phosphate sorption capacity, suggesting that AAH would be a highly efficient sorbent for immobilizing P after P fertilizer application to the soils. This partly accounts for the low utilization efficiency of P in the paddy soils with a large amount of amorphous Fe and Al oxides [55]. Our study clarifies the structure of phosphate surface complexes and the identity of the surface precipitates, and suggests the existence of ternary complexes in a wide range of pH and P sorption loadings. Identification of theses surface species is useful to constructing physically meaningful models, such as surface complexation models and reactive-transport models [56,57]. Moreover, the quantitative analysis of surface complex and surface precipitation of P indicate that, compared to ferrihydrite, the precipitates on AAH starts to form at a lower P sorption loading, suggesting that the AAP precipitates more readily than AFP near the phosphate fertilizer grains where dissolved P concentration could be high temporarily after fertilizer application. These new insights into the phosphate sorption on Al oxides improve our understanding of P mobility and bioavailability in Al oxide enriched soils and sediments. Further studies are required to assess the impacts of other environmental factors, such as the coexistence of natural organic matter or heavy metals, on the phosphate sorption on Al oxides, and to explore the effects of pH on the stability of AAP.

Supplementary Materials

The following are available online at https://www.mdpi.com/2571-8789/3/1/20/s1, the following are available free of charge via the internet, including of the XRD collection methods for wet kinetic samples, Figure S1: the (differential) pair distribution functions (PDFs) of the dried phosphate sorption isotherm samples at pH 3 and pH 7, Figure S2: P K-edge XANES spectra for the phosphate sorption isotherm samples prepared at different pHs and initial P concentrations, Figure S3: comparison of the P spectra and their linear combination fits for determining the relative fractions of precipitation and adsorption in P sorption isotherm samples, Figure S4: the relative proportions of the components identified by multiple curve resolution (MCR) analyses of ATR-FTIR spectra.

Author Contributions

X.W. and M.Z. designed the study and wrote the paper. X.W. performed the most experiments and analyzed the data. B.L.P. collected the NMR data. J.F.B. did the MCR analysis. Y.H. provided the beamline time for P XAS spectra. Z.H., P.Y., and W.X. collected the XRD patterns of the kinetic samples. B.L.P., J.F.B. and X.F. gave some comments on the paper.

Acknowledgments

This work was supported by the Wyoming Agricultural Experimental Station Competitive Grants Program and the Wyoming Reclamation and Restoration Center. Partial support was provided by the U.S. National Science Foundation Faculty Early Career Development Program (EAR-1752903). X.W. thanks National Natural Science Foundation of China (Nos. 41601228) and China Postdoctoral Science Foundation (No. 2016M590700) for their support. Use of the Advanced Photon Source, Argonne National Laboratory, supported by U.S. DOE-BES under Contract DE-AC02-06CH11357. J.-F.B. thanks the Swedish Research Council (2016-03808) for support.

Conflicts of Interest

The authors declare no conflict of interest.

References

  1. Li, Y.; Wang, Y.; Lu, J. Effect of phosphorus fertilization on yield and phosphorus use efficiency of winter oilseed rape (Brassica napus L.) with two different cropping intensities in the middle and lower reaches of Yangtze River. J. Food Agric. Environ. 2012, 10, 576–579. [Google Scholar]
  2. Bromfield, S.M. Relative contribution of iron and aluminium in phosphate sorption by acid surface soils. Nature 1964, 201, 321–322. [Google Scholar] [CrossRef]
  3. Bortoluzzi, E.C.; Perez, C.A.S.; Ardisson, J.D.; Tiecher, T.; Caner, L. Occurrence of iron and aluminum sesquioxides and their implications for the P sorption in subtropical soils. Appl. Clay Sci. 2015, 104, 196–204. [Google Scholar] [CrossRef]
  4. Freese, D.; Vanderzee, S.E.A.T.M.; Vanriemsdijk, W.H. Comparison of different models for phosphate sorption as a function of the iron and aluminum-oxides of soils. J. Soil Sci. 1992, 43, 729–738. [Google Scholar] [CrossRef]
  5. Gerard, F. Clay minerals, iron/aluminum oxides, and their contribution to phosphate sorption in soils—A myth revisited. Geoderma 2016, 262, 213–226. [Google Scholar] [CrossRef]
  6. Liu, J.; Yang, J.; Liang, X.; Zhao, Y.; Cade-Menun, B.J.; Hu, Y. Molecular speciation of phosphorus present in readily dispersible colloids from agricultural soils. Soil Sci. Soc. Am. J. 2014, 78, 47–53. [Google Scholar] [CrossRef]
  7. Kumar, E.; Bhatnagar, A.; Hogland, W.; Marques, M.; Sillanpaa, M. Interaction of inorganic anions with iron-mineral adsorbents in aqueous media—A review. Adv. Colloid Interface 2014, 203, 11–21. [Google Scholar] [CrossRef]
  8. Wang, X.; Liu, F.; Tan, W.; Li, W.; Feng, X.; Sparks, D.L. Characteristics of phosphate adsorption-desorption onto ferrihydrite: Comparison with well-crystalline Fe (hydr)oxides. Soil Sci. 2013, 178, 1–11. [Google Scholar] [CrossRef]
  9. Mallet, M.; Barthelemy, K.; Ruby, C.; Renard, A.; Naille, S. Investigation of phosphate adsorption onto ferrihydrite by X-ray photoelectron spectroscopy. J. Colloid Interface Sci. 2013, 407, 95–101. [Google Scholar] [CrossRef]
  10. Kim, J.; Li, W.; Philips, B.L.; Grey, C.P. Phosphate adsorption on the iron oxyhydroxides goethite (α-FeOOH), akaganeite (β-FeOOH), and lepidocrocite (γ-FeOOH): A 31P NMR study. Energy Environ. Sci. 2011, 4, 4298–4305. [Google Scholar] [CrossRef]
  11. Celi, L.; De Luca, G.; Barberis, E. Effects of interaction of organic and inorganic P with ferrihydrite and kaolinite-iron oxide systems on iron release. Soil Sci. 2003, 168, 479–488. [Google Scholar] [CrossRef]
  12. Rajan, S.S.S. Adsorption of divalent phosphate on hydrous aluminum-oxide. Nature 1975, 253, 434–436. [Google Scholar] [CrossRef]
  13. Shang, C.; Stewart, J.W.B.; Huang, P. PH effect on kinetics of adsorption of organic and inorganic phosphates by short-range ordered aluminum and iron precipitates. Geoderma 1992, 53, 1–14. [Google Scholar] [CrossRef]
  14. Jain, A.; Raven, K.P.; Loeppert, R.H. Arsenite and arsenate adsorption on ferrihydrite: Surface charge reduction and net OH release stoichiometry. Environ. Sci. Technol. 1999, 33, 1179–1184. [Google Scholar] [CrossRef]
  15. Wang, X.; Li, W.; Harrington, R.; Liu, F.; Parise, J.B.; Feng, X.; Sparks, D.L. Effect of ferrihydrite crystallite size on phosphate adsorption reactivity. Environ. Sci. Technol. 2013, 47, 10322–10331. [Google Scholar] [CrossRef]
  16. Wang, X.; Hu, Y.; Tang, Y.; Yang, P.; Feng, X.; Xu, W.; Zhu, M. Phosphate and phytate adsorption and precipitation on ferrihydrite surfaces. Environ. Sci. Nano 2017, 4, 2193–2204. [Google Scholar] [CrossRef]
  17. Li, W.; Pierre-Louis, A.M.; Kwon, K.D.; Kubicki, J.D.; Strongin, D.R.; Phillips, B.L. Molecular level investigations of phosphate sorption on corundum (α-Al2O3) by 31P solid state NMR, ATR-FTIR and quantum chemical calculation. Geochim. Cosmochim. Acta 2013, 107, 252–266. [Google Scholar] [CrossRef]
  18. Li, W.; Feng, X.; Yan, Y.; Sparks, D.L.; Phillips, B.L. Solid-state NMR spectroscopic study of phosphate sorption mechanisms on aluminum (hydr)oxides. Environ. Sci. Technol. 2013, 47, 8308–8315. [Google Scholar] [CrossRef]
  19. Li, W.; Feng, J.; Kwon, K.D.; Kubicki, J.D.; Phillips, B.L. Surface Speciation of Phosphate on Boehmite (gamma-AlOOH) Determined from NMR Spectroscopy. Langmuir 2010, 26, 4753–4761. [Google Scholar] [CrossRef]
  20. Wang, L.; Putnis, C.V.; Ruiz-Agudo, E.; Hovelmann, J.; Putnis, A. In situ imaging of interfacial precipitation of phosphate on goethite. Environ. Sci. Technol. 2015, 49, 4184–4192. [Google Scholar] [CrossRef]
  21. Yan, Y.; Li, W.; Yang, J.; Zheng, A.; Liu, F.; Feng, X.; Sparks, D.L. Mechanism of myo-inositol hexakisphosphate sorption on amorphous aluminum hydroxide: Spectroscopic evidence for rapid surface precipitation. Environ. Sci. Technol. 2014, 48, 6735–6742. [Google Scholar] [CrossRef] [PubMed]
  22. Lookman, R.; Grobet, P.; Merckx, R.; Vlassak, K. Phosphate sorption by synthetic amorphous aluminum hydroxides: A 27Al and 31P solid-state MAS NMR spectroscopy study. Eur. J. Soil Sci. 1994, 45, 37–44. [Google Scholar] [CrossRef]
  23. Kim, Y.; Kirkpatrick, R.J. An investigation of phosphate adsorbed on aluminium oxyhydroxide and oxide phases by nuclear magnetic resonance. Eur. J. Soil Sci. 2004, 55, 243–251. [Google Scholar] [CrossRef]
  24. Van Emmerik, T.J.; Sandstrom, D.E.; Antzutkin, O.N.; Angove, M.J.; Johnson, B.B. 31P solid-state nuclear magnetic resonance study of the sorption of phosphate onto gibbsite and kaolinite. Langmuir 2007, 23, 3205–3213. [Google Scholar] [CrossRef] [PubMed]
  25. Lookman, R.; Grobet, P.; Merckx, R.; Van Riemsdijk, W.H. Application of P-31 and Al-27 MAS NMR for phosphate speciation studies in soil and aluminium hydroxides: Promises and constraints. Geoderma 1997, 80, 369–388. [Google Scholar] [CrossRef]
  26. Yan, Y.; Liu, F.; Li, W.; Liu, F.; Feng, X.; Sparks, D.L. Sorption and desorption characteristics of organic phosphates of different structures on aluminium (oxyhydr)oxides. Eur. J. Soil Sci. 2014, 65, 308–317. [Google Scholar] [CrossRef]
  27. Yan, X.; Wei, Z.Q.; Hong, Q.Q.; Lu, Z.H.; Wu, J.F. Phosphorus fractions and sorption characteristics in a subtropical paddy soil as influenced by fertilizer sources. Geoderma 2017, 295, 80–85. [Google Scholar] [CrossRef]
  28. Pierzynski, J.; Hettiarachchi, G.M. Reactions of phosphorus fertilizers with and without a fertilizer enhancer in three acidic soils with high phosphorus-fixing capacity. Soil Sci. Soc. Am. J. 2018, 82, 1124–1139. [Google Scholar] [CrossRef]
  29. Wang, X.; Gu, C.; Feng, X.; Zhu, M. Sulfate local coordination environment in schwertmannite. Environ. Sci. Technol. 2015, 49, 10440–10448. [Google Scholar] [CrossRef] [PubMed]
  30. Jaumot, J.; Gargallo, R.; de Juan, A.; Tauler, R. A graphical user-friendly interface for MCR-ALS: A new tool for multivariate curve resolution in MATLAB. Chemometr. Intell. Lab. 2005, 76, 101–110. [Google Scholar] [CrossRef]
  31. Wang, X.; Kubicki, J.D.; Boily, J.F.; Waychunas, G.A.; Hu, Y.; Feng, X.; Zhu, M. Binding geometries of silicate species on ferrihydrite surfaces. ACS Earth Space Chem. 2018, 2, 125–134. [Google Scholar] [CrossRef]
  32. Webb, S.M. SIXpack: A graphical user interface for XAS analysis using IFEFFIT. Phys. Scr. 2005, T115, 1011–1014. [Google Scholar] [CrossRef]
  33. Ravel, B.; Newville, M. ATHENA, ARTEMIS, HEPHAESTUS: Data analysis for X-ray absorption spectroscopy using IFEFFIT. J. Synchrotron Radiat. 2005, 12, 537–541. [Google Scholar] [CrossRef] [PubMed]
  34. Hesterberg, D.; Zhou, W.Q.; Hutchison, K.J.; Beauchemin, S.; Sayers, D.E. XAFS study of adsorbed and mineral forms of phosphate. J. Synchrotron Radiat. 1999, 6, 636–638. [Google Scholar] [CrossRef] [PubMed]
  35. Arai, Y.; Sparks, D.L. Phosphate reaction dynamics in soils and soil components: A multiscale approach. Adv. Agron. 2007, 94, 135–179. [Google Scholar]
  36. Khare, N.; Martin, J.D.; Hesterberg, D. Phosphate bonding configuration on ferrihydrite based on molecular orbital calculations and XANES fingerprinting. Geochim. Cosmochim. Acta 2007, 71, 4405–4415. [Google Scholar] [CrossRef]
  37. Mortlock, R.F.; Bell, A.T.; Radke, C.J. 31P and 27Al NMR investigations of the effects of pH on aqueous solutions containing aluminum and phosphorus. J. Phys. Chem. 1993, 97, 775–782. [Google Scholar] [CrossRef]
  38. Isobe, T.; Watanabe, T.; de la Caillerie, J.B.D.; Legrand, A.P.; Massiot, D. Solid-state H-1 and Al-27 NMR studies of amorphous aluminum hydroxides. J. Colloid Interface Sci. 2003, 261, 320–324. [Google Scholar] [CrossRef]
  39. Li, W.; Harrington, R.; Tang, Y.; Kubicki, J.D.; Aryanpour, M.; Reeder, R.J.; Parise, J.B.; Phillips, B.L. Differential pair distribution function study of the structure of arsenate adsorbed on nanocrystalline γ-Alumina. Environ. Sci. Technol. 2011, 45, 9687–9692. [Google Scholar] [CrossRef]
  40. van Genuchten, C.M.; Pena, J. Sorption selectivity of birnessite particle edges: A d-PDF analysis of Cd(II) and Pb(II) sorption by δ-MnO2 and ferrihydrite. Environ. Sci. Proc. Impacts 2016, 18, 1030–1041. [Google Scholar] [CrossRef]
  41. Zhu, M.; Northrup, P.; Shi, C.; Billinge, S.J.L.; Sparks, D.L.; Waychunas, G.A. Structure of sulfate adsorption complexes on ferrihydrite. Environ. Sci. Technol. Lett. 2014, 1, 97–101. [Google Scholar] [CrossRef]
  42. Wang, X.; Zhu, M.; Koopal, L.K.; Li, W.; Xu, W.; Liu, F.; Zhang, J.; Liu, Q.; Feng, X.; Sparks, D.L. Effects of crystallite size on the structure and magnetism of ferrihydrite. Environ. Sci. Nano 2016, 3, 190–202. [Google Scholar] [CrossRef] [Green Version]
  43. Khare, N.; Hesterberg, D.; Martin, J.D. XANES investigation of phosphate sorption in single and binary systems of iron and aluminum oxide minerals. Environ. Sci. Technol. 2005, 39, 2152–2160. [Google Scholar] [CrossRef] [PubMed]
  44. Liu, Y.; Hesterberg, D. Phosphate bonding on noncrystalline Al/Fe-hydroxide coprecipitates. Environ. Sci. Technol. 2011, 45, 6283–6289. [Google Scholar] [CrossRef]
  45. Dean, J.A. Lange’s Handbook of Chemistry, 15th ed.; McGrawHill: New York, NY, USA, 1999. [Google Scholar]
  46. Xie, R.; Gomez, M.J.; Xing, Y.; Klose, P.S. Fouling assessment in a municipal water reclamation reverse osmosis system as related to concentration factor. J. Environ. Eng. Sci. 2004, 3, 61–72. [Google Scholar] [CrossRef]
  47. Kukkadapu, R.K.; Zachara, J.M.; Fredrickson, J.K.; Kennedy, D.W. Biotransformation of two-line silica-ferrihydrite by a dissimilatory Fe(III)-reducing bacterium: Formation of carbonate green rust in the presence of phosphate. Geochim. Cosmochim. Acta 2004, 68, 2799–2814. [Google Scholar] [CrossRef]
  48. Stumm, W. Reactivity at the mineral-water interface: Dissolution and inhibition. Colloids Surf. A Physicochem. Eng. Asp. 1997, 120, 143–166. [Google Scholar] [CrossRef]
  49. Del Nero, M.; Galindo, C.; Barillon, R.; Halter, E.; Made, B. Surface reactivity of α-Al2O3 and mechanisms of phosphate sorption: In situ ATR-FTIR spectroscopy and zeta potential studies. J. Colloid Interface Sci. 2010, 342, 437–444. [Google Scholar] [CrossRef] [PubMed]
  50. Dey, A.; Bomans, P.H.H.; Muller, F.A.; Will, J.; Frederik, P.M.; de With, G.; Sommerdijk, N.A.J.M. The role of prenucleation clusters in surface-induced calcium phosphate crystallization. Nat. Mater. 2010, 9, 1010–1014. [Google Scholar] [CrossRef] [PubMed]
  51. Putnis, A. Why mineral interfaces matter. Science 2014, 343, 1441–1442. [Google Scholar] [CrossRef] [PubMed]
  52. Ruiz-Agudo, E.; Putnis, C.V.; Putnis, A. Coupled dissolution and precipitation at mineral-fluid interfaces. Chem. Geol. 2014, 383, 132–146. [Google Scholar] [CrossRef]
  53. Ruiz-Agudo, E.; Putnis, C.V.; Rodriguez-Navarro, C.; Putnis, A. Mechanism of leached layer formation during chemical weathering of silicate minerals. Geology 2012, 40, 947–950. [Google Scholar] [CrossRef]
  54. Nooney, M.G.; Campbell, A.; Murrell, T.S.; Lin, X.; Hossner, L.R.; Chusuei, C.C.; Goodman, D.W. Nucleation and growth of phosphate on metal oxide thin films. Langmuir 1998, 14, 2750–2755. [Google Scholar] [CrossRef]
  55. Huang, L.; Moore, P.A.; Kleinman, P.J.A.; Elkin, K.R.; Savin, M.C.; Pote, D.H.; Edwards, D.R. Reducing phosphorus runoff and leaching from poultry litter with alum: Twenty-year small plot and paired-watershed studies. J. Environ. Qual. 2016, 45, 1413–1420. [Google Scholar] [CrossRef] [PubMed]
  56. Antelo, J.; Fiol, S.; Perez, C.; Marino, S.; Arce, F.; Gondar, D.; Lopez, R. Analysis of phosphate adsorption onto ferrihydrite using the CD-MUSIC model. J. Colloid Interface Sci. 2010, 347, 112–119. [Google Scholar] [CrossRef] [PubMed]
  57. Wilson, G.V.; Rhoton, F.E.; Selim, H.M. Modeling the impact of ferrihydrite on adsorption-desorption of soil phosphorus. Soil Sci. 2004, 169, 271–281. [Google Scholar] [CrossRef]
Figure 1. Phosphate sorption kinetic on AAH at pH 5 with 8 mM P (a) and sorption isotherms (24 h) at pH 3, 5, and 7, and their fits with the Langmuir equation [Qe = QmaxKLC/(1 + KLC), where Qe is the amount of phosphate sorbed, Qmax is the maximum sorption capacity, C is the equilibrium concentration, and KL is a constant related to the binding strength]; (b) and the corresponding dissolved AlIII in the bulk solution (c) at different pH. Each value represents the mean of two replicates with standard deviation shown by error bars.
Soilsystems 03 00020 g001aSoilsystems 03 00020 g001b
Figure 2. X-ray diffraction (XRD) patterns of the air dried phosphate sorption isotherm samples at pH 3 (a), pH 5 (b), and pH 7 (c), and the selected kinetic samples prepared at pH 5 with 8 mM P (d). AAH and AAP are included as references.
Soilsystems 03 00020 g002
Figure 3. The PDFs of the air-dried phosphate sorption isotherm samples at pH 5 (a) and the corresponding d-PDFs (b) obtained by minimizing the Al–Al peak at 2.85 Å; the (d)-PDF data at pH 3 and pH 7 are in the supporting information. The MCR analysis of PDF data for all sorption samples identifies three components (c), i.e., PDF-MCR-I, -II, and –III. The difference PDF profile of PDF-MCR-II and PDF-MCR-I is shown in (d). The PDF data of AAH and AAP are included as the references.
Soilsystems 03 00020 g003
Figure 4. P K-edge XANES spectra in the energy range of 2145–2180 eV (a) and 2157–2180 eV (b) for the phosphate sorption isotherm samples prepared at different pH values and initial P concentrations with the spectra of AAP as the reference. P K-edge XANES spectra of the end members of adsorption and precipitation speciation used in the linear combination fitting (LCF) analysis (c), and the obtained molar percentages of AAP in P (d) as a function of pH and initial P concentration.
Soilsystems 03 00020 g004
Figure 5. Solid-state 31P NMR ((a) pH 3, (b) pH 5, (c) pH 7 and 8) and 27Al NMR ((d) pH 3, (e) pH 5, (f) pH 7 and 8) spectra of the dried isotherm samples prepared at different pH with the spectra of AAH and AAP as the references. The data in each panel are stacked in the order of increasing initial P concentration from the bottom to the top.
Soilsystems 03 00020 g005aSoilsystems 03 00020 g005b
Figure 6. The differential 27Al NMR obtained by subtracting the AAH spectra from the spectra of selected isotherm samples, with gradually increasing P sorption loading from the bottom to the top, by minimizing peak intensity at 6.9 ppm (a), and the 27Al NMR spectra of the 2 mM phosphate sorption at different pHs with the spectra of AAH as the reference (b).
Soilsystems 03 00020 g006
Figure 7. ATR-FTIR spectra for the dried isotherm samples at pH 3 (a), pH 5 (b), and pH 7 and 8 (c) with the spectra of AAH and AAP as the references. The MCR analysis of all ATR-FTIR spectra identifies three components, IR-MCR-I, -II, and -III, respectively (d).
Soilsystems 03 00020 g007
Figure 8. The P precipitation percentage derived from P K-edge XANES LCF analysis, versus the amount of P sorbed (i.e., the total P removed from the solution) on AAH, fitted with linear equation (black line). Similar data for ferrihydrite from a previous study [16] is included for comparison (AFP: amorphous FePO4).
Soilsystems 03 00020 g008
Figure 9. The released AlIII in the form of precipitates (a) and the total released AlIII including both dissolved AlIII and precipitated AlIII (b) at different pH and initial P concentrations. Note that the molar amount of precipitated AlIII is equal to that of precipitated PO4 which was calculated by the ratio of P in the precipitates, obtained from the LCF analysis of P XANES spectra, multiplied by the P sorption loading.
Soilsystems 03 00020 g009

