Article

Digital Mapping of Habitat for Plant Communities Based on Soil Functions: A Case Study in the Virgin Forest-Steppe of Russia

1
V.V. Dokuchaev Soil Science Institute, Pyzhyovskiy lane 7 building 2, Moscow 109017, Russia
2
Lomonosov Moscow State University, Leninskiye Gory, 1, Moscow 119234, Russia
*
Author to whom correspondence should be addressed.
Soil Syst. 2019, 3(1), 19; https://doi.org/10.3390/soilsystems3010019
Submission received: 14 December 2018 / Revised: 4 March 2019 / Accepted: 6 March 2019 / Published: 9 March 2019
(This article belongs to the Special Issue Digital Soil Mapping of Soil Functions)

Abstract

:
The spatial structure of the habitat for plant communities based on soil functions in virgin forest-steppe of the Central Russian Upland is the focus of this study. The objectives include the identification of the leading factors of soil function variety and to determine the spatial heterogeneity of the soil function. A detailed topographic survey was carried out on a key site (35 hectares), 157 soil, and 34 geobotanical descriptions were made. The main factor of soil and plant cover differentiation is the redistribution of soil moisture along the microrelief. Redistributed runoff value was modelled in SIMWE and used as a tool for spatial prediction of soils due to their role in a habitat for plant communities’ functional context. The main methods of the study are the multidimensional scaling and discriminant analysis. We model the composition of plant communities (accuracy is 95%) and Reference Soil Group (accuracy is 88%) due to different soil moisture conditions. There are two stable soil habitat types: mesophytic communities on the Phaeozems (with additional water runoff more than 80 mm) and xerophytic communities on Chernozems (additional runoff less than 55 mm). A transitional type corresponded to xero- mesophytic communities on the Phaeozems with 55–80 mm additional redistributed runoff value. With acceptable accuracy, the habitat for natural plant communities based on soil function model predicts the position of contrastingly different components of biota in relation to their soil moisture requirements within the virgin forest-steppe of the Central Russian Upland.

1. Introduction

The most important ecological function of the soil as a component of the environment is to maintain the balance and sustainability of the biosphere under the anthropogenic impact and climate change [1,2,3]. The direct methods for soil ecological functions evaluation are limited, that is the main cause why researchers focus on indirect indicators of the soil systems functioning: the soil properties—i.e., the chemical composition of the different soil phases [4,5,6,7], soil structure [4,8,9], etc.—and the properties of environment connected to the soil by material-–energy interactions. The latter include the species composition and productivity of plant communities [10,11,12] and in a broader sense, serve as the basis for landscape indication when mapping hard-to-observe properties of a landscape from lightly observed factors.
The soil is the habitat for the plants—the environment of root nutrition and a seed pool. The study of the soil–vegetation interactions characterizes the features of the habitat for plant soil functions [2,13,14]. Soil structure (aggregate composition and pore space), chemical composition (including organic carbon and nutrients concentration), and moisture characteristics are the key properties for the plant’s growth [4,9,10,11,15,16,17]. The connection between soil properties and plant parameters are implemented in the global and regional ecological scales [18,19,20,21].
Our study site is located in the virgin forest-steppe of East European plain. The climatic conditions of the forest-steppe with favorable water-air and thermal regime contribute to the formation of the most fertile soils among all the natural land areas [22]. However, the diversity of edaphic conditions determines the wide variation of soil moisture and aeration regimes and, as a result, variety in plant species composition. We suppose that the soil moisture is the leading factor controlling species composition in the virgin forest-steppe, as it has been qualitatively shown [23].
The aim of our work was the digital mapping of the habitat for natural plant communities’ soil function, soil moisture conditions and related plant species composition in virgin forest-steppe landscapes of V.V. Alekhin Central Chernozem State Reserve (Kursk region, Russia). The objectives were to: (1) quantitatively characterize the relationship of the water regime and soil properties, the composition of plant species; (2) define the different habitat types; (3) create and verify the habitat for a plant communities map. We characterized the soil forming factors features for each section of the regular grid with resolution 2.5 m. The redistributed runoff value was modelled in SIMWE [24]. Multidimensional scaling and discriminant analysis were used to determine the relationship between surface runoff, soil moisture regime, and plant species composition. The main hypothesis of our work is that the plant species composition is the result of a complex interaction in the sequence: soil forming factor (topography)—soil forming process (redistribution of surface runoff)—soil properties (water and air regime)—soil function—species composition of vegetation.

2. Materials and Methods

The study was completed on the sub-horizontal part of the interfluve and gentle slope in the southwestern part of the Central Russian upland of the East European Plain to the south of the Kursk city (Figure 1) within the Streletsky steppe cluster of the V.V. Alekhin Central Chernozem Reserve. The average annual air temperature of study area is 5.7 °C, the amount of precipitation is 590 mm. Soil-forming parent materials are loess-like loams, underlain with 8 m by chalk deposits.
Key plot area is about 35 ha. Its topography was studied in detail by GNSS surveys. Two Stonex S9III+ GNSS receiver were used. In fixed RTK regimes the positioning accuracy of horizontal coordinates is 8 mm, vertical coordinates—15 mm. About 10,000 of points with accurately defined coordinates and height, were used for digital elevation model (DEM) creation. The DEM resolution is 2.5 m, that is equal to distance between points. The ordinary kriging method [25] was used for DEM creation. It was completed in SAGA GIS. Parameters of calculation are: search distance—100 m, max of points in search distance—60, variogram approximates by 4th degree polynomial function. (Figure 2b). The topography features of the study area include two parts: the sub-horizontal interfluve with sinkholes and the northern slope to 1.5°, complicated by the hollows of a complex genesis described in [19,26].
The surface runoff values were modelled by SIMWE in the GRASS GIS in the local neighborhood of each pixel. The model input parameters are the slope steepness, horizontal and vertical curvature, the amount of excess precipitation, infiltration rate, water diffusion coefficient, surface roughness coefficient [19]. Three first parameters are calculating in GIS by standard methods [24]. Other four parameters are equal for the study area and introduced into the model as constant. The amount of excess precipitation and infiltration rate were taken from regional literature [27]. Water diffusion coefficient and surface roughness coefficients were compiled from [28,29].
The soil survey points are arranged for description of all the diversity of soils (Figure 2b). Totally, 157 boreholes with a depth of 1 to 6 meters were completed. Detailed descriptions of the horizons were completed according to [30], the depth of the secondary carbonates and the boundaries of genetic horizons were determined; soil samples were taken from depth 0–10, 10–20, 30–40, 50–60, 70–80, 90–100 cm. Air-dry soil samples were crushed and sifted through a sieve with a mesh size of 0.25 mm. In samples, the humus content was determined by the Tyurin method [31].
Three land-use types are presented on this area: virgin, mowing steppes and pasture (Figure 2a).
Detailed geobotanical descriptions were performed at 34 sampling plots: the plant communities and the abundance of species were studied. The sampling plots had size 1 m by 1 m. 19 descriptions were completed in mowing steppe, 10 descriptions in virgin steppe, and 5 descriptions in pasture.
All the raw materials: DEM, runoff modelled map, soil and vegetation descriptions are available by the link in supplementary materials.
Species diversity has been determined on 1 m2 observational plots. Steppe meadows have a high level of species diversity per area (mean value for all releve is 23 species). This value is similar to Caucasus and Alps mountain meadows’ species richness evaluation and higher than mires species diversity in these mountain ranges [32]. The quantitative difference between relatively species richness per area of 1 m2 and 100 m2 for meadows is around ½, that is higher compared with pine forests (⅓) and beech forests (¼) in Great Britain [33]. This allows one to consider the habitat’s area of 1 m2 as a basic to species and phytocoenosis ecological evaluation.
The processing of the soil features and vegetation cover data, mapping and assessment of their accuracy was carried out in the SAGA GIS and programming language R. SAGA GIS was used for DEM creation and topography features calculation [34]. The maps evaluation was completed in R, packages ‘MASS’ (linear discriminant analysis) and ‘Ithir’ (accuracy assessment).
For soil and vegetation cover prediction a relatively simple and widely used method Linear Discriminant Analysis (LDA) was used. LDA is a statistical method used to find linear combinations of features that separate two or more classes of objects or events (discrete sizes) with the best accuracy [35,36].
Landolt ecological indicator values have been used for ecological evaluation of plant communities and habitats by species composition [20]. We have been taken rank species values for 8 ecological indicators (moisture, reaction, nutrient, humus, dispersion, light, temperature, continentality). Ecological indicator values have a wide application in ecological and geobotany investigation for determining the main gradients of species and plant communities’ relatively wide spectrum of factors [37,38,39]. Non-metric multidimensional scaling (NMS-ordination) [40] has been used for evaluation of plant communities’ variation according to complex of ecological factors with the application of Past program (v. 3.21) [41].

3. Results

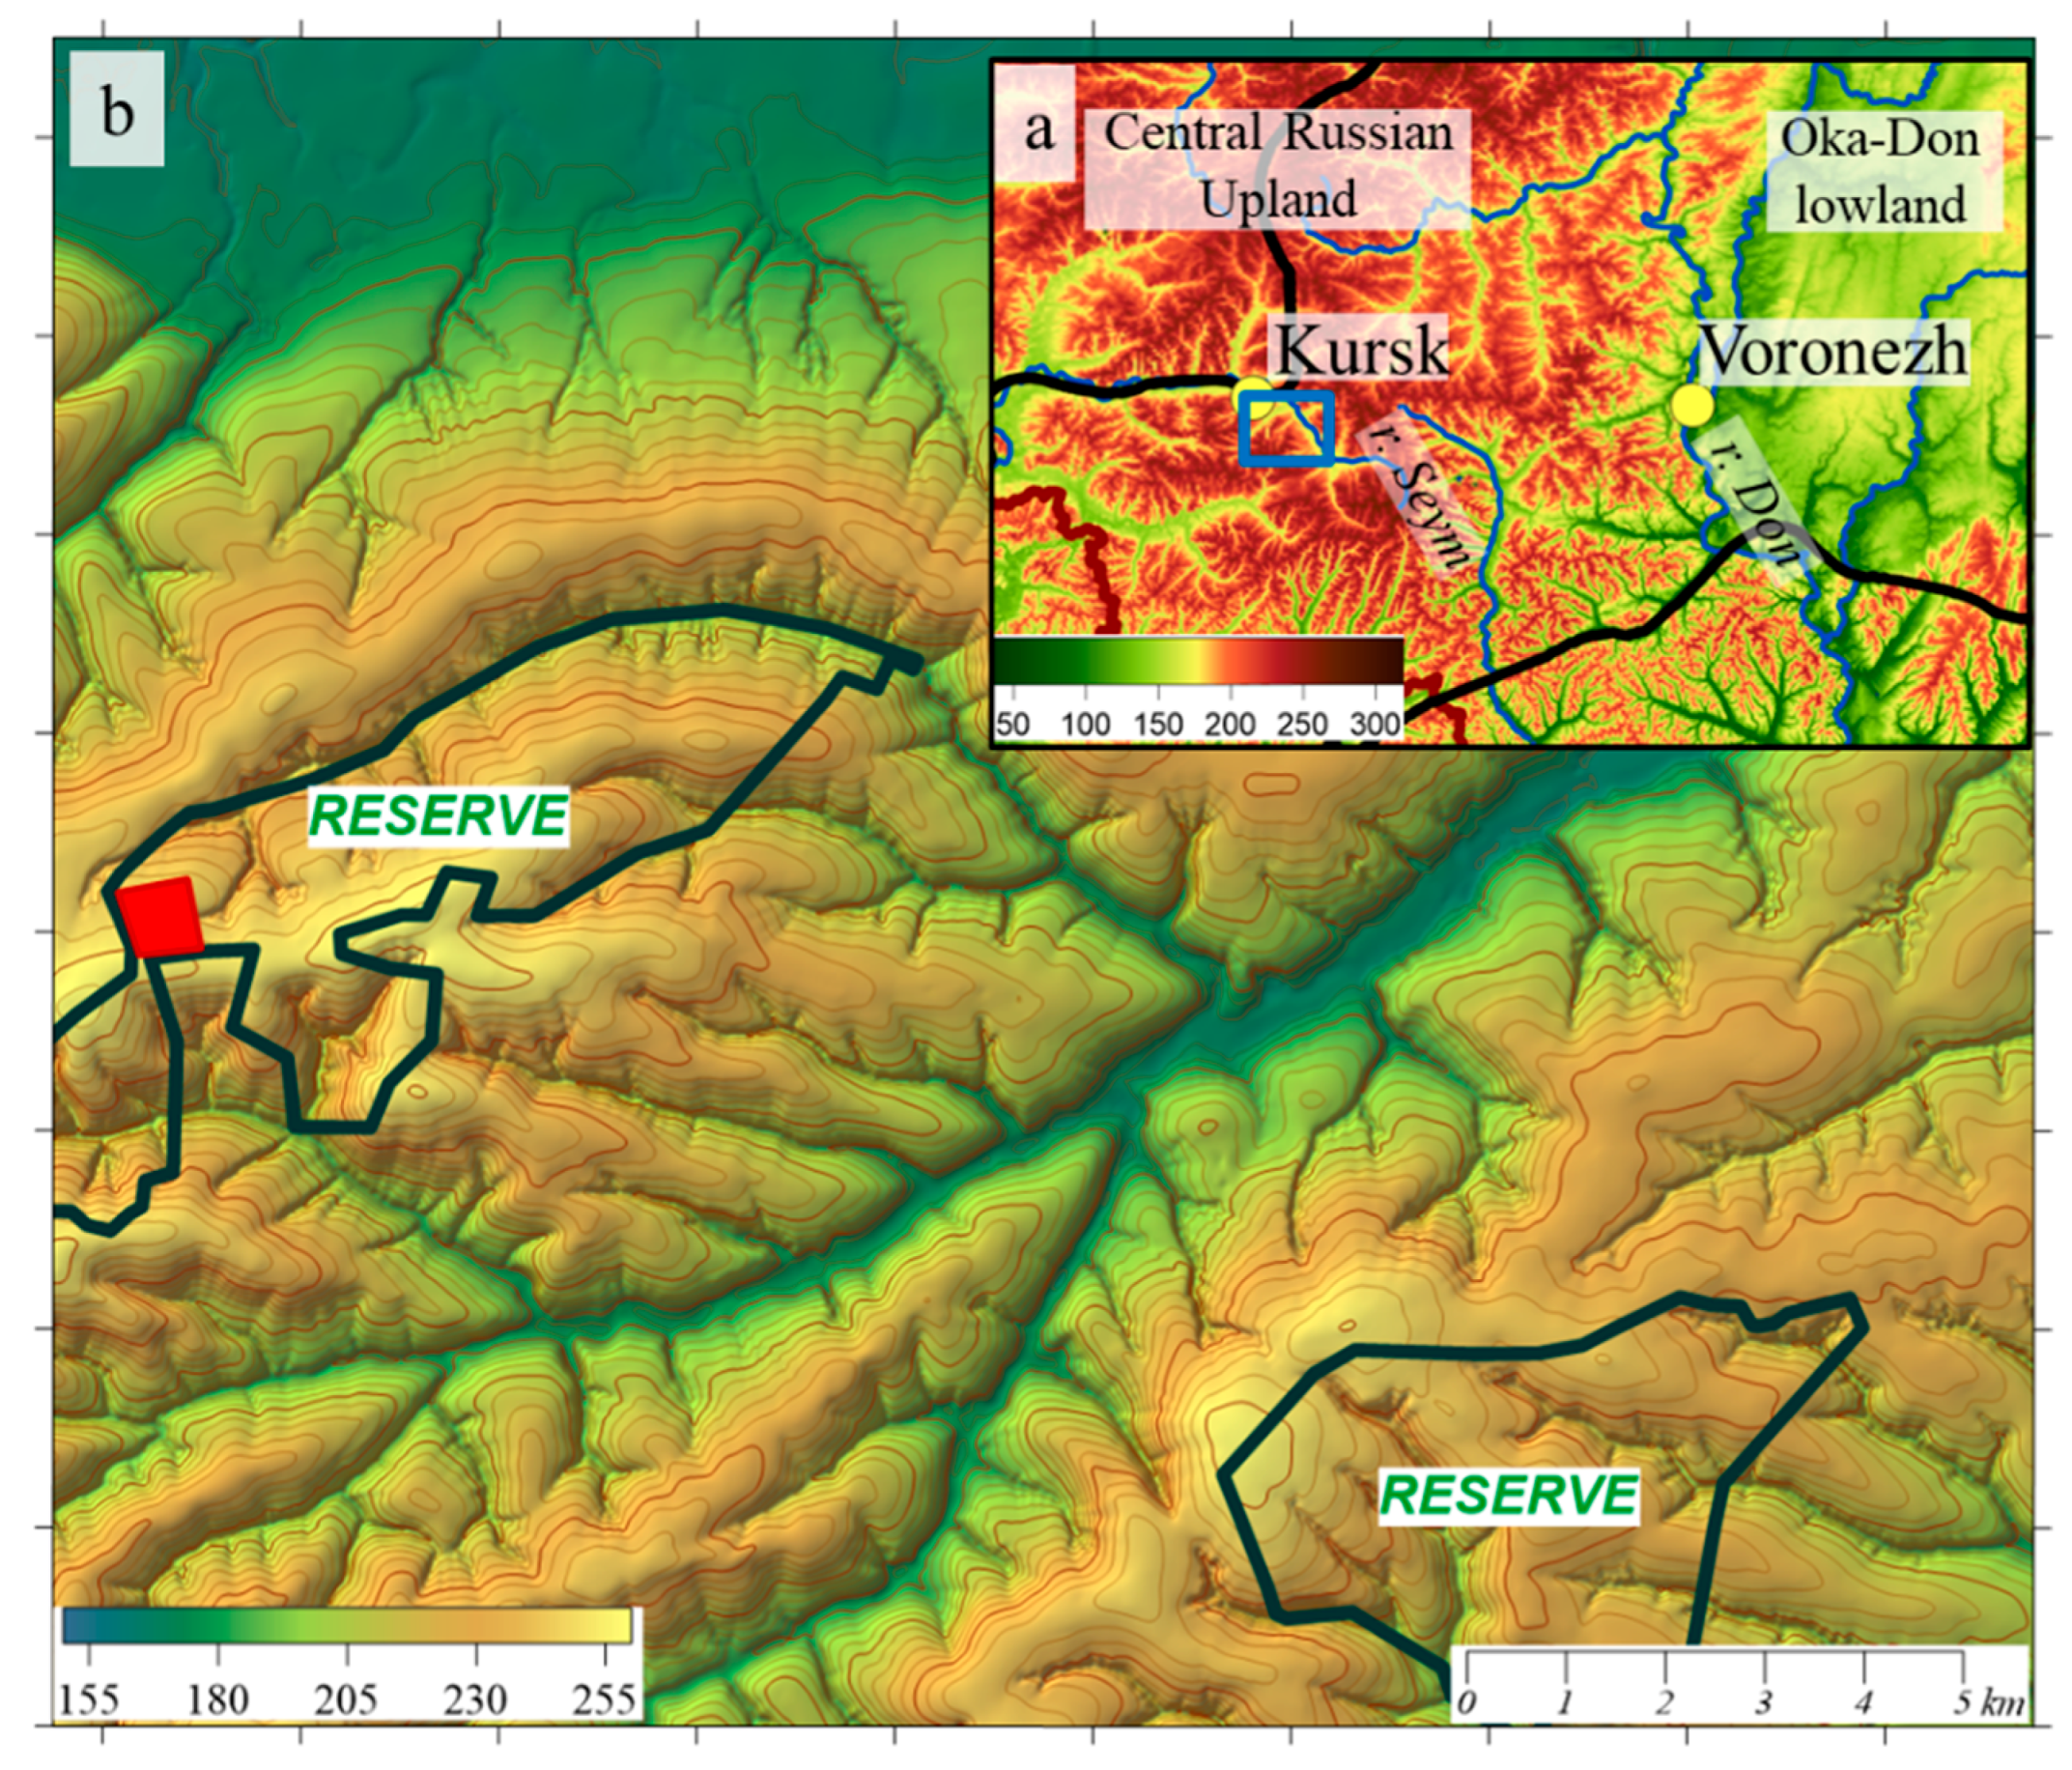
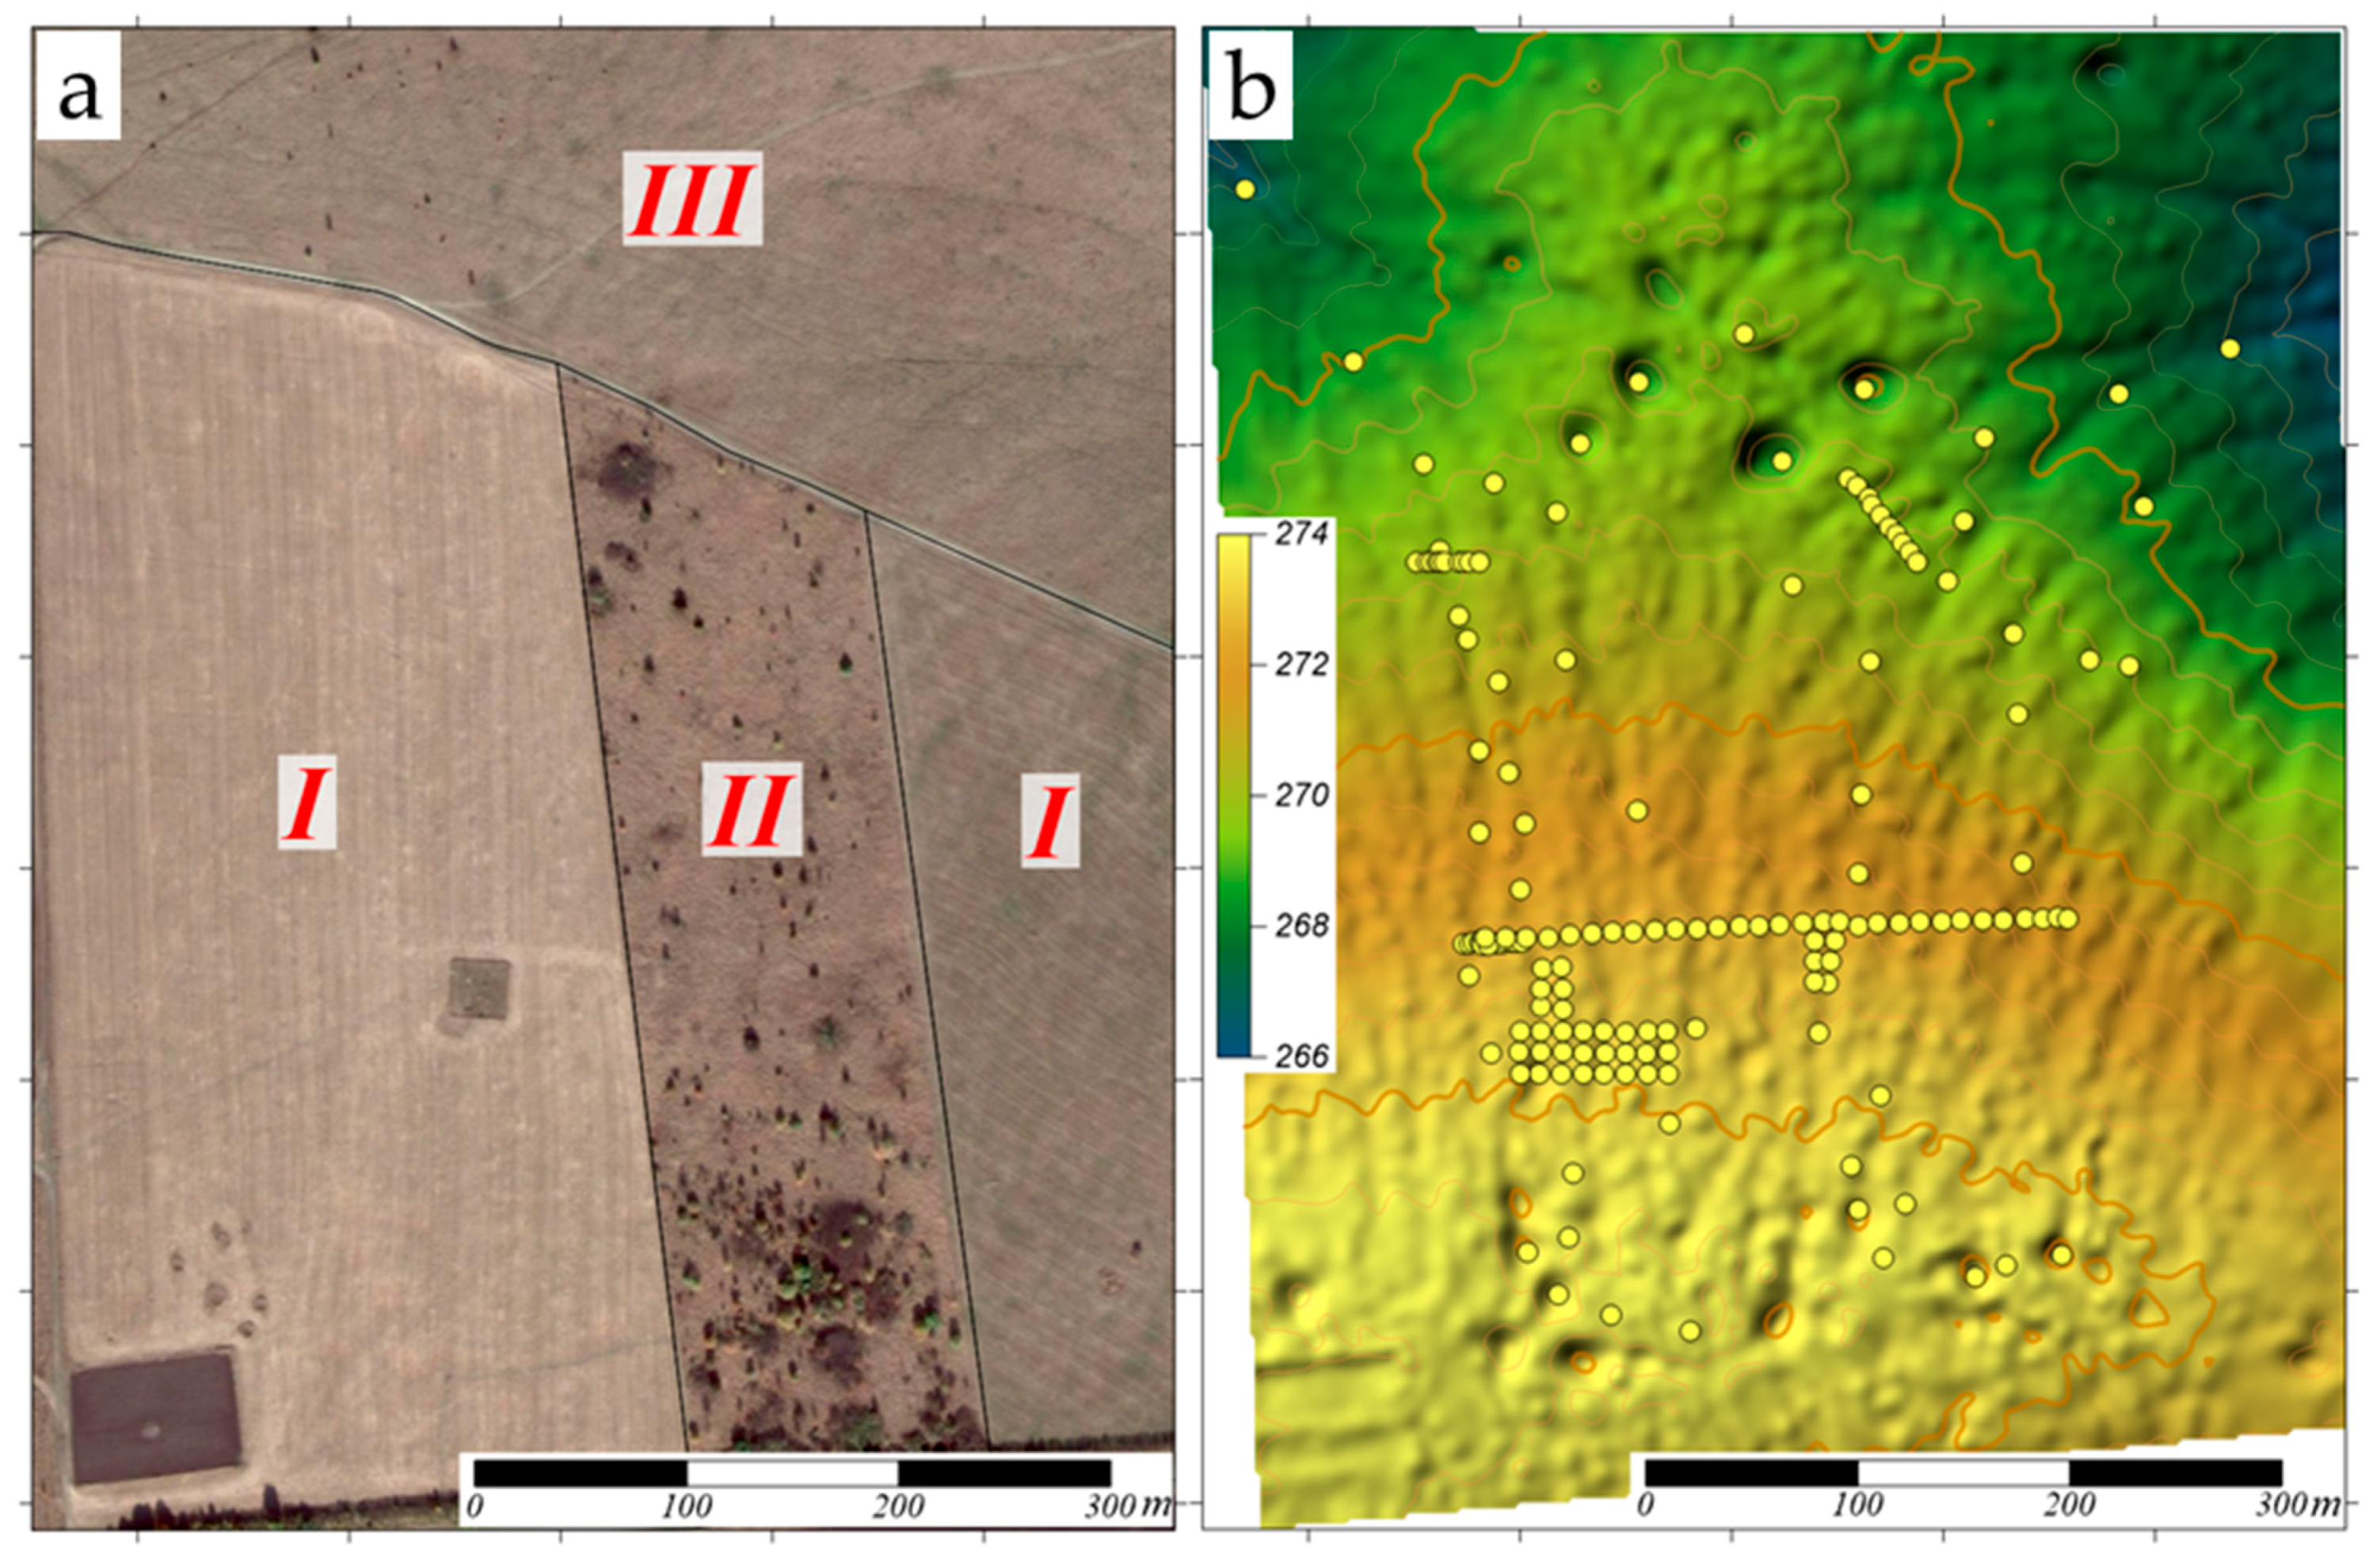
3.1. Soils of the Study Site and the Factors Controlling Soil Properties Variety

The soils of the study site represent two reference groups: Chernozems and Phaeozems. A common feature of all the studied soils is the formation of a very dark, well-structured, thick (over 50 cm, Pachic qualifier) and organic carbon-rich (more than 5%, Hyperhumic qualifier) chernic horizon in the upper part of the soil profile. The Chernozems have the calcic horizon or a layer with protocalcic properties. In Phaeozems, the secondary carbonates are absent. Some Phaeozems temporarily saturated with surface water for a period long enough that allows reducing conditions to occur (Stagnic qualifier) or having uncoated silt and sand grains on structural faces in the lower part of a humus horizon (Greyzemic qualifier).
Thus, the pedodiversity in key plot is presented by 5 different soils: Haplic Chernozem Clayic Hyperhumic Pachic and Chernic Phaeozem Clayic Hyperhumic Pachic on the interfluve, Сalcic Chernozem Clayic Hyperhumic Pachic on the convex hills, including relic marmot’s burrows, Greyzemic Chernic Phaeozem Clayic Hyperhumic Pachic and Stagnic Chernic Phaeozem Clayic Hyperhumic Pachic in hollows and closed depressions.
The key properties for the soil biota are soil structure (aggregate composition and pore space), chemical composition (including organic carbon and nutrients concentration), moisture characteristics [4,9,15]. Chernozems and phaeozems are the most fertile soils all over the world [22], especially in virgin landscapes; the thick, well-structured, organic carbon-rich chernic horizon is formed in the upper parts of all the studied soils. The main difference between soils in the key site is the moisture conditions and the secondary carbonate presence or absence features. It was found, that average water content in chernozems is 280 mm, in phaeozems—340 mm. The water content in 1 m layer of soils was measured at the beginning of growing season. The latter is directly related to the soil water regime, as it has been shown in field research and modeling [42,43], including in areas adjacent to the key site [23]. Therefore, we assume that the difference in soil moisture is the main factor that influences on the soil habitat conditions variety at the key site.

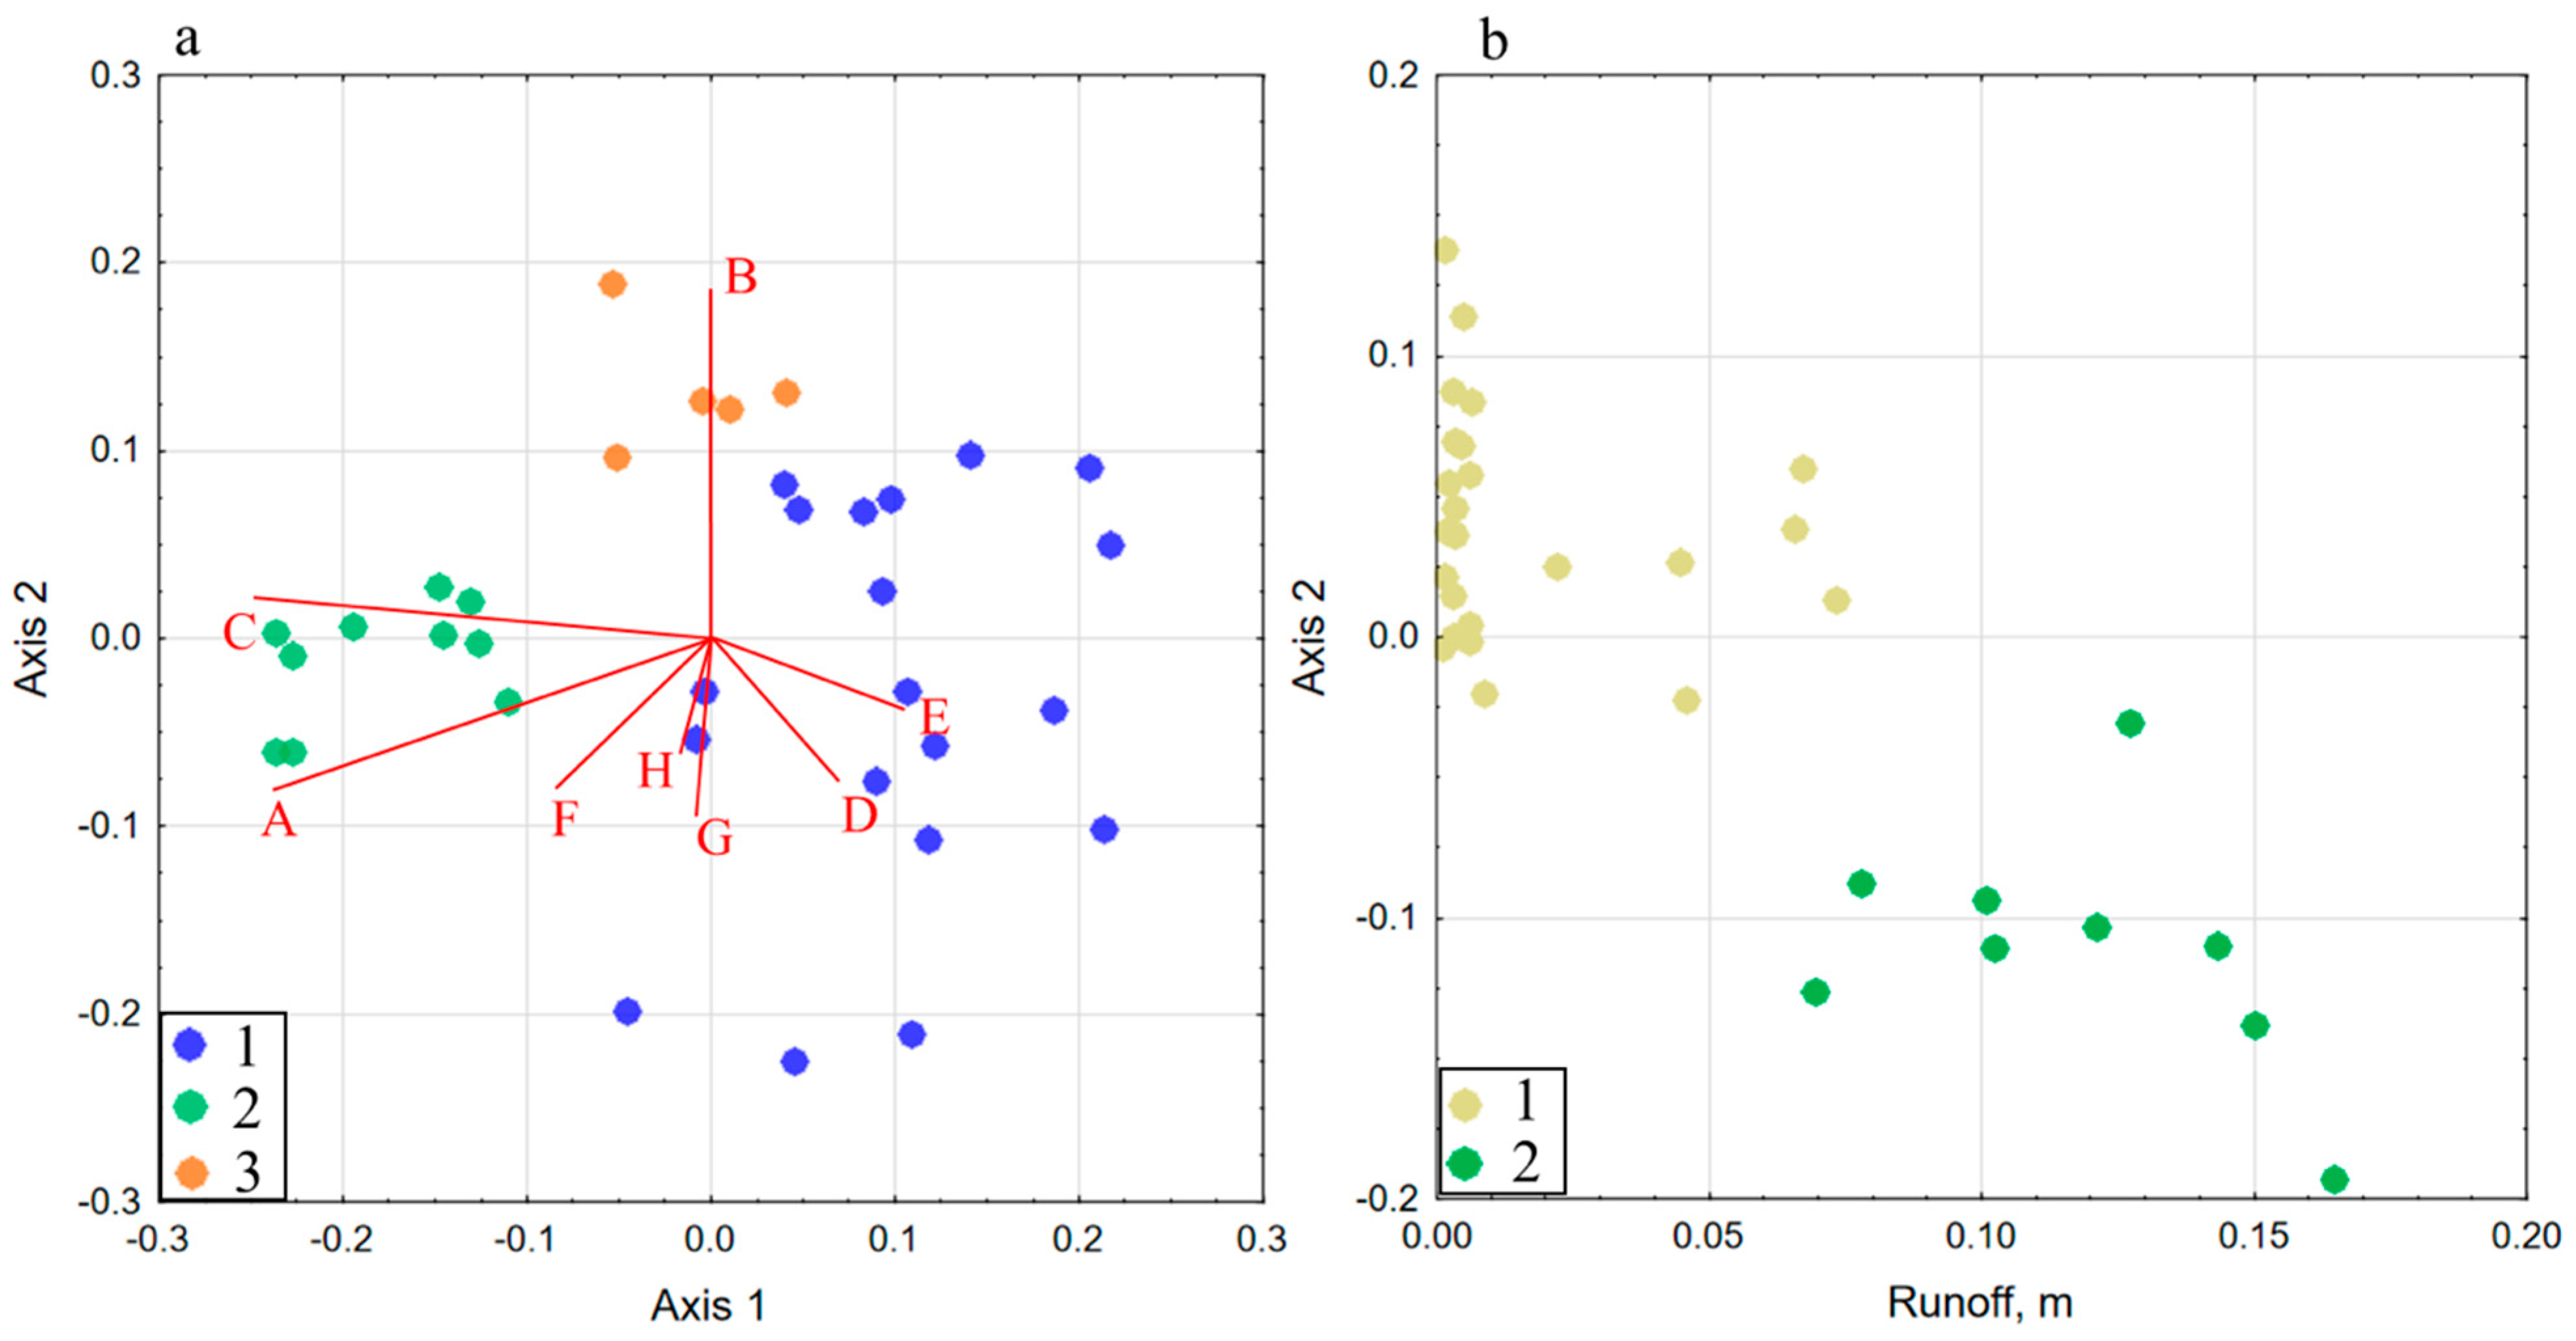
3.2. Vegetation Cover of Key Area and Relation of Vegetation Characteristics with Soil Moisture

Vegetation cover of key areas is presented by plant communities, which are typical for interfluve habitats in the forest-steppe zone. Steppe meadows and herb grass steppes (sparse sod mesophytic grasses with the dominance of Arrhenatherum elatius, Bromopsis riparia, less often Dactylis glomerata and Calamagrostis epigeios) are presented. Dense sod xerophytic grasses species (Stipa pennata and Festuca valesiaca) are co-dominante in some cases. For all phytocoenoses meadows-steppe herb species have a high level of activity according to their frequency and abundance. Meadow-steppe meso-xerophytic taproot (Onobrychis arenaria, Potentilla argentea, Viola rupestris) and mesophytic short rooted (Stachys officinalis, Centaurea jacea) perennial species are most frequent. Annual species (Melampyrum argyrocomum, Rhinanthus minor) are rare.
The ordination scheme presents some vectors of environmental factors calculated of communities according to Landolt ecological indicator values (Figure 3a) [20]. Landolt ecological indicator scales include values of 8 ecological parameters (moisture, reaction, nutrient, humus, dispersion, light, temperature, continentality). The scales allow us to estimate the ecological features of the communities in accordance with the parameters. The ecological status for each releve is determined by the ratio of the sum of environmental values for all species included in releve to the total number of species [44]. Ecological values have a significant connection with two axes of NMS-ordination.
The first axis describes the differences in diversity and abundance of species at sample plots due to differences in landuse types. The observed plots corresponded to different land use types—the mowing steppe, virgin steppe and pasture are forming to isolated areas on the ordination scheme. The accuracy of land use types allocation by this axis is 88%.
The second axis describes the observed differences in diversity and abundance of species in relation with soil moistening. In the attribute space of the axis the studied points are forming two relatively separate groups with a boundary value of the axis 2: −0.025 (Figure 3b). The accuracy of determiation of vegetation types in relation with the value of redistributed runoff is 95%.
The common scheme of topography-soil-vegetation relations is presented at Figure 4. In concave topography forms with additional water inflow leaching water regime is typical. At the flat and convex relief forms, the chernozems with periodically leaching water regime are forming. The Landolt moisture factor for chernozems is significantly lower, than for phaeozems. This regularity is complement to the difference of 1meter layer soil water content. Generally, in concave forms with additional water inflow and more moistened soils are forming mesophitic phytocenoses.
For the first vegetation type, shown at Figure 4, the modeled runoff in less than 80 mm. Xero-mesophilic steppe meadows are formed under these conditions. They are represented by herb (Onobrychis arenaria, Filipendula vulgaris)—dense sod grass (Stipa pennata, Festuca valesiaca)—sparse sod grass (Arrhenatherum elatius, Bromopsis riparia) communities. Among the herb species xerophytic species (Onobrychis arenaria, Linum perenne, Stachys recta) prevail.
Plots with values on the second axis of NMS-ordination less than -0.025 and with modeled runoff more than 80 mm, are characterized by an additional runoff more than 80 mm. Mesophilic herb (Filipendula vulgaris, Achillea millefolium, Amoria repens, A. montana)—sparse sod (Agrostis tenuis, Dactylis glomerata) and sedge (Carex michelii)—sparse sod grass (Arrhenatherum elatius, Bromopsis riparia) steppe meadows are developed under these conditions. In these communities, mesophytic herb and grass species dominate in plant communities. Among the mesophytic herb species Amoria repens, Stachys officinalis, Rumex acetosella are characterized by these communities. Meso-xerophytic species have a low level of coenotic activity.
The runoff on relief microforms determines the division of the herb-grass steppe meadows of the watershed into two groups. With the constant dominance of mesophytic grass species (Arrhenatherum elatius, Bromopsis riparia) in communities, differences are found in the participation of dense sod grasses (Stipa pennata, Festuca valesiaca). The composition of grasses with a certain ratio of mesophytic and xerophytic species has also an important role. With soil moisture increasing the part of dense grass and xero-mesophytic herb species is decreasing. Sparse sod grasses co-dominate in the condition of higher moisture habitats.
The species of xero-mesophyte and mesophyte phytocenoses on Chernozems and Phaeozems are differed by their morphological traits (Table 1). Mesophyte phytocenoses on the Phaeozems are characterized by an absence of short-rhizomatous steppe perennial species (Veronica spuria, Phlomis pungens, Serratula tinctoria, Peucedanum oreoselinum, Anthyllis macrocephala). These species grow on the Chernozems only. Long rhizomatous (Scorzonera purpurea, Sanguisorba officinalis, Rumex acetosa, Polygala comosa) and stoloniferous (Tanacetum vulgare, Amoria repens, Veronica chamaedrys, Leonurus quinquelobatus, Euphorbia semivillosa) species are specific to mesophyte phytocenoses on the Phaeozems. These meadow-steppe, meadow and nemoral species are related to increased moisture conditions. As a rule, they grow with a low abundance, but they can also dominate (for example, Amoria repens participates in the herb (Fragaria viridis, Convolvilus arvensis, Achillea millefolium)—grass (Bromopsis riparia) meadows communities).

3.3. Prediction and Verification of Habitat for Plants Soil Map Based on Soil Function

In Section 3.1 and Section 3.2, we substantiated the essential role of the soil moisture (or water regime of soils) on the formation of soils and vegetation types within the study area. The topography, that is a redistributor of precipitation, determines the water regime of the soils. Therefore, the map of the habitat for natural plant communities based on soil function of the sample plot area is based on the map of the redistributed runoff value in the local neighborhood of each pixel (Figure 5).
The spatial structure of two vegetation types (Figure 6a) and reference soil groups (Figure 6b) were modelled by LDA method from redistributed runoff values. The accuracy of vegetation types map is 95%, kappa = 0.86. The accuracy of soil map is 86%, kappa = 0.68. The change of the reference soil group from Chernozems to occurs when the value of the redistributed runoff value is 55 mm.
It was found, that the chernozems soils are forming at runoff value less than 55 mm, phaeozems—at runoff value more than 55 mm. Change of vegetation type is typical at runoff value of 80 mm.
At the third stage, soil and vegetation maps were combined into one by overlaying and 3 habitat for plant types were obtained. The area of their distribution is presented in Table 2, and the spatial structure is shown in Figure 7.

4. Discussion

Thus, we can indicate the boundary values of the redistributed runoff value corresponding to a change in the functioning modes of the biogeochemical cycle in the series of increasing leakage of moisture: (1) convex slopes and flattened sections of interfluve with a zonal precipitation rate with additional moisture less than 55 mm; (2) hollows with additional atmospheric-leakage moisture less than 80 mm; (3) hollows and ravines with additional moistening more than 80 mm.
The results indicate the existence of a stable relationship in the topography-soil-vegetation system. Topography as a factor of water flows redistribution determines extra moisture in the concave elements, leaching water regime and an increase in moisture reserves in the phaeosems. In such conditions (No. 3 in Figure 7), vegetation is adapted to specific habitat conditions, in which the abundance of mesophytic species increases. In this case, the soil perfoms as a water reservoir, accumulating it in periods of excessive moisture and giving up in periods of droughts.
The second stable area is formed by soils located on flat and convex elements, where non-leaching water regime and lower moisture reserves prevail. In such positions (No. 1 in Figure 7), the abundance of mesophytic species decreases and xero-mesophytic species predominant.
Medium zone (No. 2 in Figure 7) with phaeozem where periodically excessive moistening defines higher moisture reserves relatively to No. 3. In this case periodically-leaching water regime is tipical and xero-mesophyte phytocenoses are formed.
Thus, habitat soil function for plant communities in relationships with soil function is that through the accumulation of spring moisture, adaptive species in an optimal ratio and abundance are growing, the ecological requirements of which are suitable for each local habitat conditions.
On the whole, the mesophyte communites on Phaeozems includes more herbs and Carex species with bigger leaf area than the species of communities on Chernozem. In accordance with [12,45,46,47,48] the plants of mesophyte phytocenoses could increase hydraulic roughness, sediment retention, and minimize soil erosion in comparison with the plants of xero-mesophyte phytocenoses.

5. Conclusions

This paper is devoted to the methodological approach linking the regional climatic data and plant species composition due to topography and soil features.
Three primary conclusions can be drawn from our research:
  • Soil moisture is the leading factor that determines the soil habitat for natural plant communities’ conditions variety in the virgin forest-steppe at a local level;
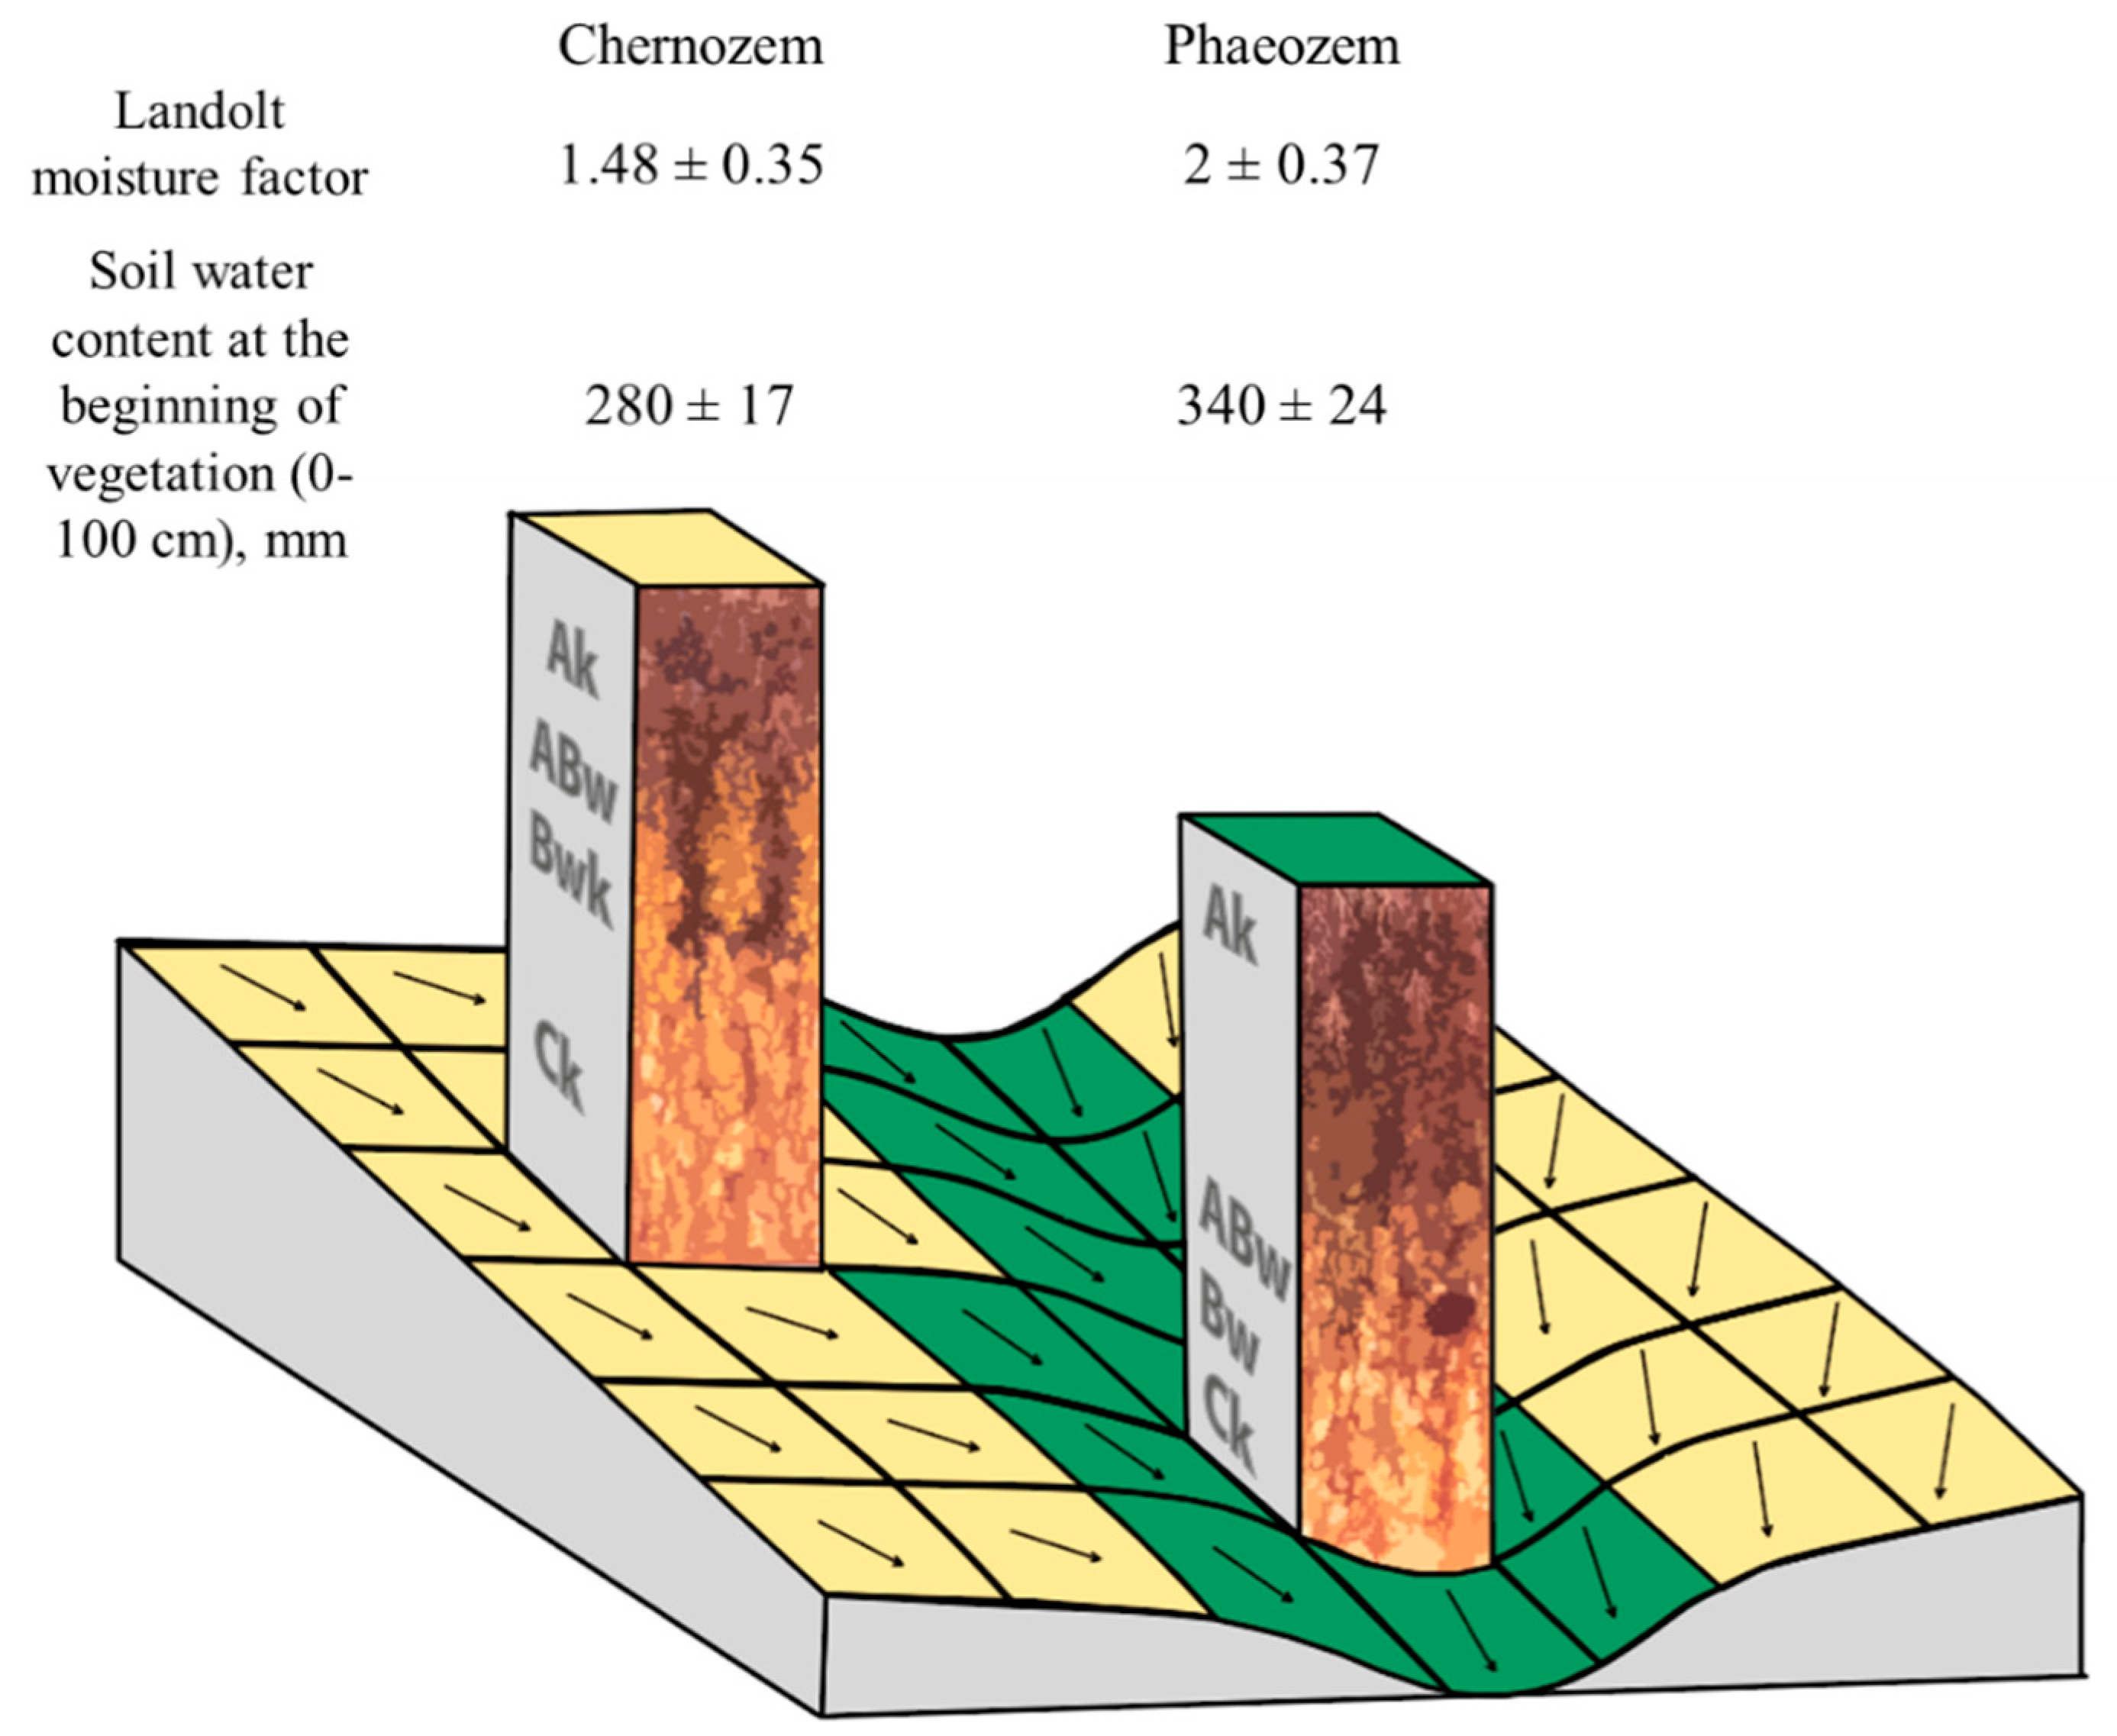
  • There are two stable soil habitats for natural plant communities types: mesophytic communities on the phaeozems (with additional runoff more than 80 mm) and xerophytic communities on chernozems (additional runoff less than 55 mm).
  • Map of habitat for plant communities in relationships with soil function allows us to predict the species composition, its distribution and abundance, the ecological and coenotic structure of steppe meadows and plant communities’ ecological specificity in relation to their requirements for soil moisture conditions.
Our methodological approach allows mapping different soil habitat for plants areas and thus can be used in agro-landscape engineering: crop species selection for planting and herbaceous hedges designing due to their moisture needs. This digital approach of soil mapping may be useful at provisional and regulating ecosystem services assessment [49]. Future works should include these relationships between crops, landforms and soil features in precision agriculture management in forest-steppe to maximize the biological production and reduce environmental risk.

Supplementary Materials

The following materials are available online at https://yadi.sk/d/yi8q5nIwE85gbw.

Author Contributions

Conceptualization—D.K., M.S. and N.L.; Methodology—N.L. and M.B.; Investigation—N.L. and D.K.; Analysis—N.L. and M.B.; Visualization—N.L. and M. Bocharnikov; Writing—Original Draft Preparation—N.L., M.S. and M.B.

Funding

This research was funded by Russian Foundation for Basic Research, grant number 17-04-02217.

Acknowledgments

The authors thank Nina Gricay, student of Lomonosov MSU, for geobotanical descriptions performance. The authors acknowledge anonymous reviewers for their comments and suggestions to improve this paper.

Conflicts of Interest

The authors declare no conflict of interest.

References

  1. Bouma, J. Soil science contributions towards Sustainable Development Goals and their implementation: Linking soil functions with ecosystem services. J. Plant Nutr. Soil Sci. 2014. [Google Scholar] [CrossRef]
  2. Greiner, L.; Keller, A.; Grêt-Regamey, A.; Papritz, A. Soil function assessment: Review of methods for quantifying the contributions of soils to ecosystem services. Land Use Policy 2017. [Google Scholar] [CrossRef]
  3. McBratney, A.; Field, D. Securing our soil. Soil Sci. Plant Nutr. 2015, 61, 587–591. [Google Scholar] [CrossRef] [Green Version]
  4. Calzolari, C.; Ungaro, F.; Filippi, N.; Guermandi, M.; Malucelli, F.; Marchi, N.; Tarocco, P. A methodological framework to assess the multiple contributions of soils to ecosystem services delivery at regional scale. Geoderma 2016. [Google Scholar] [CrossRef]
  5. Jiang, J.; Wang, Y.; Yu, M.; Li, K.; Shao, Y.; Yan, J. Science of the Total Environment Responses of soil buffering capacity to acid treatment in three typical subtropical forests. Sci. Total Environ. 2016, 563–564, 1068–1077. [Google Scholar] [CrossRef] [PubMed]
  6. Li, S.X.; Wang, Z.H.; Miao, Y.F.; Li, S.Q. Soil Organic Nitrogen and Its Contribution to Crop Production. J. Integr. Agric. 2014, 13, 2061–2080. [Google Scholar] [CrossRef]
  7. Wang, Y.; Zhao, X.; Guo, Z.; Jia, Z.; Wang, S.; Ding, K. Soil & Tillage Research Response of soil microbes to a reduction in phosphorus fertilizer in rice—Wheat rotation paddy soils with varying soil P levels. Soil Tillage Res. 2018, 181, 127–135. [Google Scholar] [CrossRef]
  8. Lehmann, A.; Stahr, K. The potential of soil functions and planner-oriented soil evaluation to achieve sustainable land use. J. Soils Sediments 2010, 10, 1092. [Google Scholar] [CrossRef]
  9. Rabot, E.; Wiesmeier, M.; Schlüter, S.; Vogel, H.J. Soil structure as an indicator of soil functions: A review. Geoderma 2018. [Google Scholar] [CrossRef]
  10. Bashir, H.; Ahmad, S.S. Ordination classification of relationship of vegetation and soil’s edaphic factors along the roadsides of Wahcantt, Pakistan. J. King Saud Univ. Sci. 2018. [Google Scholar] [CrossRef]
  11. Liu, S.; Hou, X.; Yang, M.; Cheng, F.; Coxixo, A.; Wu, X. Factors driving the relationships between vegetation and soil properties in the Yellow River Delta, China. Catena 2018, 165, 279–285. [Google Scholar] [CrossRef]
  12. Faucon, M.; Houben, D.; Lambers, H. Plant Functional Traits: Soil and Ecosystem Services. Trends Plant Sci. 2017, 22, 385–394. [Google Scholar] [CrossRef] [PubMed]
  13. Drobnik, T.; Greiner, L.; Keller, A.; Grêt-Regamey, A. Soil quality indicators—From soil functions to ecosystem services. Ecol. Indic. 2018. [Google Scholar] [CrossRef]
  14. Haslmayr, H.P.; Geitner, C.; Sutor, G.; Knoll, A.; Baumgarten, A. Soil function evaluation in Austria—Development, concepts and examples. Geoderma 2016. [Google Scholar] [CrossRef]
  15. Clapperton, M.J.; Chan, K.Y.; Larney, F.J. Managing the Soil Habitat for Enhanced Biological Fertility. In Soil Biological Fertility; Abbott, L.K., Murphy, D.V., Eds.; Springer: Dordrecht, The Netherlands, 2007. [Google Scholar]
  16. Koptsik, S.V.; Koptsik, G.N.; Livantsova, S.Y.; Berezina, N.A.; Vakhrameeva, M.G. Analysis of the Relationship between Soil and Vegetation in Forest Biogeocenoses by the Principal Component Method. Russ. J. Ecol. 2003, 34, 37–45. [Google Scholar] [CrossRef]
  17. Cachovanová, L.; Hájek, M.; Fajmonová, Z.; Marrs, R. Species Richness, Community Specialization and Soil-Vegetation Relationships of Managed Grasslands in a Geologically Heterogeneous Landscape. Folia Geobot. 2012, 47, 349–371. [Google Scholar] [CrossRef]
  18. Dufrene, M.; Legendre, P. Species assemblages and indicator species: The need for a flexible asymmetrical approach. Ecol. Monogr. 1997, 67, 345–366. [Google Scholar] [CrossRef]
  19. Eremenko, E.A.; Panin, A.V. Lozhbinnyj Mezorel’ef Vostochno-Evropejskoj Ravniny; MIROS: Moscow, Russia, 2010. (In Russian)
  20. Landolt, E. Ökologische Zeigerwerts zur Sweizer Flora; Veröffentlichungen des Geobotanischen Institutes der Eidg. Tech. Hochschule: Zurich, Switzerland, 1977; pp. 1–208. [Google Scholar]
  21. Ehrmann, J.; Ritz, K. Plant:soil interactions in temperate multi-cropping production systems. Plant Soil 2013, 376. [Google Scholar] [CrossRef]
  22. Montanarella, L.; Badraoui, M.; Chude, V.; Costa, I.D.; Mamo, T.; Yemefack, M.; Aulang, M.; Yagi, K.; Hong, S.Y.; Vijarnsorn, P.; et al. Status of the World’s Soil Resources (SWIR)—Main Report; FAO: Room, Italy, 2015. [Google Scholar]
  23. Fishman, M.I. Chernozemnye kompleksy i ih svyaz’ s rel’efom na Srednerusskoj vozvyshennosti. Pochvovedenie 1977, 5, 17–29. (In Russian) [Google Scholar]
  24. Neteler, M.; Bowman, M.H.; Landa, M.; Metz, M. GRASS GIS: A multi-purpose open source GIS. Environ. Model. Softw. 2012, 3, 124–130. [Google Scholar] [CrossRef]
  25. Oliver, M.A.; Webster, R. Basic Steps in Geostatistics: The Variogram and Kriging; Springer: Berlin, Germany. [CrossRef]
  26. Velichko, A.A.; Morozova, T.D.; Nechaev, V.P.; Porozhnjakova, O.M. Paleokriogenez, Pochvennyj Pokrov i Zemledelie; Nauka: Moscow, Russia, 1996. (In Russian) [Google Scholar]
  27. Agrofizicheskaya Harakteristika Pochv-stepnoj i Suhostepnoj Zon Evropejskoj Chasti; SSSR: Moscow, Russia, 1977. (In Russian)
  28. Šustić, D.; Tadić, Z.; Tadić, L.; Kržak, T. Hydrologic and hydraulic analysis of less studied watershed. Energy 2008, 1, 1–10. [Google Scholar]
  29. Koco, Š. Simulation of gully erosion using the SIMWE model and GIS. Landf. Anal. 2011, 17, 81–86. [Google Scholar]
  30. IUSS Working Group WRB. World Reference Base for Soil Resources 2014, Update 2015 International Soil Classification System for Naming Soils and Creating Legends for Soil Maps; World Soil Resources Report No. 106; FAO: Rome, Italy, 2015. [Google Scholar]
  31. Arinushkina, E.V. Guide on Soils Chemical Analysis; Moscow State University: Moscow, Russia, 1970; p. 488. (In Russian) [Google Scholar]
  32. Onipchenko, V.G.; Semenova, G.V. Comparative analysis of the floristic richness of alpine communities in the Caucasus and the Central Alps. J. Veg. Sci. 1995, 6. [Google Scholar] [CrossRef]
  33. Hopkins, B. The species-area relations of plant communities. J. Ecol. 1955, 43, 409–426. [Google Scholar] [CrossRef]
  34. Conrad, O.; Bechtel, B.; Bock, M.; Dietrich, H.; Fischer, E.; Gerlitz, L.; Wehberg, J.; Wichmann, V.; Böhner, J. System for Automated Geoscientific Analyses (SAGA) v. 2.1.4. Geosci. Model Dev. 2015, 8. [Google Scholar] [CrossRef]
  35. Bell, J.C.; Cunningham, R.L.; Havens, M.W. Soil Drainage Class Probability Mapping Using a Soil-Landscape Model. Soil Sci. Soc. Am. 1994, 58. [Google Scholar] [CrossRef]
  36. Webster, R.; Burrough, P.A. Multiple discriminant analysis in soil survey. Eur. J. Soil Sci. 1974, 25, 120–134. [Google Scholar] [CrossRef]
  37. Moser, B.; Büntgen, U.; Molinier, V.; Peter, M.; Sproll, L.; Stobbe, U.; Tegel, W.; Egli, S. Ecological indicators of Tuber aestivum habitats in temperate European beech forests. Fungal Ecol. 2017, 29, 59–66. [Google Scholar] [CrossRef]
  38. Odland, A. Interpretation of altitudinal gradient in South central Norway based on vascular plants as environmental indicators. J. Ecol. Indic. 2009, 9, 409–421. [Google Scholar] [CrossRef]
  39. Smirnov, V.E.; Khanina, L.G.; Bobrovsky, M.V. Validation of the Ecological-Coenotical groups of vascular plant species for European Russian forests on the basis of ecological indicator values, vegetation releves and statistical analysis. Bull. Mosk. Obs. Ispit. Prir. 2006, 111, 36–47. (In Russian) [Google Scholar]
  40. Clarke, K.R. Non-parametric multivariate analyses of changes in community structure. Aust. J. Ecol. 1993, 18, 117–143. [Google Scholar] [CrossRef]
  41. Hammer, Ø.; Harper, D.A.T.; Ryan, P.D. PAST: Paleontological Statistics Software Package for Education and Data Analysis. Palaeontol. Electron. 2001, 4, 1–9. [Google Scholar]
  42. Sanderman, J. Can management induced changes in the carbonate system drive soil carbon sequestration? A review with particular focus on Australia. Agric. Ecosyst. Environ. 2012, 155, 70–77. [Google Scholar] [CrossRef]
  43. Vereecken, H.A.; Schnepf, J.W.; Hopmans, M.; Javaux, D.; Or, T.; Roose, J.; Vanderborght, M.H.; Young, W.; Amelung, M.; Aitkenhead, S.D.; et al. Modeling Soil Processes: Review, Key Challenges, and New Perspectives. Vadose Zone J. 2016, 15, 1–57. [Google Scholar] [CrossRef]
  44. Korolyuk, A.Y. Ecological preferences of plants on the south of Siberia. Bot. Issled. Sib. Kazakhstana 2006, 12, 3–38. (In Russian) [Google Scholar]
  45. Kervroëdan, L.; Armand, R.; Saunier, M.; Ouvry, J.; Faucon, M. Plant functional trait e ff ects on runo ff to design herbaceous hedges for soil erosion control. Ecol. Eng. 2018, 118, 143–151. [Google Scholar] [CrossRef]
  46. Berendse, F.; van Ruijven, J.; Jongejans, E.; Keesstra, S. Loss of plant species diversity reduces soil erosion resistance. Ecosystems 2015, 18, 881–888. [Google Scholar] [CrossRef]
  47. Lambrechts, T.; François, S.; Lutts, S.; Muñoz-Carpena, R.; Bielders, C.L. Impact of plant growth and morphology and of sediment concentration on sediment retention efficiency of vegetative filter strips: Flume experiments and VFSMOD mod. J. Hydrol. 2014, 511, 800–810. [Google Scholar] [CrossRef]
  48. Gyssels, G.; Poesen, J.; Bochet, E.; Li, Y. Impact of plant roots on the resistance of soils to erosion by water: A review. Prog. Phys. Geogr. 2005, 29, 189–217. [Google Scholar] [CrossRef]
  49. Adhikari, K.; Hartemink, A.E. Linking soils to ecosystem services—A global review. Geoderma 2016, 262, 101–111. [Google Scholar] [CrossRef]
Figure 1. Study area (a) area location (blue square) relatively natural areas and large cities, (b) typical topography of central Russian upland and Central Chernozems State Reserve, red square—key plot (coordinates of the center—51.5727N, 36.0926E).
Soilsystems 03 00019 g001
Figure 2. (a) Land use types (I—mowing steppe, II—irgin steppe, III—pasture) and (b) DEM of key plot and soil survey points (yellow circles).
Soilsystems 03 00019 g002
Figure 3. (a) distribution of vegetation plots on Non-metric multidimensional scaling (NMS-ordination) and their correlation with Landolt ecological indicator values. The similarity index is the Euclidean distance. Coordinate 1: R² = 0.374; Coordinate 2: R² = 0.1775. A—moisture, B—reaction, C—nutrient, D—humus, E—dispersion, F—light, G—temperature, H—continentality. Types of land use: 1—mowing; 2—virgin; 3—pasture; and (b) the allocated vegetation types in the attribute space of water runoff and Axis 2 of NMS-ordination: 1—xero-mesophilic communities; 2—mesophilic communities.
Soilsystems 03 00019 g003
Figure 4. The common scheme of topography-soil-vegetation relations.
Soilsystems 03 00019 g004
Figure 5. The SIMWE modelled runoff value, m; isohypses are drawn through 0.5 m.
Soilsystems 03 00019 g005
Figure 6. (a) Vegetation types of the key area: 1—xero-mesophilic communities; 2—mesophilic (composition of phytocenoses in the text) and (b) Soils reference groups map: 1—chernozems; 2—phaeozem.
Soilsystems 03 00019 g006
Figure 7. Soil habitat for plants types: 1—convex topography forms with xero-mesophytes on the chernozems, 2—concave topography forms with xero-mesophytes on the phaeozems, 3—concave topography forms with mesophytes on the phaeozems.
Soilsystems 03 00019 g007
Table 1. Life forms plant diversity in communities on the chernozems and the phaeozems.
Life FormsSoil Reference Groups
ChernozemPhaeozem
Sod perennial species77
Short rhizomatous perennial species2320
Long rhizomatous perennial species1923
Stoloniferous perennial species2629
Bulbous species11
Annual species56
Shrub and semi-shrub species22
Summ8388
Table 2. Raster overlay cross-tabulation (at intersection—types of vegetation habitats (Figure 7), in brackets—area in ha).
Soil Reference Groups
Vegetation types chernozemsphaeozems
Xero-mesophytes1(33)0
Mesophytes2(1.5)3(1)

