Abstract
Quantifications of annual soil respiration in switchgrass systems are limited to the growing season or coarse-scale temporal sampling. This study evaluates daily and seasonal soil CO2 respiration in switchgrass croplands. Hourly measurements during a 12-month period were taken for soil CO2 flux, soil temperature, and soil moisture. Although both soil temperature and moisture were positively correlated with soil CO2 flux rates, soil temperature was the primary driver of soil respiration. During winter, lower soil temperatures corresponded with significant decreases in average daily CO2 flux rates, however, CO2 pulses associated with precipitation events increased flux rates up to three times the seasonal daily average. Soil temperature influenced both daily and seasonal flux patterns where the highest flux rates, up to 31.0 kg CO2 ha−1 h−1, were observed during the warmest hours of the day (13:00 to 15:00) and during the warmest season (Summer). Summer and Spring emissions combined accounted for 80.1% of annual flux, indicating that exclusion of non-growing season time periods may result in an underestimation of total annual CO2 efflux. Our results indicate that inclusion of the non-growing season and a fine-resolution temporal sampling approach provides more accurate quantifications of total annual CO2 emissions in switchgrass croplands.
1. Introduction
On a global scale, release of carbon dioxide (CO2) through soil respiration is estimated to contribute more than ten times the amount of carbon (C) to the atmosphere than anthropogenic fossil fuel emissions [1,2]. Consequently, changes in land use and management practices that affect soil respiration rates can have a significant impact on atmospheric CO2 concentrations and soil C pools [3]. In the United States, agriculture alone occupies 51.3% (1.16 billion acres) of the total land area [4] and is among the largest net sources of atmospheric C resulting from land use change [5]. In recent years, the cultivation of bioenergy crops has been embraced by greenhouse gas (GHG) reduction efforts to not only mitigate atmospheric CO2 emissions through the reduction of fossil fuel use, but to also promote C sequestration in agricultural soils [6,7]. Evidence suggests that bioenergy crops can promote soil C capture and storage as much as 5.4 Mg C ha−1 yr−1 [7], however, a better understanding of soil CO2 emissions, the primary mechanism of soil C loss in agricultural landscapes, is needed to determine the net C sequestration potential of these systems. Parkin and Kaspar [8] reported that careful temperature-based correction algorithms are necessary to accurately estimate annual CO2 emissions from short term measurements. They suggested future research to assess the errors associated with C loss determined from short-term CO2 flux measurements made at infrequent intervals.
Bioenergy crops are often regarded as C neutral or C sink systems due to their ability to offset fossil fuel GHG emissions, fix and deposit atmospheric C into soils, and recapture C released during utilization in crop production in subsequent growing seasons. Quantification of actual offsets generated by these crops has progressed to include many components of atmospheric C release and capture including soil and plant studies as well as complexities of the cultivation process [9,10]. These assessments can be used to identify the most efficient bioenergy crops for meeting C offset and sequestration goals from various perspectives of production. In terms of GHG offsets, switchgrass has emerged as a highly effective bioenergy resource, reducing GHG emissions from fossil fuels by 115% compared to 85% and 40% by reed canary grass and corn, respectively [9]. Studies assessing soil processes also indicate that although soil respiration in switchgrass fields can account for 44% of total plant biomass C loss, the increase in soil C content in these systems results in a greater net C uptake by soils than has been observed for some other biofuels [11,12]. Soil CO2 respiration studies assessing switchgrass croplands in the southeastern United States are, however, often limited either to data collected at a coarse temporal scale (weekly or biweekly) or to the growing season, including only warmer months. Scientists often try to estimate a total amount of C loss using the field measured data. The limited data for estimating a total annual soil C loss may mislead the results.
Extensive research has demonstrated that soil respiration rates are positively correlated with temperature [1,2,13,14] and soil moisture [15,16,17,18,19,20], both of which vary diurnally, seasonally, and episodically. Fine-resolution temporal data, i.e., multiple measurements per day, is required to assess episodic events, such as precipitation, to capture pulses in soil CO2 respiration in response to soil wetting [16,20], which would be missed using a weekly to bi-weekly sampling approach [21]. With respect to seasonal variation, although cooler soil temperatures are associated with a decrease in soil CO2 rates, soil respiration has been shown to continue even in snowy, winter conditions [22]. Omission of soil flux data during non-growing seasonal periods could thus significantly affect the net annual CO2 flux estimated for the system. These limitations in soil CO2 flux studies in switchgrass croplands create the potential to inaccurately estimate annual loss of C through soil respiration.
Although some studies do report switchgrass soil CO2 flux rates based on fine-scale and long-term data, these studies have been conducted in regions outside of the southeastern United States [11,23,24], which differ significantly in annual climate regimes that affect soil temperature and soil moisture patterns. Applying these rates to switchgrass systems located in the southeastern U.S. may also misrepresent soil C losses within the region. Switchgrass production in East Tennessee has increased significantly through efforts to cultivate biofuel crops to offset fossil fuel production and use in the region. Consequently, geographically targeted studies are needed to accurately develop C sequestration values for switchgrass production in East Tennessee.
This study investigated diurnal and seasonal variation in soil CO2 flux for a switchgrass cropland in East Tennessee, and assessed the role of soil moisture and soil temperature as controls on soil CO2 flux rates. First, we hypothesized that soil CO2 flux rates are higher than those reported for the Pacific Northwest and Central Plains regions of the United States due to the warmer climate and annual precipitation patterns in E TN. Further, we hypothesized that soil temperature was a more significant control on soil CO2 flux rates than soil moisture due to the relatively consistent annual precipitation regime coupled with significant thermal changes throughout the seasons. A fine-scale, i.e., hourly, temporal sampling approach was used for one full year to provide a better understanding of soil respiration responses to diurnal, episodic, and seasonal conditions.
2. Methods
2.1. Site Description
The study was conducted in an Alamo switchgrass plot at the University of Tennessee Plant Science Experiment Station (UT PSES) and at the University of Tennessee Holston Dairy Farm (UT HDF) both located in Knoxville, Tennessee (35°58′ N, 83°56′ W). Soil properties for both sites are listed in Table 1. Regional climatic conditions are humid subtropical with an average annual precipitation of 121.9 cm and weekly averages ranging from 3.0 cm to 5.5 cm. The mean annual temperature is 14 °C with the hottest month, July, ranging from 21 °C to 32 °C and the coldest month, January, ranging from −1 °C to 8 °C. The data were collected using two weather stations located in the UT PSES and HDF.

Table 1.
Soil properties of the study site.
The study was initiated at the UT PSES in well-established switchgrass plots planted in 1992. Crop management at this site, however, did not incorporate the use of nitrogen fertilizer which is outlined in University of Tennessee (UT) Extension recommendations and commonly practiced in the southeastern United States to increase crop yield. Flux measurements at the UT HDF site began in mid-November and continued at this location through to the completion of the experiment. UT HDF switchgrass plots were established in 2004 and managed according to UT Extension recommendations which included the application of 67 kg ha−1 y−1 of nitrogen annually. Thus, we ended up having a total of 14 month of data from the two study sites.
With the exception of the use of nitrogen fertilizer, site characteristics at both the UT PSES and UT HDF sites were comparable to reduce error resulting from differences in site environmental conditions. In addition to similar soil profiles and regional climatic conditions, both sites adhered to a similar cropping and harvesting regime in which grass was cut between 10 and 15 cm once per year in early November. Although the use of nitrogen fertilizer improves switchgrass crop production, this practice has been shown to have mixed results related to soil CO2 flux [2,16,20].
2.2. Soil Properties
Chemical soil properties for both UT PSES and UT HDF are listed in Table 1. The laser diffraction method (LDM) was employed to confirm soil classification based on particle size and ratio. Soil type classification was consistent within the first 30 cm of the soil profile with UT PSES characterized by a loam and UT HDF by sandy clay. Chemical soil analyses included soil pH, cation-exchange capacity (CEC) and soil organic carbon (SOC) content. CEC was determined using the soil testing protocol developed by the Clemson soil testing with mineral extraction performed using a Perkin-Elmer 5300 Dual View Inductively Coupled Plasma spectrometer. SOC was determined using the dry combustion method described in Sparks et al. [25]. Six replicate soil samples from the four depths at each location were collected. All soil chemistry analyses were performed at the University of Tennessee Soil, Plant and Pest Center in Nashville, TN.
2.3. Soil Respiration Measurements
Daily CO2 flux measurements were taken once per hour from 00:00 to 23:00 throughout the duration of the experiment with the exception of the cool season (December to March) in which measurements were taken once every two hours due to solar power limitations during this season. Flux rates determined from hourly data were used to assess annual, seasonal, and daily soil flux patterns. Soil CO2 flux was measured using the LICOR LI-8100 Automated Soil CO2 Flux system comprised of an infrared gas analyzer control unit and multiplexer capable of supporting continuous flux measurements for up to eight LICOR 8100 long-term closed chambers. A total of six chambers were established at the UT PSES study site. Three chambers were positioned atop switchgrass crowns to represent covered areas (Cover) and the other three chambers were positioned in the interspaces between crowns to represent bare soil (Bare).
The LICOR LI-8100 long-term CO2 flux chambers were installed to implement the closed chamber method for estimating soil respiration of CO2. In this method, the LI-8100 Analyzer control unit estimates soil respiration rates by measuring the increase or decrease (flux) of gaseous CO2 concentrations in the chamber headspace over time. The observation time for all measurements was 90 s to minimize chamber CO2 concentration changes during analysis and a 30 s dead band was programmed to allow for equilibration of the chamber pressure upon closure. All measurement protocols were programmed using a LICOR 8100 palm wireless controller linked with the LI-8100 Analyzer control unit.
Each flux chamber has an internal volume of 4076.1 cm3 with an exposed soil area of 317.8 cm2. The whole system dimensions are 48.3 cm long by 38.1 cm wide by 33 cm high. To reduce error from lateral diffusion of CO2 in the soil column, PVC soil collars measuring 20.3 cm in diameter were inserted to a depth of 3–5 cm and extended approximately 6–10 cm above the soil surface. A double gasket system sealed the chamber outside the soil collar and between the chamber and mounting plate to minimize CO2 leaks and wind effects [26]. Between measurements, the chamber head moved away from atop the measurement collar to minimize perturbations to the natural microclimate. Vegetation height was maintained at 5 cm in each chamber to allow for automated chamber movement, though we do recognize that clipping vegetation for maintenance may result in an underestimation of soil CO2 flux rates due to decreased soil C accumulation [27]. Soil temperature and moisture was also recorded at the time of each measurement. Soil temperature was monitored using Omega T-handled Type E thermocouples with 6.4 mm diameter and 250 mm immersion length inserted to a depth of 250 mm. Volumetric soil moisture was measured using 5 cm long EH2O Model EC-5 dielectric sensors.
A cubic polynomial regression analysis was applied to hourly measurements to evaluate diurnal patterns in soil CO2 flux with changes in soil moisture and temperature [28] for both Cover and Bare plots separately. Seasonal and annual flux patterns were determined using daily average flux rates calculated from hourly measurements. Seasonal assessments were represented as Spring (20 March to 20 June), Summer (21 June to 22 September), Fall (23 September to 21 December), and Winter (22 December to 19 March). To determine annual flux patterns, averaged daily CO2 flux values were summed with Cover and Bare sites representing 75% and 25%, respectively, of the total land area.
3. Results and Discussion
3.1. Annual CO2 Flux
The total annual soil CO2 emission for Cover and Bare sites were 81.17 Mg CO2 ha−1 y−1 and 51.69 Mg CO2 ha−1 y−1, respectively. These values were used to determine an average weighted annual CO2 emission of 73.80 Mg CO2 ha−1 y−1 for the switchgrass plot, where Cover is representative of 75% and Bare 25% of the total land surface area. This equates to a loss of 20.14 Mg C ha−1 y−1. The total annual soil CO2 flux measured here for switchgrass is significantly greater than estimations of annual soil CO2 efflux reported for other perennial grasses [29,30]. Compared to other crop grasses, annual loss of CO2–C flux for switchgrass is five times greater than has been observed for barley, 4.0 Mg C ha−1 y−1 and more than two times greater than reports for crops such as wheatgrass, 8.65 Mg C ha−1 y−1 [30]. In some instances, however, annual soil flux under annual and perennial crop grasses have been shown to range between 14.8 Mg CO2-C ha−1 y−1 and 20.3 Mg CO2-C ha−1 y−1 during the growing season alone [20]. This may be due to differences in climate, environmental conditions and species types. The warm, humid climate in the East Tennessee region may provide conditions conducive to higher average soil respiration rates compared to other switchgrass croplands in other regions. This is supported by lower estimated annual flux rates reported from other regions such as North Dakota (10.8 Mg CO2-C ha−1 y−1) [11], Iowa (10.2 Mg CO2-C ha−1 y−1) [24], and Louisiana (3.72 Mg CO2-C ha−1 y−1) [31]. Consequently, although it has been suggested that switchgrass croplands in the East Tennessee region function as C sinks or C neutral, our results suggest that loss of soil C through CO2 respiration may exceed an annual SOC accumulation rate of 7.55 Mg C ha−1 y−1 [32]. These findings demonstrate the need for a more detailed analysis of total net ecosystem exchange of C in East Tennessee switchgrass croplands to better understand the role of these systems in local and regional C budgets.
3.2. Seasonal CO2 Flux
Seasonal flux trends for total cropland area show a positive correlation between average seasonal temperatures and soil CO2 respiration rates. The highest seasonal CO2 fluxes were observed during the warmest season (summer) and the lowest fluxes during the coolest (winter) (Figure 1). Average daily CO2 respiration rates increased and decreased throughout the Spring and Fall seasons, respectively. Increasing ambient and soil temperatures in the Spring stimulate both plant growth and microbial activity previously dormant during the Winter. The creation of plant litter and movement of new roots through the soil supply fresh carbon and oxygen to soil microbes, resulting in a steady increase in soil CO2 respiration during the Spring transition from Winter to Summer. Similar soil temperature ranges were observed during the Spring and Fall transition, however, higher soil flux rates were observed during the Spring. Lower flux rates in the Fall coincide with generation of organic material with matured plants and decreasing ambient and soil temperatures, which can slow respiration from microbial and autotrophic processes [1,14]. Further, average daily Spring soil moisture was greater than in the Fall at 25.8% and 19.2%, respectively. Greater soil moisture content has been shown to correlate with higher soil C content [16,20] which may also contribute to the greater flux rates during the Spring. Summer alone accounted for approximately 47.4% of annual CO2 emissions while Spring and Summer combined was representative of 80.1% of the annual flux. The Fall and Winter seasons contributed least to the overall annual soil CO2 flux, 13.3% and 6.6% of respectively. However, representing close to 20% of total annual emissions, exclusion of these seasons may result in a significant underestimation of total annual soil CO2 respiration.
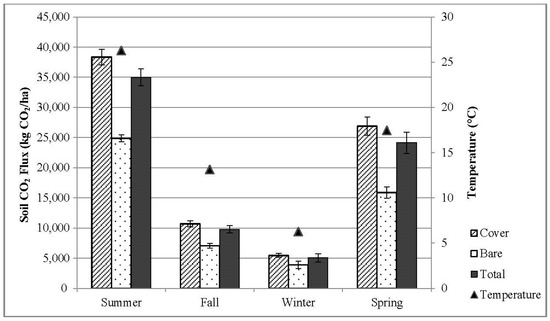
Figure 1.
Average seasonal CO2 flux rates (kg CO2 ha−1) and soil temperature. Spring was dated 20 March to 20 June, Summer 21 June to 22 September, Fall 23 September to 21 December, and Winter 22 December to 19 March.
Average respiration rates at Cover sites were greater than at Bare sites for every season (Figure 1), with the greatest flux rate offsets between site types observed during Spring and Summer. Previous studies have shown that vegetated soils can exhibit higher rates of soil respiration which can be correlated with larger microbial communities [33,34]. Results of this study are consistent with these findings, with higher soil CO2 respiration under Cover due to greater plant biomass, including switchgrass crowns and root structure, as well as increased microbial activity due to in situ litter supplied by the switchgrass crowns [33,34]. Reduced flux variation between Cover and Bare during Winter was mostly likely the result of reduced microbial activity due to cooler soil temperatures, in spite of higher soil moisture content during this season.
3.3. Daily CO2 Flux
Daily CO2 flux patterns followed the patterns of diurnal soil temperature shifts. During all seasons except winter, the highest and lowest daily flux rates were observed during the warmest and coolest hours of the day, respectively (Figure 2).
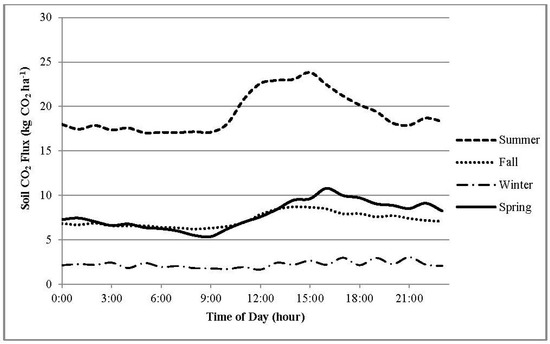
Figure 2.
Daily variations in CO2 flux for each season.
During Spring, Summer and Fall the highest average daily fluxes occurred between 13:00 and 16:00 while the lowest flux rates were measured between 00:00 and 09:00. The greatest diurnal variation in hourly flux rates was observed during the summer with an average daily range of 6.79 (±0.77) kg CO2 ha−1 h−1. The highest average hourly flux rates for the total switchgrass cropland area were measured during June and ranged from 20.6 kg CO2 ha−1 h−1 at 05:00 and 31.0 kg CO2 ha−1 h−1 at 15:00. The smallest daily variation in hourly flux rates was observed during the winter with an average daily range of 1.39 (±0.21) kg CO2 ha−1 h−1. Diurnal flux patterns were consistent with the patterns between soil temperature and soil CO2 respiration discussed with respect to seasonal trends. Higher temperatures during the daylight hours corresponded with daily peak soil respiration rates. Conversely, the decrease in CO2 flux throughout the evening correlated well with decreasing daily soil temperatures which slows biological processes. In addition to lower average soil temperatures, reduced diurnal variations in soil temperature during this season resulted in more consistent conditions from day to night and contributed to reduced variation in diurnal flux rate trends. Reduced daily variations in soil temperature under wetter soil conditions combined with cool season temperatures have been shown to be correlated with decreased soil respiration variability [35]. The cool, wet winters of the East Tennessee climate are consistent with these conditions, as are the results of this study.
3.4. Soil Moisture and Soil Temperature
Figure 3 and Figure 4 show the annual CO2 flux along with soil temperature and moisture. Overall, CO2 flux corresponds well with soil temperature change, while soil moisture was not a primary factor controlling CO2 flux in our study.
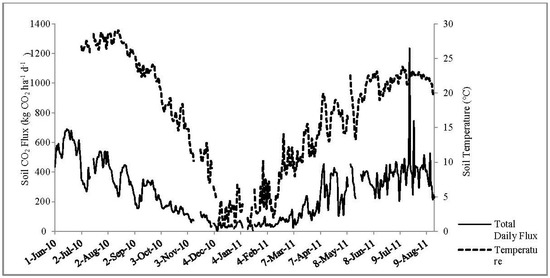
Figure 3.
Variations of daily CO2 flux and soil temperature.
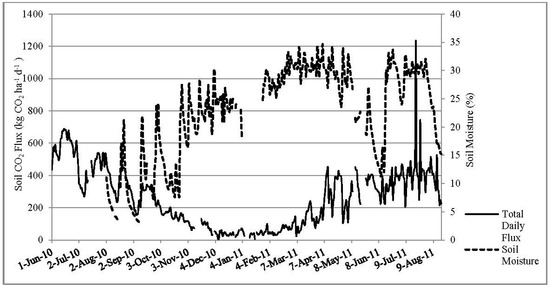
Figure 4.
Variations of daily CO2 flux and soil moisture.
A cubic polynomial regression model showed that soil temperature accounted for 75% and 69% (p < 0.0001) of soil CO2 flux variability for Cover and Bare sites, respectively (Figure 5). The positive relationship between higher flux rates and increases in soil temperature corresponded with previous studies in which increased rates of microbial and plant activity with warmer soil temperatures resulted in increased soil CO2 respiration [1,13,36]. When applied to determine the impact of soil moisture on soil CO2 respiration, the regression model accounted for only 6% of Cover flux variability and 9% for Bare (p < 0.0001). Figure 3 shows the annual CO2 flux as a function of soil moisture. These results were inconsistent with some previous studies that demonstrated a more significant positive correlation between soil moisture and soil CO2 flux [16,17,19,20].
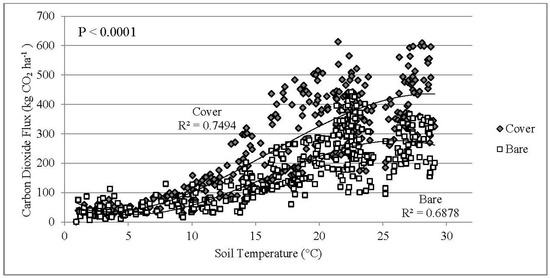
Figure 5.
A cubic polynomial regression analysis of daily CO2 flux relative to daily soil temperature. Data are representative of individual measurements collected throughout the entire study period.
Sainju et al. [20], for instance, showed that irrigation in some croplands increased CO2 flux rates by up to a 50% due to a correlated increase in soil moisture. A notable difference in our study, however, is that the highest average soil moisture (~34%) was observed during Spring but CO2 flux did not follow the soil moisture pattern. (Figure 4). Conversely, the warmer months were characterized by less frequent and less intense precipitation events resulting in a lower average soil moisture content, 21.5% during Summer, and more consistent soil moisture conditions. Figure 6 shows the annual precipitation and soil moisture. In all seasons, soil moisture increased immediately following precipitation events which simultaneously corresponded with episodic CO2 pulse events (Figure 7). Although the average daily soil CO2 flux during Winter was 60 kg CO2 ha−1, precipitation-induced pulses stimulated increases in daily flux rates of up to 178 kg CO2 ha−1.
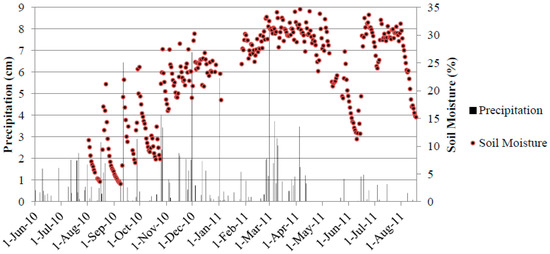
Figure 6.
Annual variations of precipitation and soil moisture.
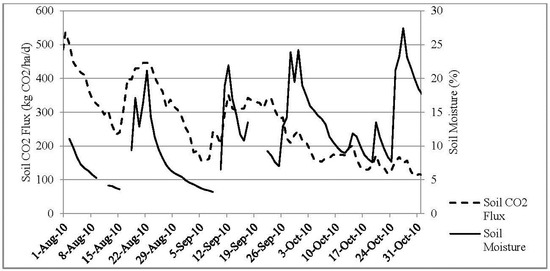
Figure 7.
Sporadic CO2 flux response to soil moisture.
Further, decreased CO2 flux rates were observed at soil moisture contents of 5% or below. These results suggest that while soil moisture is less significantly correlated to soil CO2 respiration than soil temperature in this system, episodic wetting and drying events do influence smaller scale flux rate variations.
Our results indicate that soil temperature is a primary driver of soil CO2 flux rates in switchgrass croplands in East Tennessee. As the interactive effects of soil temperature and moisture influence soil biological activity [35], the lower variability in soil moisture during warmer months may have enhanced heterotophic and autotrophic respiration sensitivity to soil temperature variations during the peak soil CO2 flux seasons (Spring and Summer). Still, the combination of both soil temperature and moisture increased the regression model’s ability to explain flux variance for Cover and Bare sites to 82.7% and 81.5% (p < 0.0001), respectively. This suggests that while soil temperature plays a more significant role in soil respiration in this system, the interaction between soil temperature and moisture should be considered in flux rate models.
4. Conclusions
In this study, the majority (~93%) of the annual soil CO2 efflux was observed during the Spring, Summer and Fall seasons. During the Winter, episodic precipitation events induced pulses of CO2 respiration indicating that significant respiration continues throughout the entire year. The growing season for switchgrass excludes Winter and portions of Spring and Fall suggesting that studies limited to only this time period may underestimate annual CO2 by more than 10%. Soil temperature was the primary driver of soil respiration rates during all seasons except Winter, during which soil moisture was more influential on average daily flux rates. CO2 flux rates at Cover sites were consistently greater than flux rates observed at Bare sites; however, significant soil respiration at Bare sites demonstrates the importance of including bare ground interspaces in soil CO2 flux assessments for switchgrass croplands. The total annual CO2 efflux reported here is greater than has been reported for other perennial grasses and greater than CO2 flux data reported for switchgrass in other regions in the United States. Greater annual CO2 flux results from the wet, warm subtropical-temperate climate of the region. Our results suggest that geographically focused studies, which include the growing and non-growing seasons, are critical to estimations of annual soil CO2-C soil losses needed for the development of more accurate carbon offset values for switchgrass production as a bioenergy crop in Tennessee.
Acknowledgments
This research was supported by funding from the Southeastern Regional Sun Grant Center through a grant provided by the US Department of Transportation, Office of the Secretary, Award No. DTO559-07-G-00050, Oak Ridge National Laboratory, through the US Department of Agriculture (USDA) under the Project titled Bioenergy Production and Carbon Sequestration, TN No. 2010-38419-20903, and through Hatch Project TEN000442.
Author Contributions
Jaehoon Lee, Leah S. Skinner, Donald Tyler conceived and designed the experiments; Leah S. Skinner and Andrew Sherfy performed the experiments; Leah S. Skinner and Jaehoon Lee analyzed the data; Andrew Sherfy and Burton English contributed reagents/materials/analysis tools; Jaehoon Lee, Leah S. Skinner, and Julie McKnight wrote the paper.
Conflicts of Interest
The authors declare no conflict of interest.
References
- Dornbush, M.E.; Raich, J.W. Soil temperature, not aboveground plant productivity, best predicts intra-annual variations of soil respiration in central Iowa grasslands. Ecosystems 2006, 9, 909–920. [Google Scholar] [CrossRef]
- Raich, J.W.; Schlesinger, W.H. The global carbon-dioxide flux in soil respiration and its relationship to vegetation and climate. Tellus B 1992, 44, 81–99. [Google Scholar] [CrossRef]
- McNally, S.; Laughlin, D.C.; Rutledge, S.; Dodd, M.B.; Six, J.; Schipper, L.A. Root carbon inputs under moderately diverse sward and conventional ryegrass-clover pasture: Implications for soil carbon sequestration. Plant Soil 2015, 392, 289–299. [Google Scholar] [CrossRef]
- Nickerson, C.; Ebel, R.; Borchers, A.; Carriazo, F. Major Uses of Land in the United States, 2007; U.S. Department of Agriculture, Economic Research Service: Washington, DC, USA, 2011; Volume 89.
- US EPA. Global Greenhouse Gas Emissions Data. 2004. Available online: http://www.epa.gov/climatechange/ghgemissions/global.html (accessed on 8 August 2013).
- Lemus, R.; Lal, R. Bioenergy crops and carbon sequestration. Crit. Rev. Plant Sci. 2005, 24, 1–21. [Google Scholar] [CrossRef]
- Sartori, F.; Lal, R.; Ebinger, M.H.; Parrish, D.J. Potential soil carbon sequestration and CO2 offset by dedicated energy crops in the USA. Crit. Rev. Plant Sci. 2006, 25, 441–472. [Google Scholar] [CrossRef]
- Parkin, T.B.; Kaspar, T.C. Temperature controls on diurnal carbon dioxide flux: Implications for estimating soil C loss. Soil Sci. Soc. Am. J. 2003, 67, 1763–1772. [Google Scholar] [CrossRef]
- Adler, P.R.; Del Grosso, S.J.; Parton, W.J. Life-cycle assessment of net greenhouse-gas flux for bioenergy cropping systems. Ecol. Appl. 2007, 17, 675–691. [Google Scholar] [CrossRef] [PubMed]
- Smith, F.; Brye, K.R.; Gbur, E.E.; Chen, P.; Korth, K. Long-term Residue Management Effects on Soil Respiration in a Wheat-Soybean Double-Crop System. Soil Sci. 2014, 179, 118–129. [Google Scholar] [CrossRef]
- Frank, A.B.; Berdahl, J.D.; Hanson, J.D.; Liebig, M.A.; Johnson, H.A. Biomass and carbon partitioning in switchgrass. Crop Sci. 2004, 44, 1391–1396. [Google Scholar] [CrossRef]
- Zeri, M.; Anderson-Teixeira, K.; Hickman, G.; Masters, M.; DeLucia, E.; Bernacchi, C.J. Carbon exchange by establishing biofuel crops in Central Illinois. Agric. Ecosyst. Environ. 2011, 144, 319–329. [Google Scholar] [CrossRef]
- Chang, X.; Zhu, X.; Wang, S.; Luo, C.; Zhang, Z.; Duan, J.; Bai, L.; Wang, W. Temperature and Moisture Effects on Soil Respiration in Alpine Grasslands. Soil Sci. 2012, 177, 554–560. [Google Scholar] [CrossRef]
- Wang, X.G.; Zhua, B.; Gao, M.R.; Wang, Y.Q.; Zheng, X.H. Seasonal variations in soil respiration and temperature sensitivity under three land-use types in hilly areas of the Sichuan Basin. Aust. J. Soil Res. 2008, 46, 727–734. [Google Scholar] [CrossRef]
- Bauer, J.; Herbst, J.; Huisman, J.A.; Weihermüller, L.; Vereecken, H. Sensitivity of simulated soil heterotrophic respiration to temperature and moisture reduction functions. Geoderma 2008, 145, 17–27. [Google Scholar] [CrossRef]
- Hernandez-Ramirez, G.; Brouder, S.M.; Smith, D.R.; Van Scoyoc, G.E. Greenhouse gas fluxes in an Eastern corn belt soil: Weather, nitrogen source, and rotation. J. Environ. Qual. 2009, 38, 841–854. [Google Scholar] [CrossRef] [PubMed]
- Lee, D.K.; Doolittle, J.J.; Owens, V.N. Soil carbon dioxide fluxes in established switchgrass land managed for biomass production. Soil Biol. Biochem. 2007, 39, 178–186. [Google Scholar] [CrossRef]
- Lloyd, J.; Taylor, J.A. On the temperature dependence of soil respiration. Funct. Ecol. 1994, 8, 315–323. [Google Scholar] [CrossRef]
- Raich, J.W.; Potter, C.S. Global patterns of carbon-dioxide emissions from soils. Glob. Biogeochem. Cycles 1995, 9, 23–36. [Google Scholar] [CrossRef]
- Sainju, U.M.; Stevens, W.B.; Caesar-TonThat, T.C.; Jabro, J.D. Land use and management practices impact on plant biomass carbon and soil carbon dioxide emission. Soil Sci. Soc. Am. J. 2010, 74, 1613–1622. [Google Scholar] [CrossRef]
- Savage, K.E.; Davidson, E.A. A comparison of manual and automated systems for soil CO2 flux measurements: Trade-offs between spatial and temporal resolution. J. Exp. Biol. 2003, 54, 891–899. [Google Scholar] [CrossRef]
- Miao, Y.; Song, C.; Wang, X.; Sun, X.; Meng, H.; Sun, L. Greenhouse gas emissions from different wetlands during the snow-covered season in Northeast China. Atmos. Environ. 2012, 62, 328–335. [Google Scholar] [CrossRef]
- Qi, Y.; Xu, M. Separating the effects of moisture and temperature on soil CO2 efflux in a coniferous forest in the Sierra Nevada mountains. Plant Soil 2001, 237, 15–23. [Google Scholar] [CrossRef]
- Tufekcioglu, A.; Raich, J.W.; Isenhart, T.M.; Schultz, R.C. Soil respiration within riparian buffers and adjacent crop fields. Plant Soil 2001, 229, 117–124. [Google Scholar] [CrossRef]
- Sparks, D.L. Methods of Soil Analysis Part 3—Chemical Methods SOIL Science Society of America; American Society of Agronomy: Madison, WI, USA, 1996. [Google Scholar]
- Healy, R.W.; Striegl, R.G.; Russell, T.F.; Hutchinson, G.L.; Livingston, G.P. Numerical evaluation of static-chamber measurements of soil-atmosphere gas exchange: Identification of physical processes. Soil Sci. Soc. Am. J. 1996, 60, 740–747. [Google Scholar] [CrossRef]
- Riedell, W.E.; Osborne, S.L.; Schumacher, T.E.; Pikul, J.L., Jr. Grassland canopy management and native trallgrass species composition effects on C and N in grass canopies and soil. Plant Soil 2010, 338, 51–61. [Google Scholar] [CrossRef]
- SAS Institute. SAS/STAT 9.1 User’s Guide the Reg Procedure: (Book Excerpt); SAS Institute: Cary, NC, USA, 2008 November 24. [Google Scholar]
- Maljanen, M.; Martikainen, P.J.; Walden, J.; Silvola, J. CO2 exchange in an organic field growing barley or grass in eastern Finland. Glob. Chang. Biol. 2001, 7, 679–692. [Google Scholar] [CrossRef]
- Zhang, H.; Zhou, X.; Lu, F.; Pang, J.; Feng, Z.; Liu, W.; Ouyang, Z.; Wang, X. Seasonal dynamics of soil CO2 efflux in a conventional tilled wheat field of the Loess Plateau, China. Ecol. Res. 2011, 26, 735–743. [Google Scholar] [CrossRef]
- Blazier, M.A.; Clason, T.R.; Vance, E.D.; Leggett, Z.; Sucre, E.B. Loblolly pine age and density affects switchgrass growth and soil carbon in an agroforestry system. For. Sci. 2012, 58, 485–496. [Google Scholar] [CrossRef]
- Garten, C.T.; Brice, D.J.; Castro, H.F.; Graham, R.L.; Mayes, M.A.; Phillips, J.R.; Post, W.M.; Schadt, C.W.; Wullschleger, S.D.; Tyler, D.D.; et al. Response of “Alamo” switchgrass tissue chemistry and biomass to nitrogen fertilization in West Tennessee, USA. Agric. Ecosyst. Environ. 2011, 140, 289–297. [Google Scholar] [CrossRef]
- Song, W.; Chen, S.; Wu, B.; Zhu, Y.; Zhou, Y.; Li, Y.; Caro, Y.; Lu, Q.; Lin, G. Vegetation cover and rain timing co-regulate the responses of soil CO2 efflux to rain increase in an arid desert ecosystem. Soil Biol. Biogeochem. 2012, 49, 114–123. [Google Scholar] [CrossRef]
- Thomson, B.C.; Ostle, N.; McNamara, N.; Bailey, M.J.; Whiteley, A.S.; Griffiths, R.I. Vegetation affects the relative abundances of dominant soil bacterial taxa and soil respiration rates in an upland grassland soil. Microb. Ecol. 2010, 59, 335–343. [Google Scholar] [CrossRef] [PubMed]
- Grahammer, K.; Jawson, M.D.; Skopp, J. Day and night soil respiration from a grassland. Soil Biol. Biochem. 1991, 23, 77–81. [Google Scholar] [CrossRef]
- Trevors, J.T. Effect of temperature on selected microbial activities in aerobic and anaerobically incubated sediment. Hydrobiologia 1985, 126, 189–192. [Google Scholar] [CrossRef]
© 2018 by the authors. Licensee MDPI, Basel, Switzerland. This article is an open access article distributed under the terms and conditions of the Creative Commons Attribution (CC BY) license (http://creativecommons.org/licenses/by/4.0/).