1. Introduction
In this presentation, we reanalyze the observations of the X-ray surface emission of the Vela pulsar (PSR B0833-45) and evaluate its effective surface temperature
(redshifted for a distant observer), mass
M, radius
R and the internal neutrino cooling rate using the cooling theory of neutron stars (NSs) [
1].
The Vela is a famous middle-aged pulsar whose emission has been observed at different wavelengths. Its X-ray emission has been observed with a number of space observatories (most importantly, with
Chandra and
XMM-Newton). We take its characteristic age as
kyr, although it is ambiguous due to frequent glitches (e.g., Lyne [
2] obtained
kyr); its real age is hard to derive due to irregular shape of the Vela supernova remnant [
3]. The magnetic field at the magnetic poles is
G [
4] (
http://www.atnf.csiro.au/people/pulsar/psrcat/), and the parallax distance to the pulsar is
pc [
5]. The surface temperature has been estimated as
MK (using the
nsa atmosphere model [
6] with a power-law non-thermal component and assuming
and
km [
7,
8,
9]).
By inferring
from observations and using the NS cooling theory, one can constrain most important parameters of the star including fundamental properties of superdense matter in its interior. We will use the cooling theory of NSs with nucleon cores and not too strong magnetic fields (to avoid dramatic effects of the
B-fields on the NS structure and evolution, such as considered in [
10,
11,
12]).
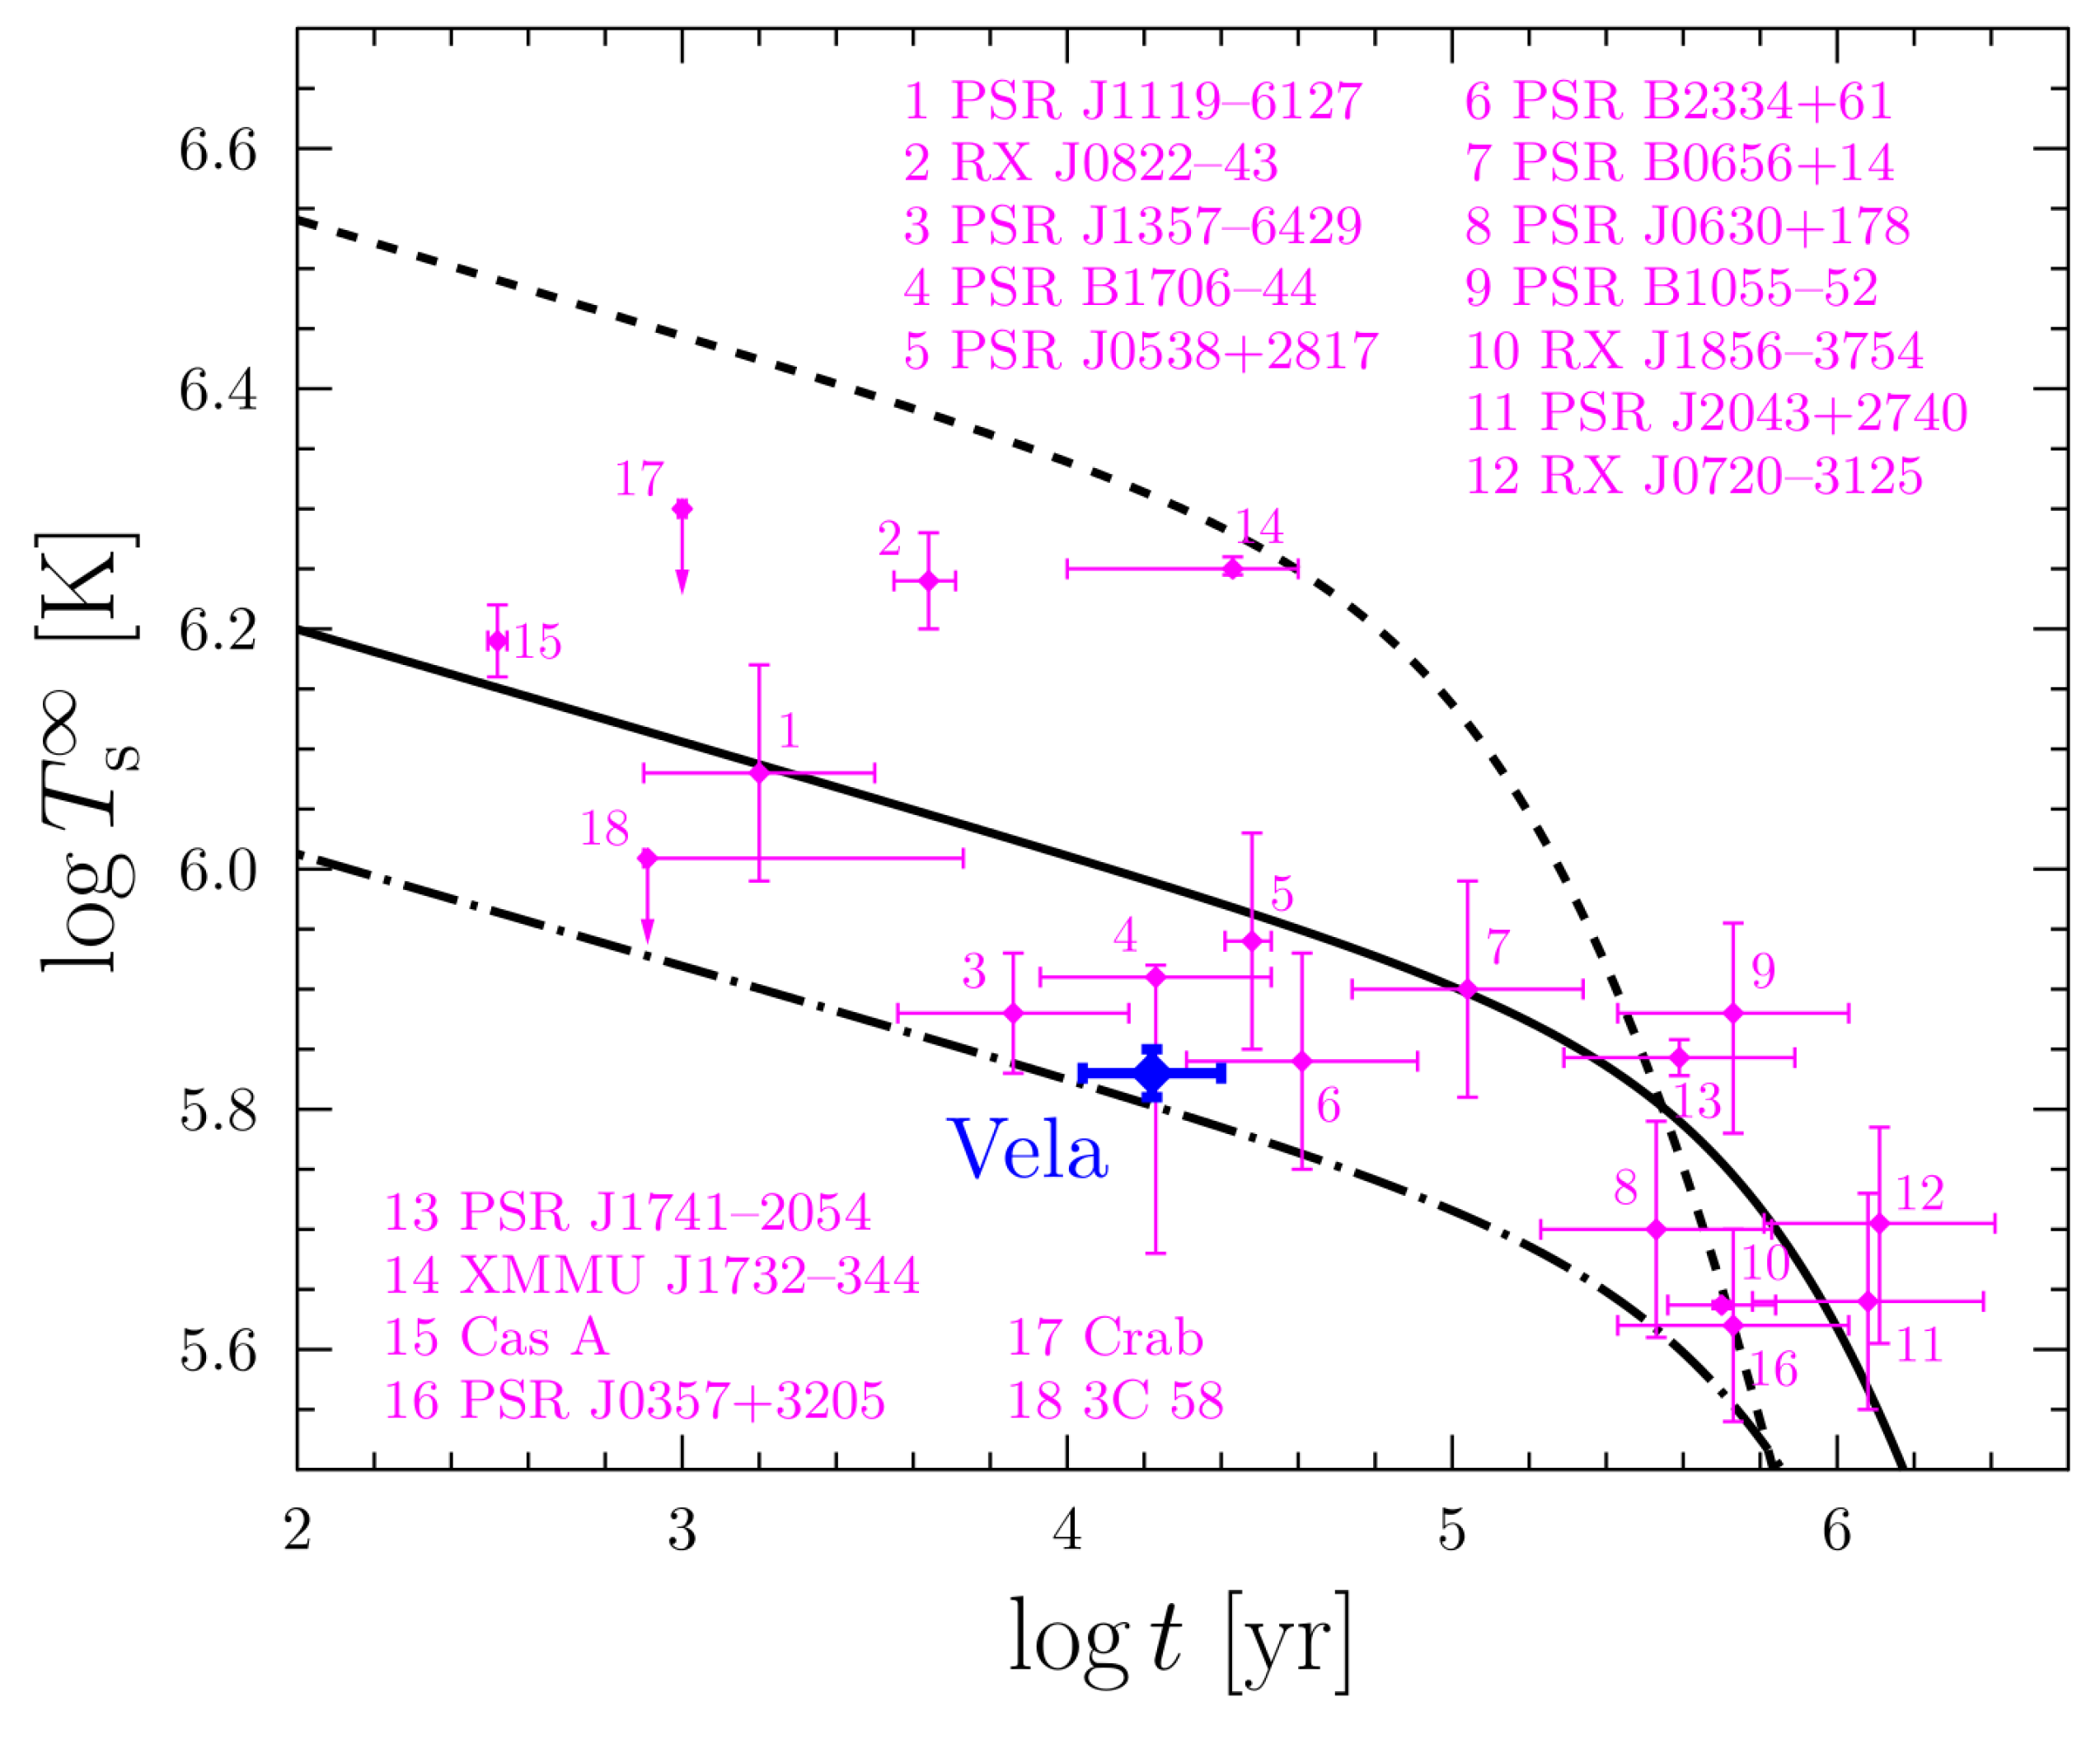
Figure 1 shows some theoretical cooling curves (
versus age
t) compared with the observations of such (not highly magnetized) NSs. The curves are calculated using the approximate analytic expressions [
13] for a
star. The stars of age
10–100 yr are thought to be thermally relaxed inside with a noticeable temperature gradient remaining only in a thin surface layer called the heat blanketing envelope (e.g., [
14,
15,
16]). The stars with
yr (including the Vela pulsar) are believed to be cooling predominantly via the neutrino emission from their superdense cores. Older stars cool mostly through their thermal surface emission. The central black solid line shows the standard cooling [
17] (of non-superfluid NSs with the modified Urca neutrino emission in the core and iron heat blanketing envelope). This curve is almost unaffected by the equation of state (EOS) of NS matter and NS mass (e.g., [
18]). The dot-and-dashed curve is the same, but the neutrino emission is enhanced by a factor of 100 (e.g., by neutrinos produced via triplet-state Cooper pairing of neutrons in a superfluid core, see
Section 3). The dashed curve is for the NSs with the neutrino emission reduced by a factor of 100 (for instance, by strong proton superfluidity in the core) and the envelope made of carbon (light elements in the heat blanket reduce its thermal insulation). According to
Figure 1, the Vela’s neutrino cooling is one of the fastest among the observed NSs, making the Vela especially interesting.
This special status of the Vela pulsar has been noticed previously (e.g., [
20]). The Vela’s spectrum has been analyzed assuming
and
km (e.g., [
7]). The internal neutrino cooling rate has also been studied, but again under the same assumptions. Here, we present our preliminary results obtained without fixing
M and
R. A more extensive analysis will be published elsewhere.
2. Spectral Analysis of the Vela Pulsar
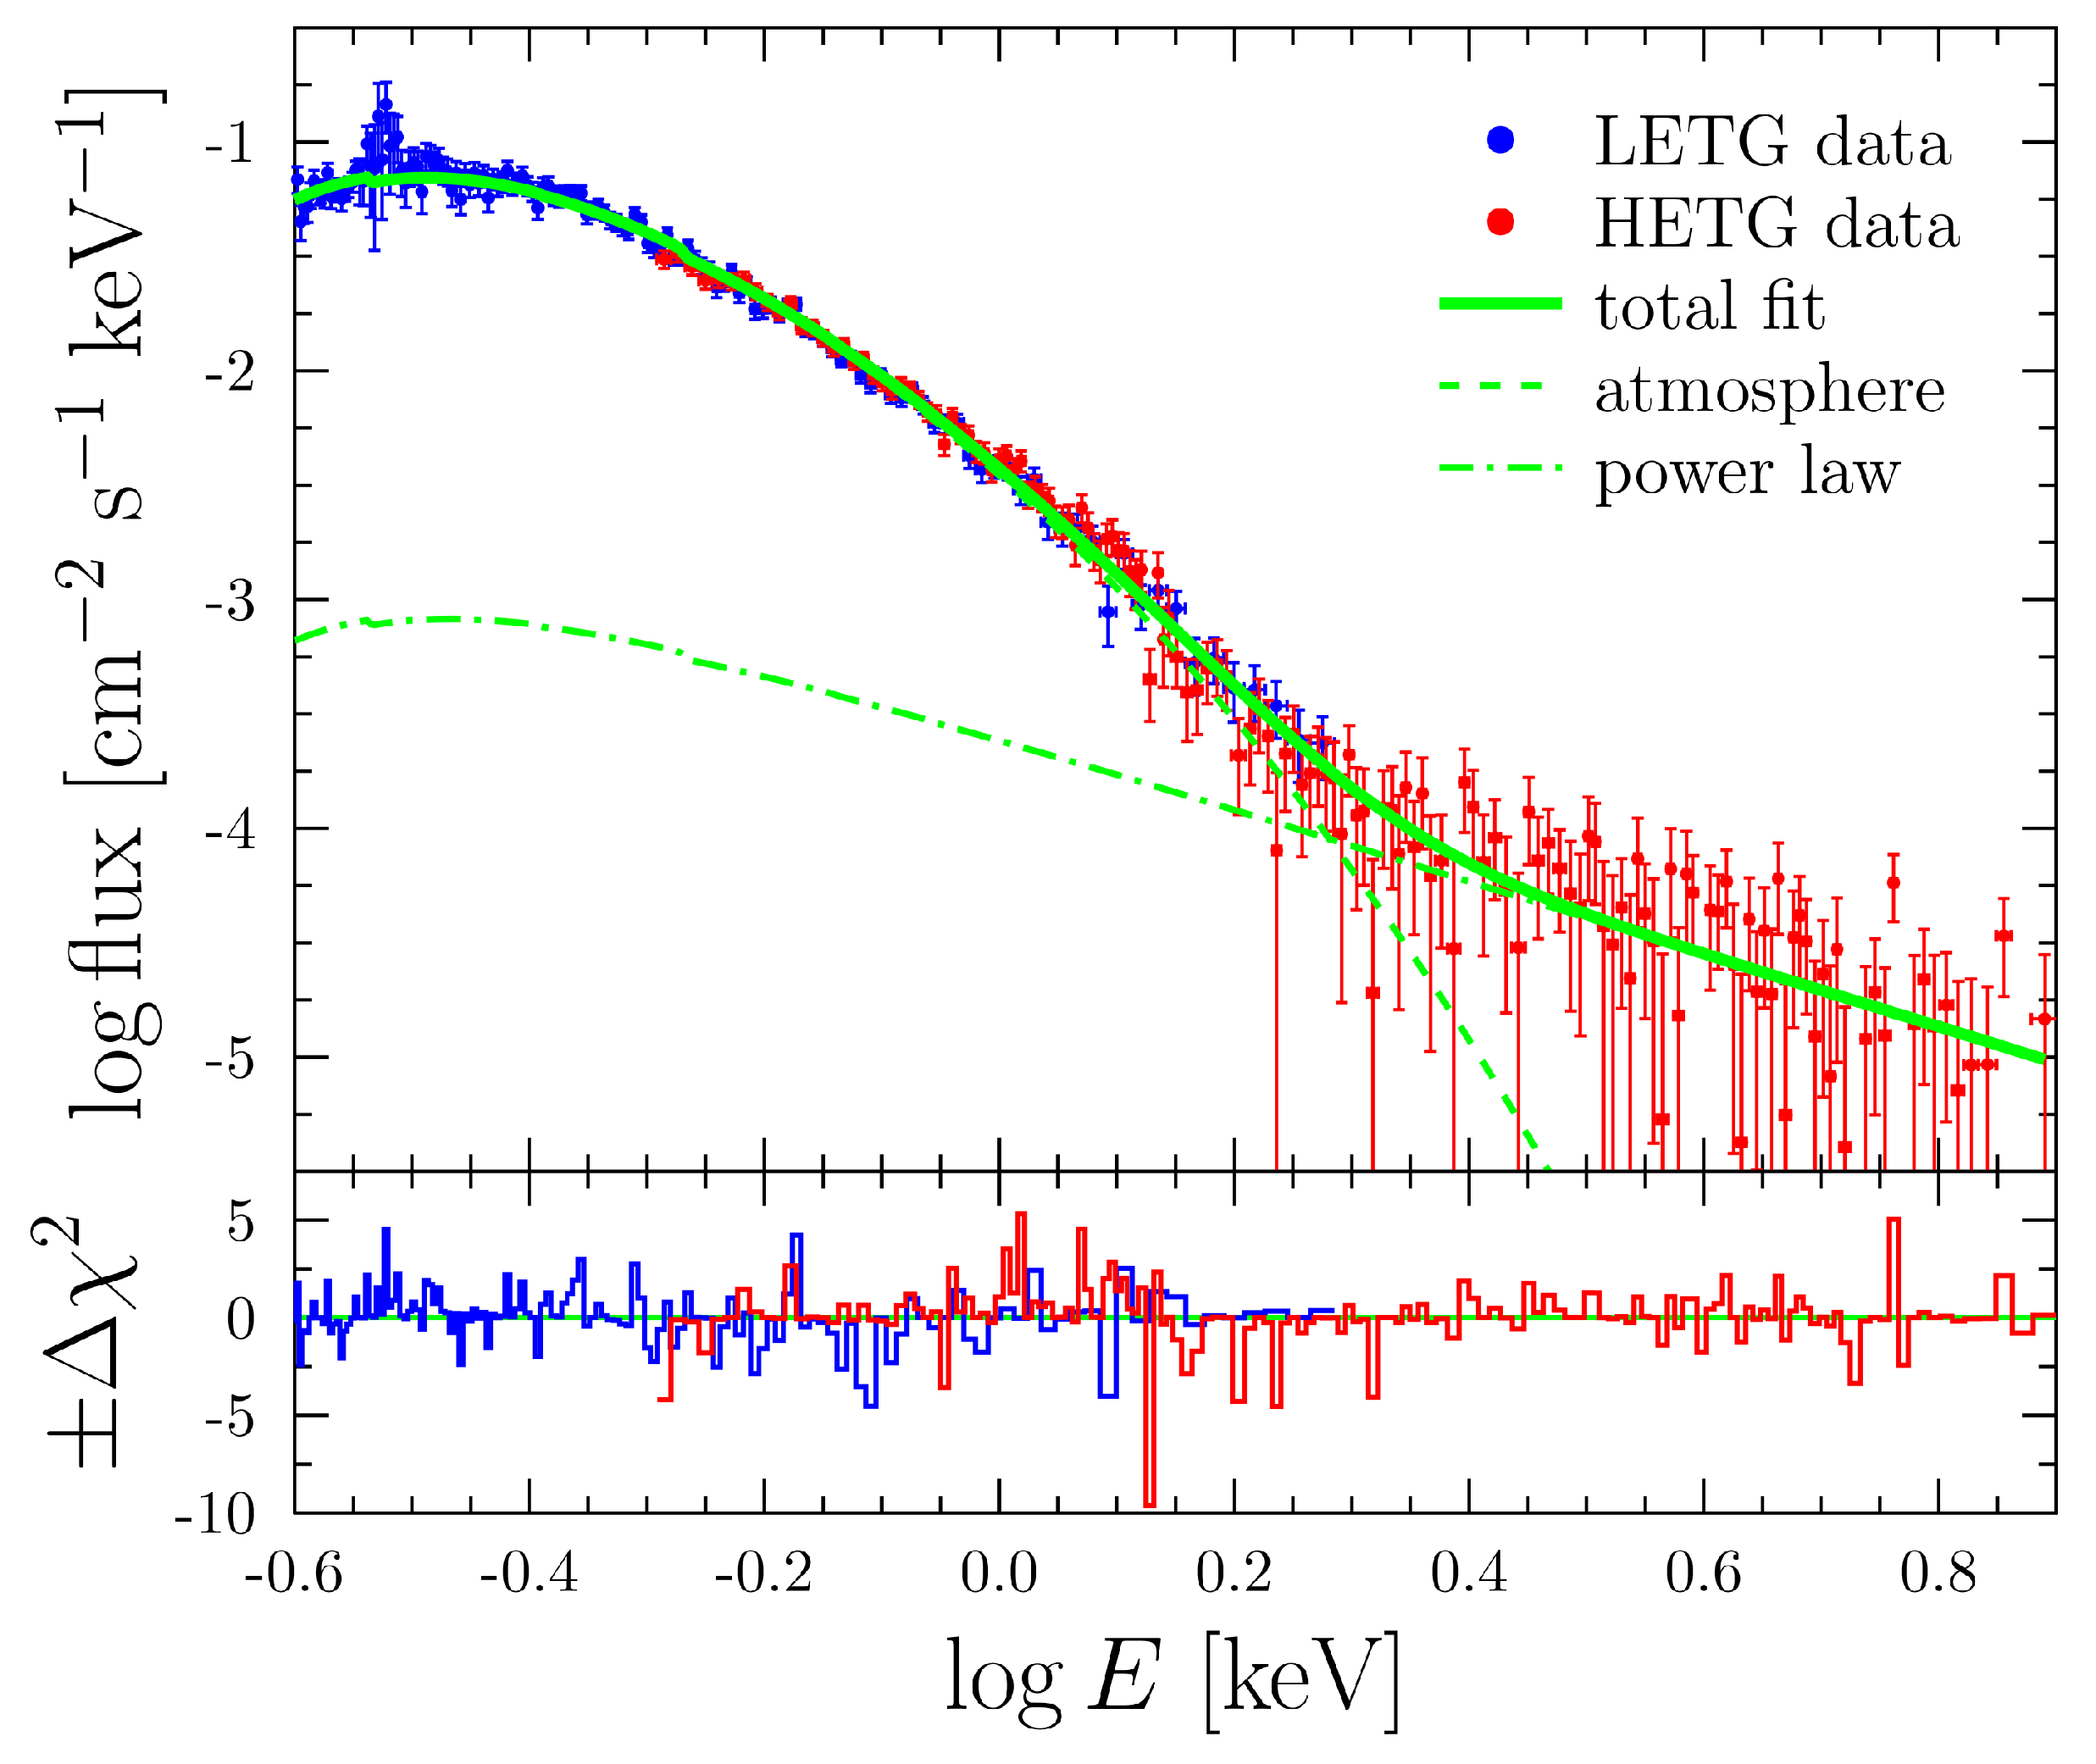
There are a lot of X-ray observations of the Vela pulsar, but here we use only those performed by the
Chandra space observatory in the two modes: HRC-S/LETG (ObsID 127 and 1852, taken on 28.01.00 and 12.01.01, respectively) and ACIS-S/HETG/CC (ObsID 131, taken on 11-12.10.99) (blue and red dots in
Figure 2, respectively). The ObsID 127 and 131 observations were used in [
7]; the latter one has never been used before. These unique data sets were obtained using the Low-Energy and High-Energy Transmission Gratings (LETG and HETG correspondingly). Other
Chandra observations of the Vela pulsar are either oriented for timing and spatial analyses or strongly pile-uped, which make them inappropriate for our purposes. The Vela’s spectrum was also observed with the
XMM-Newton observatory [
8,
9]. We intend to analyze these data in the future.
The spectrum is extracted and analyzed with the
ciao [
21] and
sherpa [
22] packages. The source and background extractions are performed as described in
Section 2 of [
7]. To avoid the contamination by the pulsar wind nebula, for the ACIS-S/HETG/CC observations, we use only the zero-order image for the spectrum extraction. The spectra are grouped to ensure at least 25 counts per energy bin. We fit it, by a combined model, which includes the thermal component described by the
nsmax [
23] model 1230 (magnetic hydrogen atmosphere with the field strength at the pole
G), and the non-thermal component described as a power-law tail. The absorption has been accounted for by the
tbabs model.
A note should be made on the magnetic field strength used for the spectral analysis. The real Vela’s surface field may differ from the standard spindown estimate
G within a factor of few, e.g., [
24]. While analyzing the Vela pulsar, it would better to test several values of the field. Here take the surface field
G; in the forthcoming paper, we will consider other models.
The employed spectral model has six physical parameters: the local (non-redshifted) surface temperature with being the redshift factor, the normalization , the power law index and its normalization , and the equivalent hydrogen column density along the line of sight. We fit the observed spectrum for a set of fixed z and N (the z step is and the N step is ), which correspond to and km at fixed pc. The parameters , , and are set free. The criterion is used as a fit goodness.
The green line in
Figure 2 shows an example of our fit at
and
km. It results in
MK,
, and
and
are close to the values obtained in [
7] at
km. All other values of
M and
R lead to almost the same
,
, and
, but
varies stronger. In this way, we derive the
map from the observed spectrum; it is demonstrated in
Figure 3a. Everywhere on this map, the
fit error is about
MK.
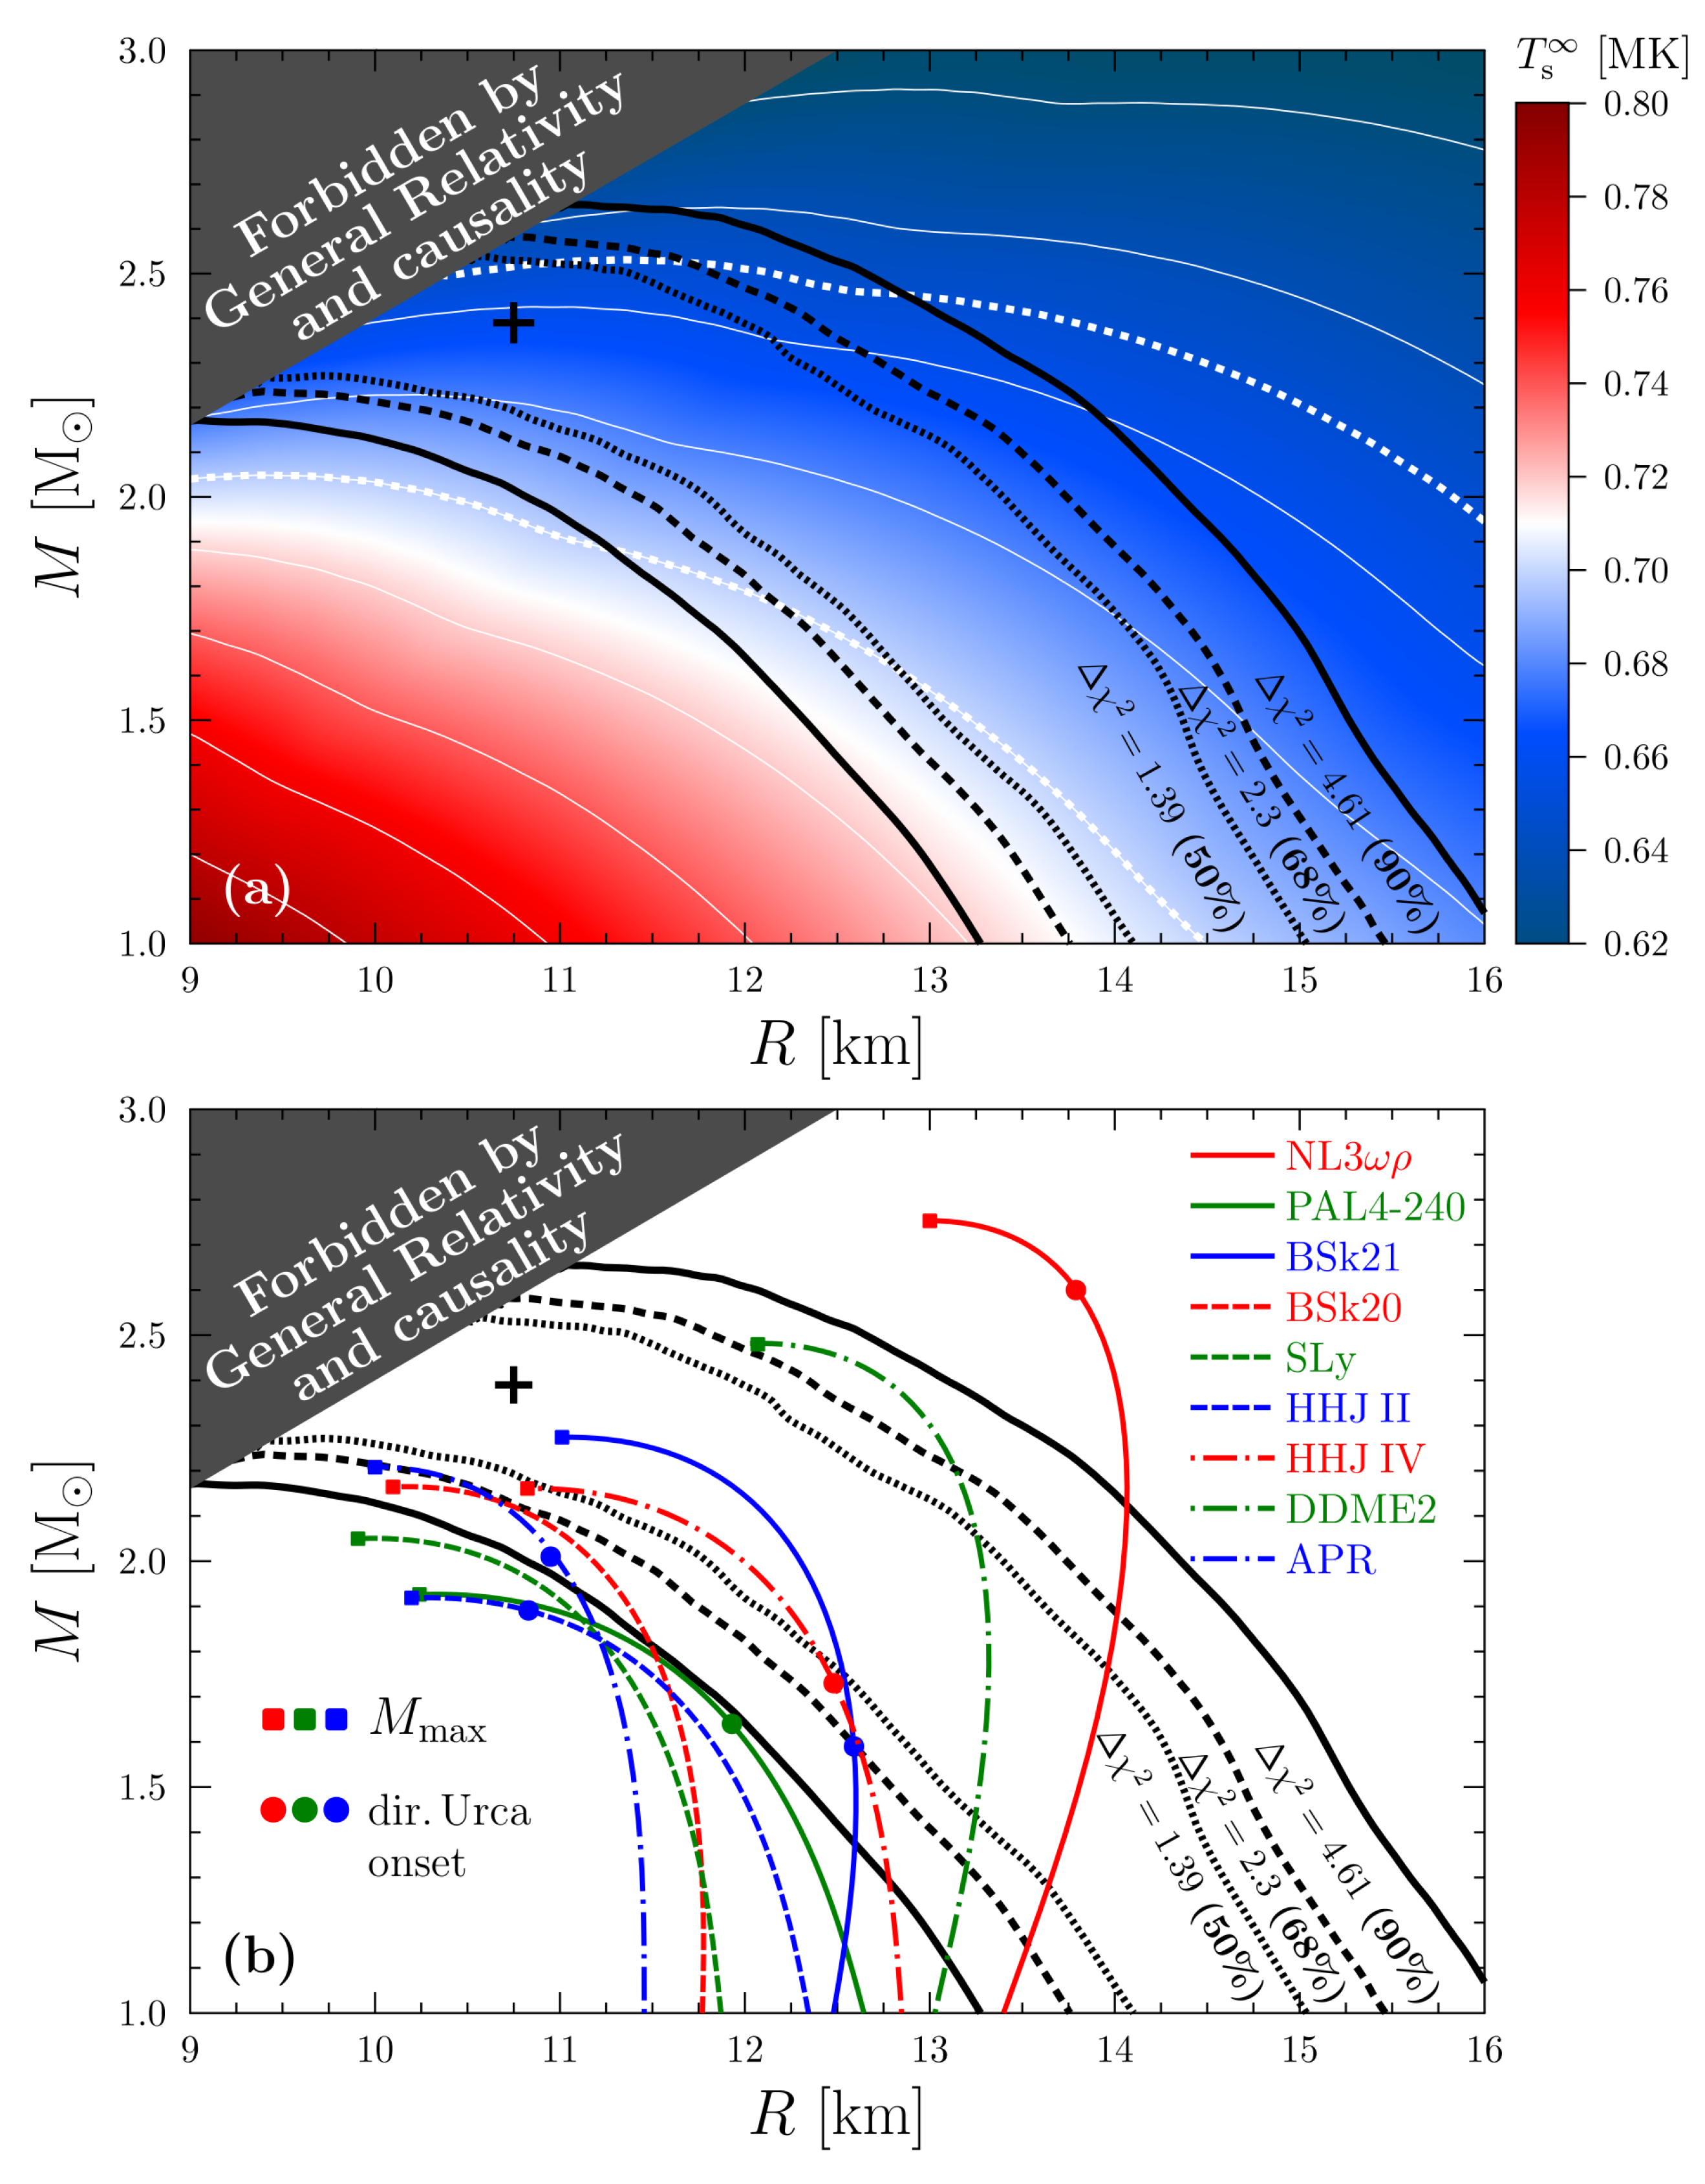
Figure 3a shows the best-fit values of
for fixed
M and
R; the minimum
depends on
M and
R. The confidence levels for the Vela’s
M and
R are plotted in
Figure 3a,b by black lines. The best fit (the ‘plus’ signs in
Figure 3)
and
km at
level (the upper limit for mass and the lower one for radius are obtained from the causality restriction; see the grey-shaded areas in
Figure 3) with reduced
for 294 degrees of freedom. The confidence region for the Vela’s temperature over the
plane (the area within the thick white dotted contours in
Figure 3) is
MK at the
level. Note that it is close to the results of previous spectral analyses [
7,
8,
9] including or excluding the
XMM-Newton data. However, at
and
km, we obtain
MK, which significantly differs from the temperature obtained in the cited papers for the same
M and
R. This is because the authors of [
7,
8,
9] treated the distance
d as a free parameter; their best-fit
d significantly differ from the well-measured parallax distance [
5] that we use. In other words, the widely used
MK does not favors NS models with
and
km.
Figure 3b compares the Vela’s
confidence levels and a set of
curves for several realistic EOS models. The NL3
and DDME2 models belong to the class of relativistic mean field EOSs (described in [
25] and in references therein). The APR model is constructed using the variational method [
26]. The class of EOSs based on Skyrme-type energy-density functionals is presented by the BSk21, BSk20 [
27] and SLy [
28] models. The PAL4-240 (also known as PAPAL [
29]), HHJII (also known as APRII [
30]) and HHJIV [
31] EOSs constitute the class of semi-analytical models. Some of these EOSs (PAL4-240, SLy, HHJII, and APR) are not consistent with the restrictions on the Vela’s mass and radius given by the 90% confidence level. Other EOSs present many possibilities to be consistent with the Vela’s data. This pulsar can be a low-mass NS but with large radius ∼13 km. Alternatively, it can be a massive (>1.5
) NS with the radius ∼11–12 km that is typical for other NSs with
M and
R constrained by atmospheric fits [
32,
33]. It can be even a massive NS with large
R that is typical for relativistic mean field EOSs (e.g., [
25]).
3. Vela’s Neutrino Cooling Rate
Let us interpret the Vela’s observations using the NS cooling theory. We will employ the method similar to that discussed in [
17,
20,
34] and in references therein. It is well described in the literature; we just outline the main points. Let us assume some values of
M,
R and
of the star, the chemical composition of the heat blanketing (thermally insulating) envelope, and specify the surface magnetic field
G. Using the theory of such envelopes, we can determine the internal temperature of the star. Since the Vela pulsar is at the neutrino cooling stage, its cooling is mostly regulated by the neutrino emission from its core. More accurately, it is regulated by the neutrino cooling function
ℓ which is the ratio of the neutrino luminosity to the heat capacity of the core (the contribution of the stellar crust being unimportant). This cooling function strongly depends on the internal stellar temperature. On the one hand,
ℓ can be derived if internal temperature and age are determined from observations. On the other hand, it is affected by the NS EOS,
M and
R, as well as by superfluidity of protons and neutrons in the core. Testing different models of
ℓ, one can limit those which are reasonably consistent with observations. All necessary formulae and caveats could be found in [
17],
Section 4.
The basic model is the standard model of a non-superfluid star cooling via the neutrino emission in the modified Urca process (the modified Urca neutrino emissivity is taken from the classical paper [
35]; similar emissivity in the medium-modified approach (e.g., [
36]) can be higher; see below). In this standard case, the cooling function
can be well approximated by analytic expressions valid in a wide range of
M and
R for many different EOSs in nucleon cores (e.g., [
20]). The cooling curves of such stars,
, are almost independent of
M and EOS. This cooling scenario is definitely inconsistent with the observations of the Vela pulsar (
Figure 1), which cools faster. Following the method we employ, the real cooling function at the Vela’s current cooling stage is approximated as
where
is a constant at the current stage. The method allows one to find
in such a way that the theoretical
becomes equal to the value inferred from observations. Thus determined,
contains important information on the NS cooling rate. According to the theory,
can be much larger or much lower than the standard value
(which would mean a faster or slower neutrino cooling, respectively). The Vela’s observations imply
, but the specific value depends noticeably on
M,
R, and the chemical composition of the heat blanket.
For instance, we can employ the minimal cooling theory [
1,
30]. It takes into account possible superfluidity of neutrons and protons (via singlet-state and triplet-state pairings, respectively) in NS cores but neglects the very powerful direct Urca process of neutrino cooling (it should be either forbidden by a given EOS or suppressed by superfluidity). A mild neutron superfluidity initiates a specific neutrino cooling due to Cooper pairing of neutrons; it can enhance the cooling factor up to
30–100 (depending mainly on neutron superfluidity models that are highly uncertain). In addition, the neutrino cooling rate can be enhanced by the in-medium effects in superdense matter (e.g., [
36,
37]), increasing
up to a factor of 300–1000 (see, e.g., figure 4 in [
36]).
Another opportunity to rise
is to allow the direct Urca process to actually operate in the NS core. This can increase
up to 5–7 orders of magnitude [
18].
Let us try to constrain
for the Vela pulsar by varying
M,
R, and the composition of the heat blanketing envelope. We will use the model of the magnetic heat blankets [
14] with
G at the NS pole, which contain the accreted matter (of light elements) just beneath the NS atmosphere and the iron matter near the heat blanket bottom. The chemical composition is specified by the mass
of the accreted matter. The maximum value
corresponds to the fully accreted heat blanket. At formally higher
, the accreted matter at the bottom of the heat blanket would quickly transform into heavier elements via pycnonuclear reactions and beta captures. The value
refers to the fully iron (non-accreted) heat blanket.
Assuming the non-accreted heat blanket, we obtain the
relation shown in
Figure 4;
varies strongly inside the confidence contours of the Vela’s
M and
R (
Figure 3). Taking the optimistic estimates provided by the minimal cooling paradigm, we should exclude a large piece of the
confidence area, which does not satisfy the condition
30–40 (in the log-scale ≲1.5–1.6). This would lead to the stringent constraints on
and
km for the Vela pulsar. Adopting the less stringent approach to the maximal cooling rate within the minimal cooling paradigm,
(
), essentially increases the allowable
area adding the possibility that the Vela pulsar has a low mass. In principle, we can consider even
, or (combining medium-modified approach with the minimal cooling paradigm) larger ∼300–1000, or (by opening the direct Urca process) much higher
. Then, we obtain that
(cooling restrictions) cannot constrain
M and
R at all.
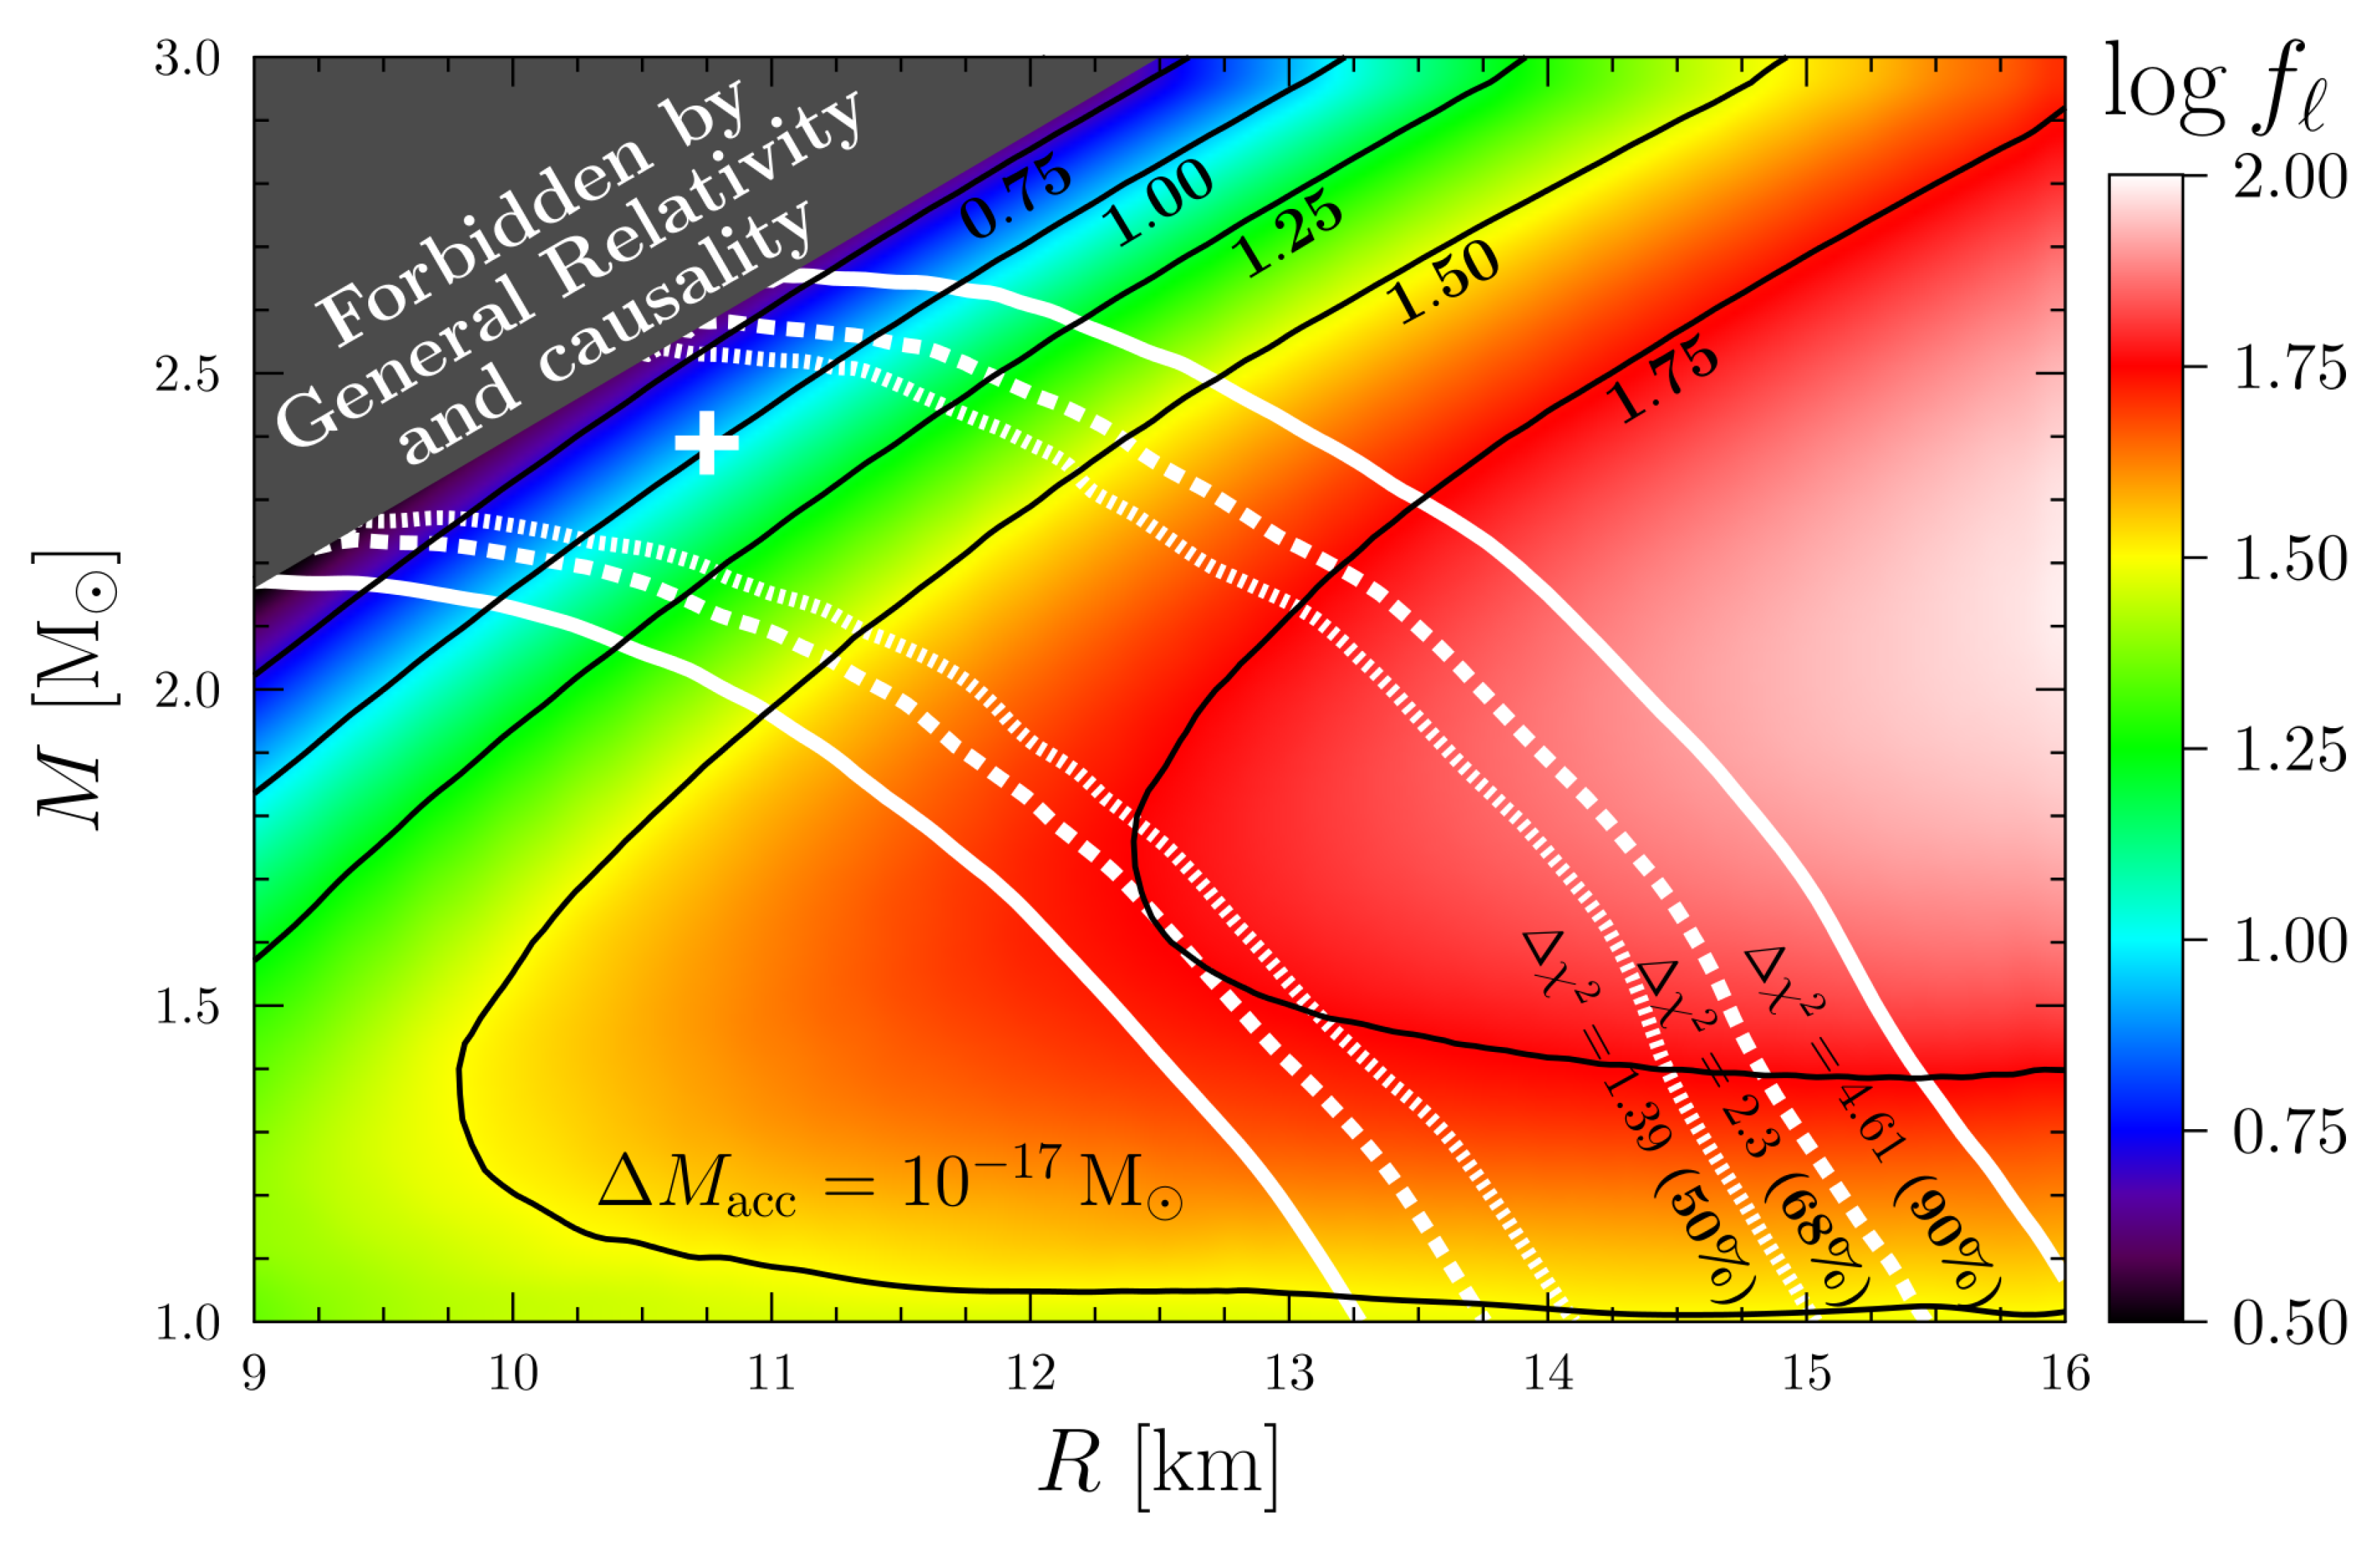
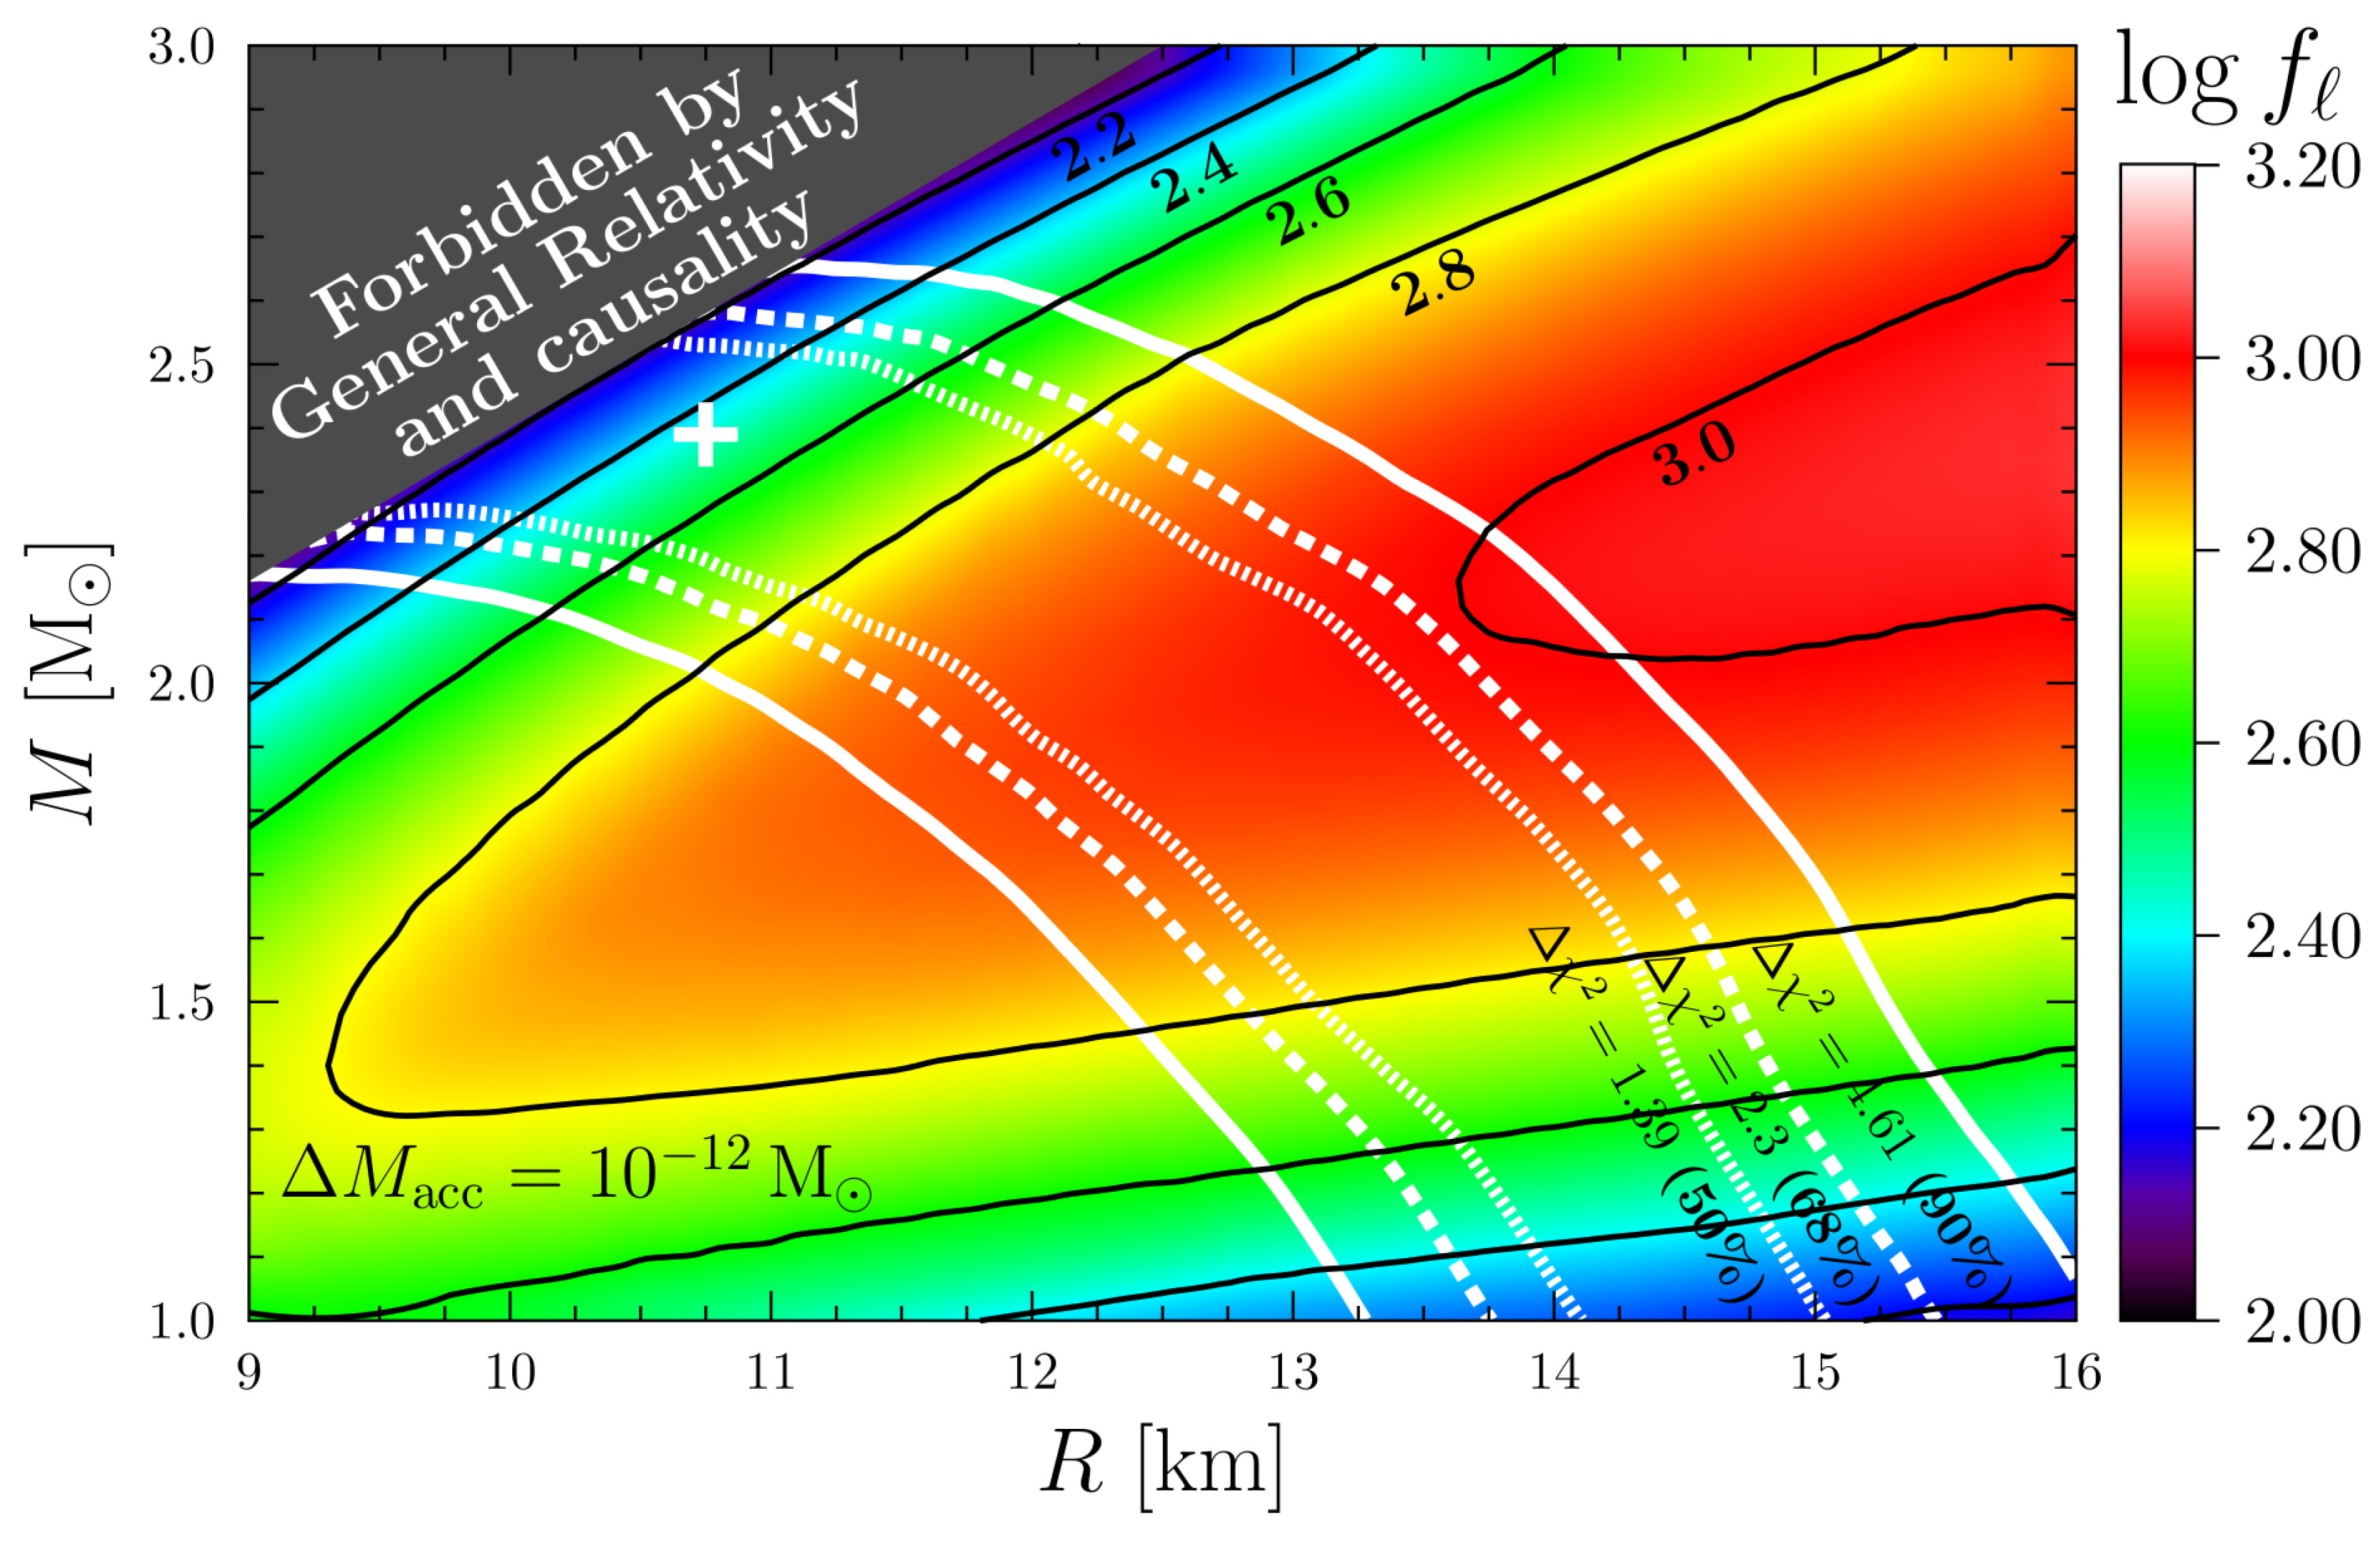
The presence of the accreted matter in the NS envelope only enlarges
and changes the cooling restrictions. This is illustrated by
Figure 5, where we plot the
map for a moderately accreted crust,
. The standard minimal cooling paradigm seems to be helpless for explaining this case. The medium-modified version (
= 2.5–3) can work out but high- or low-massive stars are preferable. Further increase of
makes the data inconsistent even with the medium-modified approach to the NS cooling.
Therefore, our analysis confirms that the Vela’s cooling rate is really higher than the standard one. In the frame of the minimal cooling paradigm, the Vela’s heat blanket cannot contain a large fraction of accreted matter. These conclusions are consistent with the earlier results [
20] obtained from a more simplified analysis.
4. Conclusions
We have analyzed the X-ray spectrum of the Vela pulsar using the data of the
Chandra observatory. We have derived the confidence regions for mass and radius of the pulsar (see
Figure 3) and its surface temperature
MK. This temperature is consistent with the previous results [
7,
8,
9]. Forbidding direct Urca process in the Vela’s core, we obtain the cooling factor
, Equation (
1), as a function of possible Vela’s
M and
R under different assumptions on the heat blanket composition (
Figure 4 and
Figure 5). Then, we compare the derived
maps with possible theoretical restrictions on the cooling factor predicted by different scenarios of NS cooling. The main conclusion is that the Vela’s cooling can be compatible with the minimal cooling paradigm. If so, the star has either rather large or rather low mass and its heat blanketing envelope is composed of non-accreted or partially accreted matter. Otherwise, the star has the neutrino cooling rate that is higher than the rate provided by the minimal cooling paradigm and the heat blanket can be non-accreted or moderately accreted.
In any case, our results are preliminary and can be elaborated further. First, it would be good to include the
XMM-Newton data. Second, we have used the hydrogen atmosphere model, but the Vela’s atmosphere can contain heavier elements. Third, the employed
nsmax atmosphere model assumes that the magnetic field in the atmosphere is pure dipole, whereas the real field may have higher multipoles. In addition, we have taken only one value of the atmospheric magnetic field, whereas pulsar field estimates are accurate within a factor of few, and a rigorous spectral analysis would require testing several field values. Fourth, we perform the phase-averaged spectral analysis, while the Vela pulsar emission has a pulsed fraction about
, e.g., [
9]. The atmosphere model we use neglects polar caps (although they may be important; e.g., [
38]). This disadvantage may slightly overestimate the surface temperature, and, consequently, slightly underestimate the neutrino cooling rate. Fifth, we artificially neglect the enhanced cooling by the direct Urca process and by possible appearance of hyperons and other exotic phases of superdense matter in the NS core. We have also not studied the effects of possible deviations of chemical composition from that adopted in the employed model [
14] of the heat blanketing envelope. All these effects are certainly beyond the scope of the present paper.


