Article

From Wind to Smoke: A Unified WebGIS Platform for Wildfire Simulation and Visualization

by
Saray Martínez-Lastras
1,
José Manuel Iglesias
2,
David Cifuentes-Jimenez
1,
María Isabel Asensio
2,* and
Diego González-Aguilera
1
1
Department of Cartographic and Terrain Engineering, Higher Polytechnic School of Ávila, Universidad de Salamanca, Avda. de los Hornos Caleros, 50, 05003 Ávila, Spain
2
Department of Applied Mathematics, Science Faculty, Universidad de Salamanca, Casas del Parque, 2, 37008 Salamanca, Spain
*
Author to whom correspondence should be addressed.
Fire 2025, 8(9), 366; https://doi.org/10.3390/fire8090366
Submission received: 8 August 2025 / Revised: 9 September 2025 / Accepted: 14 September 2025 / Published: 17 September 2025

Abstract

A unified WebGIS platform for wildfire simulation and visualization is presented, integrating three coupled physical models: HDWind for wind field computation, PhyFire for wildfire spread, and PhyNX for smoke plume dispersion. The system includes preprocessing and postprocessing scripts that enable the efficient integration of meteorological and cartographic data and support the visualization of outputs such as burned areas, wind and smoke fields, and emission estimates. The platform is deployed through a WebGIS interface that supports both decoupled and coupled simulations, providing operational flexibility and reducing computational demands when needed. A real wildfire scenario is simulated to demonstrate system capabilities. The case study highlights the platform’s applicability in operational contexts, reinforcing its potential to evolve into an accessible and user-oriented environmental decision support system for wildfire management.

Graphical Abstract

1. Introduction

Wildfires have become a growing global crisis, causing significant economic losses, severe ecosystem degradation, and adverse effects on human health [1,2]. Over the last decade, the burned area, the fire season length, and the fire severity have increased in multiple regions [3,4]. According to the Food and Agriculture Organization of the United Nations [5], wildfires affect approximately 340 million to 370 million hectares of land worldwide each year. In Europe alone, satellite-based estimates from 2023 indicate that 804,770 hectares were burned [6]. In the case of Spain, the average annual burned area between 2014 and 2023 was approximately 92,000 hectares, with a peak of 254,980 hectares in 2022 by multiple large-scale wildfires [7]. The 2025 summer season has been exceptionally devastating, with preliminary estimates indicating burned areas that far exceed previous records. The European Commission’s Copernicus Forest Fire Information System (EFFIS) estimates that 406,100 hectares had been burned in Spain by the end of August 2025.
Moreover, wildfires are a significant source of greenhouse gas emissions, affecting air quality even thousands of kilometers away [8,9]. Wildfires contribute significantly to the global carbon cycle, releasing approximately 2 gigatons of carbon into the atmosphere each year through direct emissions [10]. At a regional level, European wildfires emitted approximately 419.24 million tonnes of C O 2 in 2023 [11]. In particular, Spain contributed approximately 11.13 million tons of C O 2 emissions in 2022 [12].
Understanding and forecasting the complex processes of wildfire spread and smoke plume dispersion are essential for forest fire managers, particularly in making prevention and preparedness decisions [13,14,15]. In both cases, accurate simulations rely on numerous variables, including orography [16], burned area, burning areas [17], fuel consumed [18], heat release rate [19], smoke plume [20], and rate of spread (ROS) [21], among others. However, wind has a higher-order impact on the spread and dispersion of both wildfire and smoke [22,23,24].
Although the use of mathematical models to describe fire spread is not new [25,26,27], advances in computational power, communication technologies, and remote sensing have significantly enhanced the efficiency and applicability of wildfire modeling [28,29].
There are currently a wide range of mathematical approaches to and implementations of wildfire models and simulators applicable to forecasting wildfire spread, each based on different modeling approaches and designed to serve various operational or research objectives [30,31]. According to Sullivan [32,33], these models can be grouped into different categories that range from purely physical to purely empirical approaches, encompassing various intermediate forms. Physical models aim to represent the fundamental physics and chemistry of fire propagation; quasi-physical models simplify this by focusing primarily on the physical processes; empirical models rely entirely on statistical correlations derived from observational data; and quasi-empirical models incorporate a simplified physical framework as a basis for statistical modeling. Before introducing some of the most widely used and well-established simulators, it is useful to briefly review how wildfire modeling has evolved over the past few decades.
The historical evolution of fire propagation models begins with empirical models developed by engineers collaborating with foresters, which focused more on fire behavior than on the underlying mechanisms of combustion and heat transfer. These are considered first-generation models, with the most well-known example being BEHAVE [34], which has served as the foundation for many subsequent fire behavior models. Second-generation models sought to incorporate, in a simplified manner, certain aspects of the combustion process—such as fire intensity, the effect of fuel moisture content, mass loss during combustion, and the rate at which fuel is supplied to flaming combustion, primarily influenced by wind. This approach bypassed the more complex aspects of wildfire dynamics and relied on surface weather station data instead of mesoscale weather models, reflecting the limited computational resources available at the time. FARSITE [35], developed at the USDA Forest Service, Missoula Fire Sciences Laboratory, and Prometheus [36], from the Canadian Forest Service, exemplify the evolution from early empirical models to more advanced, spatially explicit wildfire simulators. Third-generation models incorporate mechanistic combustion frameworks and large-eddy simulations (LESs) to more accurately represent flaming combustion and fire spread mechanisms [29,37]. These models are typically coupled with computational fluid dynamics (CFD) or mesoscale atmospheric models to simulate complex fire–atmosphere interactions, such as those observed in extreme wildfires—often referred to as sixth-generation fires—that can influence local weather and generate firestorms. Notable examples include WRF-FIRE [38], ARPS/DEVS-FIRE [39], and ForeFire/Meso-NH [40], which integrate quasi-physical fire spread and combustion modules within multiscale weather prediction frameworks. Although these coupled systems provide a more realistic depiction of dynamic fire–atmosphere feedbacks, their operational use remains limited due to their substantial computational demands. Despite notable progress in wildland fire spread modeling, the operational use of these tools remains limited due to high levels of uncertainty [41]. Existing models are inherently approximate, simplified representations of reality. The extreme complexity of wildfire behavior, which arises from the wide range of spatial scales and the interplay of multiple physical processes such as pyrolysis, combustion, flow dynamics, and atmospheric interactions, renders accurate simulation a persistent challenge under practical computational constraints. Furthermore, input data such as fuels, topography, and meteorological conditions are often uncertain and lack adequate spatial and temporal resolution. A fourth approach to this problem is to couple existing models and real-time observations, with the objective of reducing the uncertainties in both model fidelity and input data by using real-time observations of the wildland fire dynamics. This approach is called data-driven modeling. Although data-driven modeling techniques like Kalman filtering [42] enhance model accuracy by integrating observational data into physical frameworks, a distinct and increasingly prominent approach involves the application of machine learning, which enables predictive modeling based on pattern recognition in large-scale datasets, independent of explicit physical assumptions [43,44,45,46].
The ultimate goal of wildfire spread modeling, beyond advancing the understanding of fire dynamics, is to develop practical tools for fire managers that support prevention, preparedness, and operational decision-making. This requires the integration of realistic yet computationally efficient models, numerical methods optimized for performance, seamless coupling with Geographic Information Systems (GISs) for spatial analysis and usability, and access to accurate, up-to-date cartographic and meteorological data.
The integration of wildfire simulation models into GISs represents a key step in making fire modeling tools operationally viable. GIS platforms not only allow the spatialization of input parameters such as fuel types, topography, and weather data, but also enable intuitive visualization and analysis of simulation outputs. Well-established tools such as FARSITE [47] and its descendant FlamMap [48] have historically relied on desktop GIS environments.
With the growing demand for real-time decision support and collaborative tools, GIS-based wildfire modeling has expanded into WebGIS environments. These web-based platforms allow for remote access, user-friendly interfaces, and integration with live data streams such as weather forecasts and satellite imagery. WebGIS systems overcome many of the limitations of standalone desktop applications by providing greater accessibility and facilitating interoperability between different data sources and services. A practical example of a wildfire simulation model integrated within a WebGIS environment is Spark, developed by CSIRO, which enables users to simulate fire spread scenarios using real-time meteorological inputs and terrain data [49]. Another notable platform is Firemap, part of the WIFIRE project [50], which combines high-performance computing with WebGIS capabilities to support dynamic wildfire modeling. Firemap allows users to run ensemble simulations, visualize fire behavior under varying conditions, and access real-time environmental data through an interactive web interface, making it a valuable tool for emergency response and planning.
A critical enabler of this shift to WebGIS has been the adoption of Open Geospatial Consortium (OGC)-compliant Web Processing Services (WPSs). The WPS architecture allows simulation models to be exposed as standardized web services, making it possible to execute wildfire spread and smoke dispersion simulations on remote servers, directly from a web client. This service-oriented approach not only improves scalability and modularity but also supports the coupling of multiple models such as wind, fire, and smoke in near real time. The commercial platform Wildfire Analyst [51] is a prominent example of a WPS-like architecture, offering cloud-based fire spread simulations accessible via web interfaces for operational wildfire risk assessment.
Many wildfire simulation models have evolved from relatively simple empirical or physical formulations to increasingly sophisticated tools that integrate fire–atmosphere interactions, smoke dispersion, risk assessment, and user-oriented interfaces for decision support. Similarly, what began as a simplified physical model for wildfire spread [52], as noted in Sullivan’s comprehensive review [33], has progressively developed into the PhyFire model [53], incorporating advances in both model formulation and computational efficiency. This evolution included the integration of the HDWind wind field simulation model [54] and, more recently, the adaptation of the atmospheric dispersion model PhyNX [55] to simulate wildfire smoke plume.
Parallel efforts have been made to improve the usability and accessibility of these models to offer user-friendly interaction and intuitive geovisualization tools. This includes the development of an ArcGIS add-in [56] and a web-based interface leveraging ArcGIS Server technology [57]. However, in both cases, the preprocessing of input data was not optimized, and their accessibility remained limited due to their reliance on commercial GIS software, which may not be readily available or affordable for all potential users. This limitation has been addressed in the current implementation, which leverages the functionalities provided by the Geospatial Data Abstraction Library (GDAL) [58] for efficient data preprocessing. Additionally, Python scripts are employed for the postprocessing of the simulation results. This modular design ensures the simulation coupled models are easily adapted to different GISs and has facilitated its integration into the WebGIS platform presented here. While the physical modeling framework and numerical implementation have been addressed in previous publications cited herein, this paper presents the next step in its evolution: the deployment of the simulation system within a WebGIS architecture to improve accessibility, facilitate operational use, and support real-time decision-making. The system integrates the three mentioned coupled physical models: HDWind for simulating wind dynamics under complex terrain conditions; PhyFire for wildfire spread; and PhyNX for smoke plume dispersion. These models, implemented in C++ 11 (ISO/IEC 14882:2011 standard) using the Neptuno++ finite element library [59], operate within a modular structure that allows seamless integration into geospatial platforms. Together with the supporting preprocessing and postprocessing scripts, these three models form what will be referred to throughout this paper as the SINUMCC Simulation Toolset, developed by the Numerical Simulation and Scientific Computing Research Group (SINUMCC) at the University of Salamanca. Ensuring that complex simulation models are accessible to institutional users promotes valuable feedback, helping to align future developments with real-world operational needs.
The originality of this study lies in the integration of three complementary components—a high-resolution wind model, a physics-based wildfire spread model, and a smoke dispersion model—within a single WebGIS platform. Unlike previous approaches, the proposed system is freely accessible and designed to combine scientific rigor with practical usability. This integration not only advances the state of wildfire simulation research but also provides a tool directly applicable to operational decision-making in fire management. By enabling both experts and non-experts to configure and run simulations through an intuitive interface, the platform bridges the gap between advanced scientific modeling and practical field applications. Furthermore, its architecture allows rapid visualization and dissemination of results, thereby supporting stakeholders in prevention, preparedness, and response actions.
This paper is structured as follows. Section 2 provides an overview of the Back-End and Front-End components that support the integration of wildfire simulation tools within the WebGIS platform. Section 3 presents the application of the platform to a real wildfire scenario, highlighting its versatility and potential for integration into operational wildfire management contexts. Finally, this paper concludes by summarizing the main findings and outlining directions for future research.

2. Materials and Methods

This section presents the integration of the SINUMCC Simulation Toolset, a modular suite of physical simulation tools composed of the models HDWind, PhyFire, and PhyNX, along with their associated preprocessing and postprocessing utilities. These components simulate wind field dynamics, wildfire spread, and smoke dispersion, respectively. The adaptation of this toolset to an operational WebGIS context required the development of complementary tools aimed at ensuring computational efficiency, data interoperability, and ease of interaction through geospatial interfaces, while maintaining the scientific robustness of the underlying numerical framework.
Section 2.1 presents the overall architecture and hierarchical organization of the integrated system, while Section 2.2 and Section 2.3 provide detailed descriptions of the Back-End and Front-End integration modules, respectively.

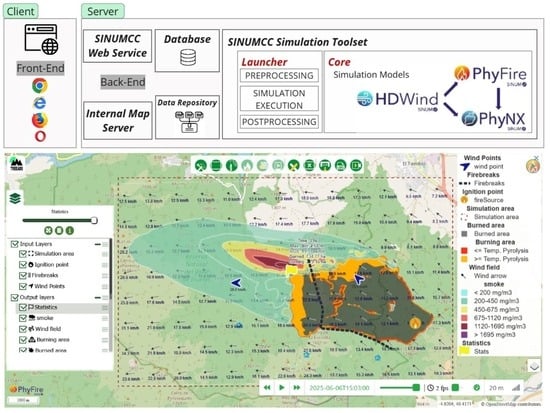
2.1. WebGIS Architecture Overview

The architecture of the WebGIS presented in this work follows the typical client–server design of similar web-based applications, as depicted in Figure 1.
The Front-End application runs in the user’s web browser (client machine). It provides a graphical interface that allows users to manage their simulations. The interface includes a cartographic viewer with interactive controls to prepare the geographical inputs and configure the parameters for new wildfire simulations (configuration stage). It also enables users to explore and assess the results of completed simulations (visualization stage). Further insights into the use of the Front-End implementation can be found in Appendix A.
On the server side, the Back-End is made up of several services that are in turn configured to work together to offer a complete user experience. These services include a general governing service (Section 2.2.1), a database system (Section 2.2.2) for the management of both user-specific data and simulations, as well as information related to the internal geographical data sources required to perform simulations in different areas, a map server (Section 2.2.3), and the SINUMCC Simulation Toolset (Section 2.2.4). A detailed explanation of the Back-End internal structure can be found in Section 2.2.

2.2. Back-End Modules

2.2.1. Back-End Governing SINUMCC Web Service

The SINUMCC Web Service is a multi-component application that is responsible for coordinating all the Back-End operations while at the same time also in charge of performing the communication tasks with the Front-End clients. Therefore, it plays several key roles within the application’s operational flow: (i) Firstly, it listens for incoming requests from the Front-End running on the client side, thus serving as a dedicated communication channel, in addition to the internal map server, between the client and the server. (ii) It also manages the user database, handling all related operations, such as logging-in validations, listing the user’s simulations and reviewing their configurations, etc. (iii) In addition, it oversees the management of workspaces, which are the directories where input and output data for each simulation are stored. This includes creating the workspaces and generating the necessary configuration files for the SINUMCC Simulation Toolset. (iv) Finally, the service is responsible for launching and monitoring simulations once the execution command is issued.
The communications module is configured to operate at two levels: local intranet and external Internet access. The first scope is set to listen to the worldwide network and is intended to receive the calls from the Front-End application running in the web browsers of the clients. This listening service exposes an Hypertext Transfer Protocol (HTTP REST) interface that handles Power-On Self-Test (POST) requests to various endpoints (URLs), allowing clients to perform predefined operations by sending request-specific parameters in the body, typically as JavaScript Object Notation (JSON) data. Beyond the typical user session-specific actions in web-based applications, a list of endpoint requests includes listing the user’s simulations, retrieving the specific simulation configuration and progress status, obtaining a cartographic representation of results from successful simulations, configuring and creating new simulations, and deleting existing simulations.
The second scope is restricted to a private network and is designed to allow communication between the SINUMCC Web Service and the host of the SINUMCC Simulation Toolset. Here, the SINUMCC Web Service dispatches execution commands to such a host in order to start simulations within specific workspaces that would have been created previously. At the same time, simulation progress and status updates will be reported by each of the simulation instances running on the above-mentioned host via HTTP requests through this private network scope to another HTTP listening service.
Workspace management is one of the key tasks of the SINUMCC Web Service component in the Back-End. Here, it is important to define what a workspace is in the context of the WebGIS and what its contents are. Essentially, workspaces are folders set to store all the input files that are needed to run a simulation within the SINUMCC Simulation Toolset but also to store the results and log files. Additionally, the platform allows users to upload new geospatial layers after the simulation has been completed, which are stored within the workspace and can be visualized alongside the simulation results. These folders are named using the Universally Unique Identifier (UUID) that is assigned to each simulation on the fly and are stored on a shared network drive to which the host of SINUMCC Simulation Toolset also has read and write access. The initial contents of a workspace prior to the start of a simulation include the following: (i) a simulation configuration file, which includes the paths for the input files and reference geospatial databases, the simulation bounding box, the model execution settings, and the instructions to perform the progress updates (i.e., the endpoint URL and the simulation ID to make the proper POST requests); (ii) a model parameter file, as specified in Table 1; (iii) a meteorological information input file; (iv) a fire ignition point input file; and (iv) optionally, other input files such as a firebreaks file. Further details on the input files required by the simulation models can be found in Section 2.2.4. A workspace is created once a logged-in client requests the creation of a new simulation with a set of parameters.

2.2.2. Database

The implemented WebGIS employs a single non-relational database using the MongoDB engine. Here, only a brief description of the structure of the database and its tables is provided. A users table includes the login and contact information of each user. Simulation data is structured in a simulations table, which stores basic data such as each simulation UUID, title description, progress, and owner in separate fields, while general simulation configuration settings are encoded as JSON and stored in a single string field. Finally, another table named simulationsources is in charge of keeping track of the internal geographic information sources available for each region or pilot.
Its structure contains a field for a bounding box that represents the simulation area where there are data available and another field storing the path of the geospatial database, its reference system, and its type, i.e., whether it is a digital elevation model (DEM), a fuel presence database, or a vegetation type map. This table is used by the SINUMCC Web Service module in order to establish the origin of the data sources to generate the cartographic input files that will be used in the simulations.

2.2.3. Internal Map Server

The map server is the component responsible for rendering and serving geospatial data layers to the client application. These maps can be stored either in raster or vector format but are always provided in a raster format for visualization inside the browser-based GIS viewer, as will be explained later in Section 2.3. Specifically, three key maps required for fire and smoke simulation are provided through the Web Map Service (WMS) protocol: a DEM, a fuel type map classified according to the National Forest Fire Laboratory (NFFL) system [60], which groups fuels into standard categories based on their physical and combustion characteristics, and a fuel presence map that identifies areas devoid of vegetation, which may function as natural firebreaks and, therefore, fire cannot propagate.

2.2.4. SINUMCC Simulation Toolset

The SINUMCC Simulation Toolset provides wildfire simulation capabilities through a modular architecture. It comprises two main components: the Launcher, a collection of Python (version 3.11) scripts responsible for managing simulation execution as well as preprocessing and postprocessing tasks, and the Core, which includes the model binaries—HDWind for wind field simulation, PhyFire for fire spread modeling, and PhyNX for smoke dispersion—alongside the finite element library Neptuno++.
  • Launcher
    The Launcher is composed of a collection of Python scripts that provides added functionality aimed to ease the treatment of geospatial information and the integration of the Core tools in a GIS. Its main task is handling a sequence of operations that are divided into (i) preprocessing tasks; (ii) simulation execution; and (iii) postprocessing tasks. Throughout these steps, the Launcher also gathers the progress of each of them and reports to the main SINUMCC Web Service in the Back-End, allowing the whole tracking of the simulation from the Front-End.
    The devised preprocessing tasks involve cropping and reprojecting the information found in the global/regional internal geospatial databases used as the three cartographic input sources, the DEM, the fuel type map, and the fuel presence map, as outlined at the end of this section. These operations are performed according to the instructions set in the main configuration file, including the simulation bounding box, the Universal Transverse Mercator (UTM) coordinate system chosen for the simulation in the specific geographical region, the spatial resolution, and the path to the original internal datasets. This way, all the input files will be georeferenced using the same projection system and resolution, thus achieving consistency between the different raster inputs in a single step. Furthermore, any raster or vector file formats can be used as global/regional input datasets (except for the DEM, where only raster is allowed) as long as they are supported by the GDAL library. These tasks are performed by several Python modules that are called by the Launcher and make intensive use of the GDAL library bindings.
    The Python script allows the set of GIS vector layers of simulation results to be processed more efficiently. In the simulation stage, the Launcher calls the Core binary to perform the numerical calculations. In the meantime, the output messages that reveal the stage along the different steps that the simulation undergoes are reported through POST requests to the main governing SINUMCC Web Service in the Back-End. Finally, once the simulation Core finishes the simulation, the Launcher triggers the postprocessing stage. In order to simplify the access to the simulation results by the end-user, a postprocessing task is set to gather all the individual files for each graphical output time step into a single Spatialite database in which each element (features representing the burning area, the burned area, the wind field, smoke concentration, etc.) is labeled with its respective time tag. This allows the Front-End specifications for the visualization of results to be fulfilled as well as facilitating the downloading of simulation results in a single file.
Detailed descriptions of the simulation models are beyond the scope of this work; instead, their roles are briefly outlined, with references to original publications detailing their formulation and validation.
An overview of the coupling strategy among the three core models is essential prior to their individual descriptions (see Figure 2). The HDWind module generates two-dimensional (2D) wind fields at several vertical levels, configured according to the smoke dispersion settings. The wind field at the lowest level is read by PhyFire to drive wildfire propagation under realistic atmospheric conditions. Simultaneously, the full vertical wind profile is used by PhyNX to compute three-dimensional (3D) smoke dispersion. PhyFire simulates the fire front and burned areas, estimating the amount of fuel consumed over time. This quantity, combined with calibrated emission factors, serves as the lower boundary condition for PhyNX to estimate smoke emissions. The simulation framework allows for flexible use: the models can be executed in either coupled or decoupled modes. For instance, wildfire spread may be simulated independently—under uniform wind conditions or with wind fields from HDWind—without computing smoke dispersion. Conversely, coupled fire and smoke simulations can be run with or without the wind field generated by HDWind, depending on data availability. This flexibility significantly reduces computational cost, given that smoke dispersion entails a fully 3D simulation with considerably higher resource demands.
  • HDWind: High-definition wind field model
    The HDWind model is developed to simulate the wind field within an atmospheric layer situated just above the surface S, where wildfire propagation occurs. This layer is influenced by surface temperature and local topography, whereas above it, these effects are considered negligible. As a result, the 3D domain in which the Navier–Stokes equations are formulated is assumed to have a substantially smaller vertical extent compared to its horizontal dimensions. This assumption allows for an asymptotic approximation of the Navier–Stokes equations, inspired by the principles underlying shallow water models. The model aims to generate a detailed 3D wind field over the study area by solving only 2D linear equations. To achieve this, we assume a linear decrease in air temperature with height and neglect the nonlinear terms. This approach enables efficient coupling with the 2D fire spread model PhyFire, thereby minimizing the computational cost of the HDWind–PhyFire integration. The theoretical framework for the asymptotic simplification of the Navier–Stokes equations used to derive this model is detailed in [54].
    In the proposed model, the 3D wind field is derived from the solution of a 2D potential problem, which is driven by the meteorological wind specified at the boundary of the domain. In practice, however, such boundary wind data are unavailable. Instead, wind speed and direction are typically measured at discrete points within the domain, such as meteorological stations. To incorporate these observations, the problem is reformulated so that the input data correspond to pointwise wind measurements rather than boundary conditions. This is accomplished by posing an optimal control problem, in which the boundary wind field acts as the control and is adjusted to best fit the available observational data. The computational strategy adopted to address this optimal control problem is presented in detail in [61].
  • PhyFire: Fire spread model
    PhyFire is a 2D simplified physical one-phase wildfire spread model incorporating certain 3D effects. It is based on the principles of energy and mass conservation, considering radiation and convection as the primary heat transfer mechanisms, while also accounting for heat loss in the vertical direction due to natural convection. The single phase represents the solid phase, while the gaseous phase is accounted for through a parameter influencing the convective term, as well as the flame temperature and height in the radiation term, both of which are determined using dedicated submodels. The model also incorporates the effects of fuel continuity and type, along with fuel moisture content, the latter being represented by a multi-valued operator in the enthalpy. Additionally, it considers flame tilt caused by wind or terrain slope. An optional feature allows for the integration of stochastic phenomena such as fire spotting (see [57]). The associated simplified system of partial differential equations (PDEs) yields, at each instant and for every point on the surface where fire spread is modeled, two dimensionless variables, the dimensionless temperature of the solid fuel (u) and the mass fraction of solid fuel (c), with the third variable in the system being the dimensionless enthalpy (e).
    The first version of this model accounted for local radiation using the Rosseland approximation and included a reactive term based on Arrhenius’ law (see [52]). Two major simultaneous improvements were later introduced: first, non-local radiation, which allowed the incorporation of 3D effects while maintaining the model’s 2D formulation, and second, a multi-valued operator in the enthalpy to model the effect of fuel moisture content (FMC) on fire spread. This novel approach to incorporating FMC effects aligns with the exponential decay in the ROS induced by this factor [62]. The current version of the model integrates the aforementioned submodels for flame temperature and height, as well as the ability to simulate certain random phenomena. Full details on the model’s evolution and its current formulation, including references to the developments mentioned above, can be found in [53]. The PDEs defining the model are complemented by the appropriate boundary and initial conditions, which establish the initial state of the fuel and the ignition point. The problem is solved using efficient numerical methods based on the finite element method (FEM). The code is also adapted for parallel computing using OpenMP, significantly reducing simulation time. The total computation time depends on factors such as the simulation domain size, time step, and spatial resolution. Notably, simulating one hour of fire spread under moderate conditions with intermediate resolution on a standard computer takes less than two minutes.
  • PhyNX: Atmospheric dispersion model
    PhyNX is a multilayer, non-reactive Eulerian model designed for urban-scale air quality assessments. It simulates convection and diffusion processes, is grounded in the mass conservation equation, and is specifically adapted to model the dispersion of smoke plumes originating from wildfires. The model operates within the atmospheric layer above the fire-affected surface S and is coupled with the wildfire spread model PhyFire through a boundary condition defined at the surface S. Smoke emissions from the simulated fire are calculated as a function of the amount of fuel consumed, modulated by an emission factor that depends on the fuel type. The model also assumes that smoke losses occur only at the lateral boundary, but not at the upper boundary, and that there is no deposition on the surface S.
    Accurate and stable numerical schemes are essential for solving air dispersion models. To address this, an Adaptive Finite Element Method (AFEM) incorporating characteristics in the horizontal plane, combined with Finite Differences in the vertical direction, has been implemented. This was achieved through operator splitting techniques and a parallelized algorithm. Operator splitting is a well-established strategy in the numerical solution of air dispersion problems, as it facilitates the decomposition of complex systems into more manageable subproblems. Our approach enables the horizontal convective and diffusive terms to be solved concurrently for each horizontal layer, allowing for increased resolution by refining the number of layers without a proportional rise in computational cost. The vertical discretization relies on the wind field provided by the HDWind model, which supplies wind data for each atmospheric layer. As a result, the method achieves high accuracy while preserving real-time or faster-than-real-time performance. For further details on the numerical scheme, its parallel implementation, and the coupling between the atmospheric dispersion model PhyNX and the wind field model HDWind, see [55].
  • Neptuno++: Finite Element library
    Neptuno++ is an adaptive finite element toolbox mainly developed by L. Ferragut at SINUMCC [59] and implemented in C++. It uses 4TRivara’s refinement and error control, enabling effective solutions for both stationary and time-dependent problems. This library has been utilized to validate convergence theories in the AFEM and has been applied for the numerical simulation of several environmental problems. The current version of this library provides functionalities for handling geospatial data.
In the context of this work, it is essential to provide a more detailed explanation of the model components that serve as a link to the WebGIS, specifically the input and output data, as well as the parameters that can be modified through this interface. Figure 2 also provides an overview of the input and output data for each model, while Table 1 lists the parameters associated with each model, distinguishing those that also depend on the fuel type. All these parameters are configurable through the WebGIS platform, allowing advanced users to precisely adjust the simulation settings according to specific needs.
Cartographic input data required by the HDWind model include the DEM and the fuel type map of the simulation area. Furthermore, the PhyFire model additionally requires a fuel presence map. Moreover, the fuel presence map can be modified through the platform to introduce potential changes in fuel distribution—such as the position and width of new firebreaks—and it defines the initial value of the dimensionless solid fuel variable in the model. Similarly, the initial value of the dimensionless solid fuel temperature, which is defined by the location of the ignition source(s), is set through the platform. Fuel type influences fire behavior through a set of parameters in the fire spread model, described below. It also determines the surface roughness coefficient, which influences wind calculations in the HDWind model.
The models also rely on meteorological inputs, including ambient temperature, relative humidity, and wind direction and intensity. All of these data can be updated hourly through the platform. Wind-related information, in particular, requires additional explanation. Two options are available for wind data. The first assumes a uniform wind across the simulation area, which can be updated hourly during the simulation. This approach uses only the fire spread model, without coupling it with the HDWind model. The second option integrates the HDWind and fire spread models and requires georeferenced wind intensity and direction data at specific locations. These data are used by the HDWind model to compute a 3D wind field over the simulation area. As previously mentioned, the wind field in the lower layer is used as input for the fire spread model, while the remaining layers are used for the smoke dispersion model.
The PhyFire model provides, at each of the graphical output times and at each point on the surface where fire spread is simulated, two dimensionless variables: the dimensionless temperature of the solid fuel (u) and the mass fraction of solid fuel (c). These variables are processed through Boolean operations involving the initial fuel temperature and fuel load to determine both the areas that have already burned and those that are actively burning. As a result, the model output is not limited to a line representing the fire front position, but also includes its depth. Additionally, the model generates key statistics for each of the graphical output times, including the total burned area (in hectares), the actively burning area (in hectares), the distance from the ignition point to the most advanced point of the fire front, and the ROS at that point.
The PhyNX model provides the smoke concentration at each output time step and at every point within each of the air layers used in the vertical discretizations; both the total height of the 3D domain of the air layer and the individual layers for which the smoke output is generated are easily selected through the WebGIS interface. Initially, the model is designed to simulate the dispersion of the smoke plume without distinguishing its components. However, it can be easily adapted to simulate the behavior of the main components of wildfire smoke, provided that the emission factors for each of these components are known.
As previously explained, the physical models are solved within a defined domain that includes (i) the simulation area, understood as the rectangular region on the surface where the wildfire occurs; (ii) the simulation time interval, which must be shorter than the time required for the fire to reach the boundary of the simulation area, thereby ensuring the validity of homogeneous Dirichlet boundary conditions; and (iii) the height of the air layer over which smoke dispersion is computed. All of these settings can be easily configured through the WebGIS platform.
Several numerical parameters also need to be configured, including the horizontal element size of the 2D finite element mesh defined on the simulation area and the number of vertical air layers in which wind field and smoke concentrations are computed and displayed. Additionally, while the time step used for the numerical integration is predefined, the user can select the output time interval for graphical results, which controls the frequency at which simulation output data are saved and visualized.
In addition, each model includes a set of parameters with pre-calibrated default values, which the user can modify through the WebGIS interface. These parameters can be classified into two categories. On one hand, there are model-specific parameters—for instance, those associated with the optimal control problem of the HDWind model or with the three heat transfer mechanisms considered by the PhyFire model (radiation, convection, and vertical natural convection) or the horizontal and vertical dispersion coefficients used in the PhyNX model. On the other hand, there are parameters whose values depend on the type of fuel, for example, the surface roughness parameter in the HDWind model, the emission coefficient in PhyNX, and up to eight fuel-related parameters in PhyFire, which are conceptually described in Table 1. Detailed explanations of these pre-calibrated parameter values can be found in [62,63] and their references. While these values are based on preliminary calibration efforts, further refinement and validation remain ongoing. These parameters have been primarily adjusted for Mediterranean vegetation types using data from the Photo-Guide for Mediterranean Fuels [64], which provides detailed fuel characterizations essential for accurate fire behavior modeling in such ecosystems. In parallel, ongoing work is being conducted to adapt these parameters for Central European vegetation, aiming to improve model applicability across diverse ecological regions. While the full set of model parameters reflects the complexity of the physical processes involved, default values are provided within the platform to support general use cases, with the option for expert users to modify them as needed for advanced analyses or specific fuel scenarios.

2.3. Front-End

The Front-End application consists of a website comprising three modules: a login page, a user dashboard, and a GIS component that functions as both a simulation results viewer and a simulation configuration interface. The Front-End is written using the React.js framework [65], while the GIS viewer runs over the javascript OpenLayers library [66].
Both the login and dashboard components feature a straightforward design and do not incorporate technically innovative or noteworthy elements, relying instead on conventional approaches commonly employed in contemporary web applications.
Certain aspects of the GIS viewer deserve a more detailed explanation. The map viewer provides the possibility to use several publicly available map base sources such as Bing Aerial [67], Bing Road [67], OpenStreetMap (OSM) [68], ArcGIS Online [69], or Copernicus Very High-Resolution (VHR) image layers [70]. It also incorporates a layer manager panel that classifies the data sources in two groups: (i) input layers and (ii) reference cartography. This latter group includes the DEM, the fuel types, and the fuel presence layers served through the WMS protocol by the internal cartography map server [56] but also other DEM data sources as Copernicus [71], the European-level fuel type cartography from EFFIS [72], or country-specific orthophoto imaging [73]. In the input layers, there is the simulation area, the initial ignition point, the wind reference point or stations, and the firebreaks or firefighter actions.
As regards the input layers, these would be populated during the creation of a new simulation throughout the configuration stage by using a multi-tab configuration panel and a toolbar interface to access the available features, including the following tools: (i) access to the general configuration tab in the configuration panel; (ii) a simulation area selection tool; (iii) access to the meteorological input configuration tab; (iv) setting up the initial ignition point(s); (v) setting up firebreaks; (vi) setting up meteorological reference points or stations; and (vii) resetting the configuration.
Regarding the configuration panel, it holds all the input forms and controls to fully configure the simulation within the application capabilities. The tabs are as follows: (i) metadata, allowing a title, description, and start date for the event to be set; (ii) general options, which include the time span for the simulation, the frequency of saving results, the precision of the simulation, and whether the smoke simulation must be enabled or not; (iii) meteorology, which allows the configuration of whether the simulation will be run with a uniform wind or a wind computed through HDWind; (iv) fuels, permitting the manipulation of the different parameters that govern the fire behavior of each of the models; (v) and (vi) PhyFire- and HDWind-specific model parameters; and (vii) PhyNX-specific model parameters if it was selected.
The visualization stage incorporates the same tools as the configuration stage. However, the intention of the configuration of panel and toolbar here is only to review the simulation configuration settings. Furthermore, the toolbar includes a log that allows viewing the output generated by the SINUMCC Simulation Toolset. Since the simulation results are time-tagged, along with a new group in the layers panel, other floating tools appear in the map viewer interface: a time slider and photogram controller. The simulation results’ available layers are (i) wind field; (ii) burned area; (iii) burning area; (iv) simulation statistics providing some useful data such as the output time step in hours, the ROS in m/min, and the extent (ha) of the burned and burning areas; and (v) smoke concentration, if PhyNX was selected. The activation of the layers, along with the selection of an instant with the time slider, activates a request to the SINUMCC Web Service to retrieve such cartographic information, which is in turn sent back to the client in GeoJSON format for visualization.
Additionally, the interface includes a feature accessible through the toolbar that allows users to upload external geospatial data in formats such as Shapefile, GeoJSON, or KML. This functionality becomes available once the simulation has been completed. The uploaded files are then integrated into the workspace and displayed alongside the existing simulation layers within the WebGIS environment. This capability supports the incorporation of additional spatial information, such as the actual perimeter of a burned area, enabling visual comparison between simulation results and real-world data.

3. Results: A Real Case Study

To validate the simulation tool, a real wildfire event was selected and reproduced using the platform (see Supplementary Materials) based on the available cartographic and event data, with details provided later in this section. It is important to note that the simulation was carried out with an awareness of the significant uncertainty associated with some of the input data.
The selected case corresponds to a wildfire that occurred near the village of El Raso, a hamlet belonging to the municipality of Candeleda, in the southern part of Ávila Province (central Spain). The fire broke out at 17:41 on 14 August 2021 and originated next to a road as a result of negligence—specifically, the improper disposal of a cigarette butt. The fire rapidly spread under critical fire weather conditions, with air temperatures close to 40 °C and relative humidity well below typical thresholds, resulting in an extremely dry atmosphere highly conducive to fire propagation. Wind data were retrieved from the NASA POWER database, but due to their coarse spatial resolution (50 km) and the distance to the fire site, they involve a high degree of uncertainty. To improve the characterization of local wind conditions, additional information was incorporated from the ERA5-Land reanalysis dataset [74] and from records of nearby meteorological stations provided by the Junta de Castilla y León.
The ignition point, the estimated affected area ( 219.61 ha), and the reported deployment of firefighting resources, including two helicopters and several ground crews, were obtained from the open access forest fire database provided by the Junta de Castilla y León [75]. The final fire perimeter, however, was estimated by the authors using post-fire satellite imagery and uploaded to the simulation workspace after the simulation was completed in order to visually compare the results. No data were available regarding intermediate perimeters or the specific suppression actions carried out during the event. Additionally, no information was found concerning smoke generation, distribution, or impact, which limits the scope of the analysis related to smoke dispersion simulation.
The simulation was carried out through the WebGIS platform by selecting a computational domain of approximately 23 km2 and a simulation period of three hours. The cartographic datasets used in this case study were clipped from the internal map server of the platform, and their detailed description is provided in reference [56]. Two-point wind observations were incorporated into the system to reconstruct the local wind field using the HDWind model. The ignition point was manually located at the observed starting position of the fire. In addition, the platform’s built-in tools were used to define several firebreaks. These were introduced both to compensate for limitations in the original fuel presence map, particularly the absence of secondary roads, and to simulate potential suppression actions by firefighting crews along the flanks of the fire. Furthermore, some fuel-type-dependent parameter values were adjusted: specifically, the HFlame parameter was slightly increased for fuel models 1 and 2, and the MasCom parameter was increased for fuel model 1, as herbaceous fuels in this area tend to be denser than standard classifications suggest.
Figure 3a shows the simulated fire spread over a three-hour period, including ignition point, firebreaks, wind vectors, and burned and active burning areas. The grey background layer corresponds to the actual final fire perimeter, allowing for a visual comparison between the simulation results and the observed extent of the fire. By summing the burning area ( 50.34 ha) and the burned area ( 93.81 ha), the total affected area reaches 144.15 ha. In comparison, the observed fire perimeter corresponds to ( 219.61 ha). Part of this discrepancy arises because the reported perimeter measurement includes the entire interior area, such as unburned features (e.g., the lake), whereas the simulation excludes unburned patches within the fire perimeter. To provide a more objective assessment of model performance, we calculated similarity indices between the final simulated and observed fire perimeters. The Jaccard index was 0.603 and the Sørensen index 0.752 , indicating a moderate-to-high level of agreement [76] between the two perimeters.
Figure 3b displays the simulation output after two hours, highlighting the estimated smoke concentration levels in the lowest atmospheric layer, along with the fire’s active and burned areas, ignition point, and firebreaks. Since no observed smoke data were available for this fire, the smoke dispersion results should be interpreted as hypothetical. Such data are rarely available in real wildfire events. The firebreak on the left integrates a road into the fuel presence map, updating the original data to reflect actual conditions. The remaining firebreaks simulate suppression actions carried out by firefighting crews along the flanks of the fire.

4. Discussion

This paper presents the development and implementation of an integrated WebGIS-based simulation tool that couples wind field modeling, wildfire spread, and smoke dispersion. The system incorporates three physical models—HDWind, PhyFire, and PhyNX—coupled through a modular and efficient computational architecture and supported by a user-oriented WebGIS interface. This integration enables the simulation of complex wildfire-related processes with a high level of realism, while offering a user-friendly interface and intuitive geovisualization tools that enhance information support for emergency management agencies.
This new version represents a significant technical improvement over previous implementations, such as those based on ArcGIS tools. A key innovation is the integration of the GDAL library for the automated preprocessing of geospatial data, which significantly enhances efficiency and interoperability. In addition, the modular design facilitates seamless coupling of the physical models and their execution within a unified WebGIS environment. The platform incorporates a set of custom-designed REST services that act as a web-based processing interface, enabling flexible and efficient execution of wildfire simulations, and offers compatibility with some OGC standards, such as WMS and Web Feature Service (WFS), used for data visualization and access. These advancements contribute to greater computational performance, reduced user workload, and a more streamlined simulation workflow.
The tool allows for the configuration and execution of simulations with minimal technical knowledge, making it highly suitable for operational use in risk assessment, emergency planning, and decision-making processes. The incorporation of pre-calibrated model parameters, automated preprocessing and postprocessing, and interactive visualization features supports a complete workflow from configuration to analysis of simulation outcomes. In addition, the firebreak design tool provides significant versatility by allowing users to modify the fuel map directly within the simulation environment. This functionality can be used both to update or correct incomplete fuel data, such as missing roads or vegetation discontinuities, and to incorporate planned suppression measures into the simulation process. The platform also enables users to download simulation output files for further analysis with external GIS tools, thereby facilitating integration with existing workflows and supporting more advanced post-simulation assessments. Additionally, users can upload external geospatial data files; in the case analyzed, a file containing the final fire perimeter was uploaded, enabling qualitative comparisons between the simulation results and the actual fire extent.
The integration of the HDWind, PhyFire, and PhyNX models into a unified simulation platform has reached a sufficient level of development to support integrated simulation within the platform, while recognizing the observed limitations in perimeter accuracy. The inclusion of a historical case study demonstrates the tool’s capability to simulate complex fire behavior and smoke dispersion under realistic conditions, supporting its applicability for retrospective analyses and operational decision-making. Furthermore, the system offers two complementary modes of use: a command line interface that allows advanced users to refine input data and modeling parameters with greater flexibility and a WebGIS-based interface designed to facilitate access and interaction for practitioners. This dual approach enhances both scientific usability and institutional applicability, contributing to the broader goal of translating advanced wildfire modeling into practical tools for planning, response, and evaluation.
To contextualize the contributions of the proposed platform, a comparative analysis is presented in Table 2, focusing on key technical and operational features of several existing wildfire simulation systems. This analysis highlights the comprehensive scope of the SINUMCC platform, which offers a balanced combination of physically grounded modeling, ease of use, and operational adaptability. In contrast to other tools that typically prioritize either high-resolution simulation capabilities or simplified user interfaces, the proposed system integrates a quasi-physical modeling approach with an intuitive geospatial interface. It combines wind field estimation, fire spread, and smoke dispersion in a unified simulation environment. Additional functionalities such as three-dimensional output visualization, editable fuel maps, and exportable simulation results enhance its suitability for both real-time application and post-event assessment. The modular software design and the use of dedicated web services facilitate integration with external systems and future improvements, including the incorporation of real-time meteorological inputs or expanded analytical outputs. These strengths make the SINUMCC platform a valuable asset for wildfire modeling, with relevance for scientific investigations, public agencies, and operational decision-making contexts.
The comparative overview presented in Table 2 illustrates the wide range of existing wildfire simulation platforms and emphasizes the distinctive characteristics of the SINUMCC system. Its unified approach to modeling wind, fire, and smoke processes within a single operational framework is uncommon among current tools. Furthermore, the platform’s design prioritizes both scientific rigor and usability, enabling expert and non-expert users alike to configure and run simulations with minimal effort. The availability of editable fuel layers, compatibility with geospatial standards, and integration of three-dimensional visualization tools position it as a powerful and flexible resource for institutions involved in prevention, analysis, and emergency response. This comprehensive integration, together with a modular architecture capable of supporting further enhancements, demonstrates the maturity and forward-looking potential of the SINUMCC platform.

5. Conclusions

The development of this platform represents a milestone in a long-standing research effort in the mathematical modeling and numerical simulation of wildfire-related phenomena. These advances have been translated into a functional tool that is accessible to public administrations and wildfire management services. By integrating advanced simulation capabilities within an intuitive WebGIS environment, the platform enhances the efficiency of both data preprocessing and result analysis, while also reducing the technical barriers traditionally associated with fire modeling. Non-expert users are not required to possess technical knowledge of the underlying models; by following the instructions provided in Appendix A, they can configure and execute simulations without prior expertise in numerical methods or programming. This makes the tool suitable for practical use in operational contexts, while also enabling feedback from practitioners to guide future developments.
The current version of the system allows for the integrated simulation of wind fields, wildfire spread, and smoke dispersion within a unified geospatial interface. Its level of maturity has been demonstrated through the simulation of a real wildfire scenario, which confirms the system’s capacity to replicate key fire dynamics and smoke behavior with an accuracy consistent with the validation results, as reflected by the calculated similarity indices between observed and simulated perimeters. This performance supports its use for retrospective analysis and decision-making processes.
Although the platform already provides a high degree of automation, flexibility, and model integration, several opportunities for improvement remain. From a modeling perspective, ongoing work is focused on improving computational efficiency to enable bidirectional coupling between wind and fire dynamics under realistic time constraints. The effects of wind field resolution and spatial scale on wildfire propagation, as well as the influence of surface topography, model simplifications, and the treatment of input and output variables across temporal and spatial resolutions, are currently being investigated in our ongoing research. Additional developments include the simulation of specific smoke constituents to support assessments of air quality and health impacts, along with extended validation and sensitivity analyses to enhance predictive capability under diverse environmental conditions. We also plan to incorporate the option of exporting simulation result maps with traditional cartographic elements (scale, orientation arrow, and coordinate system), complementing the current user-oriented visualization provided by the platform.
On the platform side, development efforts are directed toward integrating real-time meteorological data, extending 3D visualization capabilities, and incorporating new geospatial layers such as burned area maps and active fire detections from the European Forest Fire Information System (EFFIS). Furthermore, the functionality for comparing simulated and observed perimeters through similarity indices—already available in the local version—will be incorporated into the WebGIS interface. These enhancements aim to increase operational usability and support both retrospective evaluations and real-time wildfire management.
Several public agencies and private entities involved in wildfire response, environmental monitoring, and land management have expressed interest in the platform. Their feedback will be essential to assess its practical value and to guide continuous development in alignment with the evolving needs of decision-makers.
Finally, to provide a structured summary on the current limitations of the simulation platform, Table 3 presents a domain-specific overview of weaknesses and implications by categorizing these issues into technical, data, and user experience areas.

Supplementary Materials

A video demonstrating an example of how to use the WebGIS interface is provided as supplemental material and can be accessed via https://figshare.com/articles/dataset/WebGIS_usage_video_for_the_research_paper_entitled_From_Wind_to_Smoke_A_Unified_WebGIS_Platform_for_Wildfire_Simulation_and_Visualization/29673542?file=56661632 (accessed on 8 August 2025 ). This video illustrates the main functionalities and user interactions described in the manuscript.

Author Contributions

Conceptualization, M.I.A.; data curation, J.M.I. and D.C.-J.; formal analysis, M.I.A.; funding acquisition, D.G.-A.; investigation, S.M.-L., J.M.I., and M.I.A.; project administration, D.G.-A.; resources, J.M.I. and D.C.-J.; software, D.C.-J.; supervision, M.I.A. and D.G.-A.; validation, J.M.I.; writing—original draft, S.M.-L., J.M.I., and M.I.A.; writing—review and editing, S.M.-L. and M.I.A. All authors have read and agreed to the published version of the manuscript.

Funding

This work was supported by the European Union’s Horizon 2020—Research and Innovation Framework Programme under Grant 101036926 and the Ministerio de Ciencia, Innovación y Universidades under Grant FPU21/00446.

Data Availability Statement

Data underlying this study can be provided by the corresponding author upon reasonable request, subject to institutional considerations.

Conflicts of Interest

The authors declare no conflicts of interest.

Abbreviations

The following abbreviations are used in this manuscript:
AFEMAdaptive Finite Element Method
CACellular Automata
CFDComputational Fluid Dynamics
CSIROCommonwealth Scientific and Industrial Research Organisation
DEMDigital Elevation Model
EFFISEuropean Forest Fire Information System
FEMFinite Element Method
FMCFuel Moisture Content
GDALGeospatial Data Abstraction Library
GISGeographic Information Systems
HDWindHigh-Definition Wind Field Model
HTTP RESTHypertext Transfer Protocol
LESsLarge-Eddy Simulations
JSONJavaScript Object Notation
NASA POWERNASA Prediction Of Worldwide Energy Resources
NFFLNational Forest Fire Laboratory
OGCOpen Geospatial Consortium
OSMOpenStreetMap
PNOASpanish National Plan for Aerial Orthophotography
ROSRate of Spread
SINUMCCNumerical Simulation and Scientific Computing Research Group
PhyFirePhysical Fire spread model
PhyNXAtmospheric Dispersion Model
POSTPower-On Self-Test
USDAUnited States Department of Agriculture
UTMUniversal Transverse Mercator
UUIDUniversally Unique Identifier
VHRVery High Resolution
WFSWeb Feature Service
WMSWeb Map Service
WPSWeb Processing Service

Appendix A. WebGIS Workflow

This appendix provides a practical overview of the operational workflow for the SINUMCC WebGIS platform, available at https://sinumcc.usal.es (accessed on 8 August 2025 ), which integrates the HDWind, PhyFire, and PhyNX models for simulating wind fields, wildfire spread, and smoke dispersion. The process can be described in three main stages:
  • Configuration stage (Front-End) In this stage, users define the simulation scenario by specifying the simulation domain, ignition sources, meteorological inputs, and relevant model parameters. The platform supports both default configurations for rapid execution and advanced parameterization for tailored analyses, including fuel map editing and activation of specific physical processes such as fire spotting or smoke modeling.
  • Simulation stage (Back-End) Once the configuration is complete, the platform processes the input data, executes the coupled models, and performs the necessary pre- and postprocessing steps. The modular architecture and integrated simulation toolset enable efficient execution while maintaining physical realism in the modeled processes.
  • Visualization stage (Front-End) Simulation results are displayed through an interactive WebGIS interface, offering 2D and 3D visualizations, statistical summaries, and temporal exploration of model outputs. The platform also supports the integration of external geospatial datasets with the simulation results, facilitating comparative analysis and operational decision-making.
Figure A1. General workflow of the SINUMCC WebGIS platform, comprising three main stages: configuration, simulation, and visualization. The integrated simulation toolset couples wind, fire, and smoke models, with outputs visualized through interactive maps, statistics, and 3D animations to support wildfire analysis and decision-making.
Fire 08 00366 g0a1
These stages provide a structured yet flexible operational workflow, enabling both rapid scenario assessment and more detailed analyses, depending on the needs and expertise of the user. The approach ensures that advanced modeling capabilities are accessible within a user-friendly environment, bridging the gap between scientific modeling and practical wildfire management.

References

  1. Crist, M.R. Rethinking the focus on forest fires in federal wildland fire management: Landscape patterns and trends of non-forest and forest burned area. J. Environ. Manag. 2023, 327, 116718. [Google Scholar] [CrossRef] [PubMed]
  2. Bowman, D.M.J.S.; Balch, J.K.; Artaxo, P.; Bond, W.J.; Cochrane, M.A.; D’Antonio, C.M.; DeFries, R.S.; Johnston, F.H.; Keeley, J.E.; Krawchuk, M.A.; et al. Fire in the Earth System. Science 2009, 324, 481–484. [Google Scholar] [CrossRef] [PubMed]
  3. Valero, M.; Rios, O.; Mata, C.; Pastor, E.; Planas, E. GIS-based integration of spatial and remote sensing data for wildfire monitoring. In Proceedings of the Earth Resources and Environmental Remote Sensing/GIS Applications IX, Berlin, Germany, 10–13 September 2018. [Google Scholar]
  4. Cunningham, C.; Williamson, G.; Bowman, D. Increasing frequency and intensity of the most extreme wildfires on Earth. Nat. Ecol. Evol. 2024, 8, 1420–1425. [Google Scholar] [CrossRef]
  5. FAO. FAO Launches Updated Guidelines to Tackle Extreme Wildfires; FAO: Rome, Italy, 2024. [Google Scholar]
  6. European Forest Fire Information System (EFFIS). Annual Report 2023 on Forest Fires in Europe, Middle East and North Africa; European Forest Fire Information System (EFFIS): Brussels, Belgium, 2024. Available online: https://share.google/rTjjv3sL0mV5DUIKa (accessed on 8 August 2025).
  7. Dirección General de Protección Civil y Emergencias. Informe Final de la Campaña de Incendios Forestales 2024; Dirección General de Protección Civil y Emergencias: Madrid, Spain, 2024. [Google Scholar]
  8. Lee, K.H.; Kim, J.E.; Kim, Y.J.; Kim, J.; Von Hoyningen-Huene, W. Impact of the smoke aerosol from Russian forest fires on the atmospheric environment over Korea during May 2003. Atmos. Environ. 2005, 39, 85–99. [Google Scholar] [CrossRef]
  9. Chan, I.; Schneider, S.R.; Cheng, A.; Styler, S.A. Wildfire Smoke Contributions to Polycyclic Aromatic Hydrocarbon Loadings in Western Canadian Urban Surface Grime. Environ. Sci. Technol. 2025, 59, 2745–2753. [Google Scholar] [CrossRef]
  10. van der Werf, G.R.; Randerson, J.T.; Giglio, L.; van Leeuwen, T.T.; Chen, Y.; Rogers, B.M.; Mu, M.; van Marle, M.J.E.; Morton, D.C.; Collatz, G.J.; et al. Global fire emissions estimates during 1997–2016. Earth Syst. Sci. Data 2017, 9, 697–720. [Google Scholar] [CrossRef]
  11. Our World in Data. Annual CO2 Emissions from Wildfires. 2025. Available online: https://ourworldindata.org/grapher/annual-carbon-dioxide-emissions?time=2023&country=~OWID_EUR (accessed on 18 July 2025).
  12. EFFIS—European Forest Fire Information System. EFFIS—Seasonal CO2 Emissions Estimate: Spain. 2025. Available online: https://forest-fire.emergency.copernicus.eu/apps/effis.statistics/seasonaltrend/ESP/2025/CO2 (accessed on 18 July 2025).
  13. Yin, L.; Shaw, S.L.; Wang, D.; Carr, E.A.; Berry, M.W.; Gross, L.J.; Comiskey, E.J. A framework of integrating GIS and parallel computing for spatial control problems—A case study of wildfire control. Int. J. Geogr. Inf. Sci. 2012, 26, 621–641. [Google Scholar] [CrossRef]
  14. Meng, Q.; Huai, Y.; You, J.; Nie, X. Visualization of 3D forest fire spread based on the coupling of multiple weather factors. Comput. Graph. 2023, 110, 58–68. [Google Scholar] [CrossRef]
  15. Prichard, S.; Larkin, N.S.; Ottmar, R.; French, N.H.F.; Baker, K.; Brown, T.; Clements, C.; Dickinson, M.; Hudak, A.; Kochanski, A.; et al. The Fire and Smoke Model Evaluation Experiment—A Plan for Integrated, Large Fire–Atmosphere Field Campaigns. Atmosphere 2019, 10, 66. [Google Scholar] [CrossRef]
  16. Liu, Y.; Heilman, W.E.; Potter, B.E.; Clements, C.B.; Jackson, W.A.; French, N.H.F.; Goodrick, S.L.; Kochanski, A.K.; Larkin, N.K.; Lahm, P.W.; et al. Smoke Plume Dynamics. In Wildland Fire Smoke in the United States; Peterson, D.L., McCaffrey, S.M., Patel-Weynand, T., Eds.; Springer: Cham, Switzerland, 2022. [Google Scholar] [CrossRef]
  17. Li, F.; Zhu, Q.; Riley, W.J.; Zhao, L.; Xu, L.; Yuan, K.; Chen, M.; Wu, H.; Gui, Z.; Gong, J.; et al. AttentionFire_v1.0: Interpretable machine learning fire model for burned-area predictions over tropics. Geosci. Model Dev. 2023, 16, 869–884. [Google Scholar] [CrossRef]
  18. Shamsaei, K.; Juliano, T.W.; Roberts, M.; Ebrahimian, H.; Kosovic, B.; Lareau, N.P.; Taciroglu, E. Coupled fire-atmosphere simulation of the 2018 Camp Fire using WRF-Fire. Int. J. Wildland Fire 2023, 32, 195–221. [Google Scholar] [CrossRef]
  19. Goodrick, S.L.; Achtemeier, G.L.; Strand, T.M. Fire Behavior and Heat Release as Source Conditions for Smoke Modeling. In Wildland Fire Smoke in the United States; Peterson, D.L., McCaffrey, S.M., Patel-Weynand, T., Eds.; Springer: Cham, Switzerland, 2022; pp. 45–65. [Google Scholar] [CrossRef]
  20. Shamsaei, K.; Juliano, T.W.; Roberts, M.; Ebrahimian, H.; Lareau, N.P.; Rowell, E.; Kosovic, B. The Role of Fuel Characteristics and Heat Release Formulations in Coupled Fire-Atmosphere Simulation. Fire 2023, 6, 264. [Google Scholar] [CrossRef]
  21. Cardil, A.; Monedero, S.; Silva, C.A.; Ramirez, J. Adjusting the rate of spread of fire simulations in real-time. Ecol. Model. 2019, 395, 39–44. [Google Scholar] [CrossRef]
  22. Filippi, J.B.; Bosseur, F.; Mari, C.; Lac, C.; Moigne, P.L.; Cuenot, B.; Veynante, D.; Cariolle, D.; Balbi, J.H. Coupled Atmosphere—Wildland Fire Modelling. J. Advanves Model. Earth Syst. 2009, 1, 9. [Google Scholar] [CrossRef]
  23. Kochanski, A.; Jenkins, M.A.; Sun, R.; Krueger, S.; Abedi, S.; Charney, J. The importance of low-level environmental vertical wind shear to wildfire propagation: Proof of concept. J. Geophys. Res. Atmos. 2013, 118, 8238–8252. [Google Scholar] [CrossRef]
  24. Masoudian, S.; Sharples, J.; Jovanoski, Z.; Towers, I.; Watt, S. Incorporating Stochastic Wind Vectors in Wildfire Spread Prediction. Atmosphere 2023, 14, 1609. [Google Scholar] [CrossRef]
  25. Perry, G.L. Current approaches to modelling the spread of wildland fire: A review. Prog. Phys. Geogr. Earth Environ. 1998, 22, 222–245. [Google Scholar] [CrossRef]
  26. Pastor, E. Mathematical models and calculation systems for the study of wildland fire behaviour. Prog. Energy Combust. Sci. 2003, 29, 139–153. [Google Scholar] [CrossRef]
  27. Peacock, R.D.; Jones, W.W.; Bukowski, R.W. Verification of a model of fire and smoke transport. Fire Saf. J. 1993, 21, 89–129. [Google Scholar] [CrossRef]
  28. Sullivan, A.L. Wildland surface fire spread modelling, 1990–2007. 3: Simulation and mathematical analogue models. Int. J. Wildland Fire 2009, 18, 387–403. [Google Scholar] [CrossRef]
  29. Bakhshaii, A.; Johnson, E. A review of a new generation of wildfire—Atmosphere modeling. Can. J. For. Res. 2019, 49, 565–574. [Google Scholar] [CrossRef]
  30. Papadopoulos, G.D.; Pavlidou, F.N. A Comparative Review on Wildfire Simulators. IEEE Syst. J. 2011, 5, 233–243. [Google Scholar] [CrossRef]
  31. Silva, J.; Marques, J.; Gonçalves, I.; Brito, R.; Teixeira, S.; Teixeira, J.; Alvelos, F. A Systematic Review and Bibliometric Analysis of Wildland Fire Behavior Modeling. Fluids 2022, 7, 374. [Google Scholar] [CrossRef]
  32. Sullivan, A.L. Wildland surface fire spread modelling, 1990–2007. 2: Empirical and quasi-empirical models. Int. J. Wildland Fire 2009, 18, 369. [Google Scholar] [CrossRef]
  33. Sullivan, A.L. Wildland surface fire spread modelling, 1990–2007. 1: Physical and quasi-physical models. Int. J. Wildland Fire 2009, 18, 349. [Google Scholar] [CrossRef]
  34. Andrews, P.L. BEHAVE: Fire Behavior Prediction and Fuel Modeling System; General Technical Report Int-194; USDA Forest Service: Washington, DC, USA, 1986. [Google Scholar] [CrossRef]
  35. Finney, M.A. FARSITE: Fire Area Simulator—Model Development and Evaluation; Research Paper Rmrs-rp-4; USDA Forest Service, Rocky Mountain Research Station: Fort Collins, CO, USA, 1998. [Google Scholar] [CrossRef]
  36. Tymstra, C.; Bryce, R.; Wotton, B.; Taylor, S.; Armitage, O. Development and Structure of Prometheus: The Canadian Wildland Fire Growth Simulation Model; Information Report NOR-X-417; Natural Resources Canada, Canadian Forest Service, Northern Forestry Centre: Edmonton, AB, Canada, 2010. [Google Scholar]
  37. Ahmed, M.M.; Trouvé, A.; Forthofer, J.; Finney, M. Simulations of flaming combustion and flaming-to-smoldering transition in wildland fire spread at flame scale. Combust. Flame 2024, 262, 113370. [Google Scholar] [CrossRef]
  38. Coen, J.L.; Cameron, M.; Michalakes, J.; Patton, E.G.; Riggan, P.J.; Yedinak, K.M. WRF-Fire: Coupled Weather–Wildland Fire Modeling with the Weather Research and Forecasting Model. J. Appl. Meteorol. Climatol. 2013, 52, 16–38. [Google Scholar] [CrossRef]
  39. Dahl, N.; Xue, H.; Hu, X.; Xue, M. Coupled fire—Atmosphere modeling of wildland fire spread using DEVS-FIRE and ARPS. Nat. Hazards 2015, 77, 1013–1035. [Google Scholar] [CrossRef]
  40. Filippi, J.B.; Bosseur, F.; Pialat, X.; Santoni, P.A.; Strada, S.; Mari, C. Simulation of coupled fire/atmosphere interaction with the MesoNH-ForeFire models. J. Combust. 2011, 2011, 540390. [Google Scholar] [CrossRef]
  41. Rochoux, M.; Zhang, C.; Gollner, M.; Trouvé, A. Designing the Future of Wildfire Modeling. Int. Assoc. Wildland Fire 2017. Available online: https://www.iawfonline.org/article/designing-future-wildfire-modeling/ (accessed on 8 August 2025).
  42. Rochoux, M.C.; Emery, C.; Ricci, S.; Cuenot, B.; Trouvé, A. Towards predictive data-driven simulations of wildfire spread – Part II: Ensemble Kalman Filter for the state estimation of a front-tracking simulator of wildfire spread. Nat. Hazards Earth Syst. Sci. 2015, 15, 1721–1739. [Google Scholar] [CrossRef]
  43. Jain, P.; Coogan, S.C.P.; Subramanian, S.G.; Crowley, M.; Taylor, S.; Flannigan, M.D. A Review of Machine Learning Applications in Wildfire Science and Management. Environ. Rev. 2020, 28, 478–505. [Google Scholar] [CrossRef]
  44. Singh, H.; Ang, L.M.; Lewis, T.; Paudyal, D.; Acuna, M.; Srivastava, P.K.; Srivastava, S.K. Trending and emerging prospects of physics-based and ML-based wildfire spread models: A comprehensive review. J. For. Res. 2024, 35, 135. [Google Scholar] [CrossRef]
  45. Andrianarivony, H.S.; Akhloufi, M.A. Machine Learning and Deep Learning for Wildfire Spread Prediction: A Review. Fire 2024, 7, 482. [Google Scholar] [CrossRef]
  46. Xu, Y.; Li, D.; Ma, H.; Lin, R.; Zhang, F. Modeling Forest Fire Spread Using Machine Learning-Based Cellular Automata in a GIS Environment. Forests 2022, 13, 1974. [Google Scholar] [CrossRef]
  47. Finney, M.A.; Andrews, P.L. FARSITE—A program for fire growth simulation. Fire Manag. Notes 1999, 59, 13–15. [Google Scholar]
  48. Finney, M.A. An overview of FlamMap fire modeling capabilities. In Proceedings of the Fuels Management—How to Measure Success: Conference Proceedings, Portland, OR, USA, 28–30 March 2006; Proceedings RMRS-P-41. US Department of Agriculture, Forest Service, Rocky Mountain Research Station: Fort Collins, CO, USA, 2006; Volume 41, pp. 213–220. [Google Scholar]
  49. Fox-Hughes, P.; Bridge, C.; Faggian, N.; Jolly, C.; Matthews, S.; Ebert, E.; Jacobs, H.; Brown, B.; Bally, J. An evaluation of wildland fire simulators used operationally in Australia. Int. J. Wildland Fire 2024, 33, WF23028. [Google Scholar] [CrossRef]
  50. Crawl, D.; Block, J.; Lin, K.; Altintas, I. Firemap: A Dynamic Data-Driven Predictive Wildfire Modeling and Visualization Environment. Procedia Comput. Sci. 2017, 108, 2230–2239. [Google Scholar] [CrossRef]
  51. Cardil, A.; Monedero, S.; SeLegue, P.; Navarrete, M.A.; de Miguel, S.; Purdy, S.; Marshall, G.; Chavez, T.; Allison, K.; Quilez, R.; et al. Performance of operational fire spread models in California. Int. J. Wildland Fire 2023, 32, 1492–1502. [Google Scholar] [CrossRef]
  52. Asensio, M.; Ferragut, L. On a wildland fire model with radiation. Int. J. Numer. Methods Eng. 2002, 54, 137–157. [Google Scholar] [CrossRef]
  53. Asensio, M.; Cascón, J.; Prieto-Herráez, D.; Ferragut, L. An Historical Review of the Simplified Physical Fire Spread Model PhyFire: Model and Numerical Methods. Appl. Sci. 2023, 13, 2035. [Google Scholar] [CrossRef]
  54. Asensio, M.; Ferragut, L.; Simon, J. A convection model for fire spread simulation. Appl. Math. Lett. 2005, 18, 673–677. [Google Scholar] [CrossRef]
  55. Ferragut, L.; Asensio, M.; Cascón, J.; Prieto, D.; Ramírez, J. An efficient algorithm for solving a multi-layer convection-diffusion problem applied to air pollution problems. Adv. Eng. Softw. 2013, 65, 191–199. [Google Scholar] [CrossRef]
  56. Prieto-Herráez, D.; Sevilla, M.I.A.; Canals, L.F.; Barbero, J.M.C.; Rodríguez, A.M. A GIS-based fire spread simulator integrating a simplified physical wildland fire model and a wind field model. Int. J. Geogr. Inf. Sci. 2017, 1–22. [Google Scholar] [CrossRef]
  57. Asensio, M.I.; Ferragut, L.; Álvarez, D.; Laiz, P.; Cascón, J.M.; Prieto, D.; Pagnini, G. PhyFire: An Online GIS-Integrated Wildfire Spread Simulation Tool Based on a Semiphysical Model. In Applied Mathematics for Environmental Problems; Asensio, M.I., Oliver, A., Sarrate, J., Eds.; Springer: Cham, Switzerland, 2020; pp. 1–20. [Google Scholar]
  58. GDAL/OGR Contributors. GDAL/OGR Geospatial Data Abstraction Software Library; Open Source Geospatial Foundation: Beaverton, OR, USA, 2020; Available online: https://gdal.org (accessed on 8 August 2025).
  59. Cascón, J.; Ferragut, L.; Asensio, M.; Prieto, D.; Álvarez, D. Neptuno++: An adaptive finite element toolbox for numerical simulation of environmental problems. In Numerical Simulation in Physics and Engineering: Trends and Applications; Lecture Notes of the XVIII ‘Jacques-Louis Lions’ Spanish-French School; Springer: Berlin/Heidelberg, Germany, 2018. [Google Scholar]
  60. Anderson, H. Aids to Determining Fuel Models for Estimating Fire Behavior; Technical Report; USDA Forest Service: Ogden, UT, USA, 1982. [Google Scholar] [CrossRef]
  61. Ferragut, L.; Asensio, M.; Simon, J. High definition local adjustment model of 3D wind fields performing only 2D computations. Int. J. Numer. Methods Biomed. Eng. 2011, 27, 510–523. [Google Scholar] [CrossRef]
  62. Asensio, M.; Cascón, J.; Laiz, P.; Prieto-Herráez, D. Validating the effect of fuel moisture content by a multivalued operator in a simplified physical fire spread model. Environ. Model. Softw. 2023, 164, 105710. [Google Scholar] [CrossRef]
  63. Asensio-Sevilla, M.; Santos-Martín, M.; Álvarez León, D.; Ferragut-Canals, L. Global sensitivity analysis of fuel-type-dependent input variables of a simplified physical fire spread model. Math. Comput. Simul. 2020, 172, 33–44. [Google Scholar] [CrossRef]
  64. Arellano, S.; Arellano, S.; Vega, J.; Ruíz, A.; Arellano, A.; Álvarez, J.; Vega, D. Foto-Guía de Combustibles Forestales de Galicia: Versión I; Andavira: Galicia, España, 2016. [Google Scholar]
  65. Meta Platforms, Inc. React—The Library for Web and Native User Interfaces. 2011. Available online: https://react.dev (accessed on 18 July 2025).
  66. MetaCarta. OpenLayers. 2006. Available online: https://openlayers.org/ (accessed on 18 July 2025).
  67. Microsoft Corporation. Azure Maps Tile API: Aerial and Road Imagery. 2023. Available online: https://learn.microsoft.com/en-us/rest/api/maps/render/get-map-tile?view=rest-maps-2025-01-01&tabs=HTTP (accessed on 18 July 2025).
  68. OpenStreetMap Contributors. OpenStreetMap. Map Tiles Accessed via QGIS as XYZ Layer. 2025. Available online: https://www.openstreetmap.org (accessed on 18 July 2025).
  69. Esri. ArcGIS Online. Plataforma SIG en la Nube. 2025. Available online: https://www.arcgis.com/ (accessed on 18 July 2025).
  70. CLMS. Very High Resolution Image Mosaic 2021—True Colour (2 m). 2021. Available online: https://land.copernicus.eu/en/products/european-image-mosaic/very-high-resolution-image-mosaic-2021-true-colour-2m (accessed on 18 July 2025).
  71. European Space Agency. Copernicus DEM—Global and European Digital Elevation Model. Copernicus Data Space Ecosystem. 2023. Available online: https://dataspace.copernicus.eu/explore-data/data-collections/copernicus-contributing-missions/collections-description/COP-DEM (accessed on 18 July 2025).
  72. EFFIS—European Forest Fire Information System. Copernicus EFFIS—Data and Services. 2024. Available online: https://forest-fire.emergency.copernicus.eu/applications/data-and-services (accessed on 18 July 2025).
  73. Instituto Geográfico Nacional. Plan Nacional de Ortofotografía Aérea (PNOA). 2024. Available online: https://pnoa.ign.es/ (accessed on 15 June 2025).
  74. Muñoz-Sabater, J.; Dutra, E.; Agustí-Panareda, A.; Albergel, C.; Arduini, G.; Balsamo, G.; Boussetta, S.; Choulga, M.; Harrigan, S.; Hersbach, H.; et al. ERA5-Land: A state-of-the-art global reanalysis dataset for land applications. Earth Syst. Sci. Data 2021, 13, 4349–4383. [Google Scholar] [CrossRef]
  75. Junta de Castilla y León. Incendios Forestales—Datos Abiertos Castilla y León. 2024. Available online: https://analisis.datosabiertos.jcyl.es/explore/dataset/incendios-forestales/information/ (accessed on 18 July 2025).
  76. Filippi, J.; Mallet, V.; Nader, B. Representation and evaluation of wildfire propagation simulations. Int. J. Wildland Fire 2014, 23, 46–57. [Google Scholar] [CrossRef]
Figure 1. Client–server scheme. Architecture of the SINUMCC simulation system based on a client–server model. The client side consists of a web interface for simulation configuration and result visualization. The server side includes the SINUMCC Web Service, a database, an internal map server, and the SINUMCC Simulation Toolset, which manages preprocessing, simulation execution, and postprocessing. The toolset integrates the HDWind, PhyFire, and PhyNX models. A shared data repository stores configuration files, spatial datasets, and simulation outputs.
Fire 08 00366 g001
Figure 2. Conceptual diagram of the integrated simulation framework composed of the three coupled physical models HDWind, PhyFire, and PhyNX. The system reads meteorological and cartographic input data, including wind intensity and direction, ambient temperature, relative humidity, DEM, fuel type, and fuel presence. HDWind computes a fully 3D wind field; it computes 2D wind fields at multiple vertical levels within the configured atmospheric layer and also the vertical wind component. The lowest-level wind field feeds into PhyFire to simulate fire propagation under realistic wind conditions, while the whole 3D wind field is used by PhyNX for 3D smoke dispersion. PhyFire calculates the burning and burned areas and estimates fuel consumption, which defines the lower boundary condition for PhyNX based on calibrated emission factors. Final outputs include 3D wind and smoke fields, active fire fronts, burned areas, and summary statistics.
Fire 08 00366 g002
Figure 3. Screenshot visualization outputs from the WebGIS platform corresponding to the simulation results, with cartographic elements (scale, orientation arrow, and coordinate system) omitted to avoid misinterpretation. (a) Simulated wind field and burned and burning areas with associated fire spread statistics and the actual final fire perimeter from the upload file. (b) Smoke concentration at ground level (0 m). Smoke plume dispersion is governed by the wind field simulated using the HDWind model.
Fire 08 00366 g003
Table 1. Model parameters. The table lists the parameters used in different submodels (column Model) along with their physical meaning (Parameter), corresponding symbol (Symbol), and units of measurement (Units). Parameters are grouped into main parameters and fuel type-dependent parameters.
Main Parameters
ModelParameterSymbolUnits
HDWindBuoyancy force coefficient λ
HDWindSmoothing function coefficient ϵ
HDWindRegularization term coefficient γ
PhyFireRadiation absorption coefficientam−1
PhyFireConvective correction factor β
PhyFireNatural convection coefficientHJs−1m−2K−1
PhyNXHorizontal dispersion coefficient K h m2  s−1
PhyNXVertical dispersion coefficient K v m2  s−1
Fuel-Type-Dependent Parameters
Model Parameter Symbol Units
HDWindRoughness index z 0 m
PhyFireHeat capacityCJ K−1 kg−1
PhyFireMaximum initial fuel load M 0 kg m 2
PhyFireFuel moisture content M v kg water/kg fuel
PhyFireMaximum flame temperature T f , m a x K
PhyFirePyrolysis temperature T p K
PhyFireCombustion half-life t 1 / 2 s
PhyFireFlame length independent factor F H m
PhyFireFlame length wind correction factor F v m1/2s1/2
PhyFireFlame length slope correction factor F s
PhyNXEmission factor F e
Table 2. Comparison of major WebGIS-based wildfire simulation tools. Summary of selected wildfire simulation platforms based on core technical and operational features: model type, wind and fire interaction approach, inclusion of smoke dispersion, support for 3D output, WebGIS integration, and the ability to edit fuel maps. The column referring to wind–fire interaction distinguishes between systems with one-way coupling, where wind affects fire behavior without feedback, and two-way coupling, where fire behavior can also influence local wind conditions.
Comparison of Web-Based Wildfire Simulation Tools
Simulation Tool Model Type Wind–Fire Coupling Smoke Dispersion 3D Capability WebGIS Support Fuel Editability
SINUMCCQuasi-
physical
1-way (2-way
planned)
YesYesYesYes
FARSITE /
FlamMap
Quasi-
empirical
NoNoLimitedNoLimited
WRF-
Fire
Physical2-wayYesYesNoNo
ForeFire /
MesoNH
Physical2-wayYesYesNoNo
SPARKQuasi-
physical
1-wayNoYesYesLimited
FireMap /
WIFIRE
EmpiricalLimitedNoNoYes (limited)No
ARPS /
DEVS-FIRE
Quasi-
physical
2-wayNo (planned)YesNoNo
Wildfire Analyst
Web
Quasi-
empirical
1-wayLimitedYesYes (WPS-based)Yes
Table 3. Summary of weaknesses and implications of the simulation platform, grouped into the technical, data, and user domains.
AreaWeaknessesImplications/Ongoing Research
TechnicalOne-way coupling (wind → fire → smoke)1. Limits ability to reproduce fire–atmosphere interactions
2. Full two-way coupling is subject to conditions
DataLimited availability of updated input data
(fuel, meteorology, topography)
1. Data quality limits simulation accuracy
2. Updated fuel map generation from satellite data
UserPlatform usability depends on Internet connection
and browser performance
1. May limit access in low-connectivity areas
2. Requires stable connection for smooth visualization
Disclaimer/Publisher’s Note: The statements, opinions and data contained in all publications are solely those of the individual author(s) and contributor(s) and not of MDPI and/or the editor(s). MDPI and/or the editor(s) disclaim responsibility for any injury to people or property resulting from any ideas, methods, instructions or products referred to in the content.

