Article

Asymmetric Flow Induced by the Longitudinal Position of the Fire Source Under Different Ambient Pressures

1
School of Thermal Engineering, Shandong Jianzhu University, Jinan 250101, China
2
Centre for Building, Construction & Tropical Architecture (BuCTA), Faculty of Built Environment, Universiti Malaya, Kuala Lumpur 50603, Malaysia
*
Authors to whom correspondence should be addressed.
Fire 2025, 8(9), 364; https://doi.org/10.3390/fire8090364
Submission received: 13 August 2025 / Revised: 11 September 2025 / Accepted: 12 September 2025 / Published: 14 September 2025

Abstract

This research examined how ambient pressure impacts the asymmetrical flow effects of fire induced under natural ventilation. Numerical simulations using Fire Dynamics Simulator (FDS) software were conducted, altering the longitudinal positions of fire sources and ambient pressure. The findings reveal that ambient pressure impacts the movement of smoke and air within the tunnel, with both outgoing smoke and incoming air increasing as ambient pressure rises. Asymmetric flow, influenced by the fire source’s longitudinal position, is observed under different ambient pressures. The intensity of these asymmetric flow effects can be characterized by the parameter of induced longitudinal flow mass rate, m i . A dimensionless ambient pressure, P*, was introduced to assess its impact on longitudinal flow’s induction, leading to the development of a predictive model for calculating the m i . While ambient pressure affects the mass flow values of smoke and airflow in tunnel fires under natural ventilation, it has minimal impact on their fundamental distribution patterns. A predictive model has been proposed for the distribution patterns of smoke overflow and air inflow under various ambient pressures.

1. Introduction

The advancement of the transportation industry has spurred a rise in tunnel construction. While tunnels enhance transportation efficiency, they also present considerable safety hazards. Tunnel fires are especially hazardous due to their elongated and confined geometry [1]. During a fire incident, heated, toxic smoke propagates rapidly and extensively throughout the structure, thereby impeding the safe evacuation of building occupants and significantly complicating firefighting operations to extinguish the conflagration [2]. A comprehensive understanding of smoke movement characteristics is fundamental to structural fire prevention, efficient smoke control, and ensuring safe evacuation [3].
A tunnel fire under natural ventilation represents the primary fire scenario and serves as the foundation for analyzing fire smoke transport characteristics under various ventilation conditions. In naturally ventilated horizontal tunnels, the fire’s longitudinal position significantly affects smoke and airflow’s distribution [4]. A centrally located fire causes smoke to spread symmetrically both upstream and downstream [5]. Conversely, when the fire is not centrally located, Yu et al. [4] and He et al. [6] conducted numerical simulations revealing that smoke diffuses unevenly in both directions; that is, asymmetric flow occurred. The mass flow rate that induces longitudinal flow quantifies the intensity of these asymmetric flow effects. Yu et al. [4] analyzed the effects of tunnel length, fire source power, and cross-sectional aspect ratio and proposed an empirical model to calculate induced longitudinal flow. More recently, researchers have also focused on the longitudinal induced flow influenced by the combined effects of fire source position and tunnel inclination [7,8].
The aforementioned research is invaluable in elucidating the mechanisms of smoke transport characteristics in naturally ventilated tunnel fires. Nevertheless, these investigations were performed in tunnels under standard atmospheric pressure. As tunnels continue to be constructed in high-altitude regions [9,10], the impact of low-pressure environments on the transport of fire smoke has garnered the attention of scholars [11,12,13]. Tang et al. [14] conducted a numerical study on the differences in longitudinal distribution of CO concentration and temperature in smoke flow from tunnel fires under varying pressure conditions. The results demonstrate that the longitudinal decay rate of CO concentration remains unaffected by ambient pressure, whereas the longitudinal attenuation of temperature occurs more rapidly under reduced pressure. Yan et al.’s full-scale tunnel fire experiments confirm that smoke gas temperature decreases more rapidly under reduced pressure conditions [11] in high-altitude regions [11]. Ji et al. [12] investigated tunnel fire smoke transport at ambient pressures of 50 to 100 kPa and created a quantitative model to predict the average smoke mass flow rate during one-dimensional diffusion, using ambient pressure and heat release rate (HRR) as key parameters. Furthermore, several researchers have examined the impact of ambient pressure on smoke movement velocity [15], smoke layer thickness [13], and the plug-holing phenomenon [16] in tunnel fires.
These studies clearly demonstrate that ambient pressure significantly affects smoke movement in tunnel fires. However, current research has inadequately explored the impact of ambient pressure on asymmetric flow caused by the longitudinal positioning of the fire source. In this study, a series of numerical calculations were performed using FDS (Fire Dynamics Simulator) software, varying the longitudinal positions of fire sources and ambient pressure. This study primarily examined the asymmetric flow effect, the resulting longitudinal flow, and the dispersion of smoke and air mass. A predictive model was developed to calculate the induced longitudinal mass flow rate using simulation data. Furthermore, a predictive model was formulated to determine the distribution patterns of smoke overflow and air inflow under varying ambient pressures. These findings aim to inform fire detection and smoke control systems for tunnel fires in high-altitude regions.

2. Materials and Methods

2.1. FDS Model

The FDS is a computational model for simulating fire-induced fluid dynamics. The FDS has been widely applied in the research of tunnel fire and fire smoke control [17,18,19,20,21], with its reliability thoroughly validated [22,23]. Consequently, the FDS (version 6.7) incorporating LES was utilized in the present study. A full-scale tunnel model measuring 500 m in length (L), 10 m in width (W), and 5 m in height (H) was constructed in the FDS, as shown in Figure 1. Six longitudinal fire source positions were assessed, each 40 m apart, starting 50 m from the tunnel’s left portal and extending to its midpoint. L u and L d denote the distances from the fire source to the tunnel’s left and right openings, respectively. Flow measuring devices were placed every 10 m to record the longitudinal mass flow rate in the tunnel, as shown in Figure 1.

2.2. Boundary Condition

As illustrated in Figure 1, to achieve high-fidelity simulation results, the computational domain was expanded bilaterally at the tunnel’s extremities. The computing domain extended to dimensions of 10 m in length, width, and height, with boundaries labeled as ‘OPEN’. To replicate typical road tunnel fire scenarios involving a car burning [24], the fire’s HRR was established at 5 MW. Considering the most unfavorable conditions, simulations considered quasi-steady state conditions with a fixed HRR. The combustion source measured 2 m by 2 m. The upper surface of the combustion source, termed the ‘BURNER’, utilized heptane as fuel and radiative fraction, soot/CO yields using default values. [25]. The tunnel’s wall material, encompassing ceilings, floors, and walls, was specified as ‘CONCRETE’. The thermophysical properties of this material are consistent with those in reference [26]. Considering the tunnels in high-altitude areas of Western China, such as the Baimang Snow Mountain Tunnel No.1 in Yunnan Province, the ambient pressure at the site was approximately 62.63 kPa [11]. To encompass a broader spectrum of environmental pressure conditions, we designated 60 kPa, 70 kPa, 80 kPa, 90 kPa, and 101 kPa as the pressure parameters for our study to analyze their influence on smoke propagation in tunnel environments. It is noteworthy that although ambient temperature fluctuates with altitude, according to Ji et al.’s research [3], an initial ambient temperature of 20 °C is considered appropriate. The smoke concentration was set to zero. Preliminary simulations indicate that an 800 s duration is adequate to achieve quasi-steady state conditions for smoke dispersion. Figure 2 takes the case of a fire source located in the middle of a tunnel under normal atmospheric pressure as an example, and it shows the changes in mass flow (black line) near the upstream exit of the tunnel and the temperature (blue line) directly above the fire source over time. As shown in the figure, the simulation has reached a quasi-stable state by 800 s. Table 1 enumerates all simulation cases pertinent to this study.
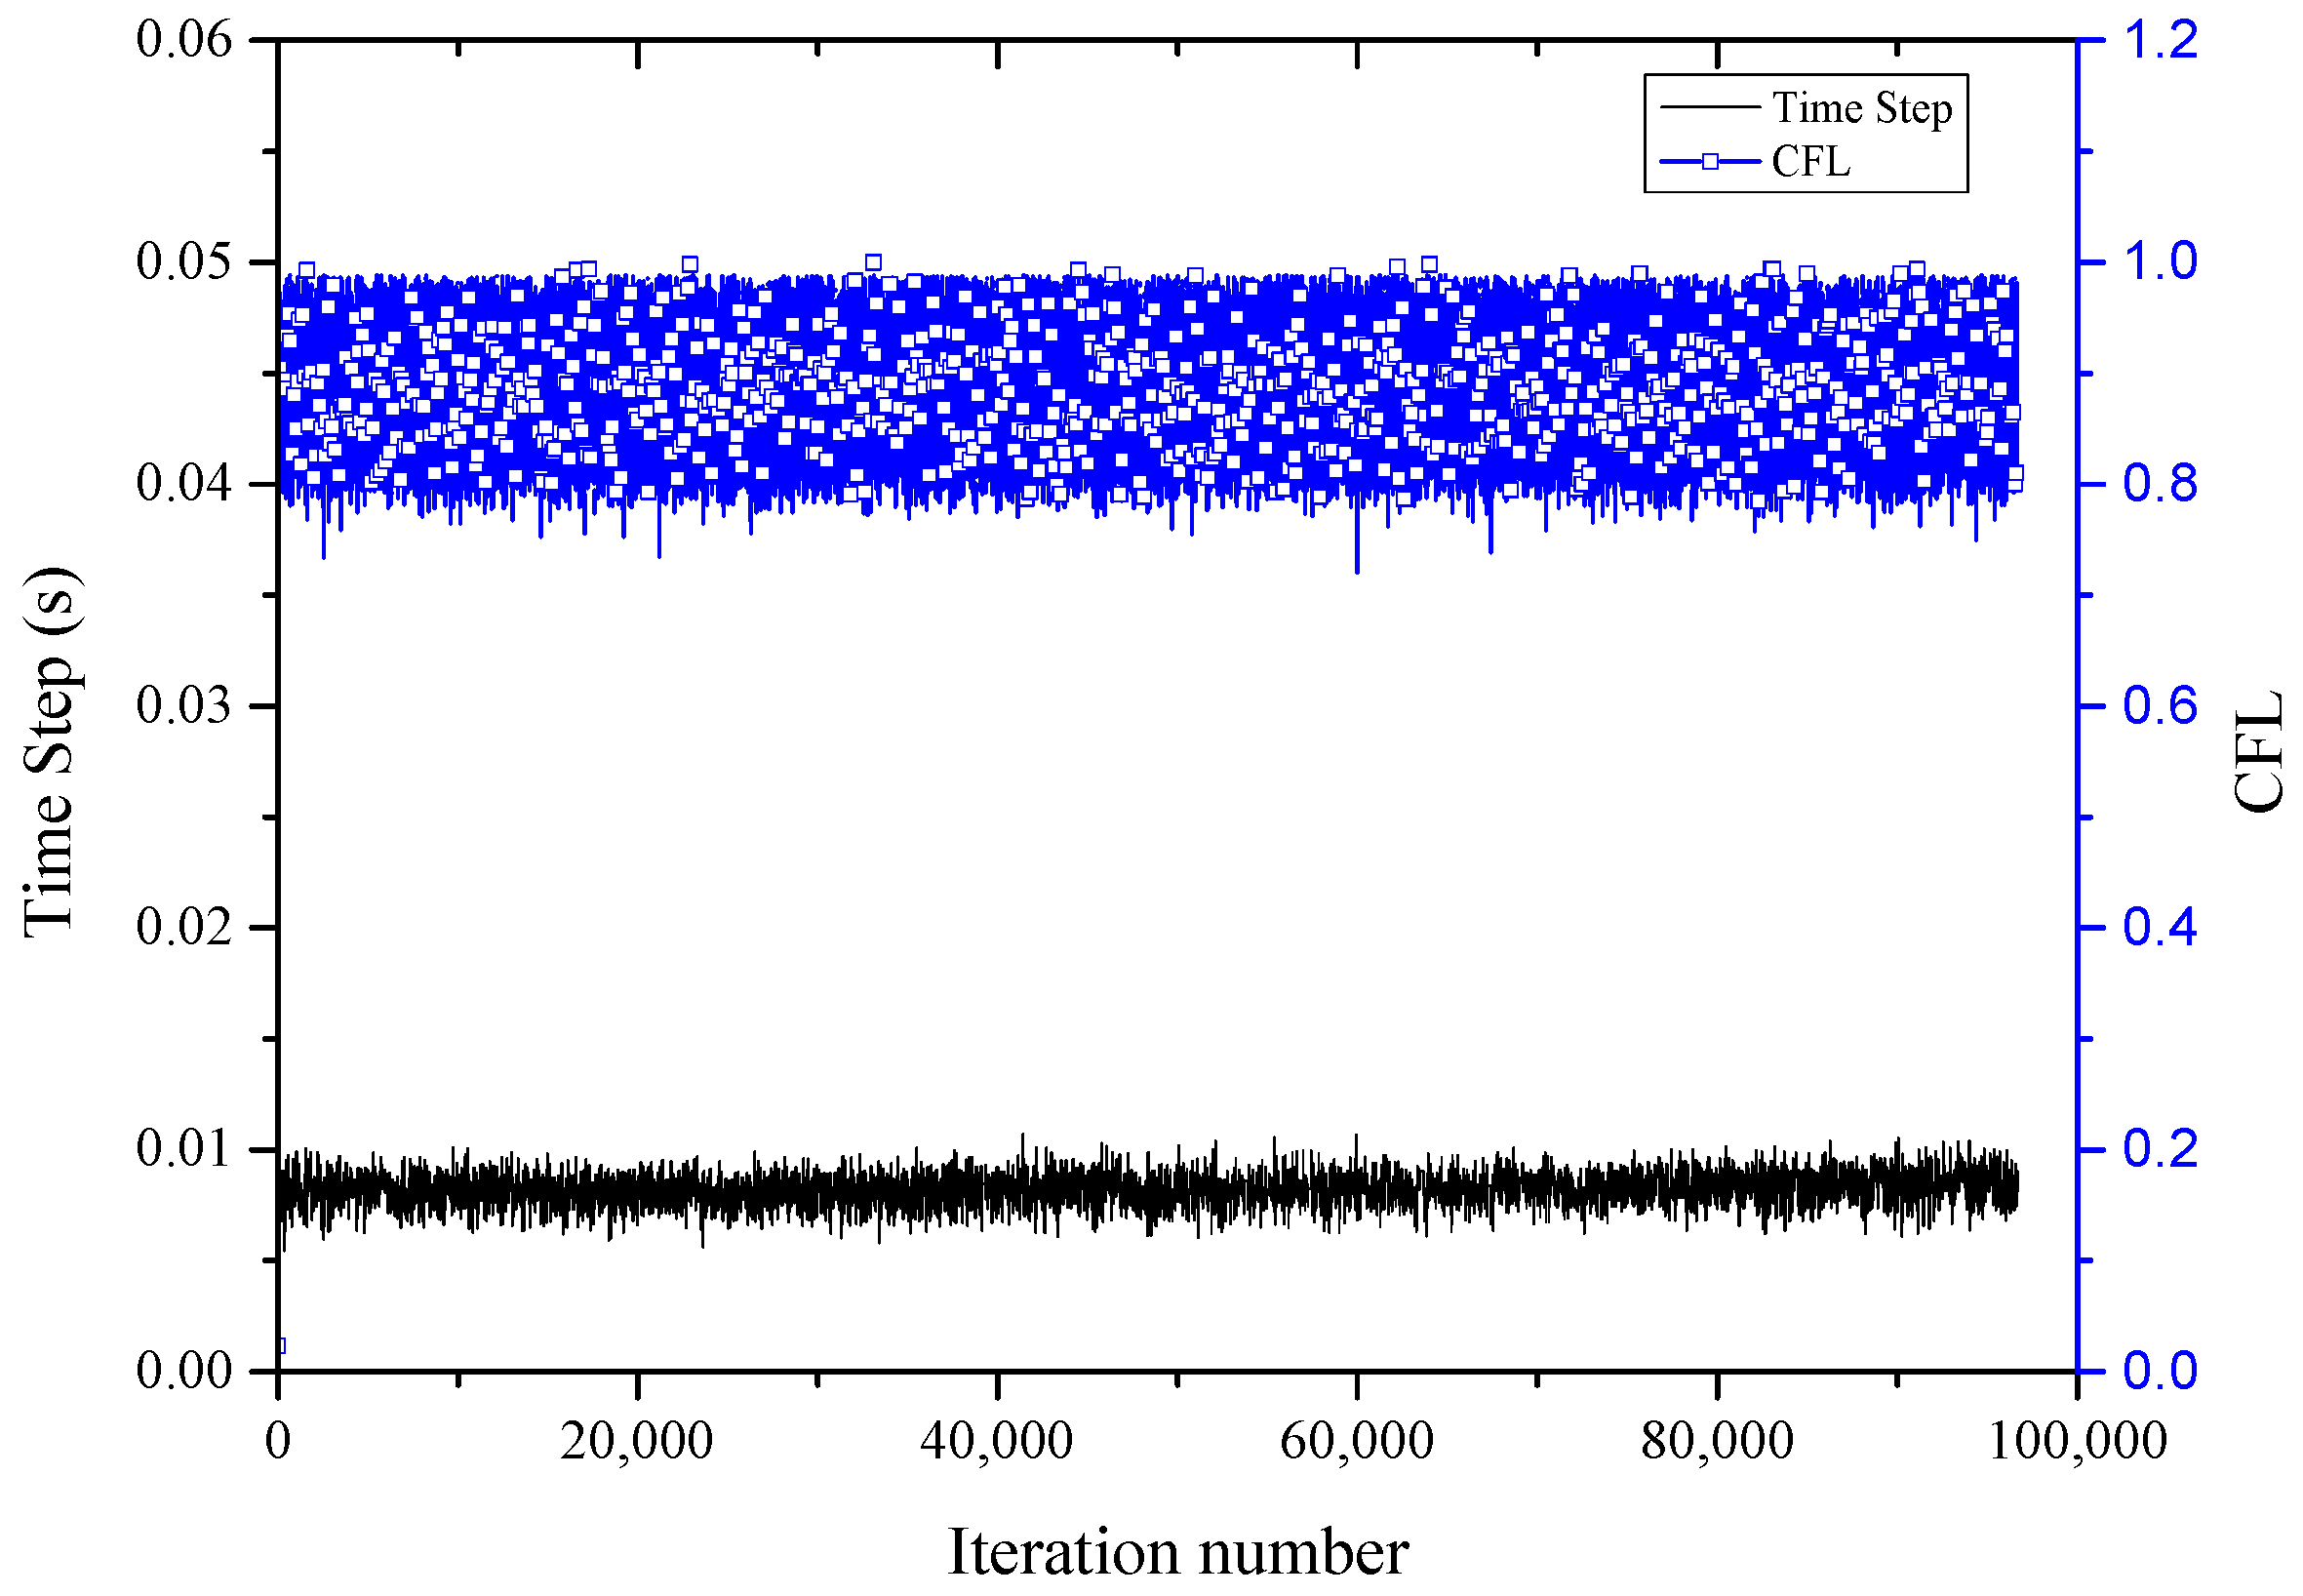
The Courant–Friedrichs–Lewy (CFL) criterion was utilized in the FDS to validate the convergence of the numerical solution. Figure 3 shows the time step and CFL during the simulation process. The time steps remain stable at approximately 0.005–0.010 s, and the CFL numbers are below the critical value of 1. Consequently, the CFL convergence criterion is satisfied.

2.3. Mesh Systeml

The grid size represents a critical parameter in FDS simulations. The grid resolution is typically assessed by the ratio of the fire source’s characteristic diameter to the grid size, with a suggested range of 4 to 16. The characteristic diameter of the fire source, D * , is expressed as Equation (1) [27]:
D * = Q / ρ a c p T a g 1 / 2 2 / 5
where ρ a represents ambient air density, Q denotes heat release rate, T a signifies ambient temperature, c p indicates specific heat capacity, and g refers to gravitational acceleration.
It should be noted that Equation (1) is applicable to normal atmospheric pressure. For low atmospheric pressure environments, air density will change. By approximating air as an ideal gas and substituting the equation ρ a = P M / R T a into Equation (1), Equation (2) can be obtained [28]:
D * = Q R / P M c p g 1 / 2 2 / 5
where R represents the ideal gas constant, M indicates the molar mass of air, and P denotes the ambient pressure.
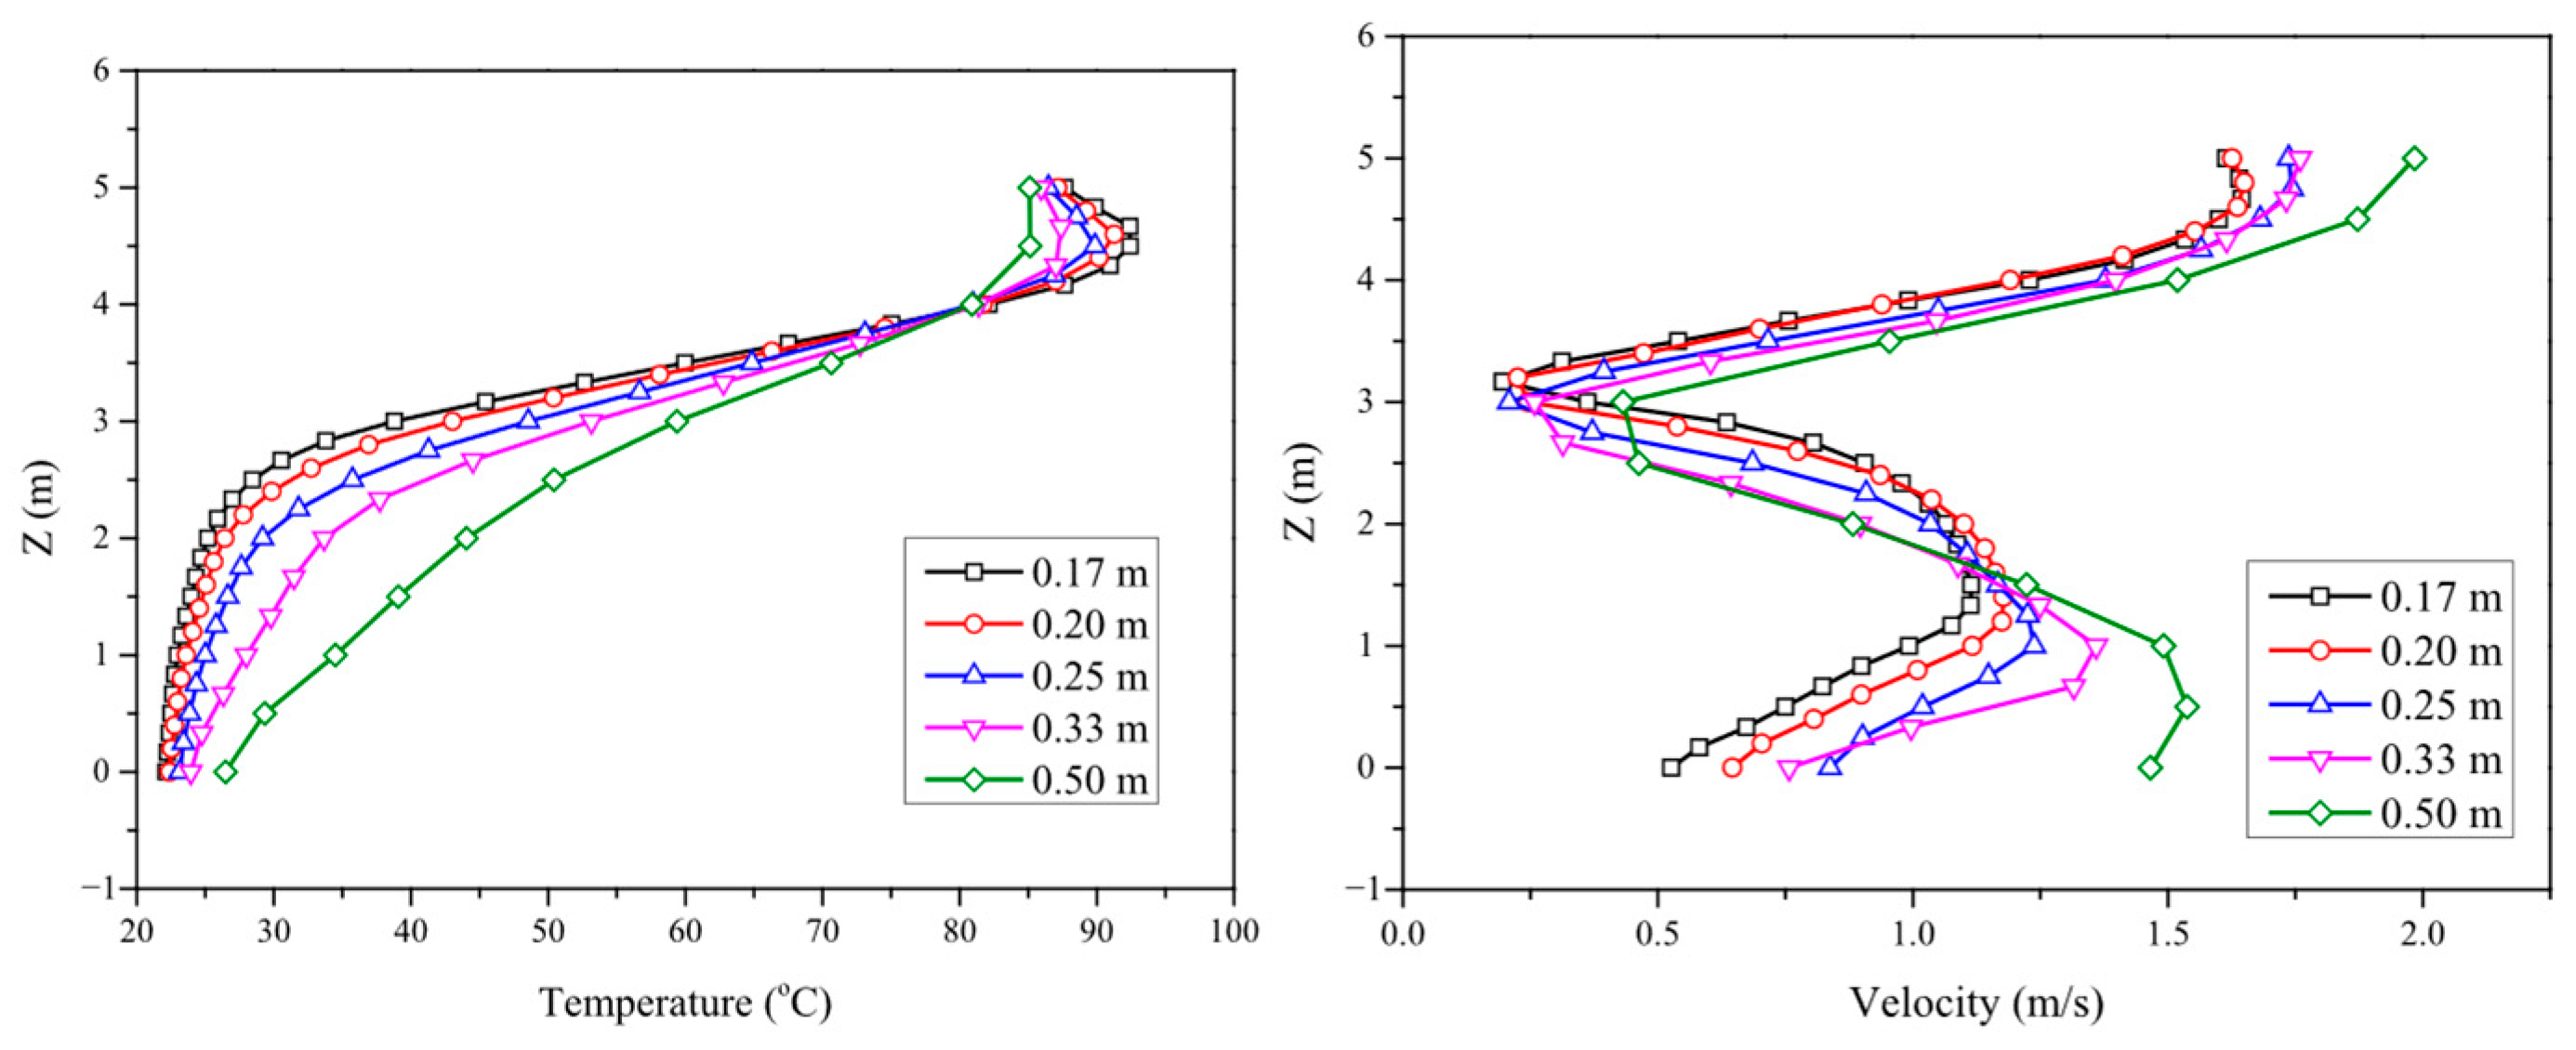
According to Equations (1) and (2), when the heat release rate of the fire source is 5 MW, the recommended grid sizes for normal pressure and low pressure (60 kPa) are 0.11 to 0.46 m and 0.13 to 0.54 m, respectively. These indicate that a higher grid resolution is required under normal pressure conditions compared to low pressure. Consequently, grids that are suitable for normal pressure applications are also suitable for low environmental pressure scenarios. Therefore, using the scenario with a central tunnel fire source as an example, five grid sizes (0.50, 0.33, 0.25, 0.20, and 0.17 m) were selected from the recommended range for comparative analysis. The vertical temperature and vertical velocity distributions at a distance of 40 m (x = 290, y = 0) from the fire source are presented in Figure 4. As the grid size diminishes, the resulting curves tend to become more uniform. Reducing the grid size below 0.2 m did not yield significant improvements, but it did increase the computation time. Consequently, the grid size of all simulation cases in this study is 0.2 m, and the total simulated grid size reaches 3,375,000.

2.4. Validation

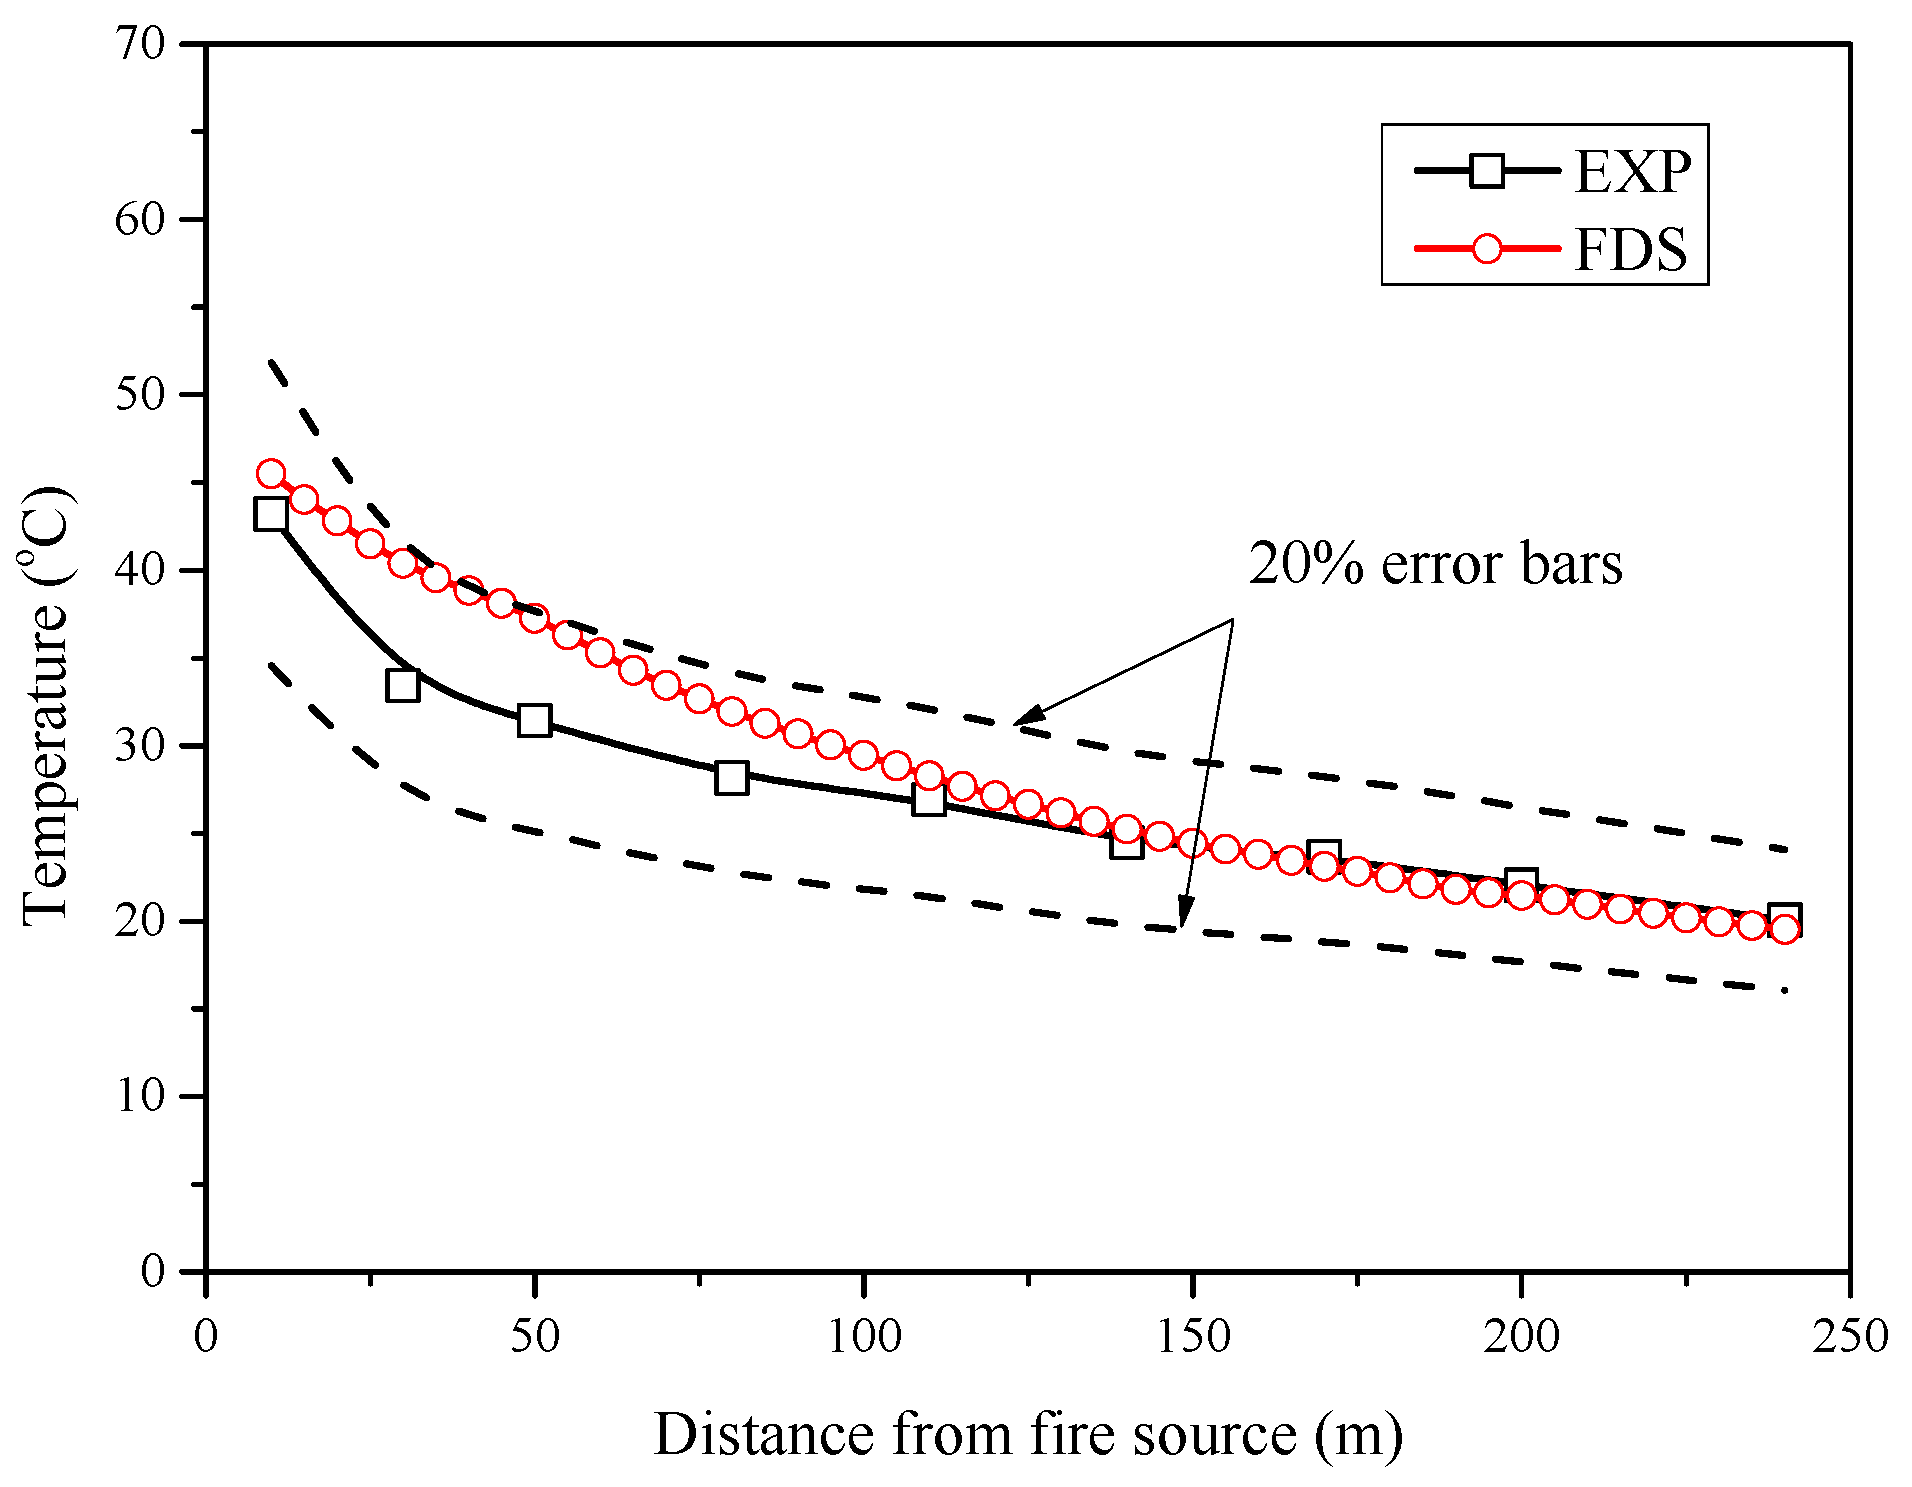
The efficacy and precision of FDS simulations for tunnel fires under natural ventilation conditions have been substantiated through extensive research [29,30]. This section draws on data from on-site experiments by Yan et al. [11] to validate the suitability and accuracy of FDS in low-pressure environments. The research team conducted on-site experiments in a high-altitude road tunnel at 4100 m, with an atmospheric pressure of 62.63 kPa. We selected Test 3 from their study and reproduced it using FDS simulations. In the current work, FDS simulations were utilized to replicate the experimental conditions. Figure 5 illustrates both the simulated and experimental results pertaining to the temperature distribution. While the temperature decay near the fire source decreases slightly more rapidly, the overall trend remains consistent, with the experimental and simulation data aligning closely, with an error of no more than 20%. The FDS is capable of analyzing the tunnel fire in low atmospheric pressure environments. This indicates that using the FDS to study the impact of ambient pressure on thermal smoke movement in naturally ventilated tunnels is both methodologically robust and effective.

3. Results and Discussions

3.1. Asymmetric Flow Under Different Ambient Pressures

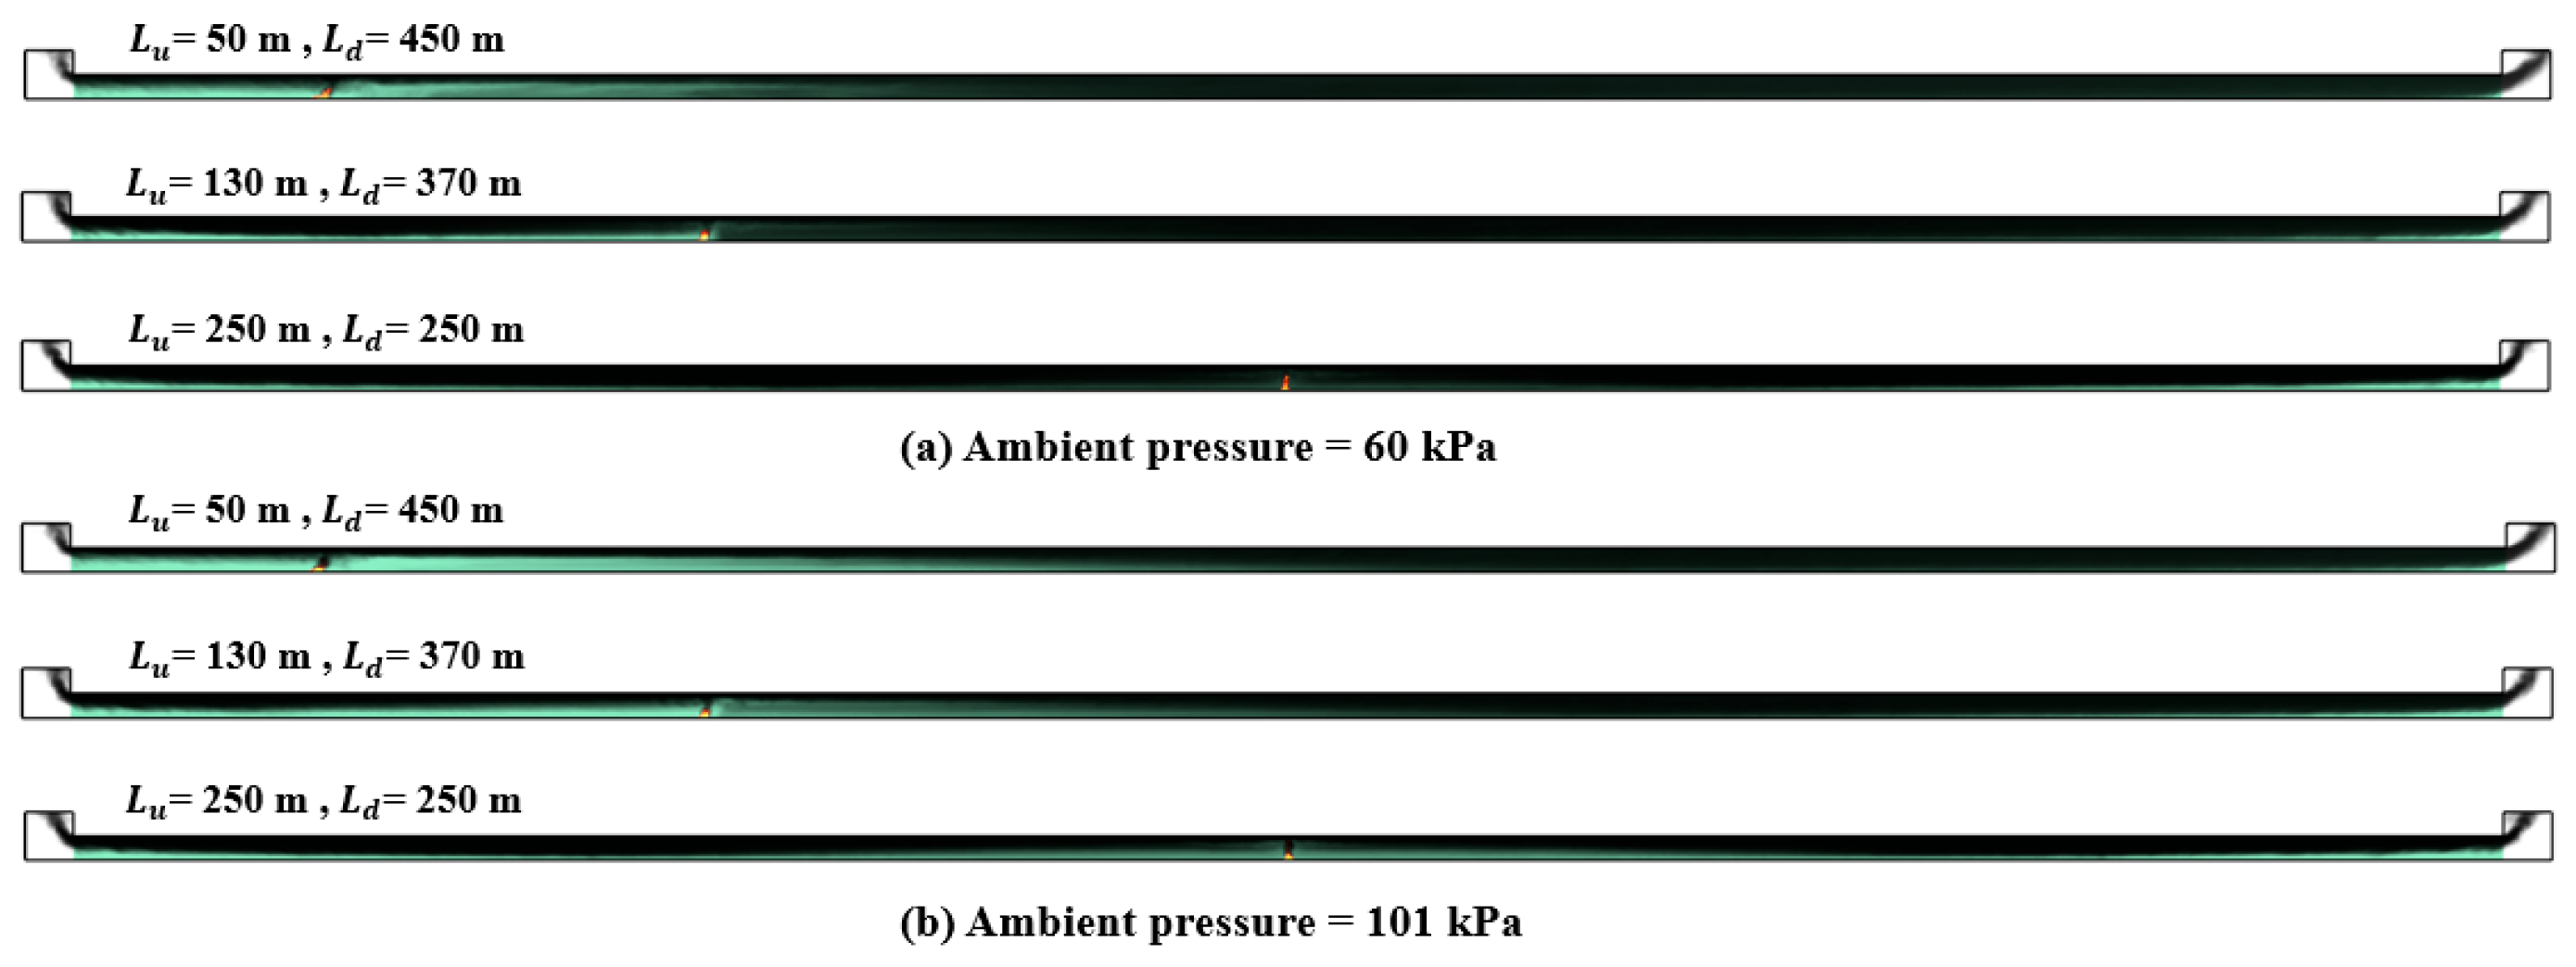
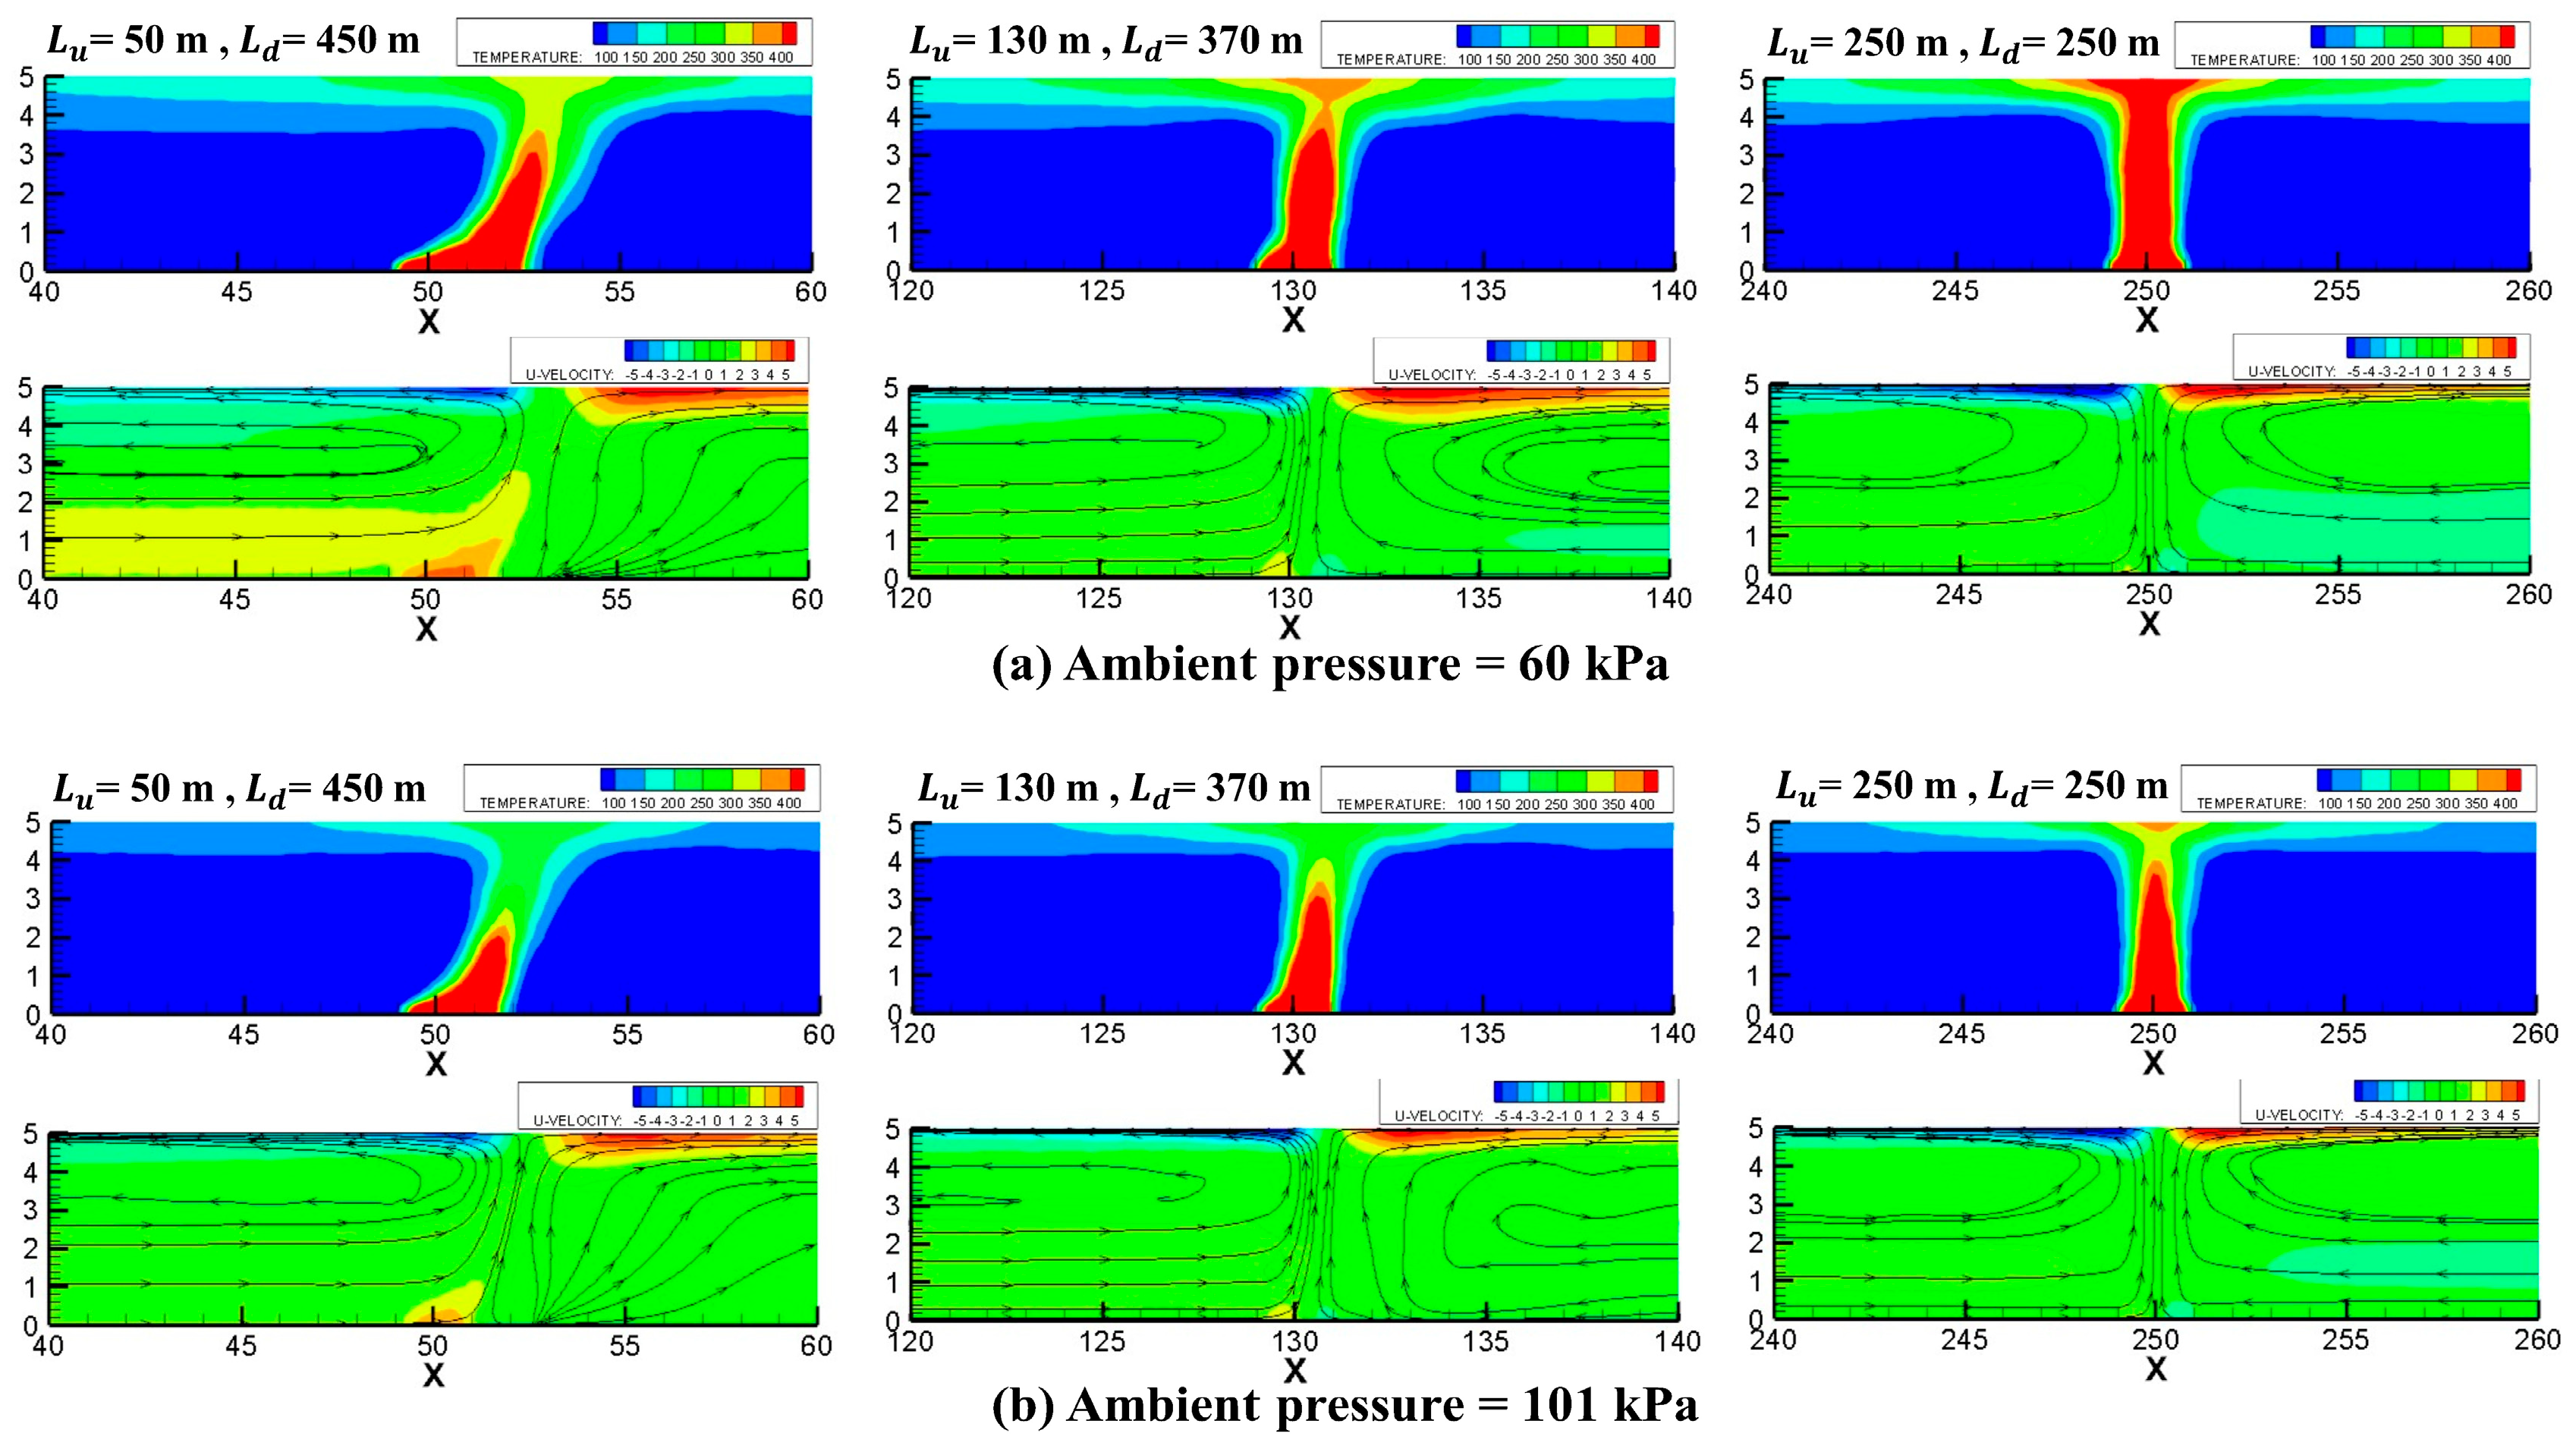
Previous studies [4,6] have shown that different longitudinal positions of fire sources can cause asymmetric flow inside tunnels under normal ambient pressure. The current work mainly focuses on the impact of ambient pressure on the asymmetric flow caused by the longitudinal location of fire sources. Figure 6 depicts the smoke flow field at different longitudinal fire source positions, exemplified by ambient pressures of 60 and 101 kPa. Observations indicate that the diffusion patterns of smoke is similar under both normal and low ambient pressure conditions. Specifically, the smoke layer will descend as it spreads towards the tunnel entrance. When the tunnel’s upstream and downstream sections are of equal length ( L u = L d ), the smoke flow distribution on either side of the fire source is symmetrical; However, when the fire source was not centrally located in the tunnel, smoke distribution was uneven between the upstream and downstream sections. The closer the fire source is to the tunnel portal, so the uneven distribution becomes increasingly strong.
To further illustrate the asymmetric flow phenomenon, Figure 7 presents the average temperature field and u velocity field in proximity to the fire source for the six selected scenarios depicted in Figure 6. Significant flame tilt is observable under both normal and reduced ambient pressures, with the temperature and velocity fields demonstrating asymmetric distributions. Specifically, when the upstream section length is shorter than the downstream section length, the flame deflects in the downstream direction. The flame’s inclination angle rises as the difference in length between the tunnel’s upstream and downstream sections increases. This indicates that the distribution of incoming air and emitted smoke is uneven, which means that the flow field is asymmetric. Additionally, in low-pressure environments, temperatures near the fire source surpass those recorded under standard atmospheric pressure, aligning with prior research [9]. This may be because the degree of air entrainment varies under different ambient pressures. The difference in air entrainment intensity may also lead to different intensities of asymmetric flow.
A schematic diagram of asymmetric air and smoke flow fields in tunnel fires is shown in Figure 8. During a fire incident, the flow field within the tunnel stratifies into an upper layer consisting of hot smoke and a lower layer comprising cold air. Driven by pressure, fresh air enters the tunnel from the entrance and moves towards the fire source in the lower section, while buoyancy causes hot smoke in the upper section to flow from the fire source back to the tunnel entrance [6], as illustrated in Figure 8. The m s and m a are defined as the mass flow rates of hot smoke and cold air, respectively. m s u and m s d denote the mass flow rates of smoke diffusion upstream and downstream of the fire source, while m a u and m a d indicate the mass flow rates of cold air entering the tunnel from upstream and downstream.
Figure 9 depicts the changes in mass flow rate distribution for smoke exiting through both upstream and downstream portals, as well as fresh air entrainment into the tunnel, under the six selected scenarios previously presented in Figure 6.
When the fire source is off-center inside the tunnel, the mass flow rate of smoke propagating upstream is observed to be less than that flowing downstream, which satisfies the relationship expressed in Equation (3):
m s u < m s d
Simultaneously, as described in Equation (4), the air mass flow rate at the upstream tunnel entrance surpasses that at the downstream entrance.
m a u > m a d
Owing to mass conservation, and excluding the mass of combustion products from the fire source [4], the mass of smoke exiting through the tunnel opening is equivalent to the mass of fresh air entering the tunnel through the tunnel opening. This relationship is expressed in Equation (5):
m s u + m s d = m a u + m a d
By combining Equations (3) and (5), Equation (6) can be obtained:
m s u m a u = m a d m s d > 0
Consequently, the longitudinal mass flow rate induced by asymmetric flow effects is defined as Equation (7) [4]:
m i = m s u m a u = m a d m s d
Moreover, Figure 9 illustrates that at both normal and low ambient pressures, the m i decreases as the distance from the tunnel’s upstream portal to the fire source increases. When the fire source is centrally located within the tunnel, m i = 0 . Thus, the magnitude of the m i characterizes the intensity of the asymmetric flow effect [4]. Under the same longitudinal fire source position, the m i in normal ambient pressures is greater than that in low ambient pressures. The impact of different ambient pressures on m i will be discussed in more detail in the following chapters.

3.2. The Impact of Ambient Pressure on m i

As previously stated,   m i decreases as the distance from the tunnel’s upstream portal to the fire source increases. In fact, the distance from the upstream portal to the fire source is determined by the difference in length between the tunnel’s upstream and downstream sections ( L = L d L u ), which primarily influences the variation in m i . Figure 10 illustrates how m i varies with L under varying ambient pressures. On the one hand, under an identical environmental pressure, the m i increases with a rise in the L , aligning with previous findings at standard ambient pressure [4]. On the other hand, at the same longitudinal fire source position, the m i increases with increasing ambient pressure. At an ambient pressure of 60 kPa, the induced longitudinal flow is 10.33 kg/s, when the length difference between upstream and downstream is 240 m. As the environmental pressure increases to 70 kPa, 80 kPa, 90 kPa, and 101 kPa, the induced longitudinal flow subsequently increases to 11.94 kg/s, 13.27 kg/s, 15.10 kg/s, and 16.93 kg/s, respectively. This may be because under low ambient pressure, the entrainment coefficient of smoke is smaller than under normal ambient pressure [11].
Yu et al.’s research [4] indicates that at standard ambient pressure, the dimensionless induced longitudinal mass flow rate ( m i * ) is mainly influenced by the dimensionless length difference between the tunnel’s upstream and downstream sections ( L * = L / L ). A predictive model has been developed, represented by Equation (8):
m i * = 0.23 L *
The dimensionless induced longitudinal mass flow rate is characterized as Equation (9).
m i * = m i / ρ a A g H 1 / 2 Q c * 1 / 3
The convective heat release rate, denoted as Q c * = Q c / ρ a c p T a g 1 / 2 H 5 / 2 , is generally calculated using the formula Q c = 0.7 Q . A ( A = W H ) denotes the tunnel cross-section area.
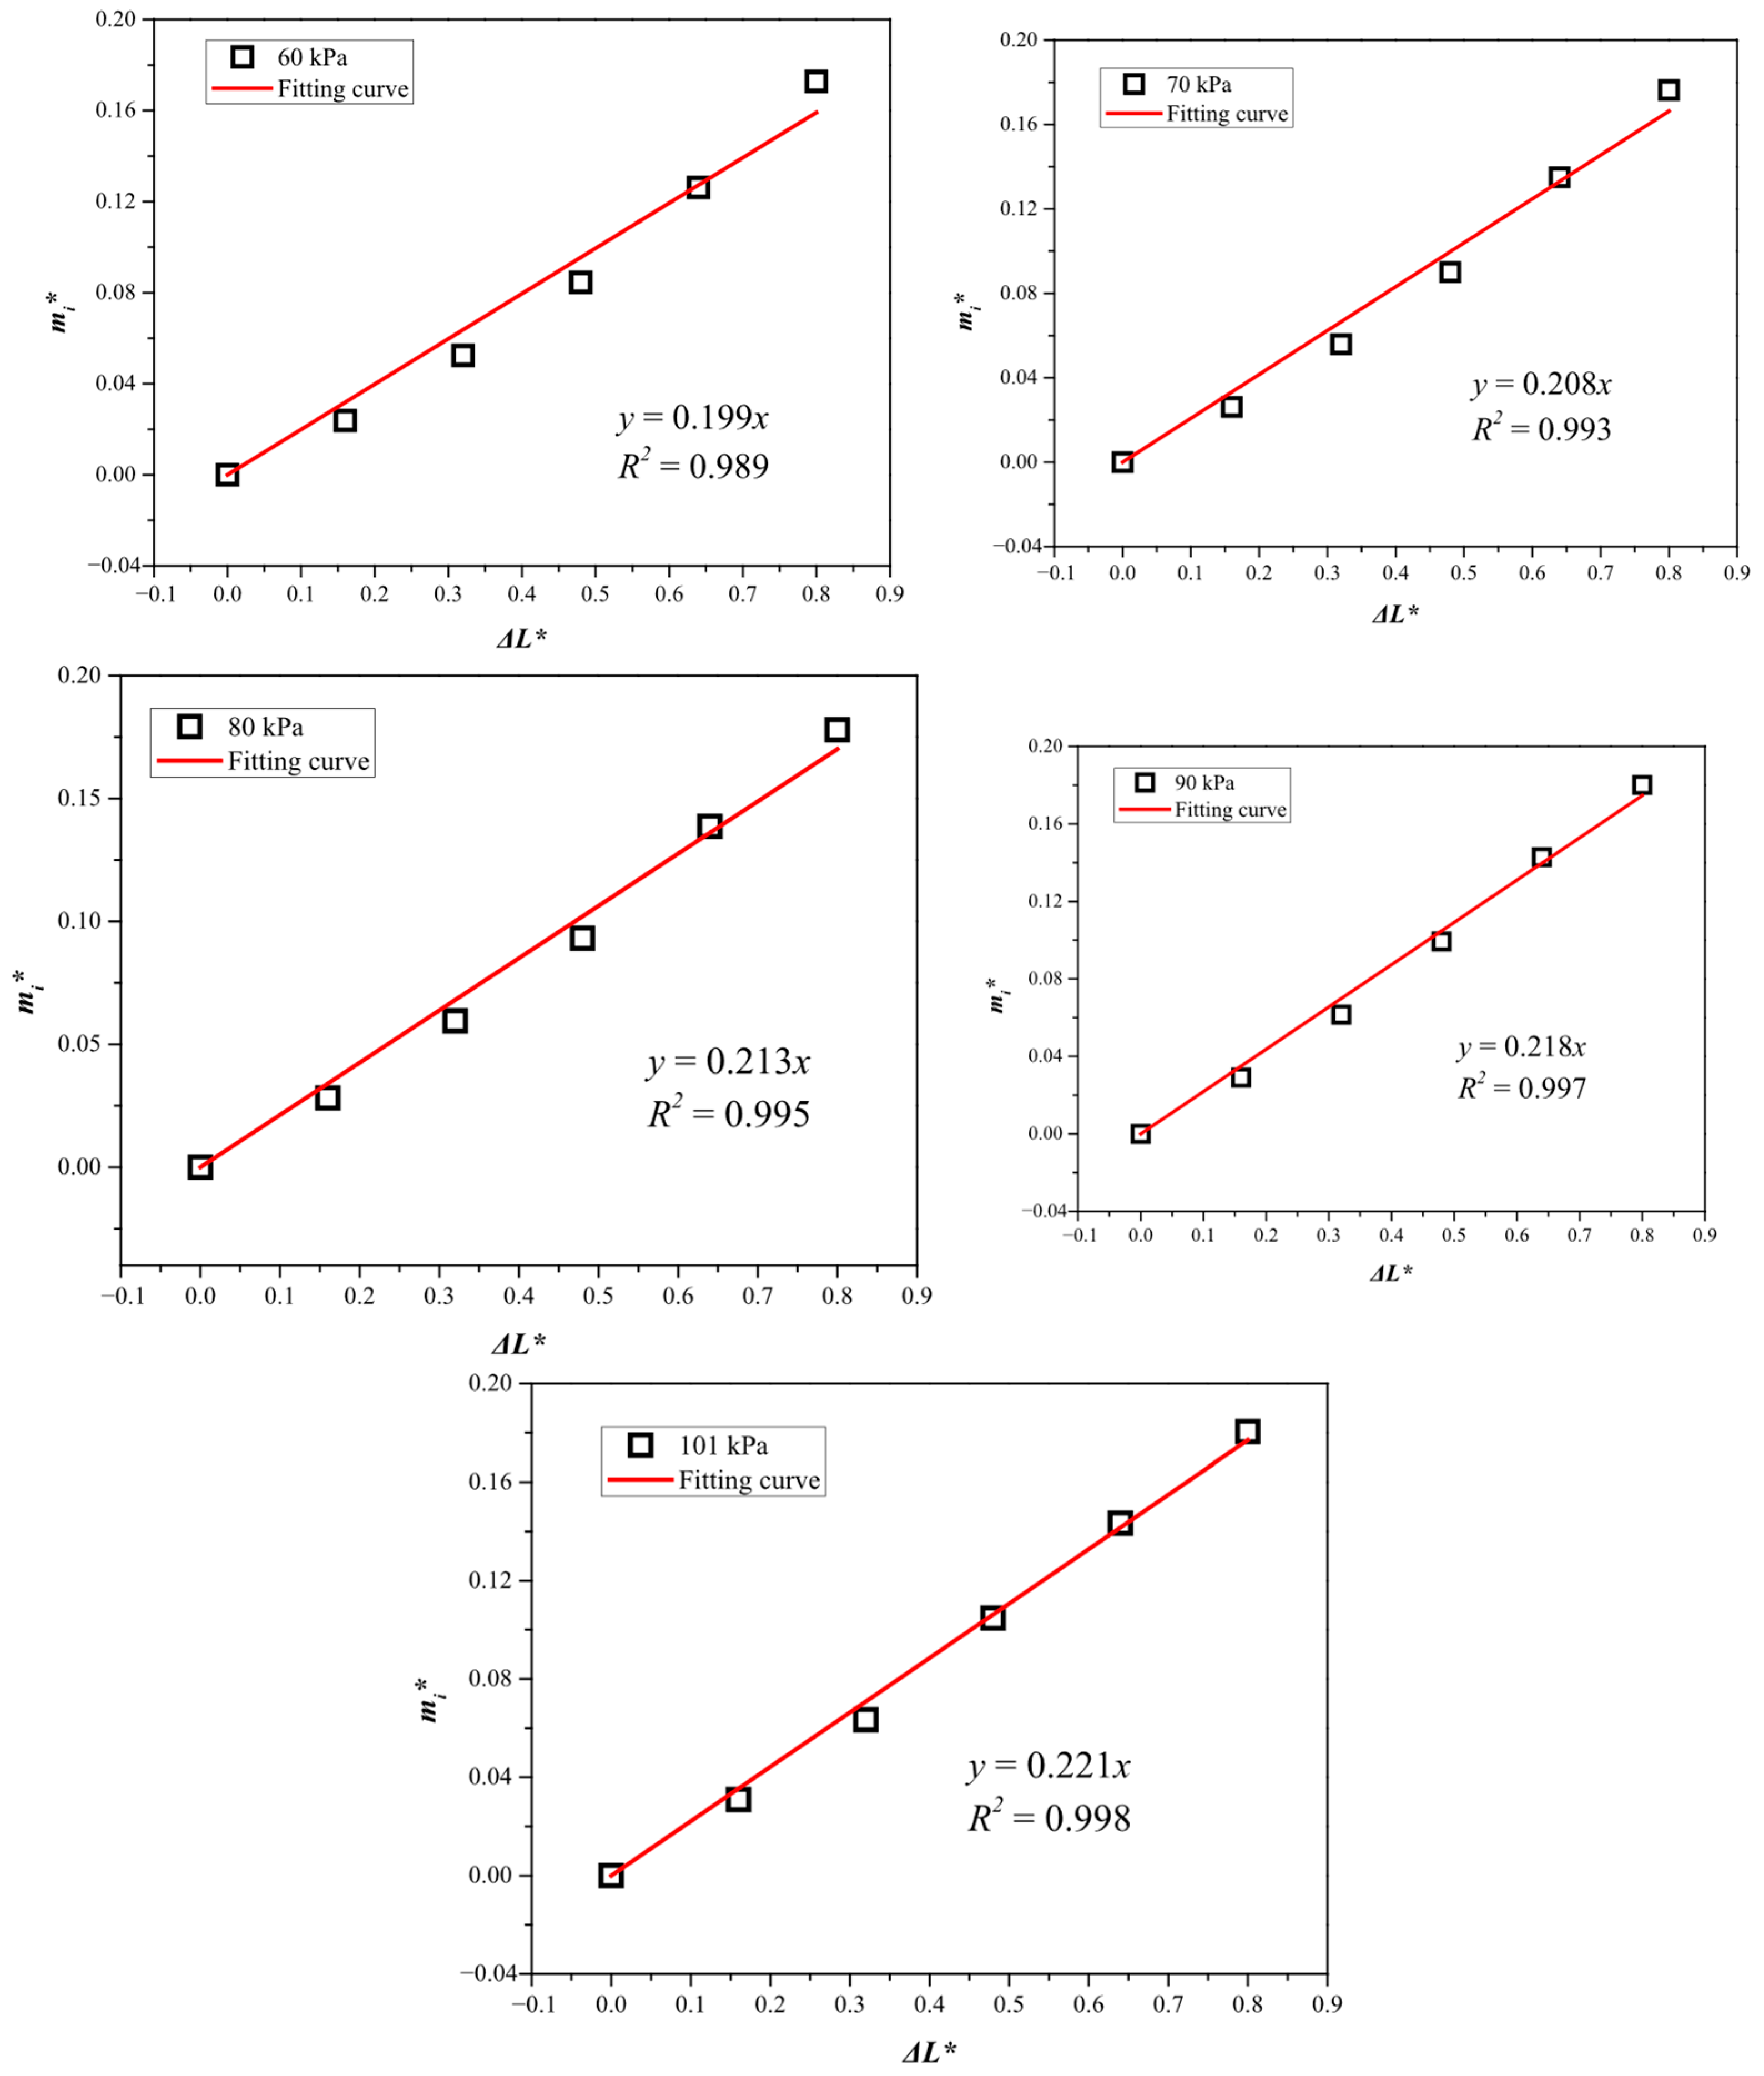
Note that m i * represents the ratio of induced velocity ( m i / ρ a A ) to the maximum ceiling jet velocity ( u m a x g H 1 / 2 Q c * 1 / 3 ) [8,31]. Therefore, the results obtained by the different ambient pressures were sorted in this way and are presented in Figure 11. The connection between m i * and L * can be accurately described by linear functions with varying slopes under different ambient pressures, as expressed by Equation (10):
m i * = K P L *
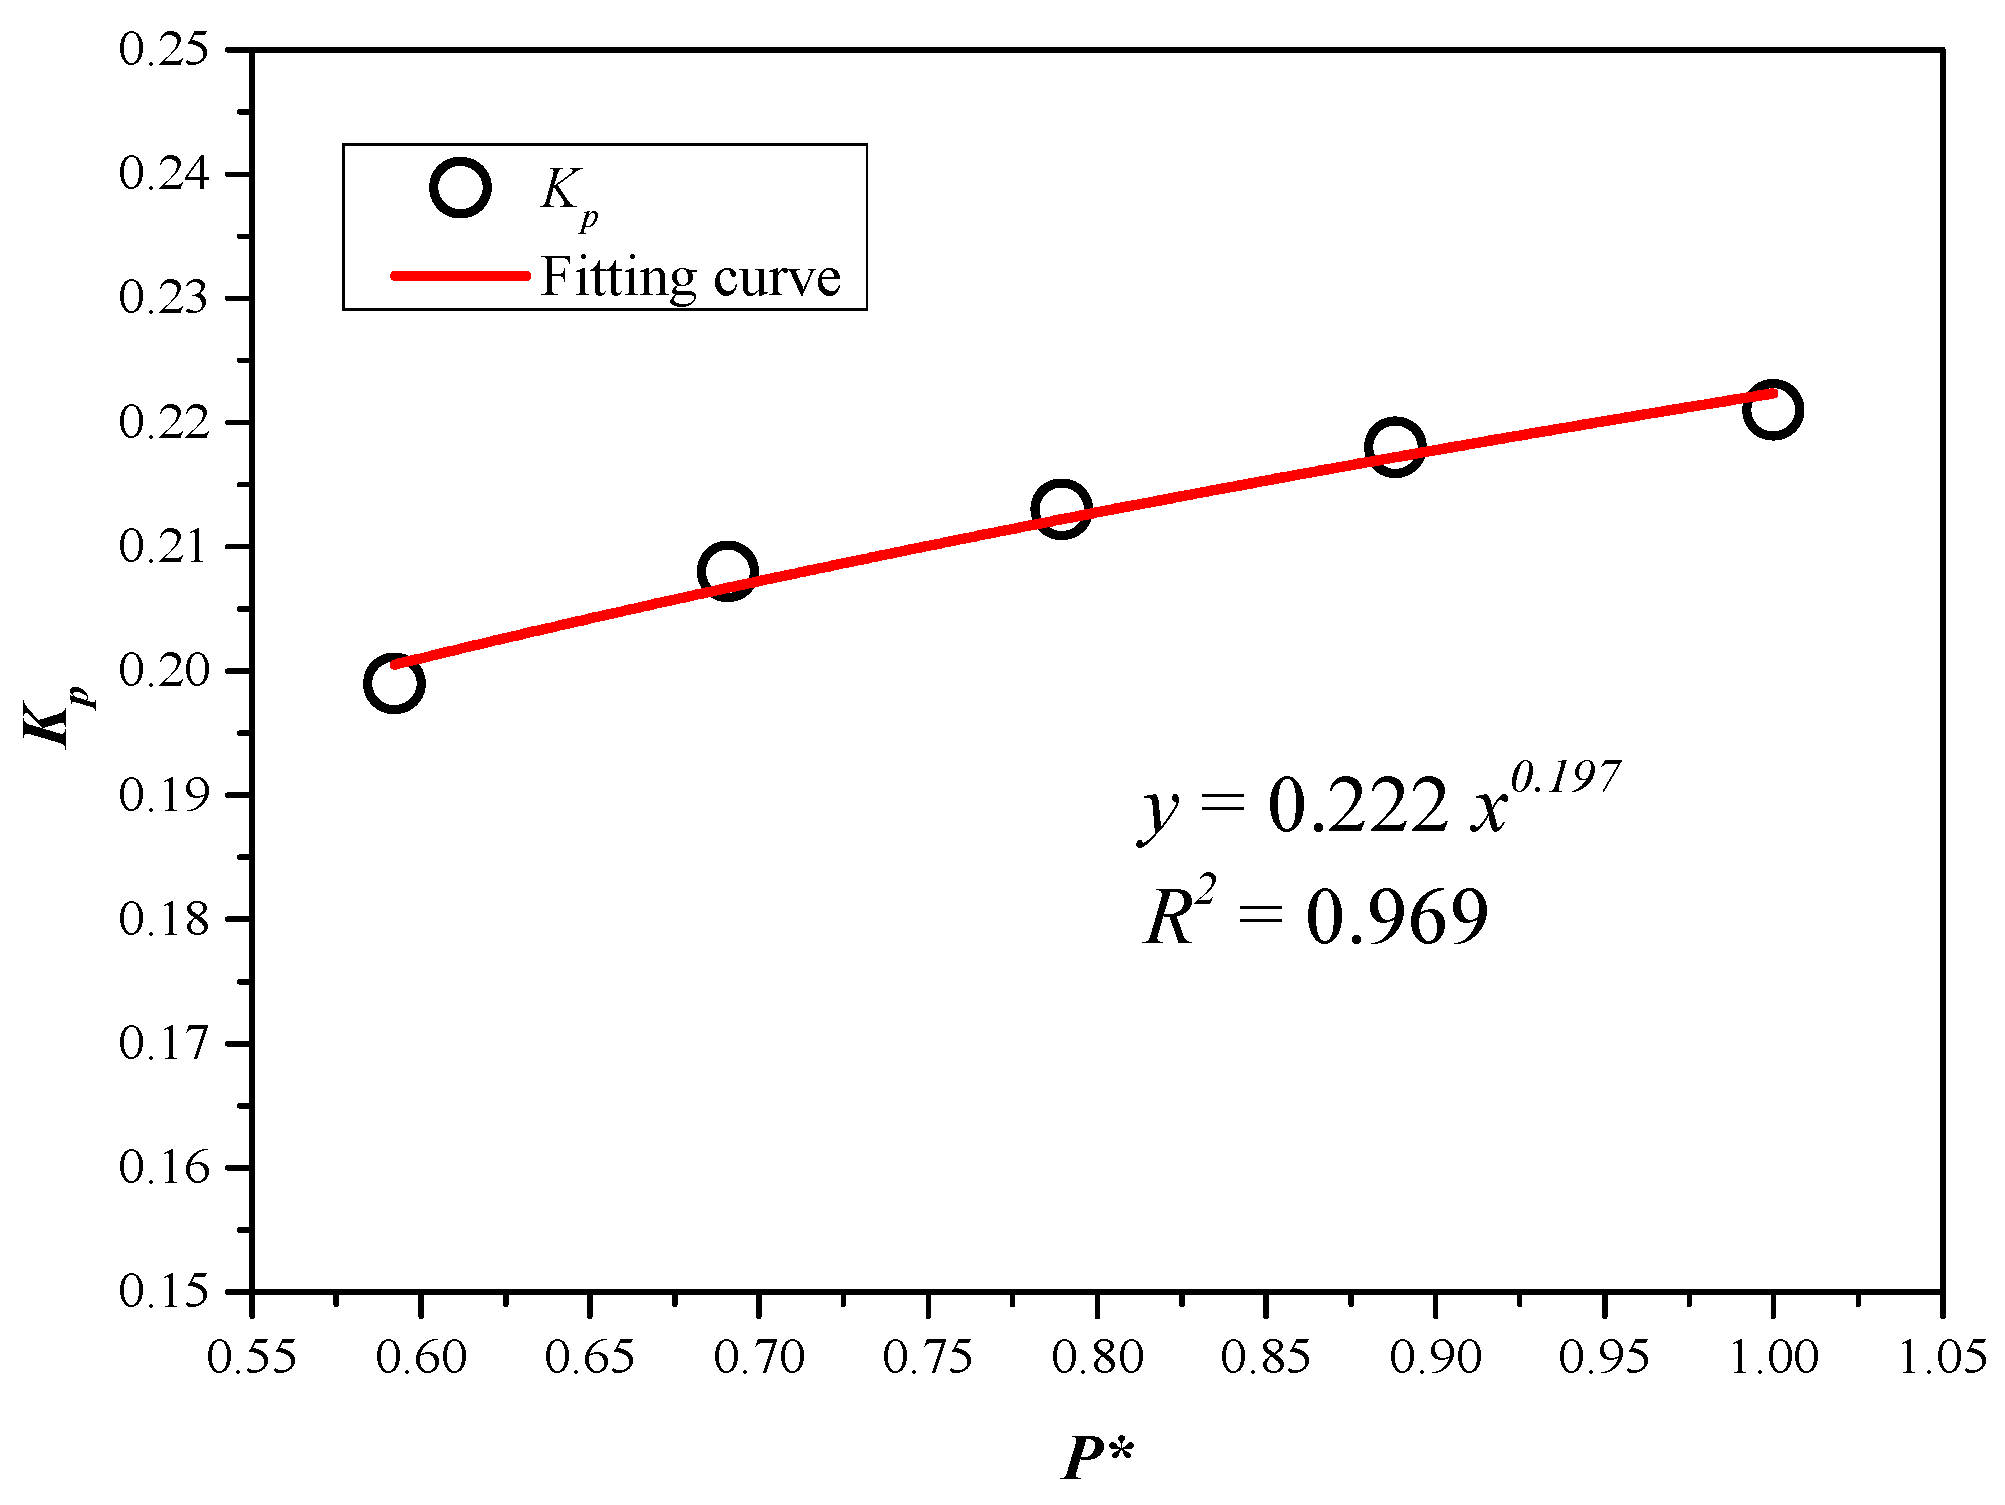
The K P is a correction parameter that considers the impact of ambient pressure. In the case of ambient pressures of 60–100 kPa, the coefficients K P are 0.199, 0.208, 0.213, 0.218, and 0.221, respectively.
Here, the impact of ambient pressure on m i is quantified by introducing dimensionless ambient pressure P * , as expressed by Equation (11) [28]:
P * = P x / P n o r m a l
where P x is the atmospheric pressure at different altitudes (kPa), and P n o r m a l is the normal atmospheric pressure (kPa).
Based on Figure 11 and Equation (11), Figure 12 plots the relationship between the correlations of K P and P * . It is evident that K P exhibits a positive correlation with ambient pressure. The fitting correlation coefficient is 0.969, and it can be expressed mathematically as Equation (12).
K P = 0.222 P * 0.197
Substituting Equation (12) into Equation (10) outlines the prediction model for the m i * and it can be described as Equation (13):
m i * = 0.222 P * 0.197 L *
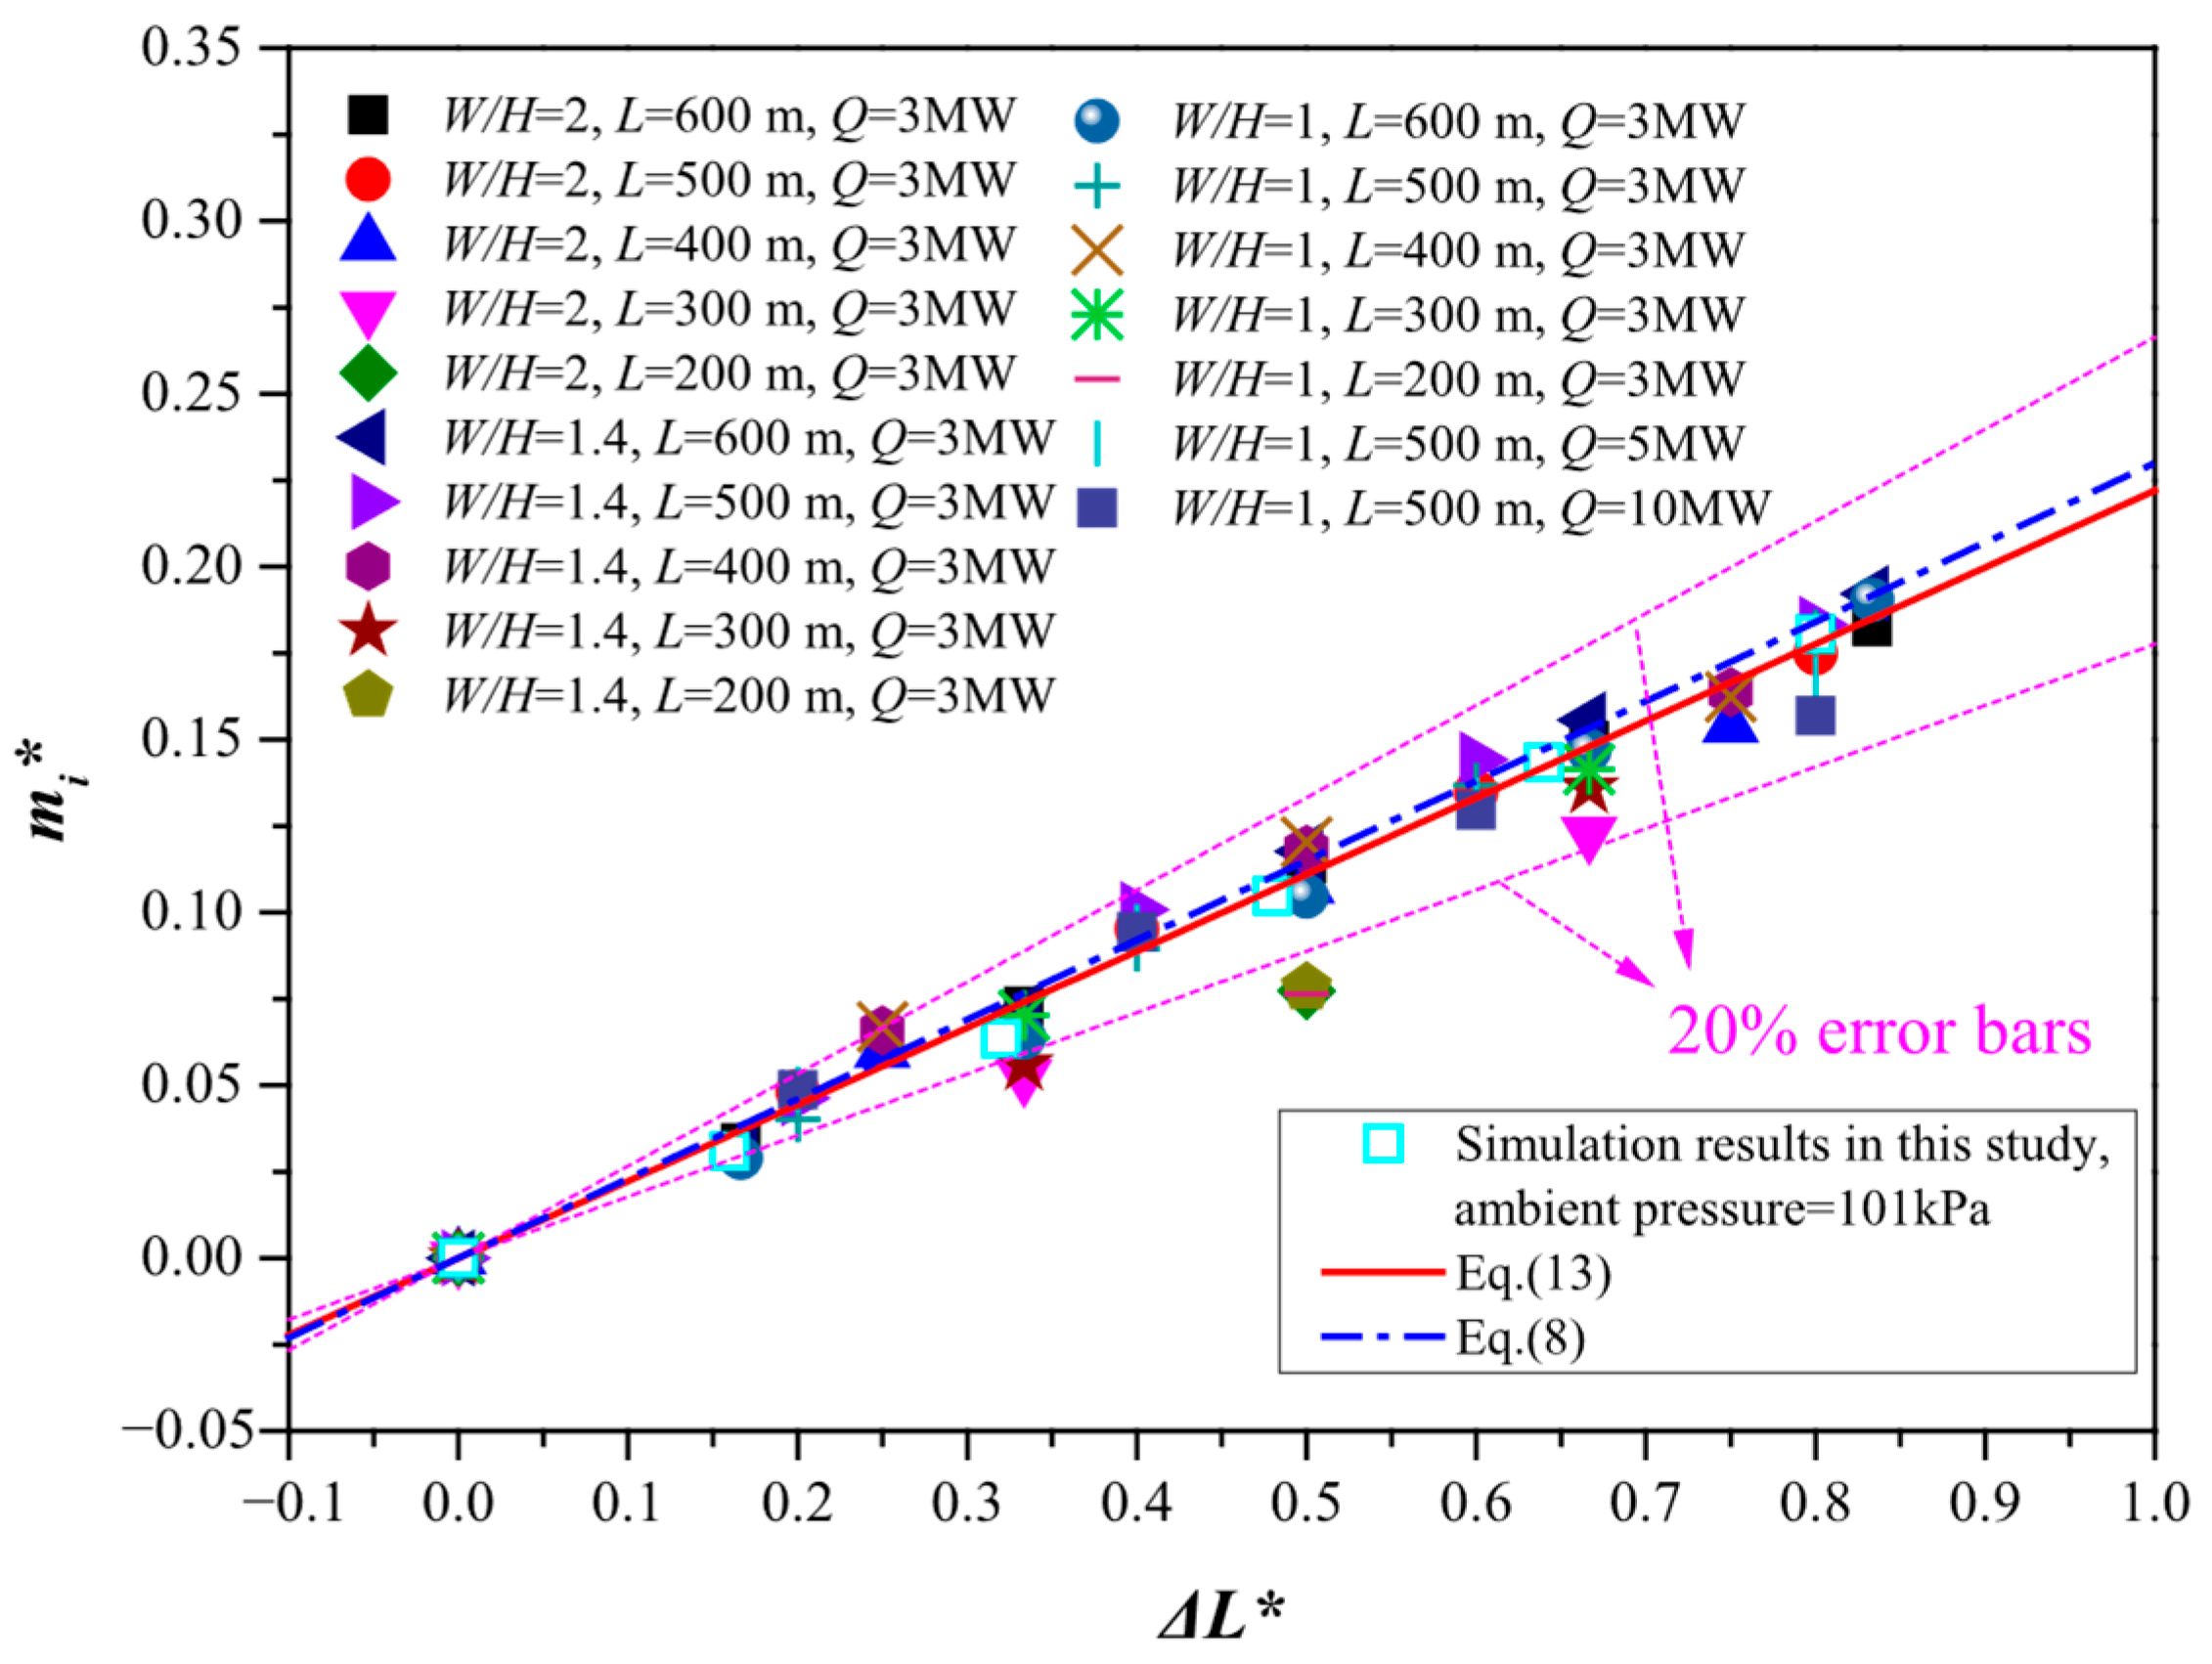
The model-predicted values were compared with previous study results [4] to verify the accuracy of Equation (13). Note that Yu et al. [4] studied the effects of HRR, aspect ratio, and tunnel length on m i under normal ambient pressure. Figure 13 presents a comparison between Equation (13) and prior research findings, with the simulation results for normal ambient pressure from this study also included in the figure. Under standard atmospheric pressure, the model introduced in this study (Equation (13)) is very close to the previous model (Equation (8)) and agrees well with previous research results.

3.3. Distribution of Mass Flow Rate Smoke and Air

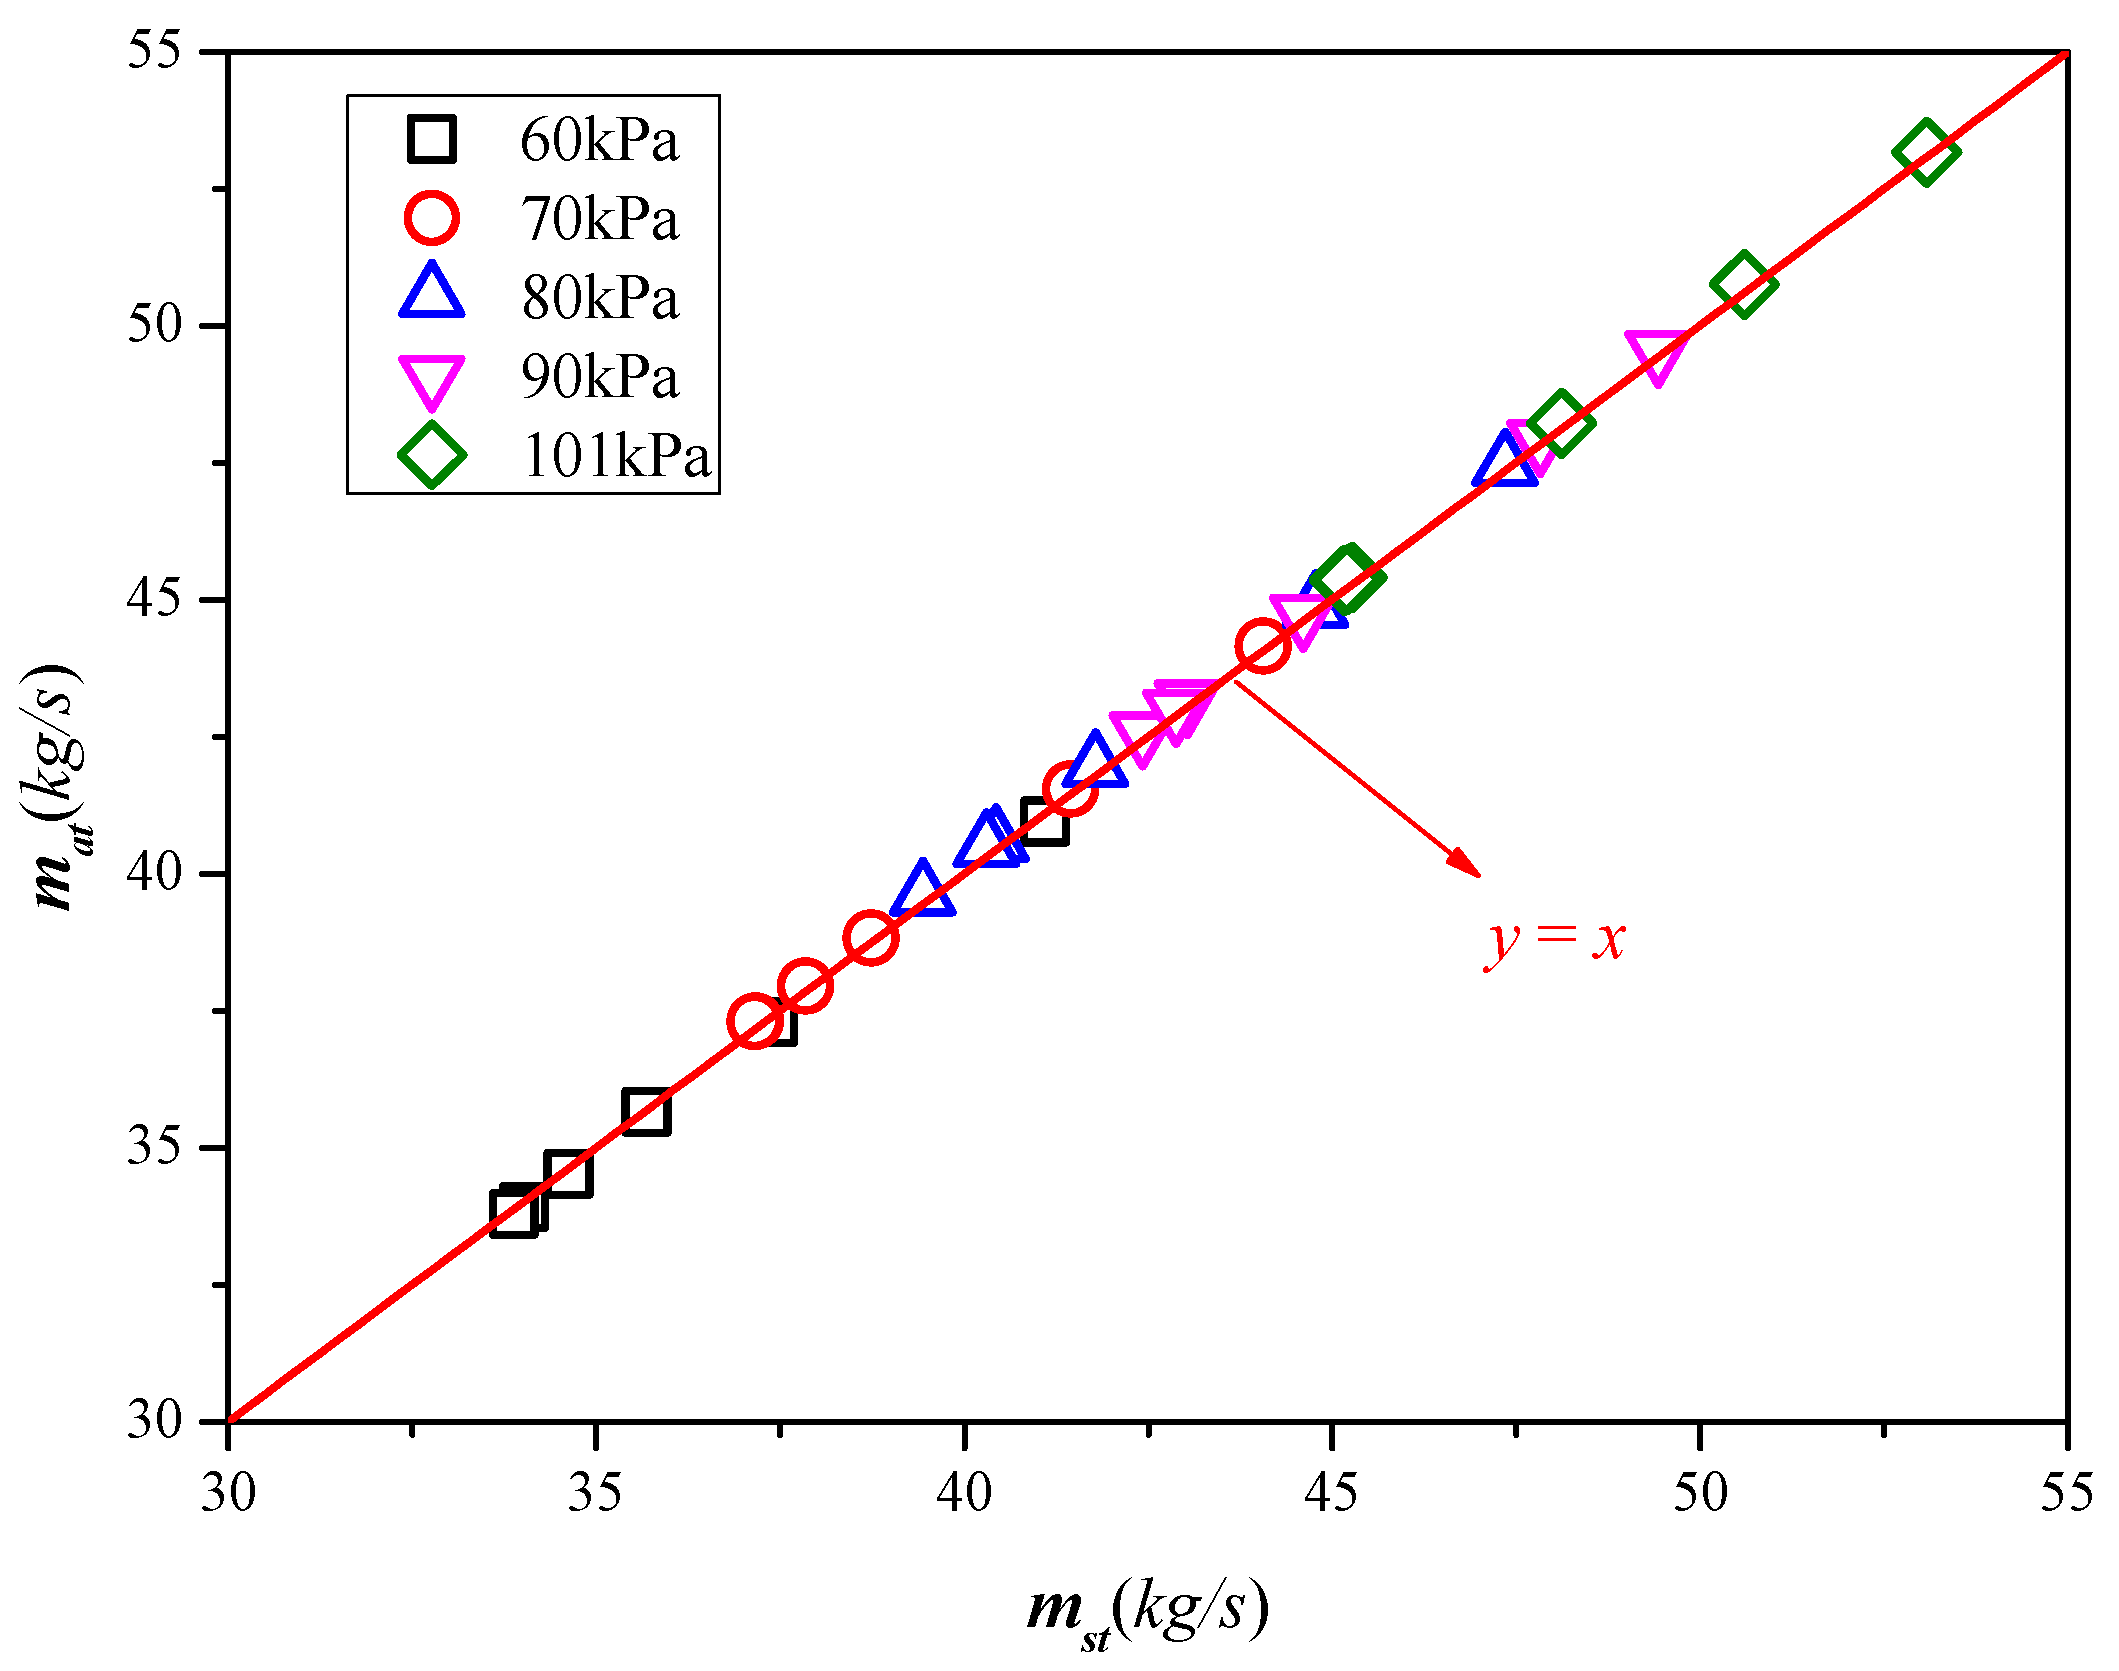
The total mass flow rate of smoke, m s t ( m s t = m s u + m s d ), is the combined amount of smoke emitted from both the upstream and downstream tunnel portals. The total air mass flow rate, m a t ( m a t = m a u + m a d ) , is the combined amount of fresh air entering through both the upstream and downstream tunnel portals. Figure 14 shows a comparison between m s t and m a t in all simulation results under different ambient pressures. The result shows that m s t = m a t ; the maximum imbalance rate does not exceed 0.5%, which conforms to the law of conservation of mass. For simplicity, the total mass flow rate of smoke or air is represented by m t ( m t = m s t = m a t ).
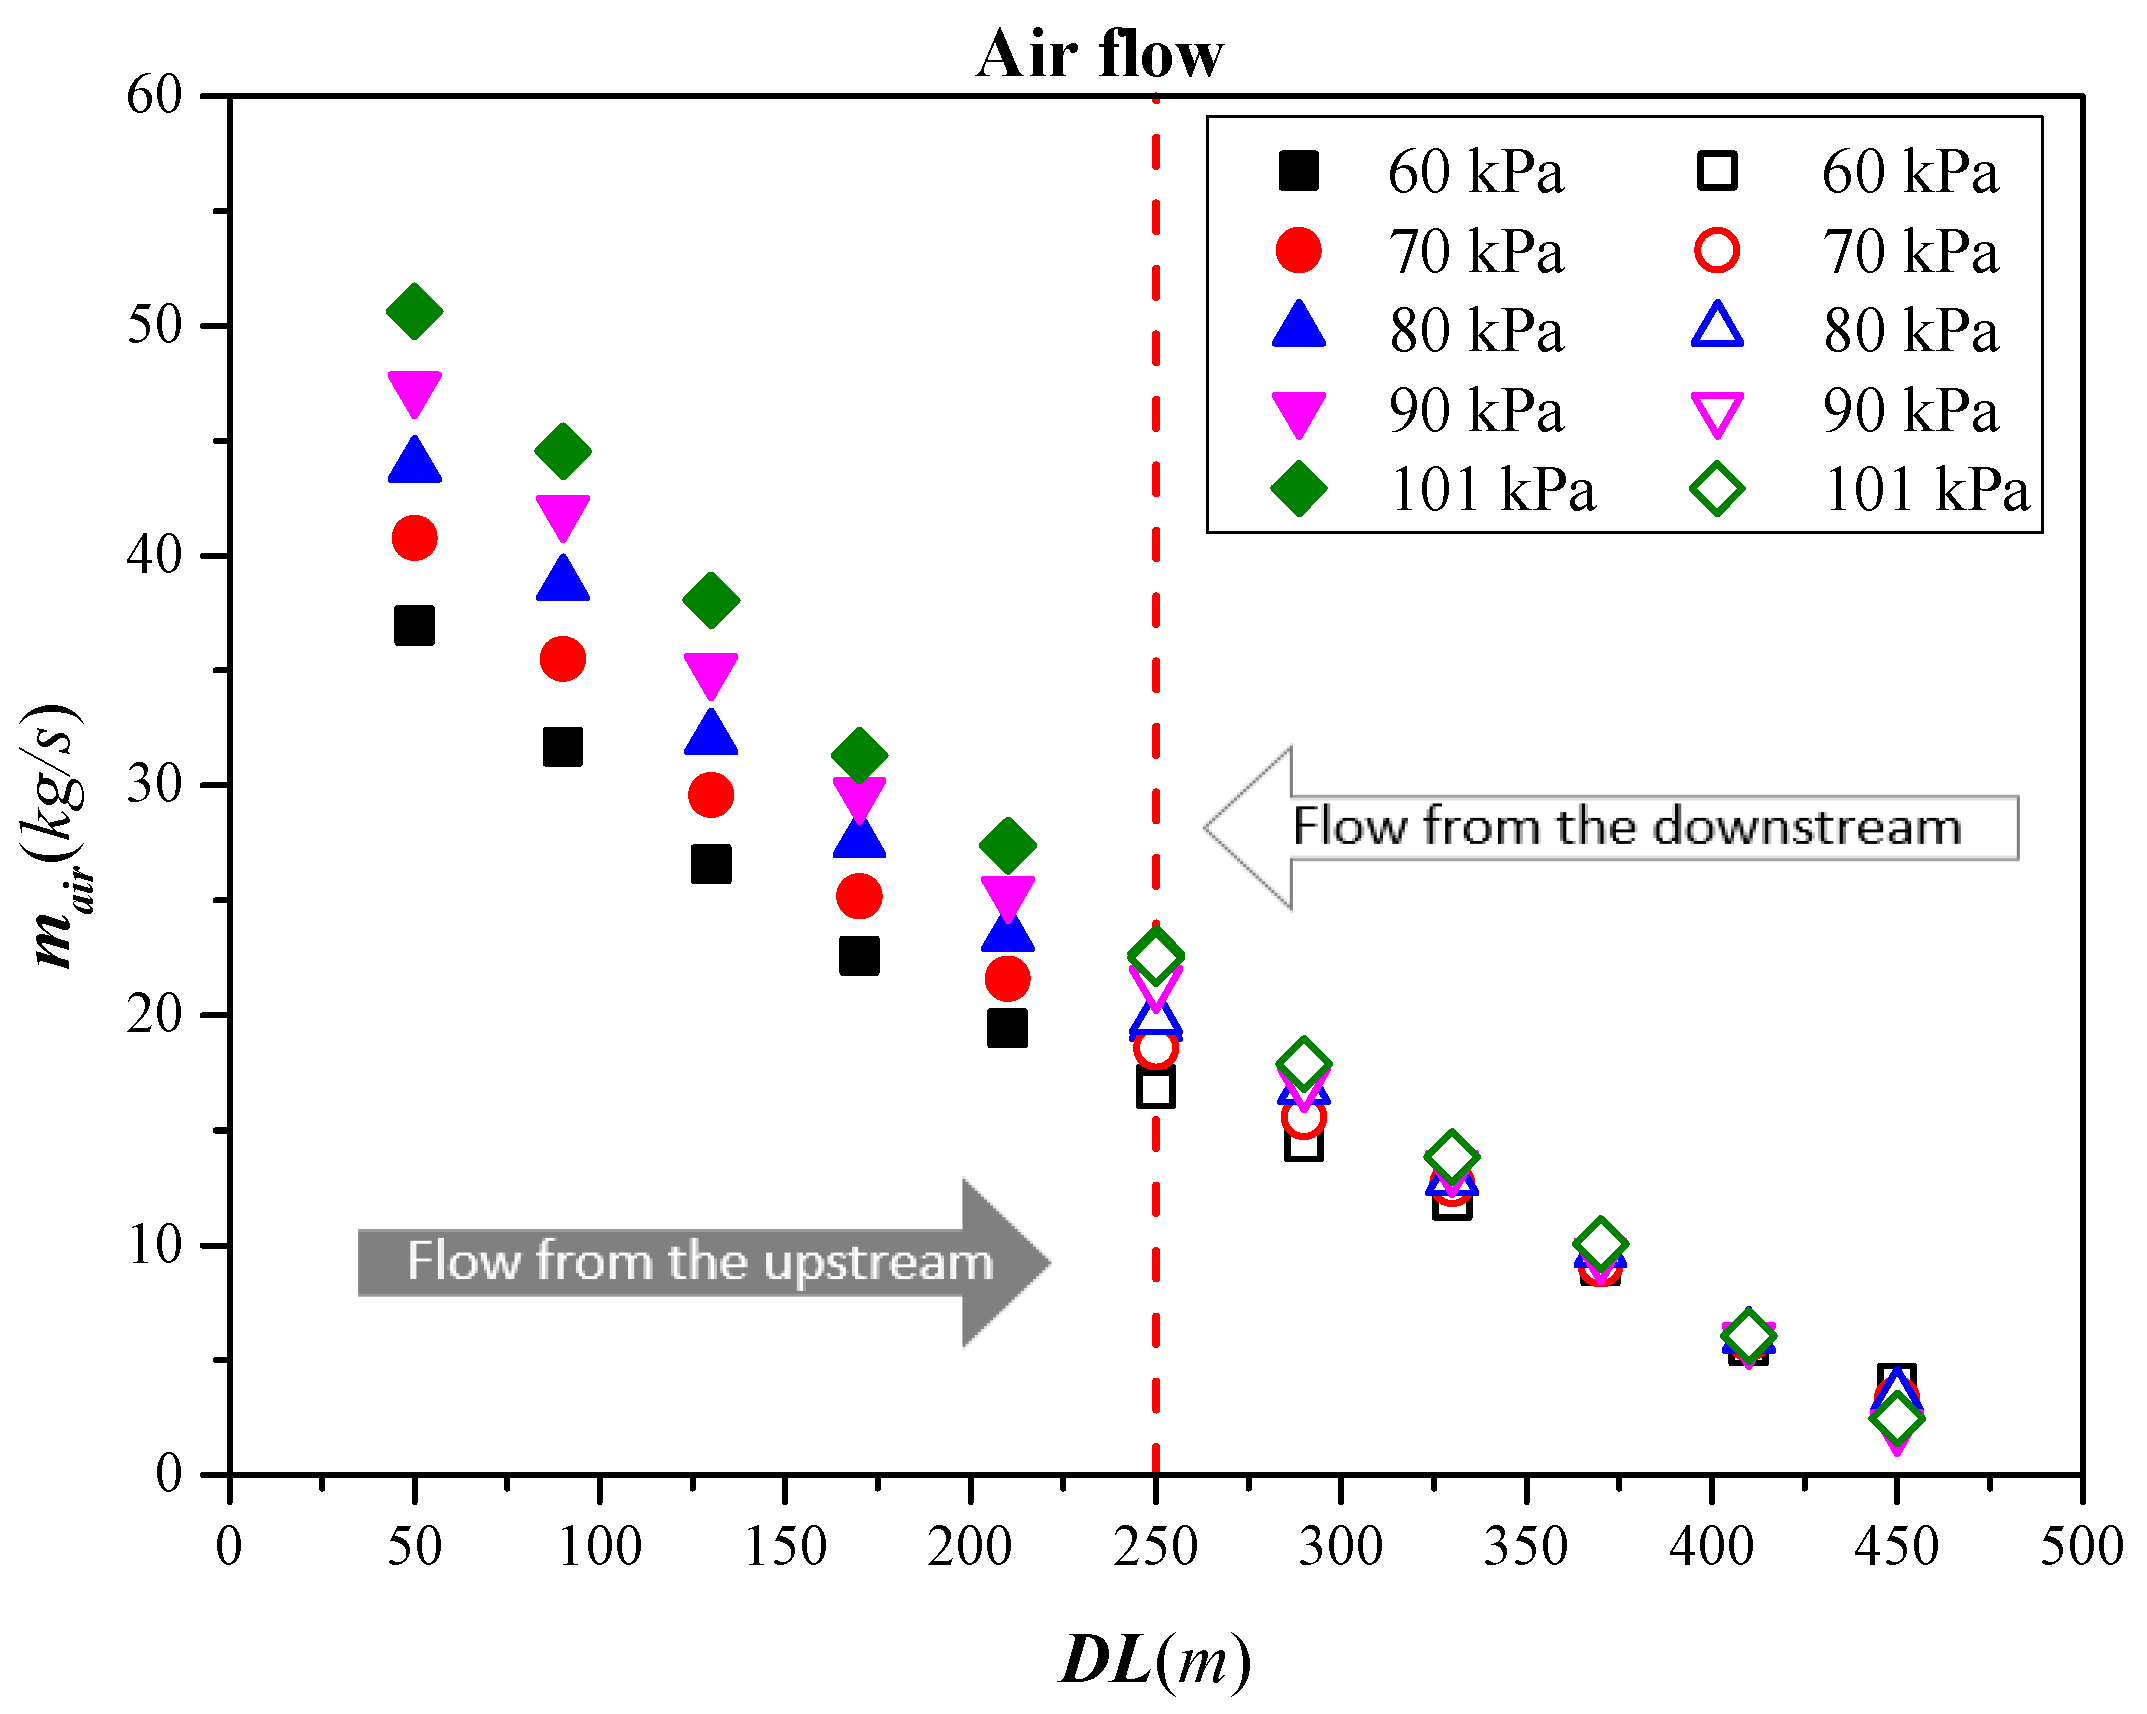
To standardize the mass flow rate of smoke or air at tunnel portals, several parameters are defined: D L represents the distance from the portal to the fire source; m a i r denotes the mass flow rate of air entering from the portal; and m s m o k e indicates the mass flow rate of smoke exiting the portal. Figure 15 and Figure 16 shows the evolution of m s m o k e and m a i r with the D L under different ambient pressures, respectively. Under identical ambient pressure, the m s m o k e (or m a i r ) is influenced by the D L . The amount of smoke decreases as the distance decreases, while the amount of fresh air increases. When the distance is below 250 m, the smoke mass flow rate shows minimal variation as the distance decreases. In addition, when the D L remains constant, the quantity of both outgoing smoke and incoming air increases with the elevation of ambient pressure.
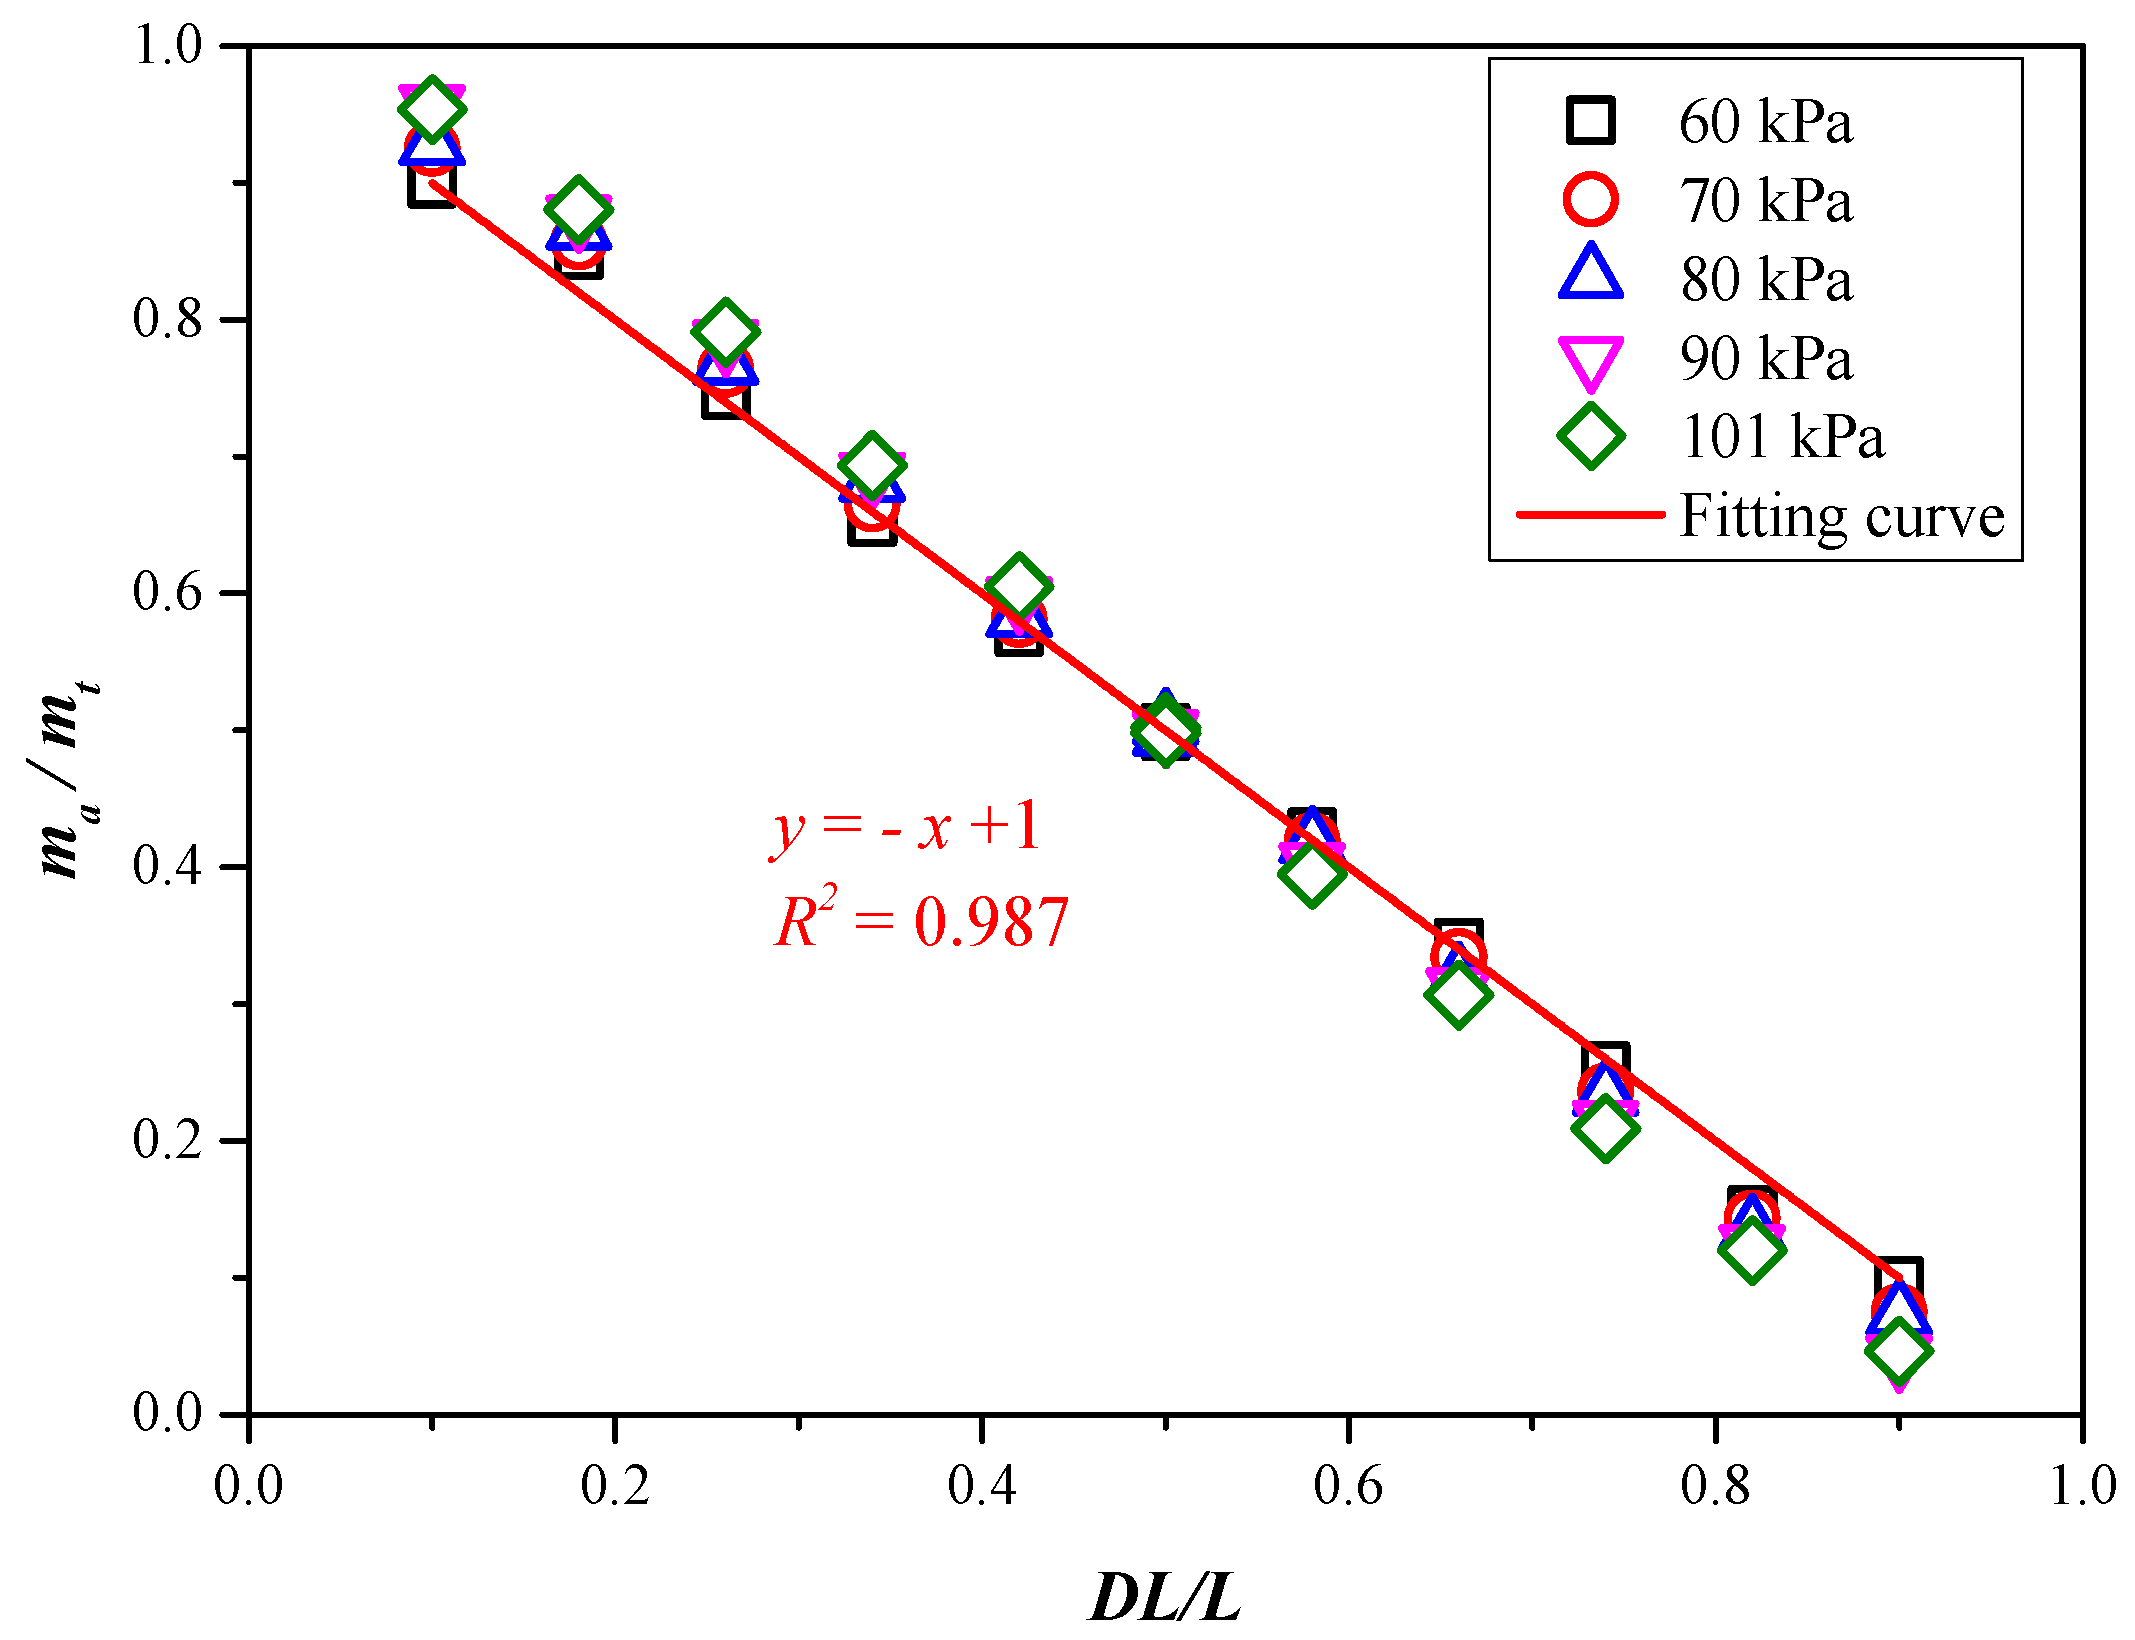
To further analyze the changes in smoke and airflow relative to the   D L , the data from Figure 15, Figure 16 and Figure 17.were converted into dimensionless form, as illustrated in Figure 17 and Figure 18. Smoke and airflow patterns under varying ambient pressures display analogous trends and can be effectively modeled using linear Equations (14) and (15), respectively.
m s m o k e / m t = 0.229 D L / L + 0.387
m a i r / m t = D L / L + 1
Note that Equation (14) is very close to the prediction model obtained by Yu et al. [4] under normal ambient pressure, as shown in Figure 17; and Equation (15) is consistent with their results under normal ambient pressure. Equations (14) and (15) describe the correlation between the proportion of smoke exiting (or air entering) through a specific tunnel portal relative to the total smoke exiting (or air entering) and the distance from the portal to the fire source. The influence of changes in air (or smoke) density caused by changes in ambient pressure on the outgoing smoke and incoming air is consistent, so the relationship expressed in Equations (14) and (15) will not be affected by ambient pressures.
According to Equation (14), the proportion of smoke released through the tunnel portal is determined by the ratio of the distance from the portal to the fire location relative to the tunnel’s total length. When the fire source is centrally positioned inside the tunnel, the proportion of smoke determined by Equation (14) is 0.5, suggesting that the smoke flow field is symmetrical, which is consistent with the simulation results. Similarly, the ratio of air entrained from the tunnel portal relies on the ratio of the distance from the portal to the fire source relative to the total tunnel length, as outlined in Equation (15). Furthermore, the airflow demonstrates greater sensitivity to variations in fire location compared to smoke flow.

4. Conclusions

This study utilized FDS numerical simulations to examine how ambient pressure affects asymmetric flow in tunnel fires under natural ventilation. This study examined the impact of different longitudinal fire source positions and ambient pressure conditions on asymmetric flow effects, induced longitudinal mass flow rates, and the dispersion characteristics of smoke and air mass flow. The primary conclusions of this work can be summarized as follows:
(1)
Asymmetric flow resulting from varying longitudinal positions of the fire source is observable under different ambient pressures. Ambient pressure affects the dynamics of smoke and air diffusion inside tunnels. An increase in ambient pressure results in a rise in both emitted smoke and incoming air.
(2)
The parameter of induced longitudinal flow mass rate characterizes the intensity of asymmetric flow effects at varying ambient pressures. A prediction model for calculating the mass flow rate of induced longitudinal flow was developed by using dimensionless ambient pressure to quantify its impact.
(3)
The ambient pressure has an impact on the mass flow values of smoke and airflow in tunnel fires but has little effect on their basic distribution laws. A predictive model has been proposed for the distribution laws of smoke overflow and air inflow under different ambient pressures.
This study aims to enhance the understanding of asymmetric smoke propagation in high-altitude fires and provide theoretical references for tunnel ventilation design. At lower environmental pressures, the asymmetric flow magnitude caused by the same fire source location decreases proportionally. The ratio of smoke efflux from the tunnel to air entrainment into the tunnel remains constant regardless of environmental pressure variations. It should be noted that the dimensionless prediction model proposed in this article should be applied with caution when applied beyond the scope of this study, such as when the tunnel length increases to the point where it is not suitable for natural ventilation.

Author Contributions

Conceptualization, F.W. and S.Z.; Methodology, F.W. and S.Z.; Software, T.L. and H.C.; Validation, X.H. and H.C.; Investigation, C.C. and X.H.; Writing—original draft, F.W. and T.L.; Writing—review and editing, L.X., C.C. and S.Z.; Supervision, L.X. and S.Z. All authors have read and agreed to the published version of the manuscript.

Funding

This study received funding from the Science and Technology Support Plan for Youth Innovation of Colleges and Universities in Shandong Province, China (Grant No. 2023KJ122), and the Leading Researcher Studio Fund of Jinan (Grant No.202333050). Shengzhong Zhao was supported by the Young Talent of Lifting Engineering for Science and Technology in Shandong, China (Grant No. SDAST2024QTA077).

Institutional Review Board Statement

Not applicable.

Informed Consent Statement

Not applicable.

Data Availability Statement

Data are contained within this article.

Acknowledgments

The authors thank the reviewers for their great help with the article during the review process.

Conflicts of Interest

The authors declare no conflicts of interest.

References

  1. Meng, N.; Liu, X.; Li, X.; Liu, B. Effect of blockage ratio on backlayering length of thermal smoke flow in a longitudinally ventilated tunnel. Appl. Therm. Eng. 2018, 132, 1–7. [Google Scholar] [CrossRef]
  2. Ji, J.; Gao, Z.H.; Fan, C.G.; Sun, J.H. Large Eddy Simulation of stack effect on natural smoke exhausting effect in urban road tunnel fires. Int. J. Heat Mass Transf. 2013, 66, 531–542. [Google Scholar] [CrossRef]
  3. Ji, J.; Wang, Z.; Ding, L.; Yu, L.; Gao, Z.; Wan, H. Effects of ambient pressure on smoke movement and temperature distribution in inclined tunnel fires. Int. J. Therm. Sci. 2019, 145, 106006. [Google Scholar] [CrossRef]
  4. Yu, L.; Wan, H.; Ji, J. Asymmetric flow effect in a horizontal natural ventilated tunnel with different aspect ratios under the influence of longitudinal fire locations. Build. Simul. 2020, 14, 1311–1323. [Google Scholar] [CrossRef]
  5. Wu, Y.; Atkinson, G.T.; Stoddard, J.P.; James, P. Effect of Slope on Control of Smoke Flow in Tunnel Fires. In Proceedings of the FIRE SAFETY SCIENCE—5, Tsukuba, Japan, 3–7 March 1997; pp. 1225–1236. [Google Scholar]
  6. He, L.; Liao, K.; Zhou, Y.; Tao, H.; Ming, Y.; Wang, X.; Zhang, H.; Zhu, G. Study on the influence of the longitudinal position of the fire source on the movement behavior of the asymmetric flow field. Therm. Sci. Eng. Prog. 2023, 39, 101753. [Google Scholar] [CrossRef]
  7. Gao, Z.; Li, L.; Sun, C.; Zhong, W.; Yan, C. Effect of longitudinal slope on the smoke propagation and ceiling temperature characterization in sloping tunnel fires under natural ventilation. Tunn. Undergr. Space Technol. 2022, 123, 104396. [Google Scholar] [CrossRef]
  8. Yu, L.; Lei, X.; Huang, P.; Liu, C.; Zhang, H.; Yang, F. Study on the combination effect of tunnel slope and longitudinal fire location on the asymmetric flow fields in a naturally ventilated tunnel. Tunn. Undergr. Space Technol. 2024, 146, 105623. [Google Scholar] [CrossRef]
  9. Ji, J.; Guo, F.Y.; Gao, Z.H.; Zhu, J.P.; Sun, J.H. Numerical investigation on the effect of ambient pressure on smoke movement and temperature distribution in tunnel fires. Appl. Therm. Eng. 2017, 118, 663–669. [Google Scholar] [CrossRef]
  10. Zhang, Y.; Yao, Y.; Ren, F.; Zhu, H.; Zhang, S.; Jiang, L. Effects of ambient pressure on smoke propagation in inclined tunnel fires under natural ventilation. Environ. Sci. Pollut. Res. 2023, 30, 65074–65085. [Google Scholar] [CrossRef] [PubMed]
  11. Yan, Z.G.; Guo, Q.H.; Zhu, H.H. Full-scale experiments on fire characteristics of road tunnel at high altitude. Tunn. Undergr. Space Technol. 2017, 66, 134–146. [Google Scholar] [CrossRef]
  12. Ji, J.; Guo, F.; Gao, Z.; Zhu, J. Effects of ambient pressure on transport characteristics of thermal-driven smoke flow in a tunnel. Int. J. Therm. Sci. 2018, 125, 210–217. [Google Scholar] [CrossRef]
  13. Yao, Y.; Zhang, Y.; Zhu, H.; Han, Z.; Zhang, S.; Zhang, X. Effects of ambient pressure on characteristics of smoke movement in tunnel fires. Tunn. Undergr. Space Technol. 2023, 134, 104981. [Google Scholar] [CrossRef]
  14. Tang, F.; Hu, L.H.; Yang, L.Z.; Qiu, Z.W.; Zhang, X.C. Longitudinal distributions of CO concentration and temperature in buoyant tunnel fire smoke flow in a reduced pressure atmosphere with lower air entrainment at high altitude. Int. J. Heat Mass Transf. 2014, 75, 130–134. [Google Scholar] [CrossRef]
  15. Liu, B.; Mao, J.; Xi, Y.; Hu, J. Effects of altitude on smoke movement velocity and longitudinal temperature distribution in tunnel fires. Tunn. Undergr. Space Technol. 2021, 112, 103850. [Google Scholar] [CrossRef]
  16. Gao, Z.; Cai, J.; Wang, P.; Liu, M.; Li, L. Smoke exhaust characteristics under stack effect of natural ventilation by shaft in high-altitude tunnel. Therm. Sci. Eng. Prog. 2024, 48, 102397. [Google Scholar] [CrossRef]
  17. Gannouni, S.; Ben Maad, R. CFD analysis of smoke backlayering dispersion in tunnel fires with longitudinal ventilation. Fire Mater. 2017, 41, 598–613. [Google Scholar] [CrossRef]
  18. Fan, C.; Zhang, L.; Jiao, S.; Yang, Z.; Li, M.; Liu, X. Smoke spread characteristics inside a tunnel with natural ventilation under a strong environmental wind. Tunn. Undergr. Space Technol. 2018, 82, 99–110. [Google Scholar] [CrossRef]
  19. Fan, C.; Chen, J.; Zhou, Y.; Liu, X. Effects of fire location on the capacity of smoke exhaust from natural ventilation shafts in urban tunnels. Fire Mater. 2018, 42, 974–984. [Google Scholar] [CrossRef]
  20. Ji, J.; Tan, T.; Gao, Z.; Wan, H.; Zhu, J.; Ding, L. Numerical Investigation on the Influence of Length–Width Ratio of Fire Source on the Smoke Movement and Temperature Distribution in Tunnel Fires. Fire Technol. 2019, 55, 963–979. [Google Scholar] [CrossRef]
  21. Yao, Y.; Li, Y.Z.; Ingason, H.; Cheng, X. Numerical study on overall smoke control using naturally ventilated shafts during fires in a road tunnel. Int. J. Therm. Sci. 2019, 140, 491–504. [Google Scholar] [CrossRef]
  22. Hu, L.H.; Huo, R.; Wang, H.B.; Yang, R.X. Experimental and Numerical Studies on Longitudinal Smoke Temperature Distribution Upstream and Downstream from the Fire in a Road Tunnel. J. Fire Sci. 2007, 25, 23–43. [Google Scholar] [CrossRef]
  23. McGrattan, K.; Hostikka, S.; McDermott, R.; Floyd, J.; Weinschenk, C.; Overholt, K. FDS Technical Reference Guide; National Institute of Standards and Technology: Washington, DC, USA, 2016. [Google Scholar]
  24. Hong, L.J.; Liu, C.J. Review of Research on Tunnel Fire Safety. Chin. J. Undergr. Space Eng. 2005, 1, 149–155. [Google Scholar]
  25. Wang, F.; Weng, M.; Han, J.; Obadi, I.; Liu, F. Effect of metro train on the critical driving force for preventing smoke back-layering in tunnel fires. Fire Mater. 2021, 46, 927–942. [Google Scholar] [CrossRef]
  26. Wang, F.; Liu, F.; Obadi, I.; Weng, M. Study on the smoke propagation characteristics of metro tunnel fire under the effects of piston wind. Indoor Built Environ. 2021, 32, 149–169. [Google Scholar] [CrossRef]
  27. McGrattan, K.; Hostikka, S.; McDermott, R.; Floyd, J.; Weinschenk, C.; Overholt, K. Fire Dynamics Simulator User’s Guide; National Institute of Standards and Technology: Washington, DC, USA, 2016. [Google Scholar] [CrossRef]
  28. Zhao, S.; Yang, H.; Xu, T.; Wang, F.; Li, C.; Xu, L. Effects of ambient pressure on fire-induced buoyancy driven plume dispersion and re-entrainment behavior in a street canyon. Atmos. Pollut. Res. 2023, 14, 101733. [Google Scholar] [CrossRef]
  29. Huang, P.; Ye, S.; Xie, J.; Chen, M.; Liu, C.; Yu, L. Study on the maximum and longitudinal distribution of ceiling gas temperature in a naturally ventilated tunnel: The effect of longitudinal fire location. Int. J. Therm. Sci. 2023, 185, 108037. [Google Scholar] [CrossRef]
  30. Zhao, S.; Xu, L.; Obadi, I.; Wang, F.; Liu, F.; Weng, M. Plug-holing height and complete plug-holing phenomenon in naturally ventilated tunnel fires with vertical shaft. Tunn. Undergr. Space Technol. 2021, 107, 103631. [Google Scholar] [CrossRef]
  31. Merci, B.; Beji, T. Fluid Mechanics Aspects of Fire and Smoke Dynamics in Enclosures; CRC Press: Boca Raton, FL, USA, 2016. [Google Scholar]
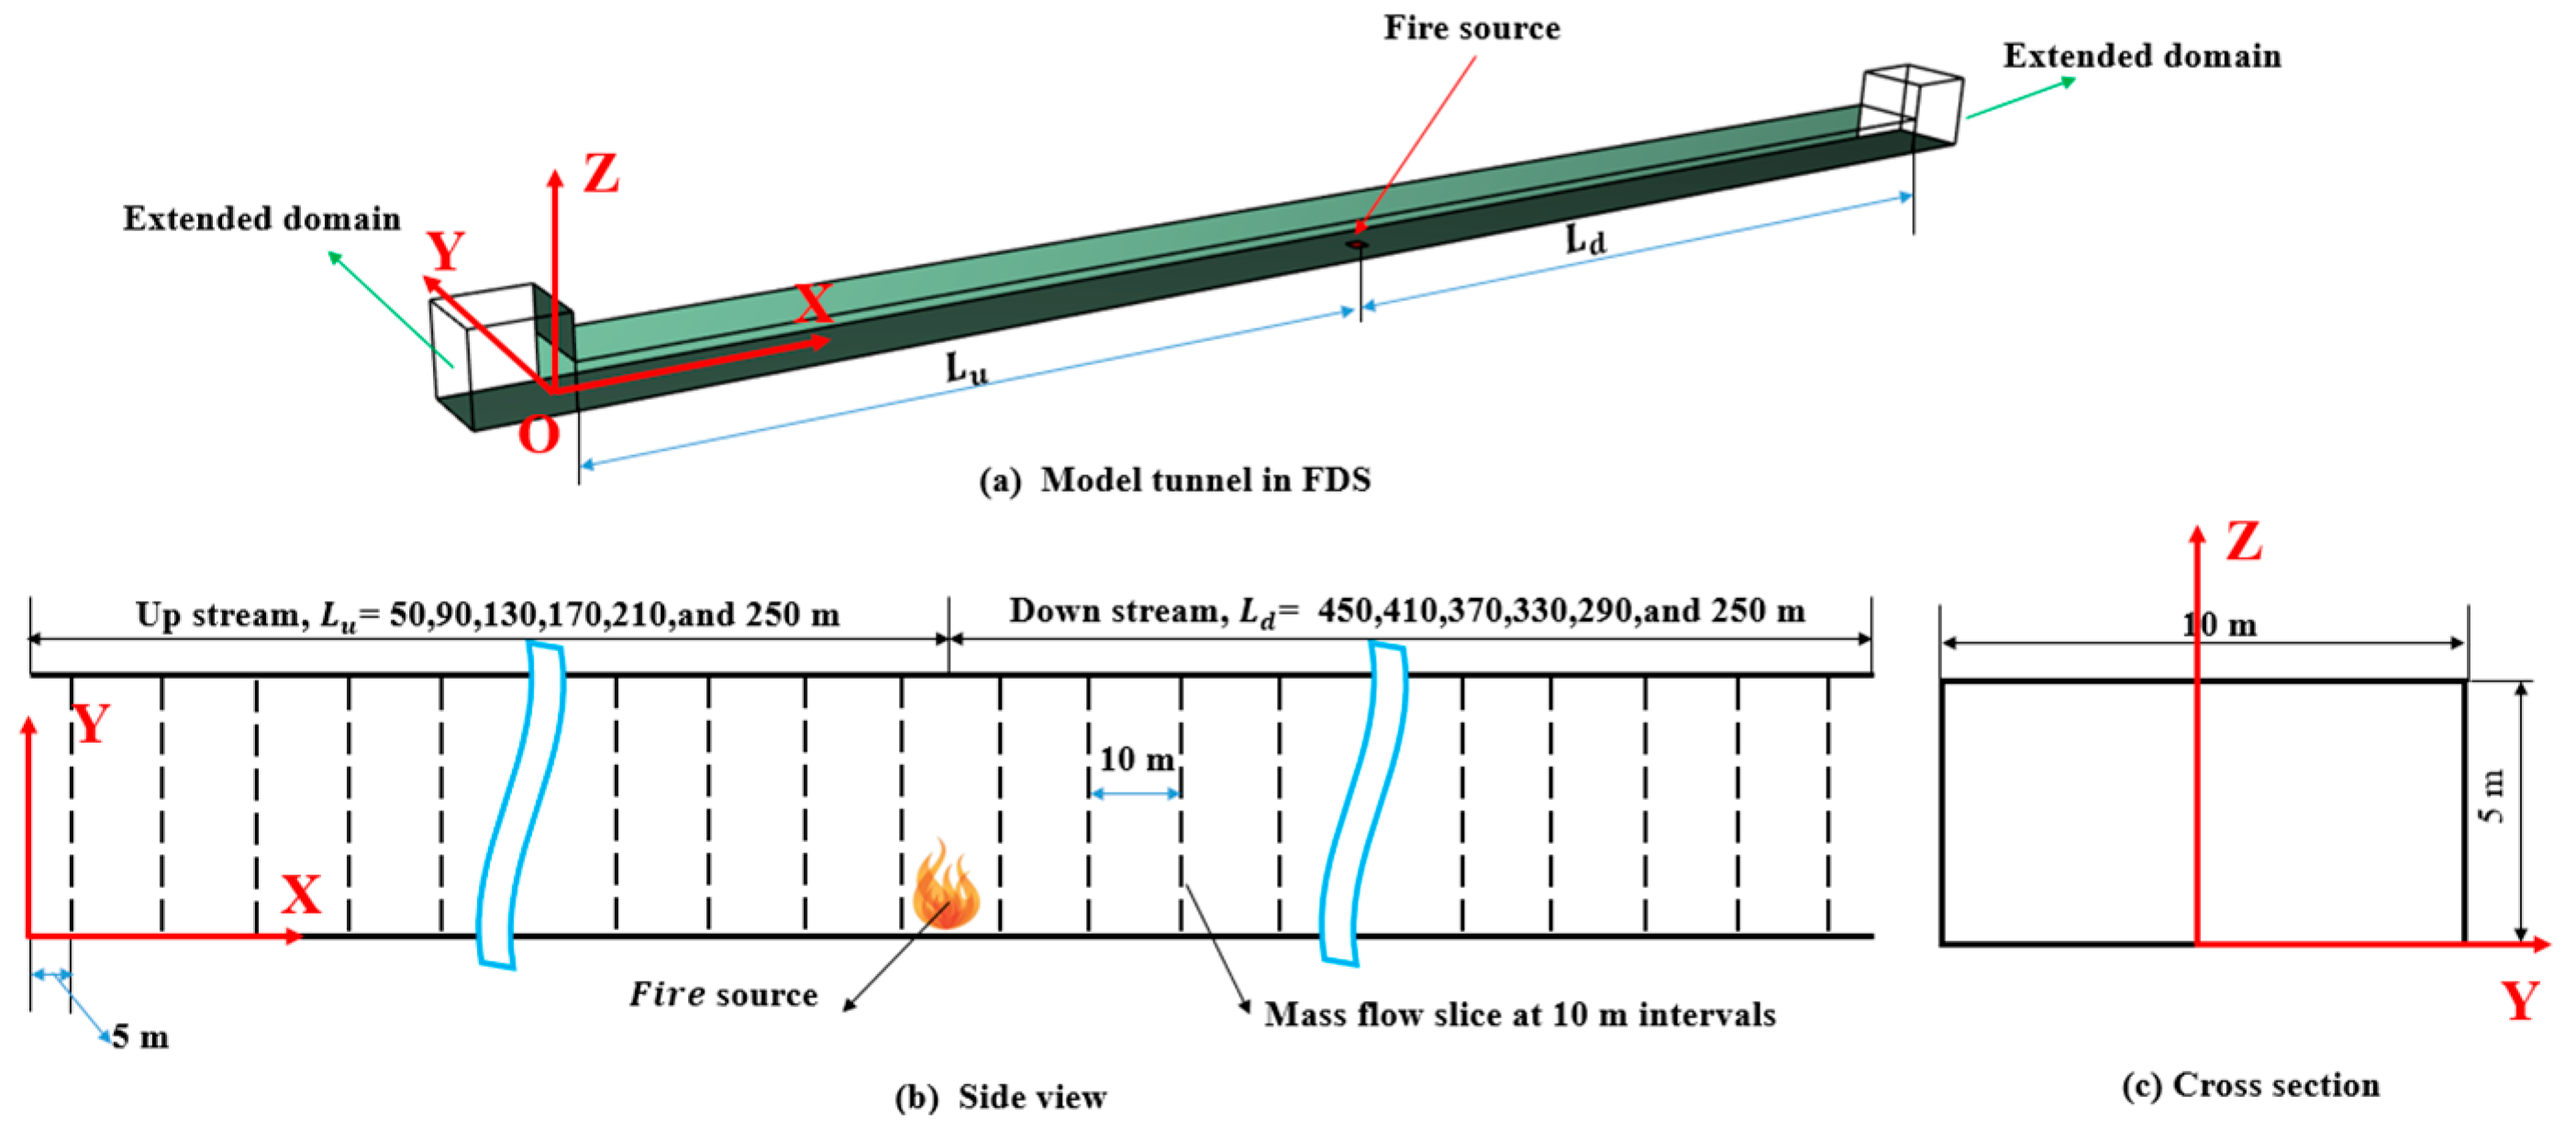
Figure 1. Sketch of the model.
Fire 08 00364 g001
Figure 2. Distribution of mass flow rate and temperature over time.
Fire 08 00364 g002
Figure 3. Time step and CFL during simulation process.
Fire 08 00364 g003
Figure 4. Distribution of vertical temperature and velocity.
Fire 08 00364 g004
Figure 5. Simulation and experimental temperature distribution.
Fire 08 00364 g005
Figure 6. Distribution of smoke flow field.
Fire 08 00364 g006
Figure 7. The average temperature field and u velocity field in proximity to the fire source.
Fire 08 00364 g007
Figure 8. Illustration of uneven airflow patterns in tunnel fires.
Fire 08 00364 g008
Figure 9. The progression of air and smoke mass flow rate distribution.
Fire 08 00364 g009
Figure 10. The variation in m i with L under different ambient pressures.
Fire 08 00364 g010
Figure 11. Evolution of m i * with L * .
Fire 08 00364 g011
Figure 12. Correlations of K P and P * .
Fire 08 00364 g012
Figure 13. Comparison with other research results.
Fire 08 00364 g013
Figure 14. Comparison between m s t and m a t under different ambient pressures.
Fire 08 00364 g014
Figure 15. Evolution of m s m o k e with the D L under different ambient pressures.
Fire 08 00364 g015
Figure 16. Evolution of m a i r with the D L under different ambient pressures.
Fire 08 00364 g016
Figure 17. Dimensionless smoke flow distribution under different ambient pressures.
Fire 08 00364 g017
Figure 18. Dimensionless airflow distribution under different ambient pressures.
Fire 08 00364 g018
Table 1. List of simulation cases.
Case No Upstream   Length   L u (m) Downstream   Length   L d (m)Ambient Pressure (kPa)HRR (MW)
1–65045050, 60, 70,
80, 90, 101
5
7–1290410
13–18130370
19–24170330
25–30210290
31–36250250
Disclaimer/Publisher’s Note: The statements, opinions and data contained in all publications are solely those of the individual author(s) and contributor(s) and not of MDPI and/or the editor(s). MDPI and/or the editor(s) disclaim responsibility for any injury to people or property resulting from any ideas, methods, instructions or products referred to in the content.