Quantifying Wildfire Dynamics Through Spatio-Temporal Clustering and Remote Sensing Metrics: The 2023 Quebec Case Study
Abstract
1. Introduction
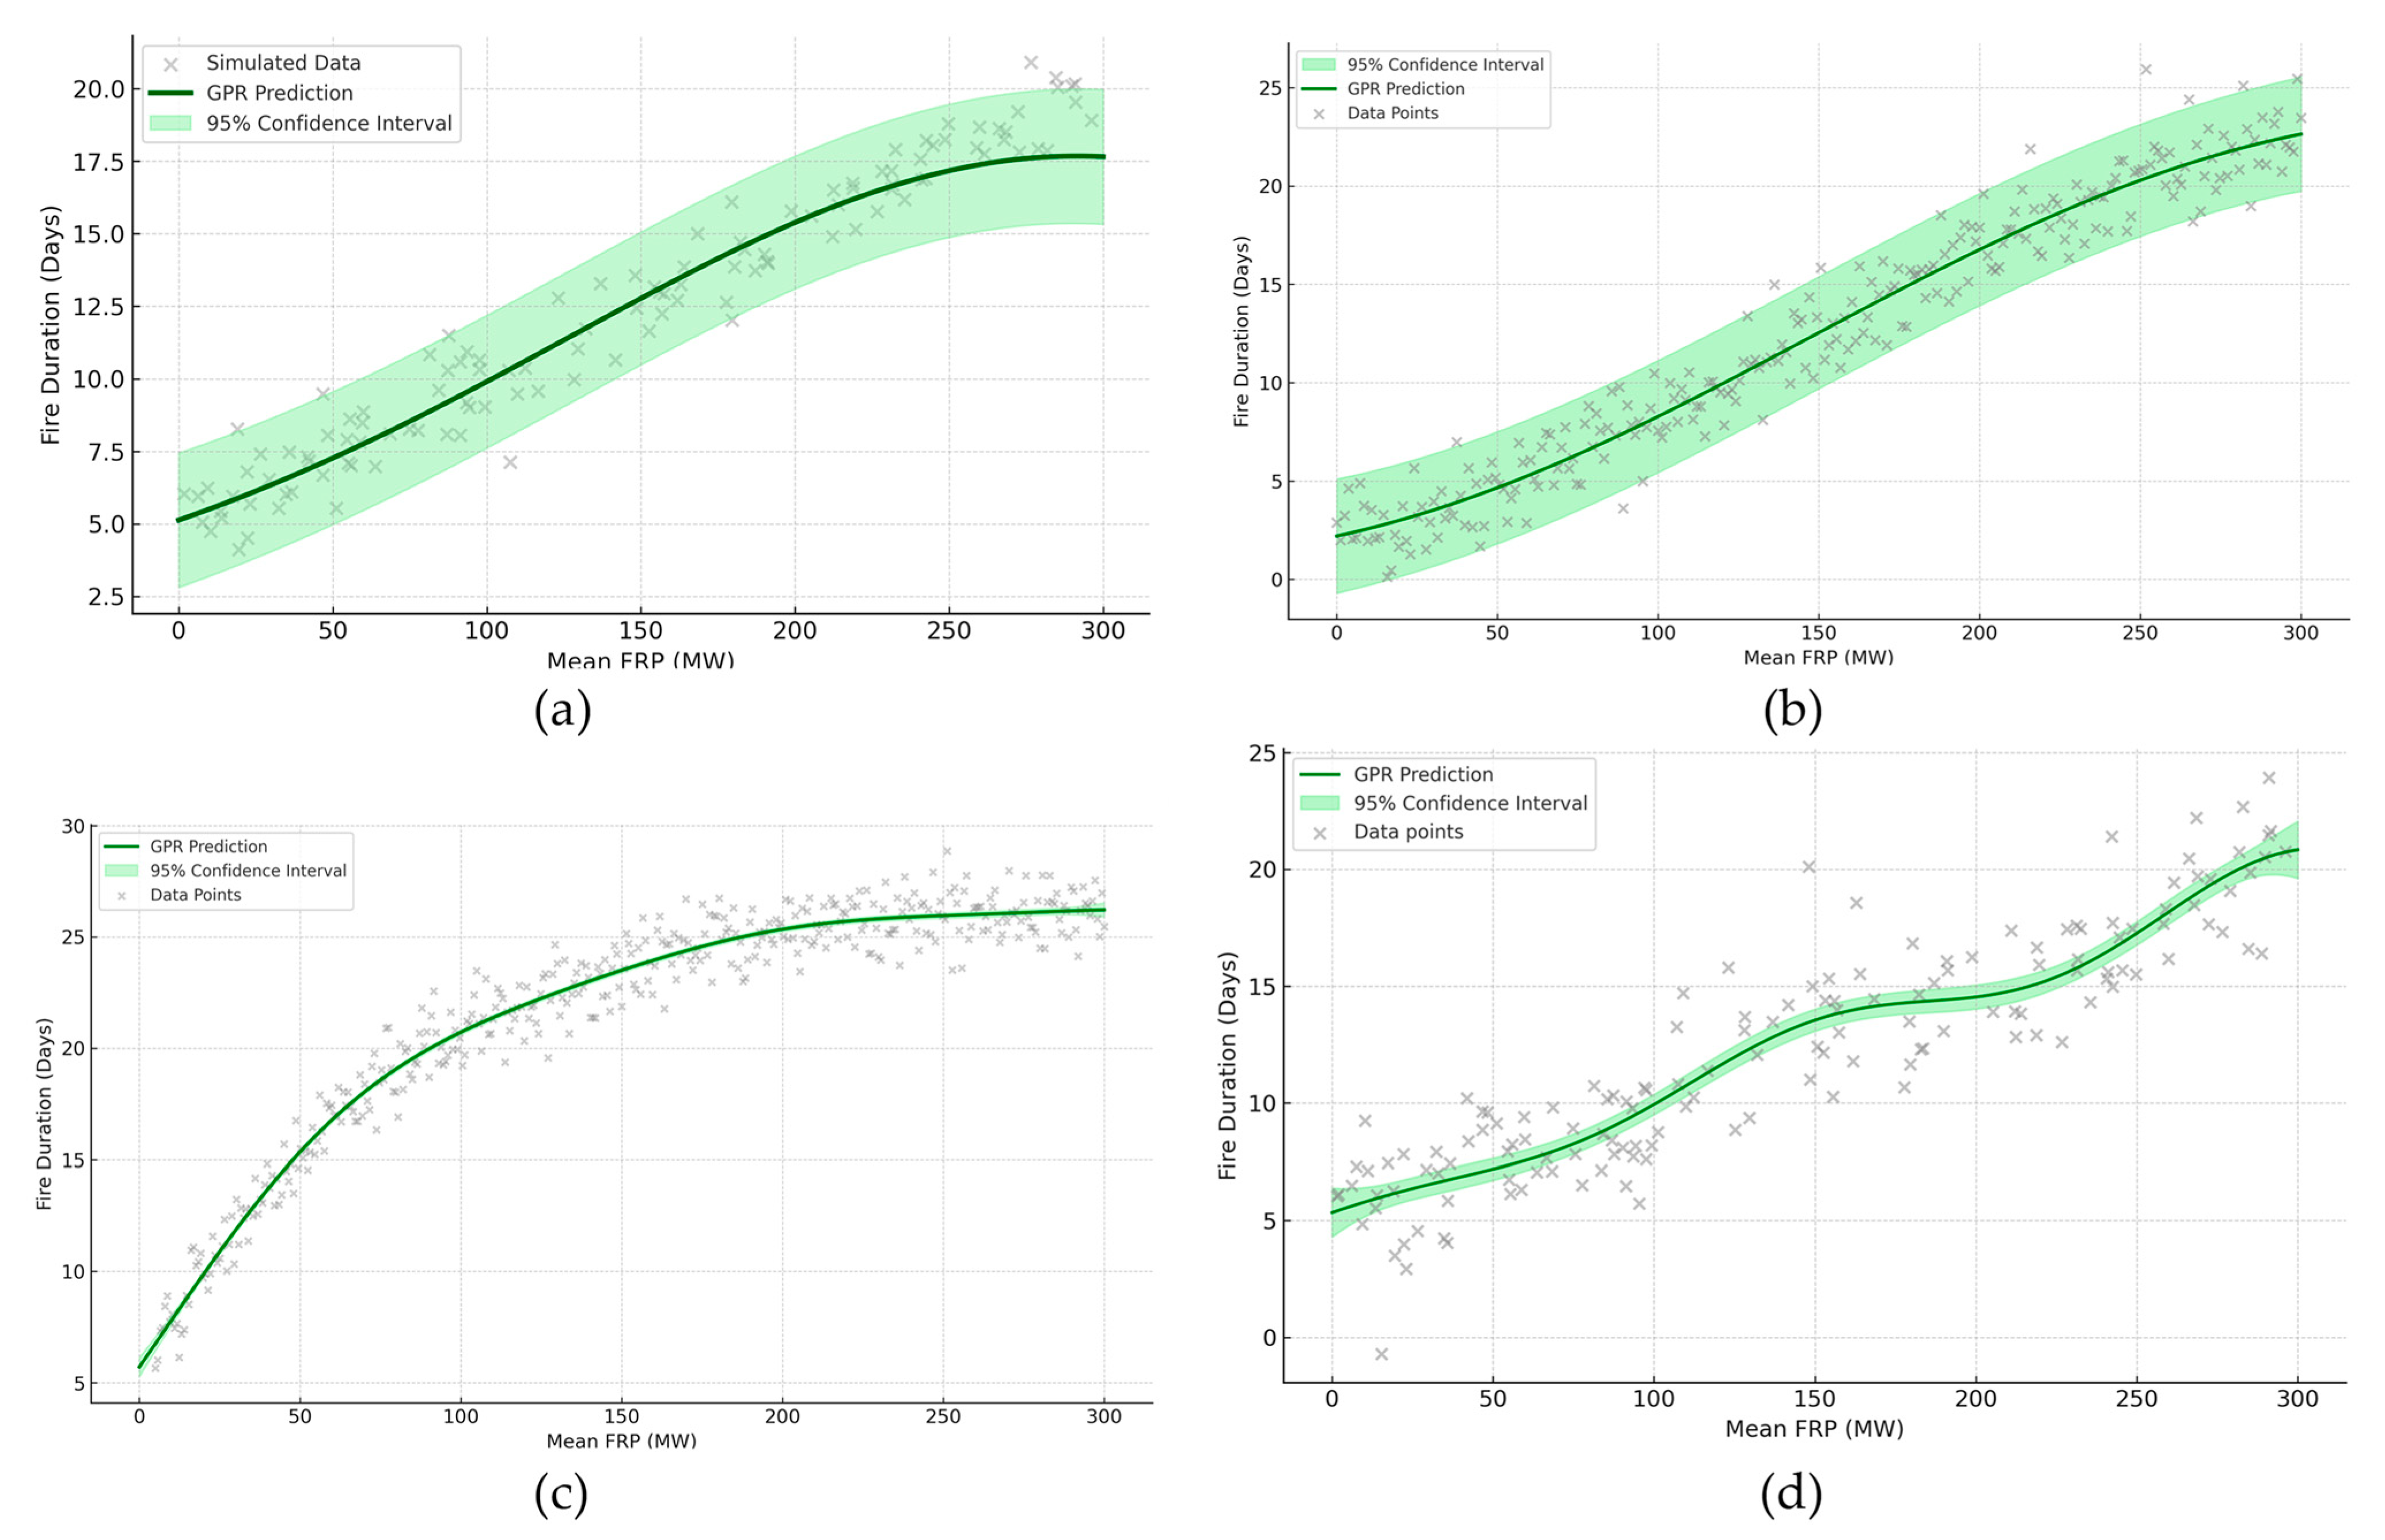
- H1: Fire clusters with longer durations and larger spatial extents exhibit higher mean FRP values, reflecting sustained, high-energy fire behavior.
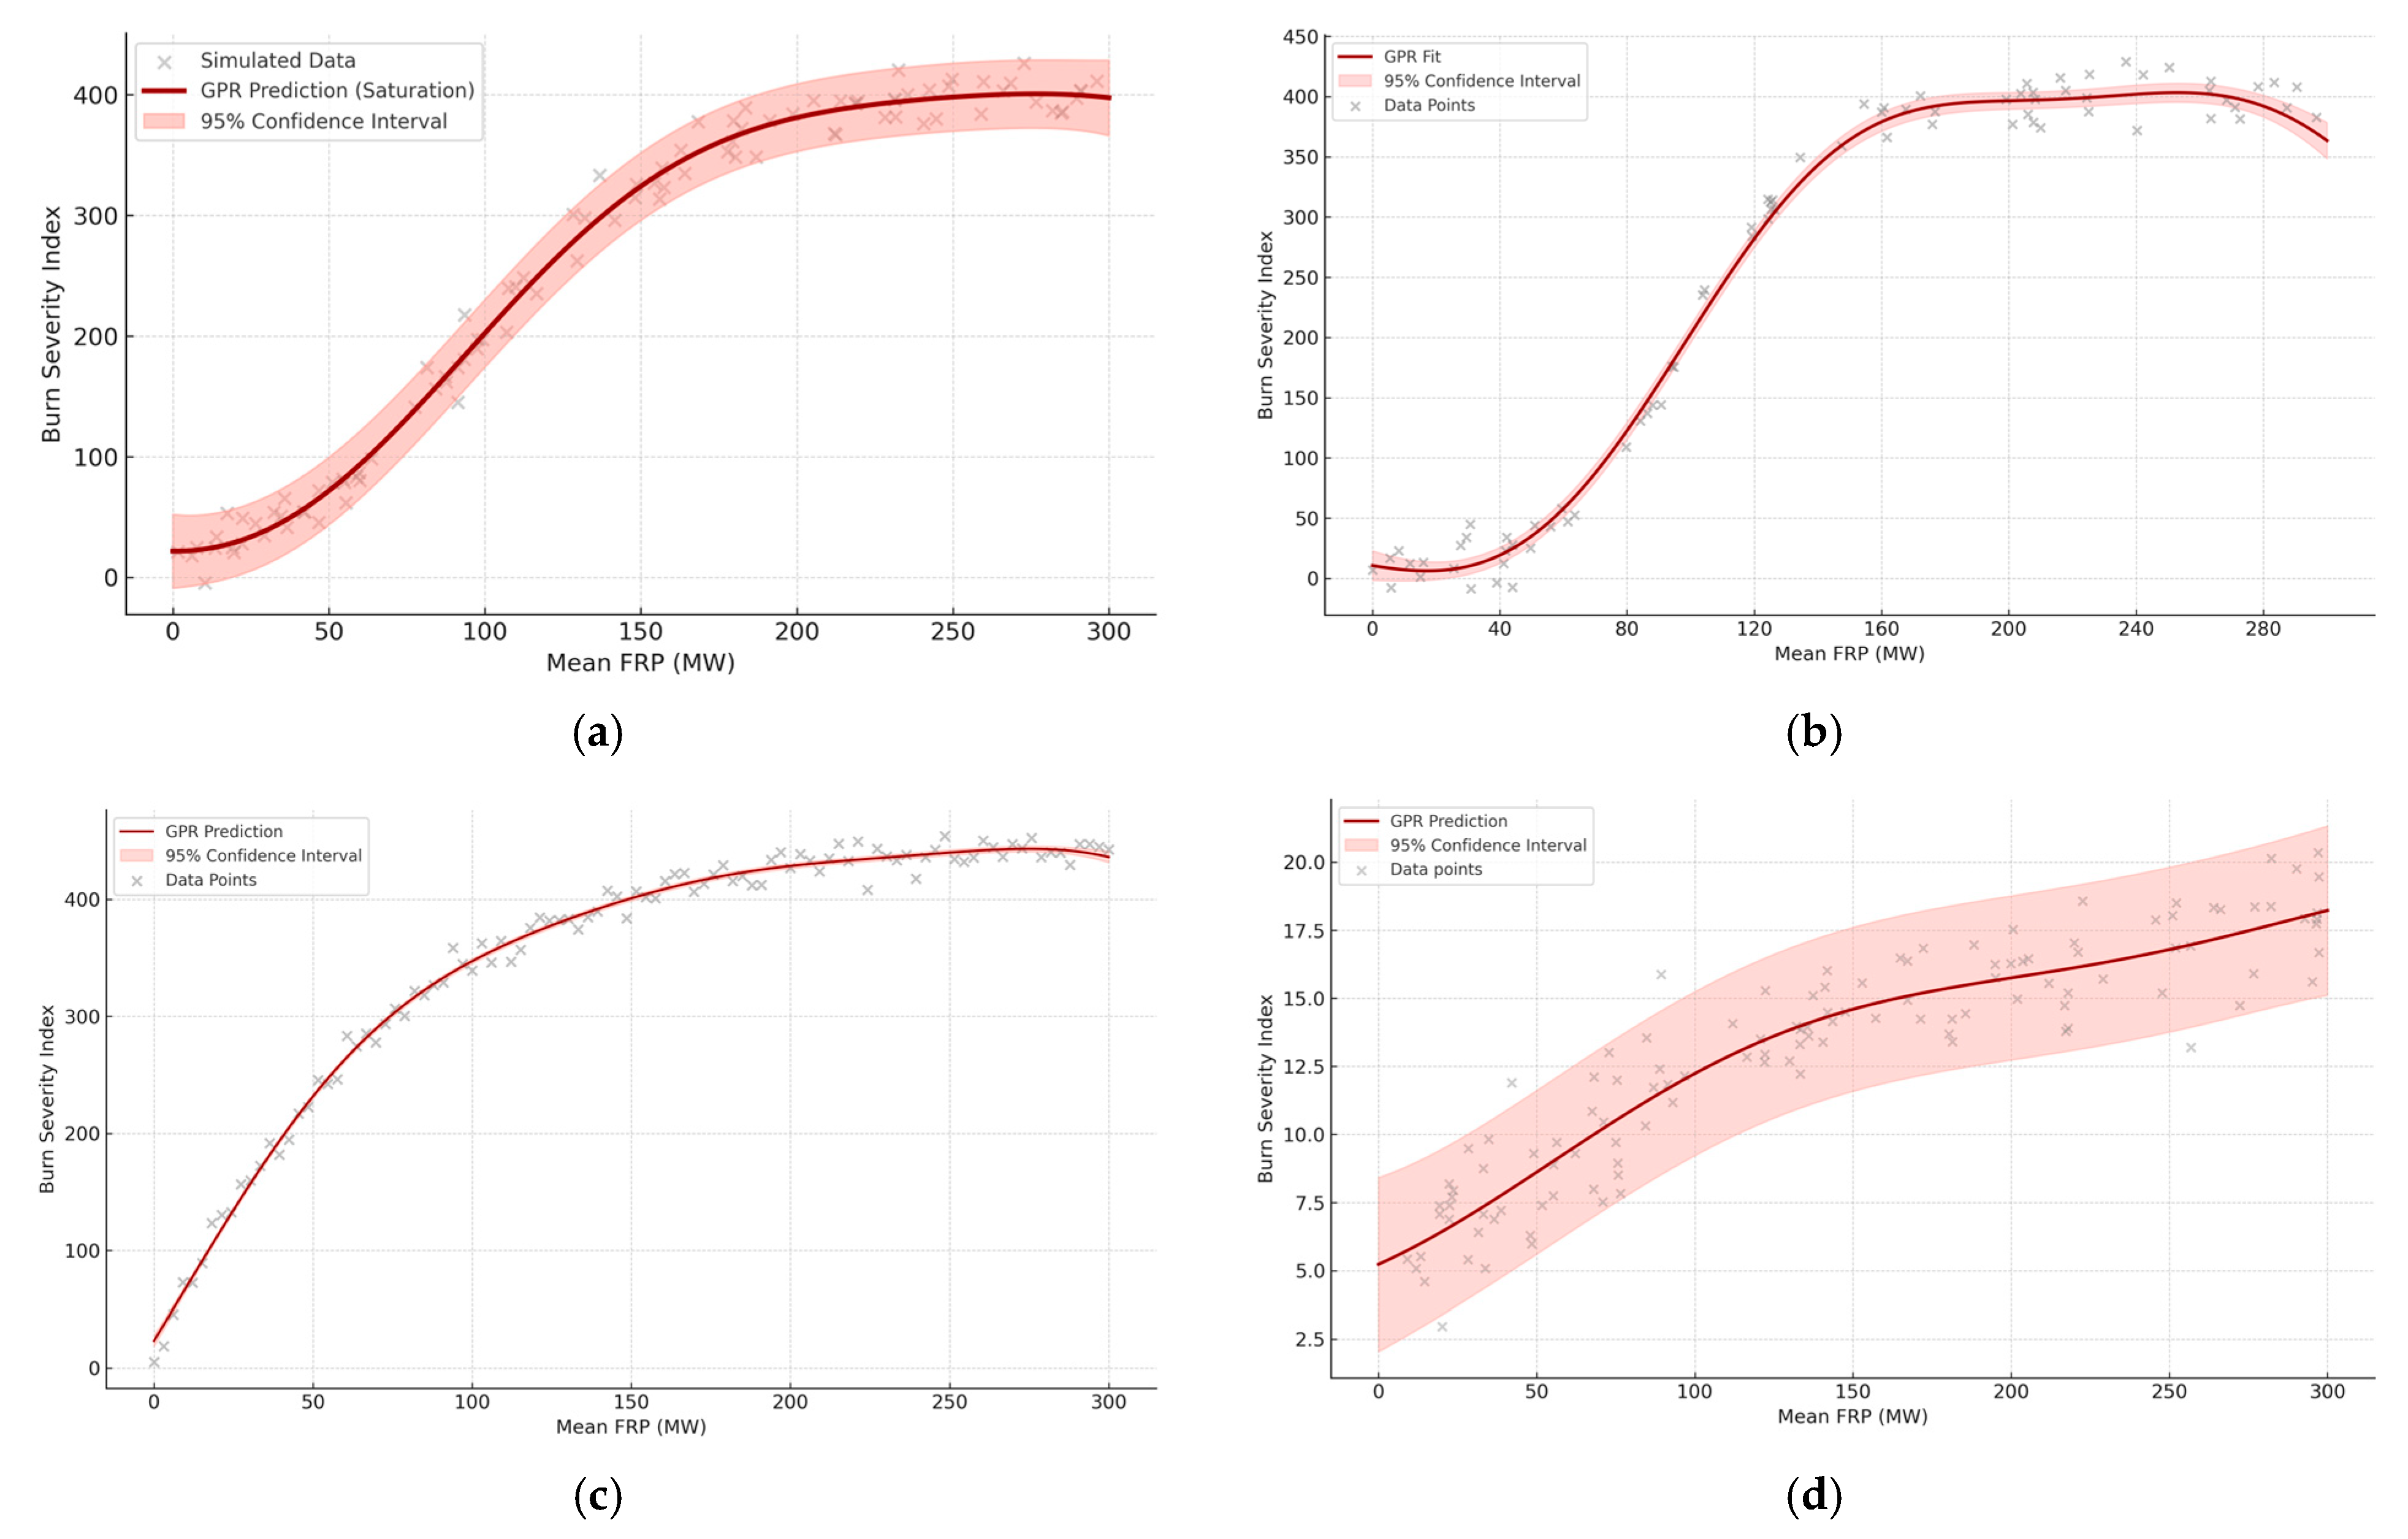
- H2: Higher FRP levels are associated with greater burn severity (ΔNBR), indicating a positive relationship between radiative intensity and ecological impact.
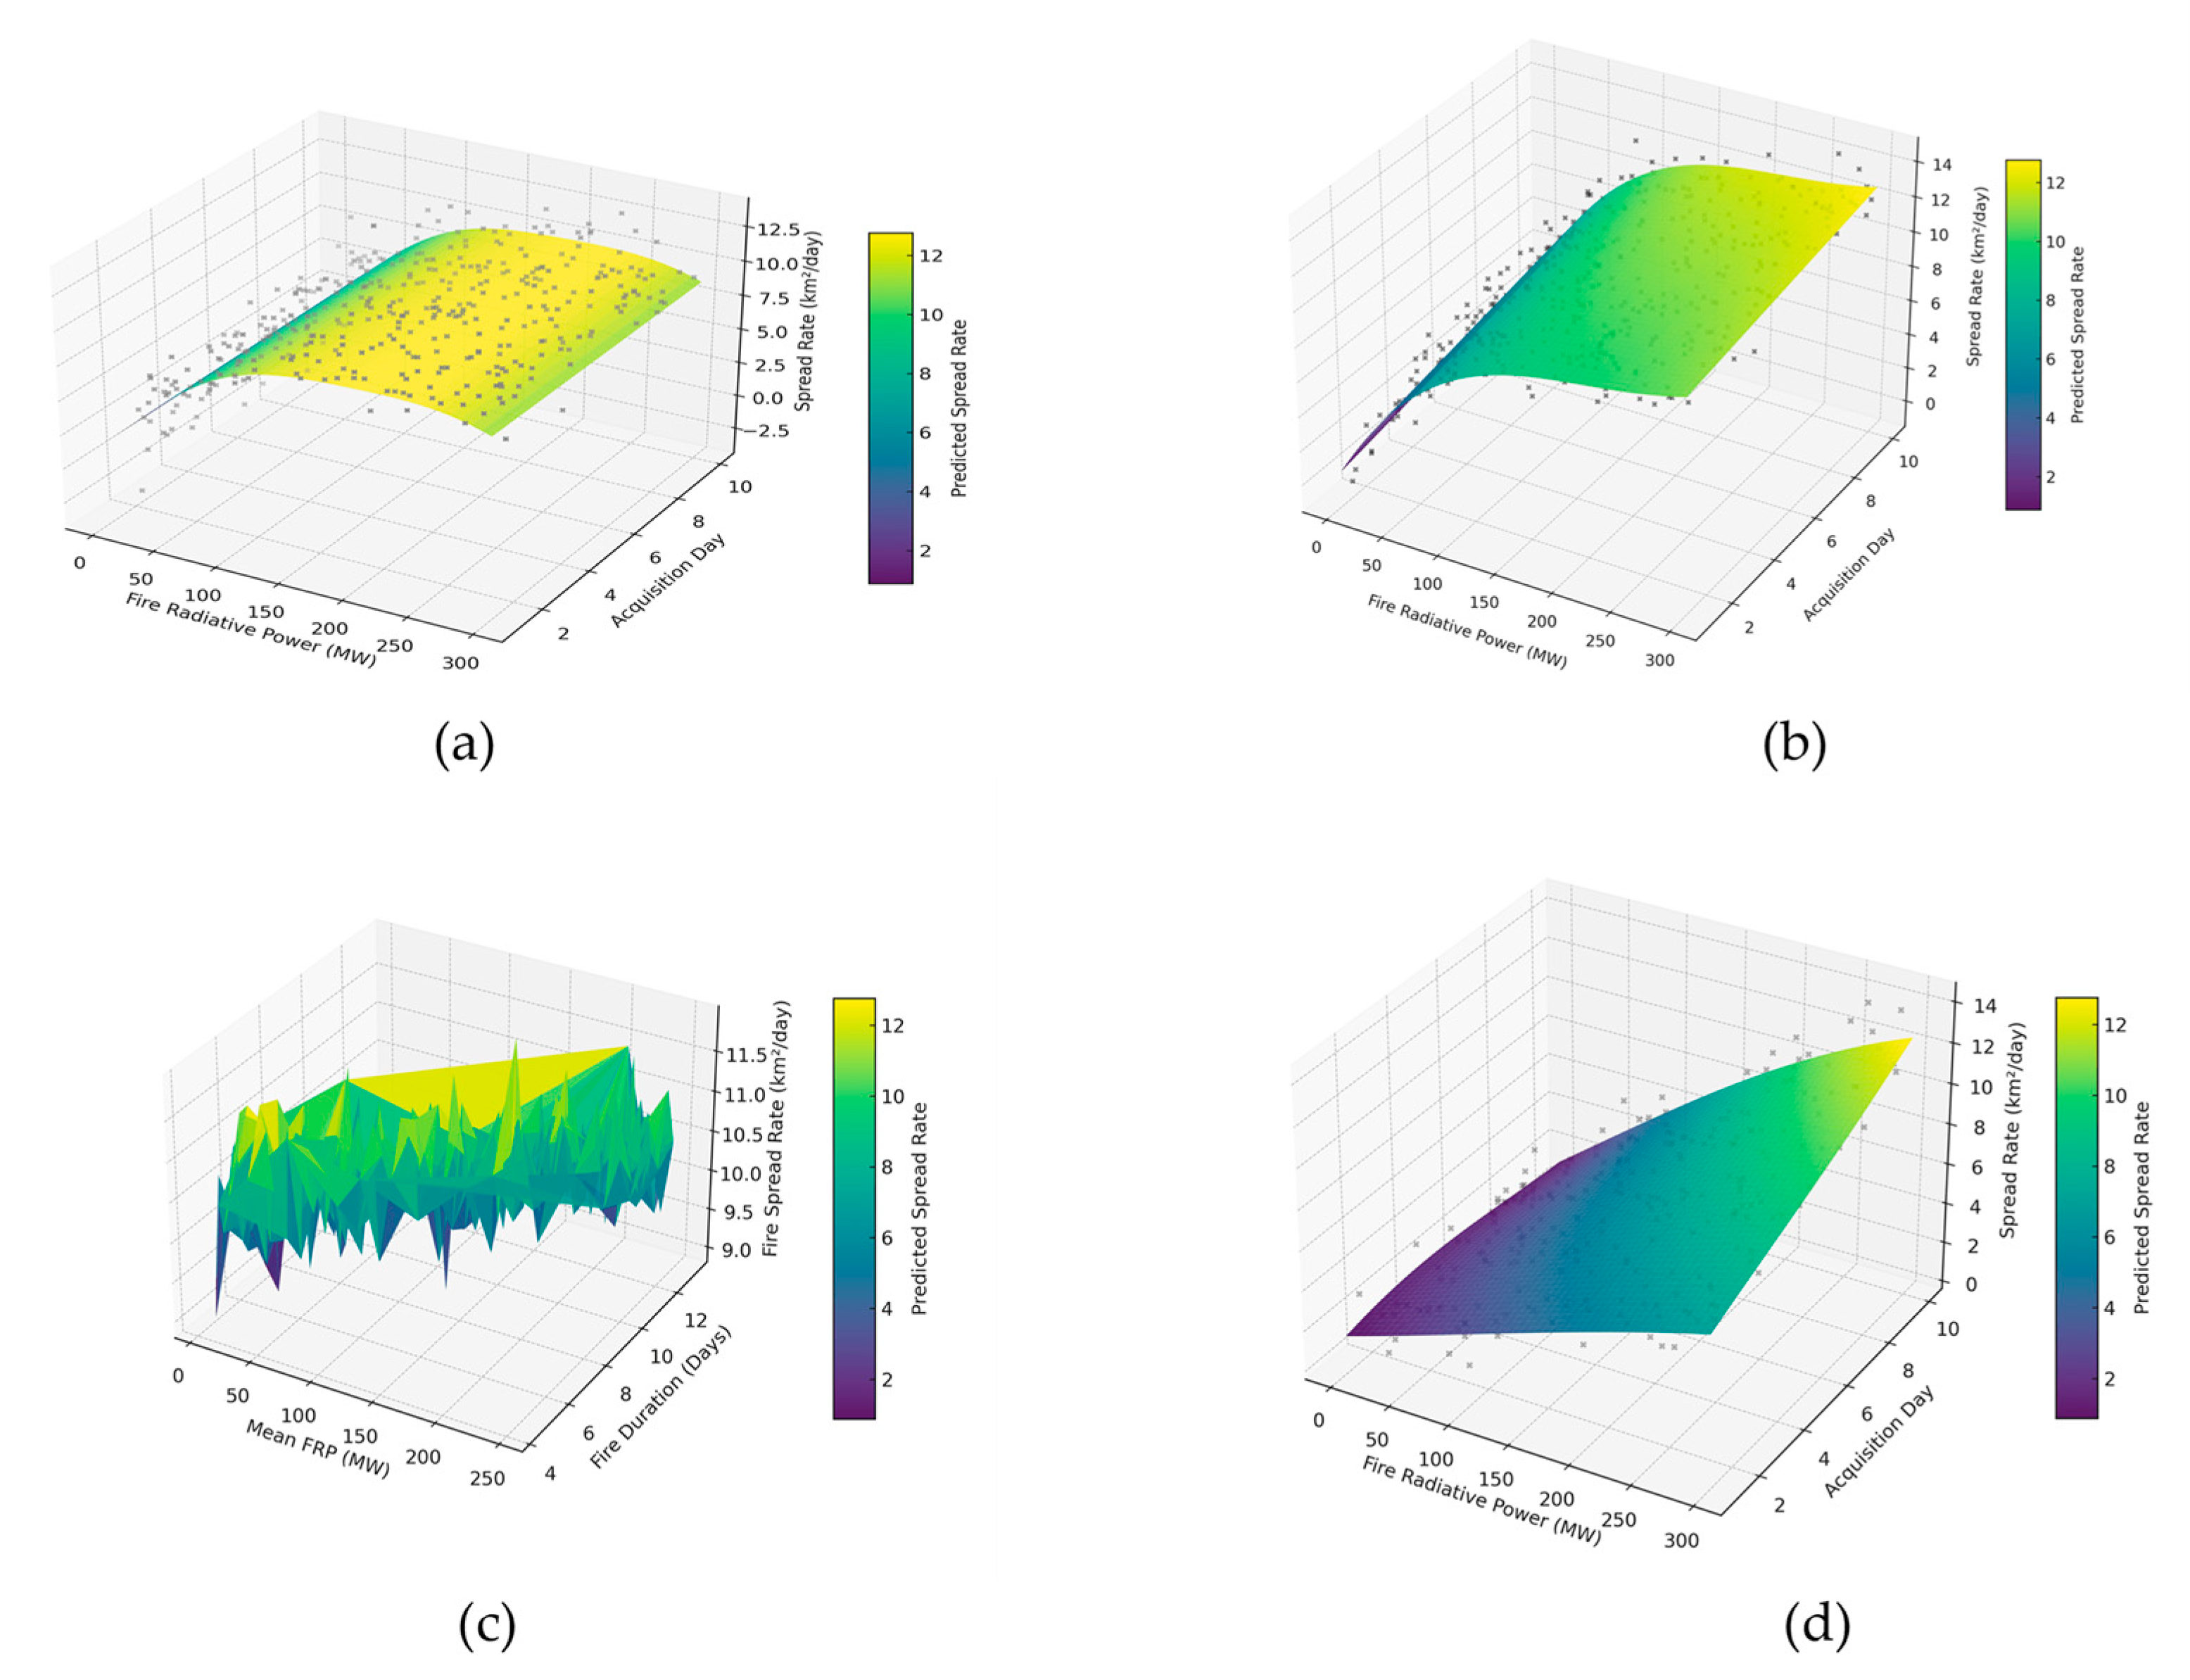
- H3: The rate of fire spread is positively influenced by both FRP and fire duration, though this relationship may vary depending on local factors, such as wind or fuel continuity. Although external variables, such as wind or fuel continuity, are not directly modeled, their influence is implicitly captured through the residual structure of the GPR model, which accounts for unexplained variance in the data.
2. Study Area and Data Requirements
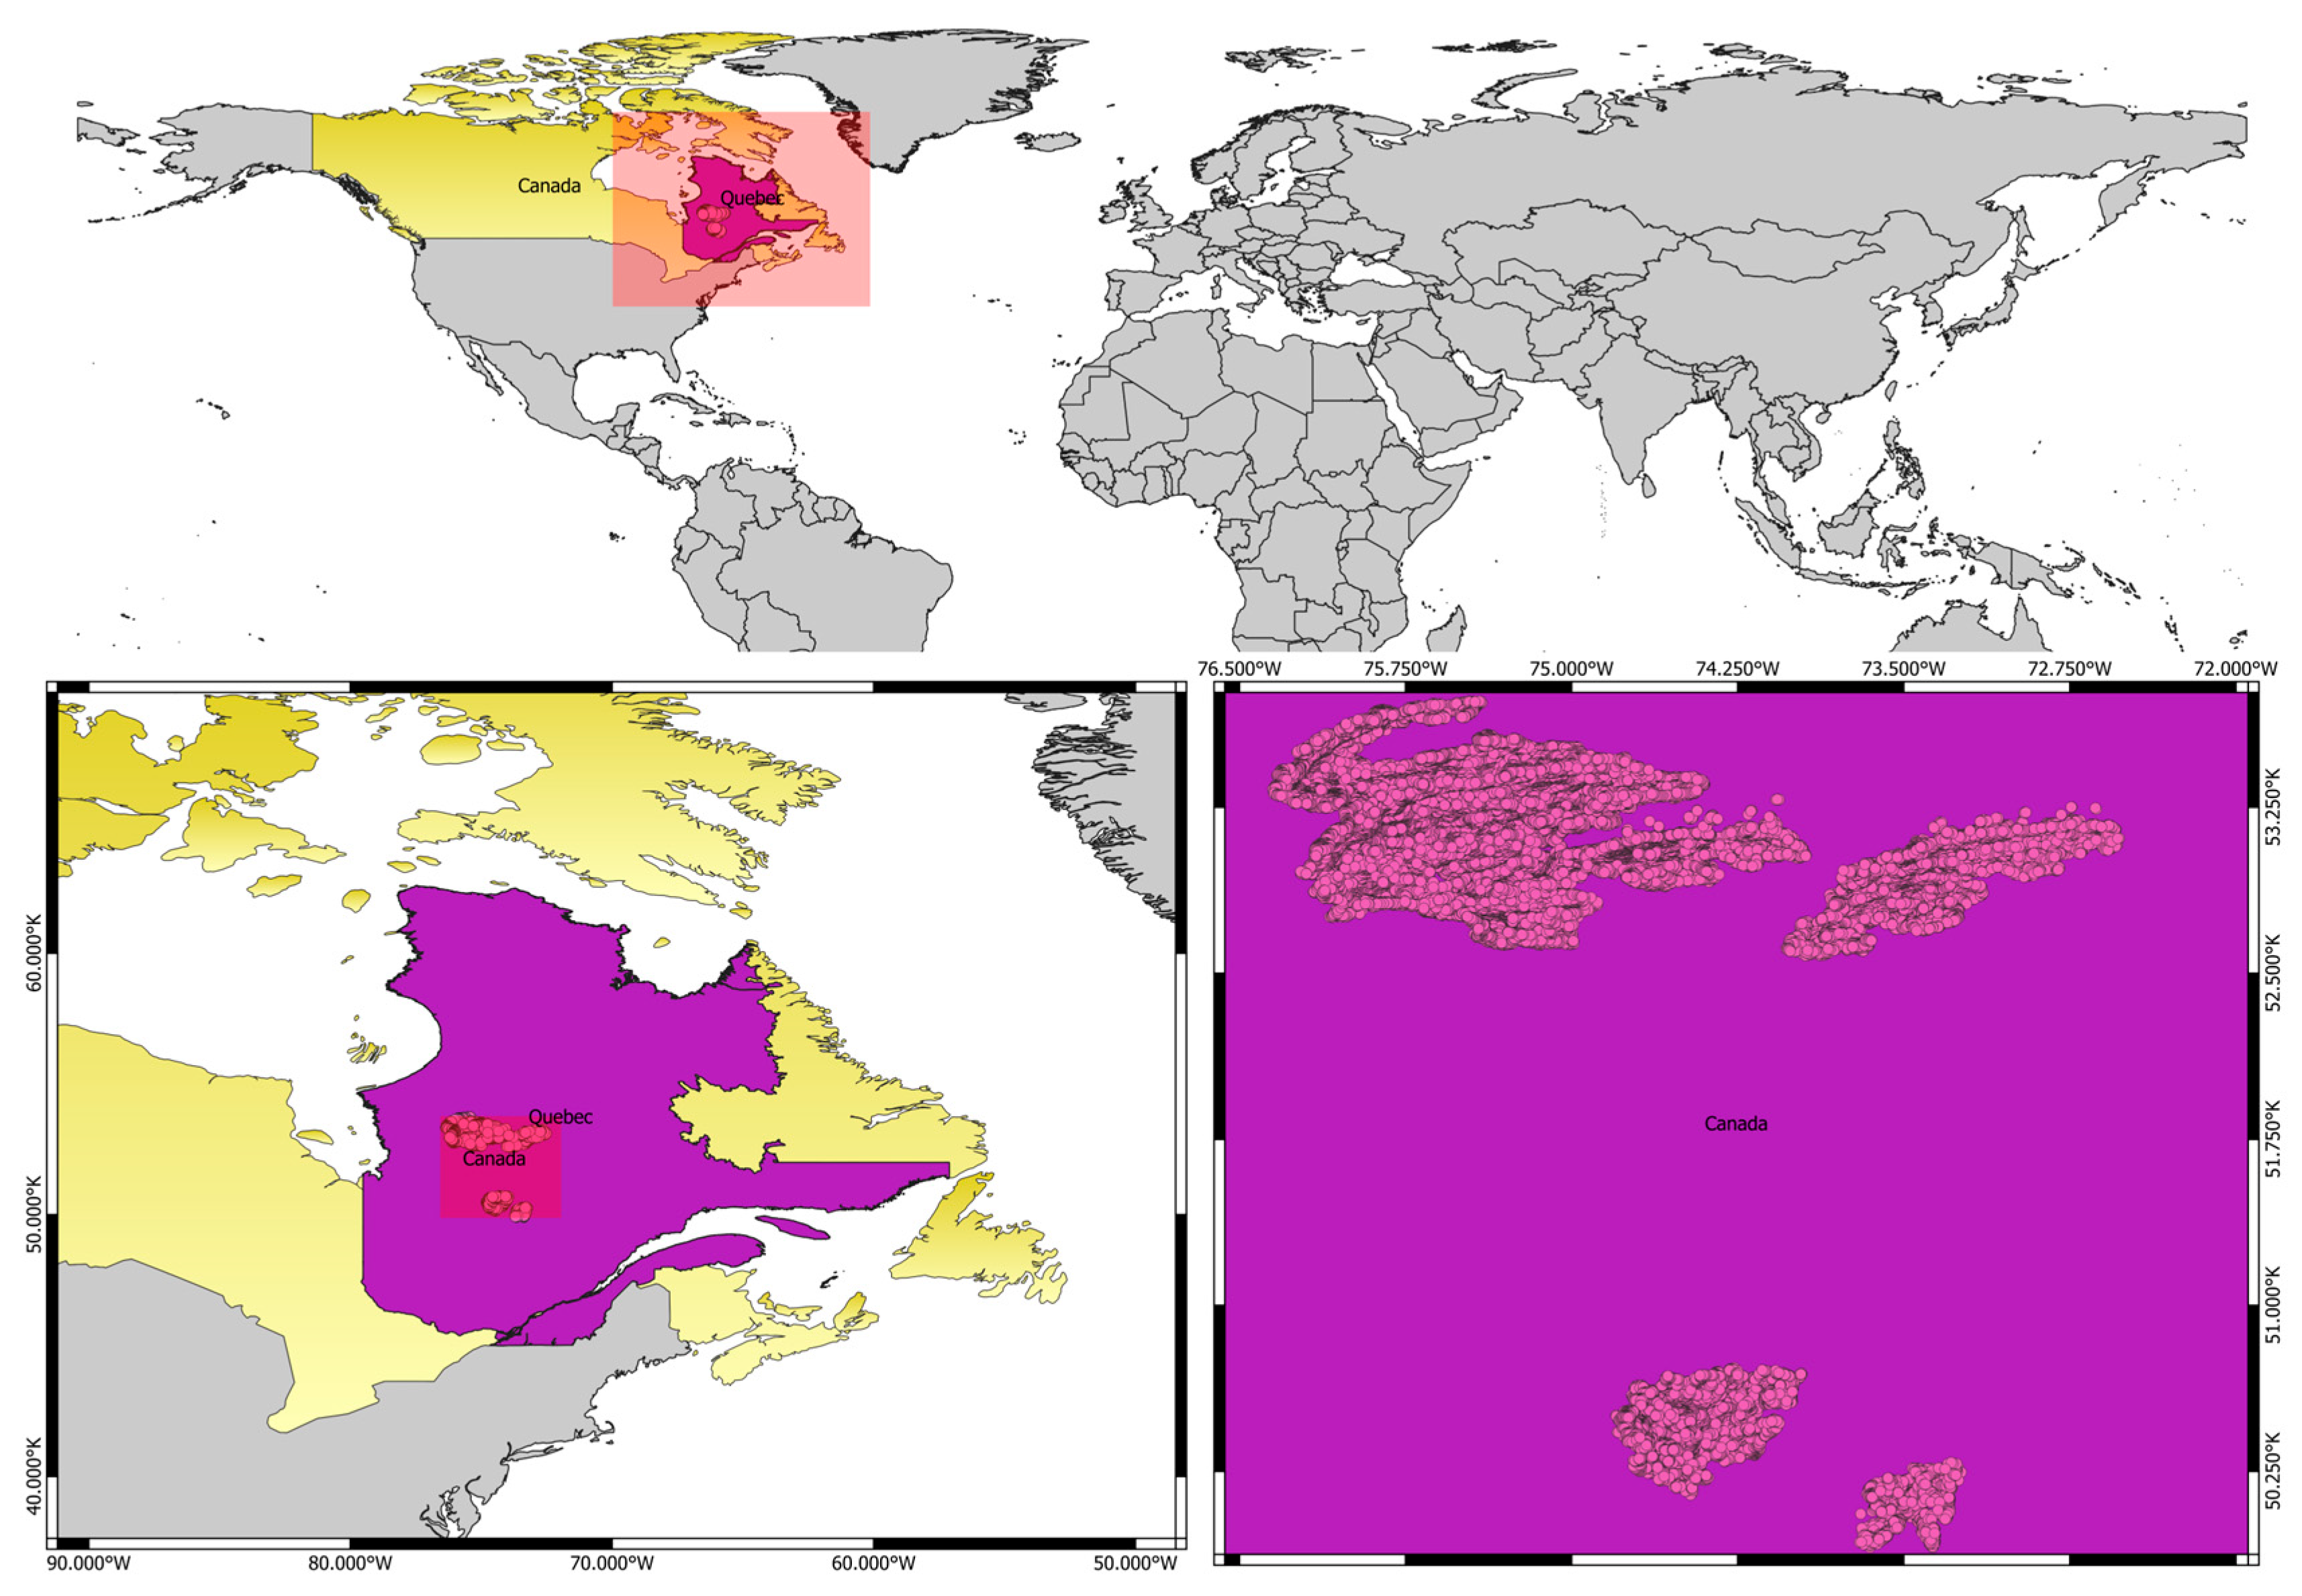
2.1. Study Area
2.2. Datasets
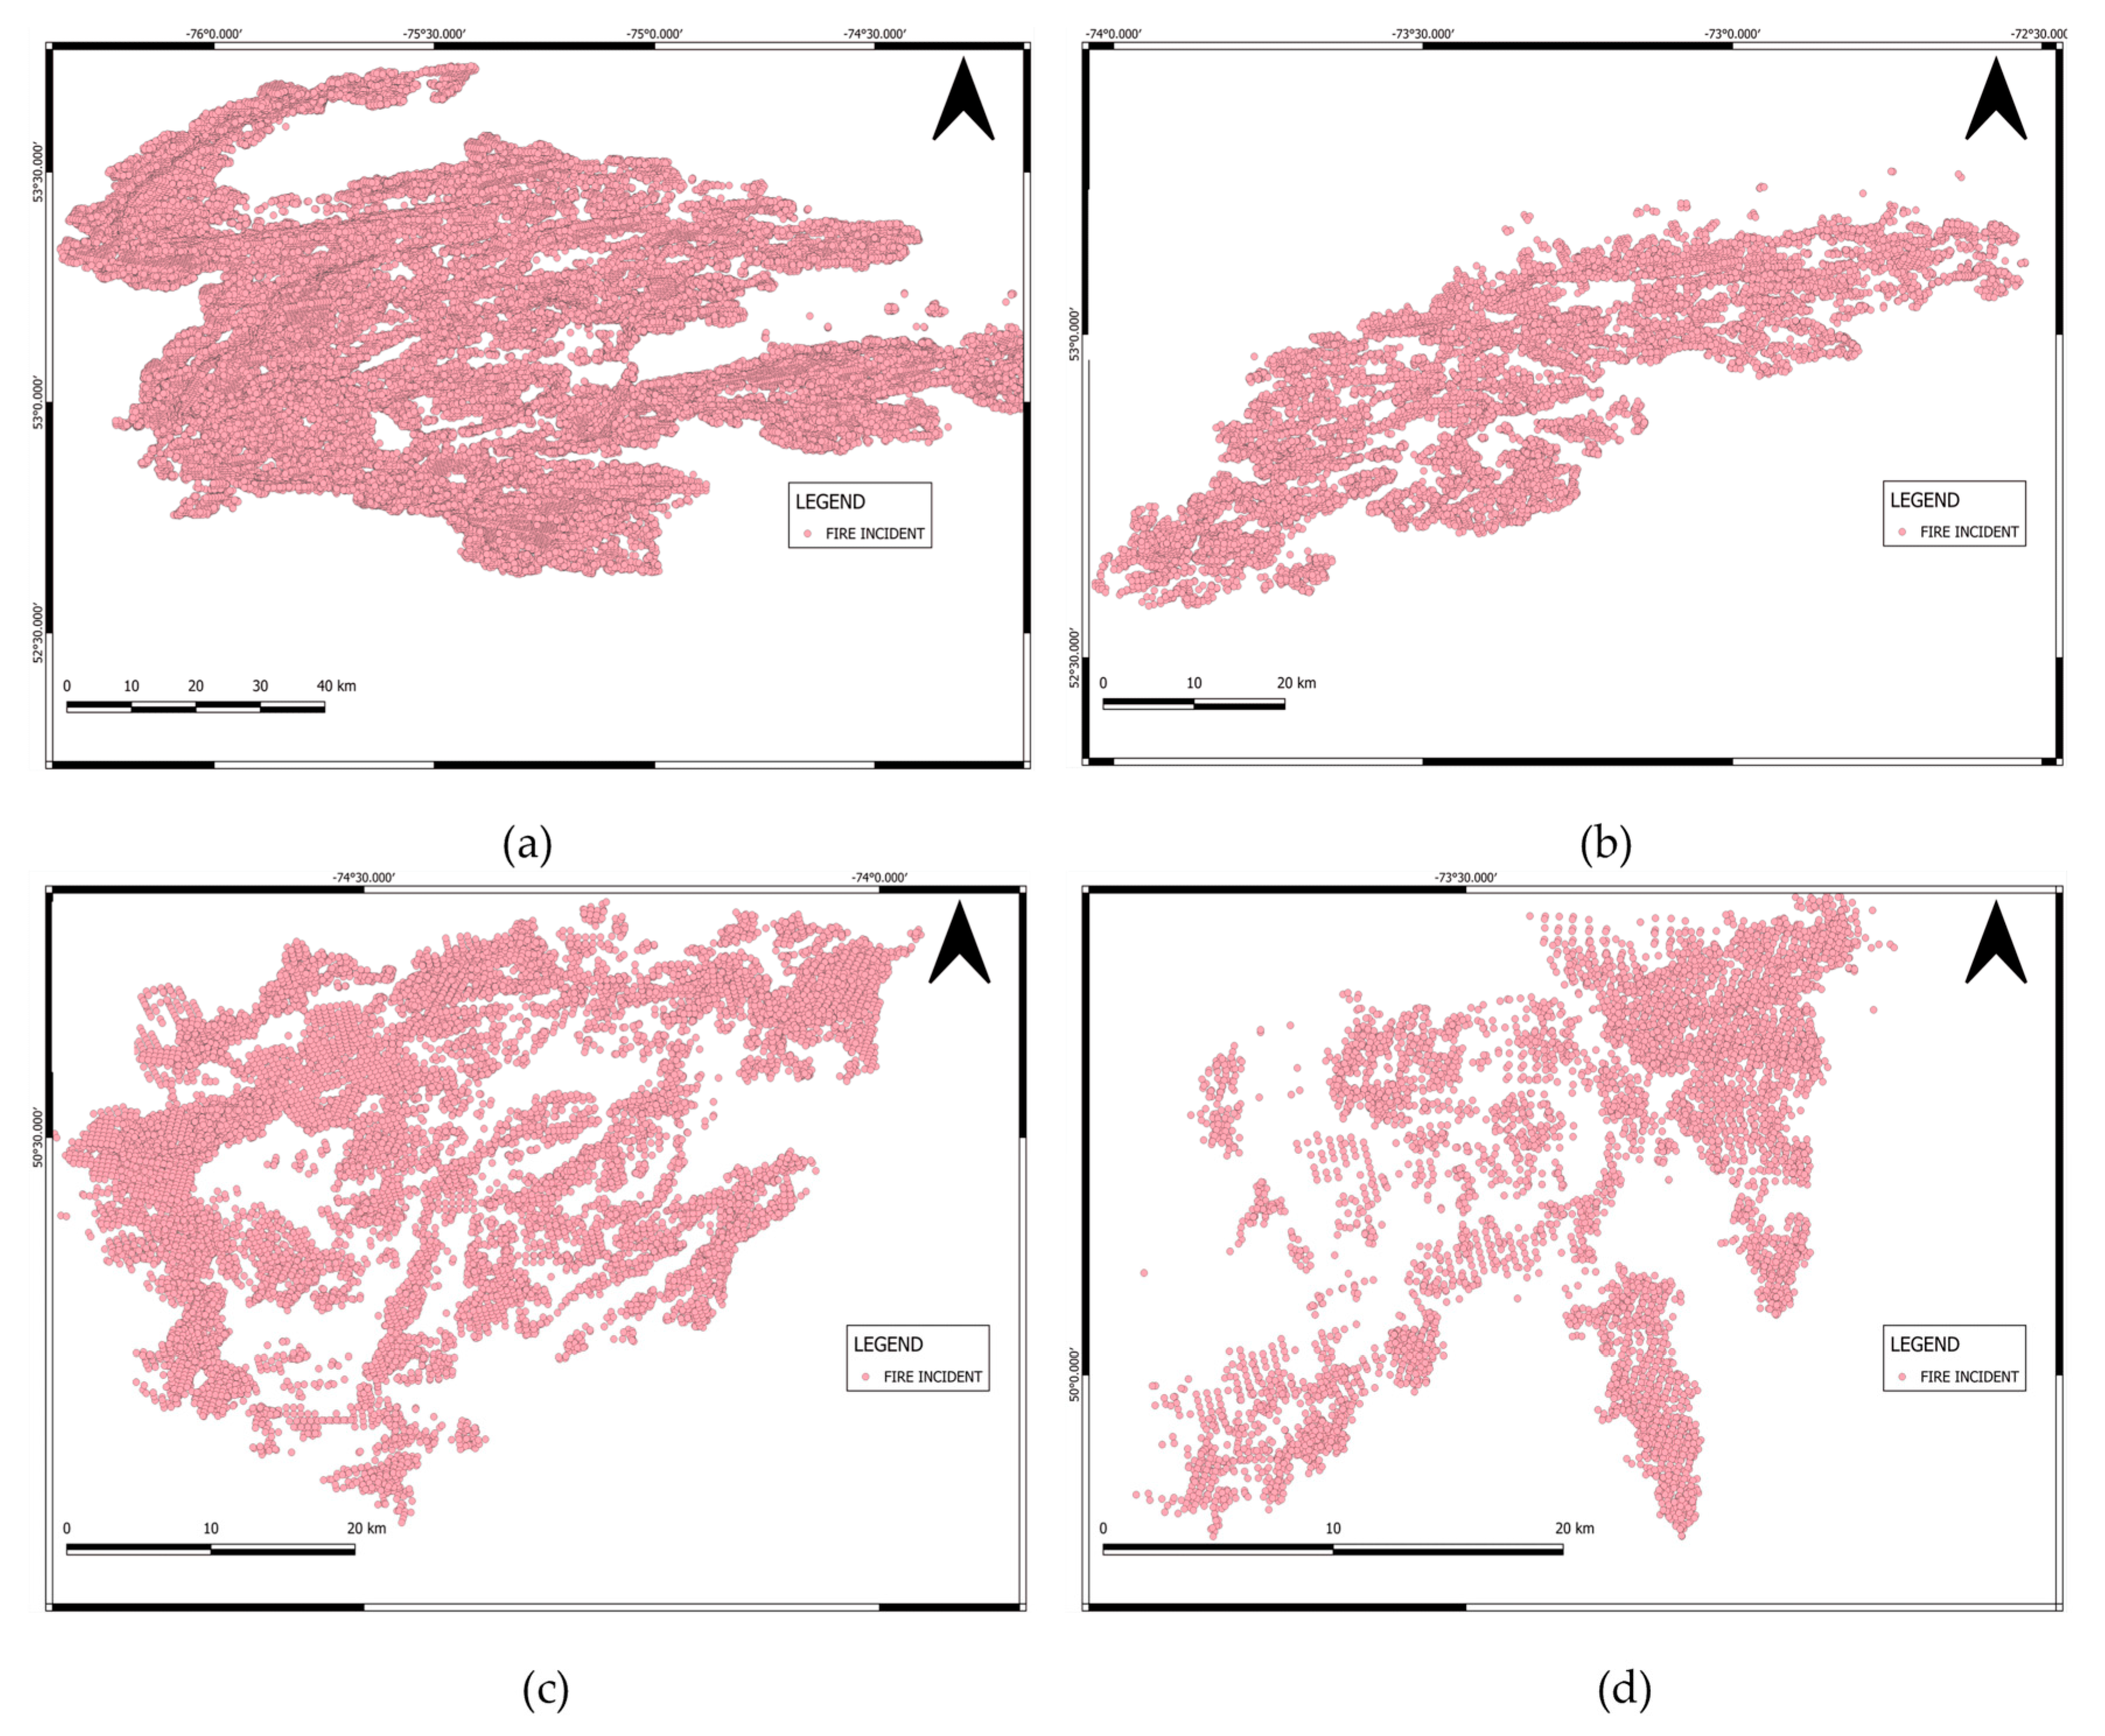
- Active Fire and FRP Data: The core dataset for analyzing spatio-temporal fire dynamics consists of active fire detections sourced from the NASA FIRMS platform. Data from the VIIRS instruments aboard the Suomi-NPP and NOAA-20 satellites were acquired for June 2023. VIIRS provides active fire detections at a spatial resolution of ~375 m and includes essential attributes for each hotspot, namely, geographic coordinates, acquisition date and time, and FRP (MW), which serves as a proxy for fire intensity [28]. A full description of the VIIRS data attributes is provided in Table 1.
- Burn Severity Data: To evaluate post-fire effects, the NBR was calculated using multispectral imagery from the Landsat 8 OLI/TIRS sensor. In accordance with established methodologies [29,30], Band 5 (Near Infrared, NIR) and Band 7 (Shortwave Infrared, SWIR 2) were used to assess burn severity, as these bands are highly sensitive to changes in vegetation moisture and structure caused by fire.
- Reference Data for Validation: To quantitatively validate the perimeters derived from the ST-DBSCAN algorithm, the National Burned Area Composite (NBAC) was used as a reference dataset [31]. Produced by Natural Resources Canada, the NBAC provides authoritative, polygon-based perimeters of large fires (>200 ha) and serves as the ground-truth benchmark for our spatial accuracy assessment.
2.3. Data Preprocessing
- VIIRS Data Integration and Preparation: The separate VIIRS S-NPP and NOAA-20 active fire datasets were merged into a single vector layer. A unified timestamp attribute was generated from the original acquisition date and time fields. While all attributes were retained for descriptive purposes, the core inputs for the clustering algorithm were the geographic coordinates, the new timestamp, and the FRP values. Table 2 presents sample rows from this final preprocessed dataset.
- Landsat Data Preparation: Pre- and post-fire Landsat 8 OLI/TIRS Collection 2 Level-2 Surface Reflectance products were used. These data, already atmospherically corrected, were spatially aligned and clipped to the extent of each fire zone of interest prior to NBR calculation [30].
- Reference Data Preparation: The NBAC vector polygons were reprojected to this study’s coordinate system (UTM) and clipped to the relevant analysis regions to ensure direct spatial alignment with the ST-DBSCAN outputs for validation.
3. Methods
3.1. Spatio-Temporal Clustering with ST-DBSCAN
3.1.1. Core Principles and Formulation
- Core point: A point with at least MinPts neighbors within its spatio-temporal neighborhood.
- Border point: A point that is not a core point but lies within the neighborhood of one.
- Noise point: A point that is neither a core nor a border point.
3.1.2. Parameter Selection and Optimization
- Spatial Epsilon ( = 2700 m): This threshold enables the linkage of fire detections from adjacent or nearby pixels while avoiding the erroneous merging of separate fire events. It reflects the spatial resolution of VIIRS (~375 m) and accounts for geolocation uncertainties.
- Temporal Epsilon ( = 72 h): A three-day window was chosen to accommodate observation gaps caused by cloud cover or orbital limitations while capturing the full evolution of single fire episodes.
- Minimum Points (MinPts = 5): This value effectively filters out isolated or spurious detections while preserving smaller, yet coherent, fire clusters.
3.2. Cluster Validation with IoU Accuracy Assessment
Methodology
- Cluster ∩ NBAC is the intersection area between the ST-DBSCAN cluster and the NBAC fire perimeter.
- Cluster ∪ NBAC is the union of their spatial extents.
3.3. Fire Behavior and Impact Metrics
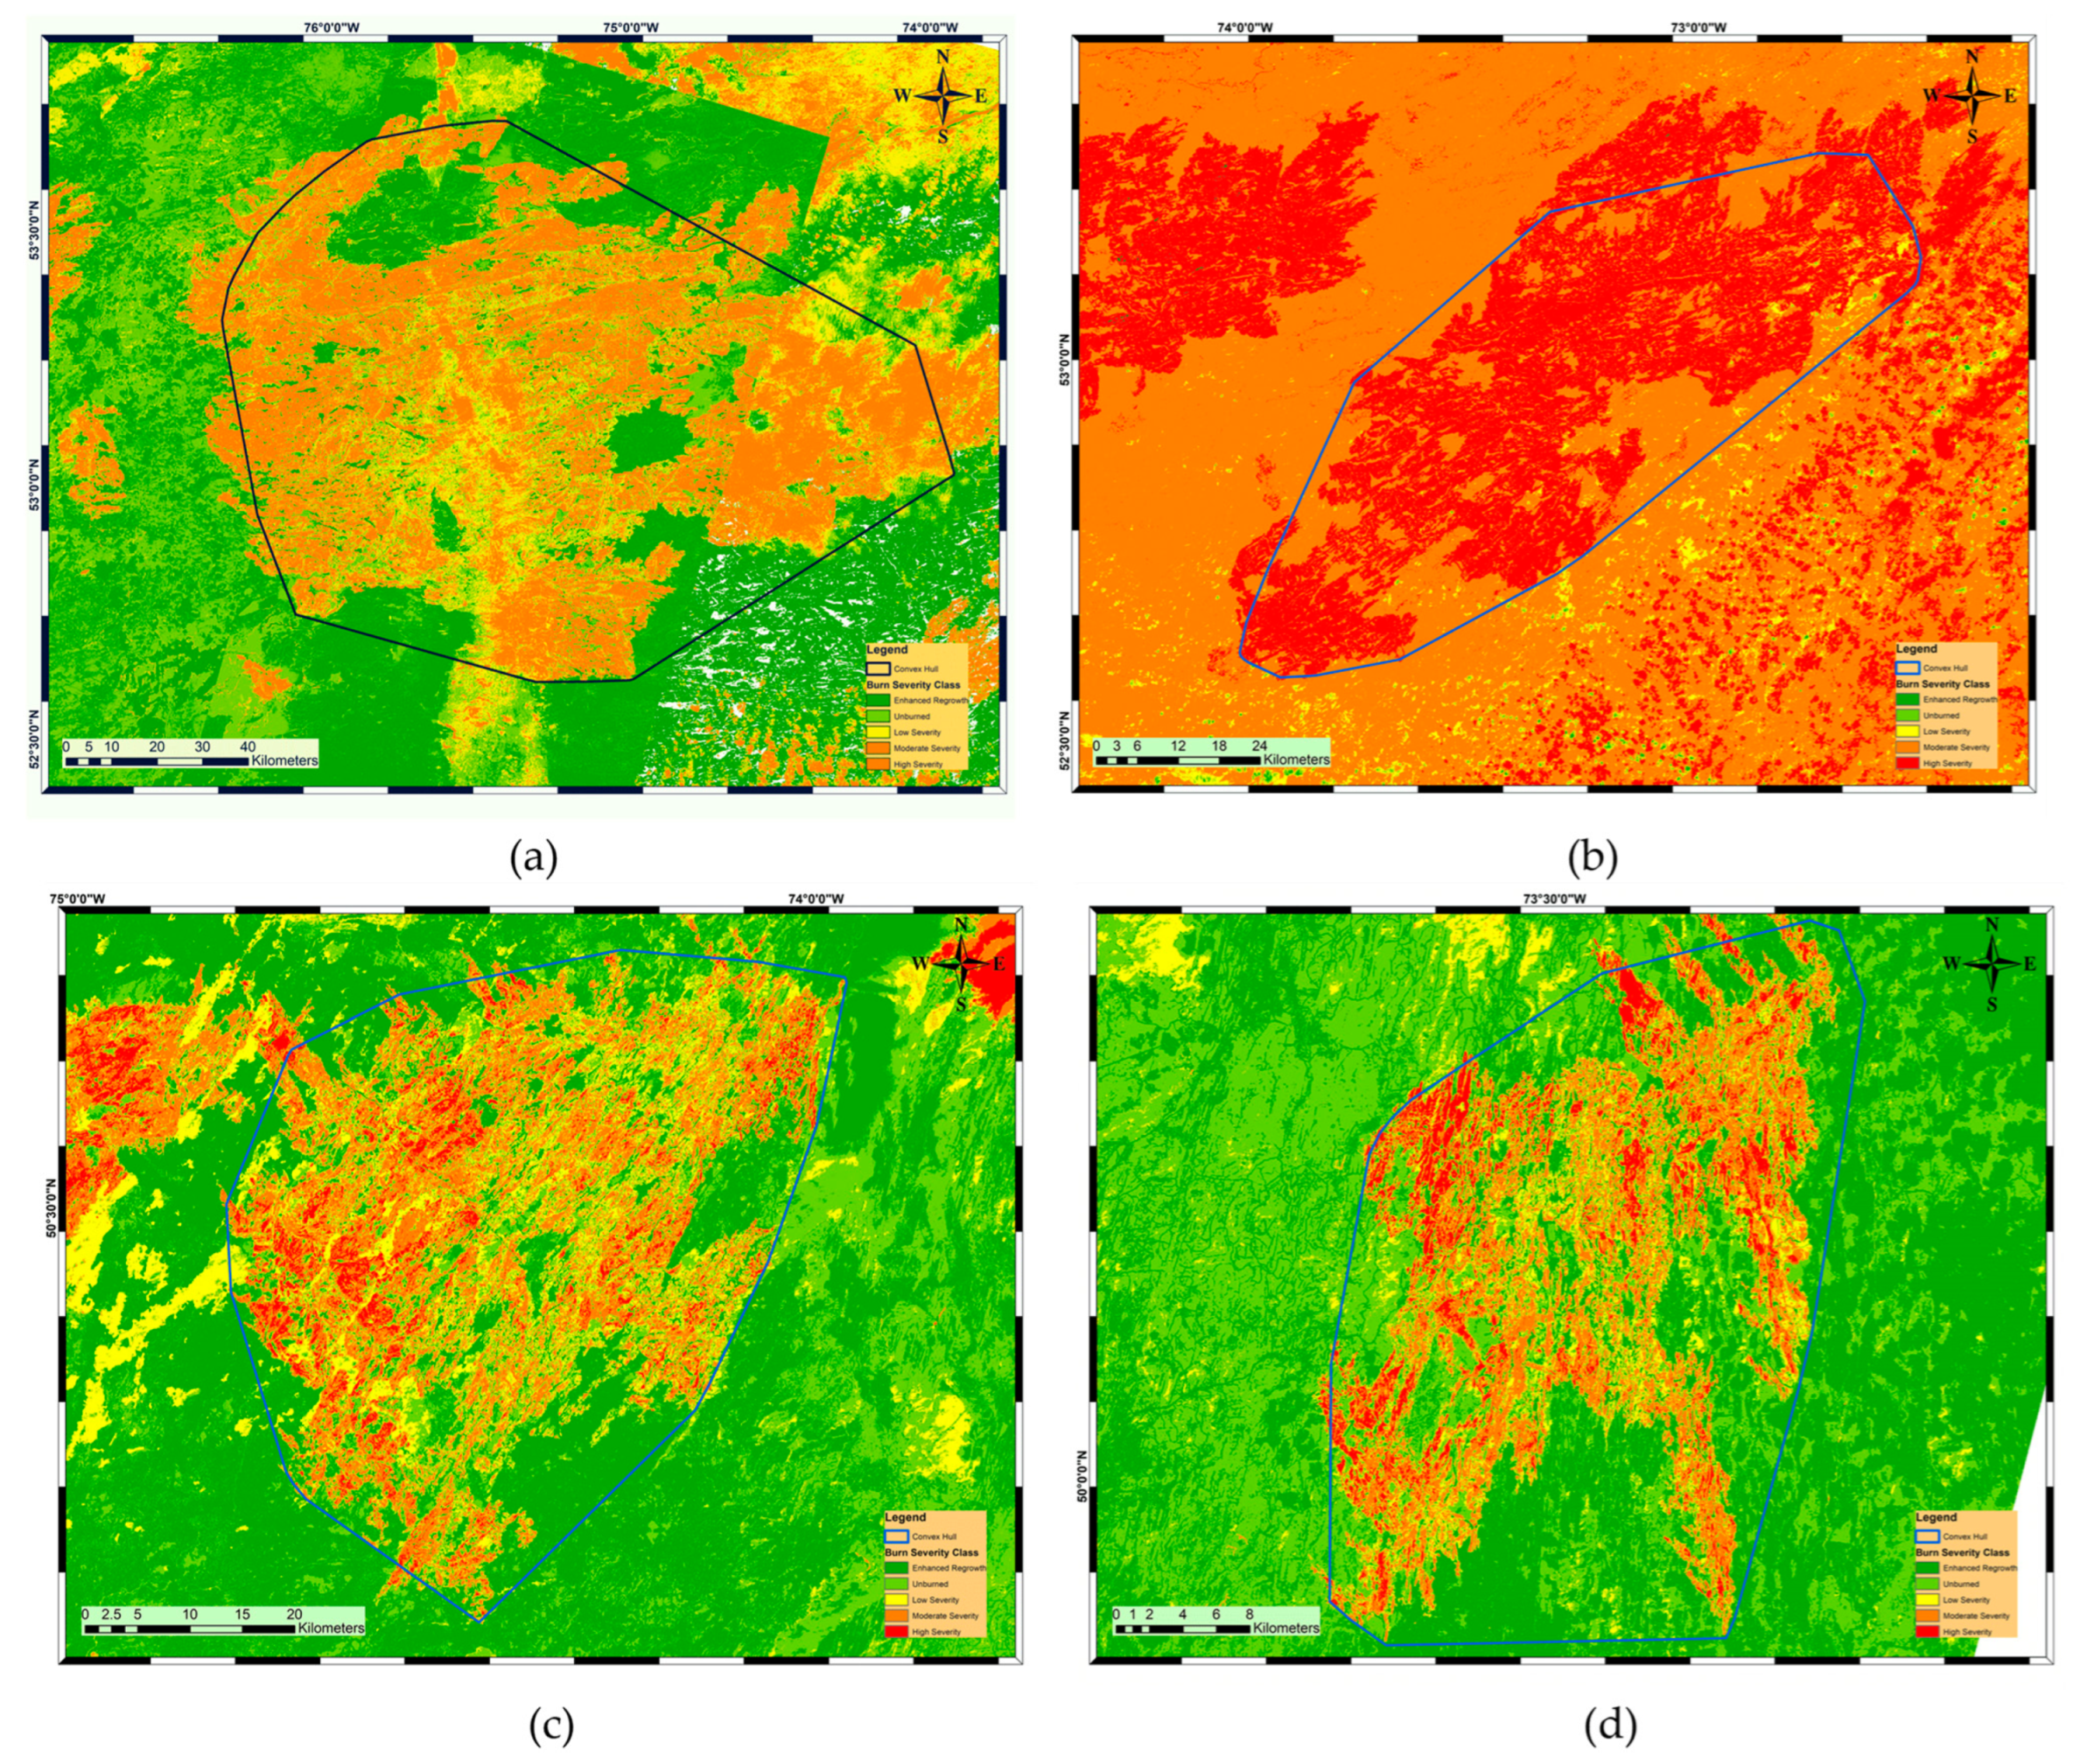
3.3.1. Burn Severity: ΔNBR Calculation
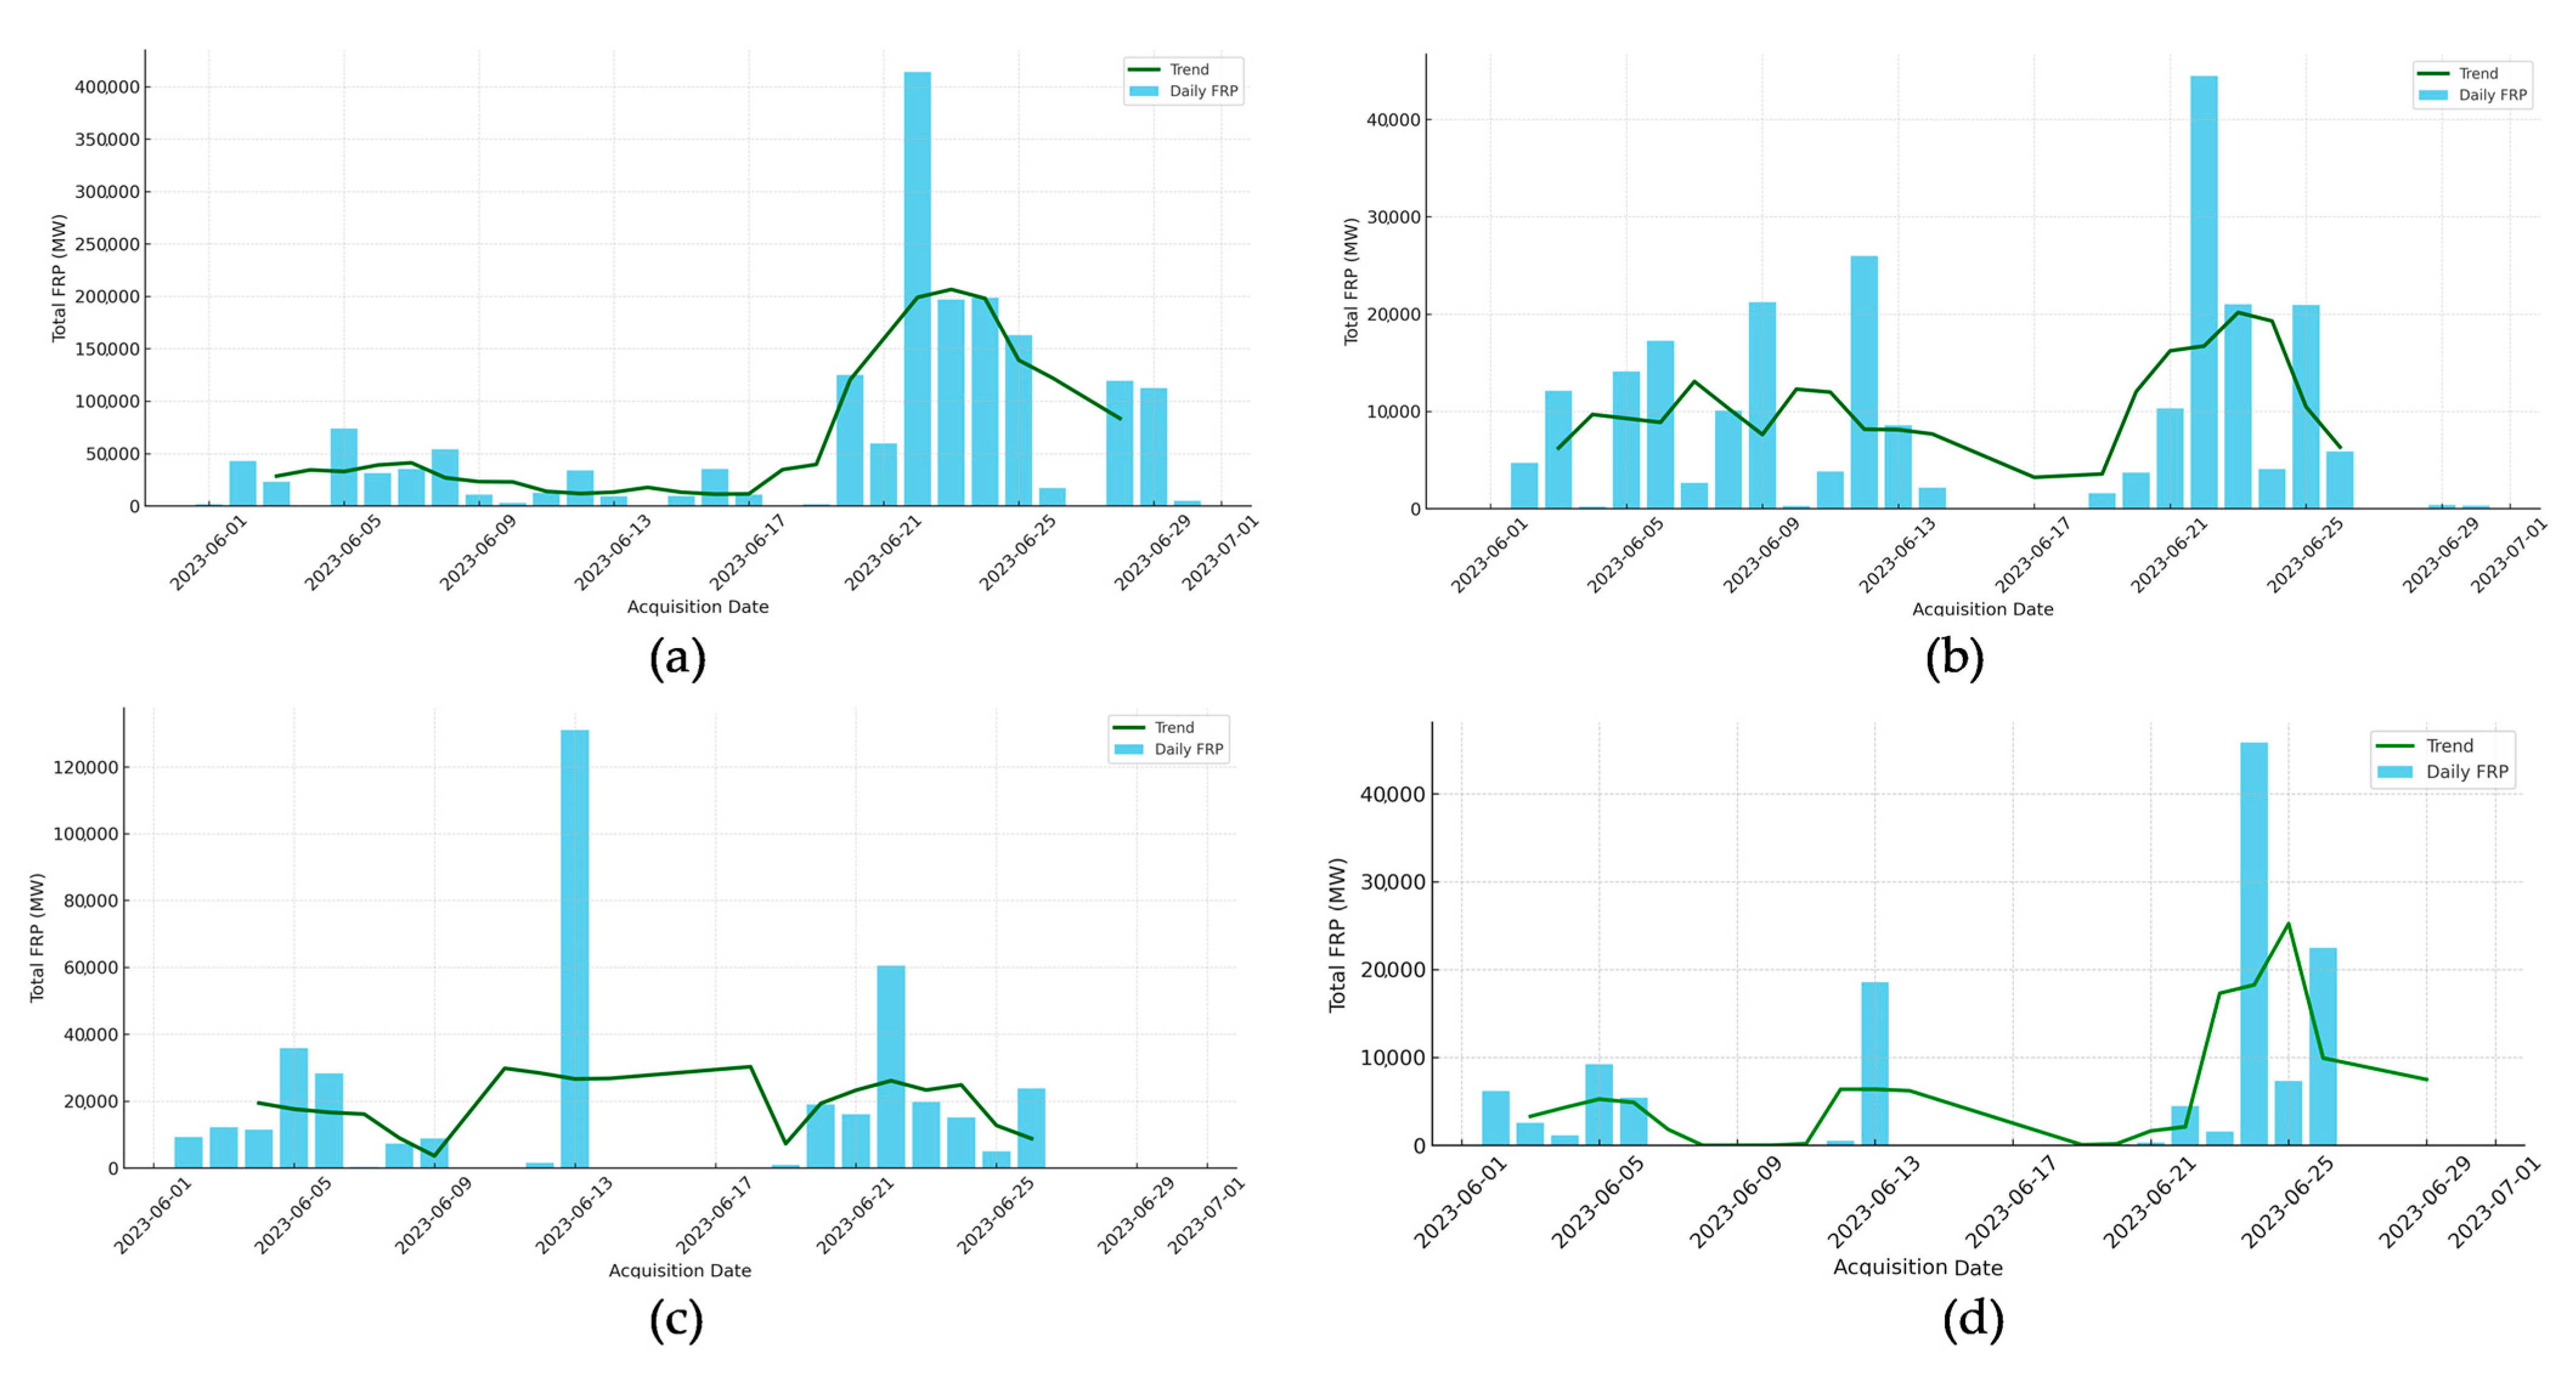
3.3.2. Fire Intensity: FRP Aggregation
3.3.3. Cluster-Derived Spatio-Temporal Metrics
- Duration (days): The time difference between the first and last detection within the cluster (DATE_END − DATE_START).
- Area (km2): This metric represents the geographic footprint of each fire cluster, calculated directly from the polygon geometry of ST-DBSCAN outputs. After clustering VIIRS fire detections, each cluster was spatially delineated as a polygon using GIS tools, and the area was computed using the projected coordinate system (UTM). This value reflects the total extent of detected fire activity, independent of vegetation damage or burn severity.
- Average Rate of Spread (km2/day): Calculated as the total area divided by the total duration.
3.4. Integrative Analysis and Hypothesis Testing
3.4.1. Rationale and Methodology: Gaussian Process Regression
3.4.2. Hypothesis Testing Framework
- To test H1 (Duration vs. Intensity): We modeled the relationship between fire duration (days) and mean FRP (MW).
- To test H2 (Intensity vs. Severity): We modeled the relationship between mean FRP (MW) and burn severity (ΔNBR).
- To test H3 (Spread vs. Intensity/Severity): We modeled the rate of fire spread (km2/day) as a function of mean FRP (MW) and duration.
3.5. Software and Tools
4. Results
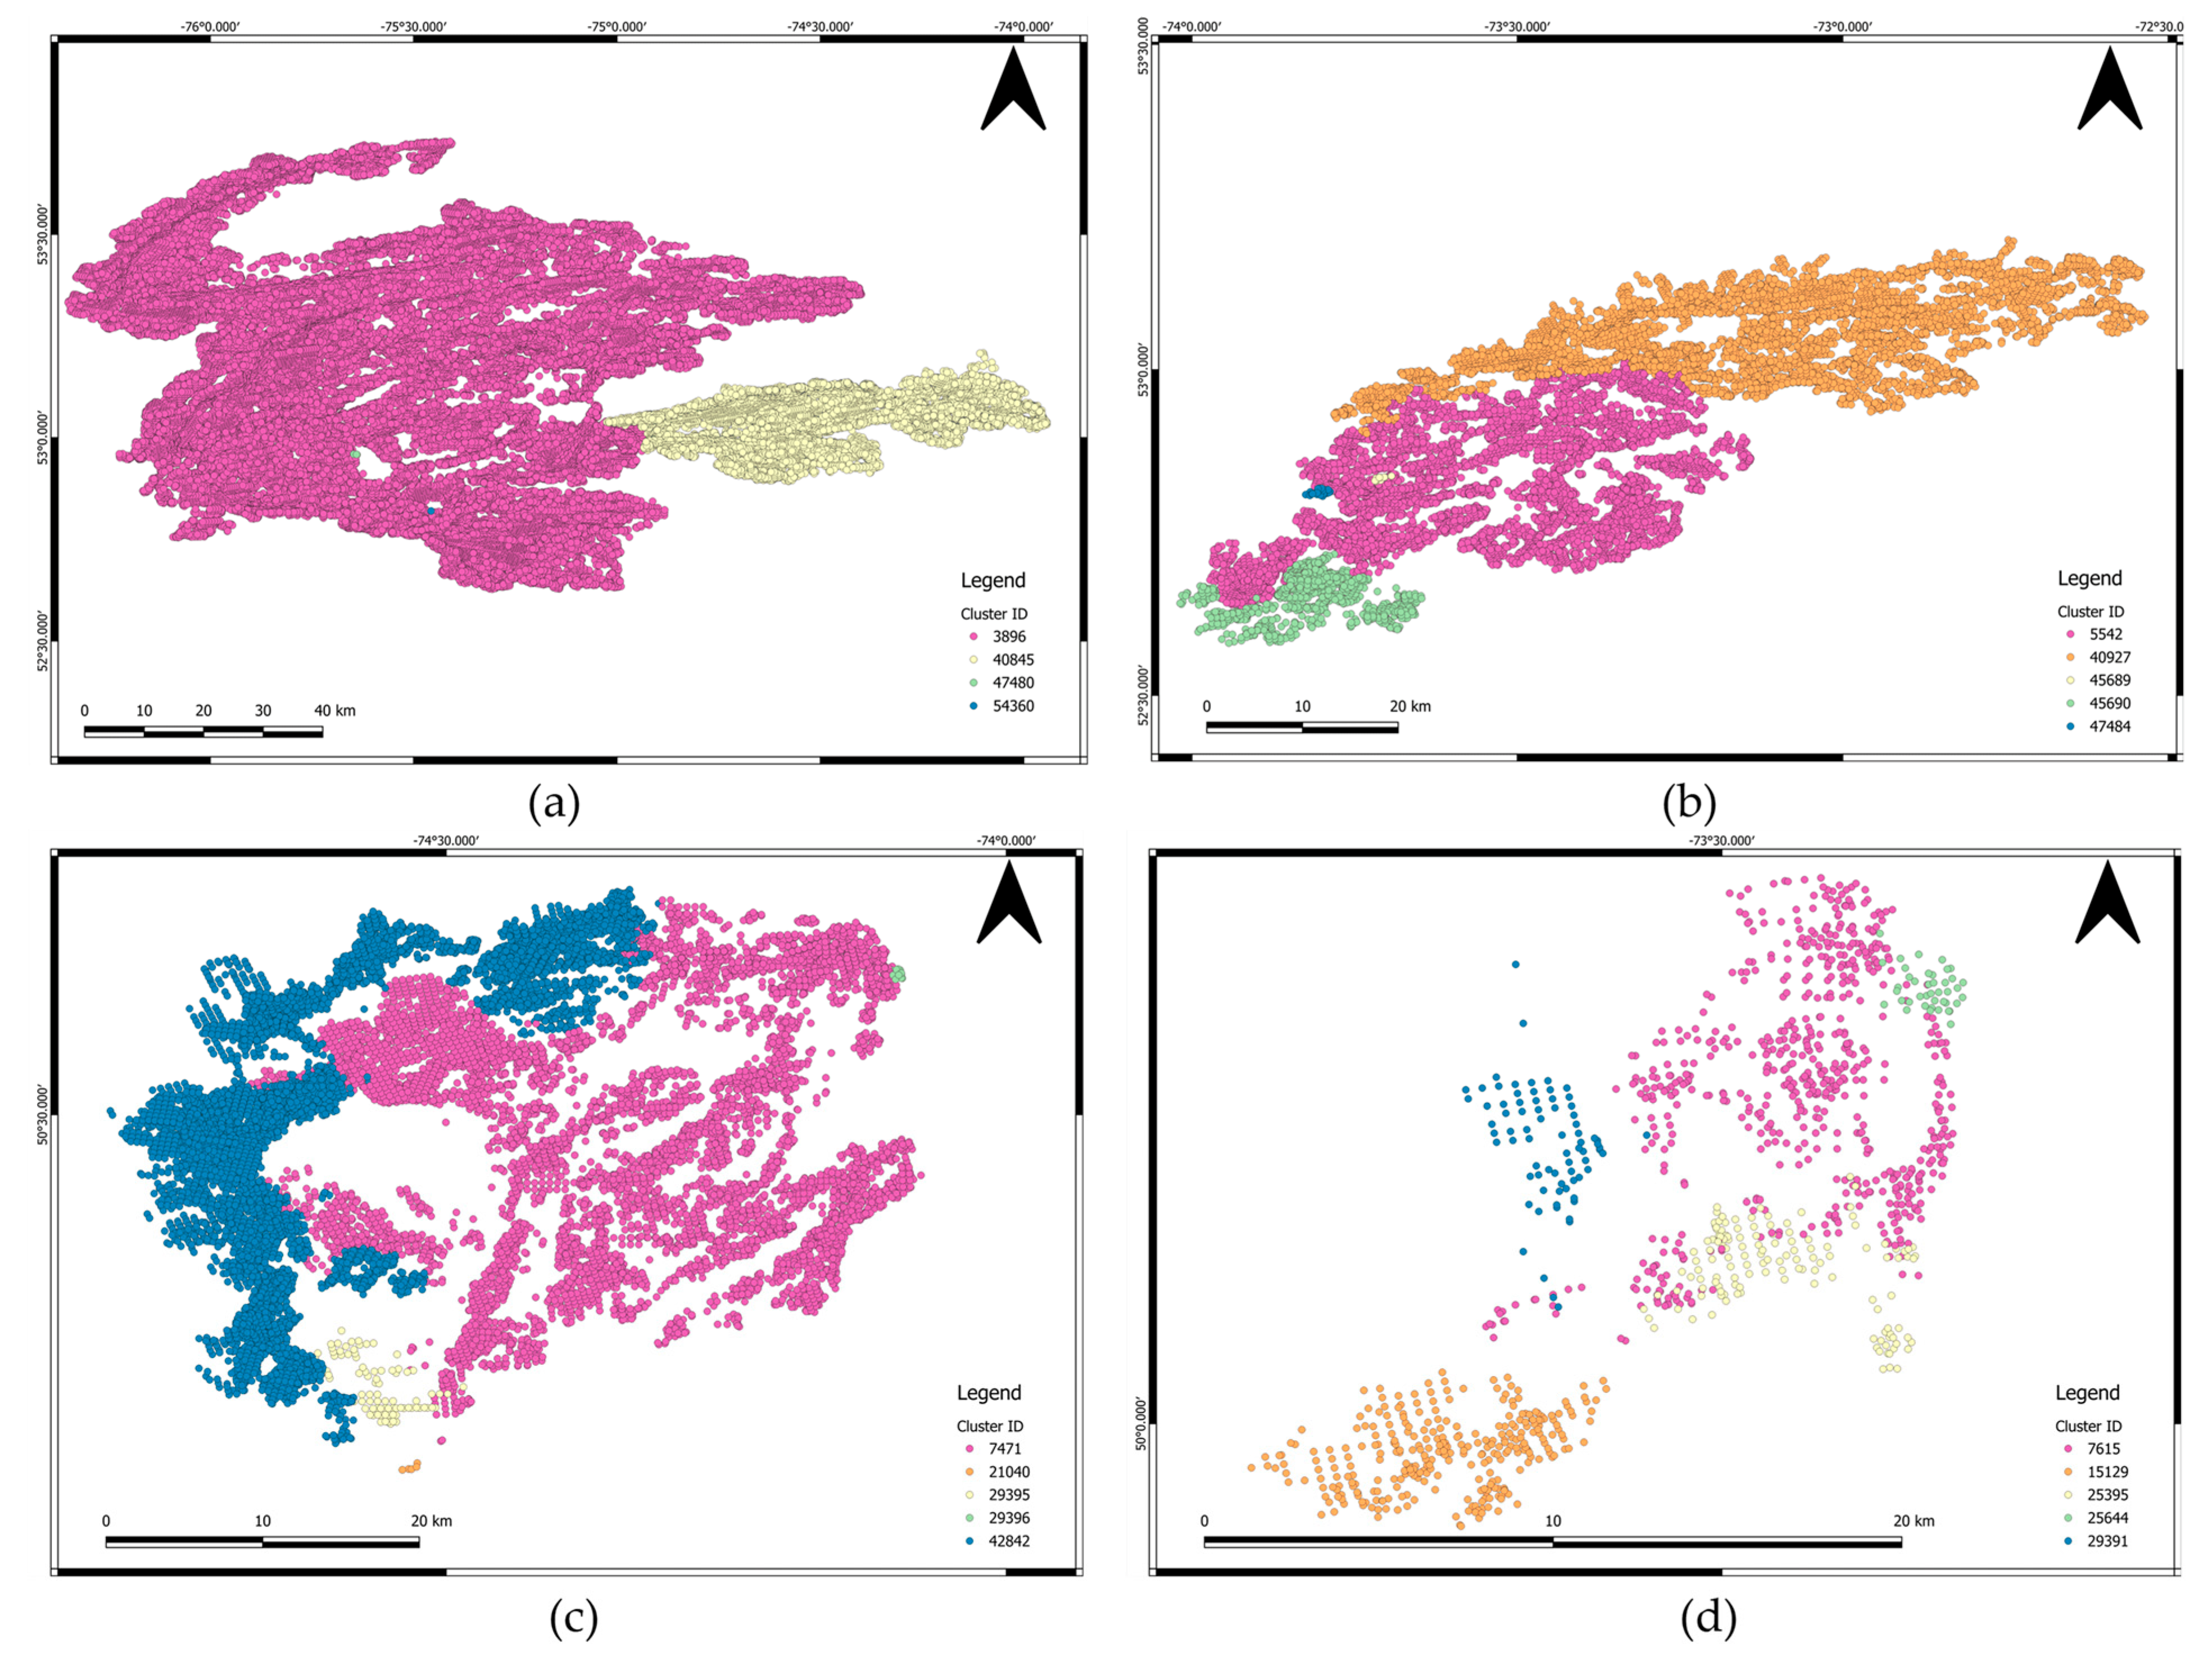
4.1. Cluster Statistics and Spatial Patterns
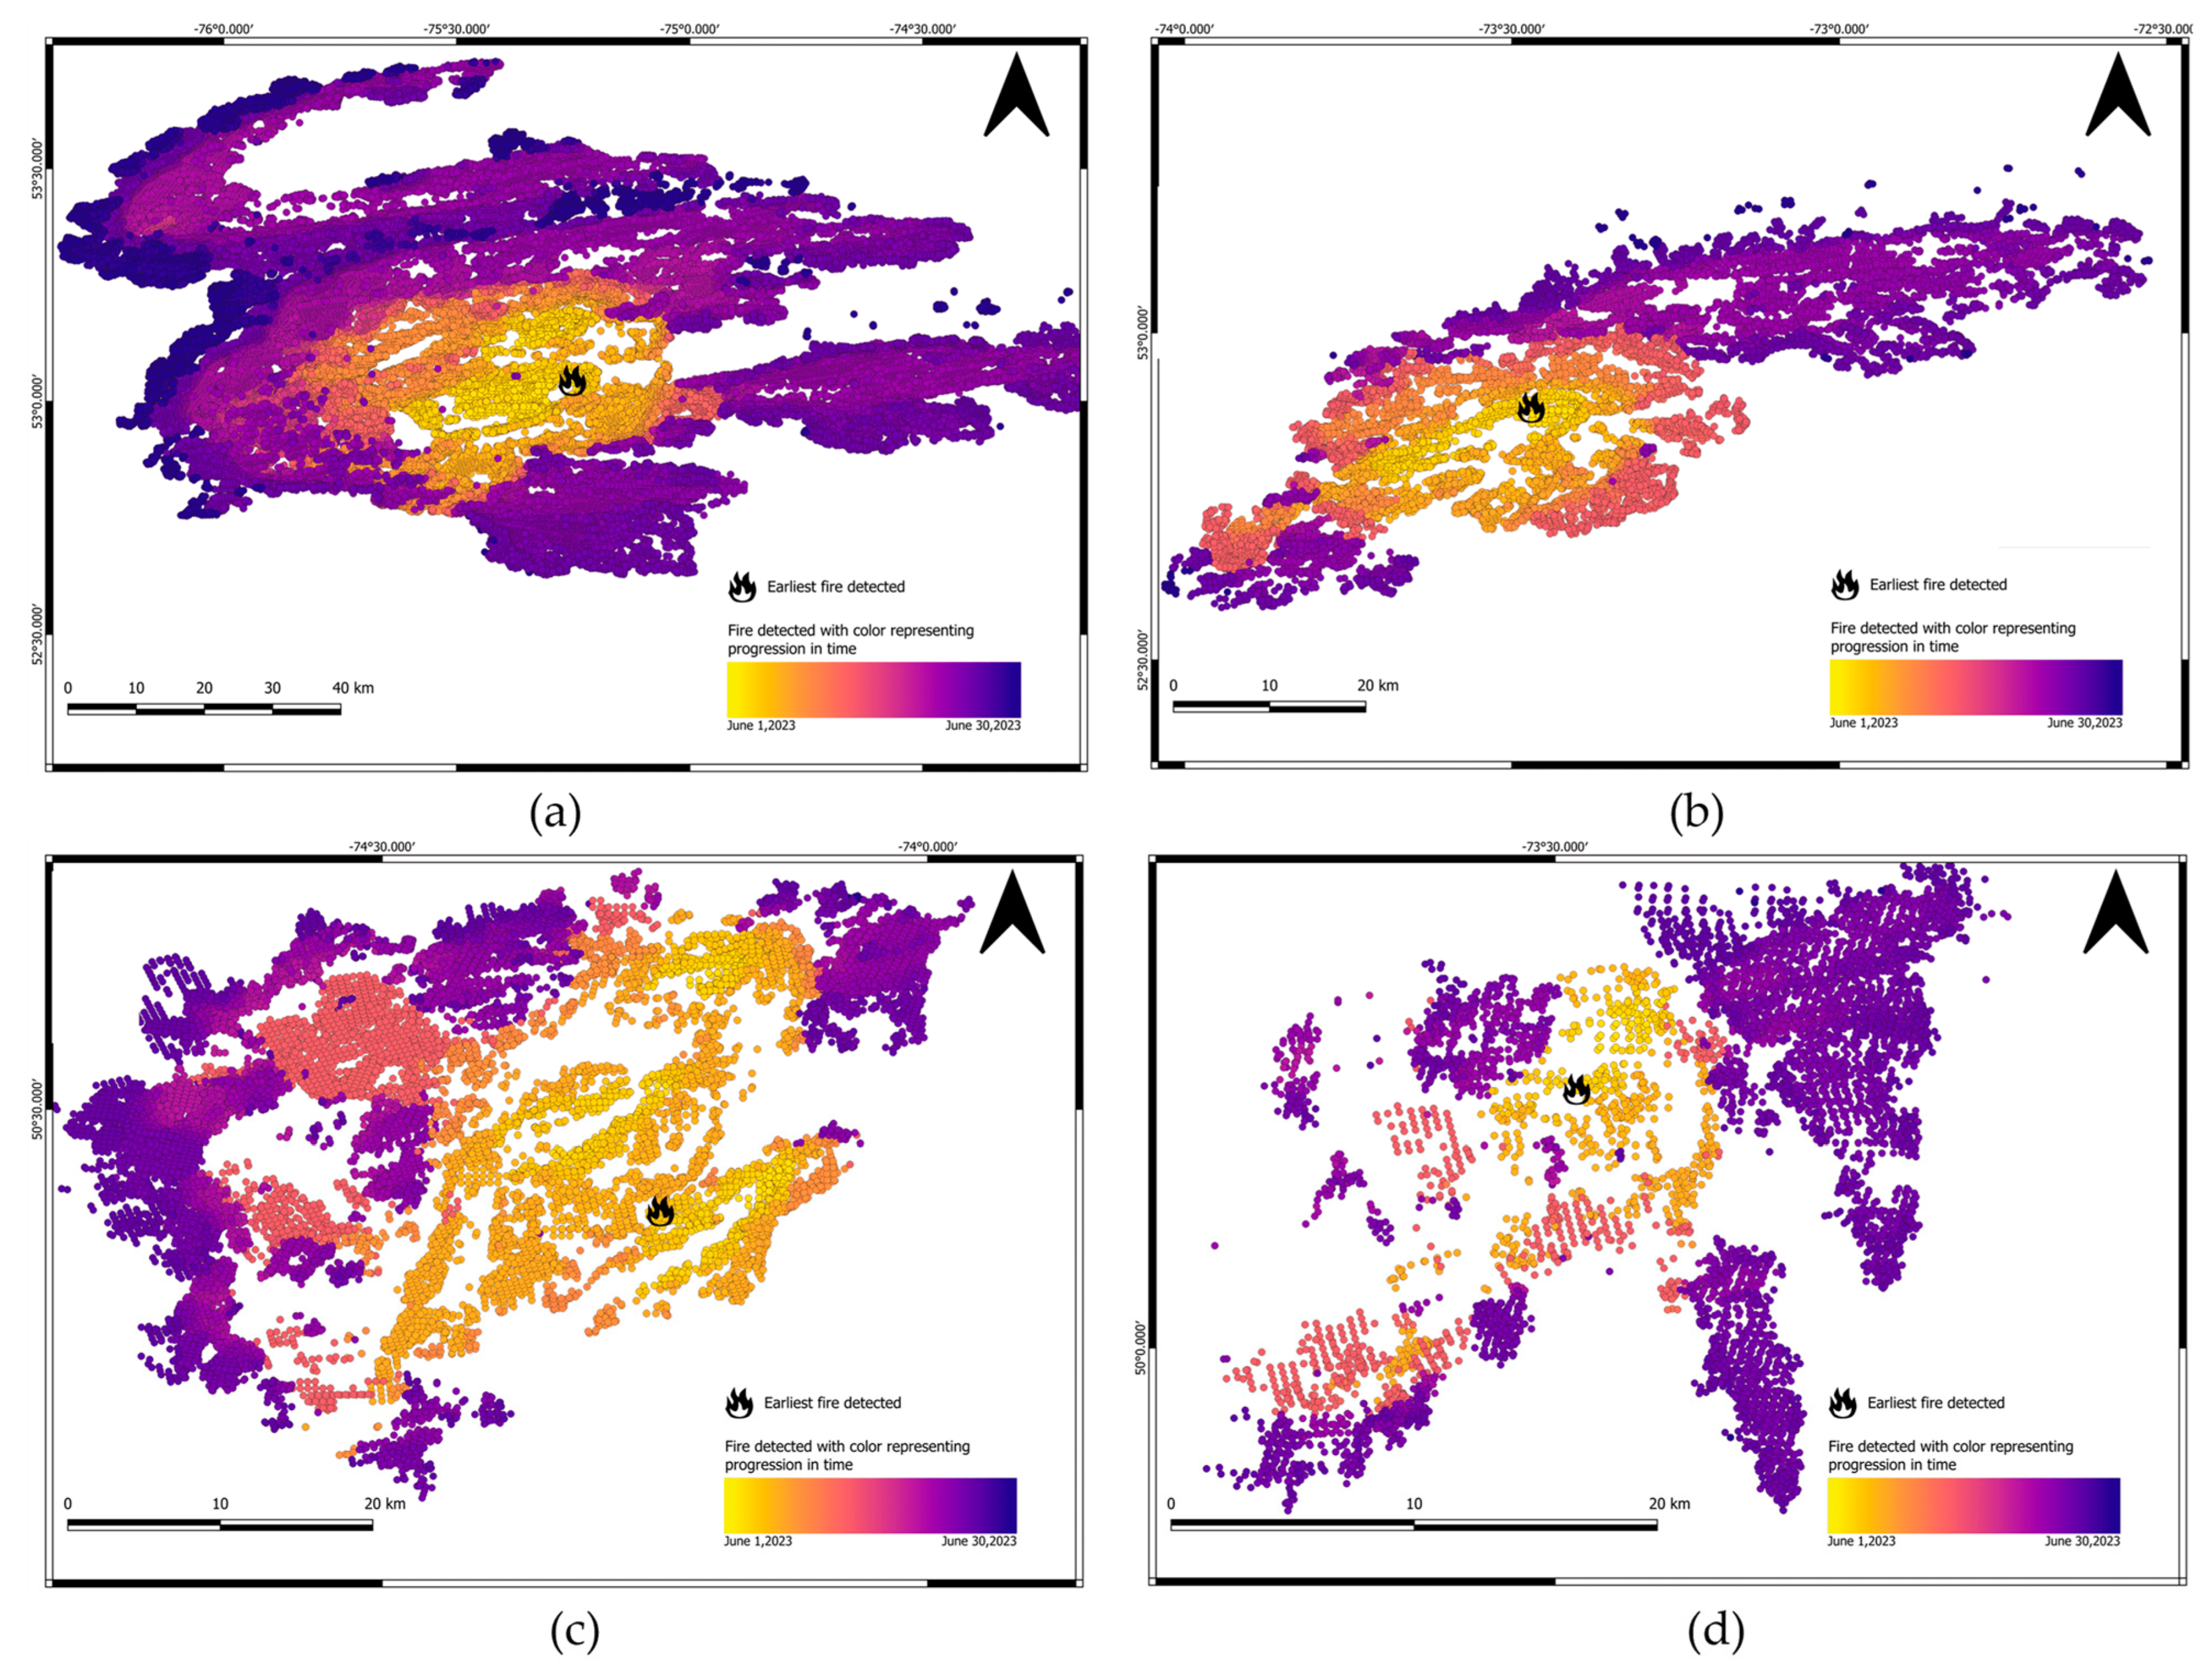
4.2. Fire Intensity and Spread Dynamics (FRP and Spread Metrics)
4.3. Burn Severity Mapping (NBR Classification)
4.4. Validation of Clustered Fire Boundaries (IoU Analysis)
4.5. Gaussian Process Regression Analysis
5. Discussion
6. Conclusions
- Spatio-temporal clustering using ST-DBSCAN effectively delineated coherent fire regions, with validation against NBAC perimeters showing moderate to high spatial agreement (IoU up to 62.6%), supporting the reliability of the approach.
- FRP-based intensity analysis revealed that higher radiative energy outputs were robustly associated with longer fire durations. However, the relationship with the rate of spread was found to be zone-dependent, indicating that fire intensity is not the sole driver of its propagation speed.
- Burn severity classification using the ΔNBR highlighted substantial spatial variability across fire zones. Zones with high FRP values often, but not always, coincided with severe burn areas—indicating the influence of local factors.
- GPR models confirmed the non-linear yet interpretable relationships between FRP, fire duration, spread rate, and burn severity, proving highly useful for quantifying complex fire dynamics.
- Spatio-temporal clustering using ST-DBSCAN effectively delineated coherent fire regions, with validation against NBAC perimeters showing moderate to high spatial agreement (IoU up to 62.6%), supporting the reliability and spatial accuracy of the approach.
- FRP-based intensity analysis revealed that higher radiative energy outputs were robustly associated with longer fire durations, confirming Hypothesis 1 (H1). However, the relationship between FRP and spread rate was zone-dependent, suggesting that fire intensity is not the sole driver of propagation speed, thereby offering partial support for Hypothesis 3 (H3).
- Burn severity classification using ΔNBR highlighted substantial spatial variability across fire zones. Zones with high FRP values often—but not always—coincided with severe burn areas, supporting Hypothesis 2 (H2) in regions with stable vegetation characteristics while highlighting the role of local factors in modulating fire impact.
- GPR models confirmed the presence of non-linear, zone-specific relationships between FRP, fire duration, spread rate, and burn severity. These models proved highly useful for quantifying complex fire dynamics and identifying saturation effects and threshold behaviors, which linear models would not capture.
Author Contributions
Funding
Institutional Review Board Statement
Informed Consent Statement
Data Availability Statement
Acknowledgments
Conflicts of Interest
Abbreviations
| CFS | Canadian Forest Service |
| ΔNBR | differenced Normalized Burn Ratio |
| FIRMS | Fire Information for Resource Management System |
| FRP | Fire Radiative Power |
| FSR | Fire Spread Reconstruction |
| GIS | Geographic Information System |
| GPR | Gaussian Process Regression |
| IoU | Intersection over Union |
| MODIS | Moderate Resolution Imaging Spectroradiometer |
| MW | megawatt |
| NASA | National Aeronautics and Space Administration |
| NBAC | National Burned Area Composite |
| NBR | Normalized Burn Ratio |
| QGIS | Quantum GIS |
| S-NPP | Suomi National Polar-orbiting Partnership |
| SOPFEU | Société de Protection Des Forêts Contre Le Feu |
| ST-DBSCAN | Spatial and Temporal Density-Based Spatial Clustering of Applications with Noise |
| SWIR | Shortwave Infrared |
| VIIRS | Visible Infrared Imaging Radiometer Suite |
References
- Van Lierop, P.; Lindquist, E.; Sathyapala, S.; Franceschini, G. Global Forest Area Disturbance from Fire, Insect Pests, Diseases and Severe Weather Events. For. Ecol. Manag. 2015, 352, 78–88. [Google Scholar] [CrossRef]
- Ahmed, M.R.; Hassan, Q.K. Occurrence, Area Burned, and Seasonality Trends of Forest Fires in the Natural Subregions of Alberta over 1959–2021. Fire 2023, 6, 96. [Google Scholar] [CrossRef]
- Jolly, W.M.; Cochrane, M.A.; Freeborn, P.H.; Holden, Z.A.; Brown, T.J.; Williamson, G.J.; Bowman, D.M.J.S. Climate-Induced Variations in Global Wildfire Danger from 1979 to 2013. Nat. Commun. 2015, 6, 7537. [Google Scholar] [CrossRef]
- Bowman, D.M.J.S.; Balch, J.K.; Artaxo, P.; Bond, W.J.; Carlson, J.M.; Cochrane, M.A.; D’Antonio, C.M.; DeFries, R.S.; Doyle, J.C.; Harrison, S.P.; et al. Fire in the Earth System. Science 2009, 324, 481–484. [Google Scholar] [CrossRef]
- Gallup, S.M.; Ford, B.; Naus, S.; Gallup, J.L.; Pierce, J.R. Equations to Predict Carbon Monoxide Emissions from Amazon Rainforest Fires. Fire 2024, 7, 477. [Google Scholar] [CrossRef]
- van der Werf, G.R.; Randerson, J.T.; Giglio, L.; van Leeuwen, T.T.; Chen, Y.; Rogers, B.M.; Mu, M.; van Marle, M.J.E.; Morton, D.C.; Collatz, G.J.; et al. Global Fire Emissions Estimates during 1997–2016. Earth Syst. Sci. Data 2017, 9, 697–720. [Google Scholar] [CrossRef]
- Andela, N.; Morton, D.C.; Giglio, L.; Chen, Y.; Van Der Werf, G.R.; Kasibhatla, P.S.; DeFries, R.S.; Collatz, G.J.; Hantson, S.; Kloster, S.; et al. A Human-Driven Decline in Global Burned Area. Science 2017, 356, 1356–1362. [Google Scholar] [CrossRef] [PubMed]
- Abatzoglou, J.T.; Williams, A.P.; Barbero, R. Global Emergence of Anthropogenic Climate Change in Fire Weather Indices. Geophys. Res. Lett. 2019, 46, 326–336. [Google Scholar] [CrossRef]
- Hall, J.V.; Loboda, T.V.; Giglio, L.; McCarty, G.W. A MODIS-Based Burned Area Assessment for Russian Croplands: Mapping Requirements and Challenges. Remote Sens. Environ. 2016, 184, 506–521. [Google Scholar] [CrossRef]
- Kumar, A. Environmental Sustainability and Forest Fire Management. Environ. Manag. 2022, 62, 431–441. [Google Scholar]
- Giglio, L.; Boschetti, L.; Roy, D.P.; Humber, M.L.; Justice, C.O. The Collection 6 MODIS Burned Area Mapping Algorithm and Product. Remote Sens. Environ. 2018, 217, 72–85. [Google Scholar] [CrossRef]
- Yang, S.; Huang, Q.; Yu, M. Advancements in Remote Sensing for Active Fire Detection: A Review of Datasets and Methods. Sci. Total Environ. 2024, 943, 173273. [Google Scholar] [CrossRef]
- Baptiste Filippi, J.; Bosseur, F.; Mari, C.; Lac, C.; Le Moigne, P.; Cuenot, B.; Veynante, D.; Cariolle, D.; Balbi, J. Coupled Atmosphere-Wildland Fire Modelling. J. Adv. Model. Earth Syst. 2009, 1, 11. [Google Scholar] [CrossRef]
- Kisilevich, S.; Mansmann, F.; Keim, D. P-DBSCAN: A Density Based Clustering Algorithm for Exploration and Analysis of Attractive Areas Using Collections of Geo-Tagged Photos. In Proceedings of the 1st International Conference and Exhibition on Computing for Geospatial Research & Application, Washington, DC, USA, 21–23 June 2010; Association for Computing Machinery: New York, NY, USA, 2010. [Google Scholar]
- Birant, D.; Kut, A. ST-DBSCAN: An Algorithm for Clustering Spatial–Temporal Data. Data Knowl. Eng. 2007, 60, 208–221. [Google Scholar] [CrossRef]
- Dastour, H.; Bhuian, H.; Ahmed, M.R.; Hassan, Q.K. Active Fire Clustering and Spatiotemporal Dynamic Models for Forest Fire Management. Fire 2024, 7, 355. [Google Scholar] [CrossRef]
- Freeborn, P.; Wooster, M.; Roberts, G.; Xu, W. Evaluating the SEVIRI Fire Thermal Anomaly Detection Algorithm across the Central African Republic Using the MODIS Active Fire Product. Remote Sens. 2014, 6, 1890–1917. [Google Scholar] [CrossRef]
- Oliva, P.; Schroeder, W. Assessment of VIIRS 375 m Active Fire Detection Product for Direct Burned Area Mapping. Remote Sens. Environ. 2015, 160, 144–155. [Google Scholar] [CrossRef]
- Li, W.; Dodwell, E.; Cook, D. A Clustering Algorithm to Organize Satellite Hotspot Data for the Purpose of Tracking Bushfires Remotely. R J. 2023, 15, 17–33. [Google Scholar] [CrossRef]
- Kalnis, P.; Mamoulis, N.; Bakiras, S. On Discovering Moving Clusters in Spatio-temporal Data. In Advances in Spatial and Temporal Databases. SSTD 2005; Bauzer Medeiros, C., Egenhofer, M.J., Bertino, E., Eds.; Lecture Notes in Computer Science; Springer: Berlin/Heidelberg, Germany, 2005; Volume 3633. [Google Scholar] [CrossRef]
- Sharma, A.; Vijay, R.K.; Nanda, S.J. Identification and Spatio-Temporal Analysis of Earthquake Clusters Using SOM–DBSCAN Model. Neural Comput. Appl. 2023, 35, 8081–8108. [Google Scholar] [CrossRef]
- Roy, D.P.; Boschetti, L.; Trigg, S.N. Remote Sensing of Fire Severity: Assessing the Performance of the Normalized Burn Ratio. IEEE Geosci. Remote Sens. Lett. 2006, 3, 112–116. [Google Scholar] [CrossRef]
- Tansey, K.; Grégoire, J.; Stroppiana, D.; Sousa, A.; Silva, J.; Pereira, J.M.C.; Boschetti, L.; Maggi, M.; Brivio, P.A.; Fraser, R.; et al. Vegetation Burning in the Year 2000: Global Burned Area Estimates from SPOT VEGETATION Data. J. Geophys. Res. Atmos. 2004, 109, D14. [Google Scholar] [CrossRef]
- Su, H.; Ma, X.; Li, M. An improved spatio-temporal clustering method for extracting fire footprints based on MCD64A1 in the Daxing’anling Area of north-eastern China. Int. J. Wildland Fire 2023, 32, 679–693. [Google Scholar] [CrossRef]
- Choi, C.; Hong, S.-Y. MDST-DBSCAN: A Density-Based Clustering Method for Multidimensional Spatiotemporal Data. ISPRS Int. J. Geo-Inf. 2021, 10, 391. [Google Scholar] [CrossRef]
- Press TC. Quebec to Improve Forest Fire Adaptation After Record-Beating Wildfire Season. 2023. Available online: https://montreal.citynews.ca/2023/11/14/quebec-forest-fire-adaptation-wildfire/ (accessed on 21 December 2024).
- Société de Protection Des Forêts Contre Le Feu (SOPFEU). Available online: https://www.sopfeu.qc.ca/en/ (accessed on 14 April 2025).
- NASA Fire Information for Resource Management System (FIRMS). Available online: https://firms.modaps.eosdis.nasa.gov/ (accessed on 13 April 2025).
- Chuvieco, E.; Mouillot, F.; van der Werf, G.R. Historical Background and Current Developments for Mapping Burned Area from Satellite Earth Observation. Remote Sens. Environ. 2019, 225, 45–64. [Google Scholar] [CrossRef]
- Key, C.H.; Benson, N.C. Landscape Assessment: Ground Measure of Severity, the Composite Burn Index; and Remote Sensing of Severity, the Nor-malized Burn Ratio. In FIREMON: Fire Effects Monitoring and Inventory System; Lutes, D.C., Keane, R.E., Caratti, J.F., Key, C.H., Benson, N.C., Sutherland, S., Gangi, L.J., Eds.; Gen. Tech. Rep. RMRS-GTR-164-CD; USDA Forest Service, Rocky Mountain Research Station: Ogden, UT, USA, 2006. Available online: https://research.fs.usda.gov/treesearch/24066 (accessed on 10 July 2025).
- Canadian Forest Service. National Burned Area Composite (NBAC); Natural Resources Canada: Ottawa, ON, Canada, 2023. [Google Scholar]
- Anwar, M.T.; Hadikurniawati, W.; Winarno, E.; Supriyanto, A. Wildfire Risk Map Based on DBSCAN Clustering and Cluster Density Evaluation. Adv. Sustain. Sci. Eng. Technol. 2019, 1. [Google Scholar] [CrossRef]
- Maggiori, E.; Tarabalka, Y.; Charpiat, G.; Alliez, P. Convolutional Neural Networks for Large-Scale Remote-Sensing Image Classification. IEEE Trans. Geosci. Remote Sens. 2017, 55, 645–657. [Google Scholar] [CrossRef]
- Guan, Z.; Miao, X.; Mu, Y.; Sun, Q.; Ye, Q.; Gao, D. Forest Fire Segmentation from Aerial Imagery Data Using an Improved Instance Segmentation Model. Remote Sens. 2022, 14, 3159. [Google Scholar] [CrossRef]
- Ma, L.; Liu, Y.; Zhang, X.; Ye, Y.; Yin, G.; Johnson, B.A. Deep Learning in Remote Sensing Applications: A Meta-Analysis and Review. ISPRS J. Photogramm. Remote Sens. 2019, 152, 166–177. [Google Scholar] [CrossRef]
- Lutes, D.C.; Keane, R.E.; Caratti, J.F.; Key, C.H.; Benson, N.C.; Sutherland, S.; Gangi, L.J. FIREMON: Fire Effects Monitoring and Inventory System; U.S. Department of Agriculture, Forest Service, Rocky Mountain Research Station: Ft. Collins, CO, USA, 2006; p. RMRS-GTR-164. [Google Scholar]
- Wooster, M.J.; Roberts, G.; Perry, G.L.W.; Kaufman, Y.J. Retrieval of Biomass Combustion Rates and Totals from Fire Radiative Power Observations: FRP Derivation and Calibration Relationships between Biomass Consumption and Fire Radiative Energy Release. J. Geophys. Res. Atmos. 2005, 110, D24311. [Google Scholar] [CrossRef]
- Rasmussen, C.E.; Williams, C.K.I. Gaussian Processes for Machine Learning; The MIT Press: Cambridge, MA, USA, 2005; ISBN 978-0-262-25683-4. [Google Scholar]
- Pedregosa, F.; Varoquaux, G.; Gramfort, A.; Michel, V.; Thirion, B.; Grisel, O.; Blondel, M.; Prettenhofer, P.; Weiss, R.; Dubourg, V.; et al. Scikit-learn: Machine Learning in Python. J. Mach. Learn. Res. 2011, 12, 2825–2830. [Google Scholar]
- Harris, C.R.; Millman, K.J.; Van Der Walt, S.J.; Gommers, R.; Virtanen, P.; Cournapeau, D.; Wieser, E.; Taylor, J.; Berg, S.; Smith, N.J.; et al. Array Programming with NumPy. Nature 2020, 585, 357–362. [Google Scholar] [CrossRef]
- Hunter, J.D. Matplotlib: A 2D Graphics Environment. Comput. Sci. Eng. 2007, 9, 90–95. [Google Scholar] [CrossRef]
- Schroeder, W.; Oliva, P.; Giglio, L.; Csiszar, I.A. The New VIIRS 375 m Active Fire Detection Data Product: Algorithm Description and Initial Assessment. Remote Sens. Environ. 2014, 143, 85–96. [Google Scholar] [CrossRef]
- Archibald, S.; Lehmann, C.E.R.; Gómez-Dans, J.L.; Bradstock, R.A. Defining Pyromes and Global Syndromes of Fire Regimes. Proc. Natl. Acad. Sci. USA 2013, 110, 6442–6447. [Google Scholar] [CrossRef] [PubMed]


| Attribute Name | Description |
|---|---|
| Latitude | Geographic latitude of the fire event. |
| Longitude | Geographic longitude of the fire event. |
| Brightness | Brightness value of the detected hot spot. |
| Scan | Satellite scan width. |
| Track | Satellite scan length. |
| Acq Date | Date the fire was detected. |
| Acq Time | Time the fire was detected. |
| Satellite | Satellite from which the data were obtained (S-NPP or NOAA-20). |
| Confidence | Confidence level of fire detection. |
| Version | Data processing version used. |
| Bright T31 | Radiance temperature (Kelvin) obtained from the thermal channel. |
| FRP (Fire Radiative Power) | Radiant power emitted by the fire (MW). |
| Day/Night | Whether the fire was detected during daytime or nighttime. |
| Fid | Latitude | Longitude | Brightness | Scan | Track | Acq_Date | Acq_Time | Satellite | Instrument | Confidence | Version | Bright_T31 | FRP | Day Night |
|---|---|---|---|---|---|---|---|---|---|---|---|---|---|---|
| 28883 | 53.16951 | −75.23611 | 339.63 | 0.62 | 0.54 | 1.06.2023 | 1643 | 1 | VIIRS | n | 2.0NRT | 298.55 | 14.28 | D |
| 28889 | 53.05344 | −75.2285 | 338.33 | 0.62 | 0.54 | 1.06.2023 | 1643 | 1 | VIIRS | n | 2.0NRT | 293.92 | 5.86 | D |
| 28890 | 53.05182 | −75.31041 | 325.56 | 0.63 | 0.54 | 1.06.2023 | 1643 | 1 | VIIRS | l | 2.0NRT | 298.88 | 8.55 | D |
| 30491 | 53.04161 | −75.2345 | 339.82 | 0.51 | 0.49 | 1.06.2023 | 1824 | 1 | VIIRS | n | 2.0NRT | 301.41 | 43.6 | D |
| Fid | Latitude | Longitude | Brightness | Scan | Track | Satellite | Confidence | Version | Bright_T31 | Frp | Daynight | Acq_Date_T | Cluster_ID | Cluster_SI |
|---|---|---|---|---|---|---|---|---|---|---|---|---|---|---|
| 28883 | 53.16951 | −75.23611 | 339.63 | 0.62 | 0.54 | 1 | n | 2.0NRT | 298.55 | 14.28 | D | 2023/06/01 16:43:00.000 | 3896 | 76,573 |
| 28889 | 53.05344 | −75.2285 | 338.33 | 0.62 | 0.54 | 1 | n | 2.0NRT | 293.92 | 5.86 | D | 2023/06/01 16:43:00.000 | 3896 | 76,573 |
| 28890 | 53.05182 | −75.31041 | 325.56 | 0.63 | 0.54 | 1 | l | 2.0NRT | 298.88 | 8.55 | D | 2023/06/01 16:43:00.000 | 3896 | 76,573 |
| 30491 | 53.04161 | −75.2345 | 339.82 | 0.51 | 0.49 | 1 | n | 2.0NRT | 301.41 | 43.6 | D | 2023/06/01 18:24:00.000 | 3896 | 76,573 |
| Severity Class | ΔNBR Range (Unscaled) |
|---|---|
| Enhanced Regrowth | <−0.10 |
| Unburned | −0.10 to +0.10 |
| Low Severity | +0.10 to +0.27 |
| Moderate Severity | +0.27 to +0.66 |
| High Severity | >+0.66 |
| Zone | Total Points | Clustered Points | Noise Points | Noise (%) |
|---|---|---|---|---|
| 1 | 76,573 | 75,532 | 1041 | 1.40% |
| 2 | 1435 | 1186 | 249 | 17.40% |
| 3 | 1812 | 1727 | 85 | 4.70% |
| 4 | 408 | 374 | 34 | 8.30% |
| Zone | Area (km2) | Mean FRP (MW) | Spread Rate (km2/day) | Duration (Days) |
|---|---|---|---|---|
| 1 | 11,300.7 | 20.03 | 376.69 | 30 |
| 2 | 2673.5 | 33.78 | 132.66 | 12.05 |
| 3 | 2102.9 | 37.24 | 31.72 | 5.55 |
| 4 | 730.3 | 14.68 | 131.12 | 8.54 |
| Fire Zone | % Enhanced Regrowth | % Unburned | % Low Severity | % Moderate Severity | % High/Severe |
|---|---|---|---|---|---|
| 1 | 6.73 | 14.54 | 15.27 | 62.16 | 1.30 |
| 2 | 0.06 | 0.01 | 0.14 | 15.96 | 83.84 |
| 3 | 1.76 | 4.59 | 5.91 | 18.84 | 68.90 |
| 4 | 5.76 | 8.59 | 13.80 | 19.70 | 52.15 |
| Fire Zone | Cluster ID | % Enhanced Regrowth | % Unburned | % Low Severity | % Moderate Severity | % High/Severe |
|---|---|---|---|---|---|---|
| 1 | 3896 | 4.16 | 12.07 | 24.82 | 55.62 | 3.33 |
| 1 | 40845 | 2.78 | 6.10 | 16.25 | 73.01 | 1.86 |
| 1 | 47480 | 20.00 | 40.00 | 0.00 | 40.00 | 0.00 |
| 1 | 54360 | 0.00 | 0.00 | 20.00 | 80.00 | 0.00 |
| 2 | 5542 | 0.01 | 0.01 | 0.17 | 20.41 | 79.40 |
| 2 | 40927 | 0.01 | 0.02 | 0.53 | 15.72 | 83.72 |
| 2 | 45689 | 0.00 | 0.00 | 0.00 | 15.79 | 84.21 |
| 2 | 45690 | 0.27 | 0.00 | 0.00 | 17.34 | 82.39 |
| 2 | 47484 | 0.00 | 0.00 | 0.00 | 10.53 | 89.47 |
| 3 | 7471 | 8.52 | 22.93 | 29.01 | 34.84 | 4.70 |
| 3 | 21040 | 20.00 | 20.00 | 40.00 | 20.00 | 0.00 |
| 3 | 29395 | 11.49 | 24.14 | 9.20 | 49.43 | 5.75 |
| 3 | 29396 | 5.26 | 10.53 | 15.79 | 63.16 | 5.26 |
| 3 | 42842 | 5.75 | 12.94 | 20.31 | 52.40 | 8.61 |
| 4 | 7615 | 9.58 | 20.77 | 24.60 | 40.58 | 4.47 |
| 4 | 15129 | 6.13 | 18.06 | 23.23 | 46.77 | 5.81 |
| 4 | 25395 | 16.3 | 17.75 | 20.00 | 42.22 | 3.70 |
| 4 | 25644 | 5.00 | 25.00 | 7.50 | 50.00 | 12.50 |
| 4 | 29391 | 6.67 | 14.67 | 13.33 | 54.67 | 10.67 |
Disclaimer/Publisher’s Note: The statements, opinions and data contained in all publications are solely those of the individual author(s) and contributor(s) and not of MDPI and/or the editor(s). MDPI and/or the editor(s) disclaim responsibility for any injury to people or property resulting from any ideas, methods, instructions or products referred to in the content. |
© 2025 by the authors. Licensee MDPI, Basel, Switzerland. This article is an open access article distributed under the terms and conditions of the Creative Commons Attribution (CC BY) license (https://creativecommons.org/licenses/by/4.0/).
Share and Cite
Urfalı, T.; Eymen, A. Quantifying Wildfire Dynamics Through Spatio-Temporal Clustering and Remote Sensing Metrics: The 2023 Quebec Case Study. Fire 2025, 8, 308. https://doi.org/10.3390/fire8080308
Urfalı T, Eymen A. Quantifying Wildfire Dynamics Through Spatio-Temporal Clustering and Remote Sensing Metrics: The 2023 Quebec Case Study. Fire. 2025; 8(8):308. https://doi.org/10.3390/fire8080308
Chicago/Turabian StyleUrfalı, Tuğrul, and Abdurrahman Eymen. 2025. "Quantifying Wildfire Dynamics Through Spatio-Temporal Clustering and Remote Sensing Metrics: The 2023 Quebec Case Study" Fire 8, no. 8: 308. https://doi.org/10.3390/fire8080308
APA StyleUrfalı, T., & Eymen, A. (2025). Quantifying Wildfire Dynamics Through Spatio-Temporal Clustering and Remote Sensing Metrics: The 2023 Quebec Case Study. Fire, 8(8), 308. https://doi.org/10.3390/fire8080308


