Article

Impact of a Summer Wildfire Episode on Air Quality in a Rural Area Near the Adriatic Coast

Division of Environmental Hygiene, Institute for Medical Research and Occupational Health, Ksaverska cesta 2, 10001 Zagreb, Croatia
*
Author to whom correspondence should be addressed.
Fire 2025, 8(8), 299; https://doi.org/10.3390/fire8080299
Submission received: 28 May 2025 / Revised: 18 July 2025 / Accepted: 25 July 2025 / Published: 28 July 2025

Abstract

This study aimed to investigate the effect of wildfire episodes on air quality in terms of particulate matter (PM) and carbonaceous compound concentration in ambient air, and to assess deviations from typical annual patterns. The sampling was performed at a rural background site near the Adriatic coast in Croatia through 2024. To better understand contributions caused by fire events, the levels of organic carbon (OC), elemental carbon (EC), black carbon (BC), pyrolytic carbon (PyrC), optical carbon (OptC), water-soluble organic carbon (WSOC), levoglucosan (LG), mannosan (MNS), and galactosan (GA) were determined in PM10 and PM2.5 fractions (particles smaller than 10 µm and 2.5 µm, respectively). The annual mean concentrations of PM10 and PM2.5 were 14 µg/m3 and 8 µg/m3, respectively. During the fire episode, the PM2.5 mass contribution to the total PM10 mass exceeded 65%. Total carbon (TC) and OC increased by a factor of 7, EC and BC by 12, PyrC by 8, and WSOC by 12. The concentration of LG reached 1.219 μg/m3 in the PM10 fractions and 0.954 μg/m3 in the PM2.5 fractions, representing a 200-fold increase during the fire episode. Meteorological data were integrated to assess atmospheric conditions during the fire episode, and the specific ratios between fire-related compounds were analyzed.

1. Introduction

Wildfire events are major contributors to particulate matter (PM) and various gaseous emissions, with significant impact on the atmosphere at both regional and global scale. The released aerosols negatively affect visibility, scatter and absorb solar radiation, and alter the microphysical and optical properties of liquid-phase clouds [1,2]. The emitted compounds include climate-relevant gases such as carbon dioxide (CO2), methane (CH4), and nitrous oxide (N2O), along with photochemically reactive species like carbon monoxide (CO), volatile organic compounds (VOCs), and nitrogen oxides (NOx), which contribute to the formation of ground-level ozone (O3) [3]. In addition to atmospheric effects, the emitted PM, especially particles of smaller size (PM2.5) influence air quality [4], and are strongly associated with risk of respiratory [5], cardiovascular conditions [6], and even premature mortality [7,8]. Originating from the combustion of vegetation and other organic material, PM has a complex chemical composition, typically containing elevated concentrations of OC composed of different organic species, including polycyclic aromatic hydrocarbons (PAHs), water-soluble organic carbon (WSOC), anhydrosugars, EC, BC, and brown carbon (BrC) [9,10]. Among all the listed species, only anhydrosugars serve as specific tracers of biomass burning, as they are formed exclusively through the thermal decomposition of cellulose at high temperatures. Levoglucosan is the most commonly used and widely reported tracer due to its high emission levels and relative atmospheric stability. Two additional isomers, mannosane (MNS) and galactosan (GA), are also frequently detected, though at much lower concentrations, and are primarily used to refine the interpretation of results by providing insights into the type of biomass burned (e.g., LG/MNS ratio) [11]. To characterize the influence of wildfires on air quality, it is important to consider not only anhydrosugars but also compounds that are not unique to biomass burning and may originate from multiple sources. When expressed as ratios with more specific indicators (e.g., OC/EC, WSOC/OC, LG/OC, LG/PM, BC/EC, LG/BC) or evaluated through their relative contributions, these compounds can provide a more comprehensive picture of emission sources and atmospheric processes. The consequences of wildfires on air quality have been extensively studied in the United States [1,12,13], and to a lesser extent in Europe, mostly in Greece [14], Spain [15] and Portugal [16,17,18], which frequently deal with severe summer wildfires. Koukouli at al. examined the impact of the large-scale August 2023 wildfires in northern Greece—particularly the Dadia Forest fire—on regional air quality, quantifying elevated levels of NO2, formaldehyde (HCHO), and CO across hundreds of kilometers, demonstrating significant air quality degradation both near the fire and in distant urban areas [19]. Diapouli et al. investigated the long-range transport of biomass burning aerosols from eastern Europe, showing their significant impact on air quality in southern Europe as a result of the 2010 wildfires in Russia and Ukraine, which led to elevated carbonaceous and secondary aerosol Athens [20]. Kaskaoutis et al. investigated the impact of peri-urban wildfires on atmospheric composition and aerosol properties in Athens, Greece, during August 2021, focusing on PM2.5, carbonaceous components, and optical characteristics of smoke plumes transported from nearby fires [21].
In Croatia, wildfire events have not yet been systematically studied; however, several incidents have been detected in the central Adriatic region through elevated levels of PAHs, especially fluoranthene (Flu) and pyrene (Pyr) [22]. As a Mediterranean country, Croatia frequently experiences wildfires during the summer, especially in coastal and rural areas. Throughout the year, weather conditions such as extended dry periods and elevated temperatures have increased the fire risk in Croatia relative to prior years. In 2024, the Croatian Firefighting Association (HZV) and the Croatian Meteorological and Hydrological Service (DHMZ) documented three prolonged heat waves in the continental region of the country and four along the coast [23,24,25,26]. That same year, the National Firefighting Operations Centre reported 6650 fires, which including 3825 vegetation fires, consuming 26,807 hectares [27]. Compared to the previous year, an increase of 21% in wildfires was noted, and a 411% increase in the total area burned [28,29].
The objective of this study was to assess the levels of PM10 and PM2.5 particles, along with selected organic compounds—including OC, EC, WSOC, and LG, MNS, GA—at a rural background site during a fire event that occurred near the Adriatic Sea coast. The typical annual trend of PM10 and PM2.5 concentrations is compared with measurements taken over a four-day period when fire activity was reported (from 30 July to 2 August 2024) [30]. Correlations between particulate matter and targeted pollutants were analyzed and the fire-related ratios were calculated to determine the direct impact of the wildfire. To evaluate the influence of meteorological conditions on the observed data, a wind rose, pollution rose of PM, and MODIS satellite imagery were utilized. The overall aim of this analysis was to evaluate the impact of fire events on air quality under conditions where other potential sources of biomass burning, such as residential heating or agricultural waste burning, can be excluded, with the latter being prohibited from May to November.

2. Materials and Methods

2.1. Sampling Site

The Croatian rural-regional background monitoring site Polača (44.028° N, 15.516° E) is strategically located in the Ravni Kotari region, 134 m above sea level, in the northern part of Dalmatia (Figure 1). This site represents a key component of the National Network for Continuous Air Quality Monitoring, specifically designed to assess background levels of atmospheric pollutants with minimal local anthropogenic influence, as it is a small settlement with approximately 1000 inhabitants.
The selection of Polača as a monitoring site is based on its representative rural character, making it ideal for observing long-range transported air masses and assessing regional background pollution levels, including carbonaceous aerosols, trace gases, and particulate matter. Its relatively isolated location from major urban centers and industrial sources ensures that the measurements reflect broader transboundary and regional atmospheric processes, rather than localized emissions. As such, Polača provides critical data for evaluating compliance with national and EU air quality directives, supporting model validation, and contributing to understanding pollution transport mechanisms in the Adriatic–Mediterranean region.

2.2. Sample Collection

The PM10 and PM2.5 (particulate matter with aerodynamic diameters smaller than 10 µm and 2.5 µm, respectively) samples were continuously collected throughout 2024 using two low-volume air samplers (SEQ47/50-RV CD, Sven Leckel Ingenieurbüro GmbH, Berlin, Germany) equipped with a cooling system and pre-baked quartz fiber filters. The ambient air flow rate was 55 m3/day. Before and after sampling, the filters were conditioned under controlled temperature and humidity conditions according to the EN 12341 standard [31]. Subsequently, they were stored below −20 °C until analysis to prevent potential chemical degradation.

2.3. EC and OC Analysis

EC and OC were quantified using a thermal-optical transmittance (TOT) method developed following the EUSAAR_2 protocol [32] and the standard EN 16909 [33] with a Sunset Laboratory carbon analyzer (CAA, model 5 L, Tigard, OR, USA). Organic carbon fractions (OC1–OC4) represent four thermally derived OC fractions where the OC1 fraction desorbed at <200 °C, OC2 at 200–300 °C, OC3 at 300–450 °C, and OC4 at 450–650 °C (according to EUSAAR_2 protocol), which were released through progressive filter heating in a helium atmosphere, and EC was released by heating in a helium/oxygen mixture, representing the total carbon (TC). The OC/EC ratio was used to indicate carbon formation processes in PM and to estimate primary organic carbon (POC) and secondary organic carbon (SOC) [34]. Following EUSAAR_2 guidelines, the transmittance method was used to correct EC by determining PyrC, which is also formed by charring organic material under inert conditions [33]. PyrC is closely related to optical carbon (OptC), a parameter encompassing all carbonaceous material contributing to light absorption during the thermal-optical analysis. Thus, OptC is a composite measure that includes EC and any generated PyrC [35,36]. This distinction is crucial because OptC values, when not corrected for PyrC, can diverge from BC concentrations independently measured by optical methods such as the aethalometer. The BC data used for this study were measured by the Croatian Meteorological and Hydrological Service, which operates the National Network for Continuous Air Quality Monitoring for the Ministry of Environmental Protection and Green Transition, Croatia.

2.4. Biomass-Burning Marker Determination

Anhydrosugars (LG, MNS, GA) were analyzed using High-Performance Anion Exchange Chromatography with Pulsed Amperometric Detection (HPAEC-PAD) on an ICS-6000 system (Thermo Scientific, Waltham, MA, USA). The analytical procedure is described in detail in Sopčić et al. [37]. In brief, aliquots of each quartz fiber filter sample (12.35 cm2) were ultrasonically extracted in 4 mL of ultrapure water (resistivity of >18.2 MΩ cm2, Smart2Pure3 UF/UV, Thermo Scientific Barnstead GenPure, Waltham, MA, USA). The extracts were then centrifuged to isolate the water-soluble fraction, which was then transferred to polypropylene vials for analysis. Anhydrosugars were separated using a Dionex CarboPac MA1 analytical column with a corresponding guard column and a manually prepared NaOH eluent. Two methods were necessary for properly separating anhydrosugars from some sugar alcohols also present in the samples: one leading under isocratic elution with 500 mM NaOH, and the other using gradient elution with an eluent concentration from 280 to 700 mM NaOH. Detection was performed using a gold working electrode with a standard quadruple potential waveform. The method detection limit for LG, MNS, and GA were in the range of 0.89 to 4.6 ng m−3, with a recovery rate of 95–98%.
The same extract was used for WSOC analysis, where a specific volume was pipetted onto a blank quartz filter and analyzed using a thermal–optical protocol with a carbon aerosol analyzer (Sunset Laboratory Inc., Tigard, OR, USA).

2.5. Meteorological Data and Hourly PM Data

Meteorological data regarding ambient temperature (T/°C), relative humidity (RH/%), wind speed (ws/m s −1), and wind direction (wd/°), as well as raw hourly PM data, were measured by the Croatian Meteorological and Hydrological Service and provided by the Ministry of Environmental Protection and Green Transition, Croatia. An analysis of the meteorological data related to wind rose and pollution rose was conducted to explore correlations between PM concentrations and various meteorological and pollutant parameters using RStudio version 2025.05.0 build 496 (Posit Software, PBC). Additionally, satellite imagery from MODIS was employed to further understand the results. Backward air mass trajectories covering a 48 h period were performed using the HYSPLIT (Hybrid Single-Particle Lagrangian Integrated Trajectory) model, available through the READY (Real-time Environmental Applications and Display System) platform developed by the NOAA (National Oceanic and Atmospheric Administration) Air Resources Laboratory, College Park, MD, USA. Trajectories were computed for selected days at three arrival heights: 0 m, 500 m, and 1000 m above ground level. The model utilized meteorological input from the Global Data Assimilation System (GDAS), with a spatial resolution of 1-degree longitude and latitude.

3. Results and Discussion

3.1. Annual Trends of PM and Carbonaceous Compounds

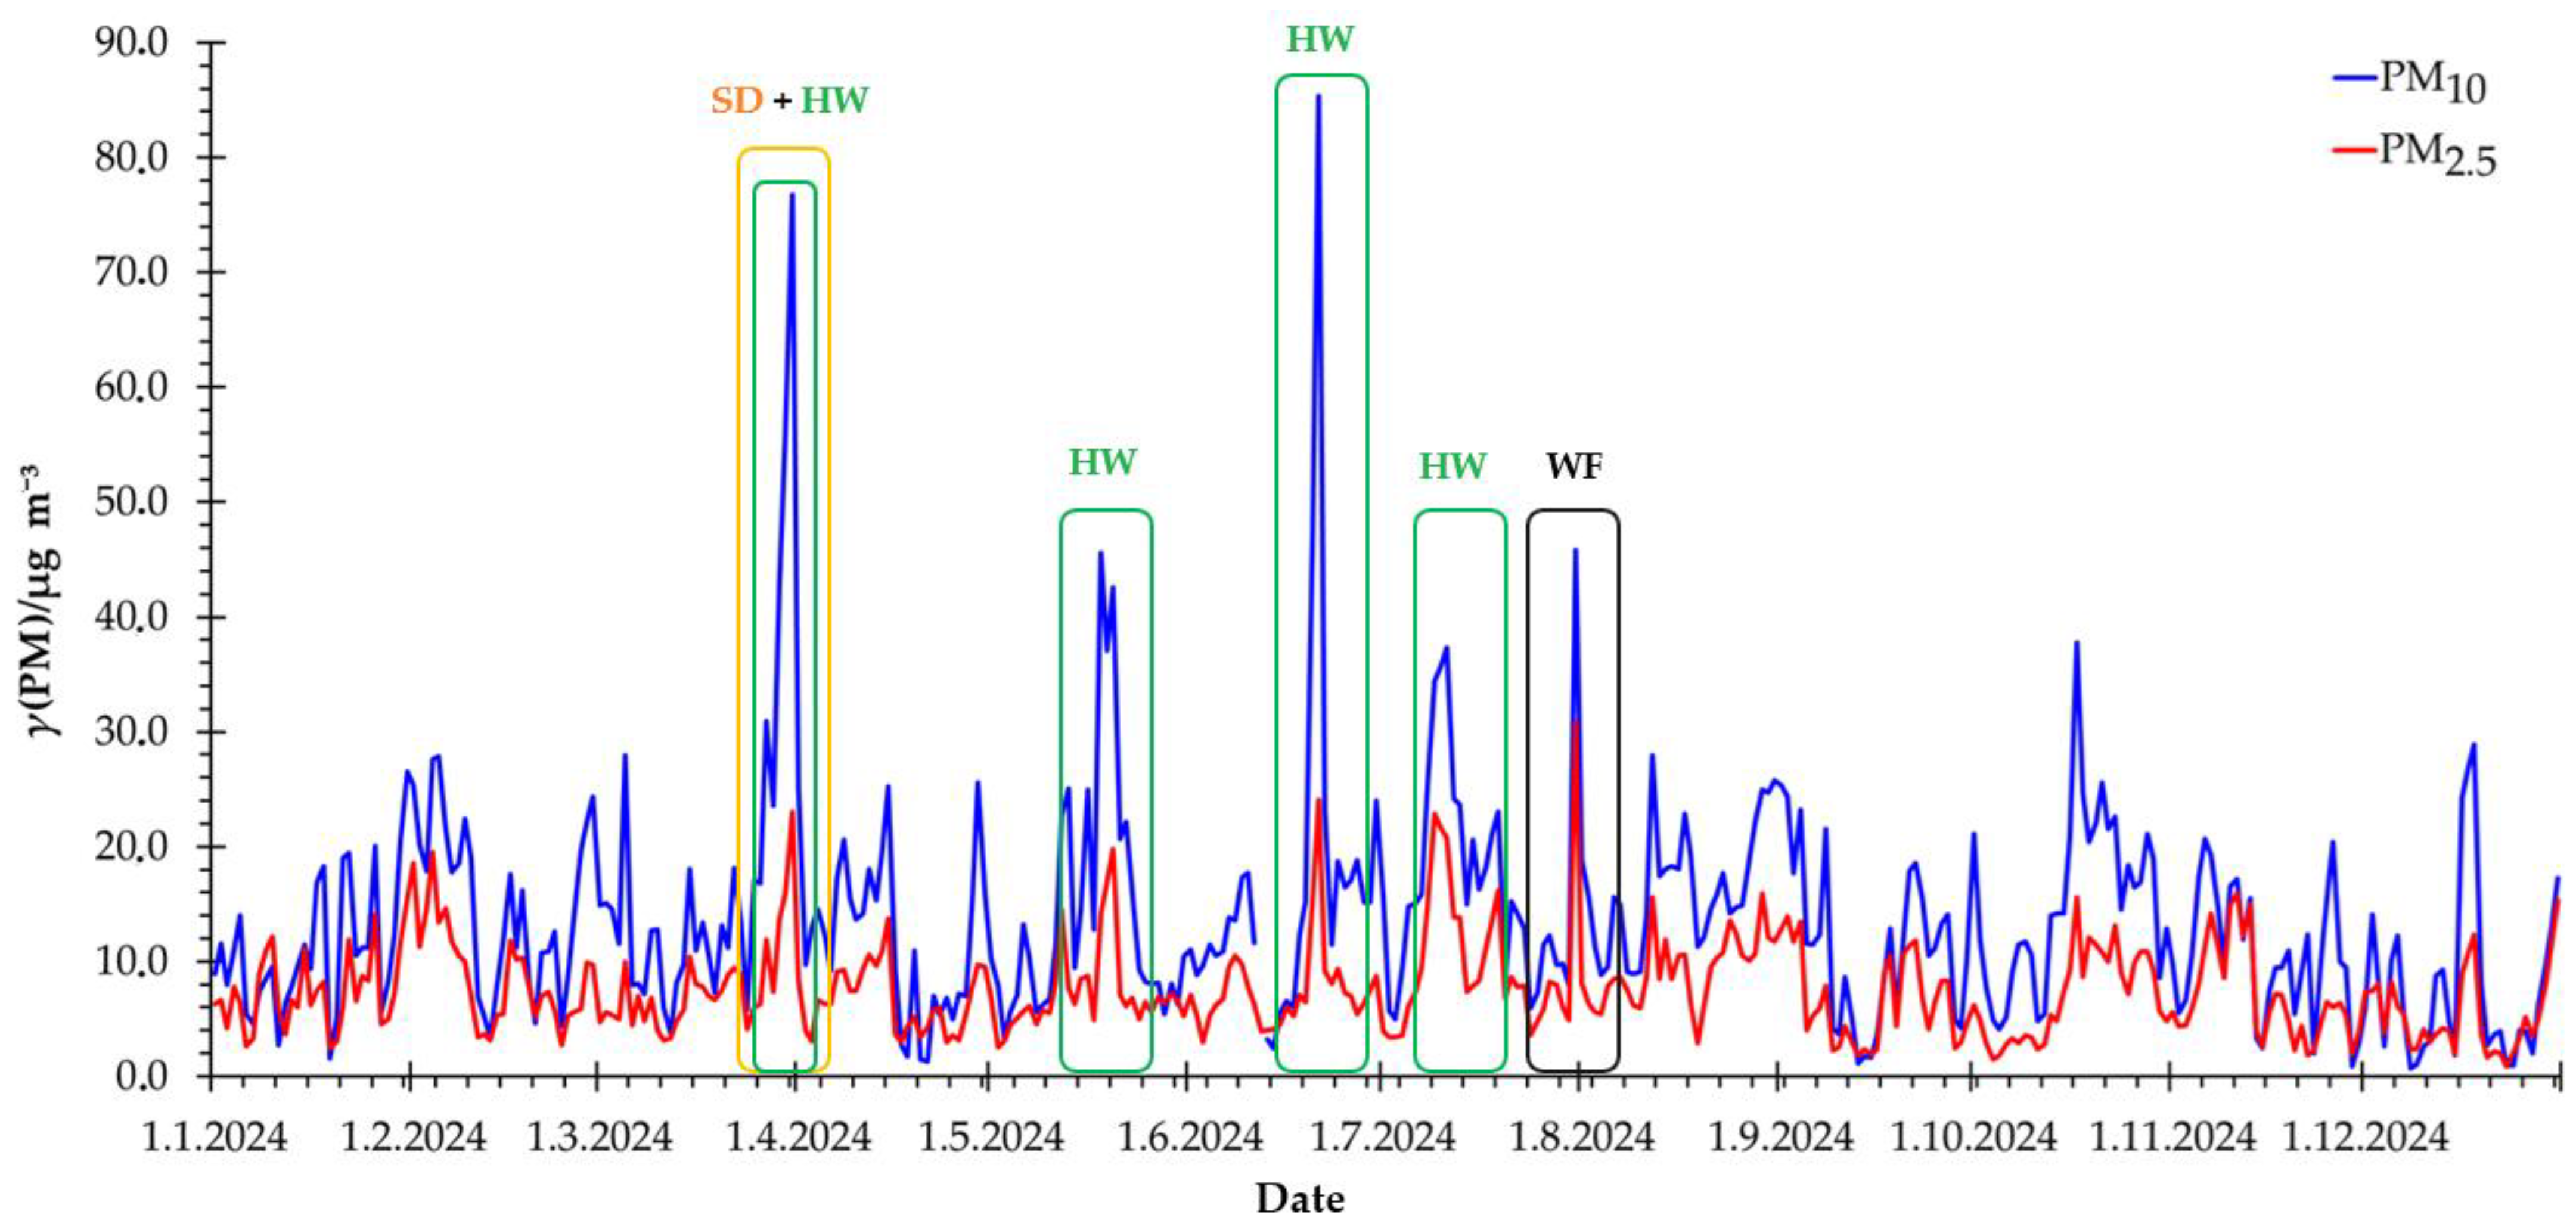
Figure 2 presents the mass concentrations of PM10 and PM2.5 throughout 2024. The annual average mass concentrations ± standard deviations were 14 ± 10 μg m−3 for PM10 and 8 ± 4 μg m−3 for PM2.5, which complies with the current EU standards that set annual limits of 40 μg m−3 for PM10 and 25 μg m−3 for PM2.5, as well as with EU standards, which will be applies from 2030 (20 μg m−3 for PM10 and 10 μg m−3 for PM2.5). However, a few exceedances of the daily limits (6 days for PM10 and 1 day for PM2.5) were established by the new EU Directive 2024/2881 [38]. The number of days with exceedances of the limit value prescribed for the 24 h averaging period was also below the allowed threshold, indicating that air quality, in accordance with both existing and forthcoming regulations, was satisfactory.
Marked exceedances in PM mass concentrations (outlined in Figure 2) coincide with heatwaves and Saharan dust episodes affecting almost the whole area of Croatia [23,24,25,26], as well as wildfire events that occurred in the Šibenik-Knin County reported by the Croatian Firefighting Association [30]. Such exceedances raise significant concerns regarding air quality, as prolonged exposure to fine particulate matter can harm health, particularly in urban and industrial areas [39,40]. The four reported heatwave events, marked in Figure 2, exhibit a clear temporal overlap with elevated concentrations of both PM10 and PM2.5, indicating a potential association between extreme temperature conditions and air quality deterioration. This increase in PM concentrations during heatwaves is often attributed to meteorological conditions and the photochemical reactions that follow. Heatwaves are typically accompanied by high-pressure systems that cause atmospheric stagnation, reducing vertical mixing and limiting pollutant dispersion. As a result, pollutants accumulate near the surface [41]. Additionally, elevated temperatures and intense solar radiation during heatwaves enhance photochemical activity, promoting the formation of secondary organic and inorganic aerosols. These processes, particularly significant for PM2.5, further contribute to the observed increase in particulate matter concentrations [42]. One of the major causes is the secondary aerosol formation, where the particles are generated through the chemical transformation of precursor gases (SO2, NOₓ, NH3, VOCs, etc.) leading to the formation of fine particulate matter (PM2.5), which can remain airborne for long periods and travel over considerable distances [43]. At the same time, long-range transport of Saharan dust introduces substantial amounts of mineral particles into the atmosphere, significantly contributing to coarse particles (PM10), regardless of local emissions. The alignment of these peaks with documented meteorological events suggests that both local and transboundary factors contribute to the observed exceedances in PM levels. Such results highlight the complex relationship between natural phenomena and anthropogenic emissions in shaping air quality dynamics.
To assess whether the pollution episodes observed at the Polača site reflected broader regional air quality patterns, PM concentrations were compared with measurements from two additional monitoring stations using data from the 2024 Annual Reports of the National Network for Air Quality Monitoring [44,45]. Both monitoring stations are located approximately 90 km from the Polača site: a rural background site at Plitvice Lakes to the northeast, and a suburban background site in Split to the southwest. At the Plitvice Lakes site, elevated PM10 and PM2.5 levels were observed during all of the reported heatwaves and Saharan dust episodes; however, no increase was detected during wildfire events near the Polača site. In contrast, at the Split site, elevated PM levels were recorded only during the heatwave, while neither the Saharan dust nor wildfire events led to noticeable increases in PM concentrations, unlike the pronounced effects observed at Polača. However, for a clearer idea of PM sources in the Polača site throughout the whole year, the source apportionment, including detailed PM composition, is necessary.
Results showed that on the days with exceedances, the PM2.5 mass contribution to the total PM10 mass was approximately 30%, except during the wildfire days, when the contribution exceeded 65%. On an annual basis, the average PM2.5 contribution to the total PM10 mass was 47%.
Average annual mass concentrations of OC in PM10 and PM2.5 were 2.93 ± 1.57 μg m−3 and 2.43 ± 1.44 μg m−3, respectively, while lower levels were observed for EC with 0.45 ± 0.31 μg m−3 in PM10 and 0.30 ± 0.19 μg m−3 in PM2.5. Measured values were comparable with previously observed annual concentrations in rural background in different European cities [46,47,48,49,50,51,52]. Annual average TC levels measured in PM10 and PM2.5 were 3.38 ± 1.77 μg m−3 and 2.74 ± 1.62 μg m−3, respectively.
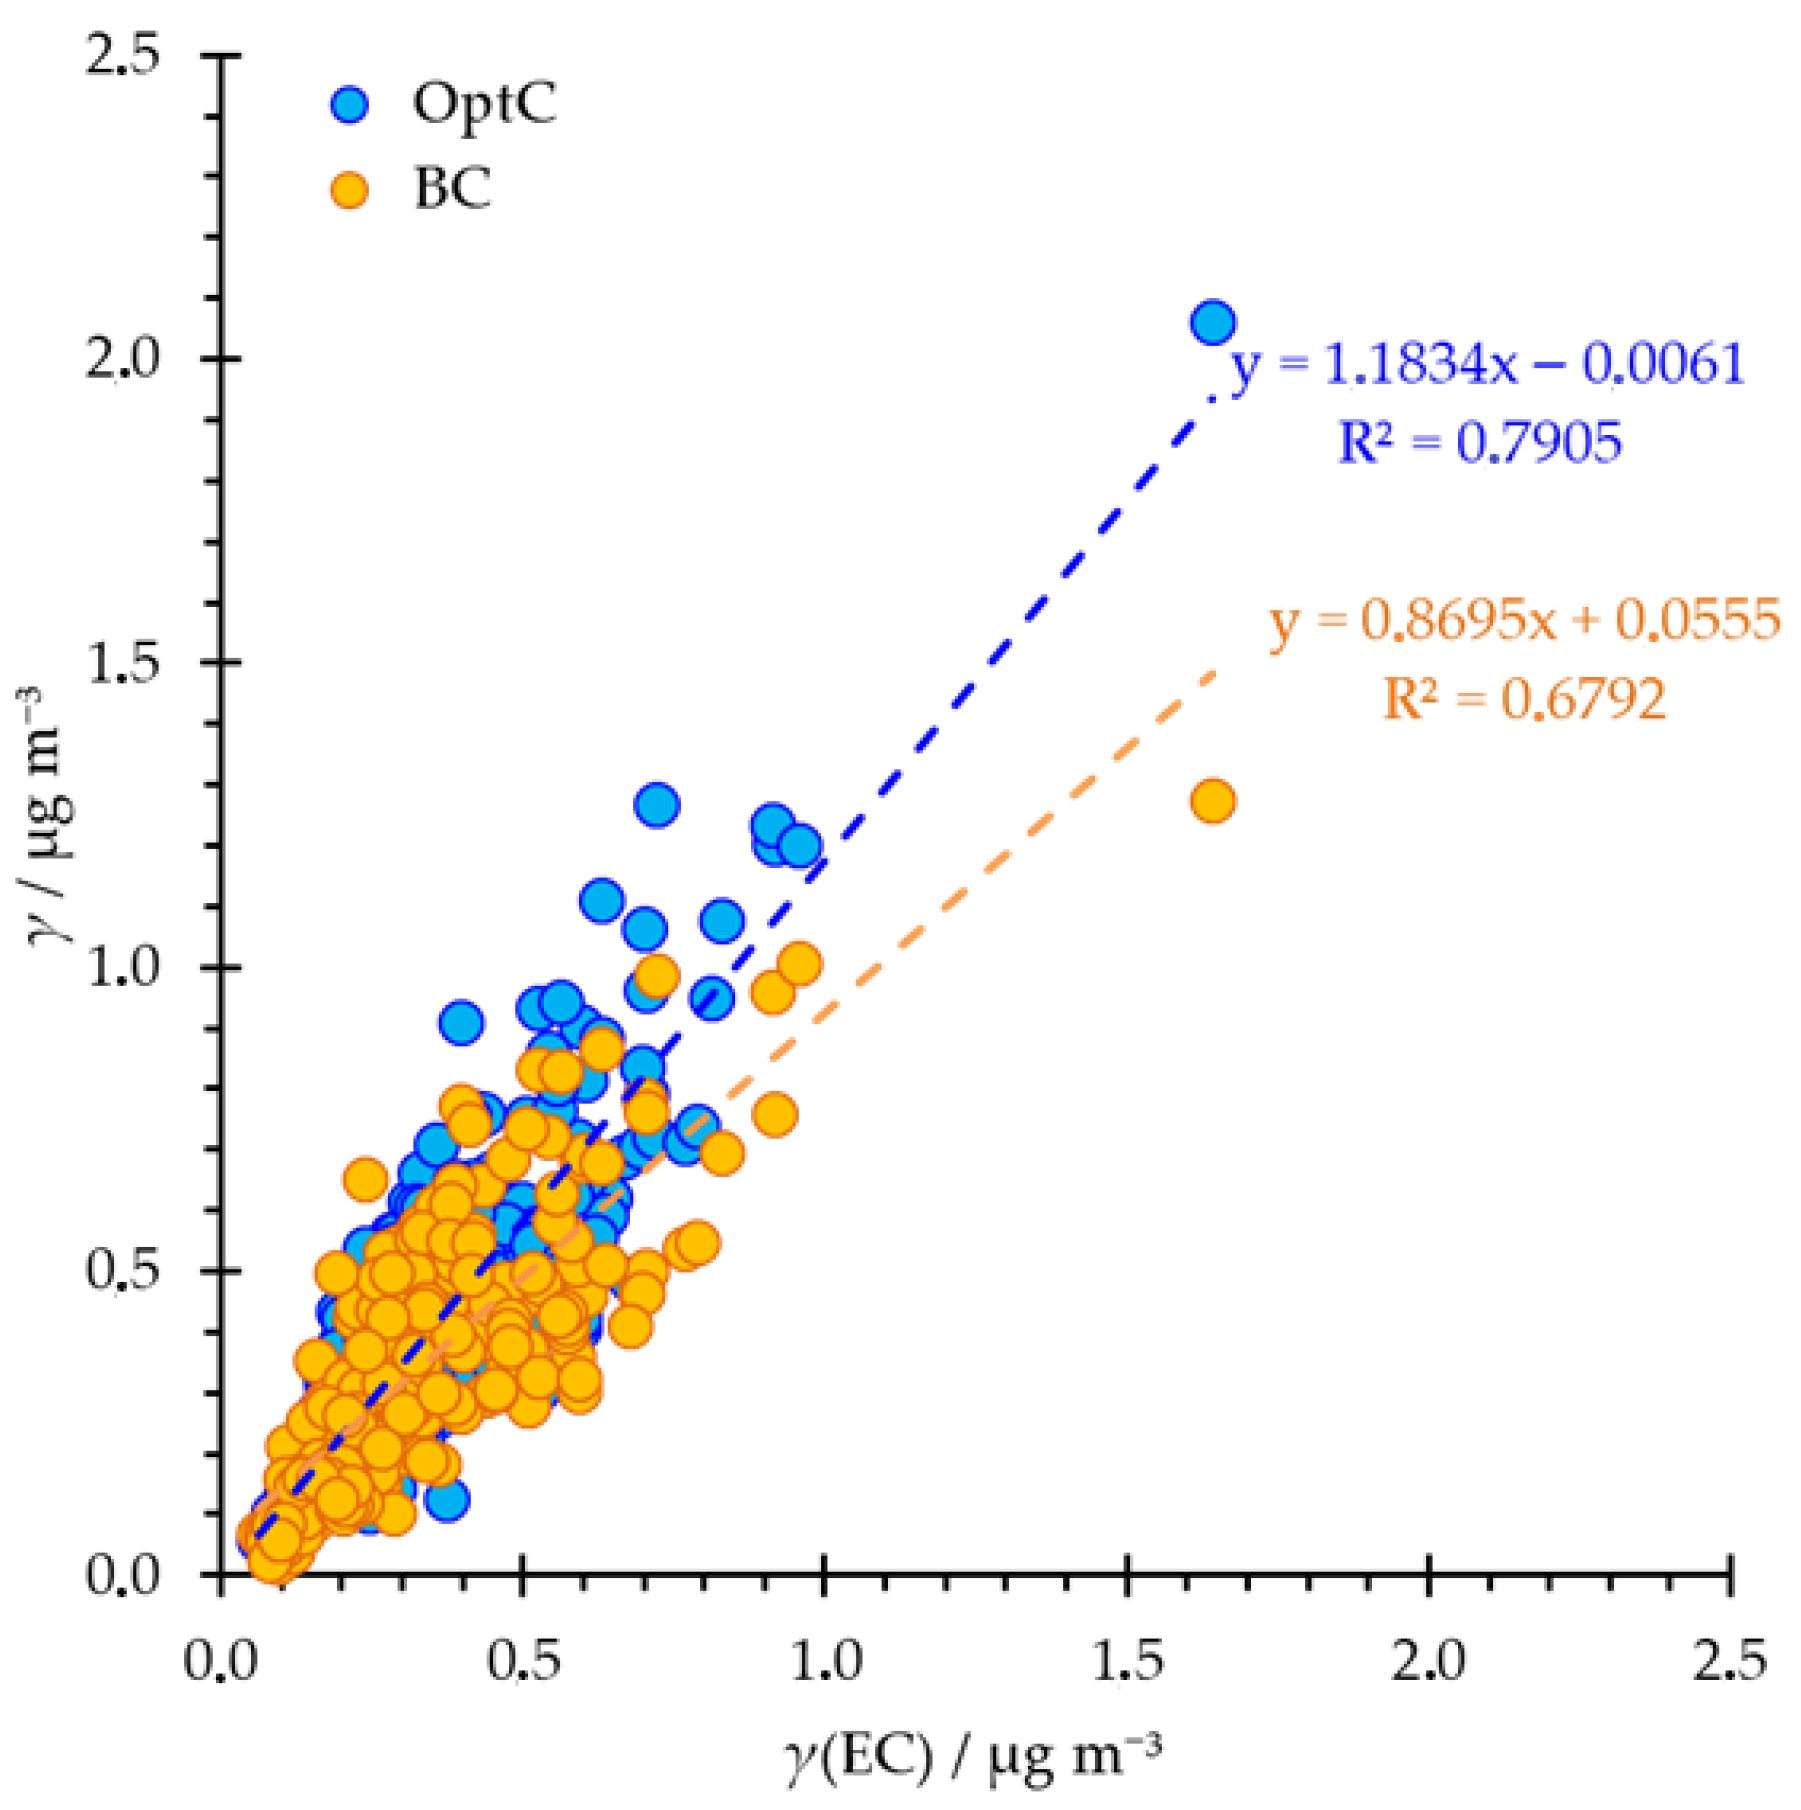
Although OC is primarily measured through volatilization from the filter in the helium phase, a portion of OC undergoes carbonization or pyrolysis, resulting in the formation of PyrC. This fraction remains on the filter and behaves similarly to EC by absorbing light and if not properly accounted, it could lead to incorrect distinction between OC and EC [53], especially under conditions where biomass burning or high OC content of PM in general increases the potential for PyrC formation. OptC is another important parameter since it includes EC and light-absorbing OC (both PyrC and brown carbon) [35,36]. Figure 3 shows a strong correlation between both OptC (determined with transmitance and thermo-optical method) and BC (determined by an aethalometer) with the measured EC, which is consistent with expectations. Since the aethalometer quantifies BC based on light attenuation at multiple wavelengths, it does not distinguish between EC and PyrC [54]. This OC fraction contributes to light absorption like EC and is therefore detected by optical methods, leading to elevated OptC readings compared to EC obtained through thermal-optical analysis [32,55].
While EC is recognized as a primary aerosol because it mainly results from pyrolysis during incomplete combustion processes such as traffic, industrial activities, and biomass burning [56,57], OC can originate from natural sources like vegetative debris, and anthropogenic sources including vehicular emissions, wood burning, industrial processes, and cooking. In contrast to POC, which is directly emitted from these sources, SOC is formed through photochemical reactions involving gas-phase precursors [58,59].
The estimation of SOC and POC is strongly influenced by temporal variations in the OC/EC ratio. In this study, monthly estimates of POC and SOC were derived using the minimum OC/EC ratio observed each month, following the widely used EC-tracer method [34,60,61,62]. Using monthly minimum OC/EC ratios provides a more seasonally responsive and dynamic estimation of POC and SOC compared to applying a single annual or campaign-wide ratio. This method assumes that the lowest monthly OC/EC ratio represents periods with minimal or negligible secondary organic aerosol formation and is therefore dominated by primary emissions. This approach is particularly valuable in environments with pronounced seasonal contrasts in emission sources and atmospheric photochemical activity, such as those influenced by biomass burning in winter and biogenic volatile organic compound (VOC) emissions in summer. The POC is calculated using the relationship (1) and assumes that POC and EC originate from the same combustion source:
POC = EC × (OC/EC)min
while SOC is then extracted from the difference between the measured total OC and the estimated POC as shown in Equation (2) [63]:
SOC = OC − POC
While this method is widely accepted, it introduces some uncertainties, particularly in conditions where the primary sources themselves exhibit variable OC/EC ratios. Specifically, lower minimum OC/EC values result in higher POC and lower SOC estimates, indicating a stronger influence of primary sources. Conversely, higher minimum OC/EC ratios increase SOC estimates, reflecting enhanced atmospheric formation of secondary organic aerosols.
Although the proportion of SOC in the total mass of PM is consistent in both the PM10 and PM2.5 fractions (Figure 4), the proportion of POC to the total mass of PM is significantly higher in PM2.5, nearly 2.5 times higher than in PM10. Such a portion suggests a greater contribution of POC to smaller particles.
WSOC, on the other hand, is often associated with SOC. However, some studies have shown that it can also be produced by biomass burning events [64,65]. Average annual mass concentrations of WSOC in PM10 and PM2.5 were 1.77 ± 0.84 μg m−3 and 1.24 ± 0.78 μg m−3, respectively. Our results showed that the WSOC mass contribution to the total mass of PM is similar in both fractions, approximately 17%. However, when considering the WSOC mass contribution to the total OC mass, it is more pronounced in the PM10 fraction (64%) compared to PM2.5 (52%), indicating a higher solubility of organic carbon in larger particulate matter [66,67,68].
Annual average mass concentrations of LG, the specific tracer for biomass burning, were 0.058 ± 0.105 μg m−3 in the PM10 fraction and 0.059 ± 0.092 μg m−3 in the PM2.5 fraction. LG levels were much lower than the ones reported so far for rural background areas in Croatia, where the annual values depended on season values varied between 0.001 and 0.124 μg m−3 in PM10 [69]. The determined levels were also lower than those across European cities [46,70,71,72]. As expected, levels of MNS were notably lower compared to LG, with average values of 0.012 ± 0.014 μg m−3 in the PM10 and 0.007 ± 0.010 μg m−3 in the PM2.5. On the other hand, mass concentrations of GA were below the detection limit in more than 75% of samples. The concentrations of LG, MNS, and GA produced during biomass burning can vary depending on factors such as combustion temperature, burning duration, fuel moisture content, and the type of vegetation burned (e.g., hardwood vs. softwood) [11,73]. Although both GA and MNS are formed from the pyrolysis of the galactose units in hemicellulose, several studies have reported that the total amount of GA emitted is substantially lower than that of MNS and LG [74,75]. This lower emission explains why GA frequently falls below the detection limit in atmospheric samples.
The results showed that the proportion of determined anhydrosugars within WSOC was higher in the PM2.5 fraction (4.8%) compared to the PM10 fraction (2.9%).

3.2. Seasonal Variations of Carbonaceous Components in PM

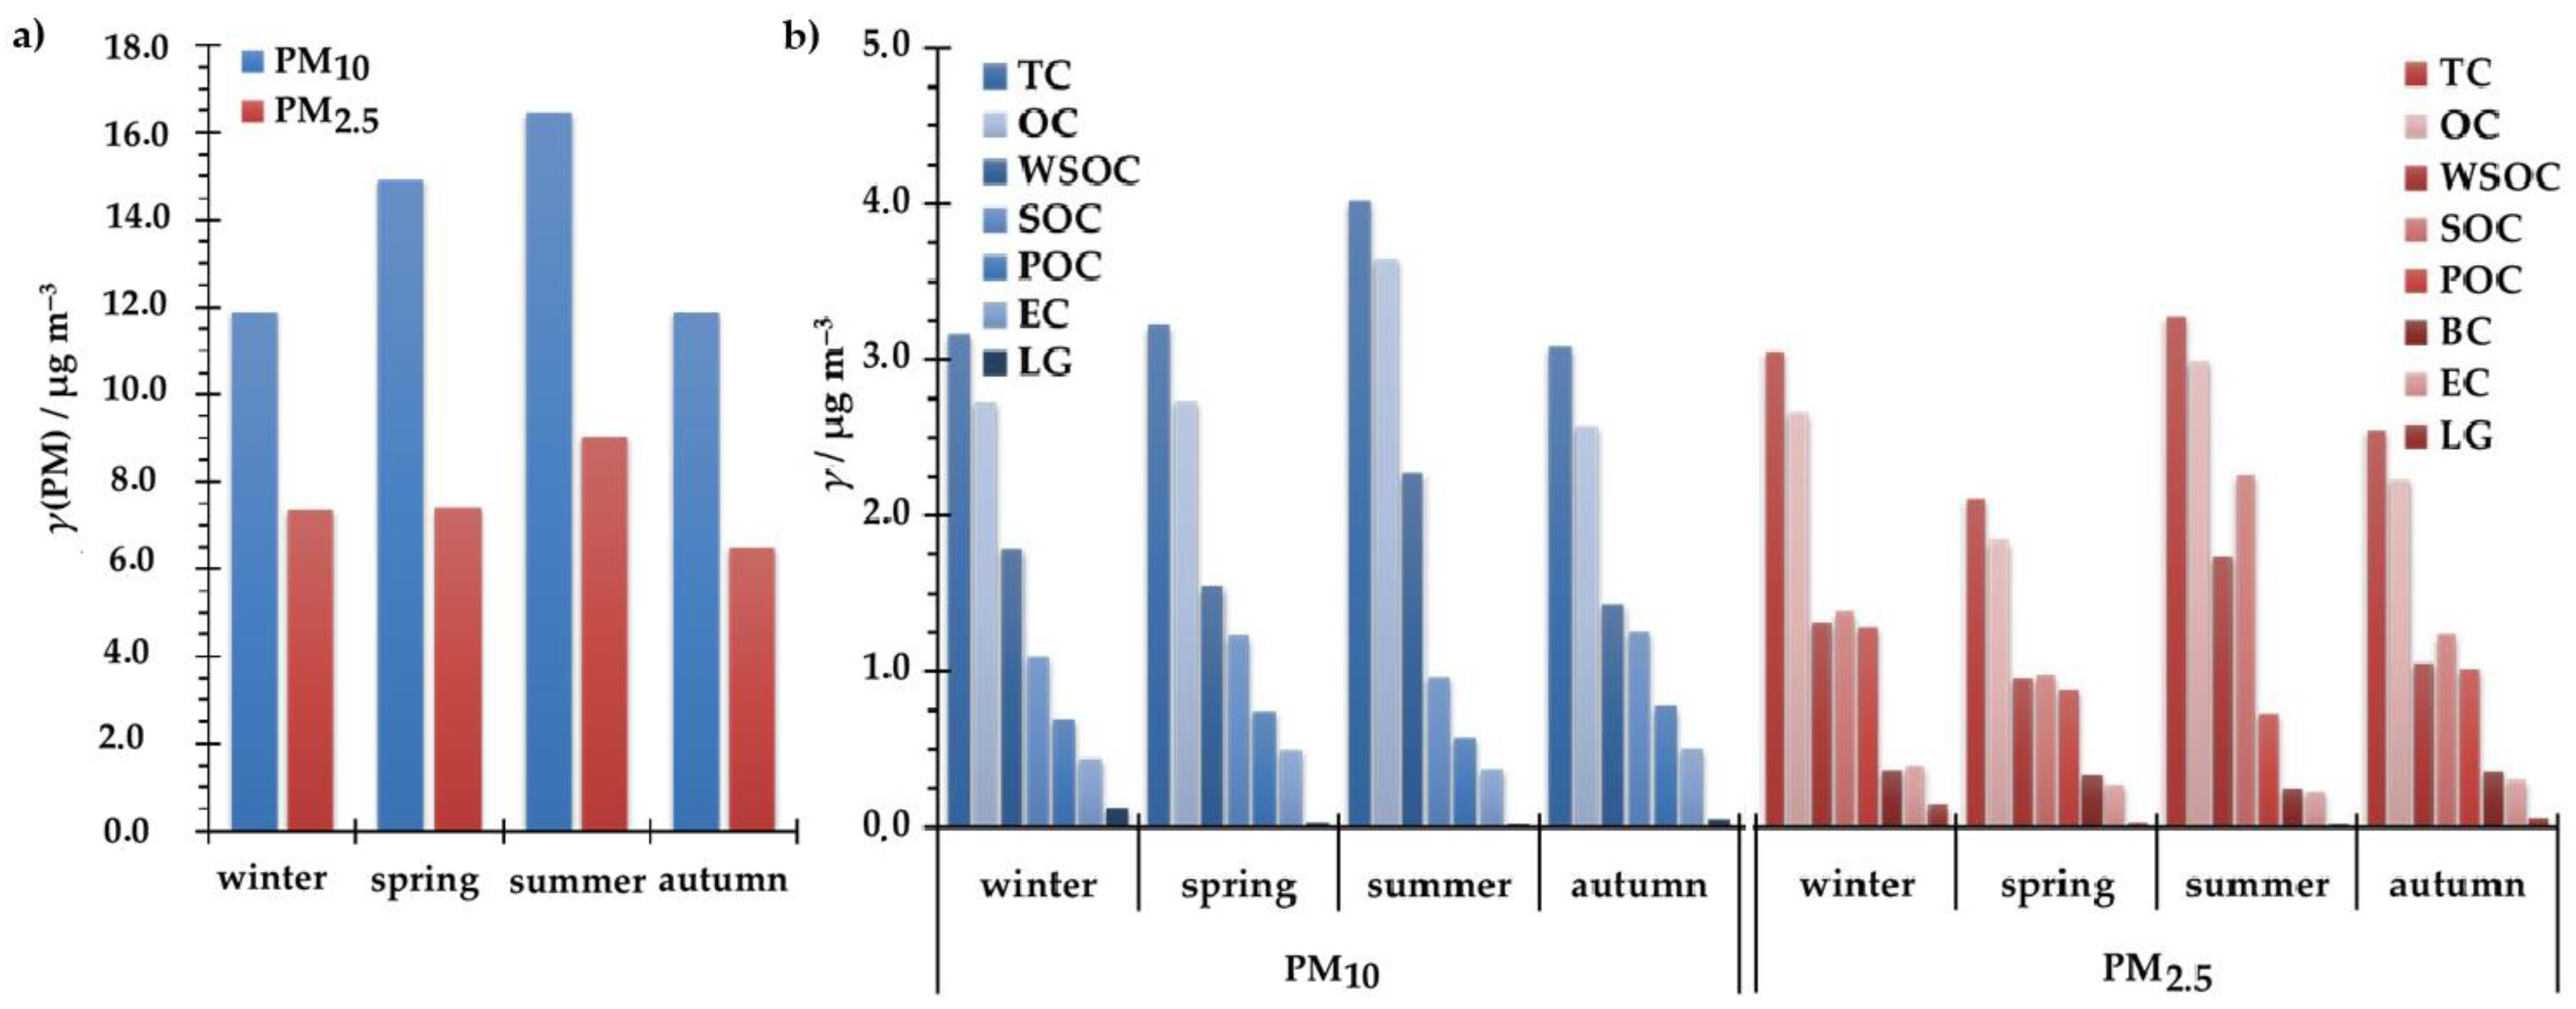
Figure 5 illustrates the seasonal variations in the mass concentrations of PM and carbonaceous compounds during 2024. Various seasonal trends of the measured compounds in both PM fractions are evident, indicating that different carbonaceous compounds exhibit distinct patterns depending on the PM fraction in which they were detected. These differences suggest that each PM fraction was influenced by different emission sources. The seasonal averages of PM10 and PM2.5 concentrations showed a decreasing trend from summer through spring and winter to autumn (Figure 5a). Statistically significant differences in PM10 levels were observed between summer and winter, as well as between winter and autumn. For PM2.5, significant differences were identified only between summer and autumn (p < 0.05). A similar seasonal trend was observed for OC and TC in PM10, whereas EC, SOC, and POC in PM10 showed the highest in autumn and lowest in summer (Figure 5b). This pattern is atypical, as the expected seasonal variation for carbonaceous aerosols generally follows the trend winter > autumn > spring > summer, primarily due to increased combustion sources and atmospheric stability during colder months [76]. However, similar seasonal variations, with elevated levels during the summer months, were also observed at another rural background site located within Plitvice Lakes National Park. These increased values are attributed to enhanced biogenic activity in the broader region surrounding the measurement site [69,76].
Seasonal variations of EC and POC in PM2.5, as well as LG in both PM fractions, followed the same trend: concentrations decreased from winter, autumn through spring and summer. The consistent trends suggest that these compounds may originate from similar sources. A comparable seasonal pattern for LG was previously observed at an urban background site in Croatia [37], where its levels were inversely related to ambient temperature and the demand for household heating.
In contrast to EC, POC and LG, the seasonal trends of OC, SOC, TC, and WSOC in PM2.5 followed a different pattern, with concentrations decreasing from summer through winter, autumn, and finally spring. Notably, WSOC in PM10 exhibited a unique seasonal trend, with the highest levels observed in summer, followed by winter, spring, and autumn. In addition to photochemical activity, enhanced biogenic emissions during warmer months may contribute to increased WSOC formation. Conversely, in winter, WSOC sources are primarily associated with water-insoluble organic matter originating from biomass burning and fossil fuel combustion [77].
The Kruskal–Wallis analysis revealed statistically significant seasonal differences for OC, TC, WSOC, and LG in PM10, and for OC, EC, SOC, POC, TC, WSOC, and LG in PM2.5 (p < 0.05). These variations suggest that carbonaceous components are closely related to seasonal factors such as ambient temperature and air circulation patterns, or enhanced biogenic activities influenced by these factors, as well as human activities that change with the seasons, including residential heating, agriculture, and traffic. Among the compounds measured, only EC, SOC, and POC in PM10 did not exhibit significant seasonal differences, suggesting two possibilities: either a consistent contribution from the same pollution source throughout the year, or different sources whose emissions and dispersion are influenced by the same factors, most likely meteorological. No statistically significant differences were observed between individual days when analyzing the data by weekday, nor between weekdays and weekends, with the exception of the mass contribution of OC and TC to the total PM. This suggests that, while seasonal influences were pronounced, daily and weekly patterns had a more limited effect on the distribution of carbonaceous fractions in PM.

3.3. Carbonaceous Compound Levels During the Wildfire Event

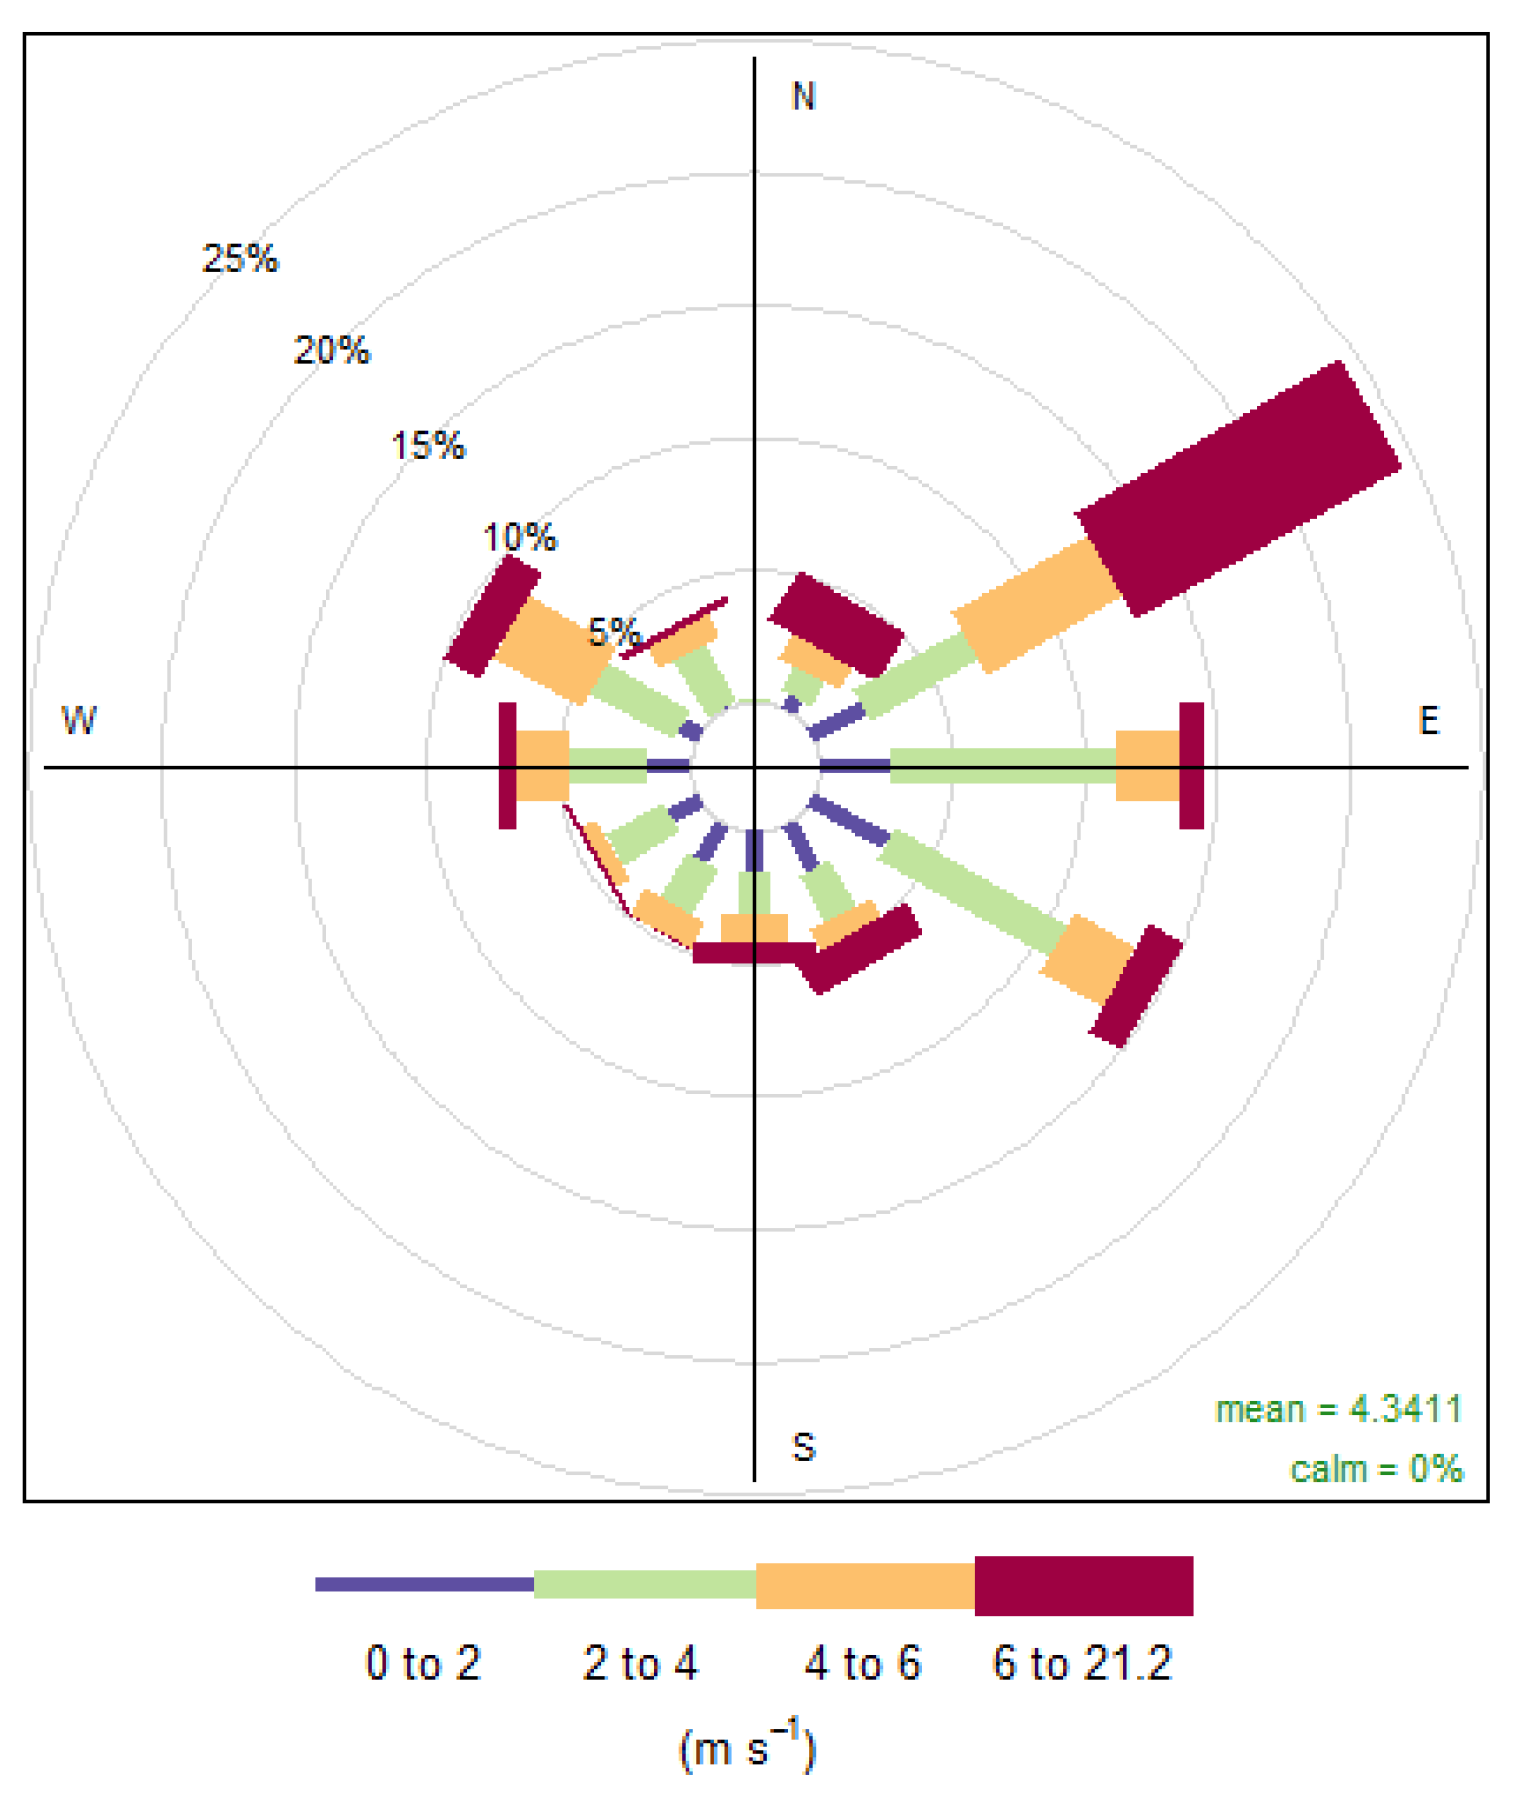
The distribution and transport of particulate matter in the atmosphere are significantly influenced by meteorological parameters, including wind speed, wind direction, relative humidity, rainfall, and ambient temperature [78]. Figure 6 presents a wind rose at the measurement site for the entire year of 2024. The data indicate that the prevailing wind came from the east–northeast (ENE), which is also linked to the highest wind speeds recorded. Between 30 July and 2 August 2024, the Croatian Firefighting Association reported two major wildfires in the region of the measuring site. Both fires occurred on July 30 in the Skradin area, affecting approximately 1700 ha of macchia, low vegetation, and pine forest. Despite intensive firefighting efforts, the fires remained active and were not fully contained until the morning of August 3 [30]. Although the cause of the fire is still unknown, during summer, they are frequently linked to human negligence. To identify pollution hotspots during wildfire episodes, the MODIS Terra and Aqua imagery data were used for each day (Figure 7).
The movement of air pollution caused by the wildfire is clearly observable. Although the distance between the fire site and the measurement location is 38 km, elevated levels of PM and LG were not detected at the site on the day of the fire (30 July), but rather the following day. As shown in Figure 8a, the increase in pollution indicates a predominant wind from the northeast. At the same time, the highest PM concentrations originated from the north–northwest (NNW), suggesting that the fire did not influence air quality at the measurement site on 30 July, when the fire was first reported. Elevated LG and PM levels were recorded on 31 July, clearly indicating the impact of the wildfire. Figure 8b shows shift in the predominant wind direction to the southwest, while the highest PM levels were associated with air masses arriving from the east to southeast—aligning with the location of the fire. The MODIS image in Figure 8b further supports these findings, confirming changes in both the direction and intensity of smoke transport.
In the following days (1 and 2 August), the wildfire had a minimal impact on air quality at the measurement site, as PM and LG concentrations remained within average values. During this period, predominant wind directions were from the northwest and southeast, while the highest PM levels were observed as originating from the west and west–southwest (WSW), as shown in Figure 8c,d.
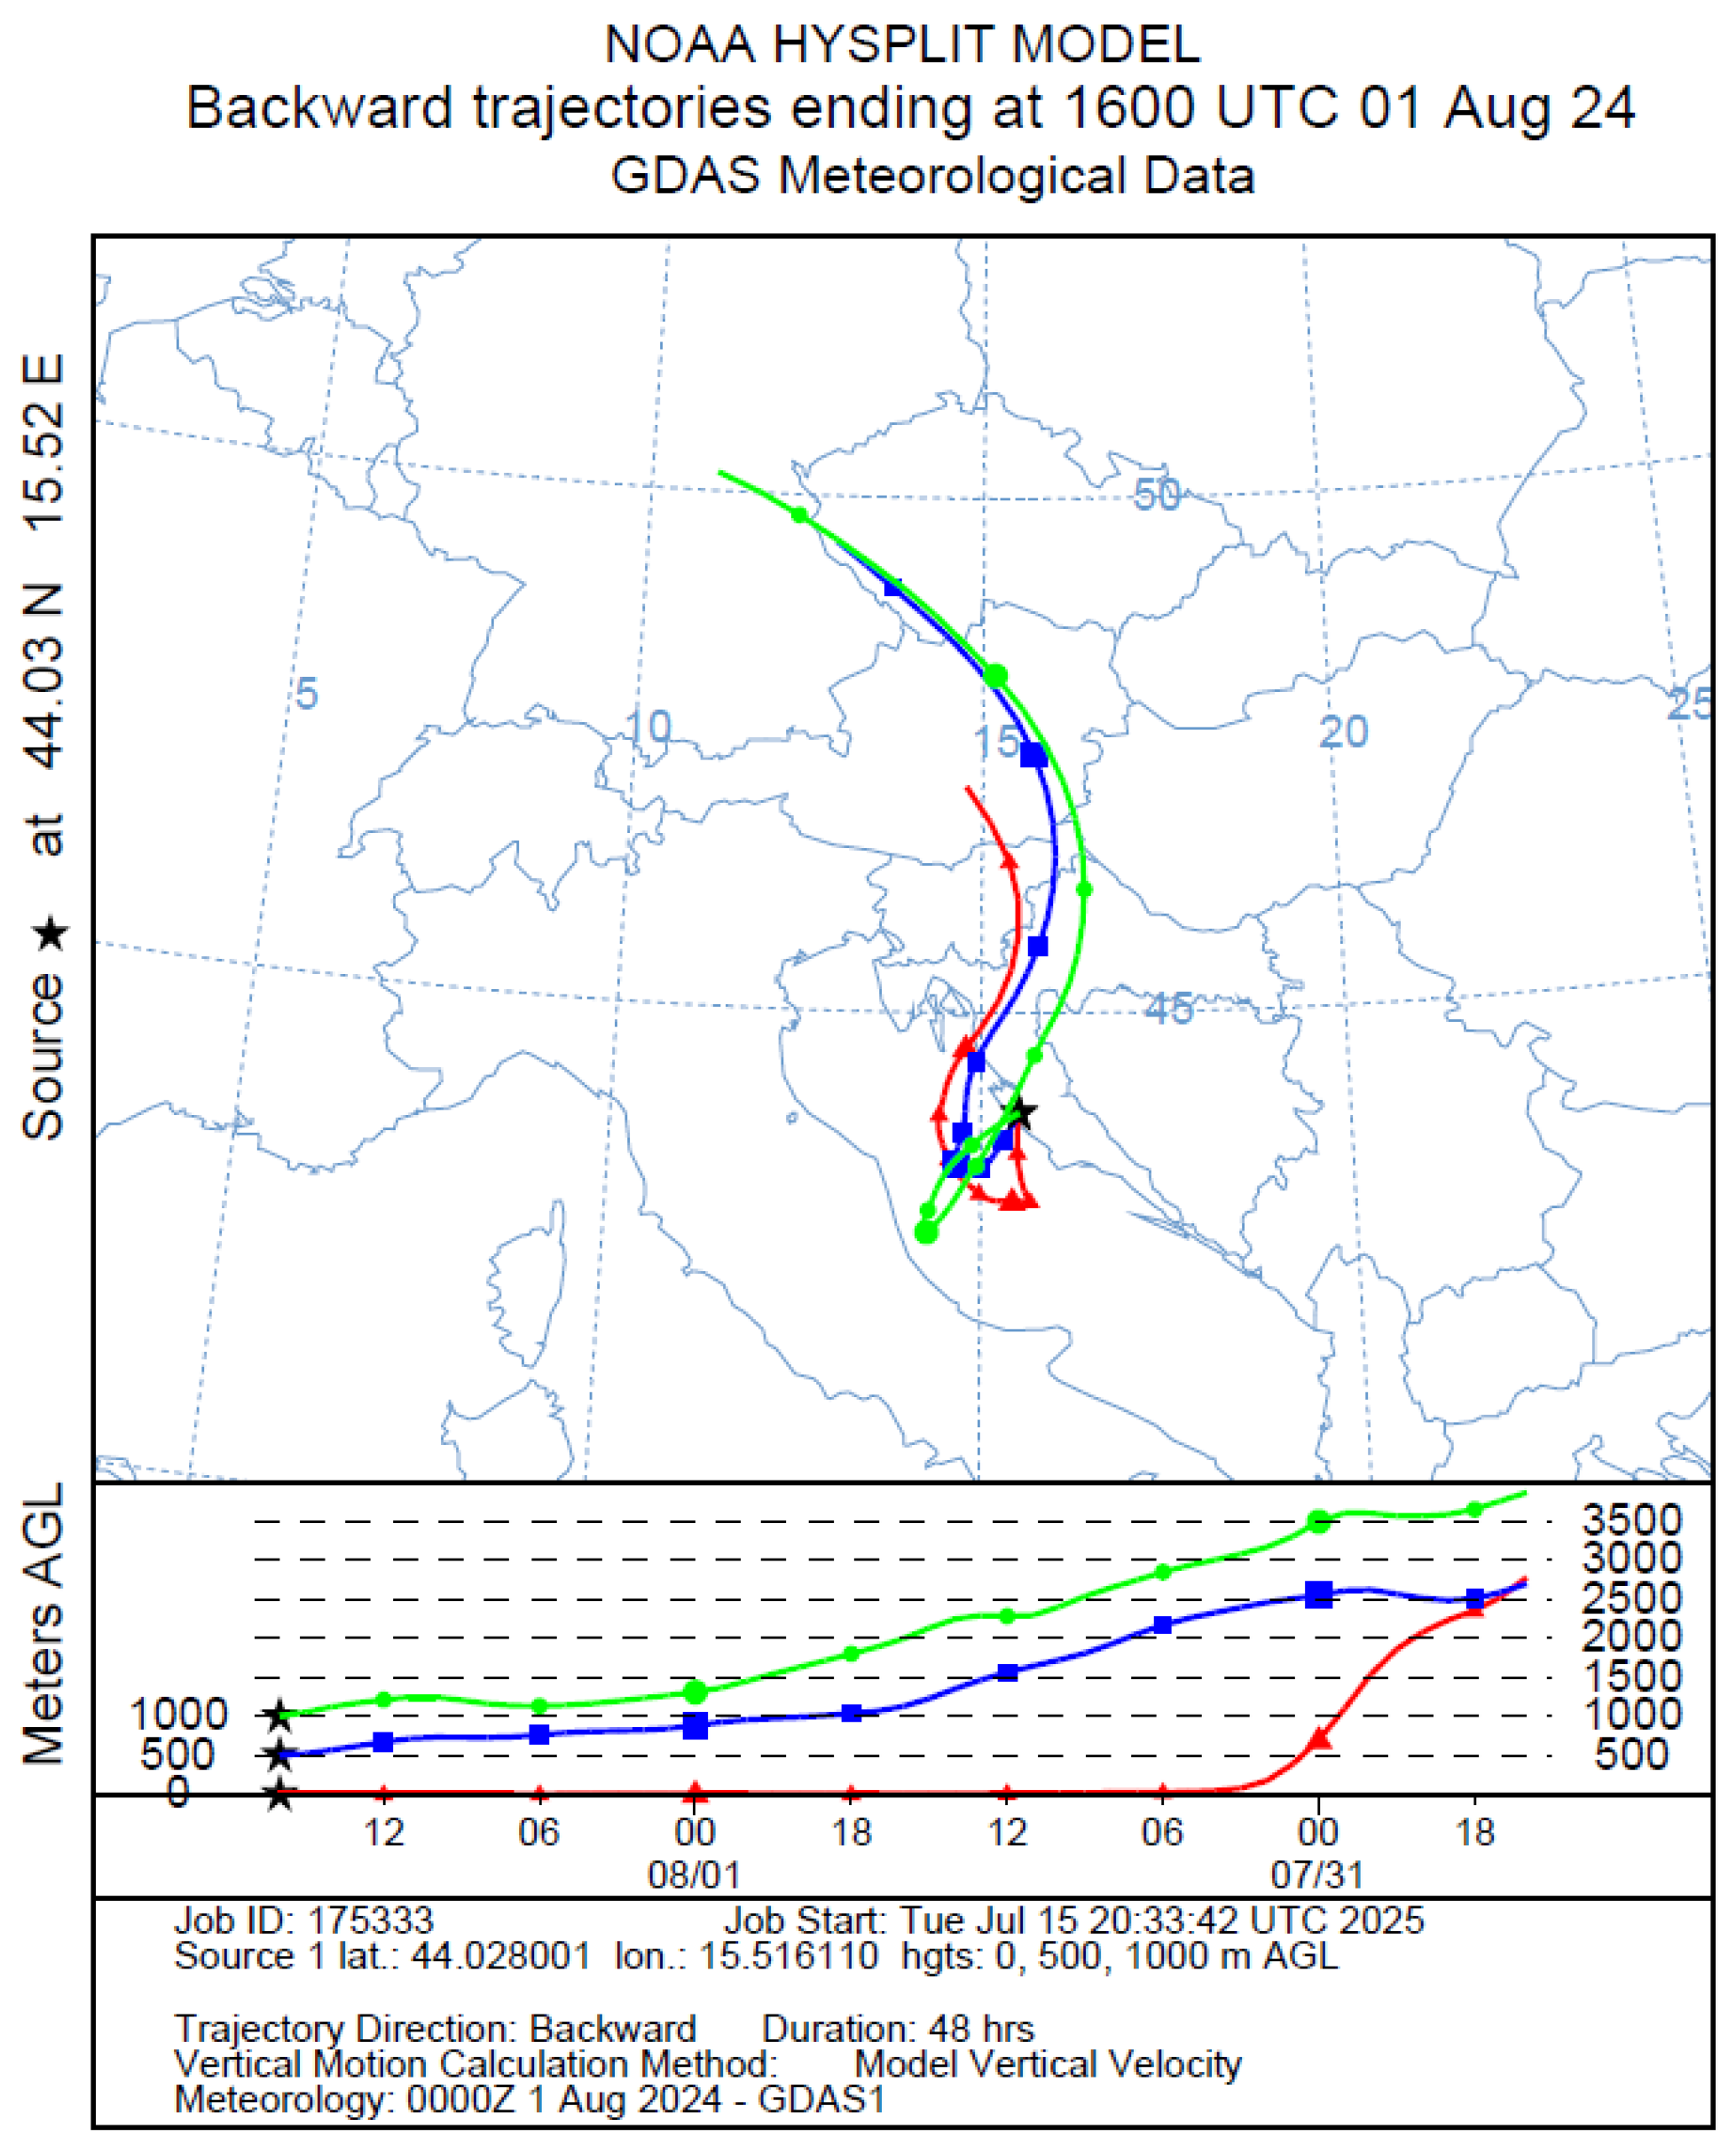
Figure 9 presents the 48 h backward air mass trajectories arriving at the Polača monitoring site, supporting the wind direction data shown in the pollution rose (Figure 8) and the satellite imagery (Figure 7). The trajectory analysis indicates that the air masses traveled over Austria and Slovenia, continued through northern and continental Croatia, and passed over the Gorski Kotar region, including the area above the Plitvice Lakes. Trajectories continued across the Adriatic Sea before turning eastward and subsequently northward toward the Polača site. This pathway suggests that the air masses may have intercepted and transported the PM emitted by the wildfire, as evidenced by the smoke plume shown in Figure 7. This is further supported by the fact that PM concentrations at the Plitvice Lakes site were not elevated during the wildfire period [44,45], and the air masses likely originated from more proximate areas, such as Šibenik-Knin County. A four-day period was inspected in detail to assess the impact on the levels of compounds strongly associated with biomass burning. The measured and calculated concentrations are presented in Figure 10. On the day of the fire event, the maximum daily mass concentrations of PM10 and PM2.5 reached 45.8 μg/m3 and 30.8 μg/m3, respectively.
Compared to the day before the fire was detected, the concentrations of carbonaceous compounds increased significantly: TC and OC increased by a factor of 7, BC by a factor of 12, PyrC by a factor of 8, SOC by a factor of 7, WSOC by a factor of 12, and POC by a factor of 4. The mass concentration of LG, a tracer directly linked to biomass burning, reached 1.219 μg/m3 in the PM10 fraction and 0.954 μg/m3 in the PM2.5 fraction, representing a 200-fold increase compared to the previous day.
The noticeable increase in carbonaceous compound levels in PM during wildfire episodes, aside from air pollution, has a significant impact on human health [79]. Numerous studies have demonstrated that the toxicity of particulate matter depends on its chemical composition, with carbonaceous fractions, metals, and secondary inorganic aerosols contributing to adverse health outcomes, particularly respiratory and cardiovascular effects [80]. In biomass burning, the health risks are attributed mainly to triggering oxidative stress and inflammation, mechanisms strongly linked to observed health issues or disabilities [81].
Table 1 summarizes the ratios of fire-related compounds for both fractions. These parameters are widely used to detect biomass burning episodes and assess their contribution to organic mass, yet they are rarely presented together in a comprehensive analysis.
On July 31, all ratios in the particulate matter samples indicated significantly higher values, aligning with the peak of the wildfire event, compared to the days before and after when the fire was either escalating or diminishing. This trend indicates a strong impact of fire-related emissions on the PM composition during the fire’s most intense phase. The sole exception is the OC/EC ratio, which was distinctly lower (10.2) on the day of the peak wildfire compared to other days. This decrease likely indicates a prevalence of EC emissions under high-temperature conditions of flaming combustion, where organic carbon is oxidized more effectively. A dominance of biomass burning was also seen from the high values of LG/BC_bb in PM2.5 (1.457), and elevated PyrC/OC (approx. 26.7% for both fractions). The LG/MNS ratio, commonly used to discern the type of biomass burned, recorded values of 5.4 and 7.0 in PM10 and PM2.5, respectively, suggesting softwood combustion [82,83]. The POC/OC ratio with 0.154 in PM10 and 0.326 in PM2.5 was higher compared to an average annual ratio of 0.06 and 0.14, respectively. The higher POC/OC ratio in PM2.5 is consistent with the fact that the contribution of PM2.5 to the total PM10 mass was twice as high during the fire event, indicating a greater presence of primary organic carbon in the fine particle fraction.
Moreover, the LG/WSOC ratio reached 0.147 in PM10 and 0.129 in PM2.5, significantly higher than the corresponding annual averages of 0.029 and 0.048, respectively, reinforcing the strong influence of biomass smoke. BC data were only available for the PM2.5 fraction, and in the ratio with EC, the values were a bit lower (0.778) than on the following days (0.886–1.830). LG was also compared to BC_bb, a part of the overall BC related to emissions from biomass burning, which was determined from distinct absorption Ångström exponent (AAE) values for fossil fuel combustion (1.0) and biomass burning sources (approx. 2.0) [84,85]. A notably higher ratio (1.457) was observed on the day of fire event compared to other days (<0.184), confirming that the primary source of black carbon on that day was biomass burning rather than traffic emissions.
On the days before and after the reported fire, the data indicate a mix of sources contributing to PM concentrations. Higher OC/EC ratios (>12) observed on these days are typical for aged aerosols and secondary organic matter formation, implying regional transport or photochemical processes [86]. The BC/EC ratio peaks on 1 August (1.83), suggesting a stronger influence from traffic emissions, particularly from diesel engines [87]. The PyrC/OC ratio reached its maximum on 1 August (30.9%), which may have been linked to long-range transport or aged organic aerosol particles [86]. Overall, while 31 July is dominated by primary biomass burning emissions, the remaining days reflect a combination of sources, including traffic, secondary aerosols, and lower-intensity biomass burning. Even though LG is a specific marker for biomass burning, as it is formed through cellulose pyrolysis at high temperatures, including additional biomass burning markers—such as potassium ions and PAHs—it could improve source identification and lead to more accurate source attribution. While these markers are less specific than LG, as they are also emitted from sources such as traffic, industry, cooking, dust, soil, and sea spray, they can complement LG by providing additional insight into biomass burning pollution and helping quantify the relative contributions of different sources more accurately.
According to the EUSAAR_2 protocol for OC/EC analysis, organic carbon fractions are thermally desorbed from PM filters in four stages based on their volatility: OC1 (<200 °C), OC2 (200–300 °C), OC3 (300–450 °C), and OC4 (450–650 °C) where OC1 represents the most volatile organic compounds and OC4 the least volatile. Figure 11 shows the OC fraction in the total OC (a), and the distribution of LG in OC fractions during the fire-affected day (31 July). The dominant fraction of total OC was OC2, accounting for 35%, followed by pyrolytic carbon (PyrC) at 26%, while OC1 contributed only 8% (Figure 11a). Thermal analysis of OC revealed a distinct shift in distribution of LG compared to previous studies. Although Hasegawa et al. [88] observed LG mainly in the OC2, OC3 and OC4 fraction, our results showed it was predominantly found in OC1 (36%) and OC4 (26%), with a smaller contribution in OC3 (17%) and PyrC (12%) (Figure 11b). This deviation likely reflects differences in combustion conditions and biomass characteristics during the wildfire event. In summary, while 31 July was clearly dominated by biomass burning, the following days reflected a combination of sources—including traffic, aged smoke, and secondary aerosol formation.
Nearly identical ratios of OC/EC, LG/PyrC, were observed in both PM10 and PM2.5 fractions, suggesting that the relative contributions of primary and secondary carbonaceous sources, as well as the distribution of specific biomass burning markers, were consistent across particle sizes. This indicates similar atmospheric processing and source profiles influencing coarse and fine particulate matter.

4. Conclusions

This study aimed to assess the impact of fire events on the concentrations of PM10, PM2.5, OC, EC, TC, WSOC, LG and MNS during the summer season at a rural site near the Croatian coastal region, where such occurrences are relatively common during periods of high temperatures. During such an event, the concentrations of biomass-burning tracers (LG, MNS, OC, EC) and fire-related ratios (OC/EC, POC/OC, PyrC/OC, LG/PM, LG/PyrC, LG/BC_bb, BC/EC, etc.) were significantly higher compared to their usual daily levels. This study also provides baseline data on LG in Croatia’s coastal rural regional site. The findings of this study clearly demonstrate the considerable influence of wildfire activity on air quality in rural Mediterranean environments, where baseline pollution levels are generally low and anthropogenic sources are limited. This research offers a detailed insight into how fire emissions change atmospheric composition by examining data throughout the year in conjunction with a targeted observation period during a wildfire event.
While annual concentrations of PM10 and PM2.5 were within EU regulatory thresholds, the occurrence of a fire event led to a substantial and immediate rise in both particulate mass and carbonaceous pollutants. Fine particles (PM2.5) dominated the composition during the wildfire, contributing over 65% to the total PM10 mass—a clear deviation from typical values. The chemical profile of PM shifted notably, with significant increases observed for OC, EC, TC, BC, WSOC, and PyrC, while LG, a key tracer for biomass combustion, surged up to 200 times compared to preceding days.
Meteorological data and remote sensing confirmed that smoke aerosols were transported from the fire zone toward the measurement site. The peak pollution day (31 July) reflected characteristics of biomass burning, including low OC/EC ratios and high proportions of LG in thermally stable OC fractions (OC4), confirming intense flaming combustion.
In the days that followed, shifts in air mass direction and changes in pollutant profiles suggested the influence of multiple sources, including traffic and secondary aerosol formation. These findings highlight the complexity of particulate matter origins in areas affected by wildfire smoke and the need to interpret chemical data alongside meteorological conditions. Source apportionment based on statistical analysis, such as Positive Matrix Factorization (PMF), with additional analytes included (metals, anions, cations, PAHs, etc.) will be the focus of our future study, particularly in characterizing the impact of fire on air pollution.

Author Contributions

Conceptualization, S.S. and R.G.; methodology, S.S., H.P., and R.G.; software, S.S.; validation, S.S., H.P., and R.G.; formal analysis, S.S., H.P.; investigation, S.S. and R.G.; writing—original draft preparation, S.S. and R.G.; writing—review and editing, S.S., R.G. and G.P.; visualization S.S. and R.G.; supervision, G.P. All authors have read and agreed to the published version of the manuscript.

Funding

Gravimetry measurements of PM10 and PM2.5 as well as the measurements of OC and EC in PM2.5 and LG in PM10 were conducted within the National Air Quality Monitoring Program on the National Network for Continuous Air Quality Monitoring funded by the Croatian Environmental Protection and Energy Efficiency Fund. All other measurements and research were funded by the European Union–Next Generation EU (Program Contract of 8 December 2023, Class: 643-02/23-01/00016, Reg. no. 533-03-23-0006)-EnvironPollutHealth.

Institutional Review Board Statement

Not applicable.

Informed Consent Statement

Not applicable.

Data Availability Statement

Supporting data may be obtained from the website http://iszz.azo.hr/iskzl/ (5 May 2025), either through a query on the website or by written request.

Acknowledgments

This study was performed using the facilities and equipment funded by the European Regional Development Fund project KK.01.1. 1.02.0007 “Research and Education Centre of Environmental Health and Radiation Protection–Reconstruction and Expansion of the Institute for Medical Research and Occupational Health”. The authors thank the Ministry of Environmental Protection and Green Transition in Croatia for supporting the scientific use of ion chromatography instruments. Instruments were acquired through the project AirQ–Expansion and Modernization of the National Network for Continuous Air Quality Monitoring (K.K.06.2.1.02.0001, granted by the European Regional Development Fund, Croatian Environmental Protection, and Energy Efficiency Fund). We also thank the Croatian Meteorological and Hydrological Service (DHMZ, Croatia) and Ministry of Environmental Protection and Green Transition in Croatia for collecting and providing meteorological, black carbon and PM hourly data.

Conflicts of Interest

The authors declare no conflicts of interest.

References

  1. Barjeste Vaezi, R.; Martin, M.R.; Hosseinpour, F. Impacts of Wildfire Smoke Aerosols on Radiation, Clouds, Precipitation, Climate, and Air Quality. Atmos. Environ. X 2025, 26, 100322. [Google Scholar] [CrossRef]
  2. Pio, C.A.; Legrand, M.; Alves, C.A.; Oliveira, T.; Afonso, J.; Caseiro, A.; Puxbaum, H.; Sanchez-Ochoa, A.; Gelencsér, A. Chemical Composition of Atmospheric Aerosols during the 2003 Summer Intense Forest Fire Period. Atmos. Environ. 2008, 42, 7530–7543. [Google Scholar] [CrossRef]
  3. Jaffe, D.A.; Wigder, N.L. Ozone Production from Wildfires: A Critical Review. Atmos. Environ. 2012, 51, 1–10. [Google Scholar] [CrossRef]
  4. Lopes, M.; Monteiro, A.; Mouzourides, P.; Κouis, P. The Health Burden of Wildfire Smoke in a Changing Climate: Exposure, Risks, and Strategies for Mitigation. Curr. Opin. Environ. Sci. Health 2025, 46, 100631. [Google Scholar] [CrossRef]
  5. Liu, J.C.; Pereira, G.; Uhl, S.A.; Bravo, M.A.; Bell, M.L. A Systematic Review of the Physical Health Impacts from Non-Occupational Exposure to Wildfire Smoke. Environ. Res. 2015, 136, 120–132. [Google Scholar] [CrossRef]
  6. Chen, H.; Samet, J.M.; Bromberg, P.A.; Tong, H. Cardiovascular Health Impacts of Wildfire Smoke Exposure. Part. Fibre Toxicol. 2021, 18, 2. [Google Scholar] [CrossRef]
  7. Karanasiou, A.; Alastuey, A.; Amato, F.; Renzi, M.; Stafoggia, M.; Tobías, A.; Reche, C.; Forastiere, F.; Gumy, S.; Mudu, P.; et al. Short-Term Health Effects from Outdoor Exposure to Biomass Burning Emissions: A Review. Sci. Total Environ. 2021, 781, 146739. [Google Scholar] [CrossRef]
  8. Coelho, S.; Ferreira, J.; Rodrigues, V.; Lopes, M. Source Apportionment of Air Pollution in European Urban Areas: Lessons from the ClairCity Project. J. Environ. Manag. 2022, 320, 115899. [Google Scholar] [CrossRef]
  9. Yuan, W.; Huang, R.J.; Yang, L.; Guo, J.; Chen, Z.; Duan, J.; Wang, T.; Ni, H.; Han, Y.; Li, Y.; et al. Characterization of the Light-Absorbing Properties, Chromophore Composition and Sources of Brown Carbon Aerosol in Xi’an, Northwestern China. Atmos. Chem. Phys. 2020, 20, 5129–5144. [Google Scholar] [CrossRef]
  10. Janta, R.; Sekiguchi, K.; Yamaguchi, R.; Sopajaree, K.; Pongpiachan, S.; Chetiyanukornkul, T. Ambient PM2.5, Polycyclic Aromatic Hydrocarbons and Biomass Burning Tracer in Mae Sot District, Western Thailand. Atmos. Pollut. Res. 2020, 11, 27–39. [Google Scholar] [CrossRef]
  11. Simoneit, B.R.T.; Schauer, J.J.; Nolte, C.G.; Oros, D.R.; Elias, V.O.; Fraser, M.P.; Rogge, W.F.; Cass, G.R. Levoglucosan, a Tracer for Cellulose in Biomass Burning and Atmospheric Particles. Atmos. Environ. 1999, 33, 173–182. [Google Scholar] [CrossRef]
  12. Braun, R.A.; Fraser, M.P. Influence of Wildfire Smoke on Summertime Surface Air Quality in an Urban Desert Region. Atmos. Environ. 2025, 358, 121297. [Google Scholar] [CrossRef]
  13. Jaffe, D.A.; O’Neill, S.M.; Larkin, N.K.; Holder, A.L.; Peterson, D.L.; Halofsky, J.E.; Rappold, A.G. Wildfire and Prescribed Burning Impacts on Air Quality in the United States. J. Air Waste Manag. Assoc. 2020, 70, 583–615. [Google Scholar] [CrossRef]
  14. Kaskaoutis, D.G.; Kharol, S.K.; Sifakis, N.; Nastos, P.T.; Sharma, A.R.; Badarinath, K.V.S.; Kambezidis, H.D. Satellite Monitoring of the Biomass-Burning Aerosols during the Wildfires of August 2007 in Greece: Climate Implications. Atmos. Environ. 2011, 45, 716–726. [Google Scholar] [CrossRef]
  15. van Drooge, B.L.; Lopez, J.F.; Grimalt, J.O. Influences of Natural Emission Sources (Wildfires and Saharan Dust) on the Urban Organic Aerosol in Barcelona (Western Mediterranean Basis) during a PM Event. Environ. Sci. Pollut. Res. 2012, 19, 4159–4167. [Google Scholar] [CrossRef]
  16. Alves, C.A.; Gonçalves, C.; Evtyugina, M.; Pio, C.A.; Mirante, F.; Puxbaum, H. Particulate Organic Compounds Emitted from Experimental Wildland Fires in a Mediterranean Ecosystem. Atmos. Environ. 2010, 44, 2750–2759. [Google Scholar] [CrossRef]
  17. Silva, P.; Carmo, M.; Rio, J.; Novo, I. Changes in the Seasonality of Fire Activity and Fire Weather in Portugal: Is the Wildfire Season Really Longer? Meteorology 2023, 2, 74–86. [Google Scholar] [CrossRef]
  18. Vicente, E.D.; Figueiredo, D.; Gonçalves, C.; Kováts, N.; Hubai, K.; Sainnokhoi, T.A.; Vicente, A.; Oliveira, H.; Lopes, I.; Alves, C. Toxicological Screening of PM2.5 from Wildfires Involving Different Biomass Fuels. Environ. Pollut. 2025, 370, 125887. [Google Scholar] [CrossRef]
  19. Koukouli, M.E.; Pseftogkas, A.; Karagkiozidis, D.; Mermigkas, M.; Panou, T.; Balis, D.; Bais, A. Extreme Wildfires over Northern Greece during Summer 2023—Part B. Adverse Effects on Regional Air Quality. Atmos. Res. 2025, 320, 108034. [Google Scholar] [CrossRef]
  20. Diapouli, E.; Popovicheva, O.; Kistler, M.; Vratolis, S.; Persiantseva, N.; Timofeev, M.; Kasper-Giebl, A.; Eleftheriadis, K. Physicochemical Characterization of Aged Biomass Burning Aerosol after Long-Range Transport to Greece from Large Scale Wildfires in Russia and Surrounding Regions, Summer 2010. Atmos. Environ. 2014, 96, 393–404. [Google Scholar] [CrossRef]
  21. Kaskaoutis, D.G.; Petrinoli, K.; Grivas, G.; Kalkavouras, P.; Tsagkaraki, M.; Tavernaraki, K.; Papoutsidaki, K.; Stavroulas, I.; Paraskevopoulou, D.; Bougiatioti, A.; et al. Impact of Peri-Urban Forest Fires on Air Quality and Aerosol Optical and Chemical Properties: The Case of the August 2021 Wildfires in Athens, Greece. Sci. Total Environ. 2024, 907, 168028. [Google Scholar] [CrossRef]
  22. Jakovljević, I.; Šimić, I.; Mendaš, G.; Sever Štrukil, Z.; Žužul, S.; Gluščić, V.; Godec, R.; Pehnec, G.; Bešlić, I.; Milinković, A.; et al. Pollution Levels and Deposition Processes of Airborne Organic Pollutants over the Central Adriatic Area: Temporal Variabilities and Source Identification. Mar. Pollut. Bull. 2021, 172, 112873. [Google Scholar] [CrossRef]
  23. Meteorological and Hydrological Bulletin 3/2024. Meteorol. Hydrol. Bull. 2024, 3, 1–51.
  24. Meteorological and Hydrological Bulletin 6/2024. Meteorol. Hydrol. Bull. 2024, 6, 1–53.
  25. Meteorological and Hydrological Bulletin 7/2024. Meteorol. Hydrol. Bull. 2024, 7, 1–59.
  26. Meteorological and Hydrological Bulletin 5/2024. Meteorol. Hydrol. Bull. 2024, 5, 1–59.
  27. National Firefighting Operations Centre Report. Available online: https://hvz.gov.hr/ (accessed on 7 May 2025).
  28. N1 Zagreb Hina N1 News. Available online: https://n1info.hr/english/news/croatia-records-21-increase-in-wildfires-in-2024/ (accessed on 6 May 2025).
  29. European Forest Fire Information System EFFIS Annual Statistics for Croatia. Available online: https://forest-fire.emergency.copernicus.eu/apps/effis.statistics/estimates (accessed on 5 May 2025).
  30. Croatian Firefighting Association. Available online: https://hvz.gov.hr/vijesti/dvoc-2-3-kolovoza-2024/4670 (accessed on 26 July 2025).
  31. EN 12341:2023; Ambient Air—Standard Gravimetric Measurement Method for the Determination of the PM10 or PM2.5 Mass Concentrat. European Committee for Standardization: Brussels, Belgium, 2023; p. 64.
  32. Putaud, J.-P.; Cavalli, F.; Viana, M.; Yttri, K.E.; Genberg, J. Toward a Standardised Thermal-Optical Protocol for Measuring Atmospheric Organic and Elemental Carbon: The EUSAAR Protocol. Atmos. Meas. Tech. 2010, 3, 79–89. [Google Scholar] [CrossRef]
  33. EN 16909:2017; Ambient Air—Measurement of Elemental Carbon (EC) and Organic Carbon (OC) Collected on Filters. European Committee for Standardization: Brussels, Belgium, 2017; pp. 1–60.
  34. Wu, C.; Yu, J.Z. Determination of Primary Combustion Source Organic Carbon-to-Elemental Carbon (OC/EC) Ratio Using Ambient OC and EC Measurements: Secondary OC-EC Correlation Minimization Method. Atmos. Chem. Phys. Discuss. 2016, 16, 5453–5465. [Google Scholar] [CrossRef]
  35. Dasari, S.; Widory, D. Radiocarbon (14C) Analysis of Carbonaceous Aerosols: Revisiting the Existing Analytical Techniques for Isolation of Black Carbon. Front. Environ. Sci. 2022, 10, 907467. [Google Scholar] [CrossRef]
  36. Panteliadis, P.; Hafkenscheid, T.; Cary, B.; Diapouli, E.; Fischer, A.; Favez, O.; Quincey, P.; Viana, M.; Hitzenberger, R.; Vecchi, R.; et al. ECOC Comparison Exercise with Identical Thermal Protocols after Temperature Offset Correction—Instrument Diagnostics by in-Depth Evaluation of Operational Parameters. Atmos. Meas. Tech. 2015, 8, 779–792. [Google Scholar] [CrossRef]
  37. Sopčić, S.; Pehnec, G.; Bešlić, I. Specific Biomass Burning Tracers in Air Pollution in Zagreb, Croatia. Atmos. Pollut. Res. 2024, 15, 102176. [Google Scholar] [CrossRef]
  38. Directive (EU) 2024/2881 of the European Parliament and of the Council of 23 October 2024 on ambient air quality and cleaner air for Europe (recast). Off. J. Eur. Union 2024, 2881, 1–70.
  39. Goodarzi, B.; Azimi Mohammadabadi, M.; Jafari, A.J.; Gholami, M.; Kermani, M.; Assarehzadegan, M.A.; Shahsavani, A. Investigating PM2.5 Toxicity in Highly Polluted Urban and Industrial Areas in the Middle East: Human Health Risk Assessment and Spatial Distribution. Sci. Rep. 2023, 13, 17858. [Google Scholar] [CrossRef]
  40. Zhai, G.; Zhang, L. Impact of Fine Particulate Matter 2.5 on Hospitalization for Upper Respiratory Tract Infections in Lanzhou Urban Industrial Area, China. Ann. Agric. Environ. Med. 2023, 30, 462–467. [Google Scholar] [CrossRef]
  41. Barriopedro, D.; Miralles, D.G.; Salcedo-Sanz, S.; García-Herrera, R.; Ordóñez, C. Heat Waves: A Growing Threat to Society and the Environment. Eos 2023, 104. [Google Scholar] [CrossRef]
  42. Zhang, Z.; Xu, W.; Zeng, S.; Liu, Y.; Liu, T.; Zhang, Y.; Du, A.; Li, Y.; Zhang, N.; Wang, J.; et al. Secondary Organic Aerosol Formation from Ambient Air in Summer in Urban Beijing: Contribution of S/IVOCs and Impacts of Heat Waves. Environ. Sci. Technol. Lett. 2024, 11, 738–745. [Google Scholar] [CrossRef]
  43. Escudero, M.; Viana, M.; Querol, X.; Alastuey, A.; Díez Hernández, P.; García Dos Santos, S.; Anzano, J. Industrial Sources of Primary and Secondary Organic Aerosols in Two Urban Environments in Spain. Environ. Sci. Pollut. Res. 2015, 22, 10413–10424. [Google Scholar] [CrossRef]
  44. Institute for Medical Research and Occupational Health, Annual Report ofNational Network for Air Quality Monitoring for 2024. Available online: https://iszz.azo.hr/iskzl/datoteka?id=168917 (accessed on 26 July 2025).
  45. DHMZ (Croatian Meteorological and Hydrological Service) Izvješće o Praćenju Kvalitete Zraka Na Postajama Državne Mreže Za Trajno Praćenje Kvalitete Zraka u 2024. Godini. Available online: https://iszz.azo.hr/iskzl/datoteka?id=168655 (accessed on 26 July 2025).
  46. Borlaza, L.J.; Weber, S.; Marsal, A.; Uzu, G.; Jacob, V.; Besombes, J.-L.; Chatain, M.; Conil, S.; Jaffrezo, J.-L. Nine-Year Trends of PM10 Sources and Oxidative Potential in a Rural Background Site in France. Atmos. Chem. Phys. 2022, 22, 8701–8723. [Google Scholar] [CrossRef]
  47. Yttri, K.E.; Aas, W.; Bjerke, A.; Cape, J.N.; Cavalli, F.; Ceburnis, D.; Dye, C.; Emblico, L.; Facchini, M.C.; Forster, C.; et al. Elemental and Organic Carbon in PM10: A One Year Measurement Campaign within the European Monitoring and Evaluation Programme EMEP. Atmos. Chem. Phys. 2007, 7, 5711–5725. [Google Scholar] [CrossRef]
  48. Yttri, K.E.; Simpson, D.; Bergström, R.; Kiss, G.; Szidat, S.; Ceburnis, D.; Eckhardt, S.; Hueglin, C.; Nøjgaard, J.K.; Perrino, C.; et al. The EMEP Intensive Measurement Period Campaign, 2008-2009: Characterizing Carbonaceous Aerosol at Nine Rural Sites in Europe. Atmos. Chem. Phys. 2019, 19, 4211–4233. [Google Scholar] [CrossRef]
  49. Dinoi, A.; Cesari, D.; Marinoni, A.; Bonasoni, P.; Riccio, A.; Chianese, E.; Tirimberio, G.; Naccarato, A.; Sprovieri, F.; Andreoli, V.; et al. Inter-Comparison of Carbon Content in PM2.5 and PM10 Collected at Five Measurement Sites in Southern Italy. Atmosphere 2017, 8, 243. [Google Scholar] [CrossRef]
  50. Querol, X.; Alastuey, A.; Ruiz, C.R.; Artiñano, B.; Hansson, H.C.; Harrison, R.M.; Buringh, E.; Ten Brink, H.M.; Lutz, M.; Bruckmann, P.; et al. Speciation and Origin of PM10 and PM2.5 in Selected European Cities. Atmos. Environ. 2004, 38, 6547–6555. [Google Scholar] [CrossRef]
  51. Putaud, J.-P.; Raes, F.; Van Dingenen, R.; Brüggemann, E.; Facchini, M.-C.; Decesari, S.; Fuzzi, S.; Gehrig, R.; Hüglin, C.; Laj, P.; et al. A European Aerosol Phenomenology—2: Chemical Characteristics of Particulate Matter at Kerbside, Urban, Rural and Background Sites in Europe. Atmos. Environ. 2004, 38, 2579–2595. [Google Scholar] [CrossRef]
  52. Aas, W.; Fagerli, H.; Alastuey, A.; Cavalli, F.; Degorska, A.; Feigenspan, S.; Brenna, H.; Gliß, J.; Heinesen, D.; Hueglin, C.; et al. Trends in Air Pollution in Europe, 2000–2019. Aerosol Air Qual. Res. 2024, 24, 230237. [Google Scholar] [CrossRef]
  53. Lee, J.; Kim, D.; Lee, J. Elemental Carbon and Its Fractions during Evolved Gas Analysis with Respect to Pyrolytic Carbon and Split Time. Appl. Sci. 2021, 11, 7544. [Google Scholar] [CrossRef]
  54. Turšič, J.; Podkrajšek, B.; Grgić, I.; Ctyroky, P.; Berner, A.; Dusek, U.; Hitzenberger, R. Chemical Composition and Hygroscopic Properties of Size-Segregated Aerosol Particles Collected at the Adriatic Coast of Slovenia. Chemosphere 2006, 63, 1193–1202. [Google Scholar] [CrossRef]
  55. Karanasiou, A.; Minguillón, M.C.; Viana, M.; Alastuey, A.; Putaud, J.-P.; Maenhaut, W.; Panteliadis, P.; Močnik, G.; Favez, O.; Kuhlbusch, T.A.J. Thermal-Optical Analysis for the Measurement of Elemental Carbon (EC) and Organic Carbon (OC) in Ambient Air a Literature Review. Atmos. Meas. Tech. Discuss 2015, 8, 9649–9712. [Google Scholar] [CrossRef]
  56. Rajput, P.; Sarin, M.M.; Sharma, D.; Singh, D. Organic Aerosols and Inorganic Species from Post-Harvest Agricultural-Waste Burning Emissions over Northern India: Impact on Mass Absorption Efficiency of Elemental Carbon. Environ. Sci. Process. Impacts 2014, 16, 2371–2379. [Google Scholar] [CrossRef]
  57. Hou, S.; Liu, D.; Xu, J.; Vu, T.; Wu, X.; Srivastava, D.; Fu, P.; Li, L.; Sun, Y.; Vlachou, A.; et al. Source Apportionment of Carbonaceous Aerosols in Beijing with Radiocarbon and Organic Tracers: Insight into the Differences between Urban and Rural Sites. Atmos. Chem. Phys. 2021, 21, 8273–8292. [Google Scholar] [CrossRef]
  58. Choi, J.-K.; Ban, S.-J.; Kim, Y.-P.; Kim, Y.-H.; Yi, S.-M.; Zoh, K.-D. Molecular Marker Characterization and Source Appointment of Particulate Matter and Its Organic Aerosols. Chemosphere 2015, 134, 482–491. [Google Scholar] [CrossRef]
  59. Mahilang, M.; Deb, M.K.; Pervez, S. Biogenic Secondary Organic Aerosols: A Review on Formation Mechanism, Analytical Challenges and Environmental Impacts. Chemosphere 2021, 262, 127771. [Google Scholar] [CrossRef]
  60. Plaza, J.; Artíñano, B.; Salvador, P.; Gómez-Moreno, F.J.; Pujadas, M.; Pio, C.A. Short-Term Secondary Organic Carbon Estimations with a Modified OC/EC Primary Ratio Method at a Suburban Site in Madrid (Spain). Atmos. Environ. 2011, 45, 2496–2506. [Google Scholar] [CrossRef]
  61. Castro, L.M.; Pio, C.A.; Harrison, R.M.; Smith, D.J.T. Carbonaceous Aerosol in Urban and Rural European Atmospheres: Estimation of Secondary Organic Carbon Concentrations. Atmos. Environ. 1999, 33, 2771–2781. [Google Scholar] [CrossRef]
  62. Turpin, B.J.; Huntzicker, J.J. Identification of Secondary Organic Aerosol Episodes and Quantitation of Primary and Secondary Organic Aerosol Concentrations during SCAQS. Atmos. Environ. 1995, 29, 3527–3544. [Google Scholar] [CrossRef]
  63. Ma, L.; Hu, D.; Yan, Y.; Niu, Y.; Duan, X.; Guo, Y.; Li, W.; Peng, L. Pollution Characteristics and Source Analysis of Carbonaceous Components in PM2.5 in a Typical Industrial City. Aerosol Air Qual. Res. 2024, 24, 240014. [Google Scholar] [CrossRef]
  64. Decesari, S.; Fuzzi, S.; Facchini, M.C.; Mircea, M.; Emblico, L.; Cavalli, F.; Maenhaut, W.; Chi, X.; Schkolnik, G.; Falkovich, A.; et al. Characterization of the Organic Composition of Aerosols from Rondônia, Brazil, during the LBA-SMOCC 2002 Experiment and Its Representation through Model Compounds. Atmos. Chem. Phys. 2006, 6, 375–402. [Google Scholar] [CrossRef]
  65. López-Caravaca, A.; Crespo, J.; Galindo, N.; Yubero, E.; Juárez, N.; Nicolás, J.F. Sources of Water-Soluble Organic Carbon in Fine Particles at a Southern European Urban Background Site. Atmos. Environ. 2023, 306, 119844. [Google Scholar] [CrossRef]
  66. Sopčić, S.; Godec, R.; Jakovljević, I.; Bešlić, I. The Influence of Biomass Burning on the Organic Content of Urban Aerosols. Biomass 2024, 5, 1. [Google Scholar] [CrossRef]
  67. Fernandes, K.S.; dos Santos, E.O.; Batista, C.E.; Ribeiro, I.O.; Piracelli, V.P.; Solci, M.C.; Duvoisin Jr., S.; Martin, S.T.; Souza, R.A.F.; Machado, C.M.D. WSOC and Its Relationship with BC, Levoglucosan and Transition Metals in the PM2.5 of an Urban Area in the Amazon. J. Braz. Chem. Soc. 2022, 33, 570–581. [Google Scholar] [CrossRef]
  68. Witkowska, A.; Lewandowska, A.U. Water Soluble Organic Carbon in Aerosols (PM1, PM2.5, PM10) and Various Precipitation Forms (Rain, Snow, Mixed) over the Southern Baltic Sea Station. Sci. Total Environ. 2016, 573, 337–346. [Google Scholar] [CrossRef]
  69. Sopčić, S.; Jakovljević, I.; Štrukil, Z.S.; Bešlić, I. Source Identification of Carbohydrates and Polycyclic Aromatic Hydrocarbons in a Rural Area near the Plitvice Lakes National Park, Croatia. Atmos. Environ. 2025, 345, 121050. [Google Scholar] [CrossRef]
  70. Puxbaum, H.; Caseiro, A.; Claeys, M. Levoglucosan Levels at Background Sites in Europe for Assessing the Impact of Biomass Combustion on the European Aerosol Background. J. Geophys. Res. Atmos. 2007, 112, D23S05 (1-11). [Google Scholar] [CrossRef]
  71. Maenhaut, W.; Vermeylen, R.; Claeys, M.; Vercauteren, J.; Matheeussen, C.; Roekens, E. Assessment of the Contribution from Wood Burning to the PM10 Aerosol in Flanders, Belgium. Sci. Total Environ. 2012, 437, 226–236. [Google Scholar] [CrossRef]
  72. Jedynska, A.; Hoek, G.; Wang, M.; Eeftens, M.; Cyrys, J.; Beelen, R.; Cirach, M.; De Nazelle, A.; Keuken, M.; Visschedijk, A.; et al. Spatial Variations of Levoglucosan in Four European Study Areas. Sci. Total Environ. 2015, 505, 1072–1081. [Google Scholar] [CrossRef]
  73. Vincenti, B.; Paris, E.; Carnevale, M.; Palma, A.; Guerriero, E.; Borello, D.; Paolini, V.; Gallucci, F. Saccharides as Particulate Matter Tracers of Biomass Burning: A Review. Int. J. Environ. Res. Public Health 2022, 19, 4387. [Google Scholar] [CrossRef]
  74. Zdráhal, Z.; Oliveira, J.; Vermeylen, R.; Claeys, M.; Maenhaut, W. Improved Method for Quantifying Levoglucosan and Related Monosaccharide Anhydrides in Atmospheric Aerosols and Application to Samples from Urban and Tropical Locations. Environ. Sci. Technol. 2002, 36, 747–753. [Google Scholar] [CrossRef]
  75. Otto, A.; Gondokusumo, R.; Simpson, M.J. Characterization and Quantification of Biomarkers from Biomass Burning at a Recent Wildfire Site in Northern Alberta, Canada. Appl. Geochem. 2006, 21, 166–183. [Google Scholar] [CrossRef]
  76. Šimić, I.; Godec, R.; Bešlić, I.; Davila, S. Carbon Mass Concentrations in the Air at the Plitvice Lakes National Park. Kem. u Ind. 2018, 67, P127–P133. [Google Scholar] [CrossRef]
  77. Yu, Q.; Chen, J.; Qin, W.; Cheng, S.; Zhang, Y.; Sun, Y.; Xin, K.; Ahmad, M. Characteristics, Primary Sources and Secondary Formation of Water-Soluble Organic Aerosols in Downtown Beijing. Atmos. Chem. Phys. 2021, 21, 1775–1796. [Google Scholar] [CrossRef]
  78. Pakbin, P.; Hudda, N.; Cheung, K.L.; Moore, K.F.; Sioutas, C. Spatial and Temporal Variability of Coarse (PM10-2.5) Particulate Matter Concentrations in the Los Angeles Area. Aerosol Sci. Technol. 2010, 44, 514–525. [Google Scholar] [CrossRef]
  79. Sigsgaard, T.; Forsberg, B.; Annesi-Maesano, I.; Blomberg, A.; Bølling, A.; Boman, C.; Bønløkke, J.; Brauer, M.; Bruce, N.; Héroux, M.E.; et al. Health Impacts of Anthropogenic Biomass Burning in the Developed World. Eur. Respir. J. 2015, 46, 1577–1588. [Google Scholar] [CrossRef]
  80. Van Den Heuvel, R.; Staelens, J.; Koppen, G.; Schoeters, G. Toxicity of Urban PM10 and Relation with Tracers of Biomass Burning. Int. J. Environ. Res. Public Health 2018, 15, 320. [Google Scholar] [CrossRef]
  81. Pardo, M.; Li, C.; Zimmermann, R.; Rudich, Y. Health Impacts of Biomass Burning Aerosols: Relation to Oxidative Stress and Inflammation. Aerosol Sci. Technol. 2024, 58, 1093–1113. [Google Scholar] [CrossRef]
  82. Schmidl, C.; Marr, I.L.; Caseiro, A.; Kotianová, P.; Berner, A.; Bauer, H.; Kasper-Giebl, A.; Puxbaum, H. Chemical Characterisation of Fine Particle Emissions from Wood Stove Combustion of Common Woods Growing in Mid-European Alpine Regions. Atmos. Environ. 2008, 42, 126–141. [Google Scholar] [CrossRef]
  83. Piazzalunga, A.; Belis, C.; Bernardoni, V.; Cazzuli, O.; Fermo, P.; Valli, G.; Vecchi, R. Estimates of Wood Burning Contribution to PM by the Macro-Tracer Method Using Tailored Emission Factors. Atmos. Environ. 2011, 45, 6642–6649. [Google Scholar] [CrossRef]
  84. Sandradewi, J.; Prévôt, A.S.H.; Szidat, S.; Perron, N.; Alfarra, M.R.; Lanz, V.A.; Weingartner, E.; Baltensperger, U.R.S. Using Aerosol Light Abosrption Measurements for the Quantitative Determination of Wood Burning and Traffic Emission Contribution to Particulate Matter. Environ. Sci. Technol. 2008, 42, 3316–3323. [Google Scholar] [CrossRef]
  85. Zotter, P.; Herich, H.; Gysel, M.; El-Haddad, I.; Zhang, Y.; Močnik, G.; Hüglin, C.; Baltensperger, U.; Szidat, S.; Prévôt, A.S.H. Evaluation of the Absorption Ångström Exponents for Traffic and Wood Burning in the Aethalometer Based Source Apportionment Using Radiocarbon Measurements of Ambient Aerosol. Atmos. Chem. Phys. Discuss. 2016, 17, 4229–4249. [Google Scholar] [CrossRef]
  86. Ram, K.; Sarin, M.M.; Tripathi, S.N. A 1 Year Record of Carbonaceous Aerosols from an Urban Site in the Indo-Gangetic Plain: Characterization, Sources, and Temporal Variability. J. Geophys. Res. Atmos. 2010, 115, D24313. [Google Scholar] [CrossRef]
  87. Singh, A.; Rajput, P.; Sharma, D.; Sarin, M.M.; Singh, D. Black Carbon and Elemental Carbon from Postharvest Agricultural-Waste Burning Emissions in the Indo-Gangetic Plain. Adv. Meteorol. 2014, 2014, 179301. [Google Scholar] [CrossRef]
  88. Hasegawa, S. Experimental Characterization of PM2.5 Organic Carbon by Using Carbon-Fraction Profiles of Organic Materials. Asian J. Atmos. Environ. 2022, 16, 2021128. [Google Scholar] [CrossRef]
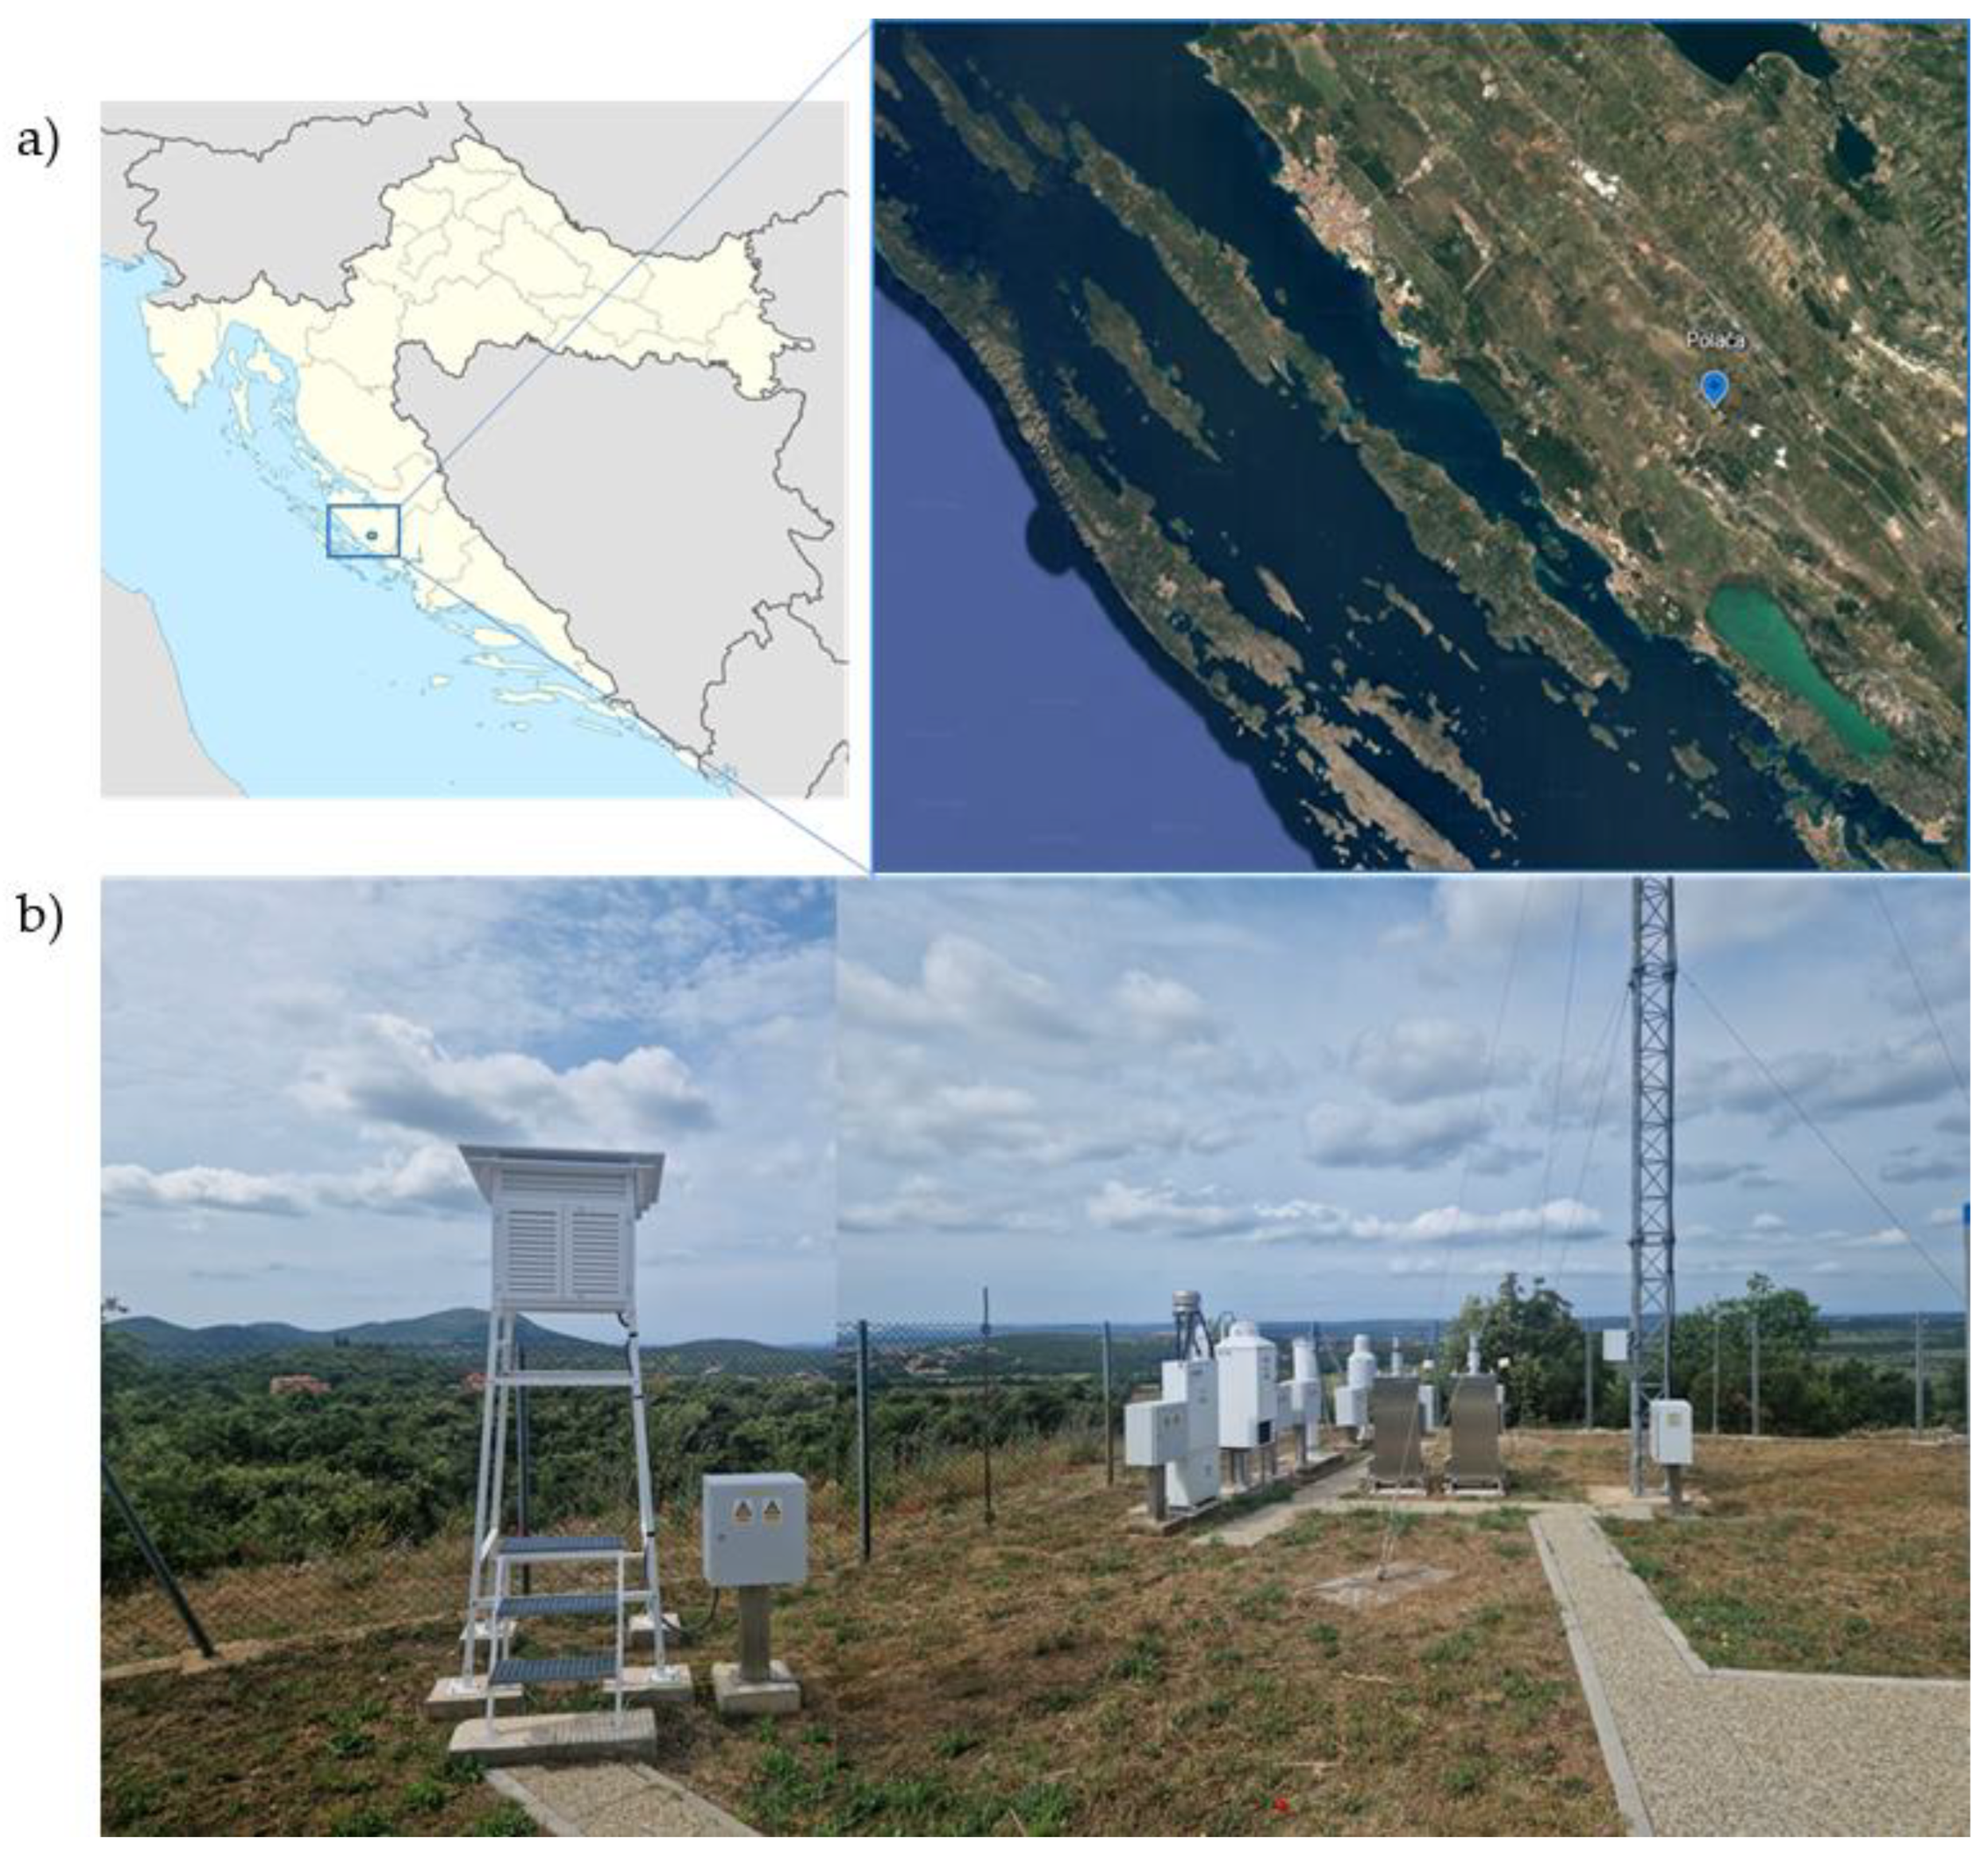
Figure 1. (a) Geographical location and (b) measuring site of Polača, Croatia.
Fire 08 00299 g001
Figure 2. Mass concentrations of PM10 and PM2.5 during 2024 at the measuring site. The periods marked specifically correspond to Sahara dust (SD) events, heat waves (HWs), and wildfire (WF) events.
Fire 08 00299 g002
Figure 3. Correlations between BC (determined with aethalometer) and OptC with EC (determined with thermo-optical method) during 2024.
Fire 08 00299 g003
Figure 4. Mass contribution of EC, OC, POC, and SOC to the total PM mass at a rural background monitoring site.
Fire 08 00299 g004
Figure 5. Average seasonal mass concentrations of (a) PM and (b) carbonaceous compounds in PM10 and PM2.5 at a rural background monitoring site during 2024.
Fire 08 00299 g005
Figure 6. Wind rose during 2024 at Polača, Croatia. Frequency of counts by wind direction (%).
Fire 08 00299 g006
Figure 7. MODIS Terra and Aqua satellite imagery during the wildfire period: (a) 30 July, (b) 31 July, (c) 1 August and (d) 2 August 2024. Orange spots indicate active fire locations, brown areas represent burned or fire-affected regions, and gray fog-like formations indicate smoke.
Fire 08 00299 g007
Figure 8. Pollution rose for PM10 (hourly PM data) during the wildfire period: (a) 30 July, (b) 31 July, (c) 1 August, and (d) 2 August 2024.
Fire 08 00299 g008
Figure 9. NOAA HYSPLIT 48 h back trajectories ending at 16:00 UTC 1 August 2024.
Fire 08 00299 g009
Figure 10. Mass concentration of OC, SOC, WSOC, PyrC, EC, POC, and LG during the period from 30 July to 2 August 2024 determined in (a) PM10 and (b) PM2.5. * Data of BC were available only for PM2.5 fraction.
Fire 08 00299 g010
Figure 11. Ratios of (a) organic carbon fractions within total OC and (b) LG within organic carbon fractions on 31 July 2024, the day the wildfire was detected. OC1 fraction desorbed at <200 °C, OC2 at 200–300 °C, OC3 at 300–450 °C, and OC4 at 450–650 °C.
Fire 08 00299 g011
Table 1. Ratios of wildfire-related compounds measured in PM10 and PM2.5 during the four days surrounding the wildfire event, along with annual average values and corresponding standard deviations.
PM10PM2.5
30 July 202431 July 20241 August 20242 August 2024Annual Value (Average ± SD)30 July 202431 July 20241 August 20242 August 2024Annual Value (Average ± SD)
OC/EC17.510.212.012.98.1 ± 4.317.810.213.312.29.4 ± 4.6
POC/OC0.0890.1540.1300.1220.245 ± 0.1310.1860.3260.2490.2710.428 ± 0.174
OC1/OC0.1430.0860.1030.1040.121 ± 0.0680.0990.0750.1070.1030.103 ± 0.042
OC2/OC0.3250.3490.2770.3170.176 ± 0.0930.3310.3550.2850.3220.246 ± 0.091
OC3/OC0.1910.1900.1830.1880.164 ± 0.0650.2140.2240.2020.2180.184 ± 0.058
OC4/OC0.1240.1200.1710.1630.275 ± 0.1650.1190.0780.0960.1000.185 ± 0.134
PyrC/OC0.2160.2560.2650.2280.268 ± 0.0790.2370.2670.3090.2560.281 ± 0.103
LG/MNS1.15.31.75.4/2.17.02.82.1/
LG/WSOC0.0030.1470.0010.0040.032 ± 0.0390.0040.1290.0080.0030.052 ± 0.082
LG/OC10.0180.8060.0080.0290.211 ± 0.2740.0220.7670.0470.0150.264 ± 0.300
LG/OC20.0080.1980.0030.0100.157 ± 0.2810.0060.1610.0180.0050.118 ± 0.155
LG/OC30.0140.3650.0050.0160.151 ± 0.2100.0100.2550.0250.0070.129 ± 0.137
LG/OC40.0210.5760.0050.0190.126 ± 0.2200.0180.7320.0530.0160.167 ± 0.203
LG/PyrC0.0120.2700.0030.0130.072 ± 0.0820.0090.2140.0160.0060.099 ± 0.270
BC/EC/////0.8860.7781.8301.0441.079 ± 0.394
LG/BC_bb/////0.1841.4570.1040.0790.527 ± 0.671
Disclaimer/Publisher’s Note: The statements, opinions and data contained in all publications are solely those of the individual author(s) and contributor(s) and not of MDPI and/or the editor(s). MDPI and/or the editor(s) disclaim responsibility for any injury to people or property resulting from any ideas, methods, instructions or products referred to in the content.