
Characterization of Acoustic Source Signal Response in Oxidized Autocombusted Coal Temperature Inversion Experiments


Abstract
1. Introduction
2. Basic Theory of Experiments
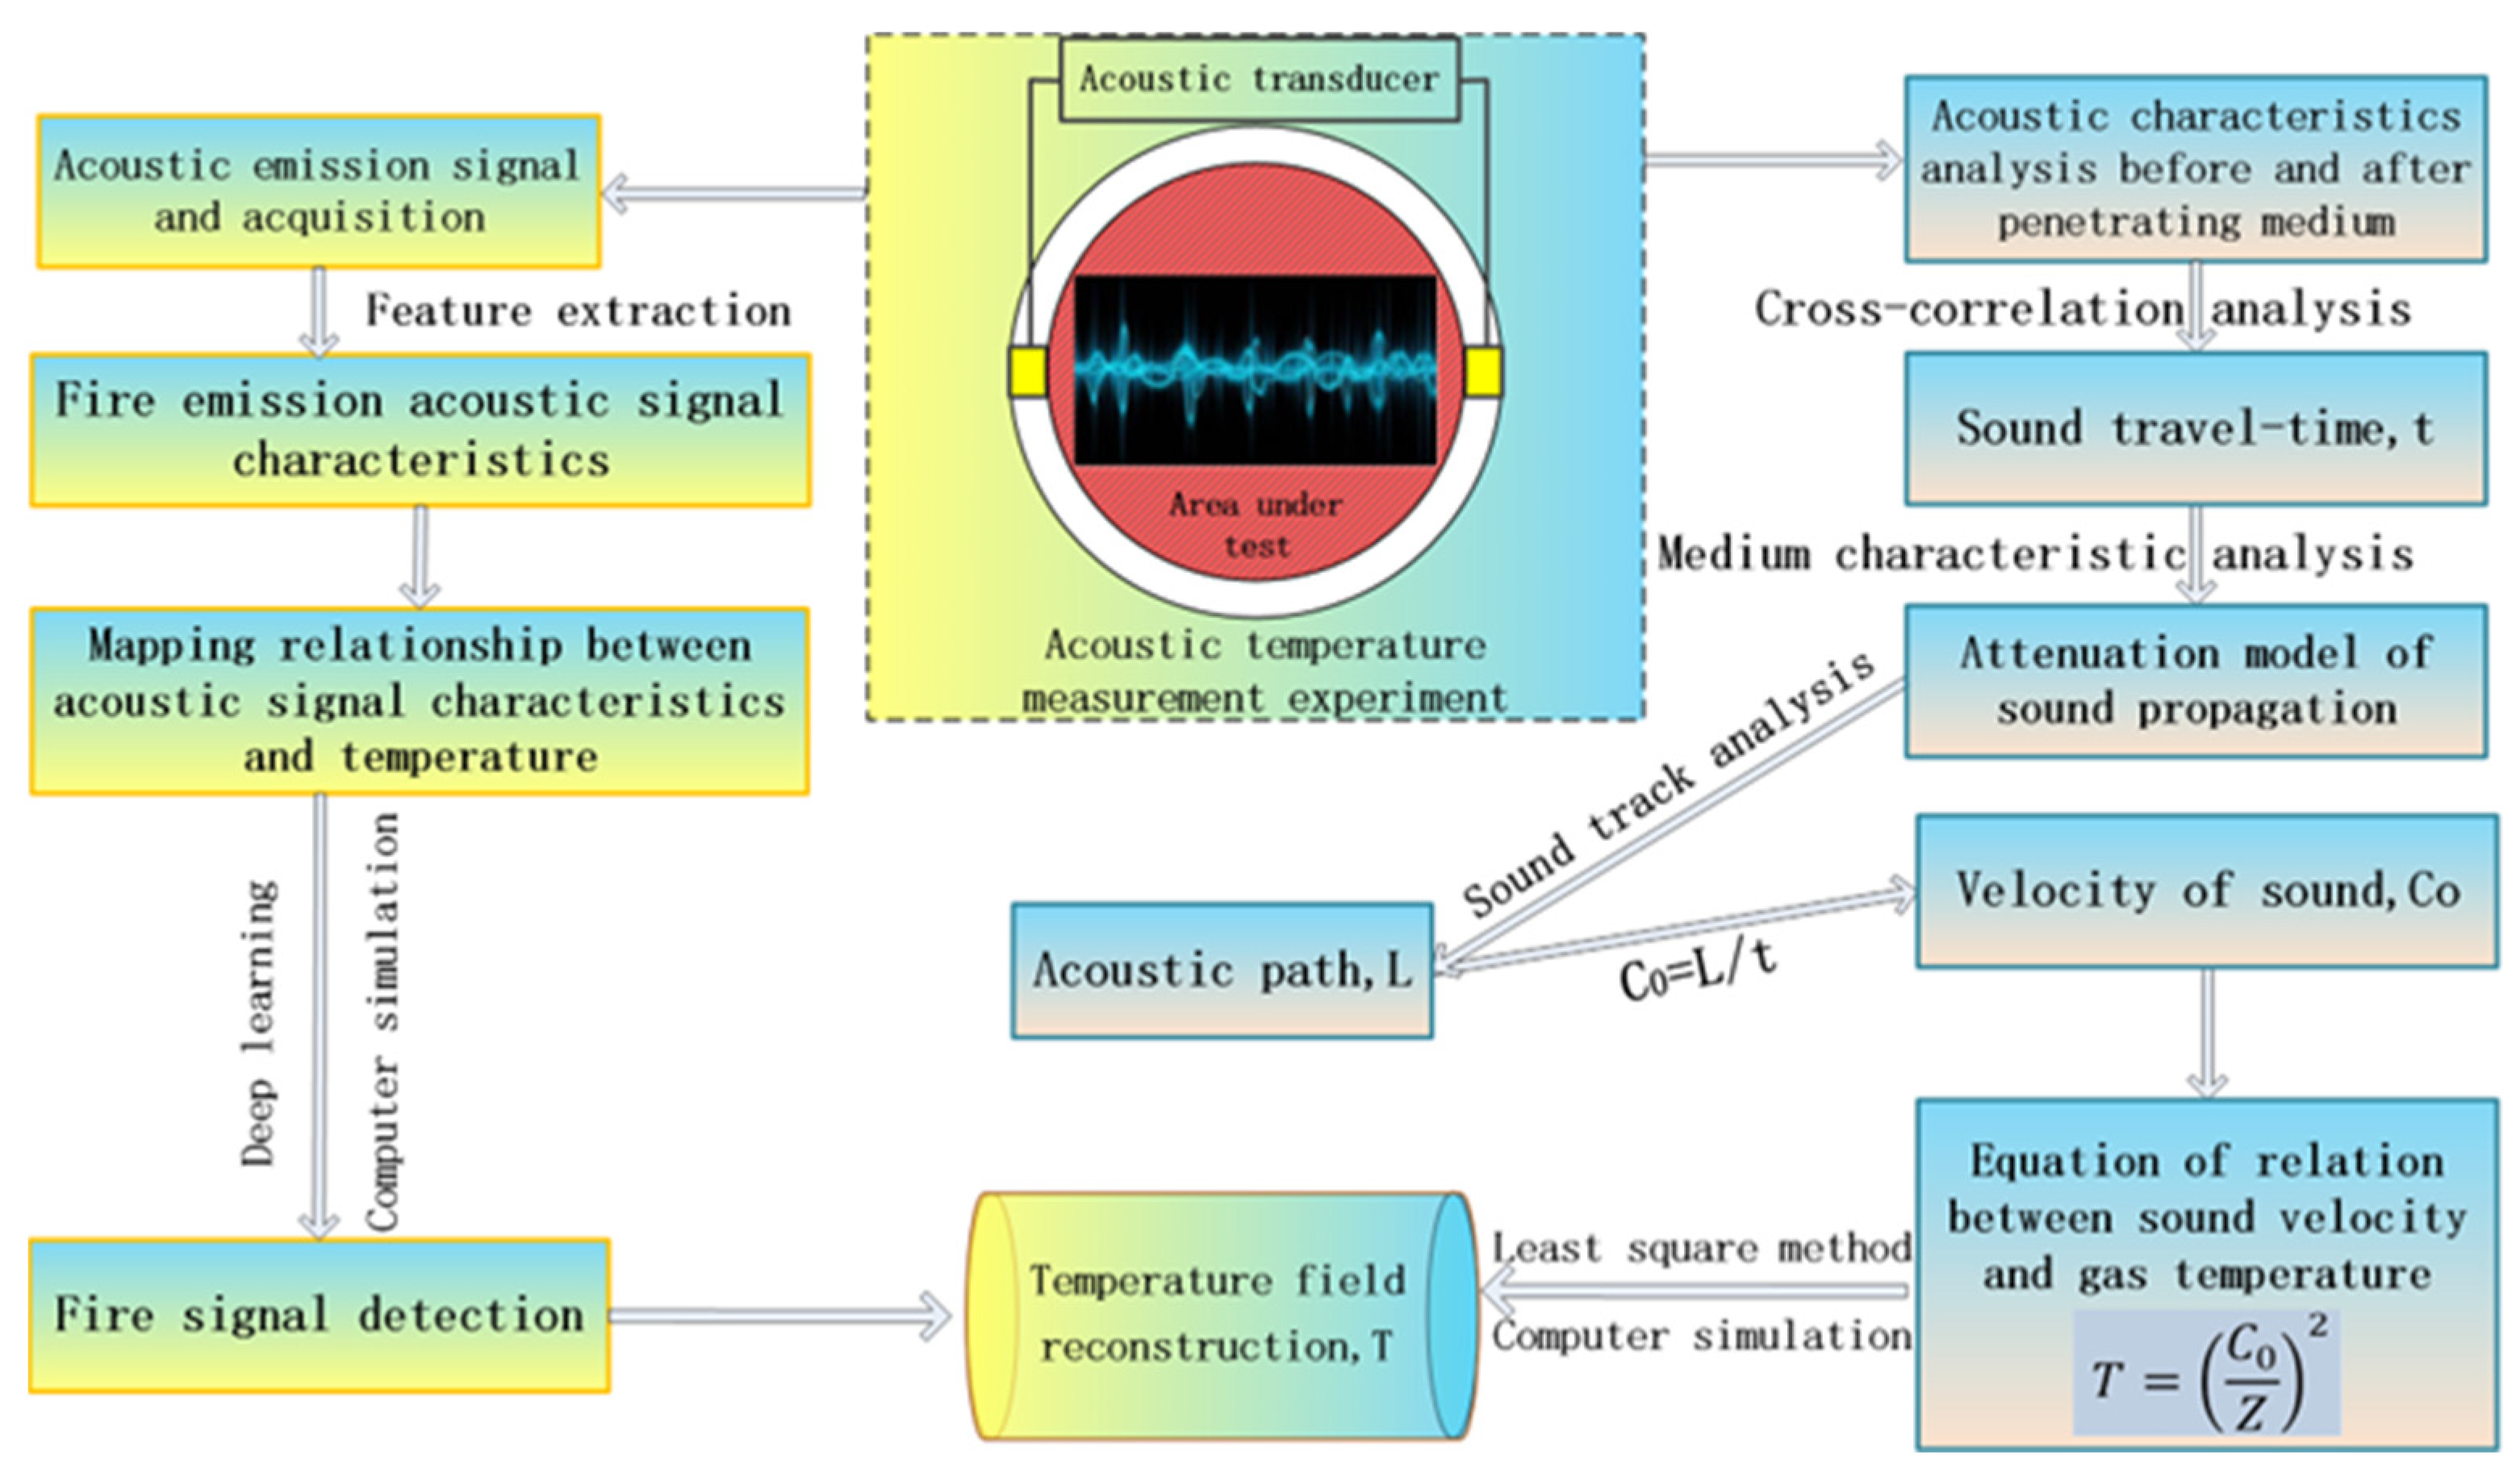
2.1. Basic Principles
2.2. Acoustic Source Signal Type
2.2.1. Pseudo-Random Sequence Signal
2.2.2. Sweep Signal
3. Experimental Systems and Methods
3.1. Design Ideas
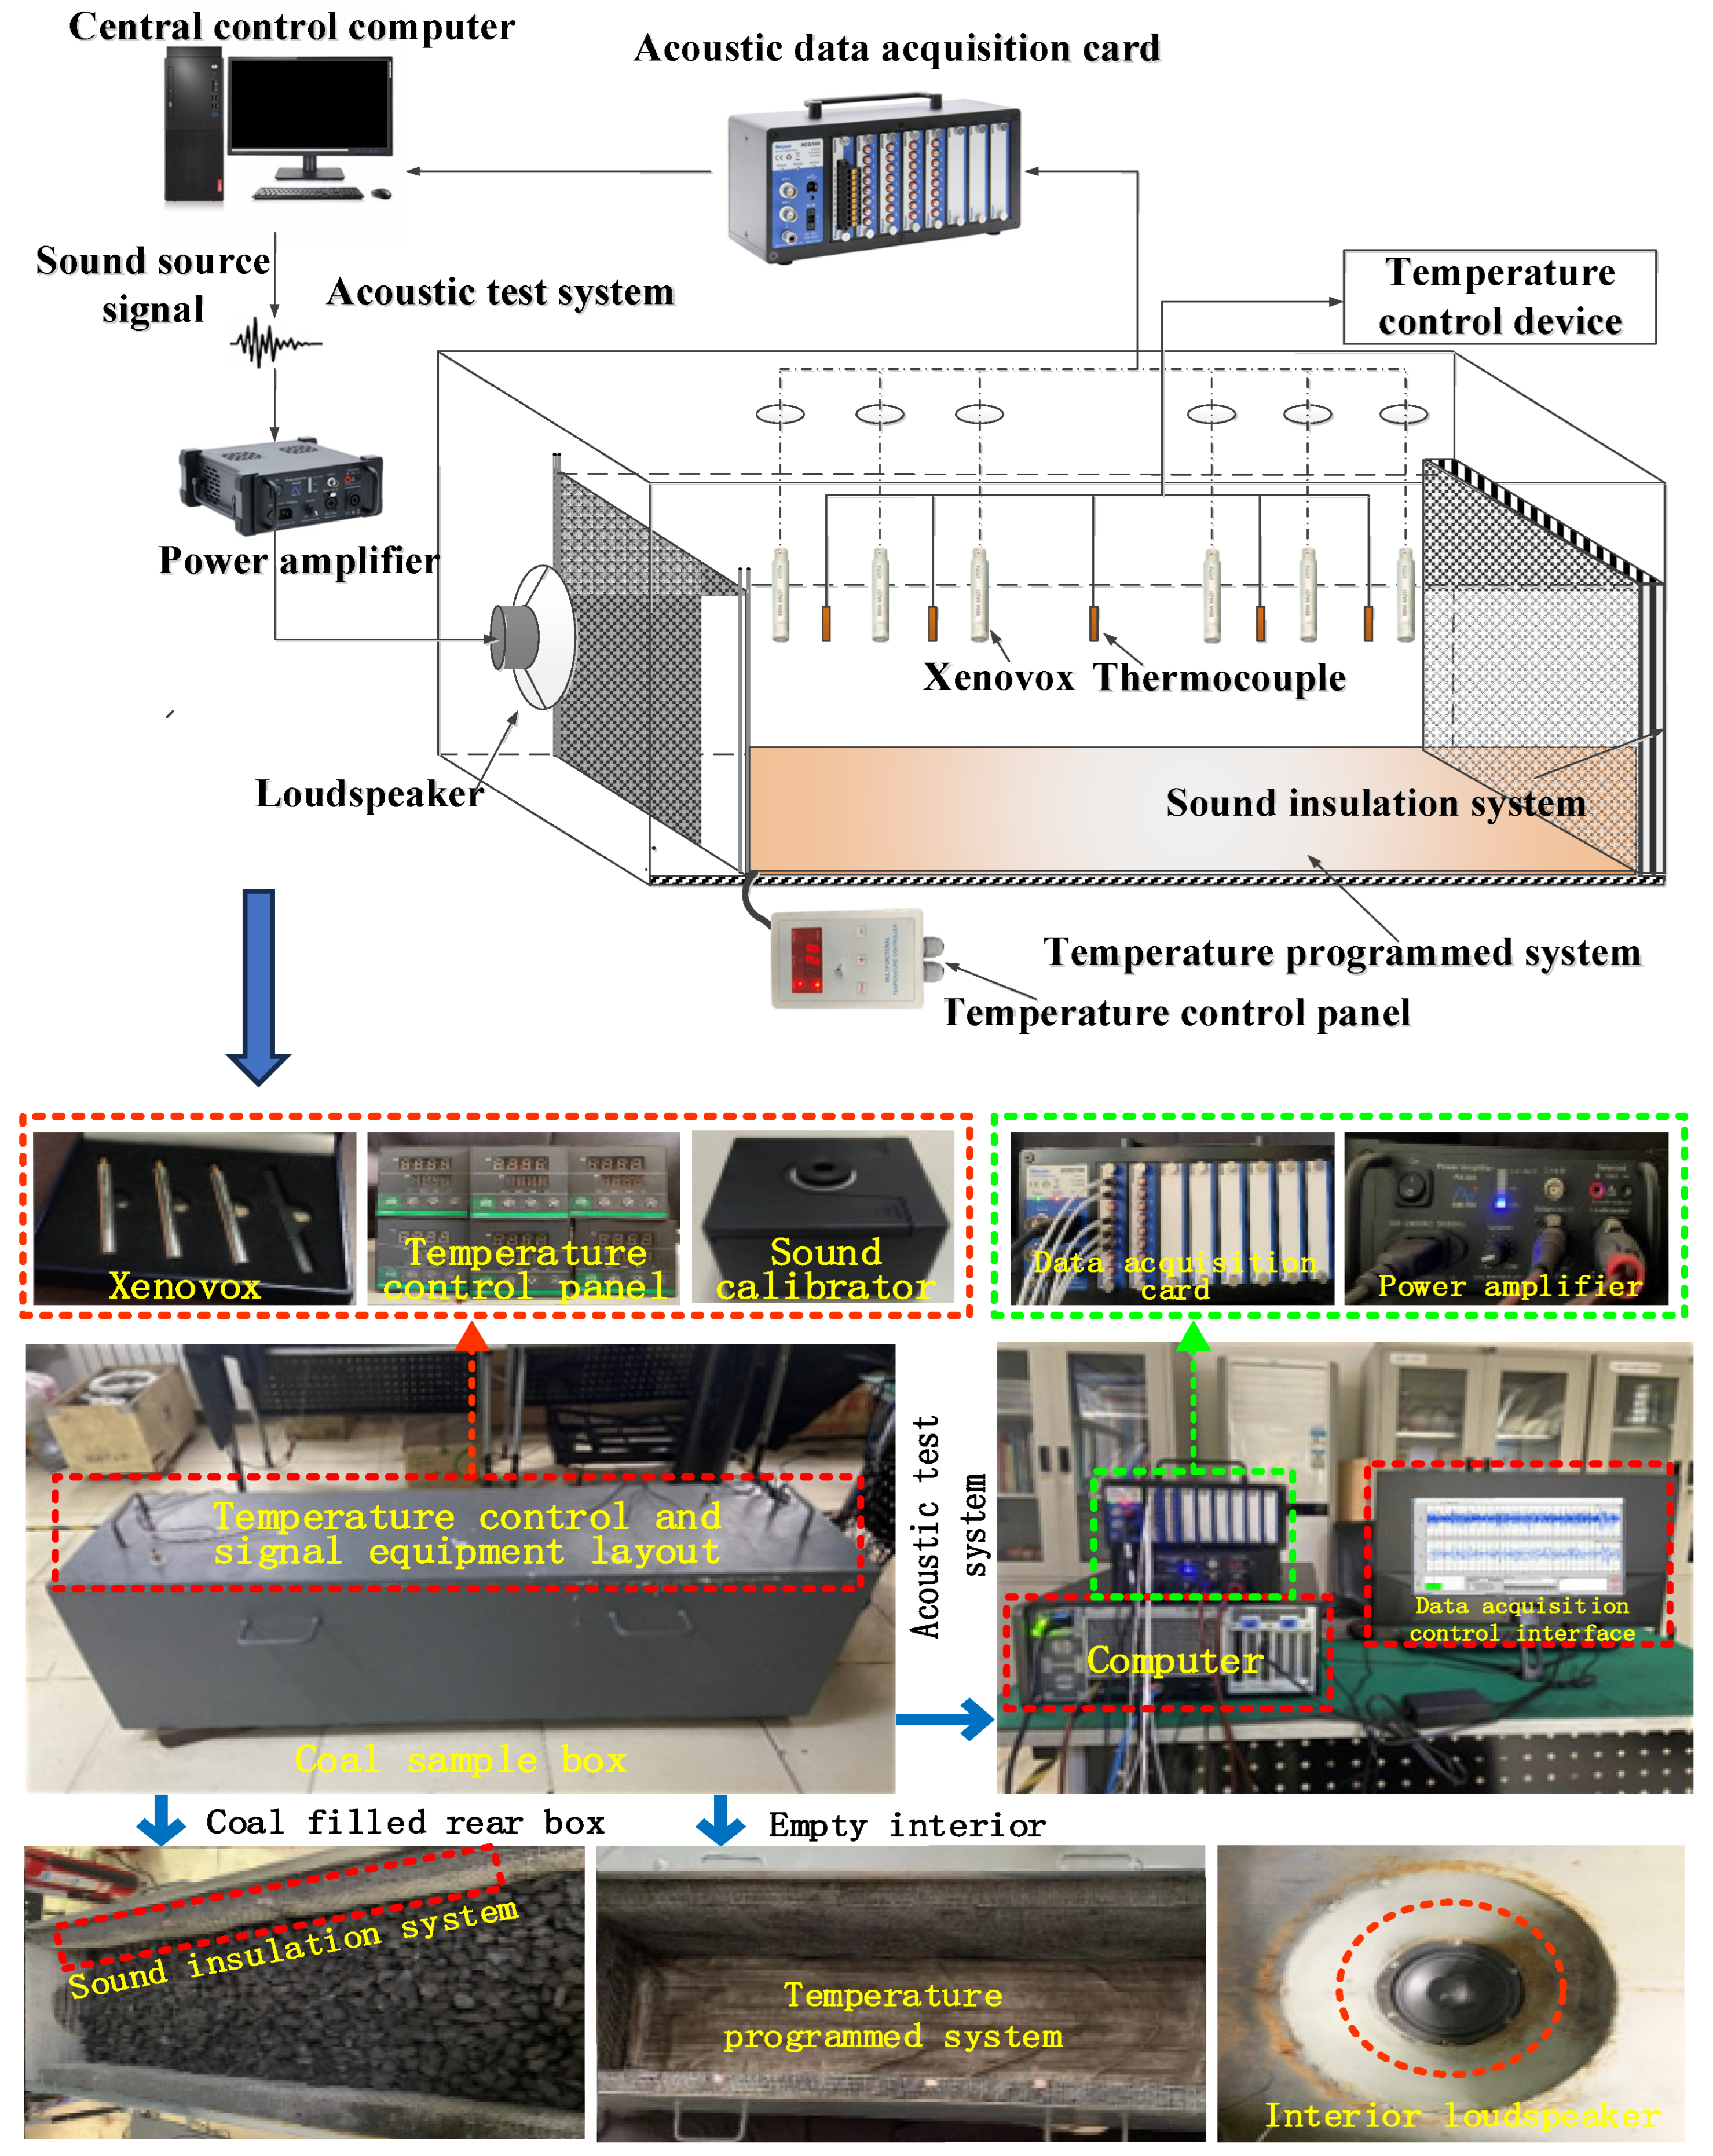
3.2. System Components and Parameter Settings
3.3. Experimental Conditions and Methods
4. Experimental Results and Analysis
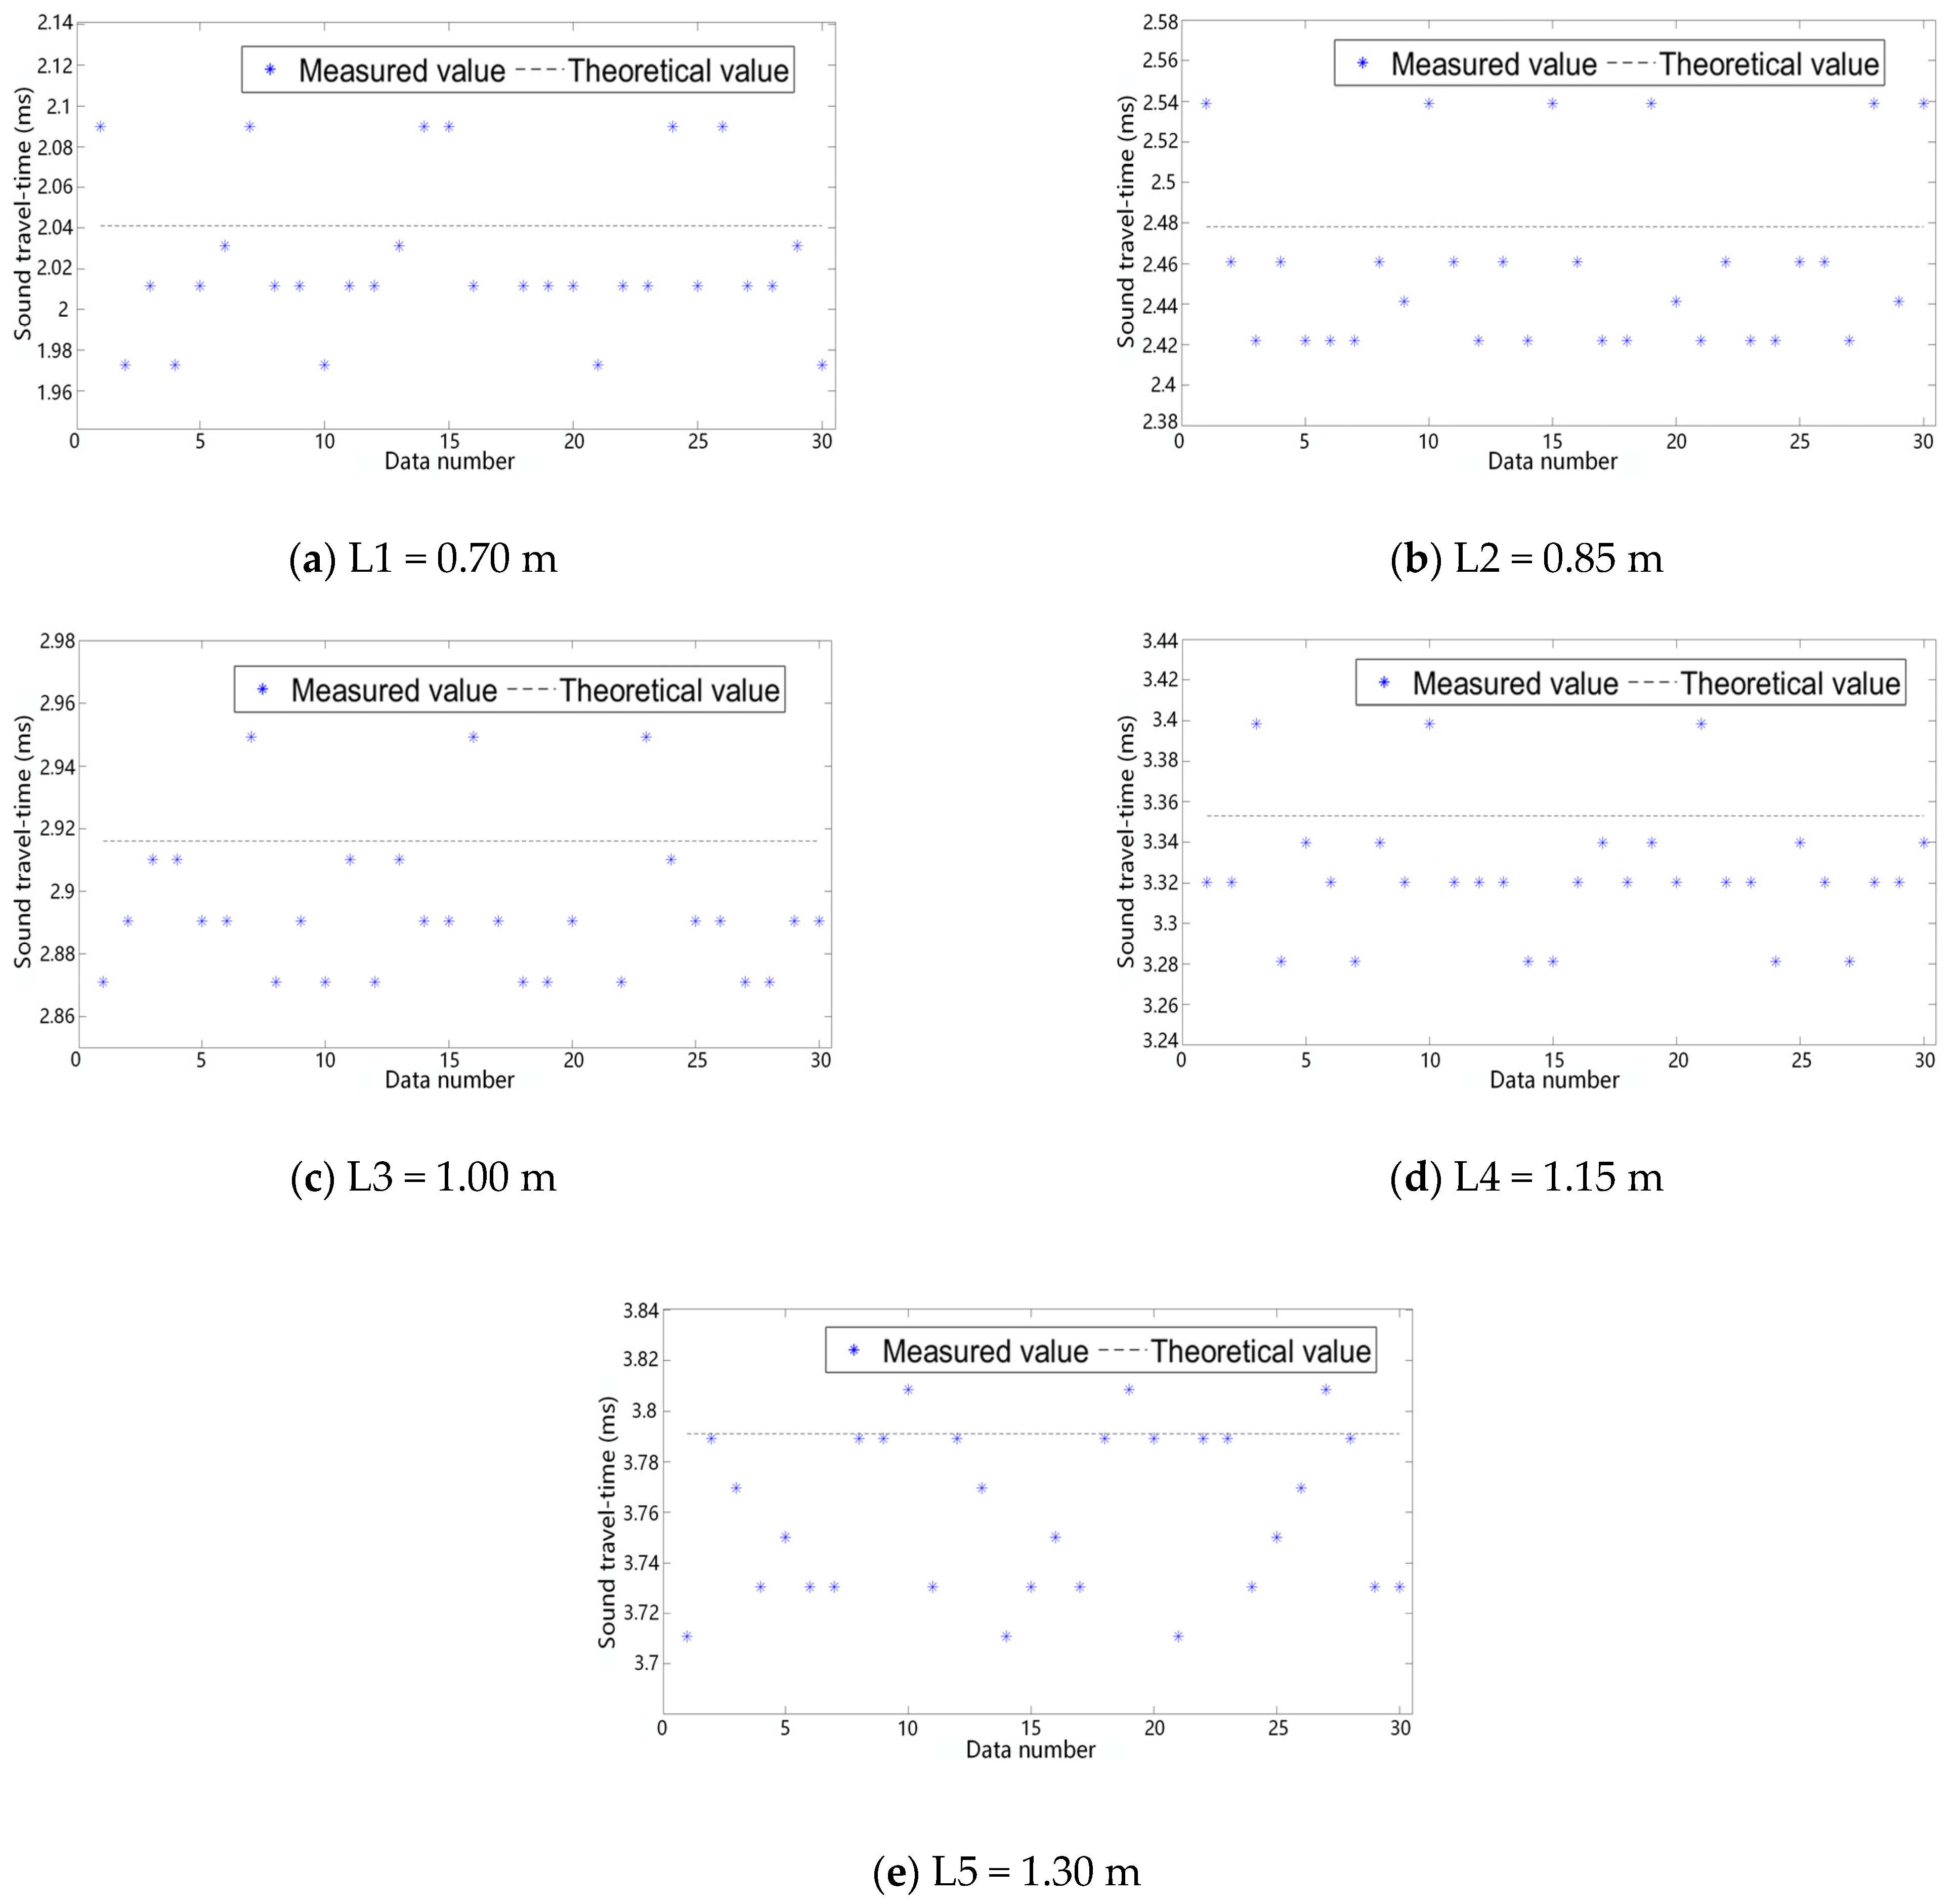
4.1. Pseudo-Random Sequence Signal Accuracy Analysis in Loose Coals
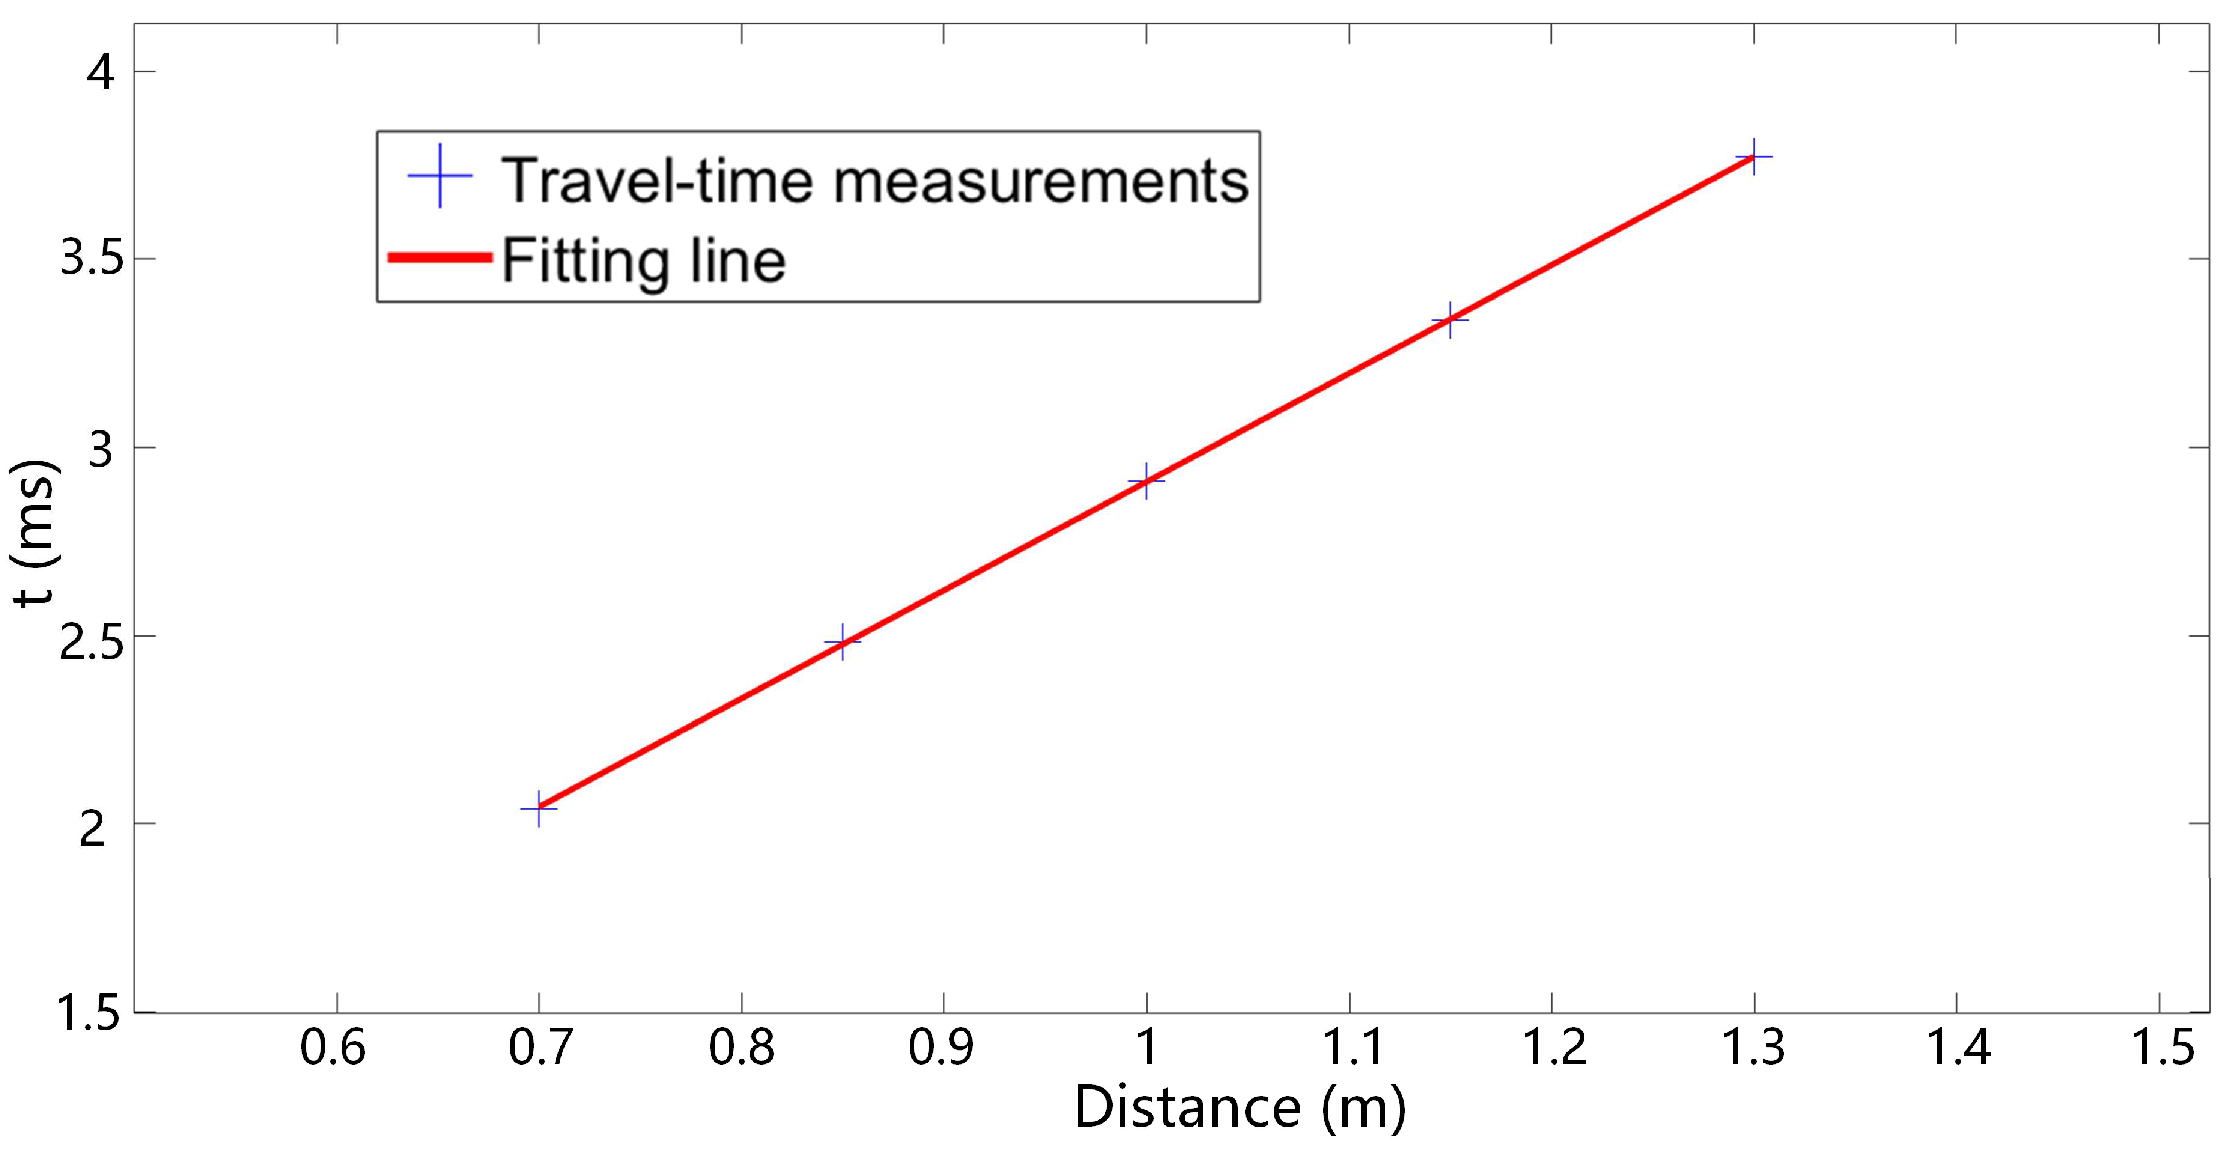
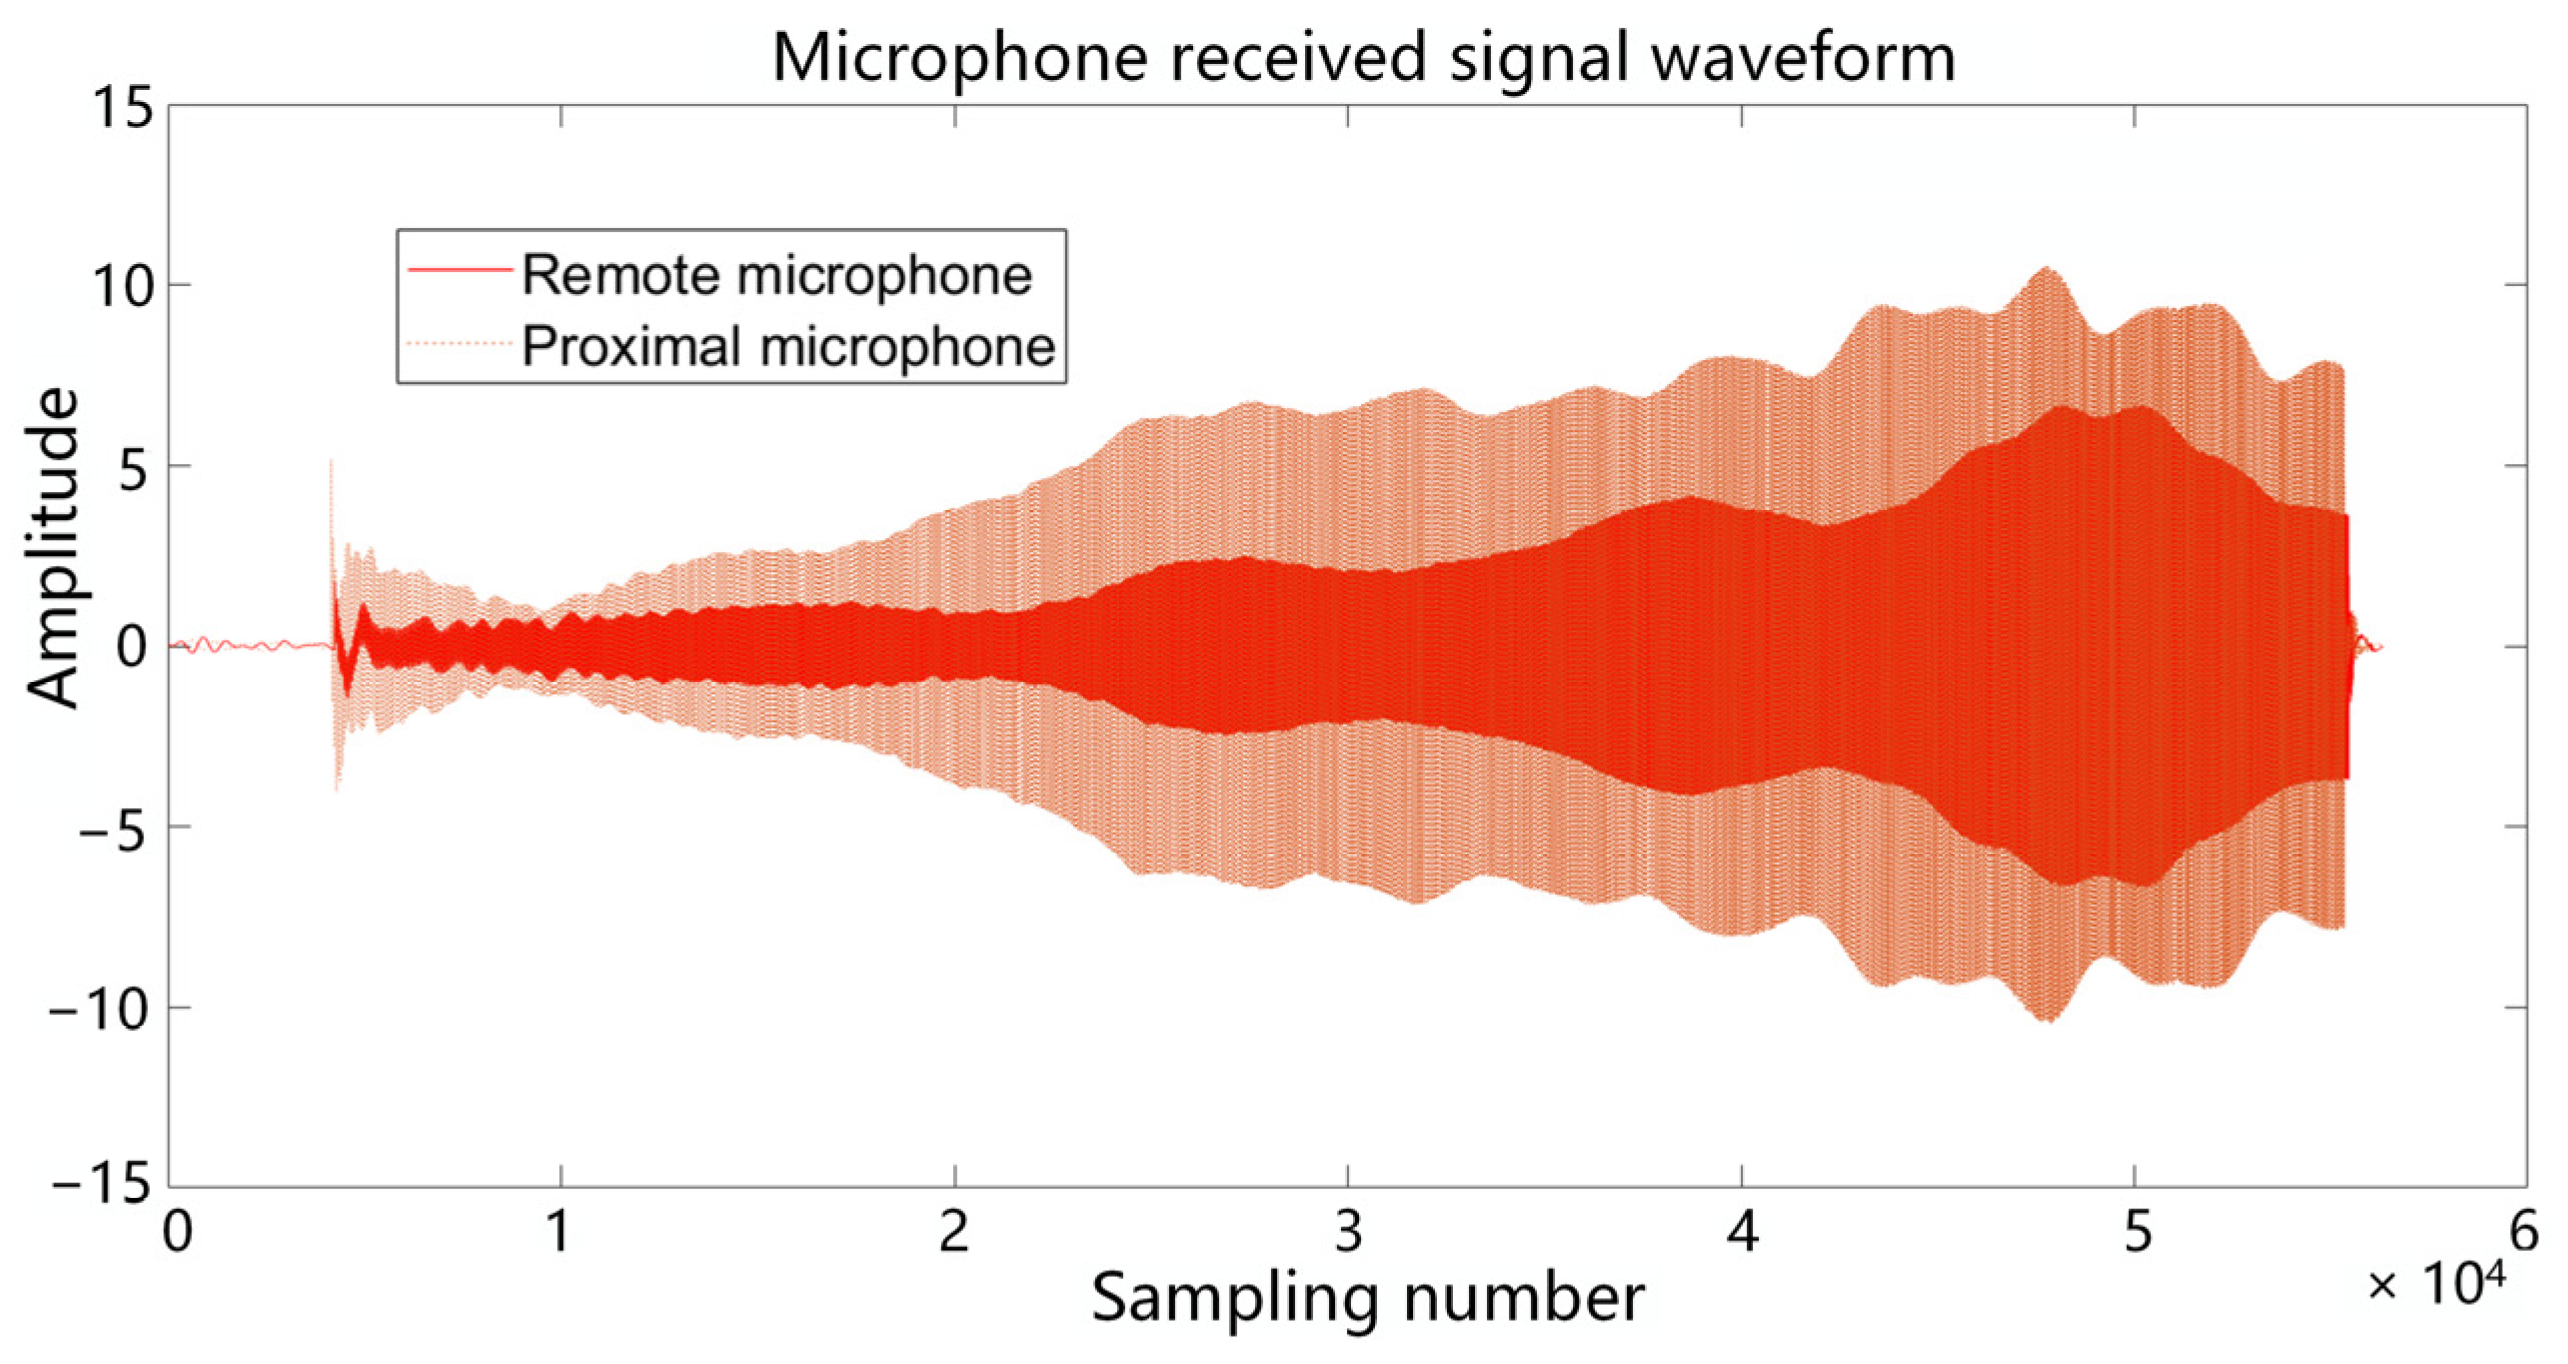
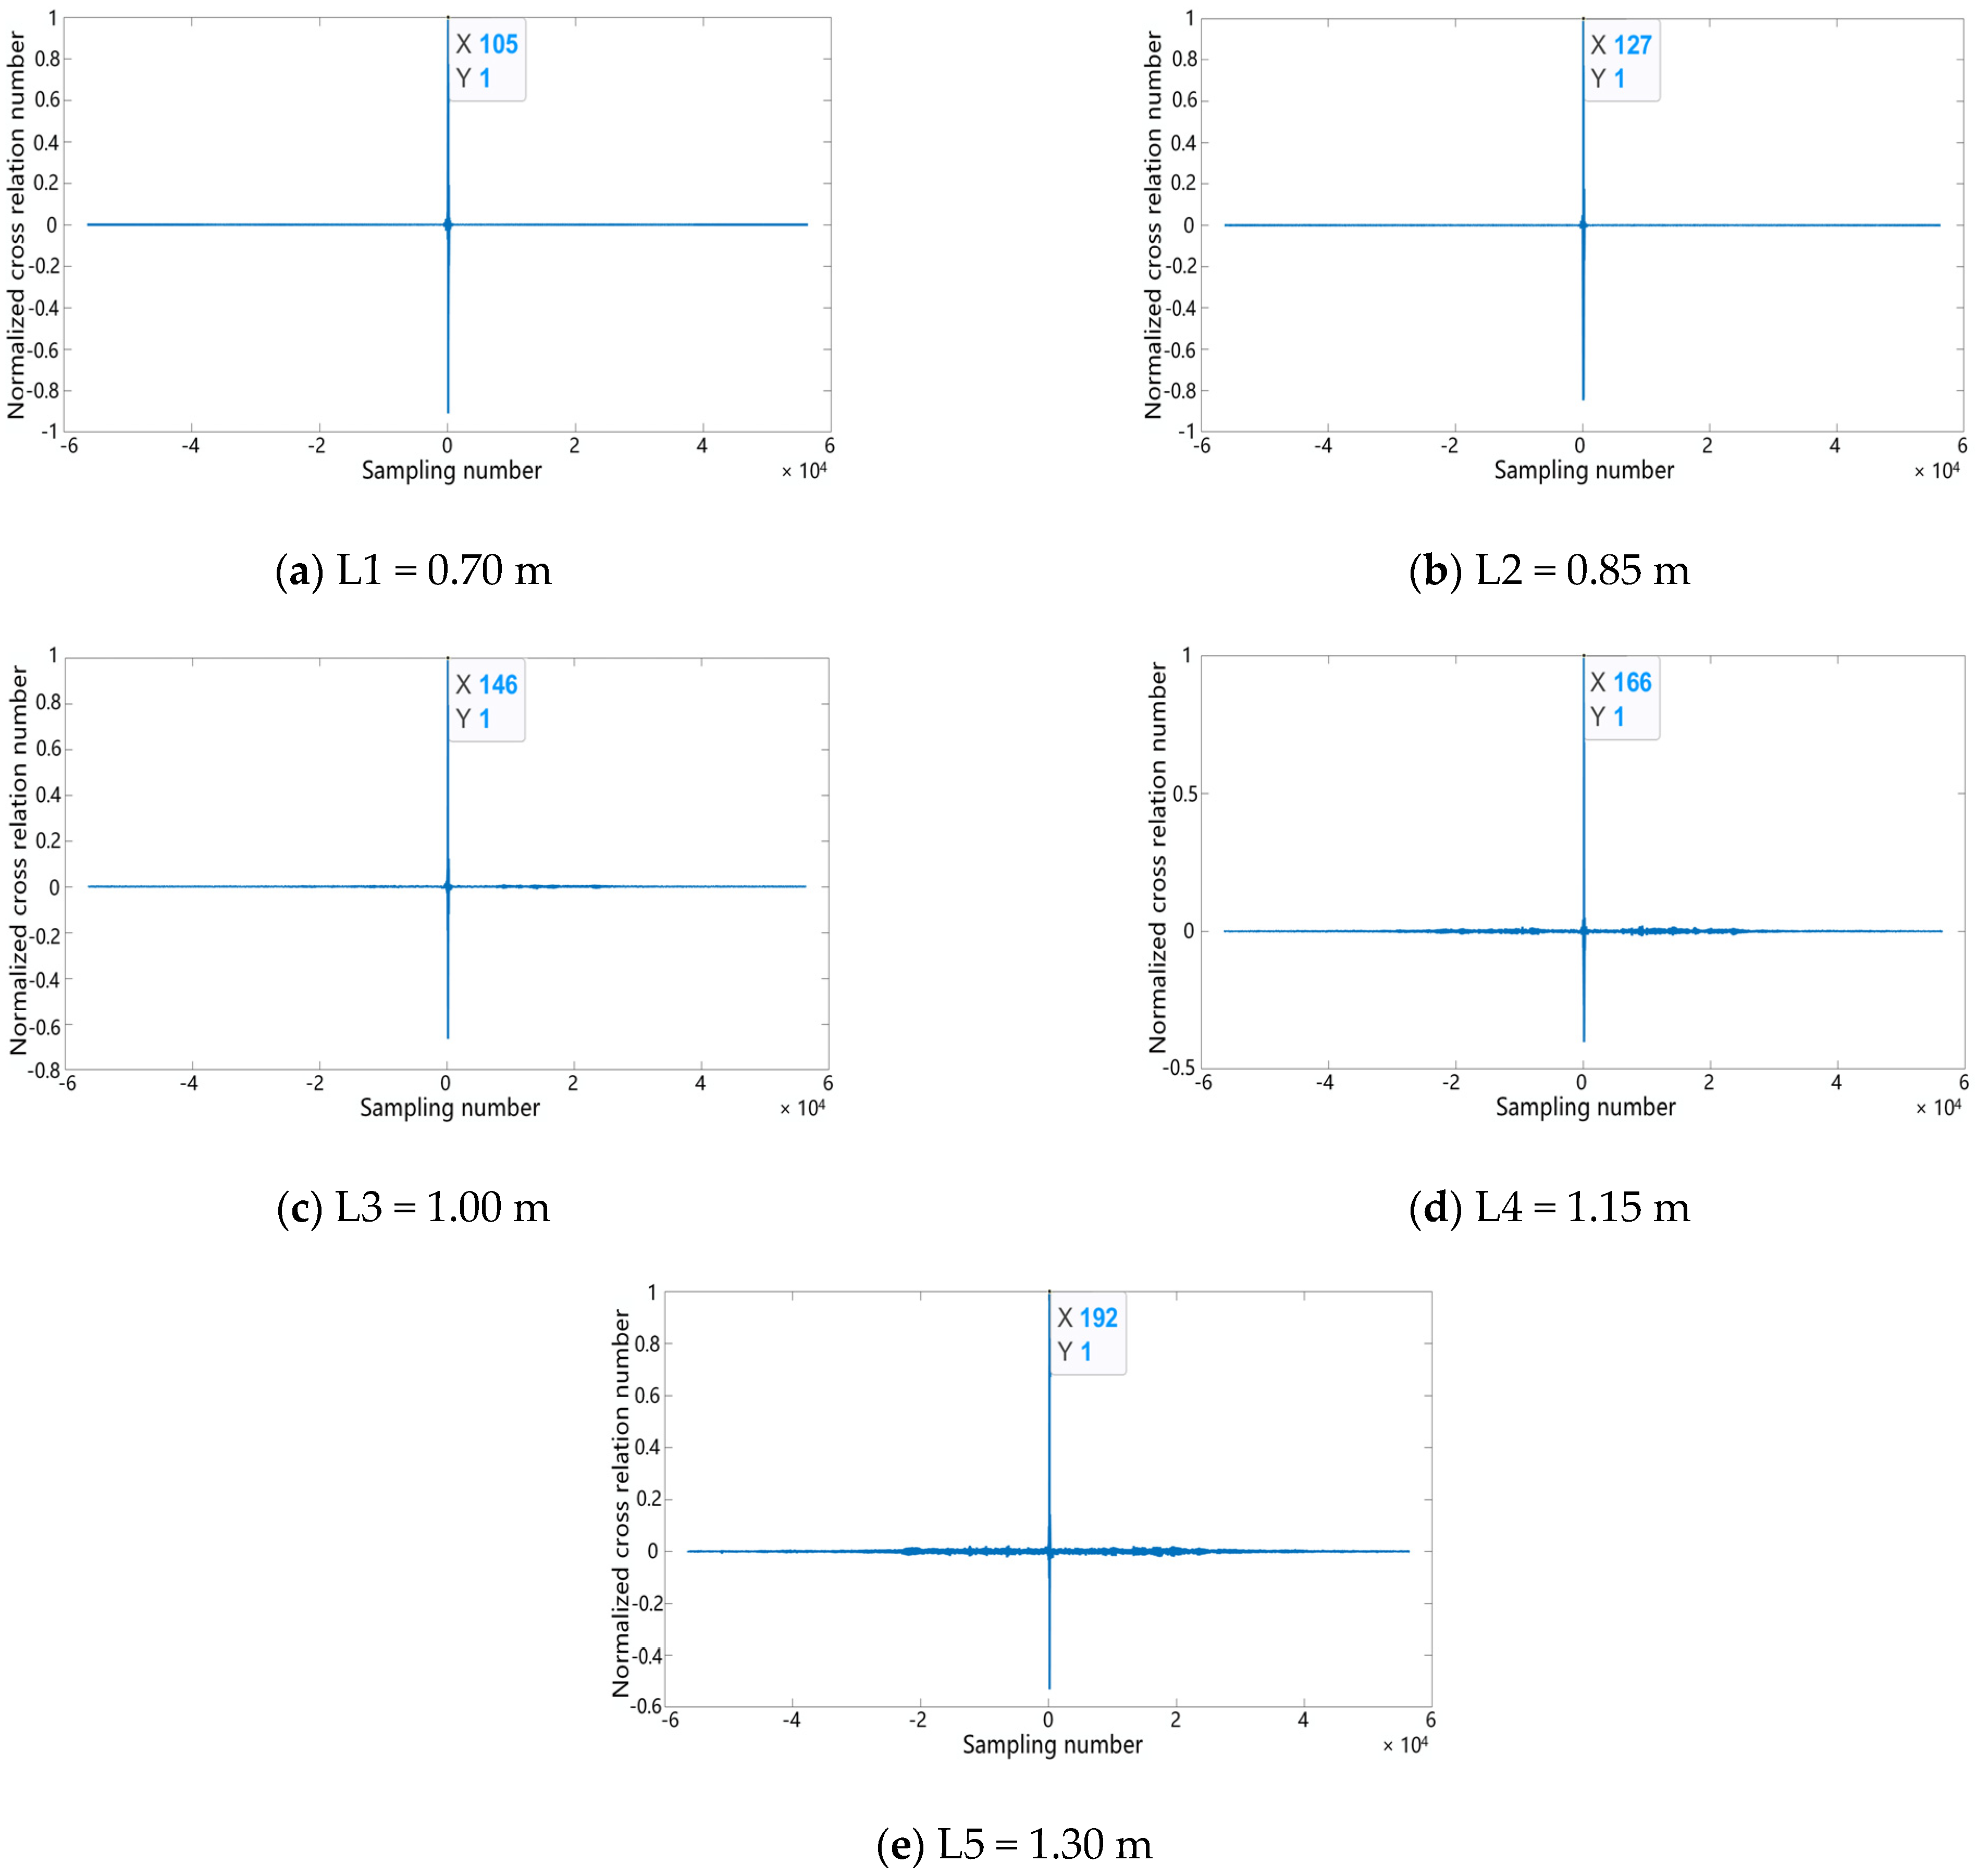
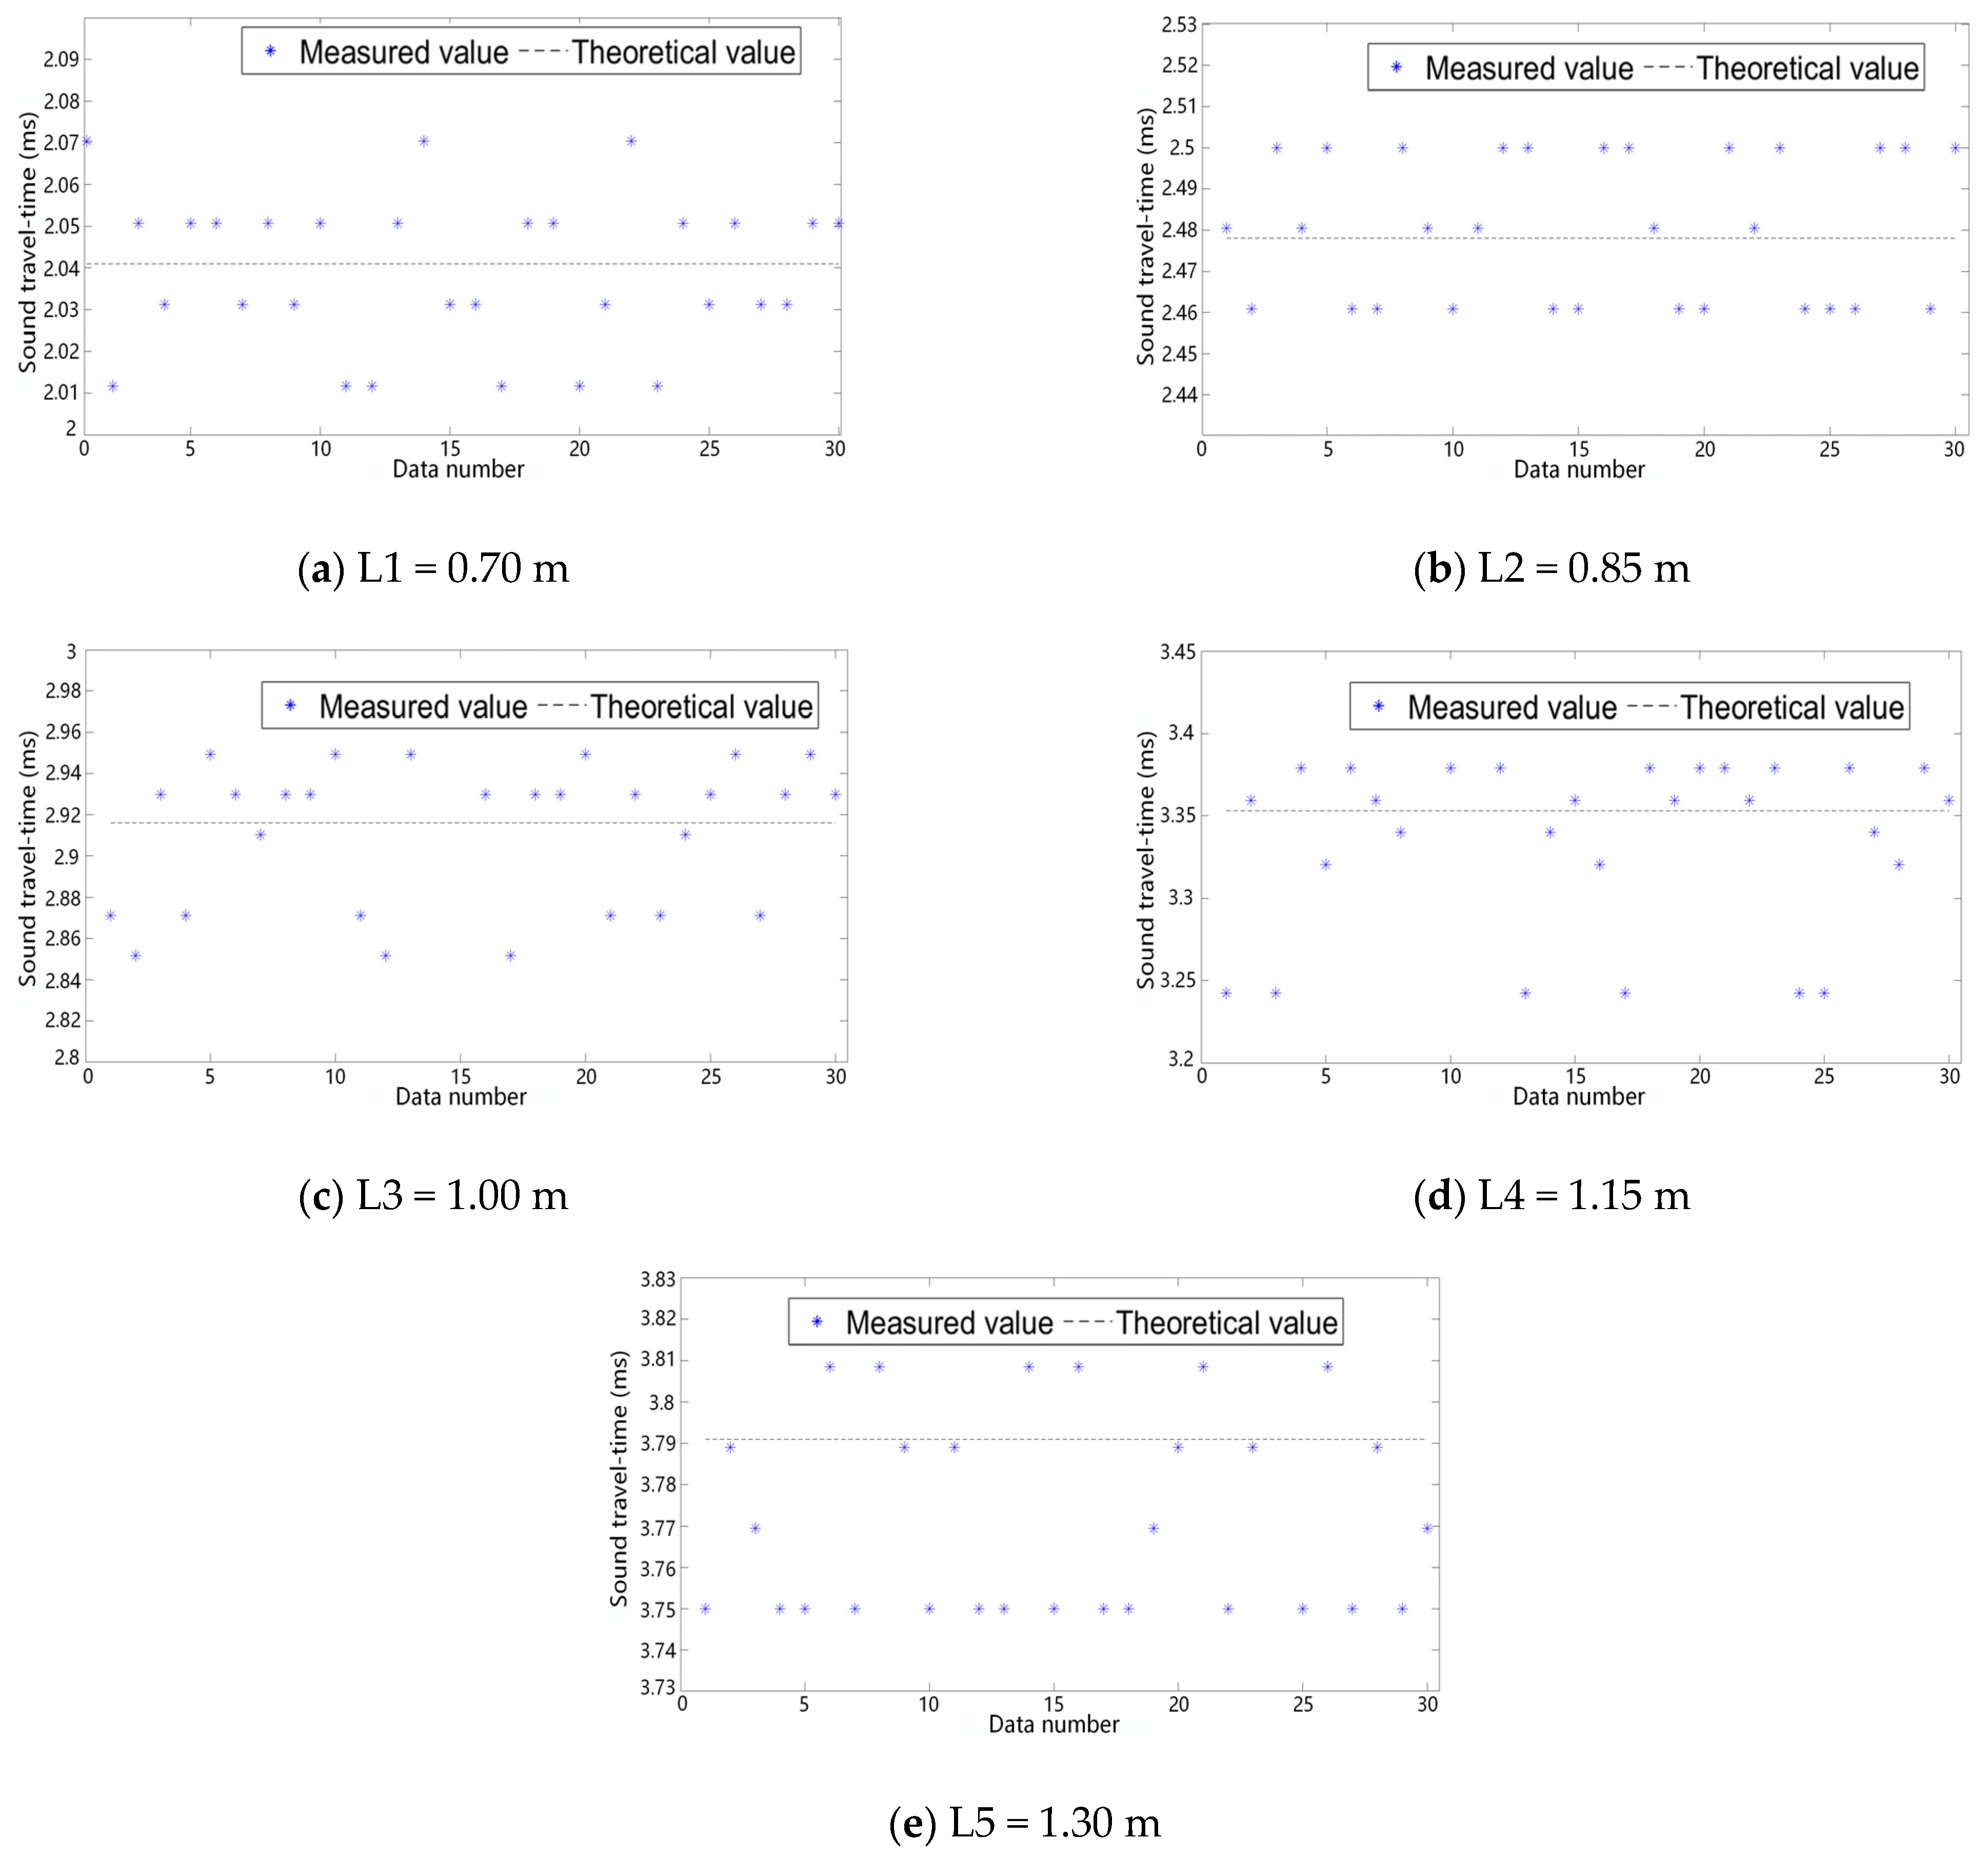
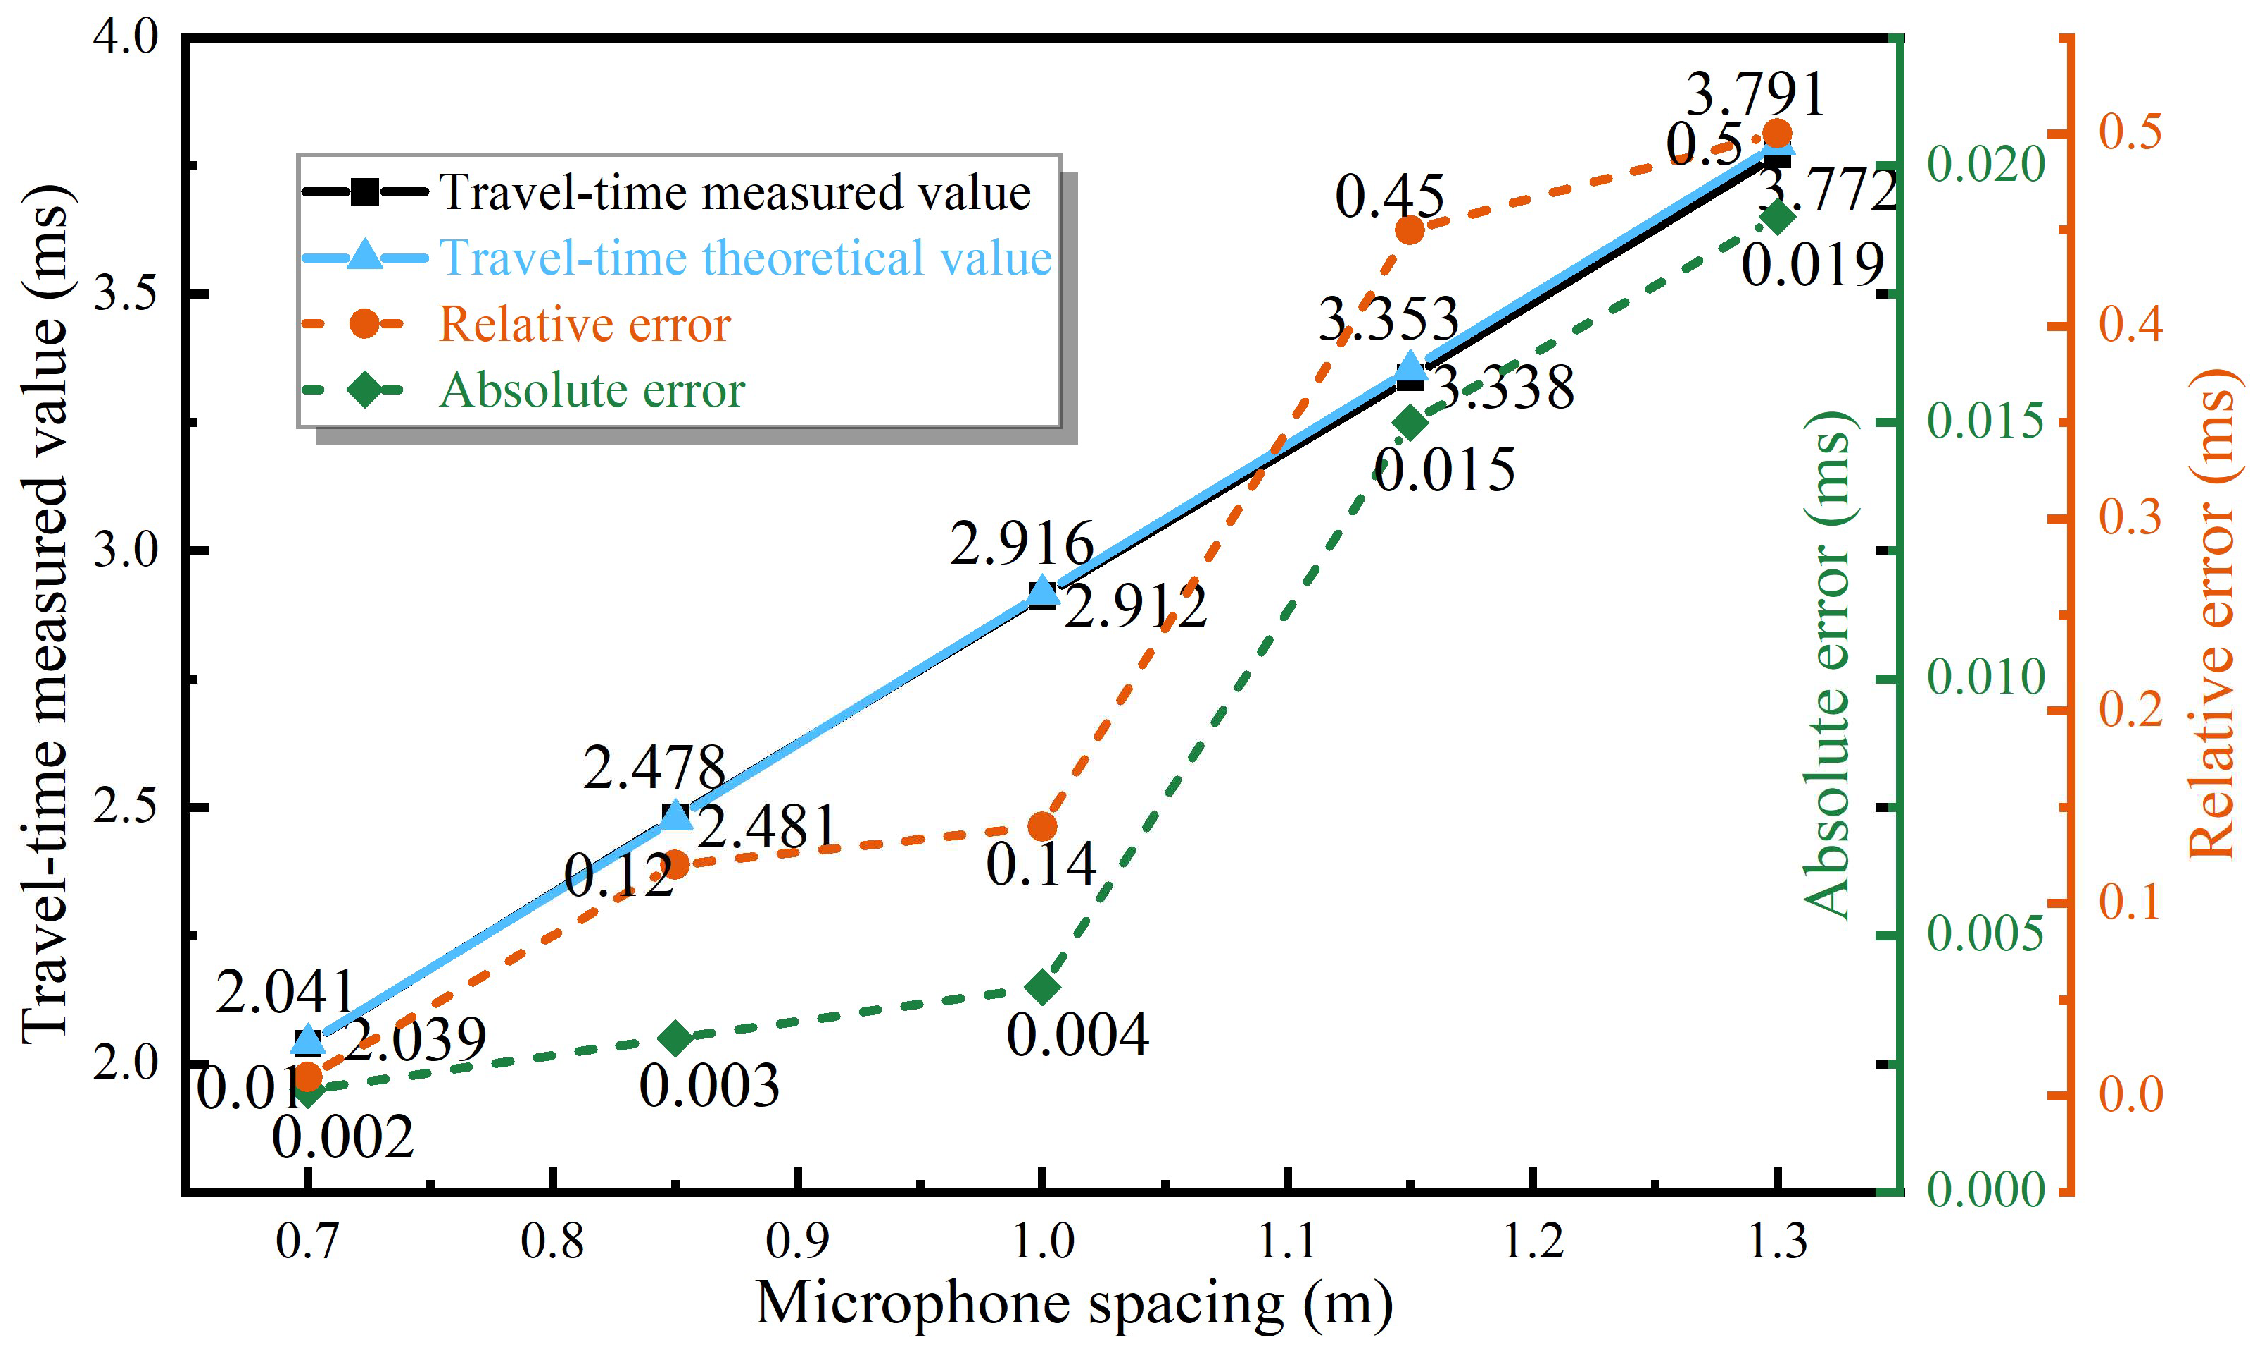
4.2. Accuracy Analysis of Frequency Sweep Signals in Loose Coals
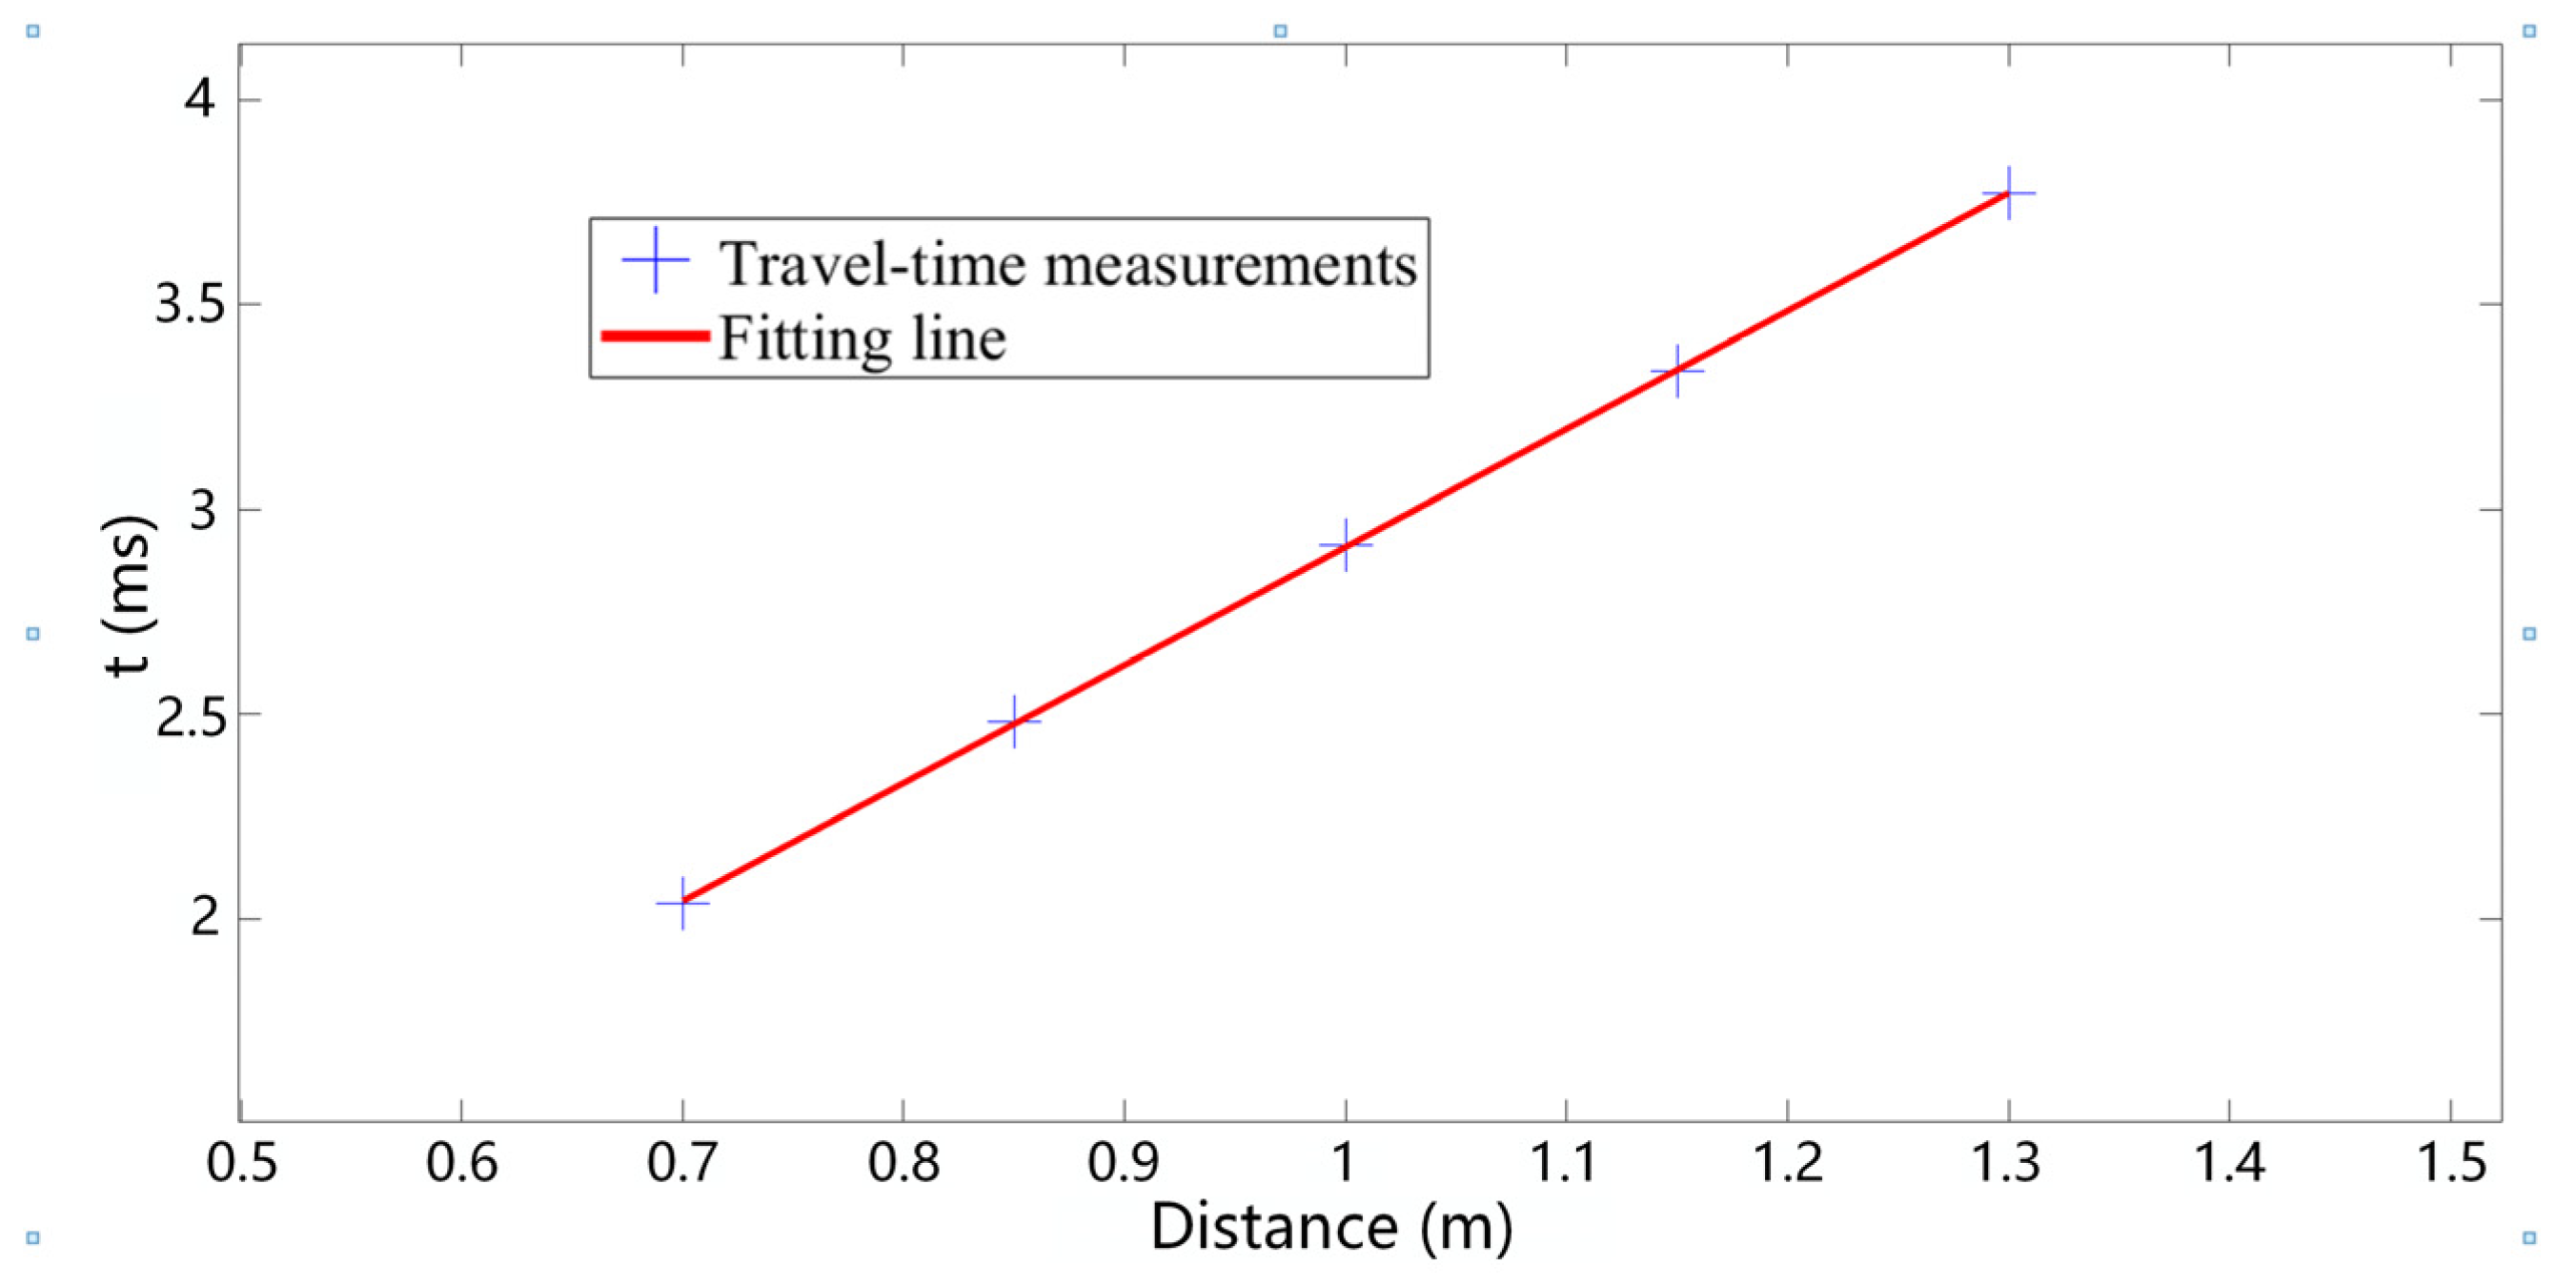
4.3. Verification of the Inversion of Coal Temperature by Swept Frequency Acoustic Source Signals
5. Conclusions
Author Contributions
Funding
Institutional Review Board Statement
Informed Consent Statement
Data Availability Statement
Conflicts of Interest
References
- Wang, Y.; Sun, Q.; Wu, J.; Han, S.; Zhang, R.; Jiang, S.; Gu, X. Research on the low carbon development path of China’s coal industry under carbon peaking & carbon neutral target: Based on the RCPs-SSPs framework. Resour. Policy 2023, 86, 104091. [Google Scholar] [CrossRef]
- Bui, T.; Tseng, J.; Tsai, F.M.; Ali, M.H.; Lim, M.K.; Tseng, M.L. Energy security challenges and opportunities in the carbon neutrality context: A hierarchical model through systematic data-driven analysis. Renew. Sustain. Energy Rev. 2023, 187, 113710. [Google Scholar] [CrossRef]
- National Bureau of Statistics of China. Statistical Communique of the People’s Republic of China on the 2022 National Economic and Social Development. People’s Daily, 2023; Volume 3, 12–29. [CrossRef]
- Guo, J.; Wen, H.; Zheng, X.; Liu, Y.; Cheng, X. A method for evaluating the spontaneous combustion of coal by monitoring various gases. Process Saf. Environ. Prot. 2019, 126, 223–231. [Google Scholar] [CrossRef]
- Musa, S.D.; Tang, Z.H.; Abdullateef, O.I.; Habib, M. China’s energy status: A critical look at fossils and renewable options. Renew. Sust. Energ. Rev. 2018, 81, 2281–2290. [Google Scholar] [CrossRef]
- Gun, J.; Liu, Y.; Cheng, X.; Yan, H.; Xu, Y. A novel prediction model for the degree of rescue safety in mine thermal dynamic disasters based on fuzzy analytical hierarchy process and extreme learning machine. Int. J. Heat Technol. 2018, 36, 1336–1342. [Google Scholar] [CrossRef]
- Boleslav, T.; Zdenek, P. Investigation of the spontaneous combustion susceptibility of coal using the pulse flow calorimetric method: 25 years of experience. Fuel 2014, 125, 101–105. [Google Scholar] [CrossRef]
- Mishra, R.K.; Roy, P.N.S.; Singh, V.K.; Pandey, J.K. Detection and delineation of coal mine fire in Jharia coal field, India using geophysical approach: A case study. J. Earth Syst. Sci. 2018, 127, 107. [Google Scholar] [CrossRef]
- Zhao, Q.; Zhang, Y.; Gao, Y.; Ji, Y.; Huang, Z. Mechanism research and application on distributed optical fibre temperature measurement in coalmine goaf area based on the sensor network. Int. J. Sens. Netw. 2016, 20, 104–110. [Google Scholar] [CrossRef]
- Zhou, F.; Xia, T.; Shi, B. Coexistence of gas and coal spontaneous combustion (Il): New prevention and control technologies. J. China Coal Soc. 2013, 38, 353–360. [Google Scholar] [CrossRef]
- Liu, X.; Cai, X.; Guo, Q.; Yang, J. Study of acoustic wave propagation in micro- and nanochannels. Wave Motion 2018, 76, 51–60. [Google Scholar] [CrossRef]
- Chen, C.; Yang, K.; Duan, R.; Ma, Y. Acoustic propagation analysis with a sound speed feature model in the front area of Kuroshio Extension. Appl. Ocean Res. 2017, 68, 1–10. [Google Scholar] [CrossRef]
- Dushaw, B.D.; Menemenlis, D. Antipodal acoustic thermometry: 1960, 2004. Deep. Sea Res. Part I Oceanogr. Res. Pap. 2014, 86, 1–20. [Google Scholar] [CrossRef]
- Yan, H.; Chen, G.; Zhou, Y.; Liu, L. Primary study of temperature distribution measurement in stored grain based on acoustic tomography. Exp. Therm. Fluid Sci. 2012, 42, 55–63. [Google Scholar] [CrossRef]
- Zhang, W.; Jiang, G.; Sun, J.; Lyu, W. Acoustic reconstruction of the vortex field in the nonuniform temperature field of a simulated furnace. Appl. Acoust. 2023, 207, 109334. [Google Scholar] [CrossRef]
- Ren, S.; Zhang, Y.; Song, Z.; Xiao, Y.; Deng, J.; Shu, C. Initial exploration on potential fire hazards detection from coal spontaneous combustion applied by acoustic wave. Sci. Total Environ. 2023, 897, 165475. [Google Scholar] [CrossRef]
- Ettini, K.; Cotter, J.; Guldiken, R. Analytical, simulation, and experimental verification of ultrasonic thermometry technique. Appl. Acoust. 2023, 207, 109345. [Google Scholar] [CrossRef]
- Shen, G.; Zhang, S.; An, L. Study on time delay estimation in acoustic pyrometry under reverberation and high noise environments. J. Chin. Soc. Power Eng. 2014, 34, 529–533+563. [Google Scholar]
- Luo, Z.; Tian, F.; Sun, X. Study of source waveform used for measuring acoustic wave transit time in furnace. Comput. Simul. 2007, 24, 329–332. [Google Scholar] [CrossRef]
- Wang, M.; Shi, J.; Li, W. Study on acoustic travel time measurement based on cross correlation. Electron. Des. Eng. 2016, 24, 102–104+108. [Google Scholar] [CrossRef]
- Zhang, X.; Gao, B.; Song, Z. The research of acoustic measuring of gas temperature employing cross-correlation algorithm. Proc. CSEE 2003, 23, 185–188. [Google Scholar] [CrossRef]
- Kleppe, J.A. Method and apparatus for measuring acoustic wave velocity using impulse response. J. Acoust. Soc. Am. 1995, 98, 28. [Google Scholar] [CrossRef]
- Ewan, B.C.R.; Ireland, S.N. Error reduction study employing a pseudo-random binary sequence for use in acoustic pyrometry of gases. Rev. Sci. Instru. 2000, 71, 4658–4664. [Google Scholar] [CrossRef]
- Zhang, S.; An, L.; Li, G.; Shen, G.; Feng, Q.; Deng, Z. Application of pseudo-random sequence signal in acoustic pyrometry of boiler furnace. J. Chin. Soc. Power Eng. 2012, 32, 378–382. [Google Scholar] [CrossRef]
- Deng, J.; Qu, G.; Ren, S.; Wang, C.; Zhao, X. Experimental study on optimization of low frequency acoustic transmission frequency in loose coal. Saf. Coal Mines 2022, 53, 15–23. [Google Scholar] [CrossRef]
- Guo, X.; Xu, J.; Hui, S. Theoretical analysis on law of transporting oxygen in the loose coal. J. China Coal Soc. 2001, 26, 643–648. [Google Scholar] [CrossRef]
- Young, K.J.; Ireland, S.N.; Melendez, M.C.; Stones, R. On the systematic error associated with the measurement of temperature using acoustic pyrometry in combustion products of unknown mixture. Meas. Sci. Technol. 1998, 9, 1. [Google Scholar] [CrossRef]
- Modliski, N.; Madejski, P.; Janda, T.; Szczepanek, K.; Kordylewski, W. A validation of computational fluid dynamics temperature distribution prediction in a pulverized coal boiler with acoustic temperature measurement. Energy 2015, 92, 77–86. [Google Scholar] [CrossRef]
- Rudolf, S. Cybernetics, system(s) theory, information theory and Fuzzy Sets and Systems in the 1950s and 1960s. Inform. Sci. 2010, 180, 4459–4476. [Google Scholar] [CrossRef]
- Oliveira, V.; Almeida, A.A.; Balata, P.; Nascimento, S.; Brockmann-Bauser, M.; Lopes, L.W. Differences and reliability of linear and nonlinear acoustic measures as a function of vocal intensity in individuals with voice disorders. J. Voice 2023, 37, 663–681. [Google Scholar] [CrossRef]
- Damhof, F.; Brekelmans, W.; Geers, M. Experimental analysis of the evolution of thermal shock damage using transit time measurement of ultrasonic waves. J. Eur. Ceram. Soc. 2009, 29, 1309–1322. [Google Scholar] [CrossRef]
- Dokhanchi, N.S.; Arnold, J.; Vogel, A.; Voelker, C. Measurement of indoor air temperature distribution using acoustic travel-time tomography: Optimization of transducers location and sound-ray coverage of the room. Measurement 2020, 164, 107934. [Google Scholar] [CrossRef]
- Shen, G.; Yang, G.; Chen, D.; Liu, W.; Zhang, S.; An, L. Study on time delay estimation in boiler acoustic temperature measurement based on second correlation PHAT-β algorithm. J. Chin. Soc. Power Eng. 2018, 38, 617–623. [Google Scholar] [CrossRef]
- Hu, Y.; Li, D.; Yuan, B.; Suo, G.; Liu, Z. Application of pseudo-random frequency domain electromagnetic method in mining areas with strong interferences. Trans. Nonferrous Met. Soc. China 2020, 30, 774–788. [Google Scholar] [CrossRef]
- Guo, J.; Shang, H.; Cai, G.; Jin, Y.; Wang, K.; Li, S. Early detection of coal spontaneous combustion by complex acoustic waves in a concealed fire source. ACS Omega 2023, 8, 16519–16531. [Google Scholar] [CrossRef] [PubMed]
- Ren, S.; Ma, T.; Zhang, Y.; Deng, J.; Xiao, Y.; Zhai, X.; Zhang, Y.; Song, Z.; Wang, C. Sound absorption characteristics of loose bituminous coal porous media with different metamorphic degrees. Fuel 2023, 332, 126091. [Google Scholar] [CrossRef]
- Vera-Diaz, J.M.; Pizarro, D.; Macias-Guarasa, J. Acoustic source localization with deep generalized cross correlations. Signal Process. 2021, 187, 108169. [Google Scholar] [CrossRef]
- Deng, J.; Qu, G.; Ren, S.; Wang, C.; Wang, J.; Zhao, X.; Bai, G. Experimental study on acoustic wave propagation characteristics and main paths in loose coal. J. China Coal Soc. 2023, 48, 1238–1245. [Google Scholar] [CrossRef]
- Guo, J.; Chen, C.; Jin, Y.; Cai, G.; Wen, H.; Li, S. Mapping model of sound velocity and coal temperature for quasi-porous media in loose coal. J. China Coal Soc. 2024, 49, 3510–3521. [Google Scholar] [CrossRef]


| Sweep Signal Form | Mathematical Expression | Parameter Description |
|---|---|---|
| Linear swept signal | f(t) = f0 + βt(t ∈ [0, tg]) | β = [f(tg) − f0]/tg |
| Secondary type sweep signal | f(t) = f0 + βt2(t ∈ [0, tg]) | β = [f(tg) − f0]/tg2 |
| Logarithmic sweep signal | f(t) = f0 + 10βt(t ∈ [0, tg]) | β = [log10f(tg) − f0]/tg |
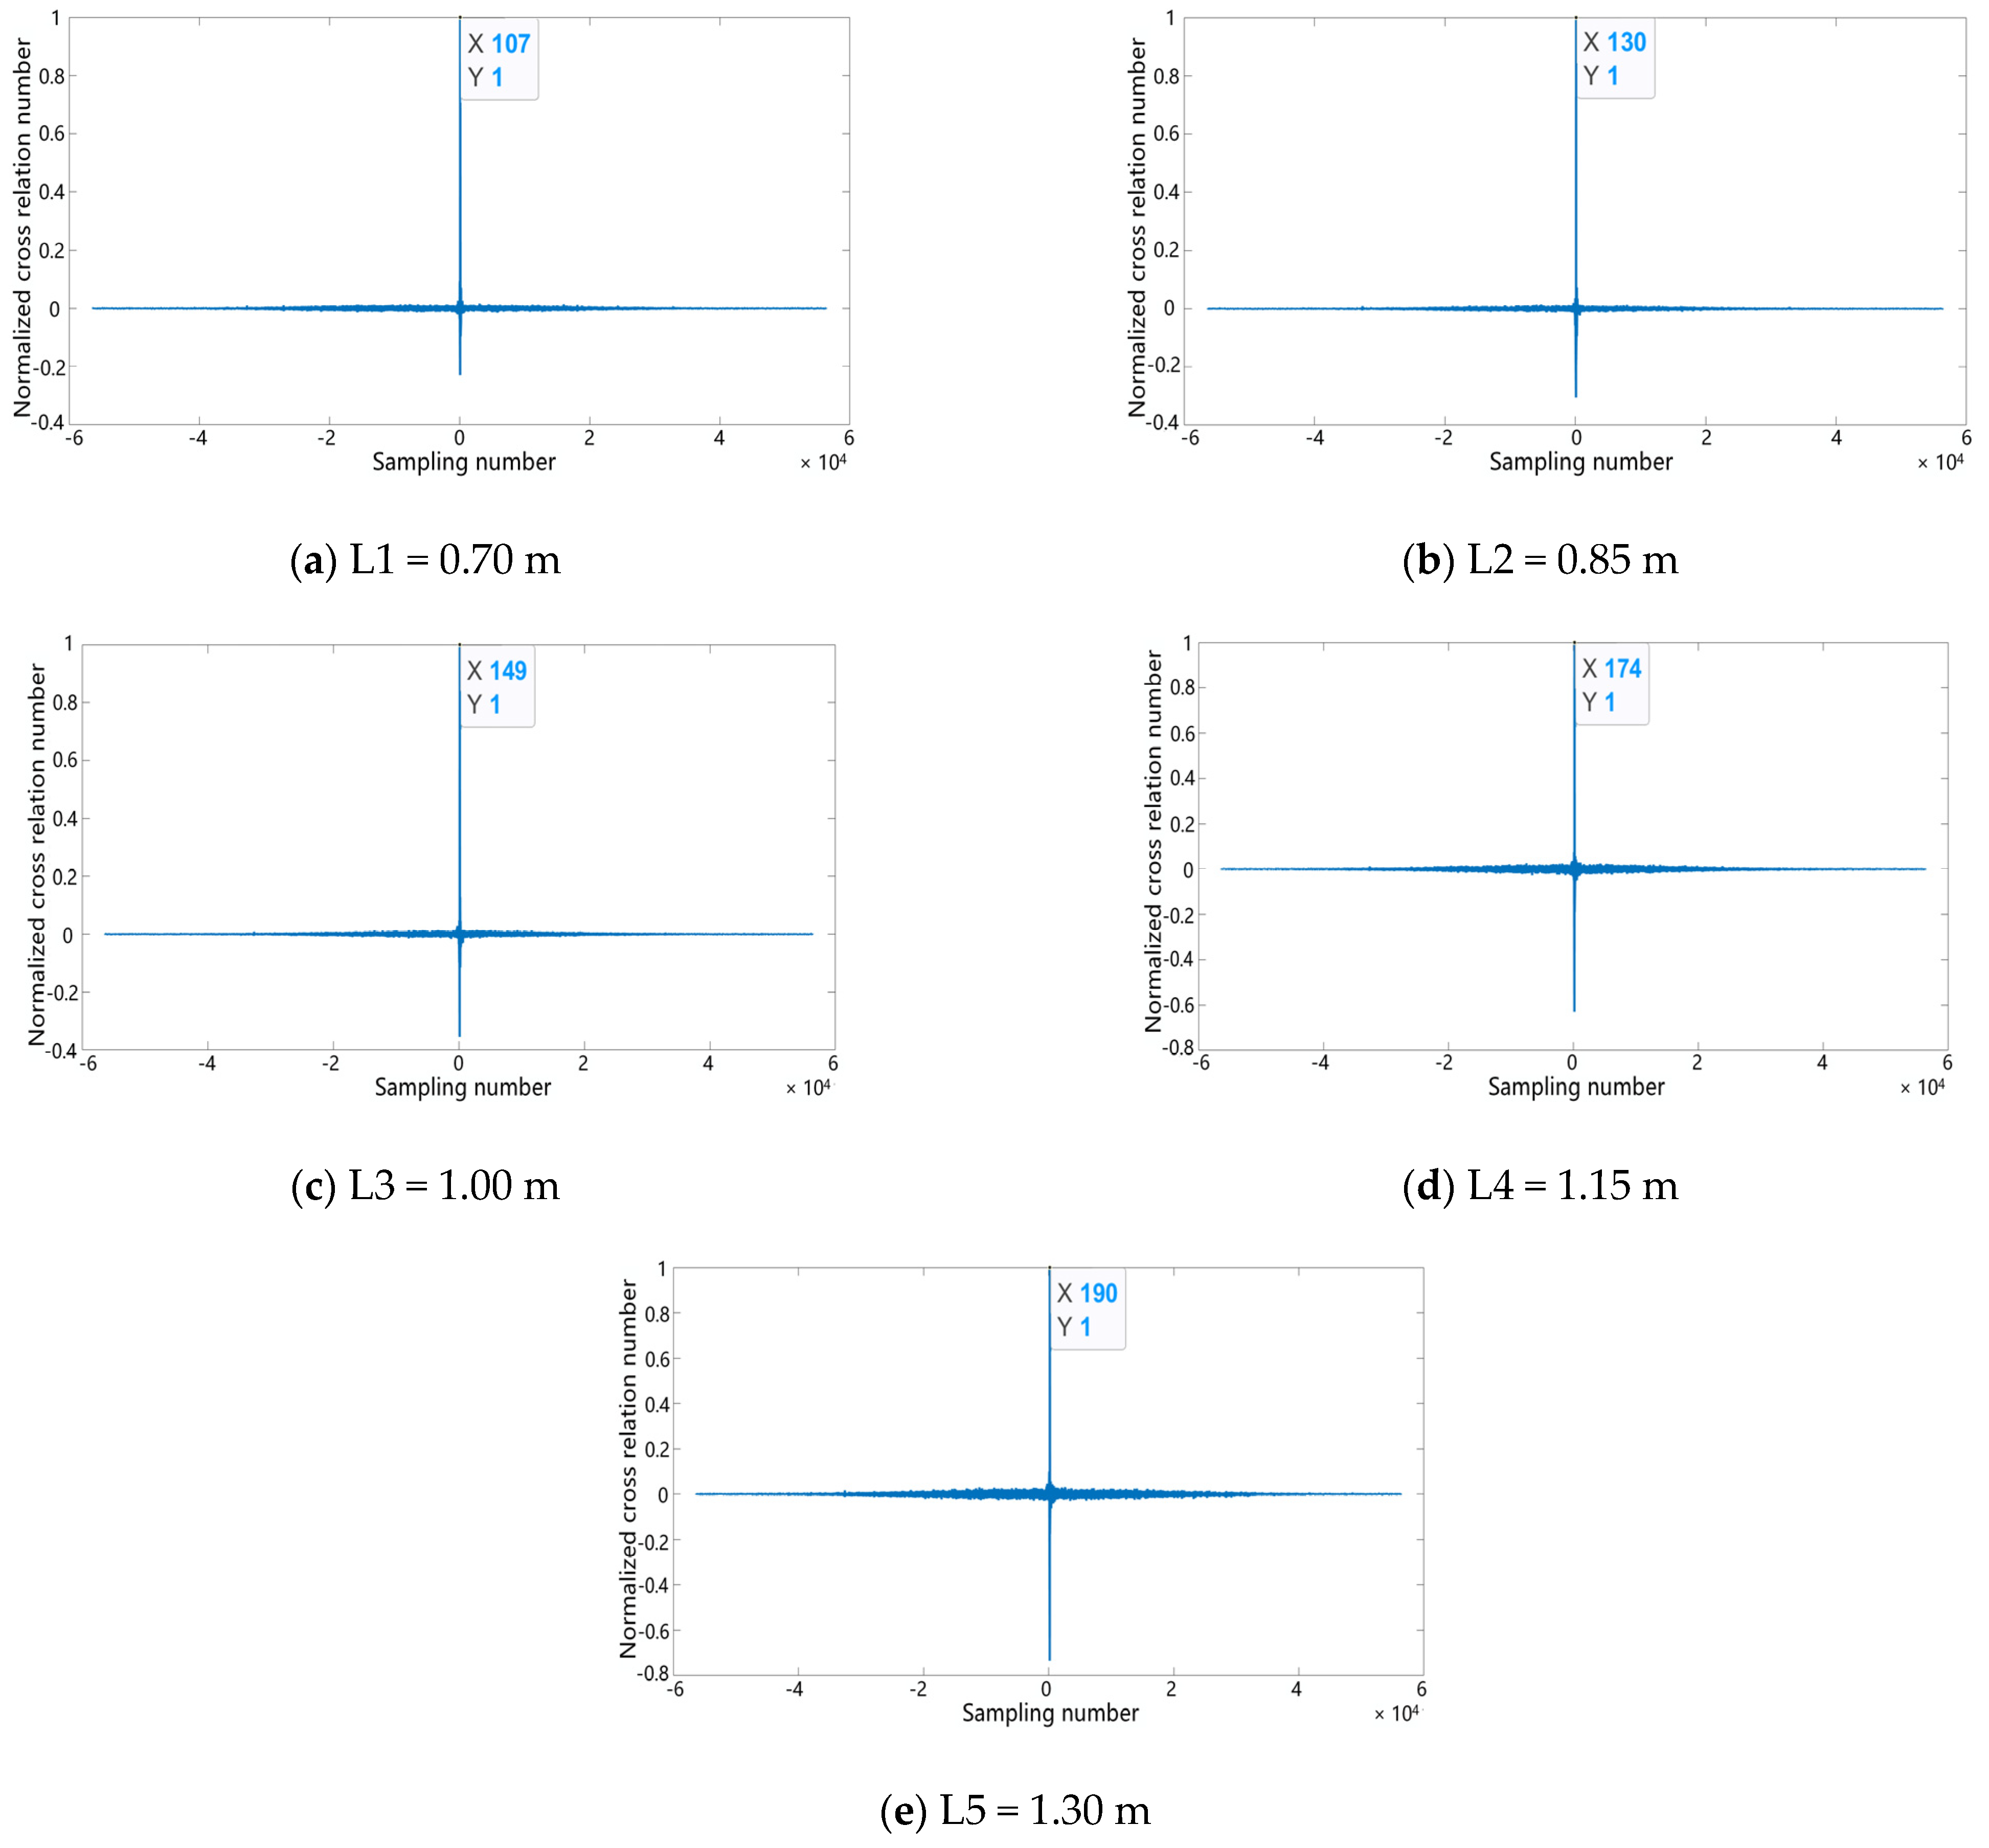
| Route Number | Theoretical Value of TOF t (ms) | Theoretical Delay Sampling Points (ms) |
|---|---|---|
| L1 | 2.041 | 104 |
| L2 | 2.478 | 126 |
| L3 | 2.916 | 149 |
| L4 | 3.353 | 171 |
| L5 | 3.791 | 194 |
Disclaimer/Publisher’s Note: The statements, opinions and data contained in all publications are solely those of the individual author(s) and contributor(s) and not of MDPI and/or the editor(s). MDPI and/or the editor(s) disclaim responsibility for any injury to people or property resulting from any ideas, methods, instructions or products referred to in the content. |
© 2025 by the authors. Licensee MDPI, Basel, Switzerland. This article is an open access article distributed under the terms and conditions of the Creative Commons Attribution (CC BY) license (https://creativecommons.org/licenses/by/4.0/).
Share and Cite
Guo, J.; Gao, W.; Liu, Y.; Cai, G.; Wang, K. Characterization of Acoustic Source Signal Response in Oxidized Autocombusted Coal Temperature Inversion Experiments. Fire 2025, 8, 264. https://doi.org/10.3390/fire8070264
Guo J, Gao W, Liu Y, Cai G, Wang K. Characterization of Acoustic Source Signal Response in Oxidized Autocombusted Coal Temperature Inversion Experiments. Fire. 2025; 8(7):264. https://doi.org/10.3390/fire8070264
Chicago/Turabian StyleGuo, Jun, Wenjing Gao, Yin Liu, Guobin Cai, and Kaixuan Wang. 2025. "Characterization of Acoustic Source Signal Response in Oxidized Autocombusted Coal Temperature Inversion Experiments" Fire 8, no. 7: 264. https://doi.org/10.3390/fire8070264
APA StyleGuo, J., Gao, W., Liu, Y., Cai, G., & Wang, K. (2025). Characterization of Acoustic Source Signal Response in Oxidized Autocombusted Coal Temperature Inversion Experiments. Fire, 8(7), 264. https://doi.org/10.3390/fire8070264