Abstract
Understanding the structural behaviour of flat plate systems during fire exposure is critical for ensuring the safety of occupants and emergency personnel. Flat slabs, a widely used structural system, undergo significant thermal deformations in fire, which increase demands on supporting columns and reduce the stiffness and strength of concrete and steel. While experimental fire tests have provided valuable data to understand the behaviour of isolated components of flat slabs, numerical analysis is the only route to comprehending the structural behaviour of full-scale flat plate structures during fire exposure. ABAQUS is commonly used for modelling reinforced concrete (RC) structures under fire, with two prevailing techniques: (1) solid element modelling for concrete and truss reinforcement and (2) shell element modelling with embedded steel layers and line-column elements. However, uncertainties remain regarding the influence of modelling parameters such as dilation angle and concrete tensile stress, and the impact of surface fire exposure has not been comprehensively studied. This study presents a novel contribution by conducting a detailed numerical investigation of a full-scale flat plate structure exposed to fire using both modelling approaches. The shell-element model was validated against experimental data and used to evaluate the effect of dilation angle and tensile strength assumptions. A unique aspect of this work is the assessment of fire exposure on different slab surfaces, including bottom, top, and both, which provides insights into slab deflections and column displacements under different surface fire exposure scenarios. The structure was then modelled using solid elements to systematically compare modelling techniques. The results highlight key differences between approaches and guide for selecting the most suitable modelling strategies for fire-exposed flat plate systems.
1. Introduction
Finite Element (FE) modelling can be a viable alternative to experimental testing [1]. ABAQUS, a versatile general-purpose FE programme developed in 1978, offers various functionalities applicable to structural fire engineering. Numerous researchers demonstrated the suitability of such a comprehensive software package in structural fire engineering [2].
Two primary approaches are routinely used to model reinforced concrete (RC) slabs in ABAQUS [3]. The first employs three-dimensional continuum (solid) elements to model the concrete and three-dimensional truss elements for the rebars [3]. The second approach utilizes shell elements, where the reinforcement bars are modelled as thin steel layers [3,4].
The solid element approach enables the evaluation of the slab’s three-dimensional stress distributions. However, it may fall short in modelling bending behaviour [3], as it has only translation degrees of freedom [5]. Shell elements, on the other hand, have both translational and rotational degrees of freedom [2,5]. A fine mesh can enhance the response and mitigate this issue [3]. However, this necessity can clash with the mesh’s ability to represent the concrete aggregate size, which allows for capturing the intricate behaviour of softening concrete [3]. Employing a fine mesh also escalates the computational costs associated with the solid technique, rendering it impractical for system-level analysis [6]. Previous research showed that mesh dependency is influenced by the inelastic tensile response rather than the compressive behaviour [7,8]. Mesh sensitivity problems can be solved by modelling tension softening using the tensile stress-displacement approach [8,9].
Flat slabs undergo thermal deformations during a fire, resulting in rotations and elongations [10,11]. These deformations are partially constrained by supporting columns [12]. They result in significant load redistribution and increase the slab’s deformation near the columns [13]. In such conditions, the exterior and corner columns become particularly crucial [12].
Previous research on flat plate structures under fire conditions has primarily focused on fire exposure at the bottom surface of the slab. Moss et al. [14] explored the behaviour of multi-bay, two-way RC slabs subjected to ISO 834 [15] standard fire using SAFIR software 2001. They observed a decrease in the steel yield strength above 300 °C, resulting in a reduction in bending strength and slab sagging, ultimately leading to structural failure. Building on the same concept, George [6] used ABAQUS 2009 to simulate a fire starting on the third floor. They noted a significant increase in deflection, particularly at the centre of the studied bay, which led to punching failure after approximately 60 min of exposure to fire. Due to convergence issues, they assumed that the top and bottom reinforcements continuously covered the full flat slab.
Creating a FE model that accurately reflects the behaviour of concrete structures under high-temperature conditions poses a series of issues [16]. Concrete damage plasticity (CDP) parameters in ABAQUS, specifically the dilation angle and the tensile behaviour, strongly influence the outcomes [16]. The EC2 (1995) guidelines propose omitting concrete’s tensile strength [6]. This approach has been widely adopted in most numerical simulations, as demonstrated in the works of Lim et al. [17] and Moss et al. [14]. However, it is essential to underline that ignoring the tensile behaviour of concrete is not feasible when utilizing ABAQUS. FE simulations show that including the tensile strength of concrete provides better predictions of slab behaviour at large deflections [4,17]. Section 3.2.2.2 of EN1992-1-2 [18] provides a simple reduction expression to predict the tensile strength of concrete at elevated temperatures, up to 600 °C [18]. Previous researchers investigated the influence of the dilation angle (φ) on the deflection response of concrete flat slabs at ambient temperatures. Genikomsou and Polak [19] explored the impact of the dilatation angle (φ) on concrete flat slabs at ambient temperature. They recommended using any value between 20° and 42°. Wahid et al. [16] evaluated the φ value at elevated temperatures for a three-dimensional FE model of a slab–column assembly. Their findings suggested that φ values ranging from 30° to 35° provide satisfactory predictions of the slab’s deflection. It was noted that the optimal φ value may vary depending on the specific concrete compression model [16].
A few researchers have employed the FE method to analyze flat slabs subjected to fire exposure. Although the dilation angle and concrete tensile model significantly influence the behaviour, the literature lacks clear recommendations on how they should be incorporated. Furthermore, more data are needed regarding the effect of surface fire exposure on the performance of flat plate structures. Additionally, it is unclear which modelling technique (shell or solid) can be considered the better approach.
This paper provides recommendations to facilitate the analysis of flat slab structures during fire exposure using the FE method. It also provides data on the effects of the exposure surface on vertical deflection and lateral displacement of the column. The following sections present details of the FE modelling using both shell and solid elements, as well as an analysis of a designed prototype.
2. General Thermo-Structural Analysis Procedures
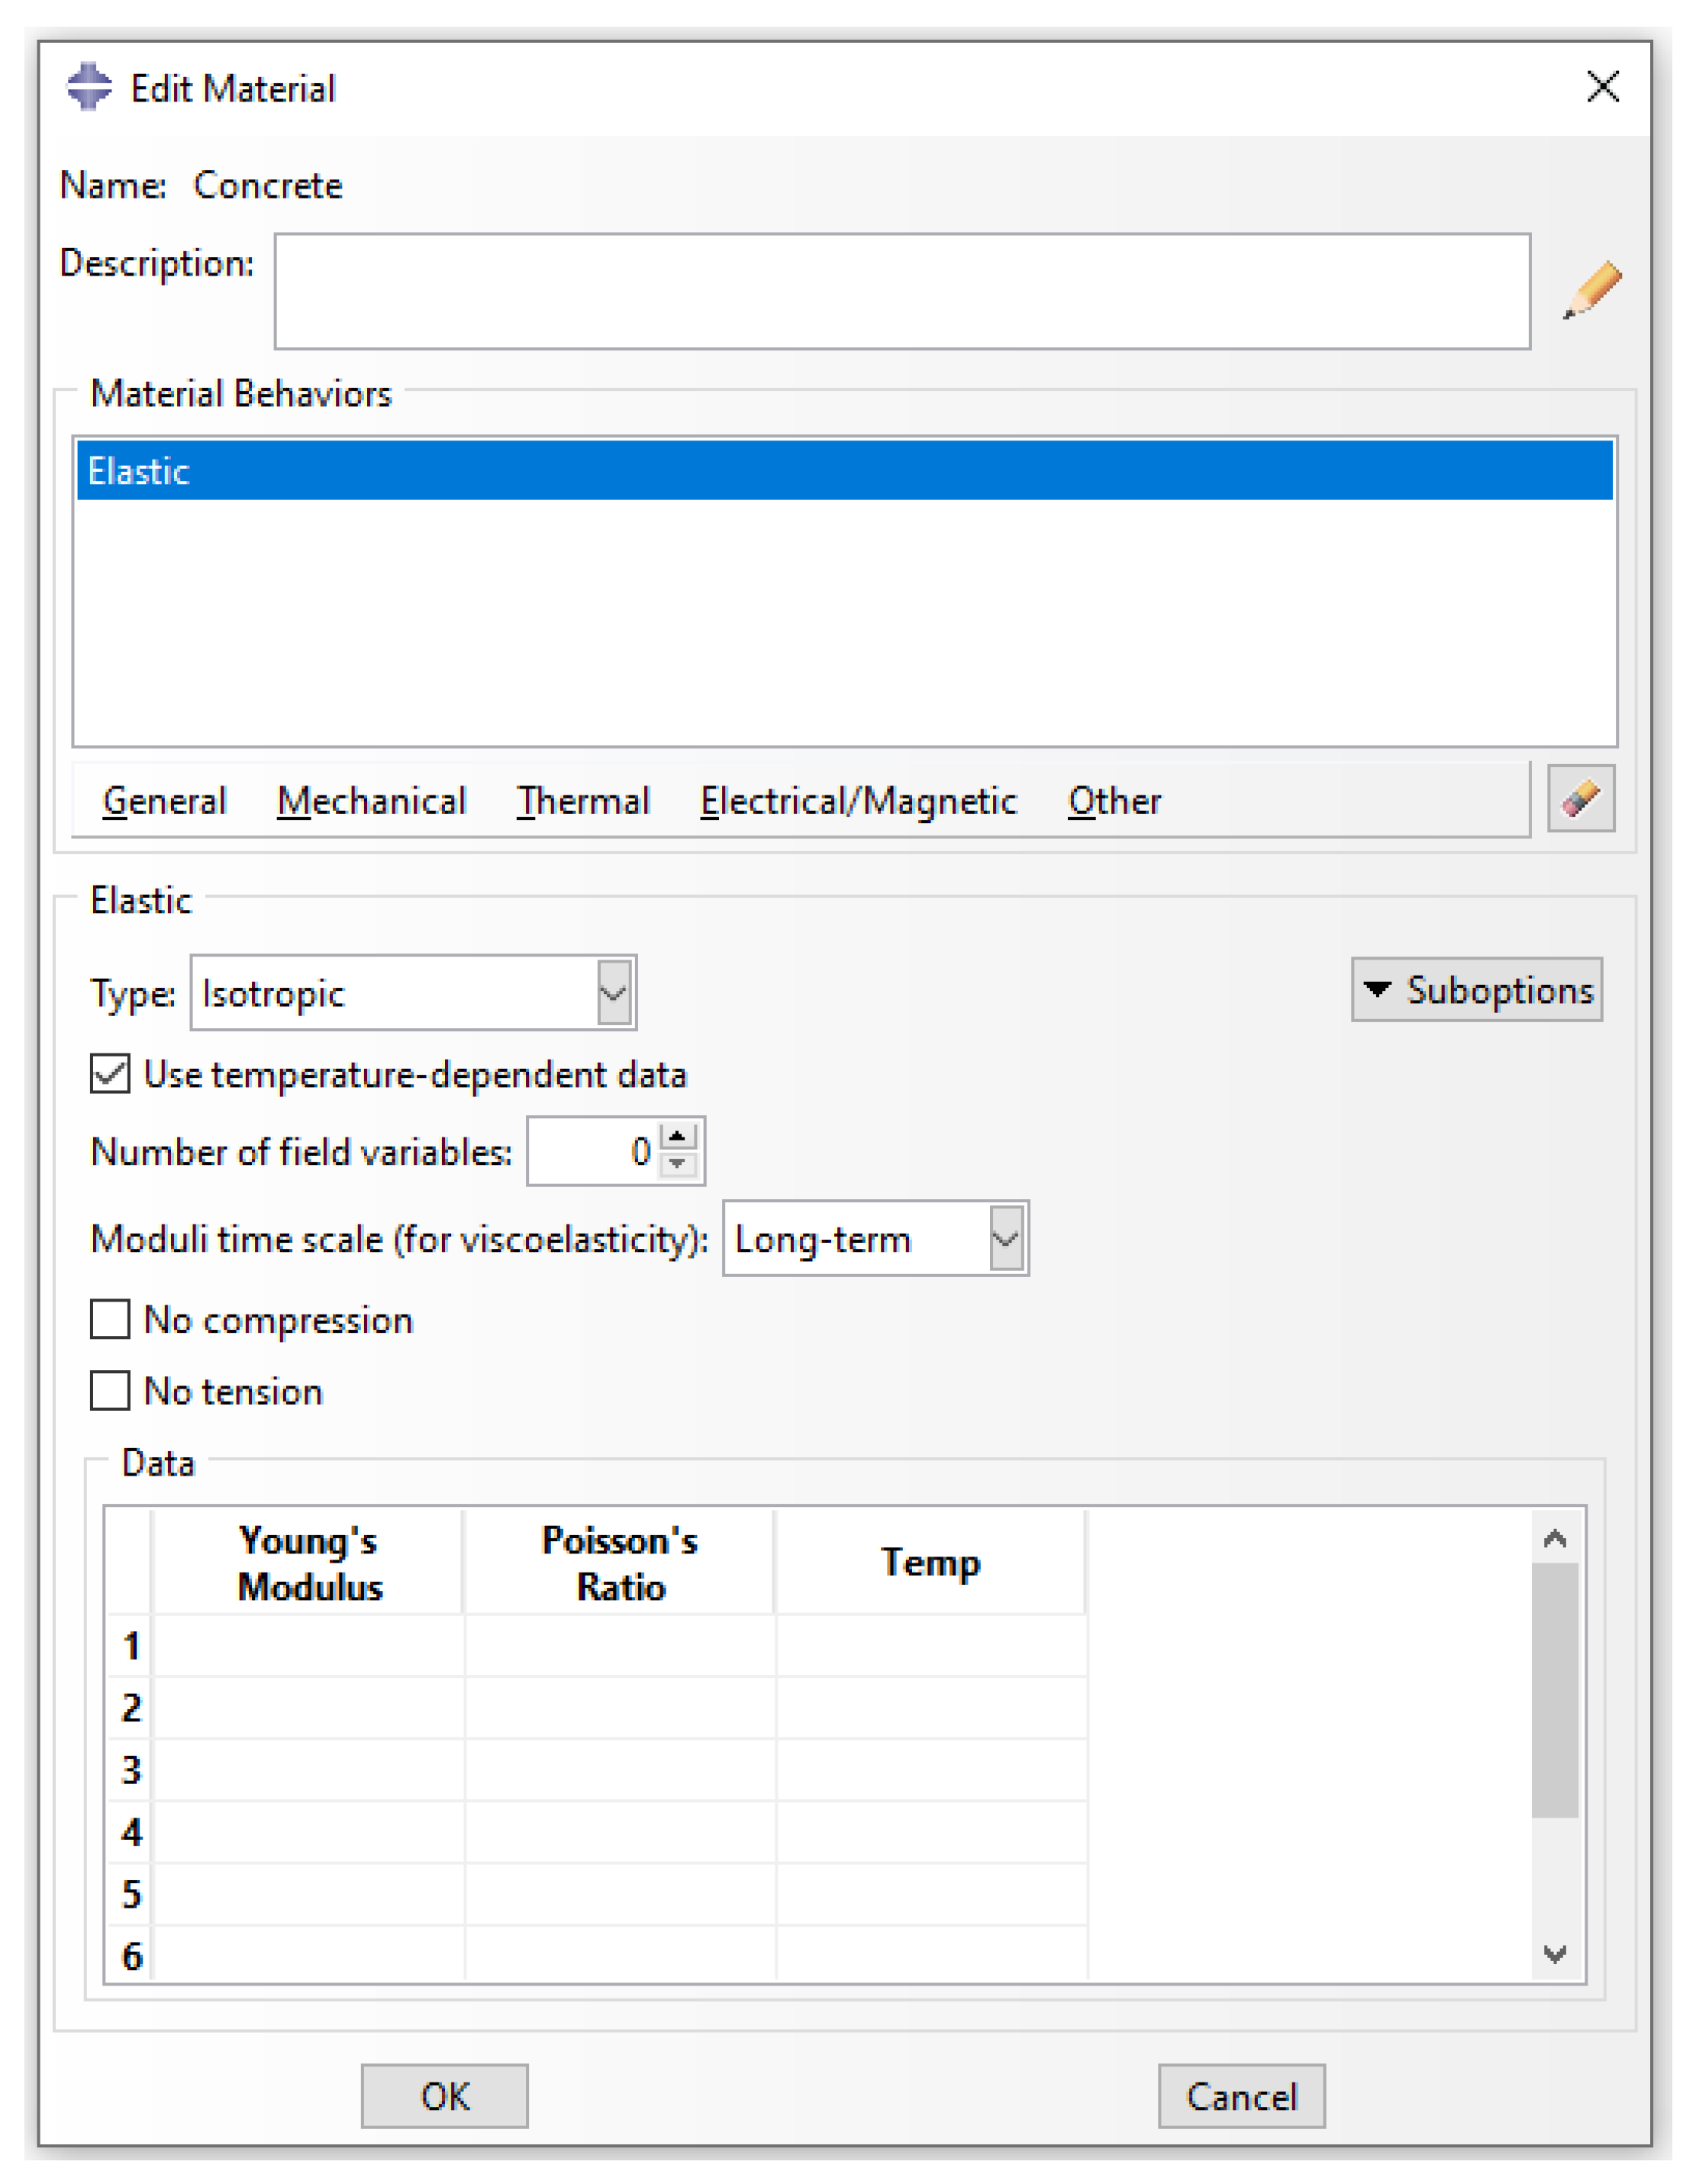
Simulations of RC structures under fire require an understanding of the temperature-dependent properties for both thermal and mechanical analysis. Thermal conductivity, specific heat capacity, and mass density are needed for thermal analysis. Mechanical analysis requires definitions of the modulus of elasticity of concrete and rebars, the thermal expansion coefficient of concrete and rebars, the compressive and tensile behaviour of concrete, and the plasticity of rebars. These properties can be entered in ABAQUS as functions of temperature. For example, Figure 1 illustrates how the temperature-dependent concrete modulus of elasticity can be entered in ABAQUS using tabulated data. The temperature-dependent properties of concrete and steel are based on formulations given in EC2-1-2 [18] and by Lie [20]. These formulations are presented in Table 1 and Table 2.

Figure 1.
Defining the temperature-dependent concrete modulus in ABAQUS.

Table 1.
Thermal properties of concrete.
Table 2.
Thermal properties of steel.
To define the thermal boundary conditions in the fire scenario, the floor slab was exposed to the standard fire curve specified in ASTM E119 [21] for two hours. Heat transfer to the fire-exposed surface was primarily modelled through thermal radiation, with a surface emissivity (ε) of 0.70. The net radiative heat flux () to the surface was calculated using the Stefan-Boltzmann law [. where σ is the Stefan-Boltzmann constant (5.67 × 10⁻⁸ W/m2·K4), is the fire temperature and is the slab surface temperature. Convection was neglected in the thermal analysis, as its contribution to heat transfer is less than 10%, making radiation the dominant mode of heat transfer during fire exposure. Adiabatic boundary conditions were applied to the protected column faces, assuming no heat transfer through these surfaces. The heat conduction equation [ governed the transient heat conduction through the slab thickness. Where is the material density, is the specific heat capacity, is the temperature, is time, and is the thermal conductivity. Internal heat generation () was assumed to be zero. These thermal analyses, encompassing radiation and conduction, were implemented using ABAQUS, with temperature-dependent material properties defined following Eurocode 2 Part 1-2.
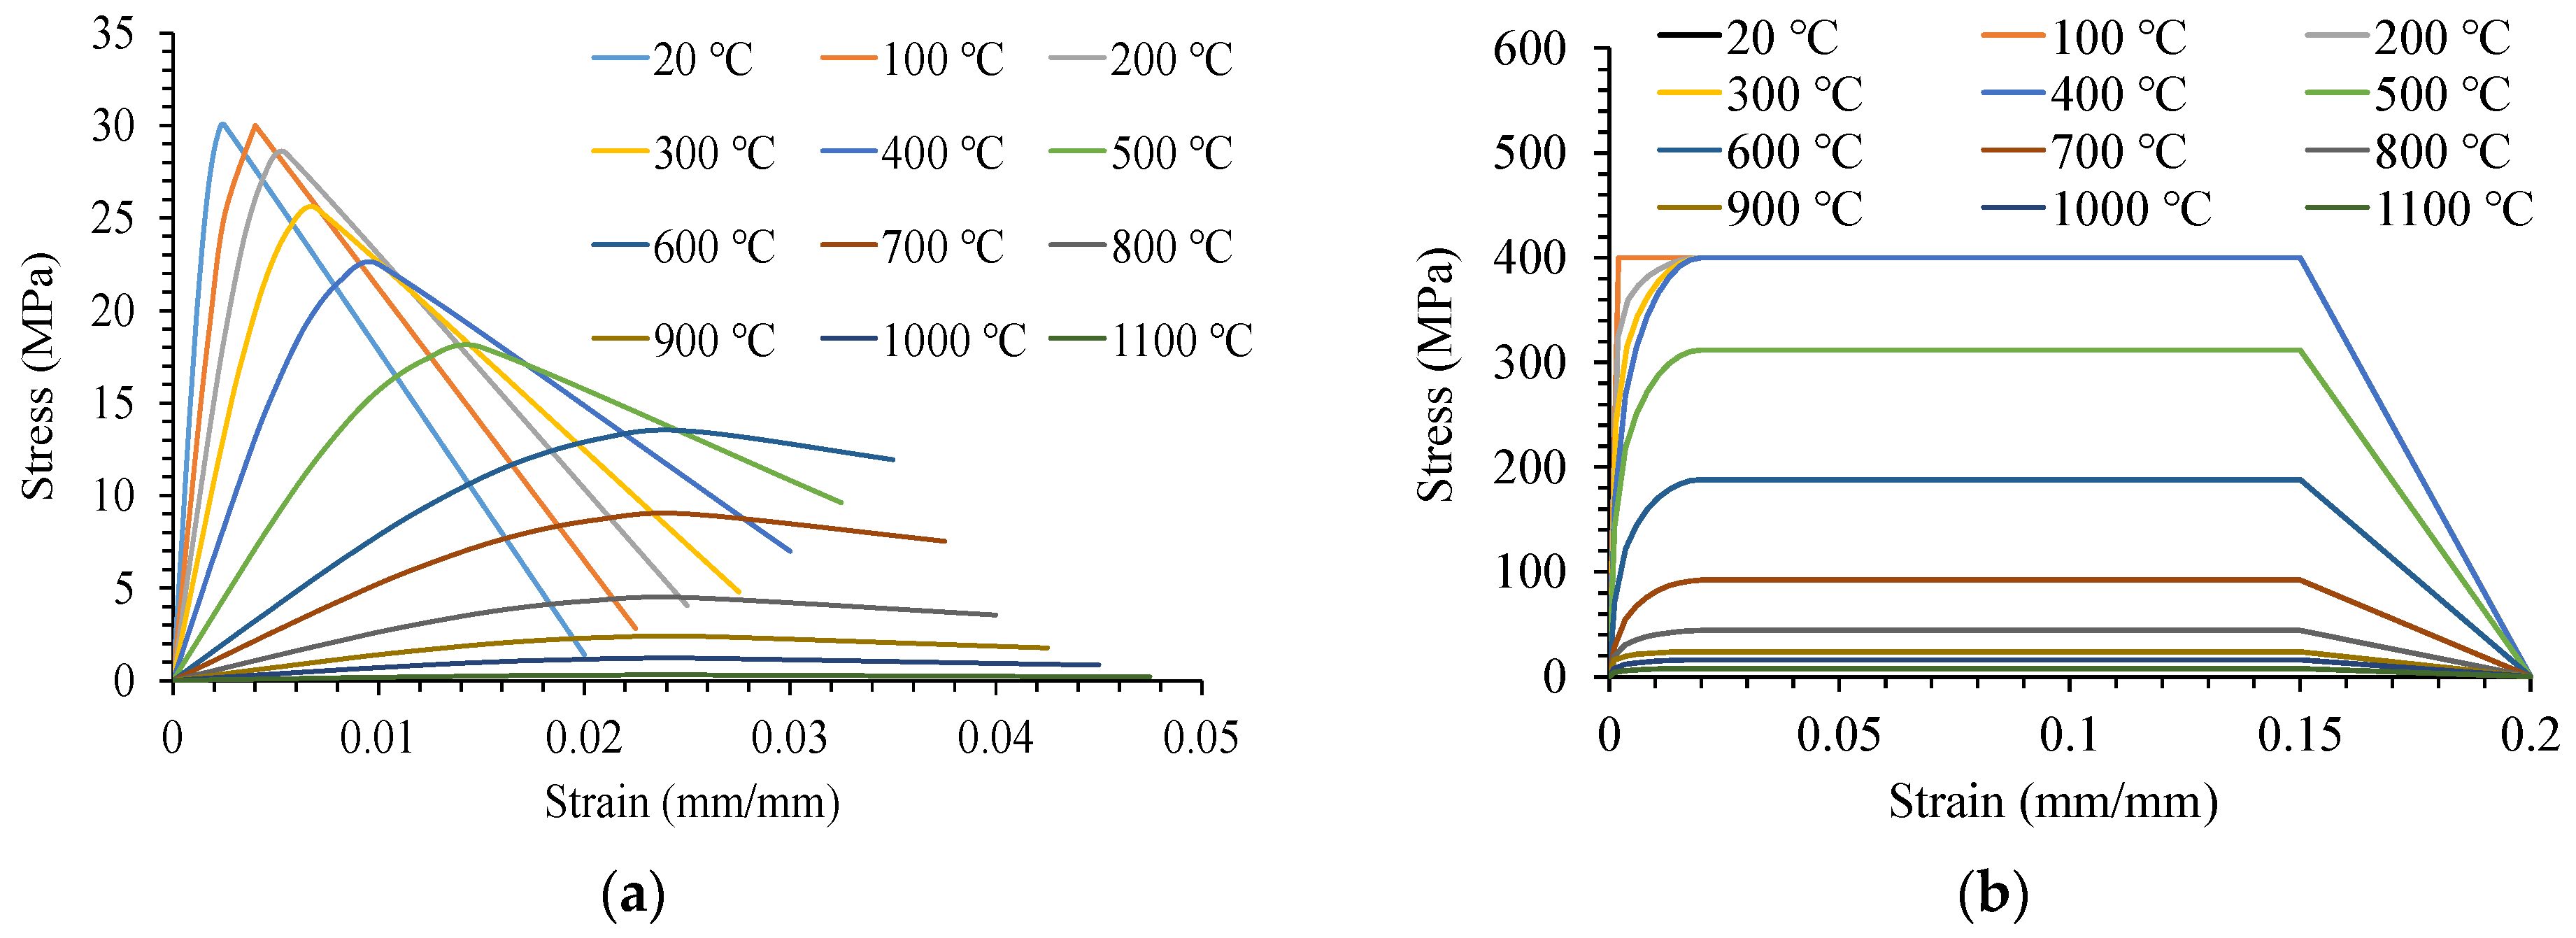
The stress–strain relationship for concrete subjected to compression at elevated temperatures is graphically presented in Figure 2a, assuming a concrete strength of 30 MPa. Two key factors chiefly influence these curves: the compressive strength () and the strain at peak stress (). Equation (1) is employed to establish the ascending branch. Linear modelling is valid for the descending branch that terminates at the ultimate strain () [4,16,18]. The specific values for the parameters (, and ) for siliceous-aggregate normal-density concrete, followed the EC2-1-2 [18] recommended values.
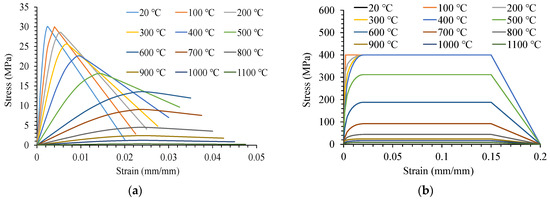
Figure 2.
Stress–strain relationships at elevated temperatures: (a) Concrete in compression and (b) Steel in tension or compression.
The stress–strain relationship of steel under elevated temperatures is graphically represented in Figure 2b. Three pivotal factors influence this curve: the slope of the linear elastic range (), the proportional limit (), and the maximum stress threshold ().
A sequential analysis technique was chosen to analyze flat plate structures supporting gravity loads during exposure to fire. First, a thermal heat transfer model was developed to generate the thermal profile of the slab. Next, structural analysis was performed. The following assumptions were made.
- Concrete degradation due to reasons other than fire temperature was ignored. This assumption was made to allow the analysis to continue for the duration of the fire. According to the structural strength failure criteria in BS 476-20:1987 [22,23], horizontal elements are considered to have failed when deflection limits (Δ) in Equations (2) and (3) are reached. Therefore, in this study, failure was judged based on these criteria. The clear span (L) and the depth of section (d) were used in these calculations. Adopting these failure criteria ensures alignment with widely accepted practices in structural fire engineering and consistency with experimental methodologies. This approach bridges the gap between numerical modelling and experimental validation by providing a clear, standardized, practical framework for assessing structural failure under fire conditions.
- Concrete spalling was excluded due to its limited occurrence in normal-strength concrete.
- The elevated temperatures do not affect the bond of the steel rebars to the concrete.
- The slab is uniformly exposed to fire.
- Columns are assumed to be thermally protected and unaffected by the fire. Their properties were assigned based on an ambient temperature of 20 °C.
3. Flat Building Structure (Prototype)
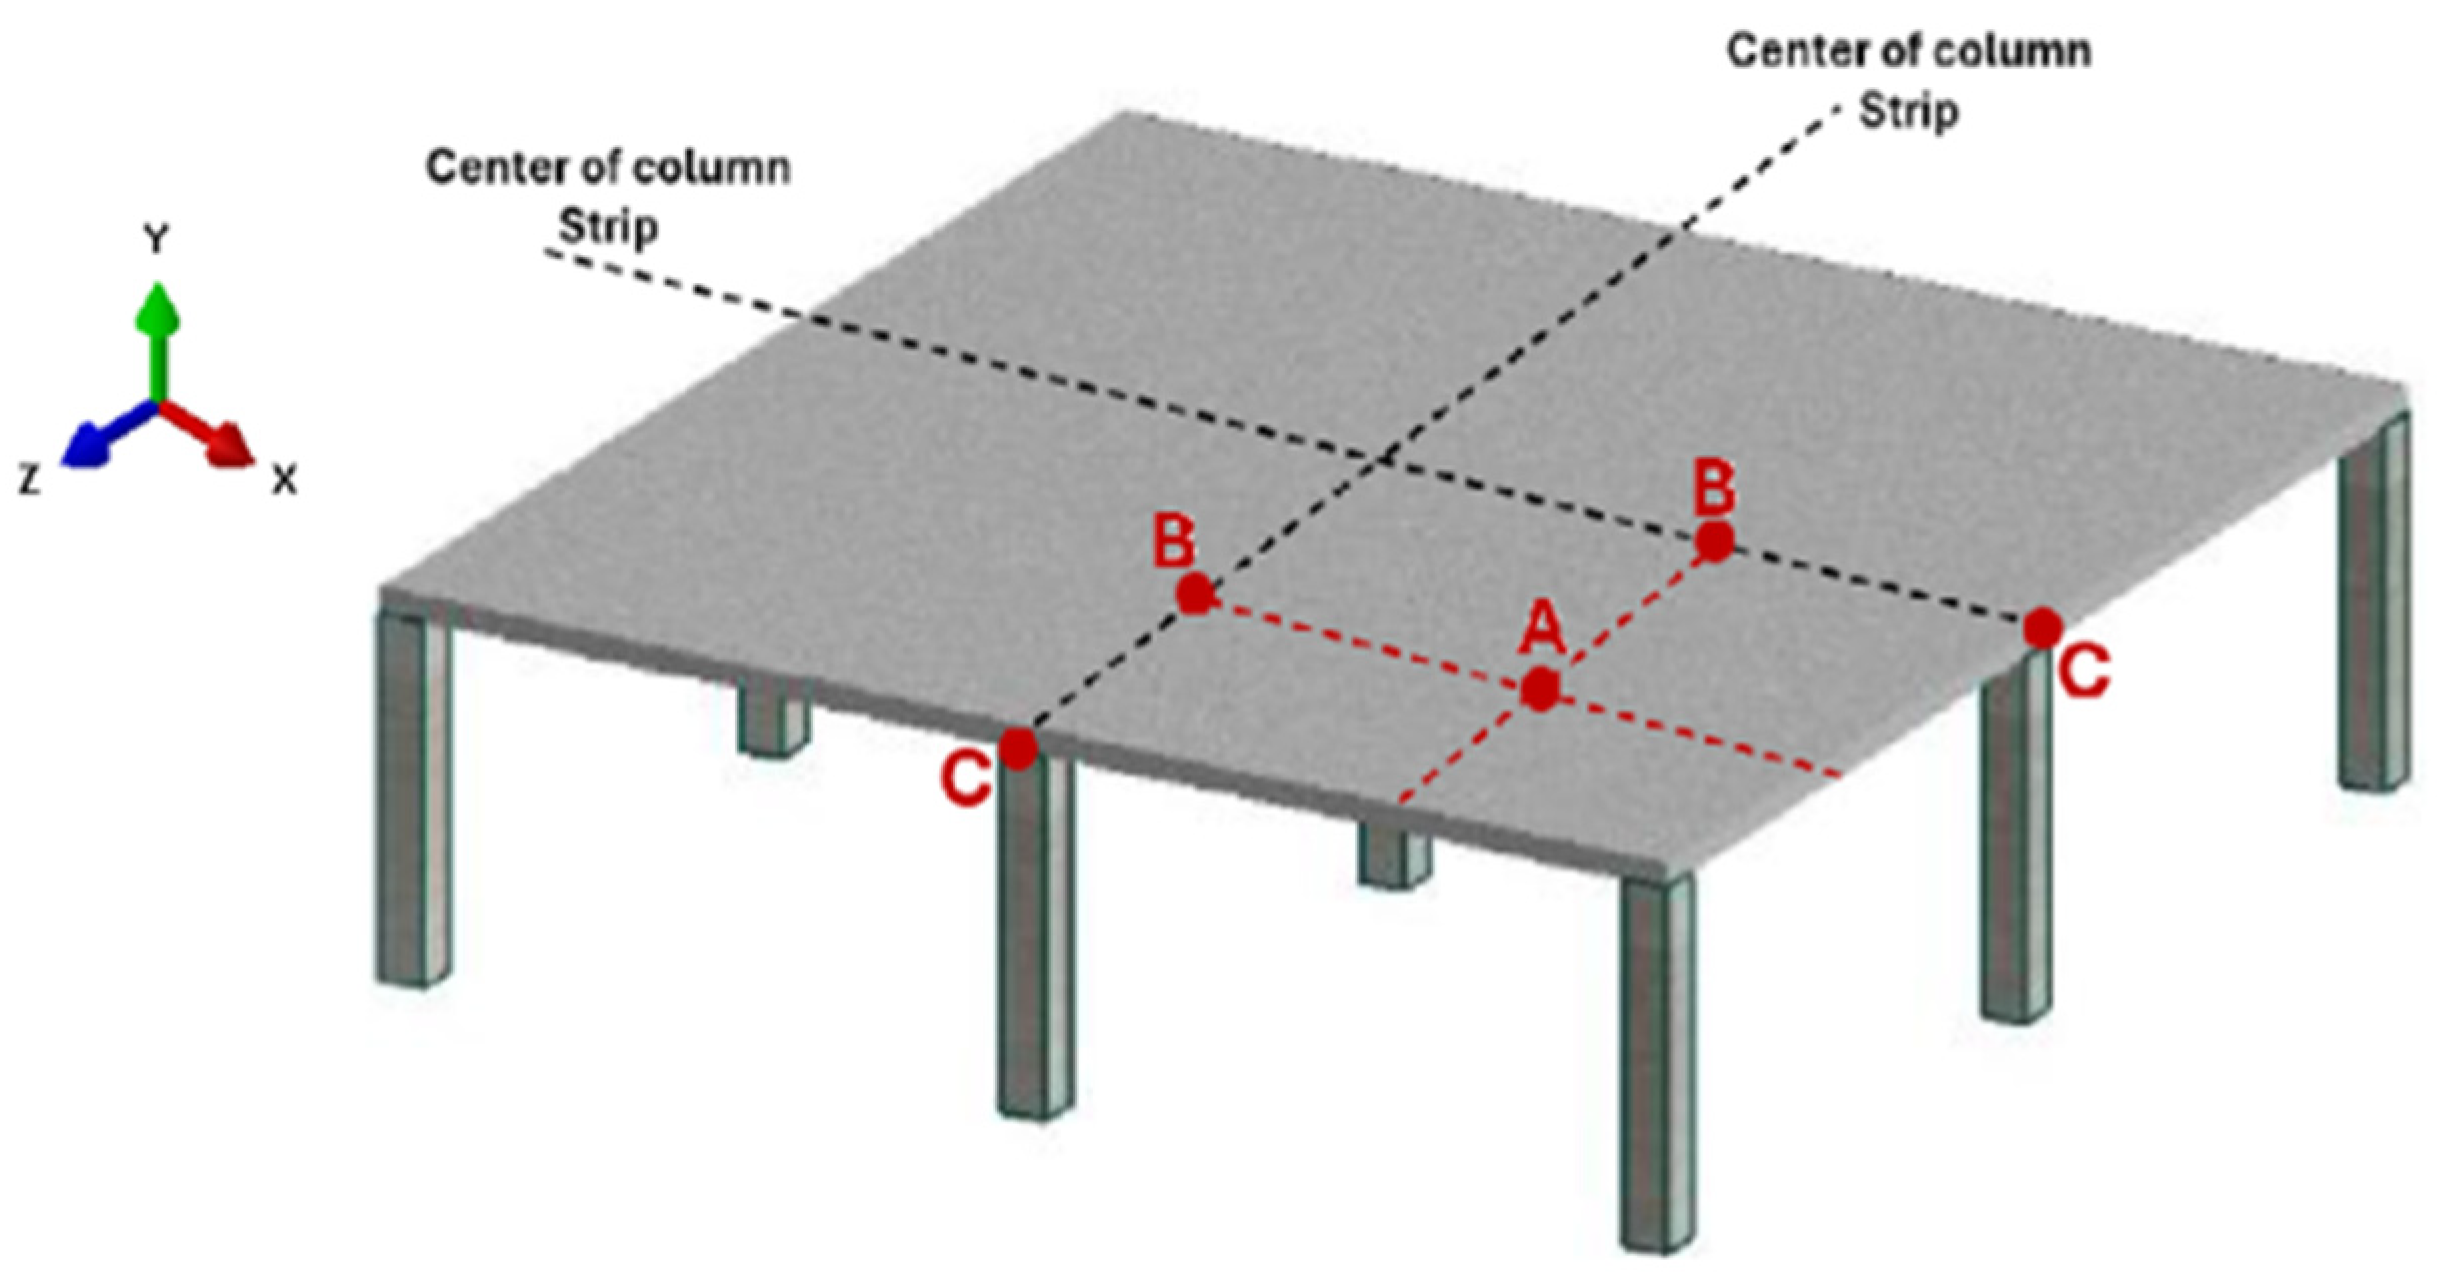
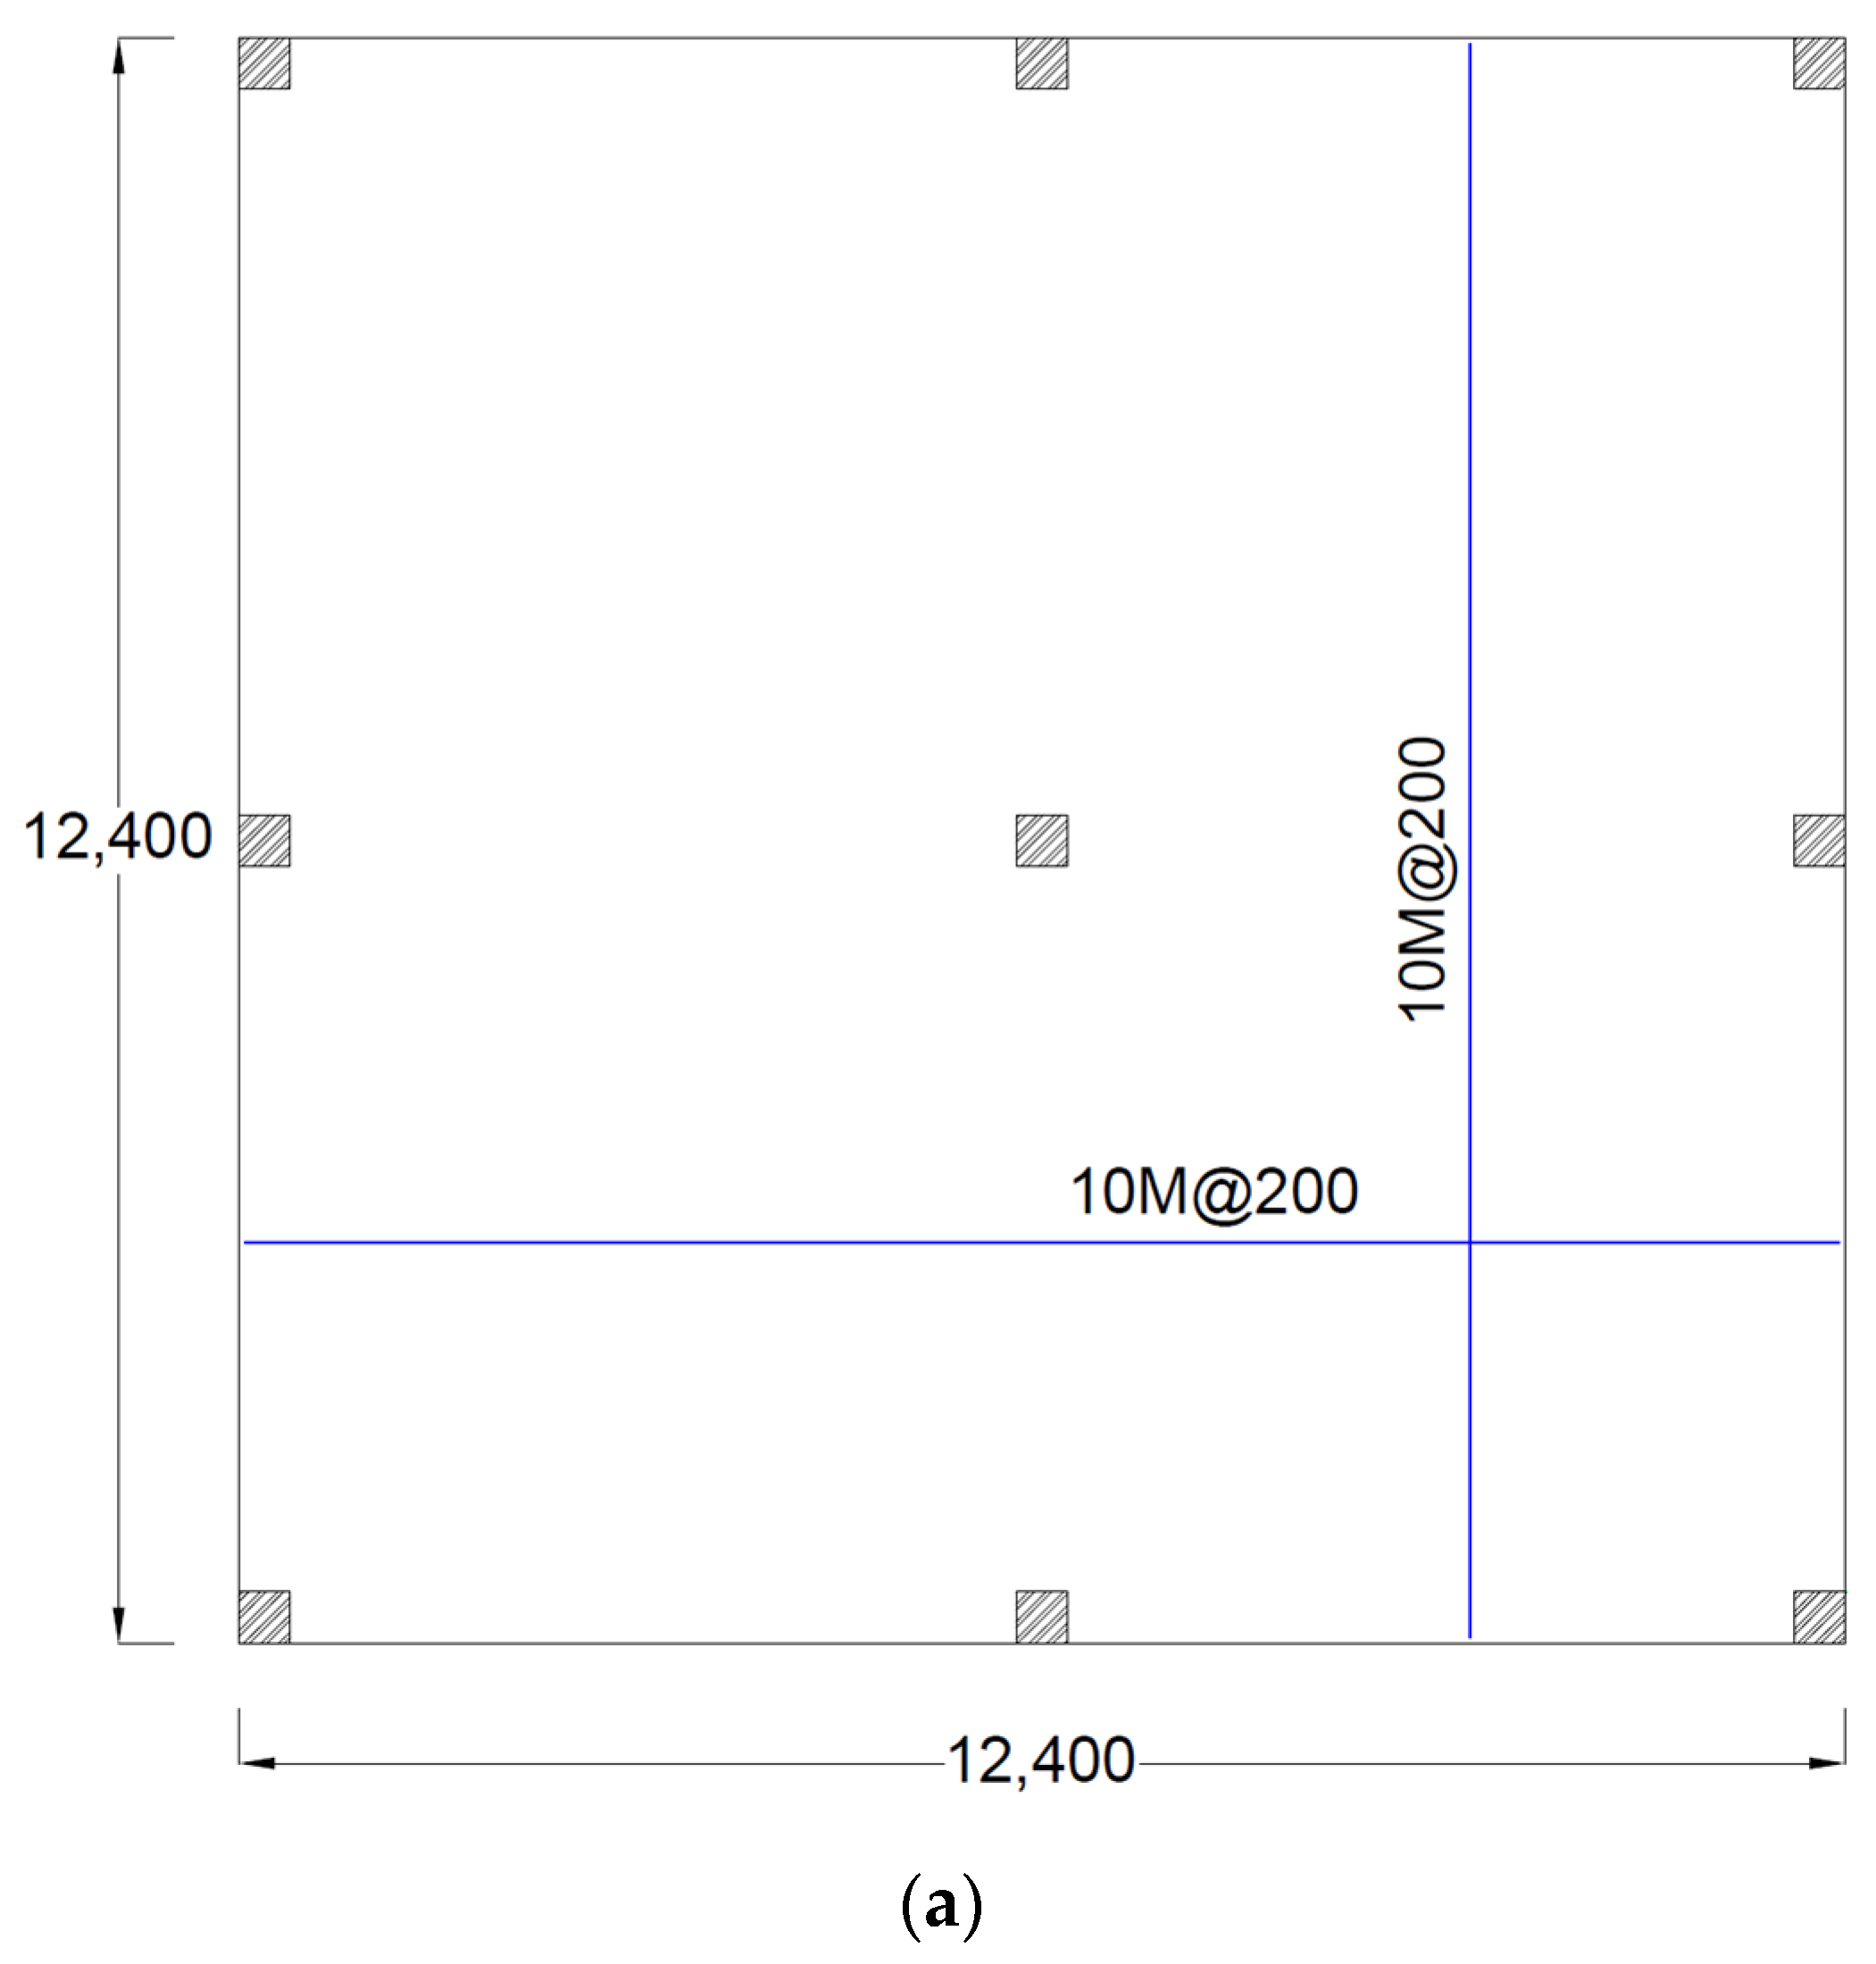
Figure 3 shows the chosen prototype, representing a two-way RC slab of a one-storey, two-bay building. A one-storey, two-bay structure was selected to represent typical flat-plate buildings commonly used in residential and commercial construction while also minimizing computational complexity for the analysis. The clear height and bay width were taken as 2.8 m and 6 m, respectively. The columns’ cross-section was assumed to be 400 mm by 400 mm. The materials for the prototype consisted of Grade 60 hot-rolled reinforcement with a yield strength (fy) of 400 MPa and normal-weight concrete with a cylinder compressive strength of 30 MPa, as well as 19 mm siliceous aggregates. The prototype was designed following CSA A23.3 [24], assuming a superimposed dead load of 1 kN/m2 and a live load of 2.4 kN/m2. The slab thickness was 210 mm, which satisfied the serviceability and strength criteria of CSA A23.3 [24]. Steel reinforcement had a minimum cover of 20 mm. Figure 4 displays the layout of the bottom and top reinforcement.

Figure 3.
Schematic of the two-bay, one-story flat plate prototype.

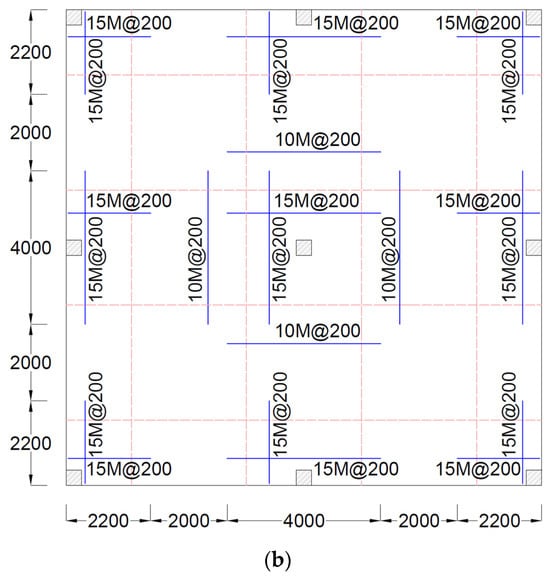
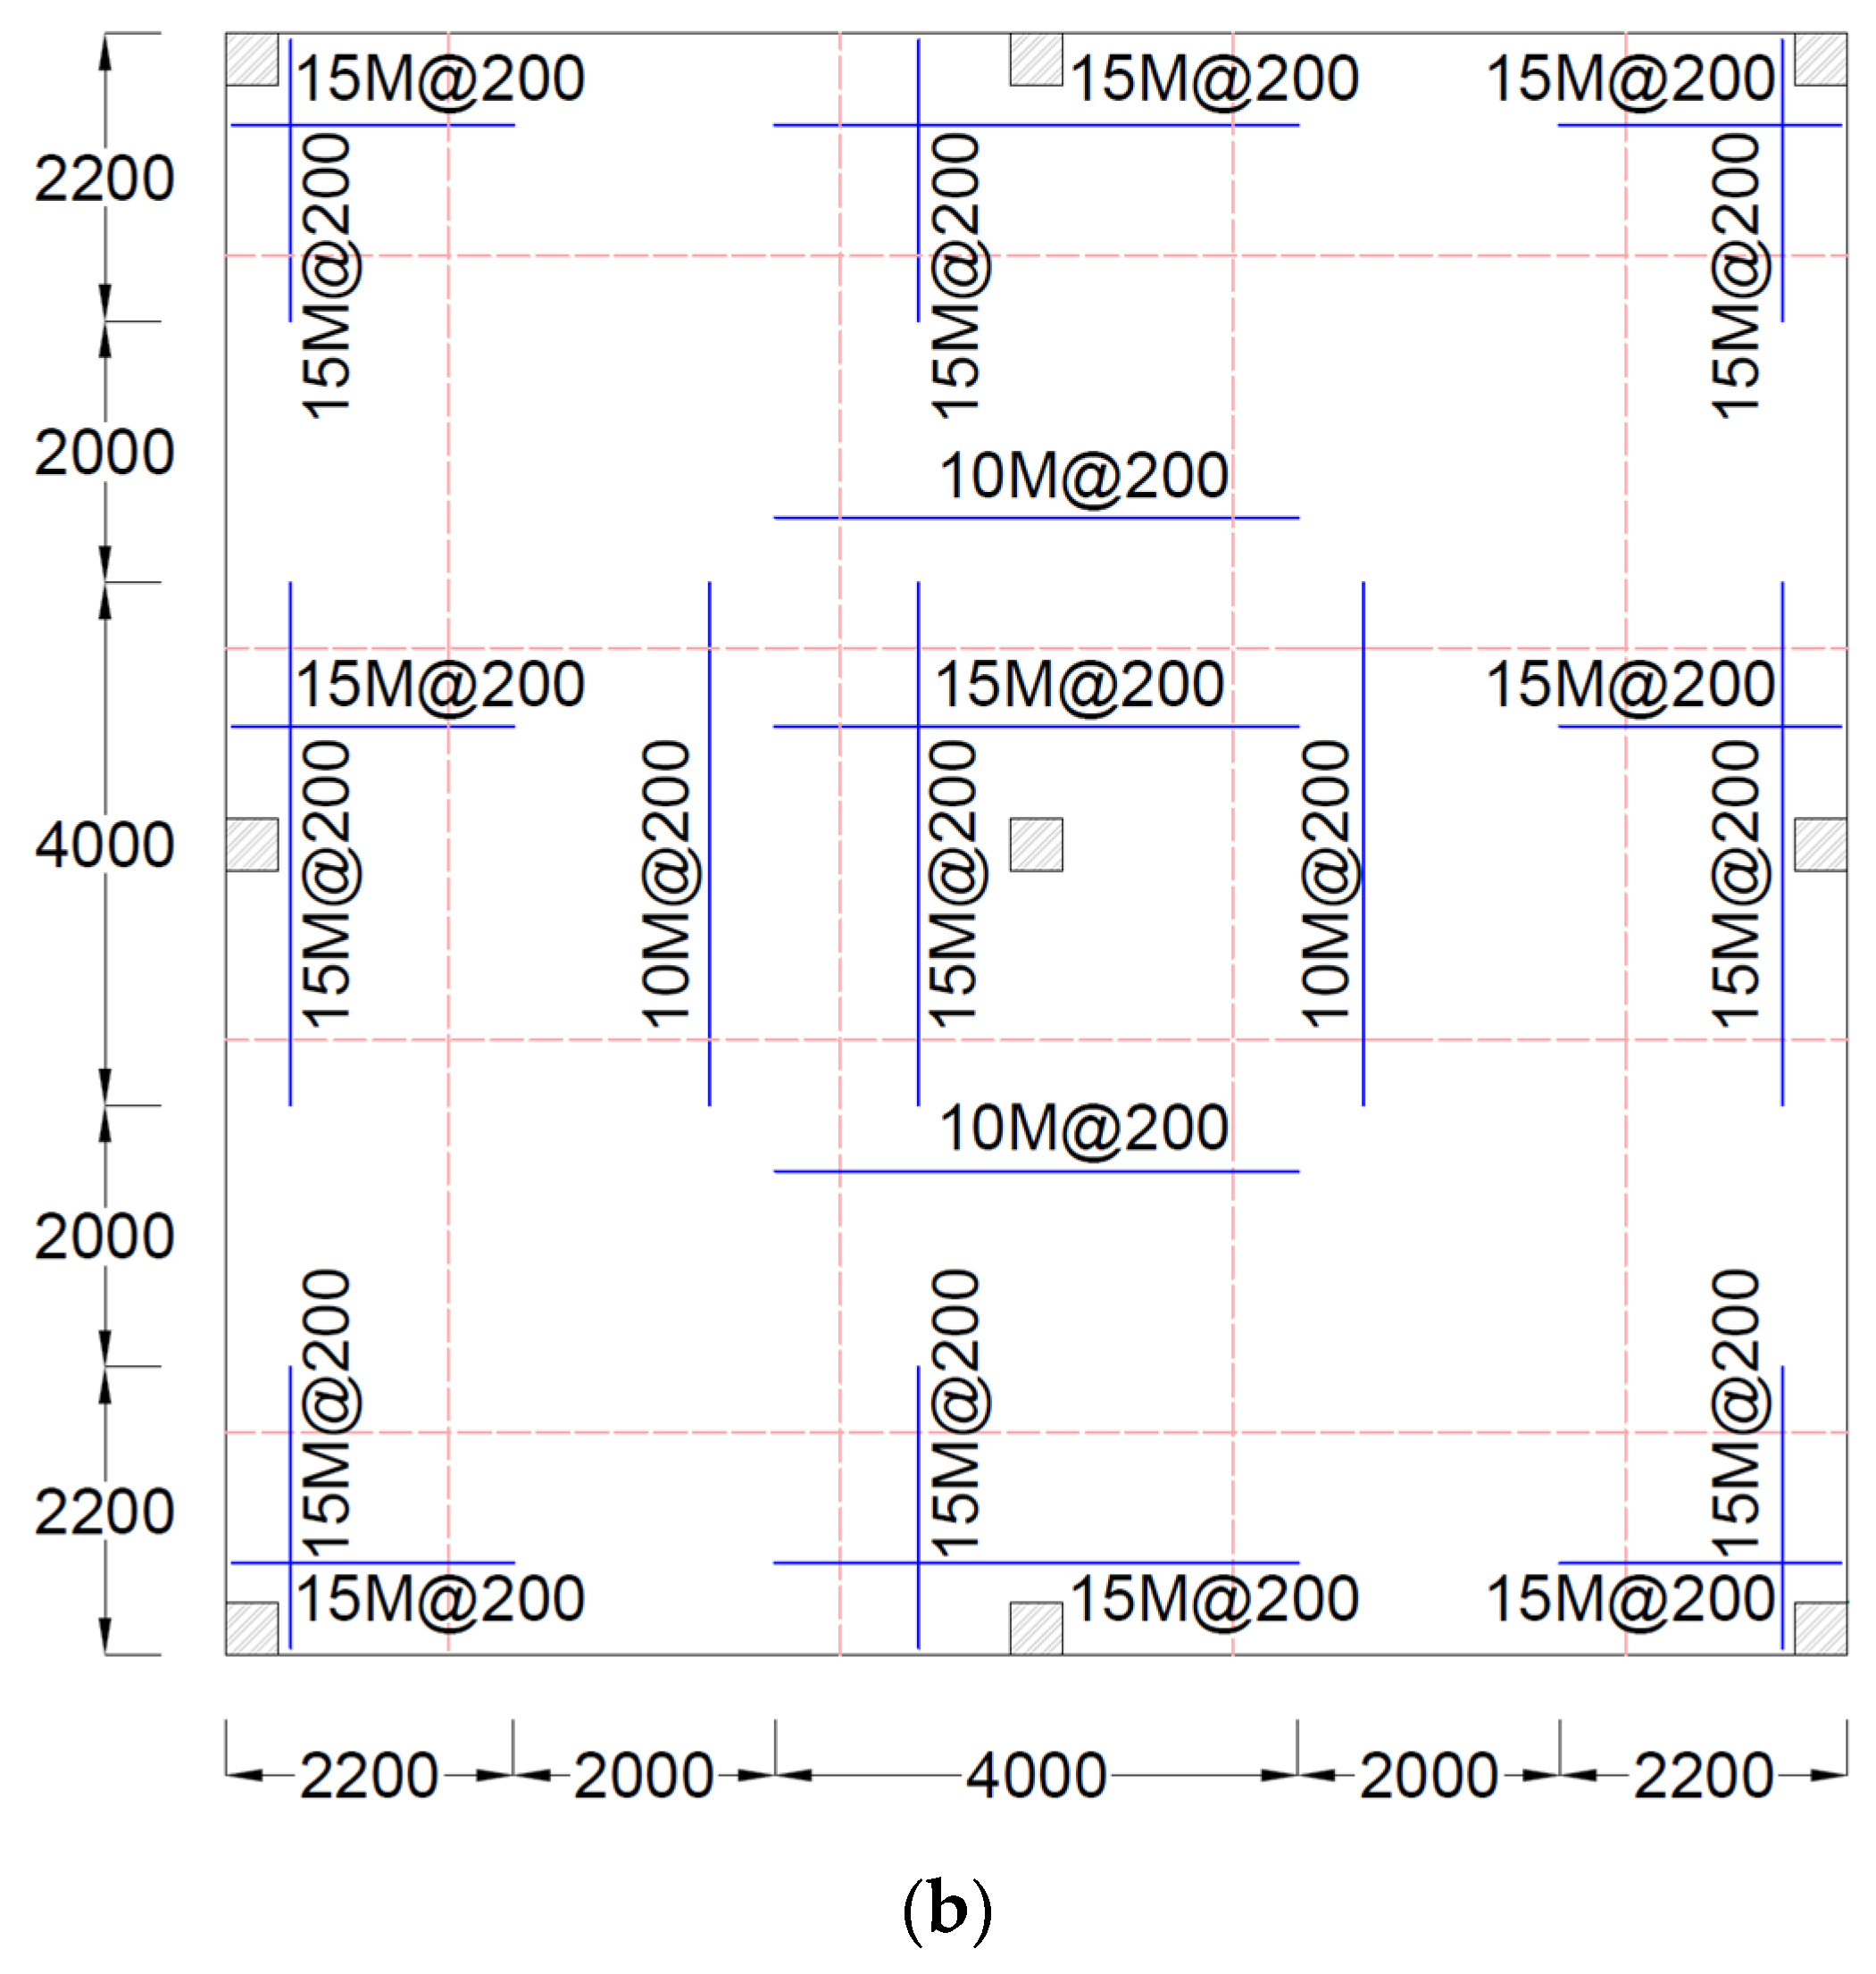
Figure 4.
Reinforcement layout in the prototype slab [Dimensions in mm]: (a) Bottom reinforcement layout and (b) Top reinforcement layout.
4. Fire Scenarios
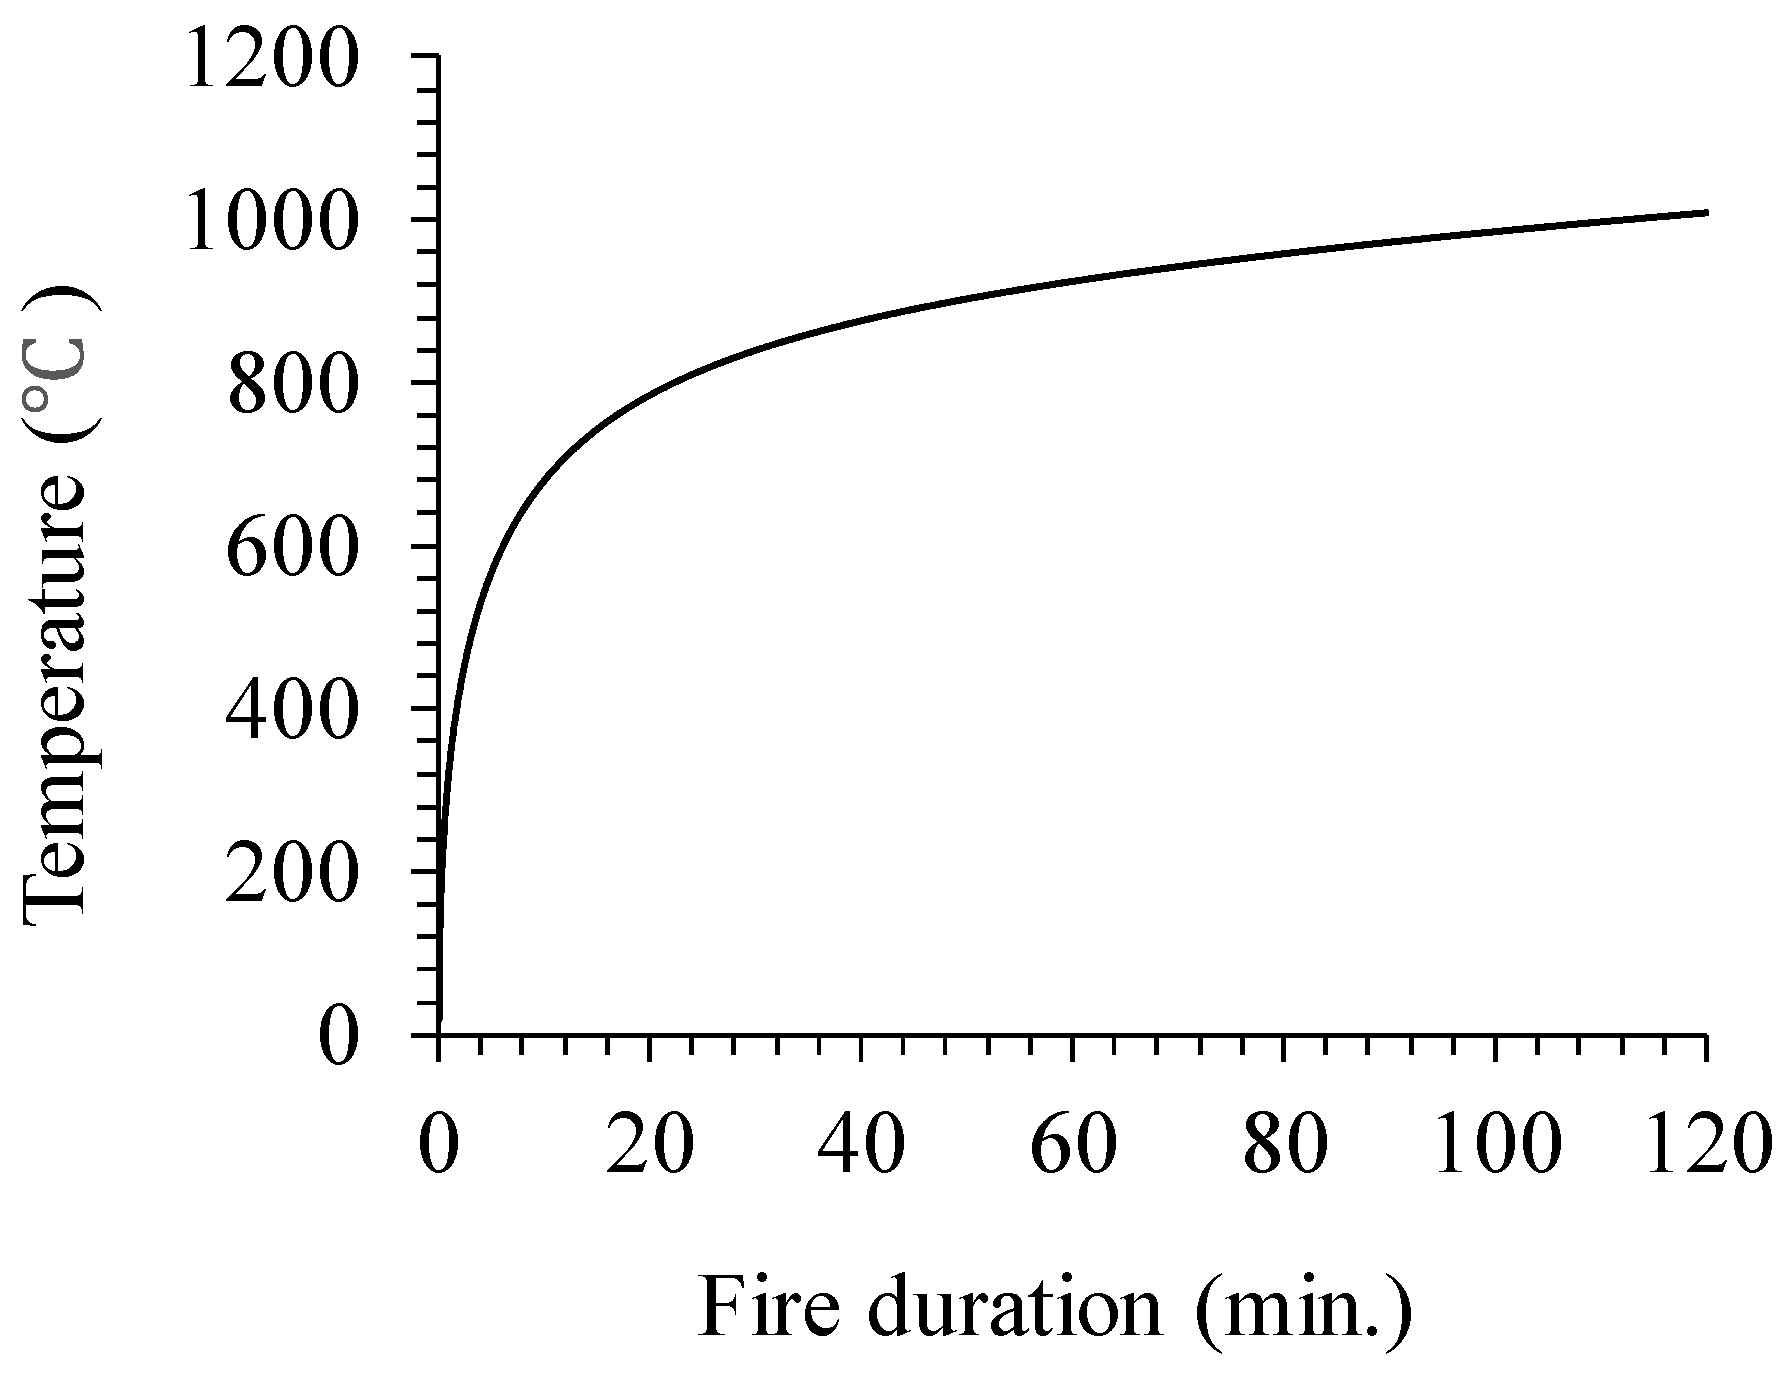
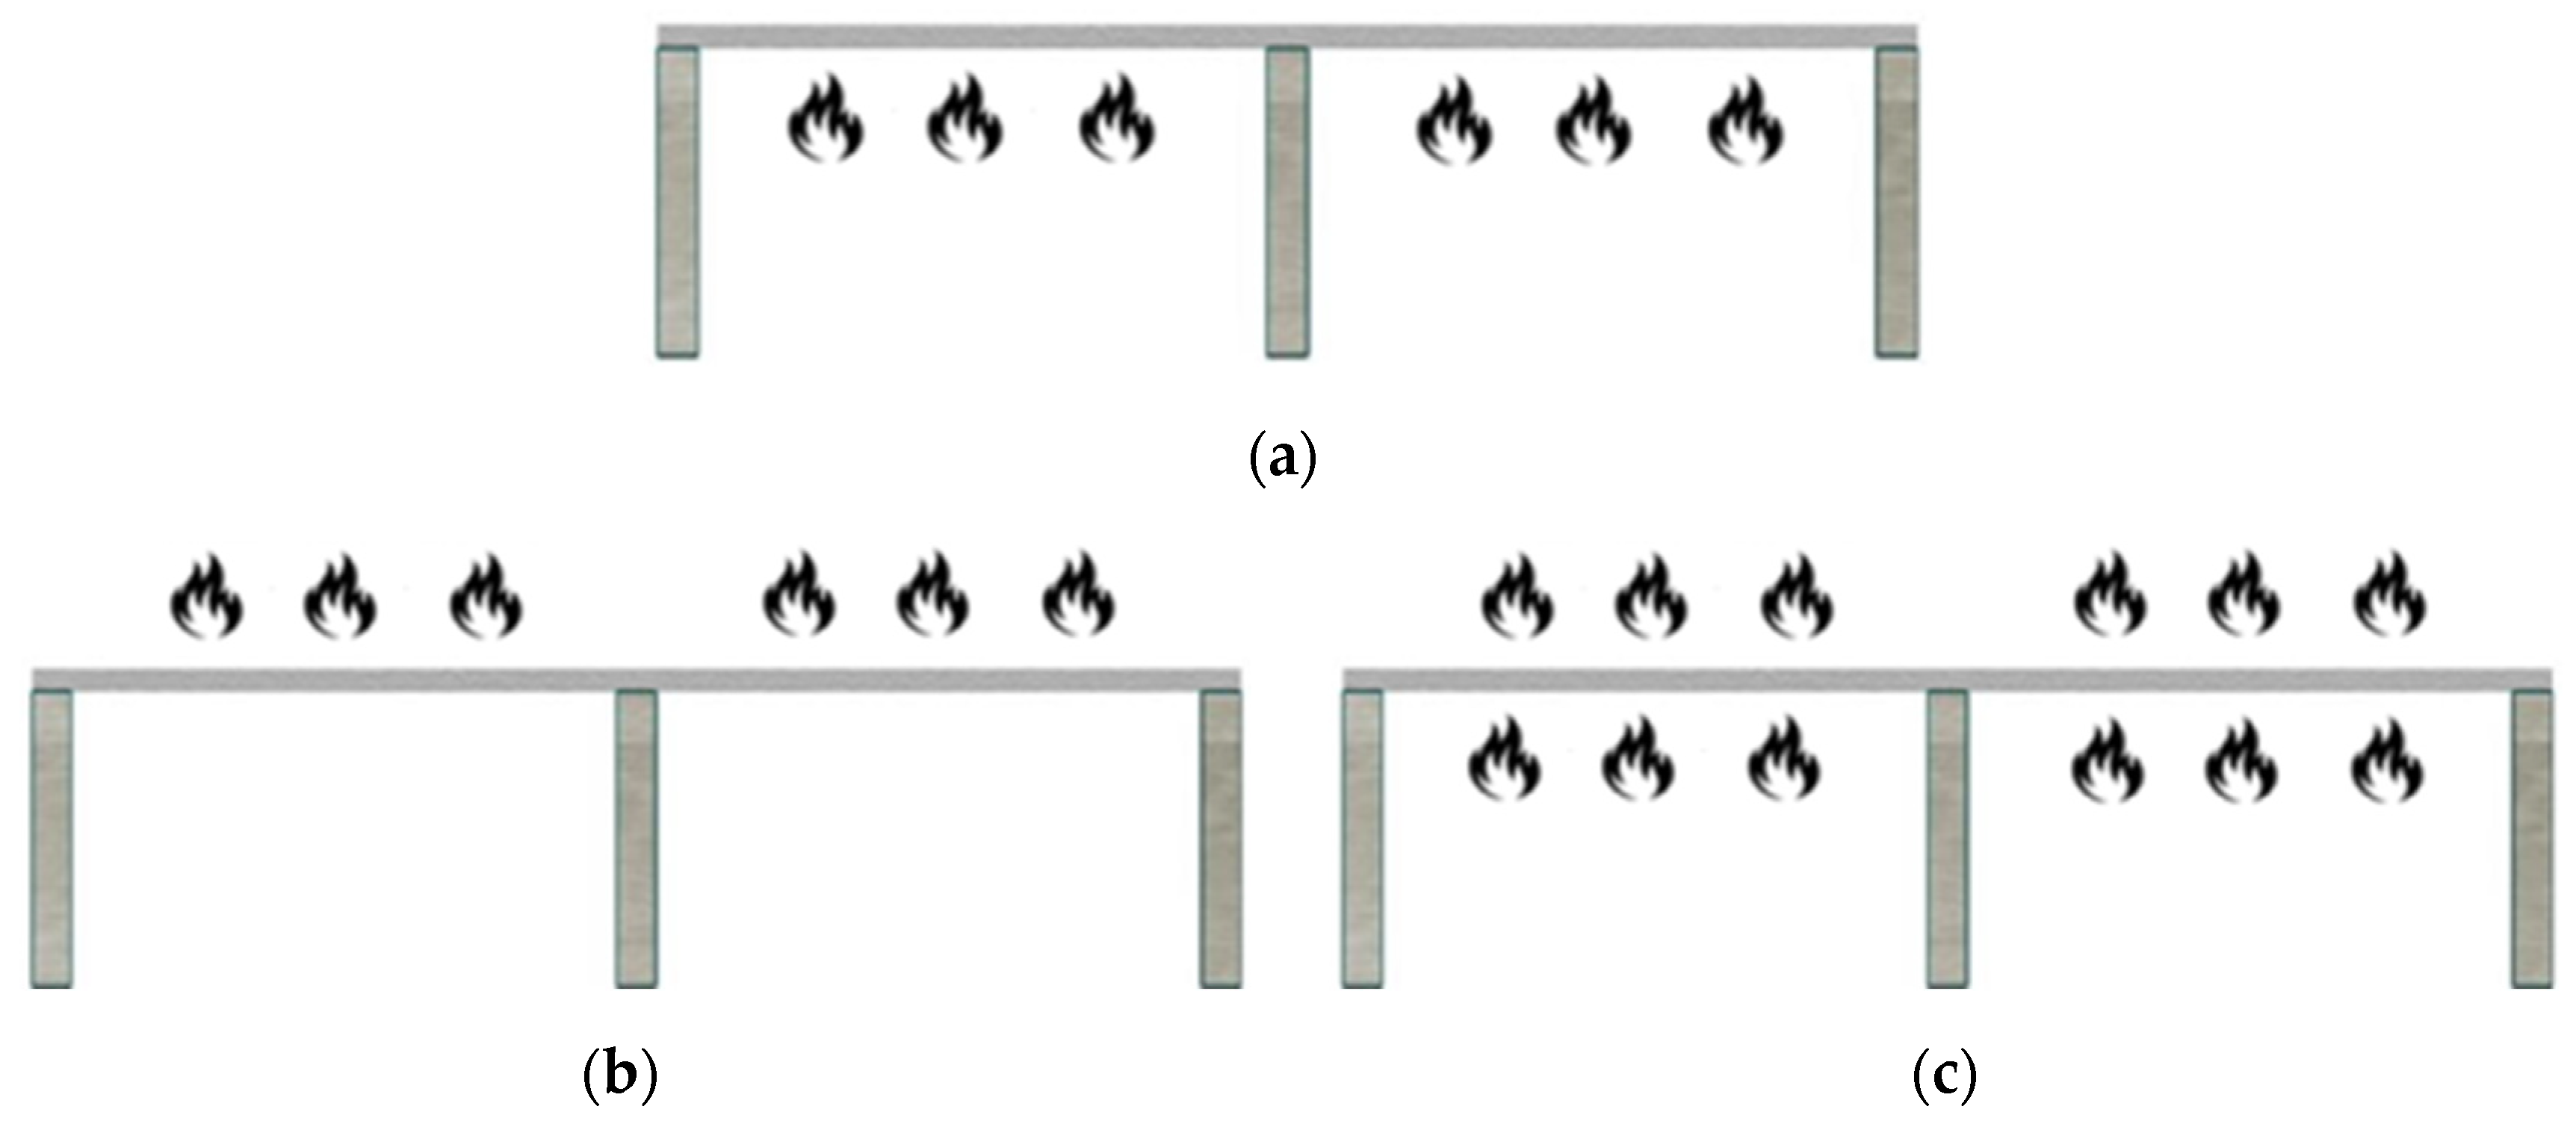
The analysis considers the ASTM E119 standard fire (Figure 5), which represents a time–temperature curve widely utilized for simulating internal building fires. This curve simulates fully developed fires without the decay periods under standardized conditions. Three fire scenarios were considered, in which the flat slab was exposed to the ASTM E119 standard fire at its bottom, top, and both surfaces (Figure 6). Bottom-surface exposure represents typical compartment fires, where flames and hot gases accumulate below the slab. Top-surface exposure simulates less common scenarios, such as roof fires or external flame impingement. In contrast, both-surface exposure represents extreme conditions, such as multi-storey fire involvement or complete structural engulfment. During fire exposure, the prototype structure is subjected to dead loads plus 50% of the live loads, as specified in Eurocode (CEN, 2002a) [4].
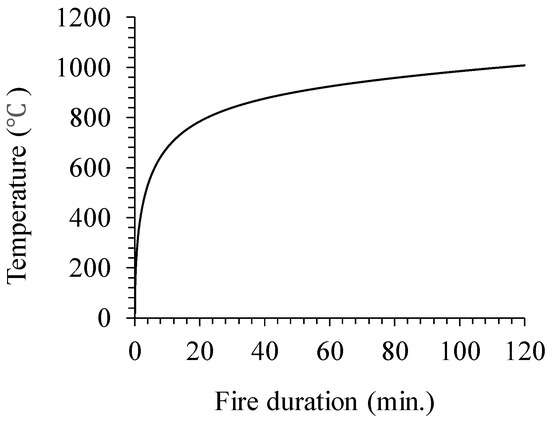
Figure 5.
ASTM fire curve.
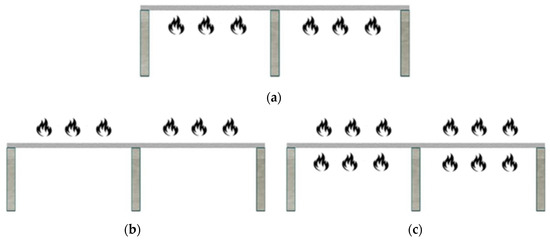
Figure 6.
Prototype fire exposure scenarios: (a) Fire exposure at the bottom surface, (b) Fire exposure at the top surface, and (c) Fire exposure on both surfaces.
5. Modelling Procedure for Flat Plate Structures Subjected to Fire
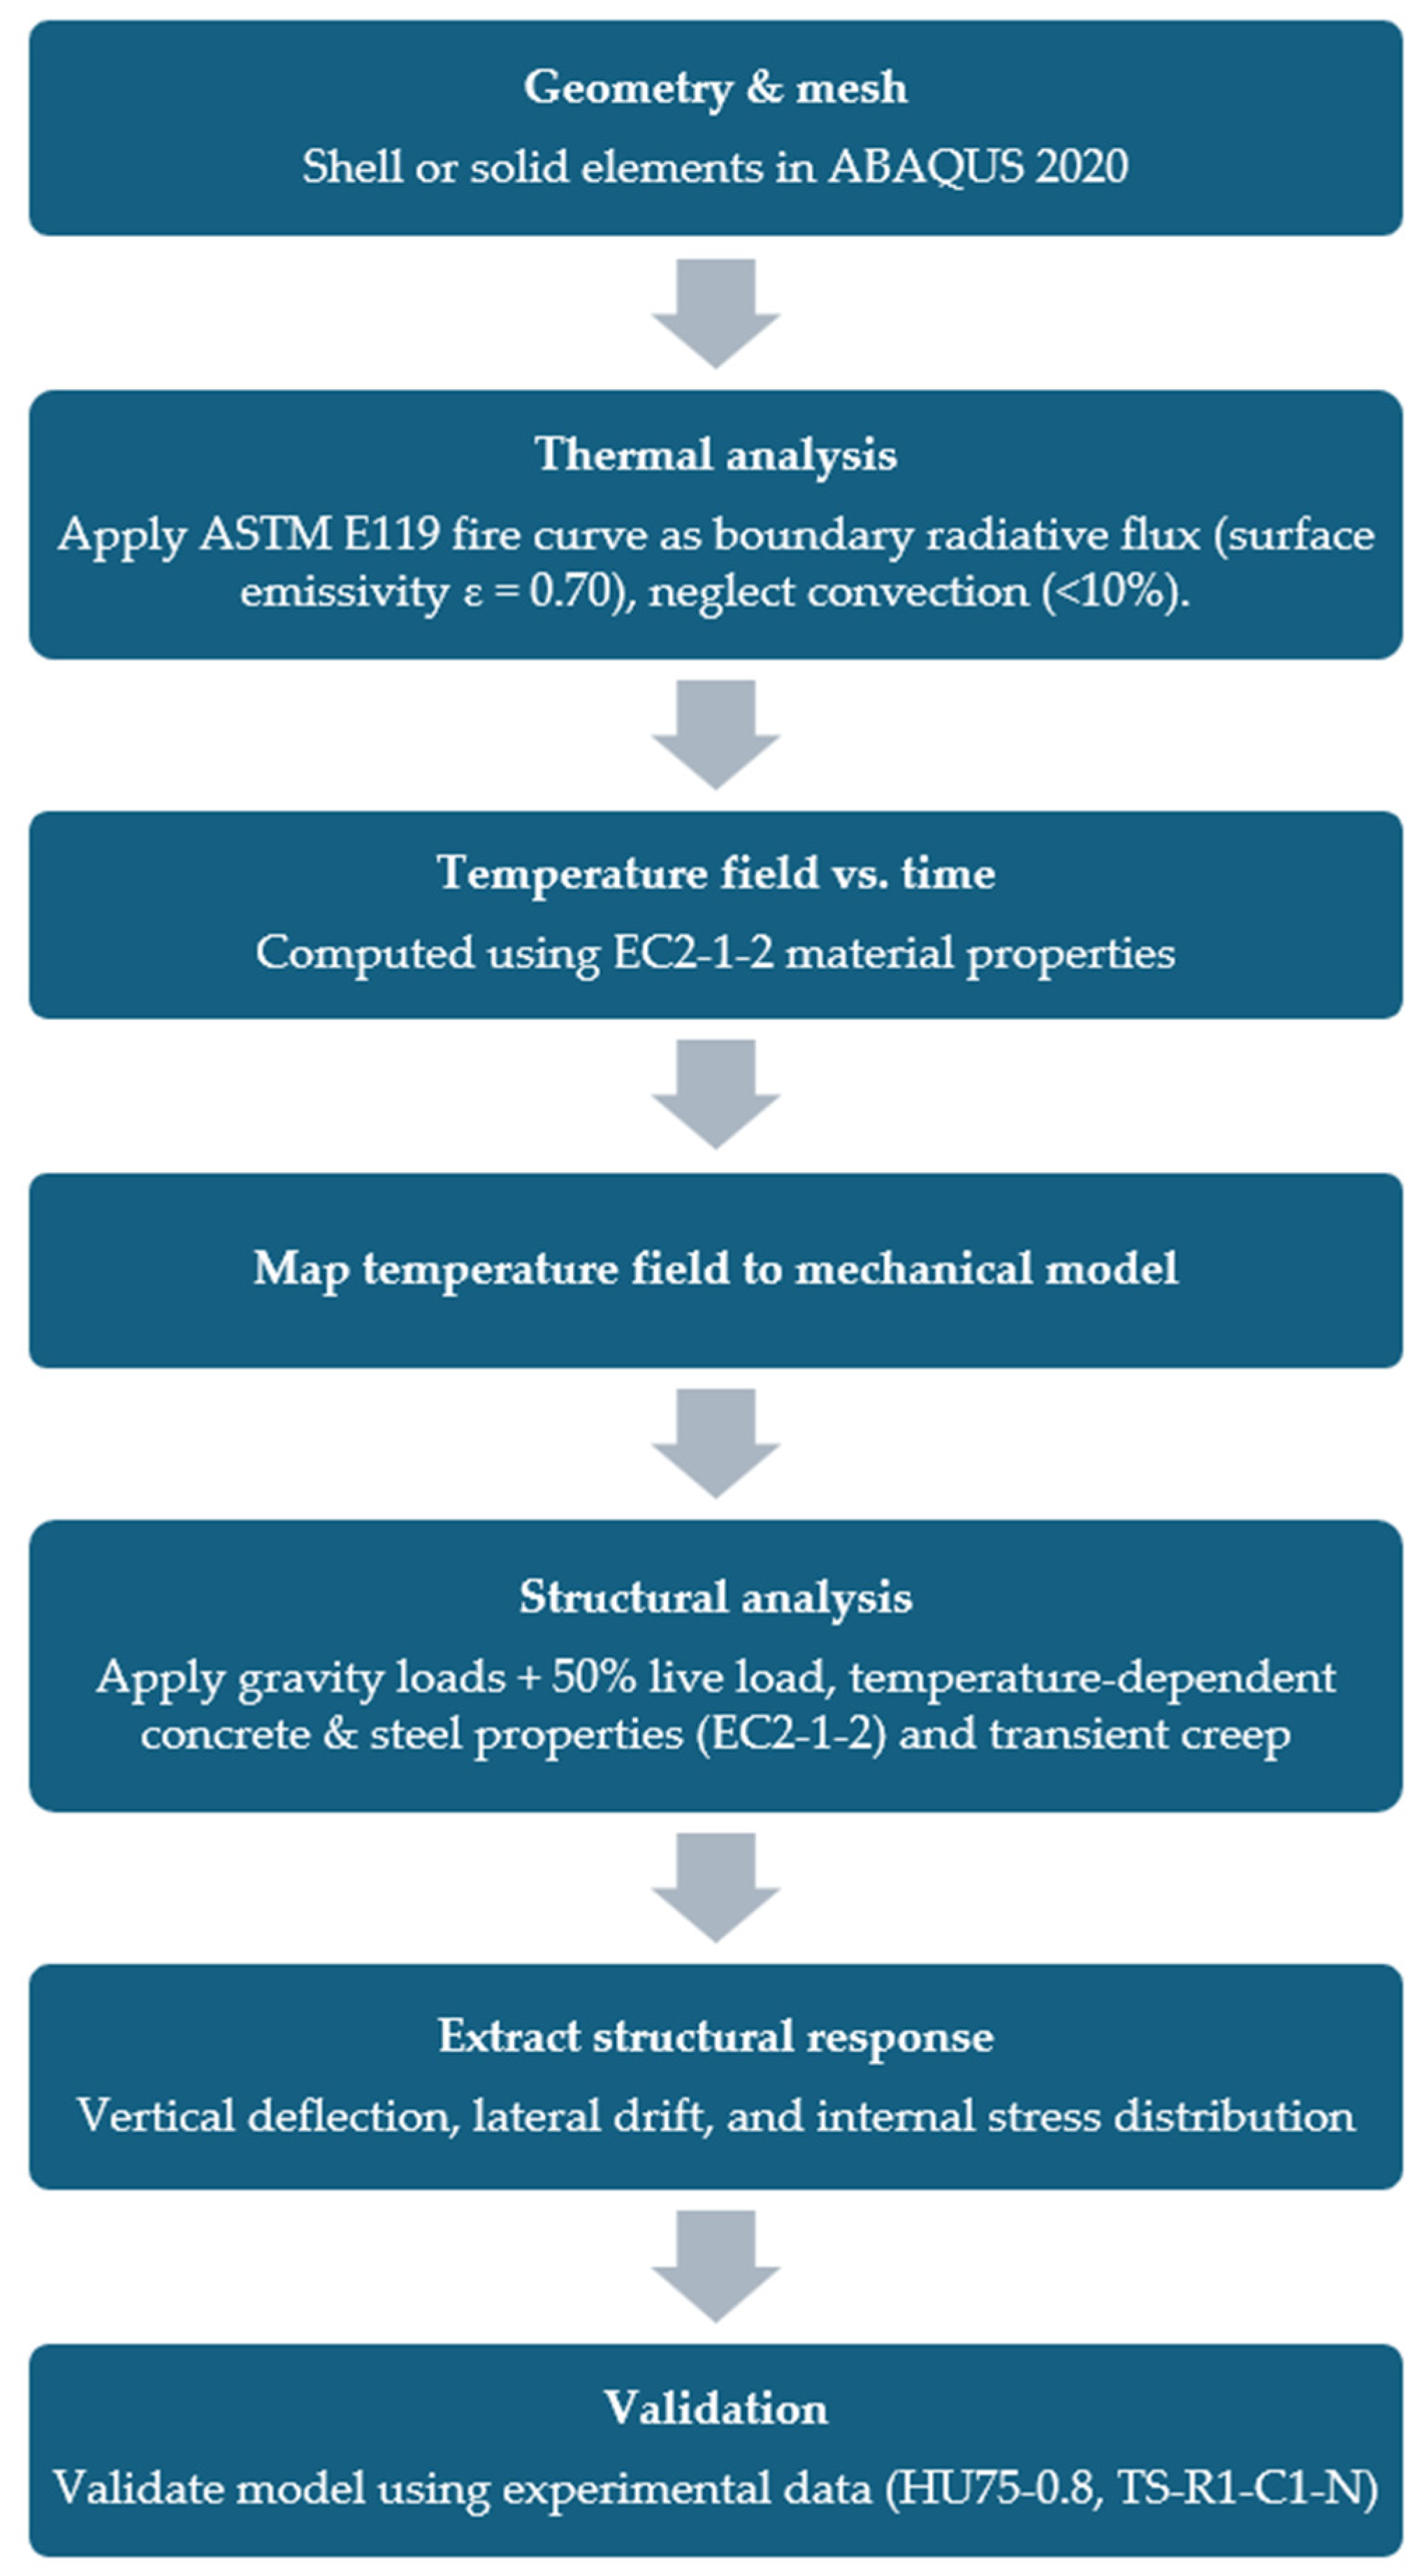
The thermal and structural behaviour of flat plate structures exposed to fire was studied using a sequentially coupled thermo-mechanical analysis. The procedure, illustrated in Figure 7, outlines the main modelling steps.
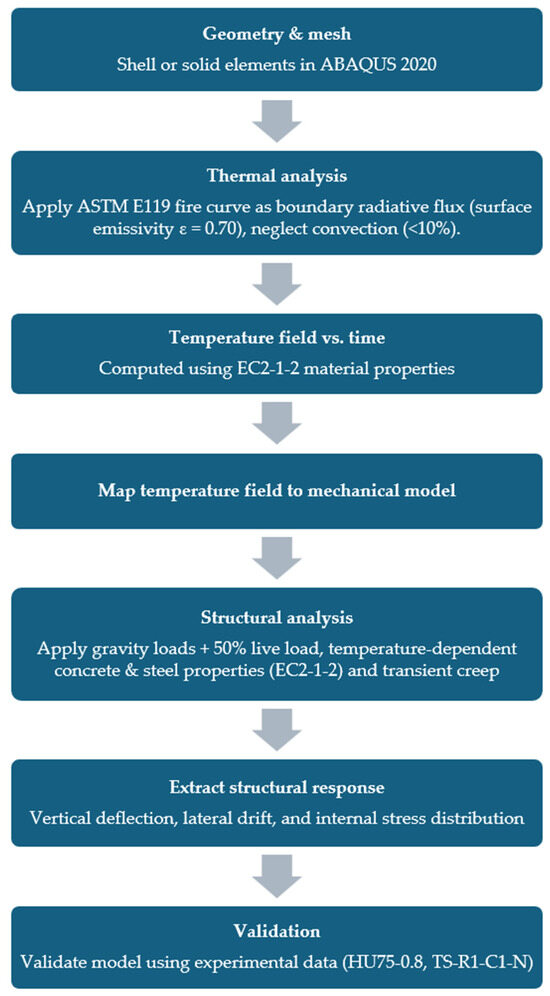
Figure 7.
Thermo–mechanical coupling workflow.
The process begins with developing the structural geometry in ABAQUS 2020 using shell or solid elements. In the thermal analysis, the ASTM E119 fire curve is applied as radiative flux (emissivity = 0.70), while convection is neglected due to its minor influence (<10%). Temperature fields are computed over time using material properties from Eurocode 2 (EC2-1-2) and then mapped onto the mechanical model.
The structural analysis encompasses gravity loads plus a 50% live load, considering temperature-dependent properties of concrete and steel, as well as transient creep effects. Key outputs include deflection, drift, and internal stresses.
To validate the accuracy of the shell element model, a mesh convergence study was conducted. The mesh was refined from an initial element size of 210 mm to a finer size of 105 mm. This refinement resulted in a change of less than 3% in the peak mid-span deflection, indicating that the solution is mesh-independent and that further refinement yields negligible differences in results. This small change confirms the adequacy of the chosen mesh density for capturing the structural response under fire exposure.
Finally, the numerical results are validated against experimental data from tested slabs (HU75-0.8 and TS-R1-C1-N), confirming the accuracy of the model.
6. Shell Modelling of Prototype
The sensitivity study of George [6] on slab–column specimens examined three mesh sizes: small, medium, and large, corresponding to 0.5, 1.0, and 1.5 times the slab thickness, respectively. Results indicated that small and medium meshes initially exhibited similar responses. However, convergence issues arose with the smallest mesh at higher levels of deformation. Based on their finding, employing mesh sizes equal to or smaller than the slab thickness ensures computational efficiency and accuracy [6]. Consequently, their shell model [6] used a mesh size equal to the slab thickness to ensure efficient calculations, prevent convergence issues, and maintain sufficient accuracy.
The prototype slab was divided into zones based on the reinforcement layout, as shown in Figure 8. Then, the entire floor slab was modelled using a mesh size equal to the slab thickness for thermal and structural modelling.

Figure 8.
Reinforcement zones in the prototype flat slab.
The concrete slab was modelled using a 4-node heat transfer quadrilateral shell element (DS4) in the thermal analysis stage. The rebars were not modelled as ABAQUS does not allow reinforcement to be considered during thermal analysis when using the shell modelling technique. Columns were modelled using a 2-node heat transfer link element (DC1D2). In the structural analysis stage, reinforcement was incorporated using the Rebar Layers option in ABAQUS, which represents reinforcement as smeared steel layers within the shell elements. This approach simplifies the modelling of bond interactions while effectively capturing the contribution of the rebars to structural stiffness and strength.
The floor slab was subjected to the three aforementioned fire scenarios. Following the recommendations of Lie [20], convection was neglected in the thermal analysis because it contributes less than 10% to the total heat transfer, as noted by Lie [20]. For the fire exposure simulation, the ASTM E119 standard fire curve was applied for two hours, with heat transfer to the slab’s surface modelled primarily through radiation, using an emissivity value of 0.7.
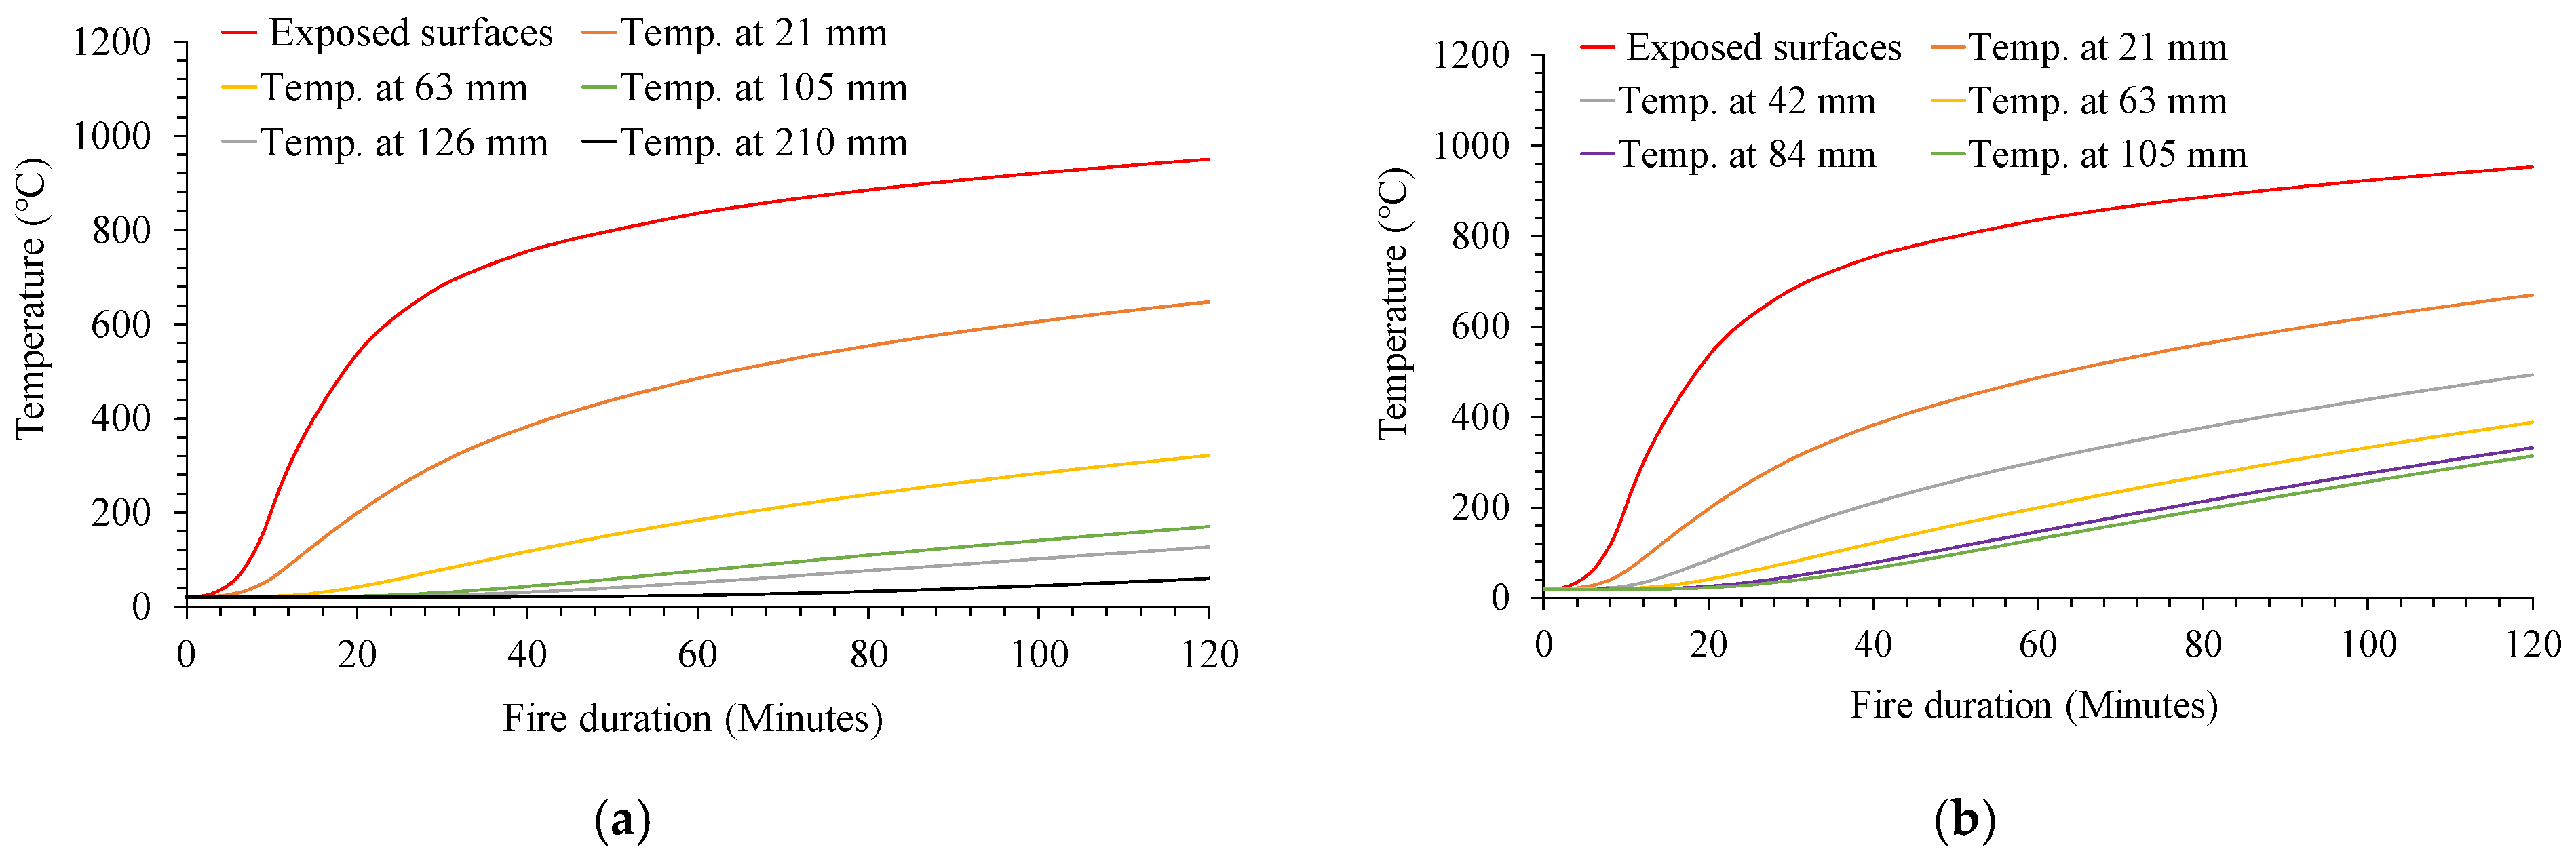
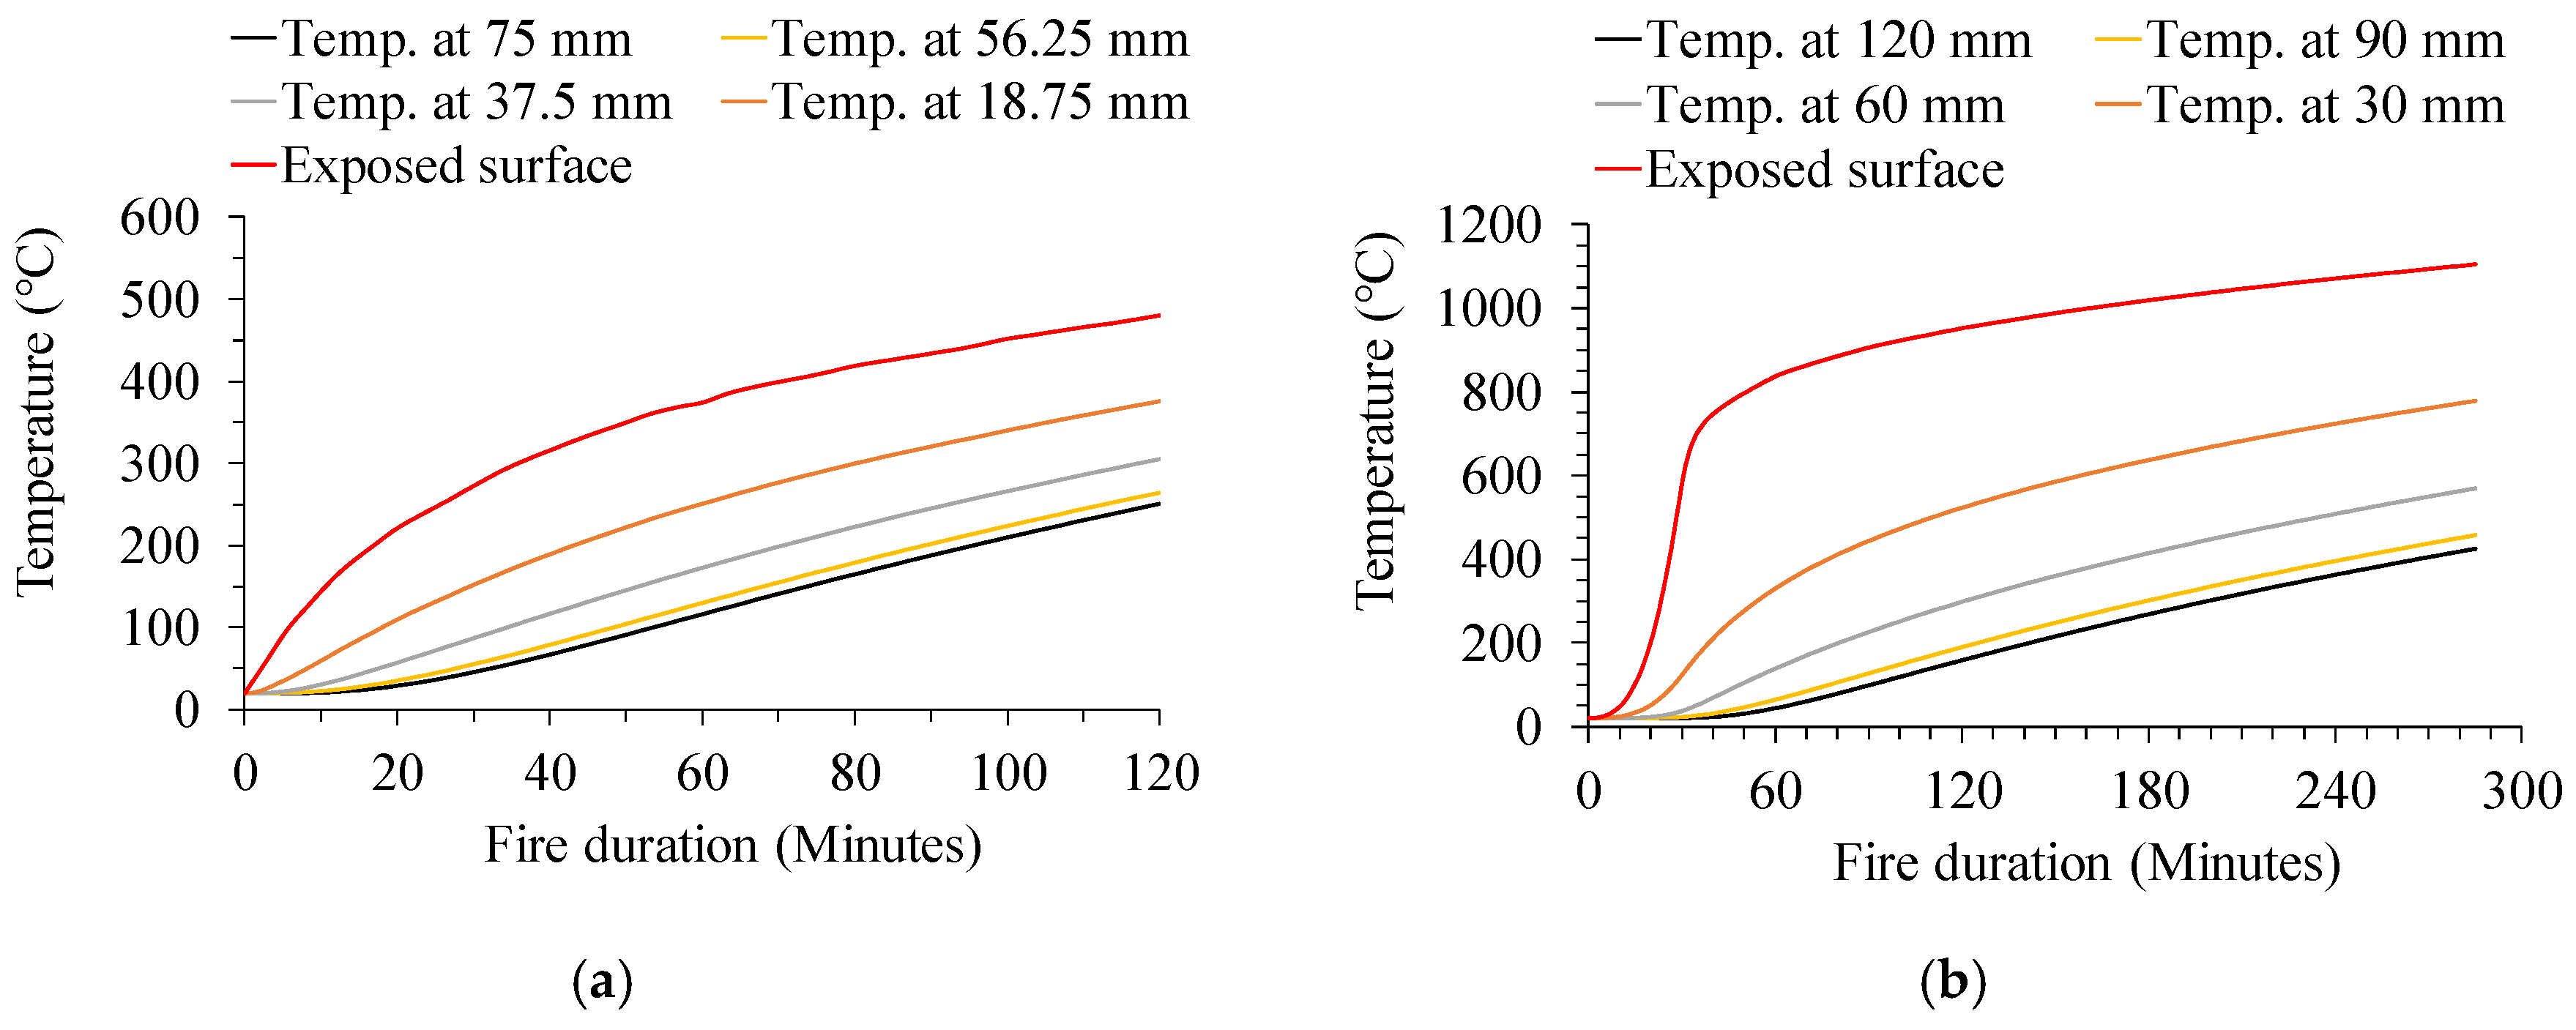
Figure 9 presents the temperature distribution at various points within the slab thickness over time. For one-sided fire exposure (either the bottom or top surface), as shown in Figure 9a, the temperature variation is depicted across the full slab thickness. The unexposed surface (e.g., at 210 mm) experiences significantly lower temperatures due to the insulating properties of the concrete. For fire exposure on both sides, Figure 9b shows the variation for half the slab thickness as the temperature distribution is symmetric around the slab centroid. While the temperatures near the exposed surface are similar in both scenarios, the unexposed surface in the one-sided fire exposure case exhibits a significantly smaller temperature increase, as shown in Figure 9a.
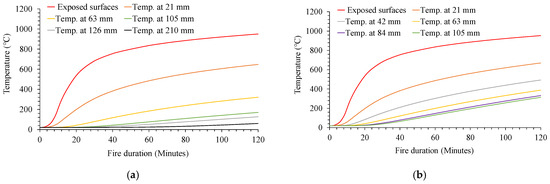
Figure 9.
Temperature at points through the thickness of the slab at different fire durations: (a) Fire exposure at the bottom or top surface and (b) Fire exposure at both the top and bottom surfaces.
The same thermal mesh was utilized for the structural analysis. The slab was modelled using a 4-node doubly curved shell element with reduced integration, hourglass control, and FE strain capabilities (S4R), where the rebars were simulated as a steel layer integrated within the shell element. The columns were modelled using a 2-node linear beam element (B31).
The connections between the slab’s and column’s elements were achieved using surface-to-surface contact with master–slave interaction. The columns were fixed at their base. The predicted temperatures from the thermal model were incorporated into the stress analysis model, which utilized the ABAQUS general static solver.
6.1. Impact of Concrete Tensile Stress on the FE Predictions
The definition of concrete tensile behaviour is crucial for accurately modelling fire-exposed slabs using ABAQUS. A reliable tensile stress–strain relationship is essential, requiring a careful definition of tensile strength and tensile stress at ultimate tensile strain. The literature review revealed that a simplified bilinear tension model is commonly utilized. This model should be adequate for the analysis; however, the definition of the parameters that determine the curve is expected to impact the analysis significantly.
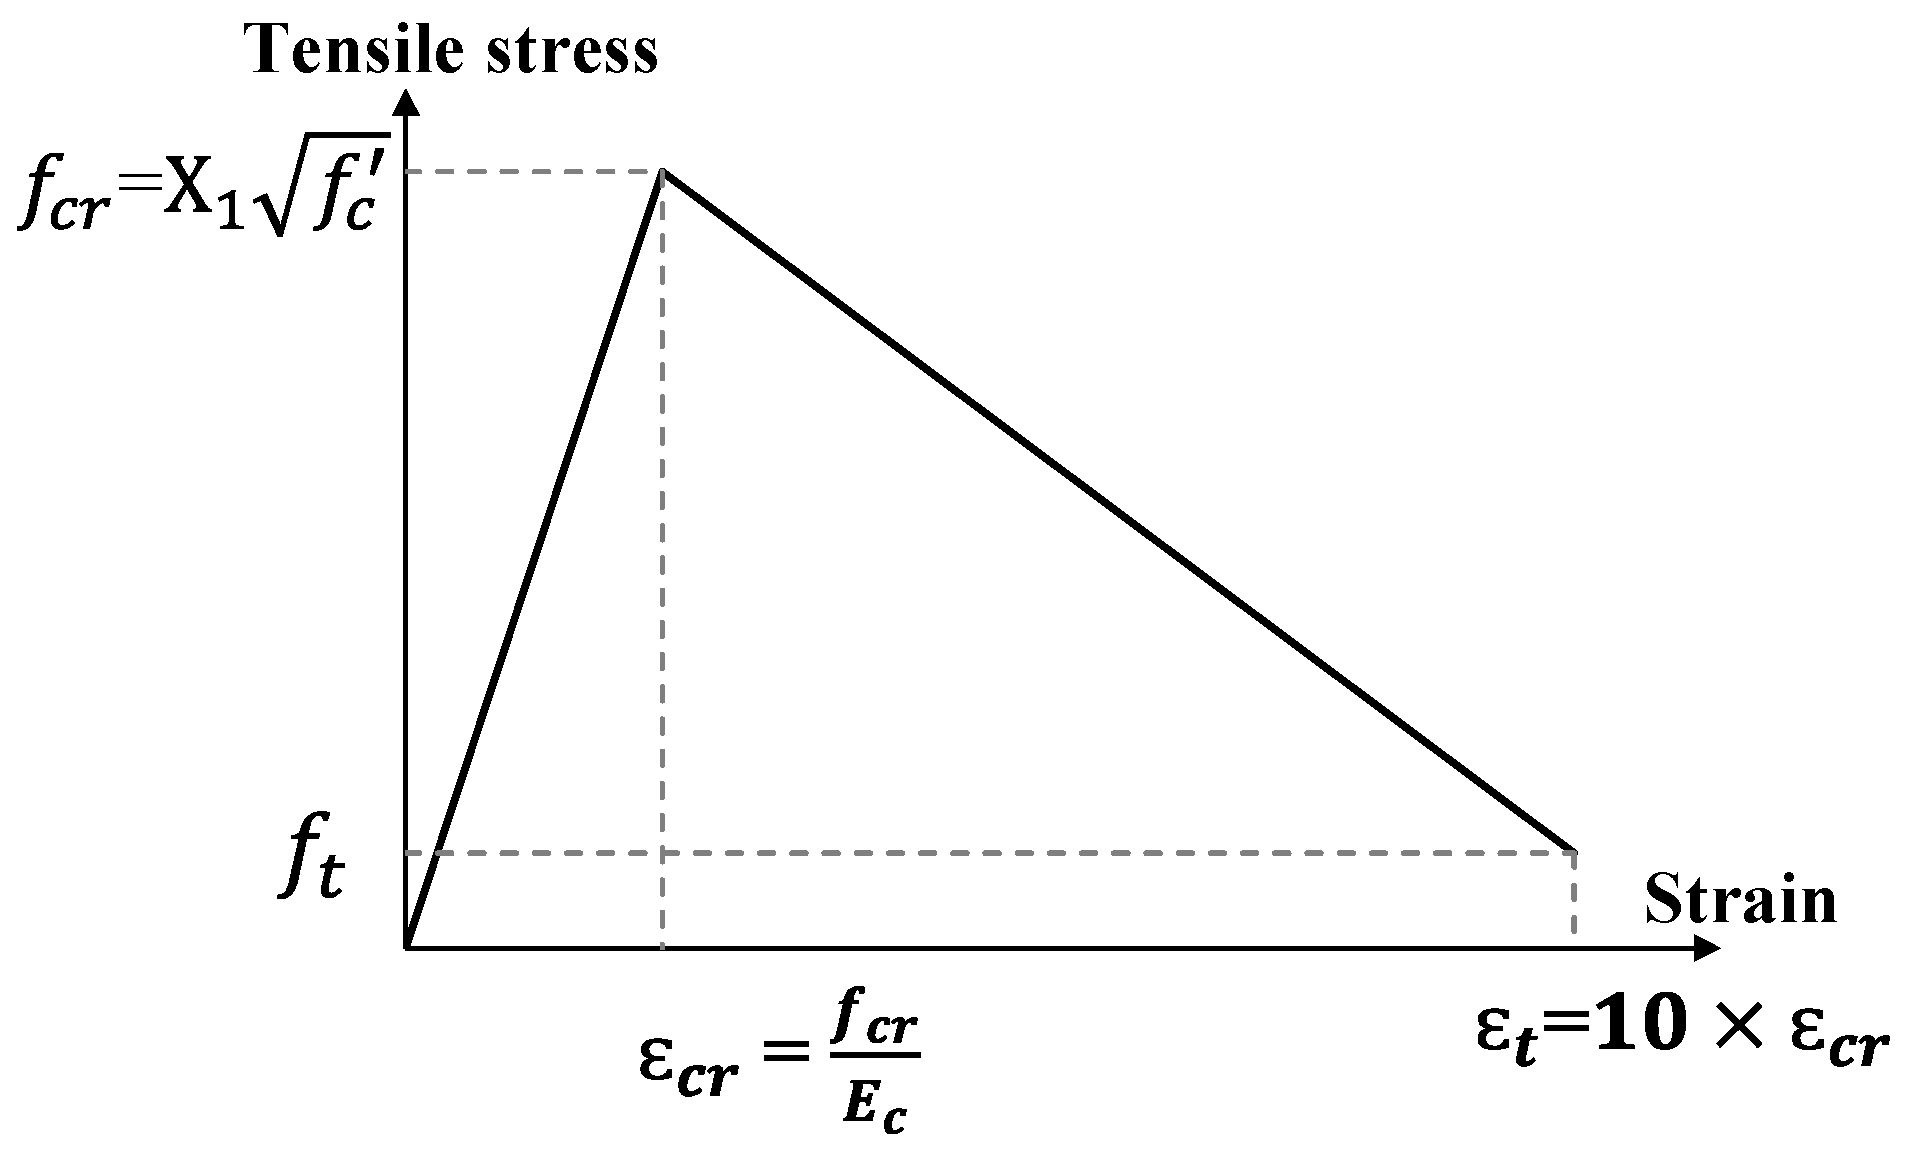
At ambient temperature, the tensile strength , can be taken equal to , where is a reduction factor. The strain-softening branch of the curves starts at and ends at a strain of , corresponding to zero tensile stress. George & Tian [6,13] proposed using and values of 0.2 and 10.0. At elevated temperatures, the value of should be reduced following the Eurocode. In this section, the sensitivity of the predictions of the prototype to and values are examined.
Preliminary analysis revealed that the ambient temperature stress–strain relationship often resulted in numerical instability during simulations, particularly under high-deformation conditions. A modified stress–strain relationship, shown in Figure 10, was developed to address this issue. In this refined model, the stress corresponding to the ultimate tensile strain () was not set to zero but was calculated using Equation (4) from Collins and Mitchell [25]. This adjustment improved numerical stability, ensuring the model could effectively handle large deformations.
where α1 accounts for the bond characteristics of reinforcing bars and has a value of 1.0 for deformed bars and 0.7 for plain bars. α2 reflects the type of loading, with a value of 1.0 for short-term loading or 0.7 for sustained loading.

Figure 10.
Adopted tensile stress–strain relationship for concrete.
To examine the effect of the value assumed for on the analysis results, analysis of the prototype structure was conducted using a fixed dilation angle (φ = 35°) and considering values based on was taken equal to 0.62, , and 0.124.
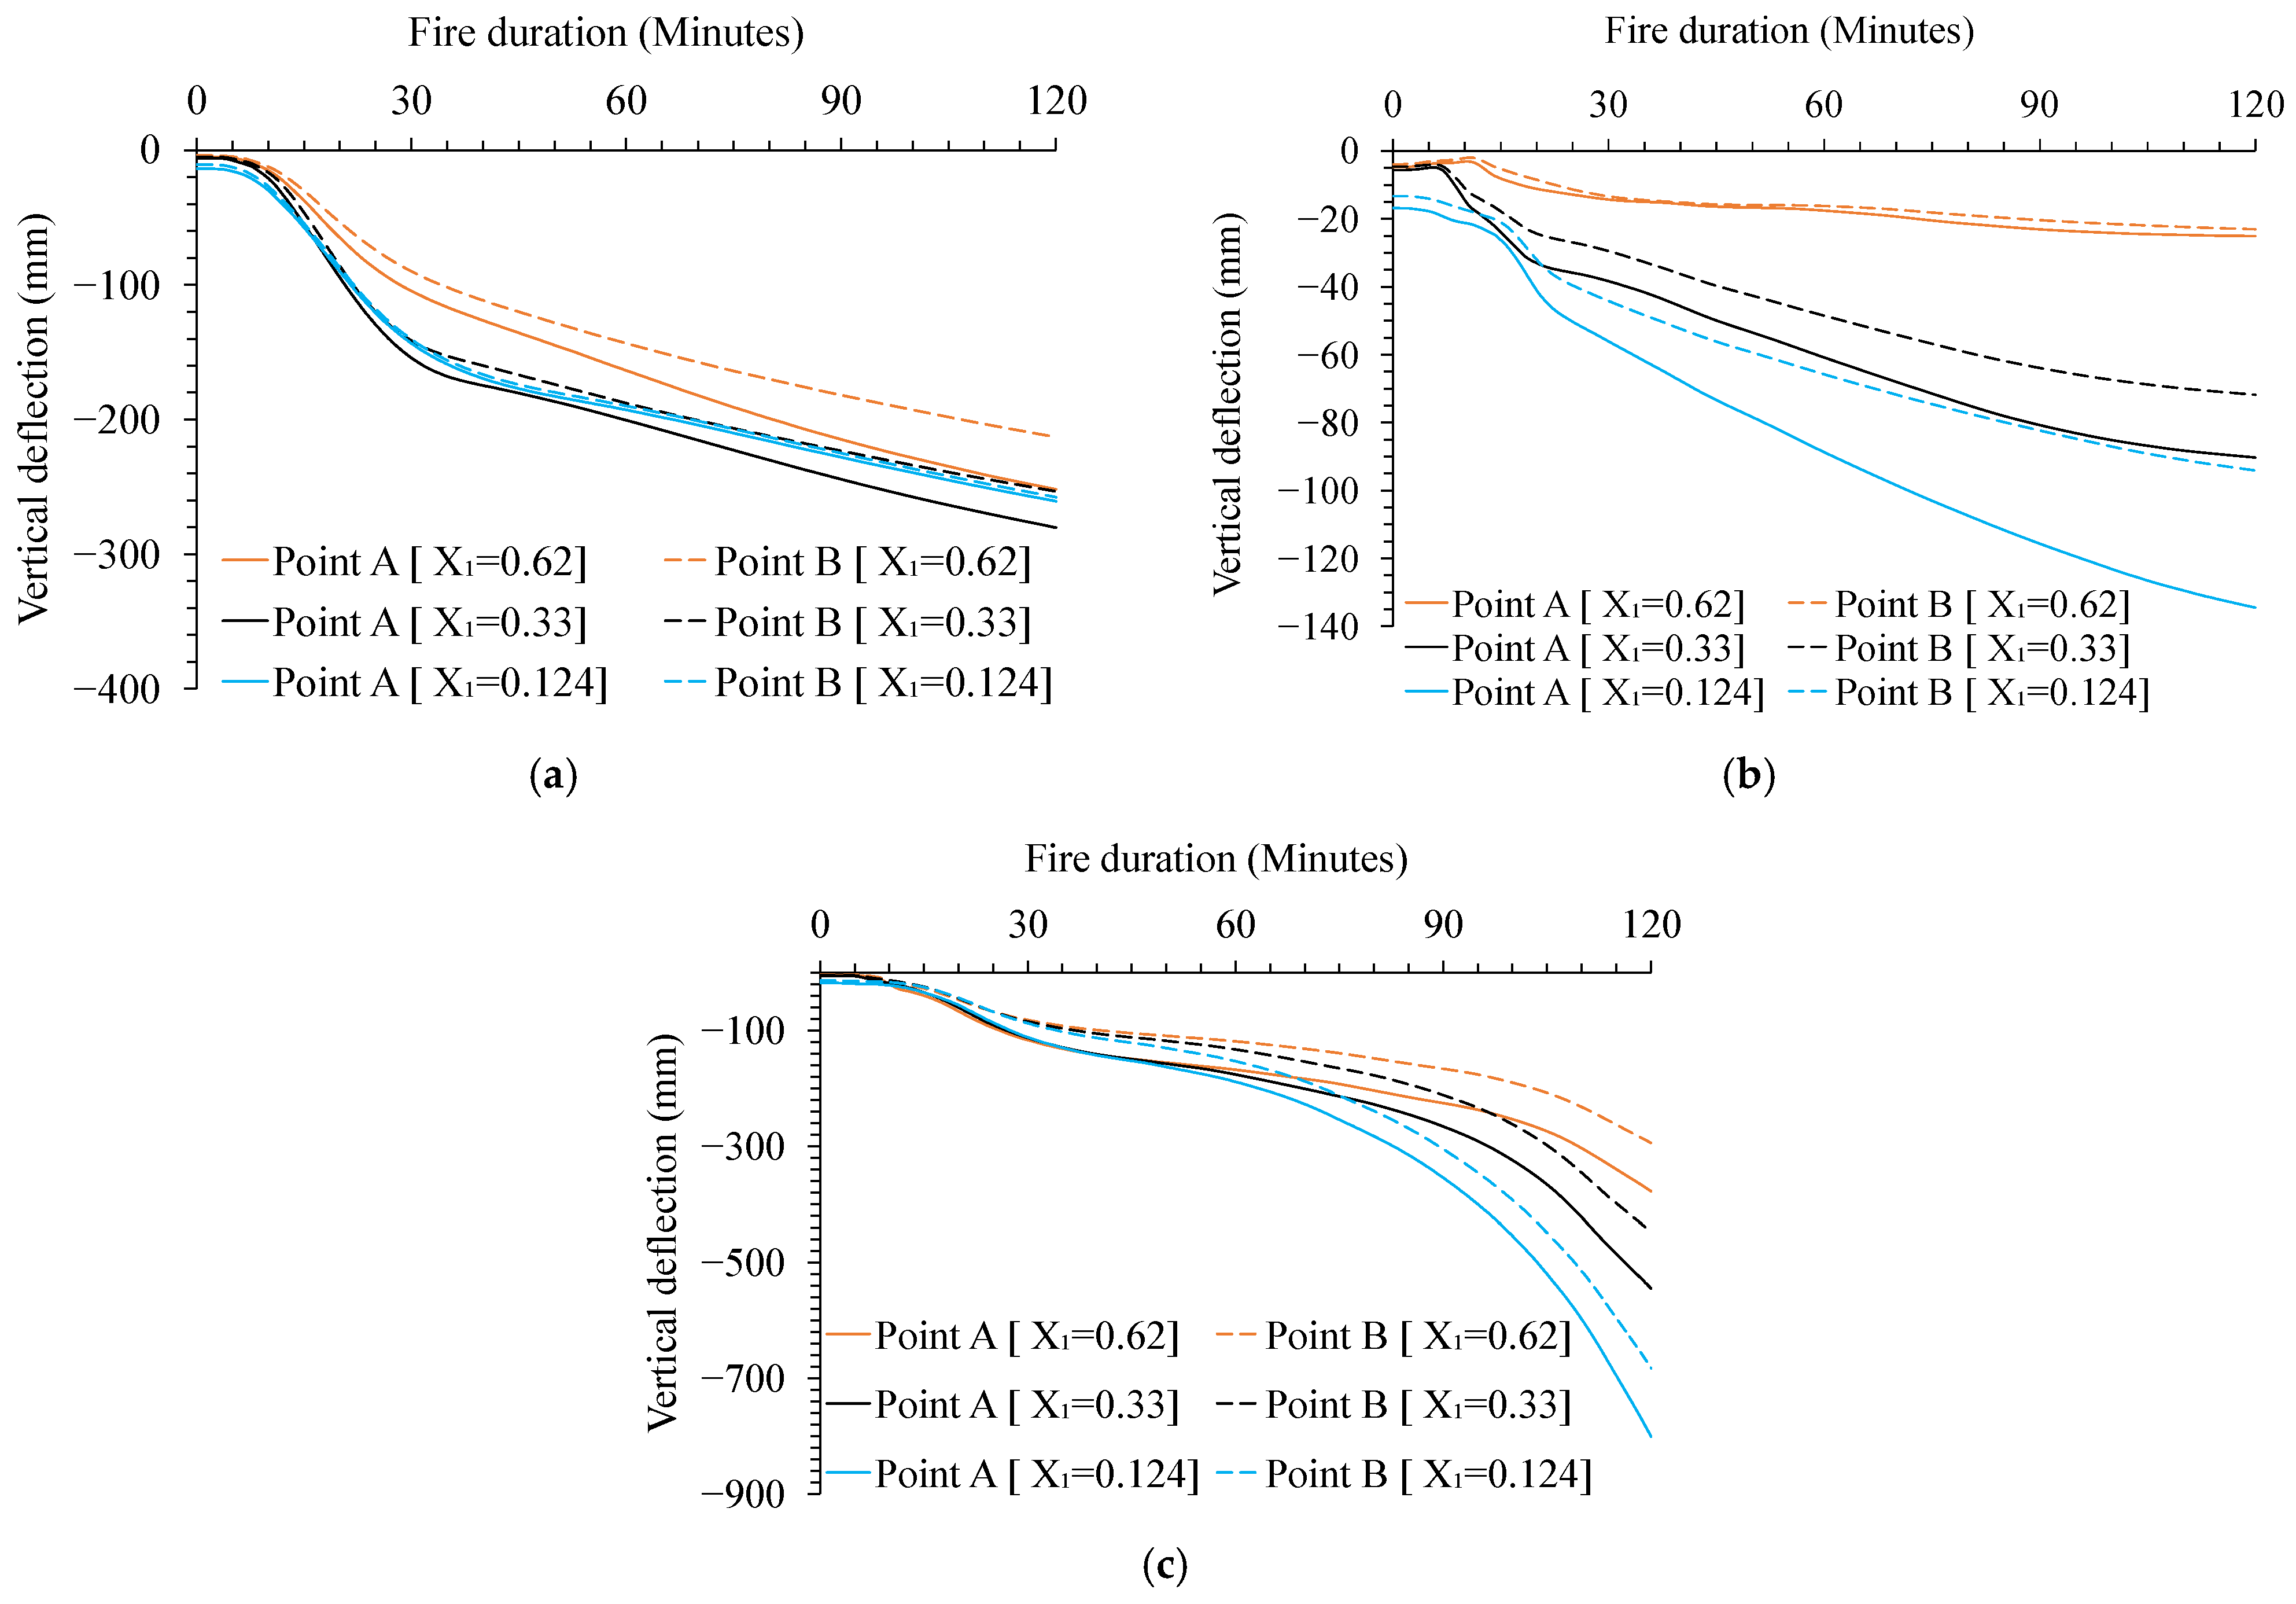
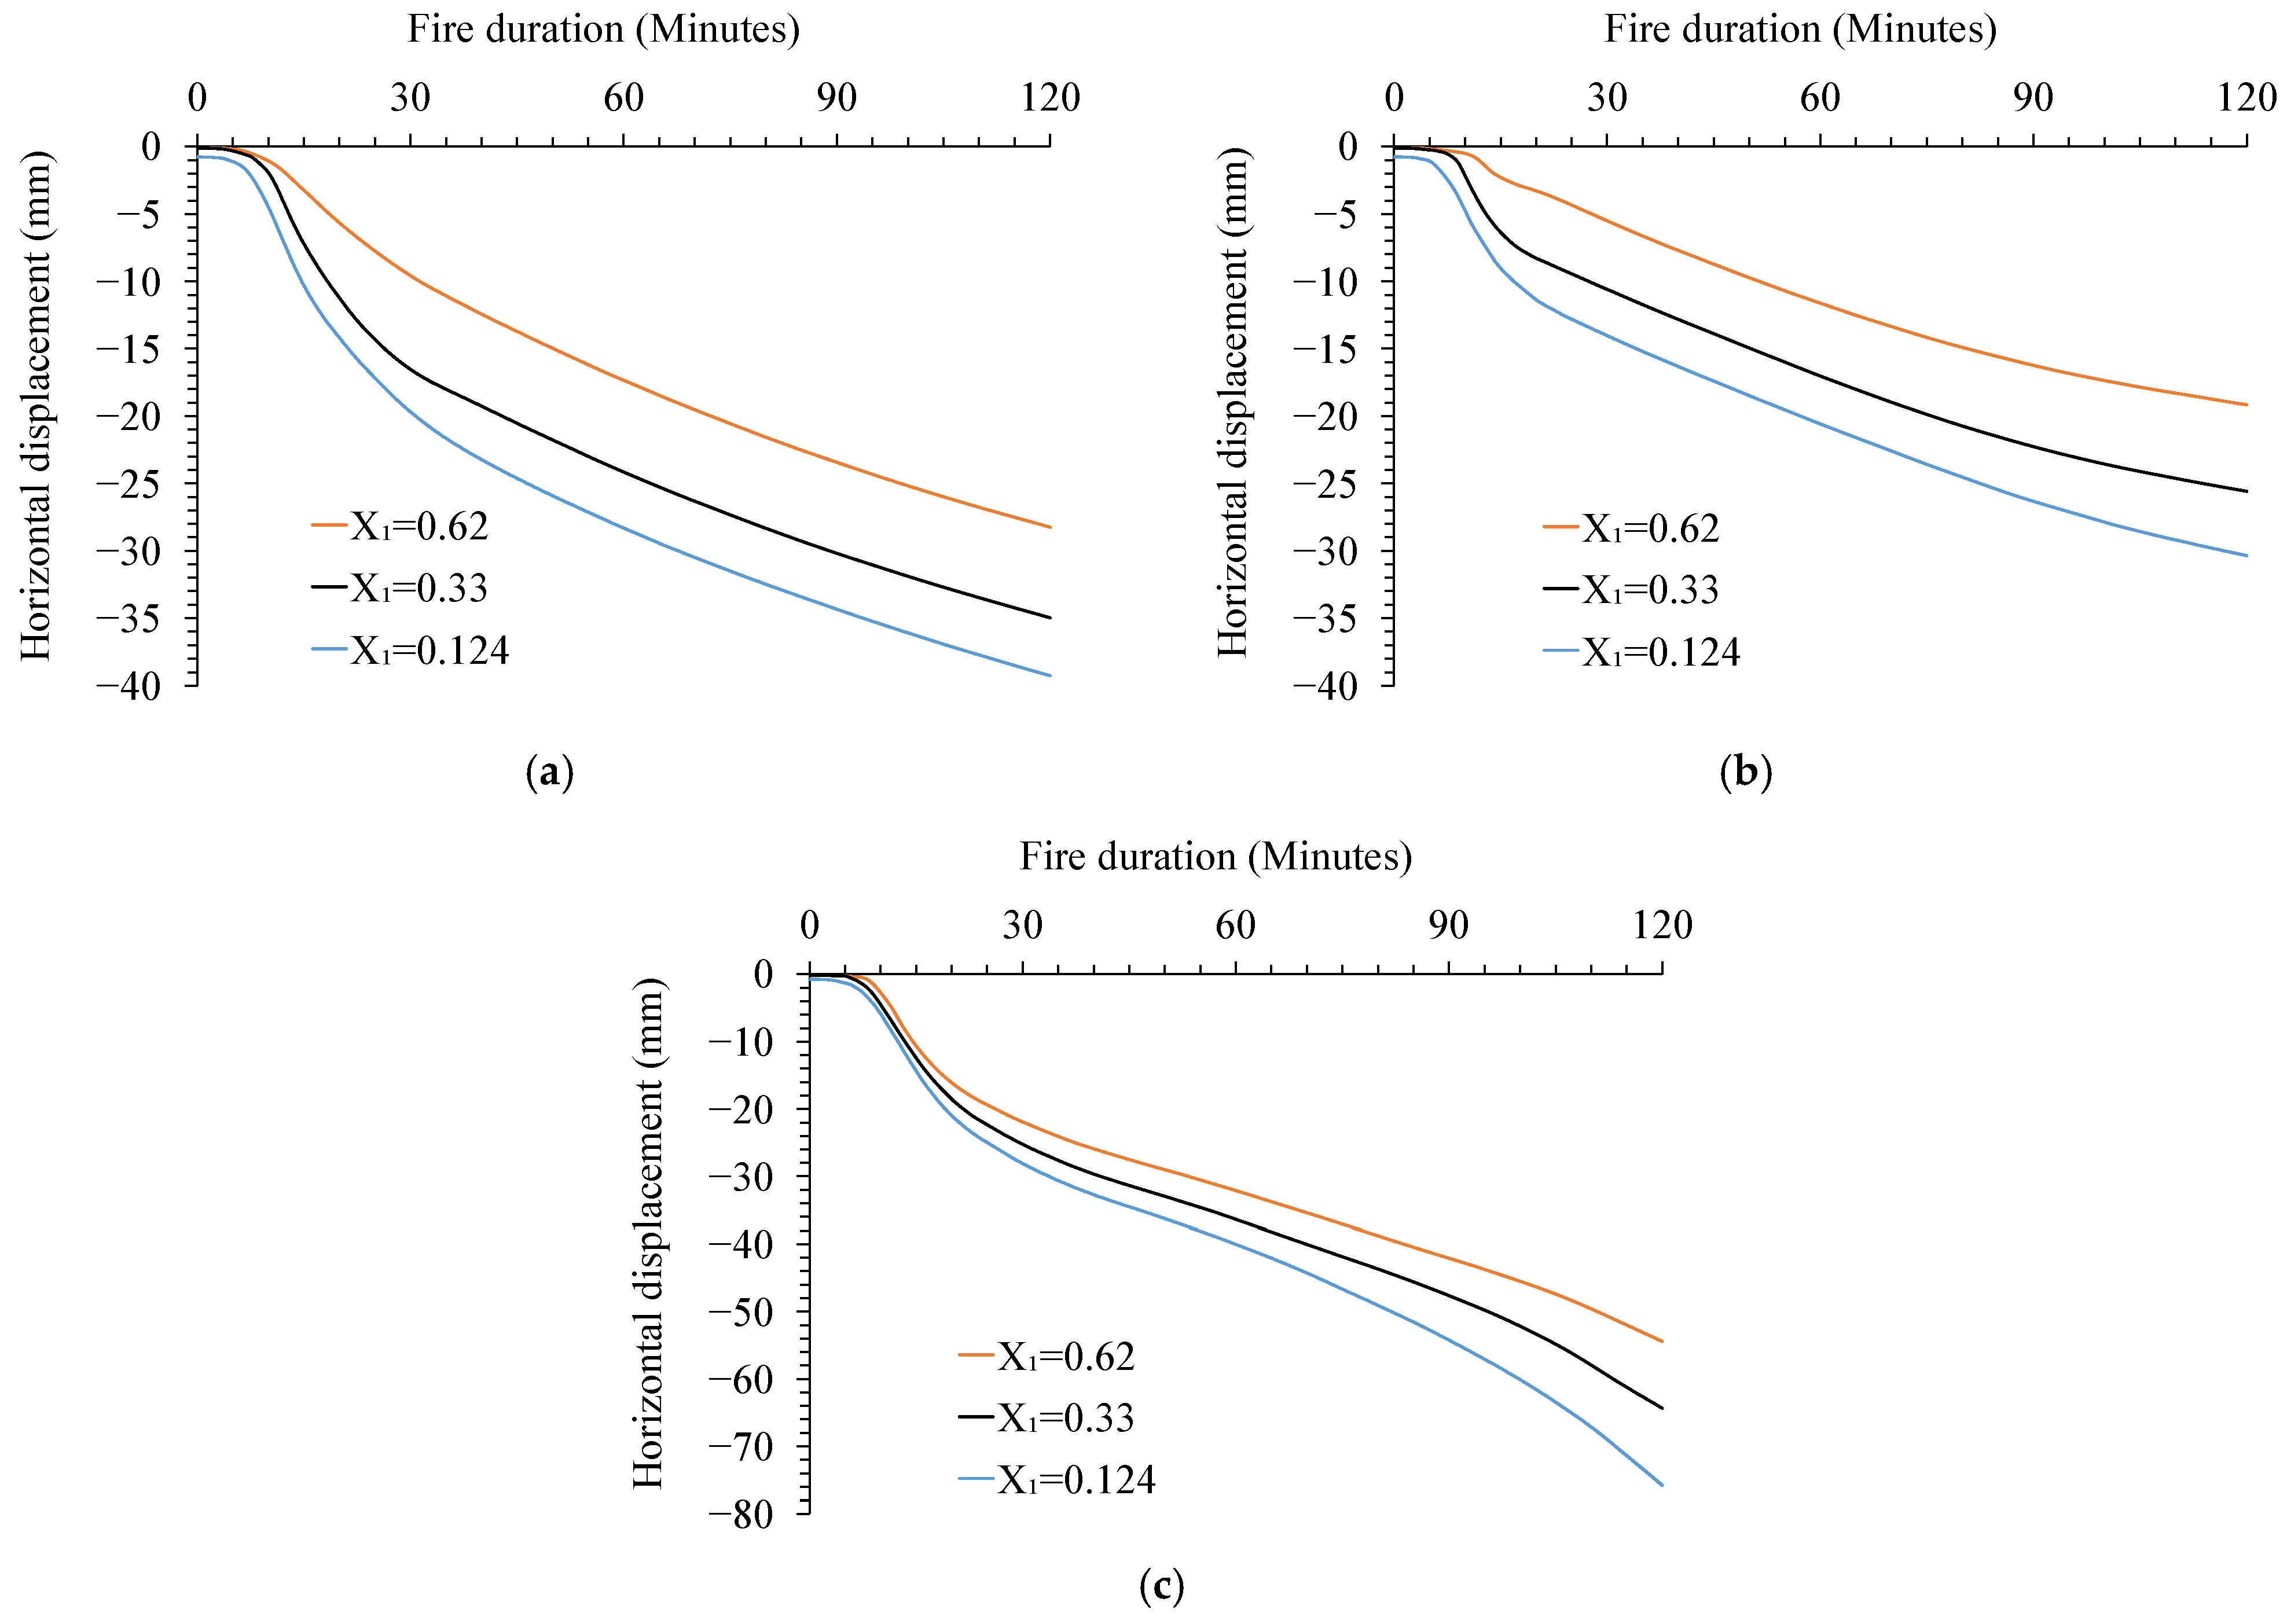
Figure 11 illustrates the significant impact of the tensile strength and fire duration on the vertical deflection of points A and B, defined in Figure 3. Figure 12 demonstrates the considerable influence of the tensile strength on the horizontal displacement at the column’s top end. Using 0.124 value resulted in equal deflections at points A and B, which is unrealistic. Using led to the lowest deflections. As the FE analysis is based on the principal stresses, it is intuitive to use a stress of .

Figure 11.
Impact of the concrete tensile strength on the vertical deflection at points A and B: (a) Bottom-side fire exposure, (b) Top-side fire exposure, and (c) Fire exposure on both sides.
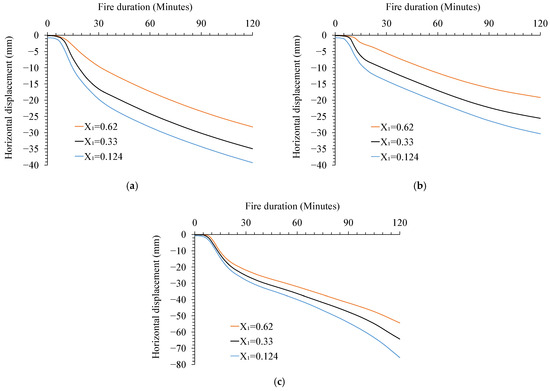
Figure 12.
Impact of the concrete tensile strength on the horizontal displacement at the top of the column (point C): (a) Bottom-side fire exposure, (b) Top-side fire exposure, and (c) Fire exposure on both sides.
6.2. Impact of the Dilation Angle on the FE Predictions
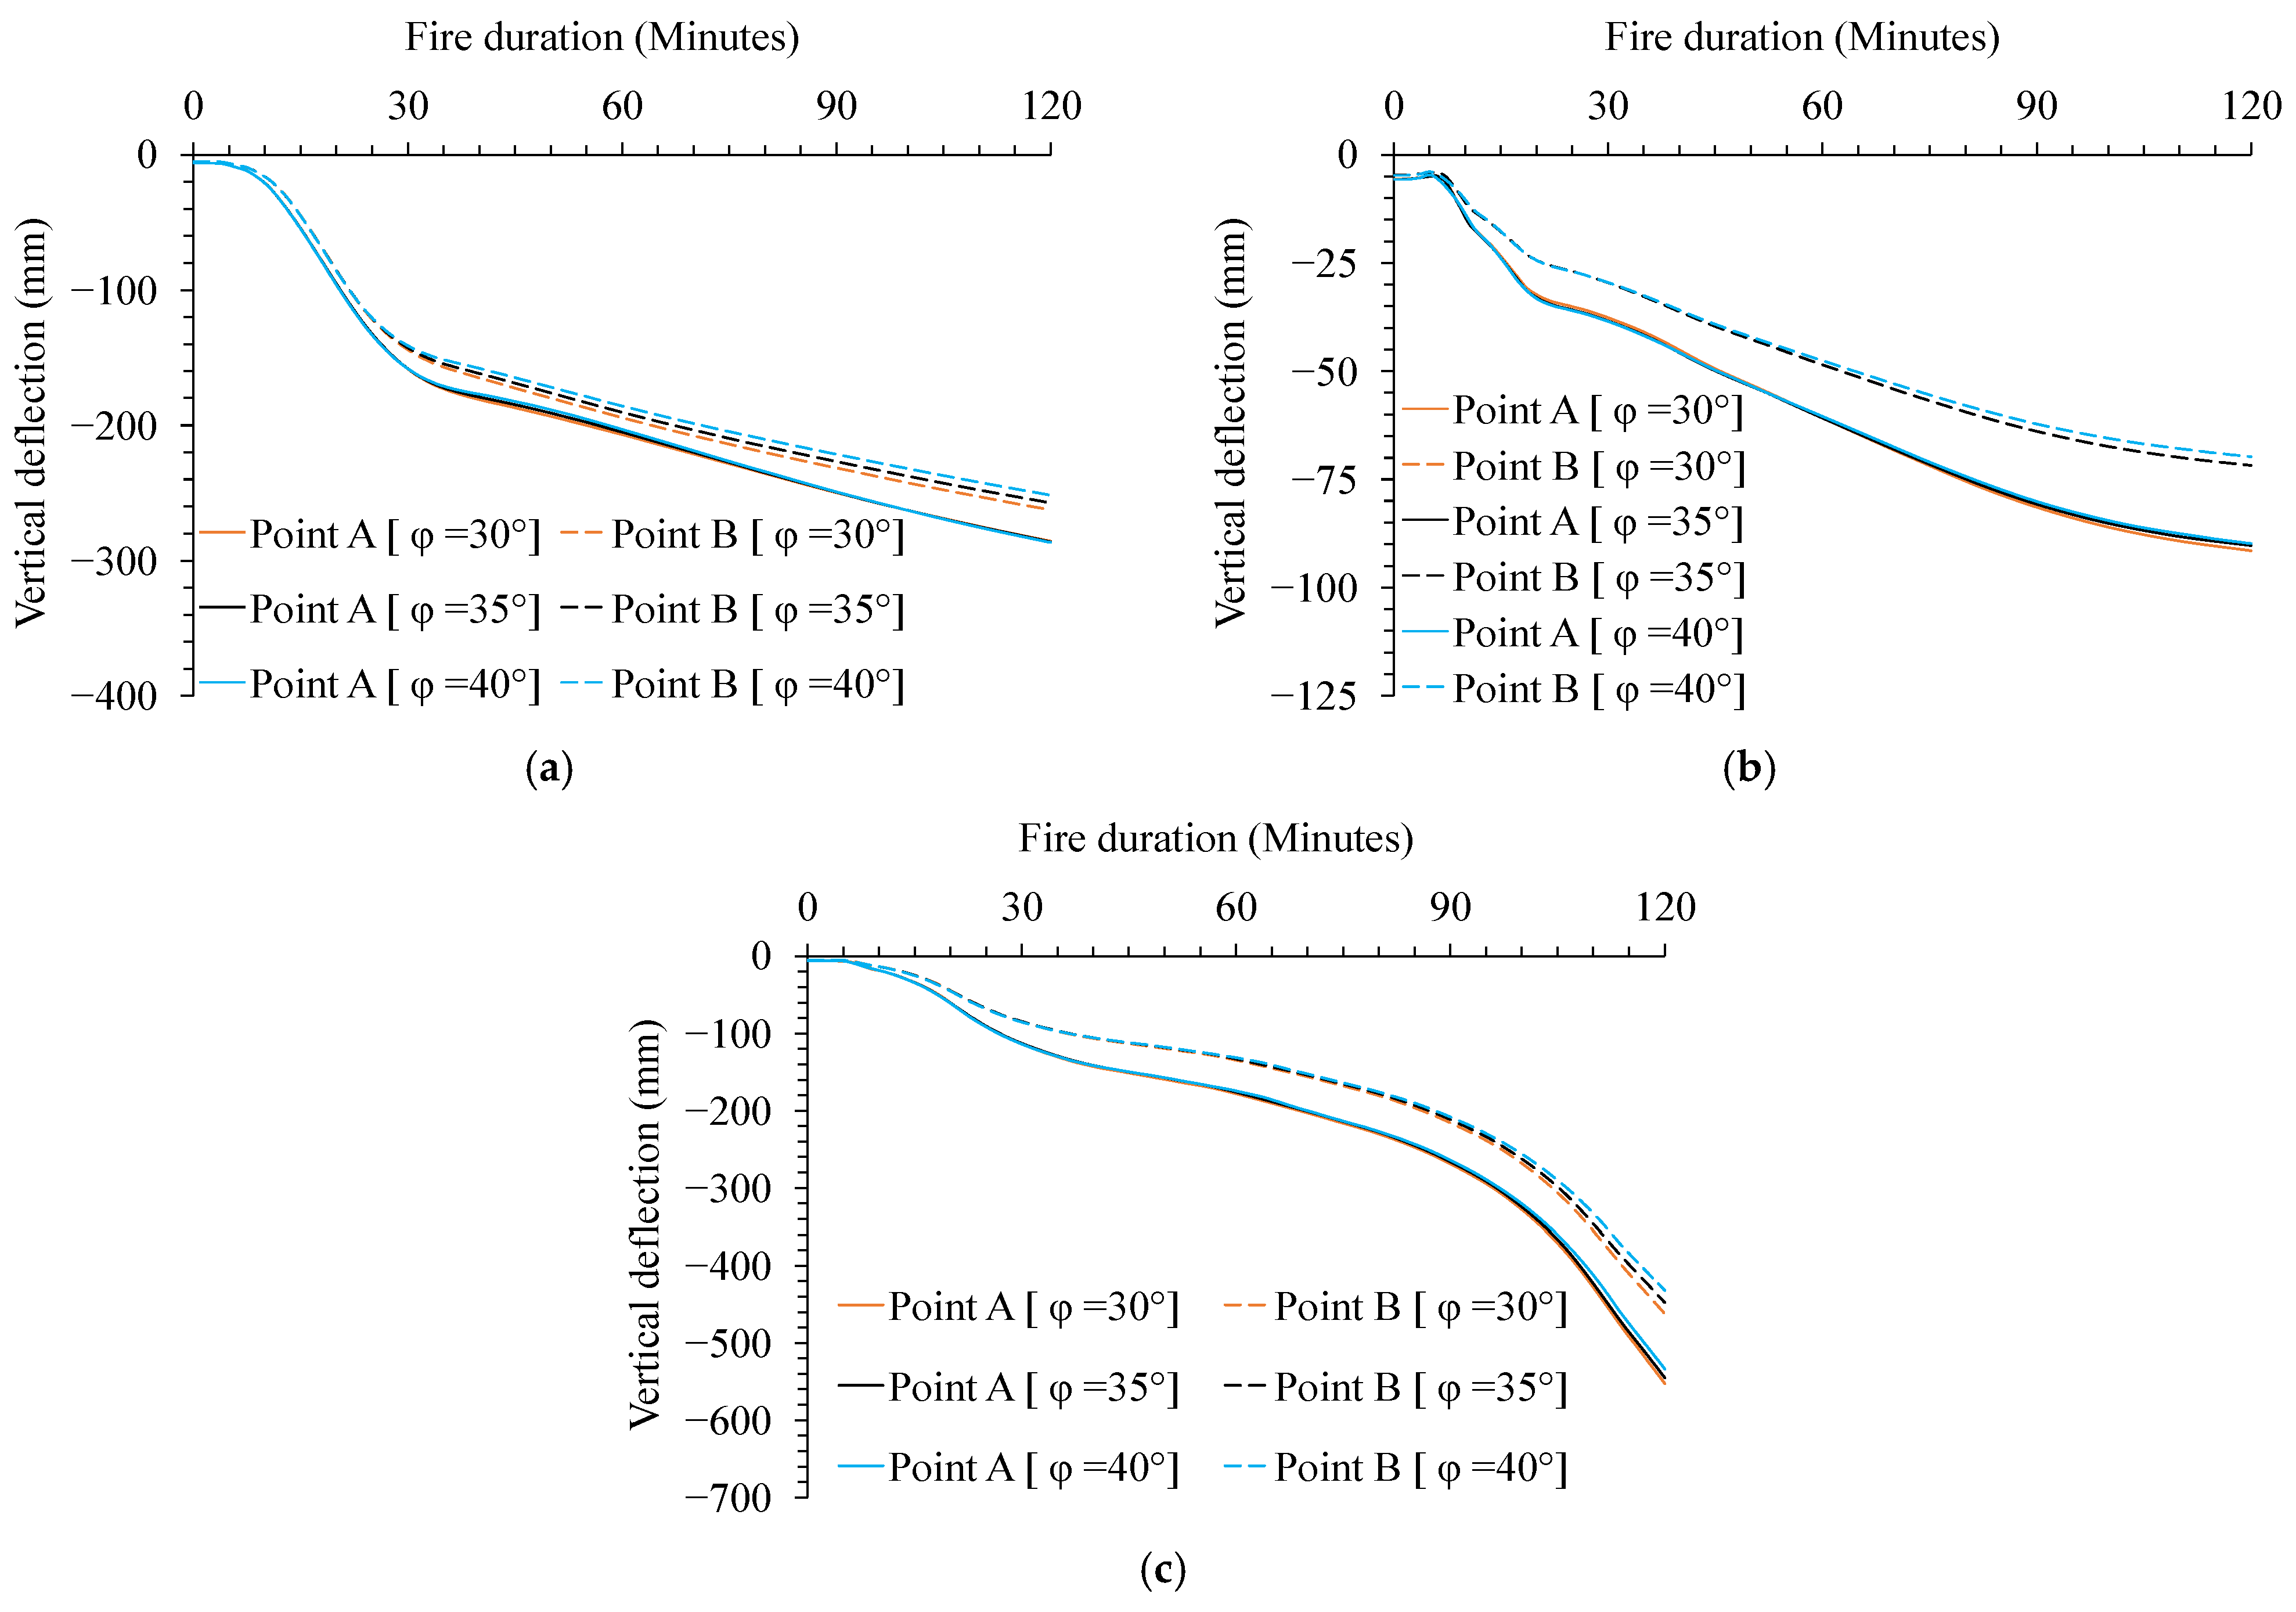
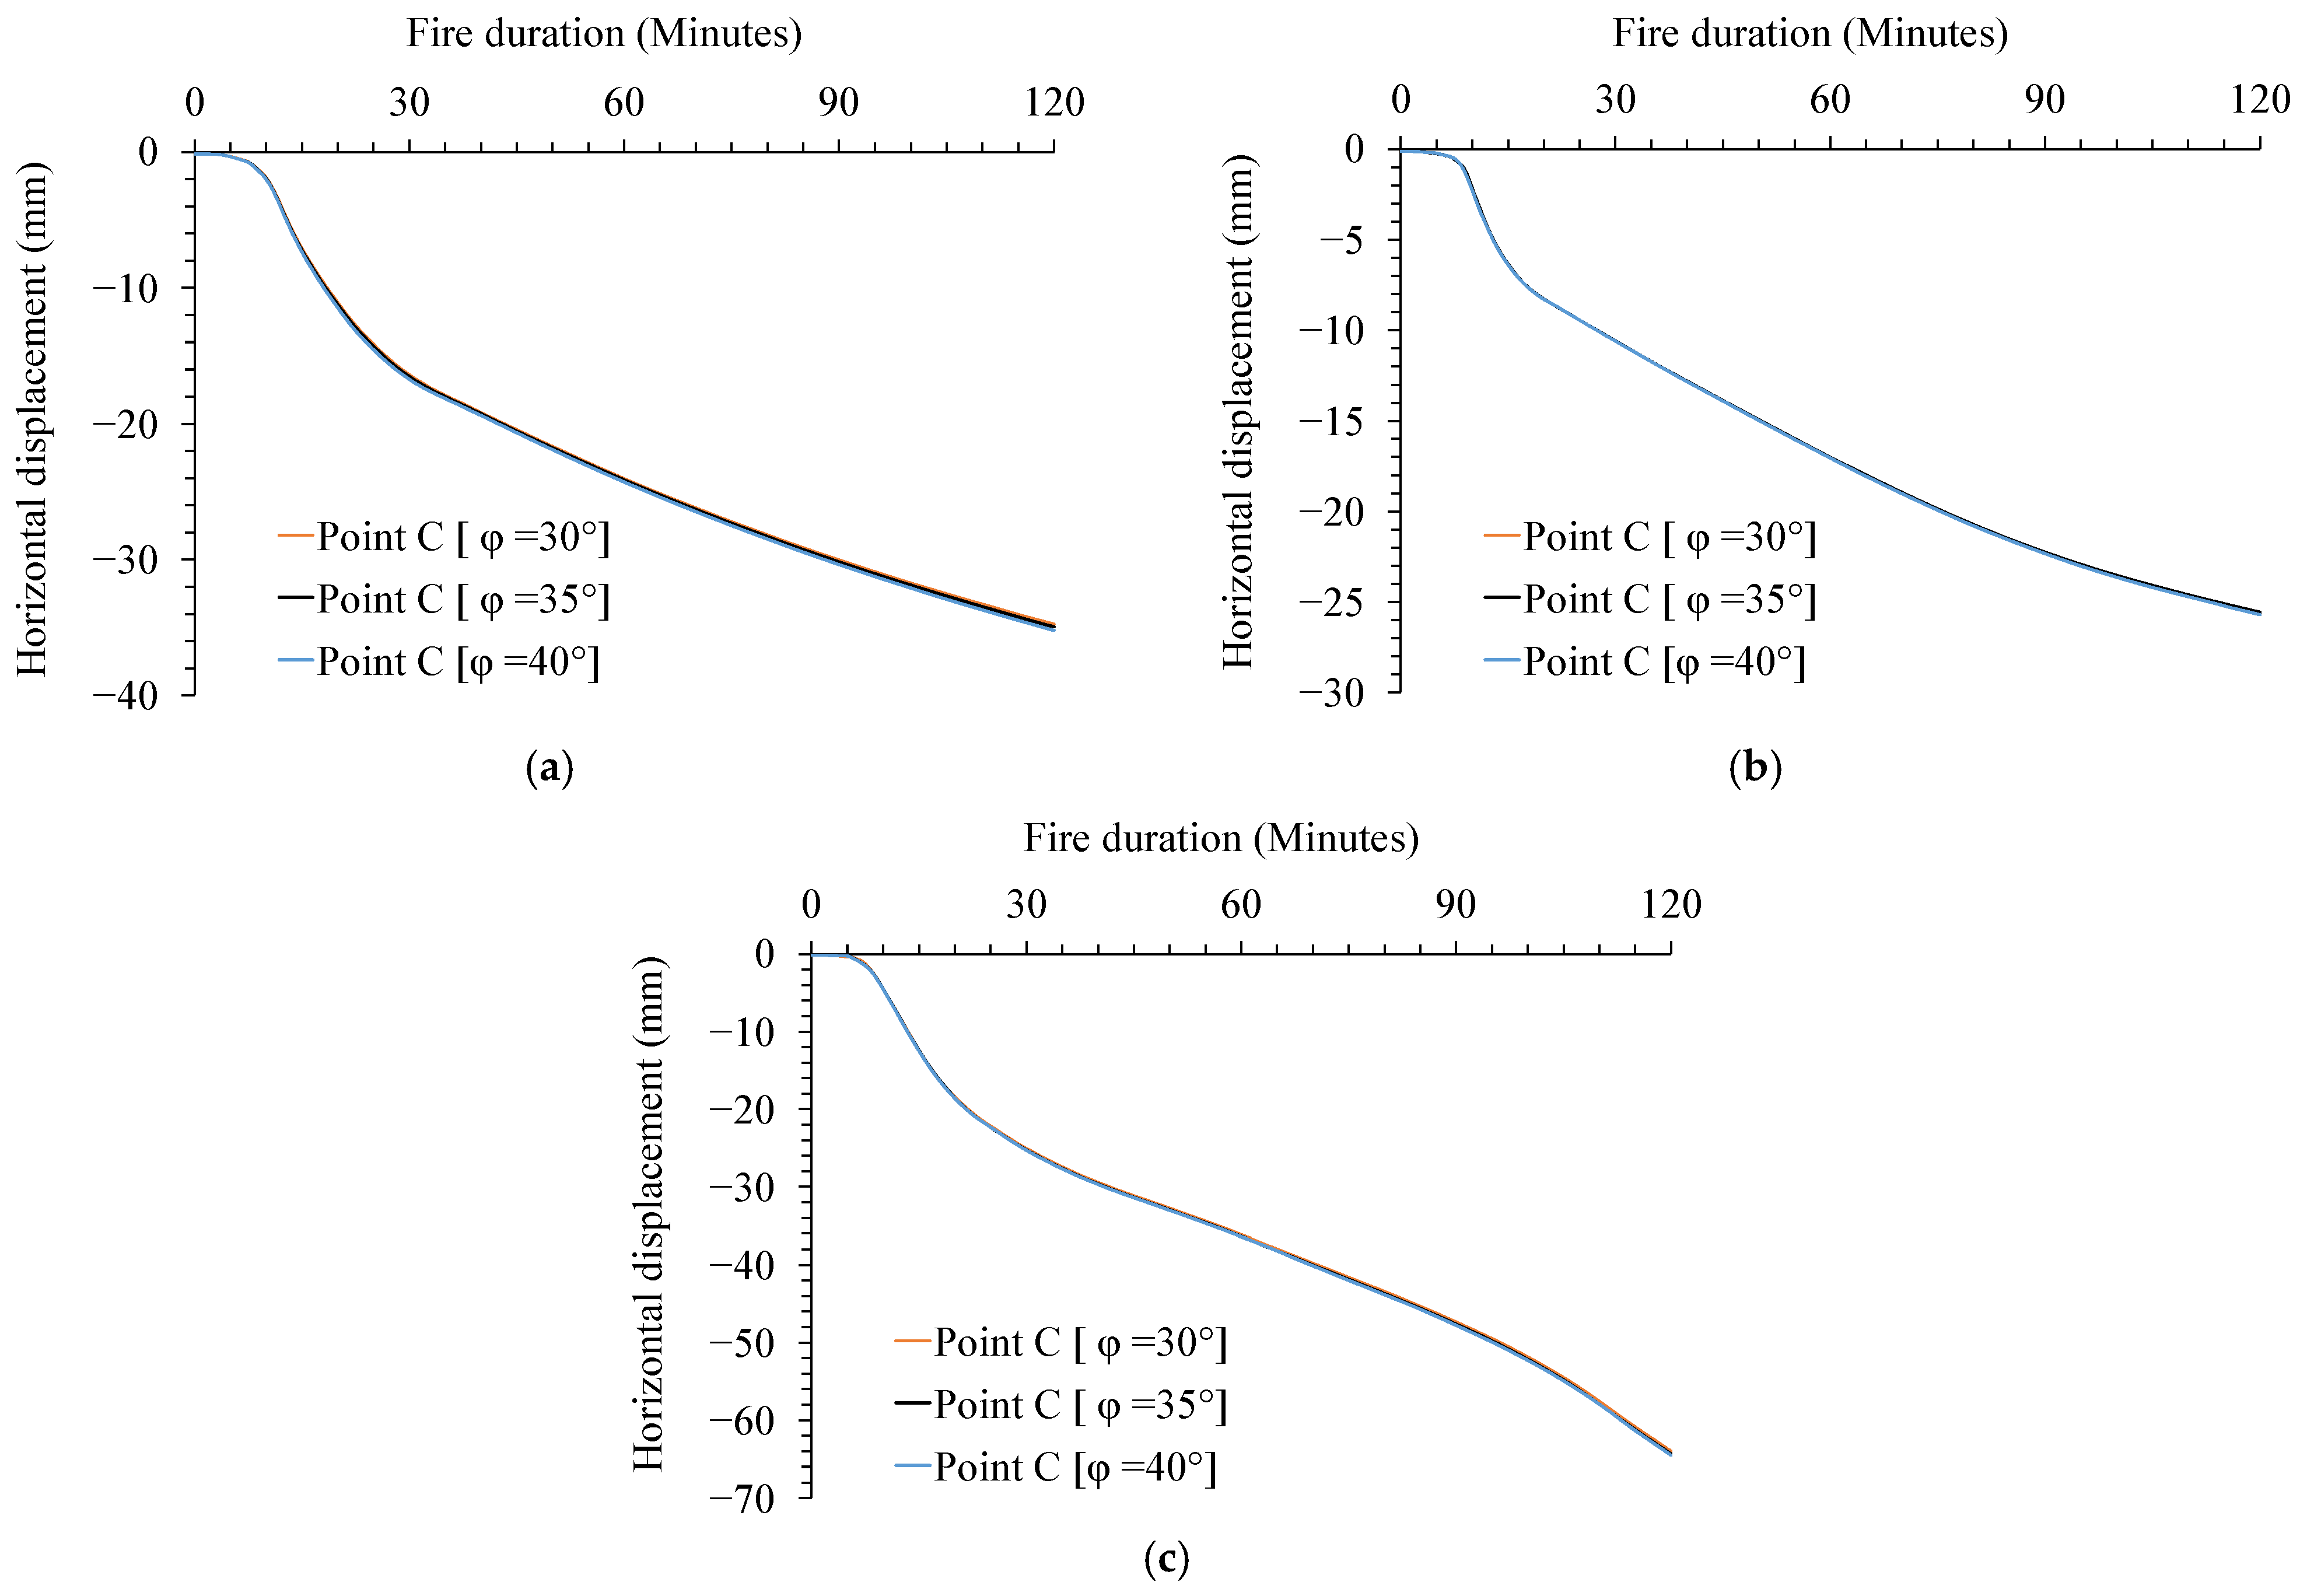
This section examines the influence of the dilation angle (φ) on the FE predictions for the prototype structure. Analyses were conducted using a fixed tensile peak stress of , considering three values for φ: 30°, 35°, and 40°. As depicted in Figure 13 and Figure 14, the resulting deformations were nearly identical across the three dilation angles, suggesting that variations within this range have a negligible impact on the structural response. This outcome can be attributed to the development of tensile membrane action (TMA) in the slab under fire conditions. As the slab experiences significant thermal expansion and deflection, it transitions from a flexural behaviour to a membrane-dominated response, where in-plane tensile forces become the primary load-resisting mechanism. In this state, the slab’s capacity is less sensitive to parameters affecting volumetric plastic strain, such as the dilation angle, and more influenced by factors governing in-plane tensile behaviour.
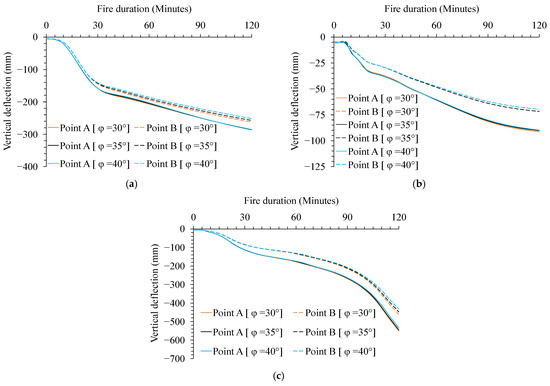
Figure 13.
Impact of the dilation angle on the vertical deflection at points A and B: (a) Bottom-side fire exposure, (b) Top-side fire exposure, and (c) Fire exposure on both sides.
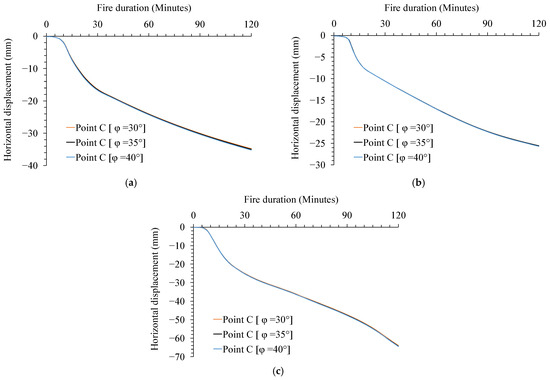
Figure 14.
Impact of the dilation angle on the horizontal displacement at the top end of the column (point C): (a) Bottom-side fire exposure, (b) Top-side fire exposure, and (c) Fire exposure on both sides.
The dominance of TMA in fire-exposed slabs has been documented in prior studies. For instance, Burgess and Sahin [26] highlighted the significant role of TMA in enhancing the fire resistance of lightly RC slabs, noting that large deflections can mobilize in-plane tensile forces, which substantially increase the load-carrying capacity. Similarly, Wahid et al. [16] observed that variations in the dilation angle had a limited effect on the deflection predictions of reinforced concrete flat slabs under fire, reinforcing the notion that TMA governs the structural response in such scenarios.
Therefore, within the context of fire-induced large deformations and the associated membrane behaviour, the influence of the dilation angle on FE predictions is minimal. This insight supports the use of a standard dilation angle value within the examined range for modelling purposes without compromising the accuracy of the structural response predictions under fire conditions.
6.3. Validation
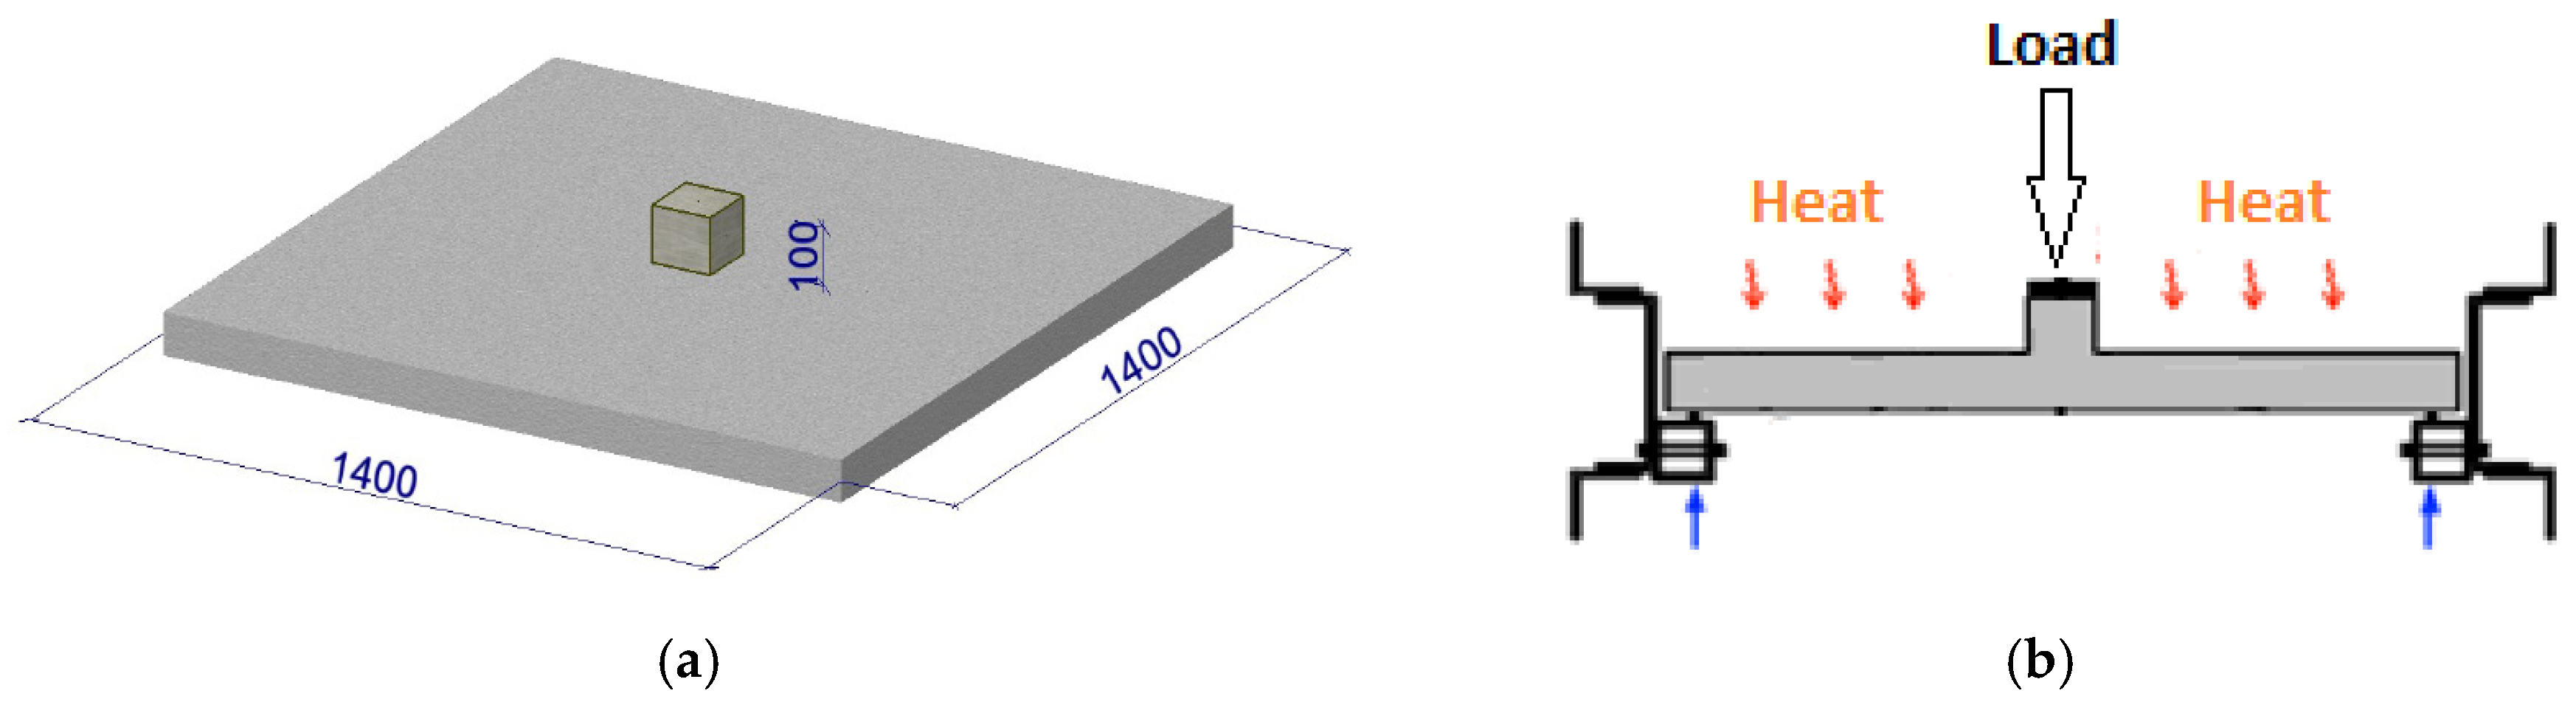
In this section, the use of and φ = 35° are examined using the experiments conducted by Smith [27] and Liao et al. [28]. Figure 15 and Figure 16 show slabs HU75-0.8 by Smith [27] and TS-R1-C1-N by Liao et al. [28].

Figure 15.
Slab HU75-0.8 tested by Smith [27]: (a) Dimensions and (b) Test setup.
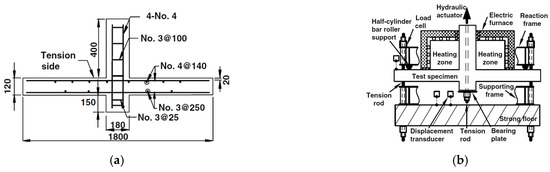
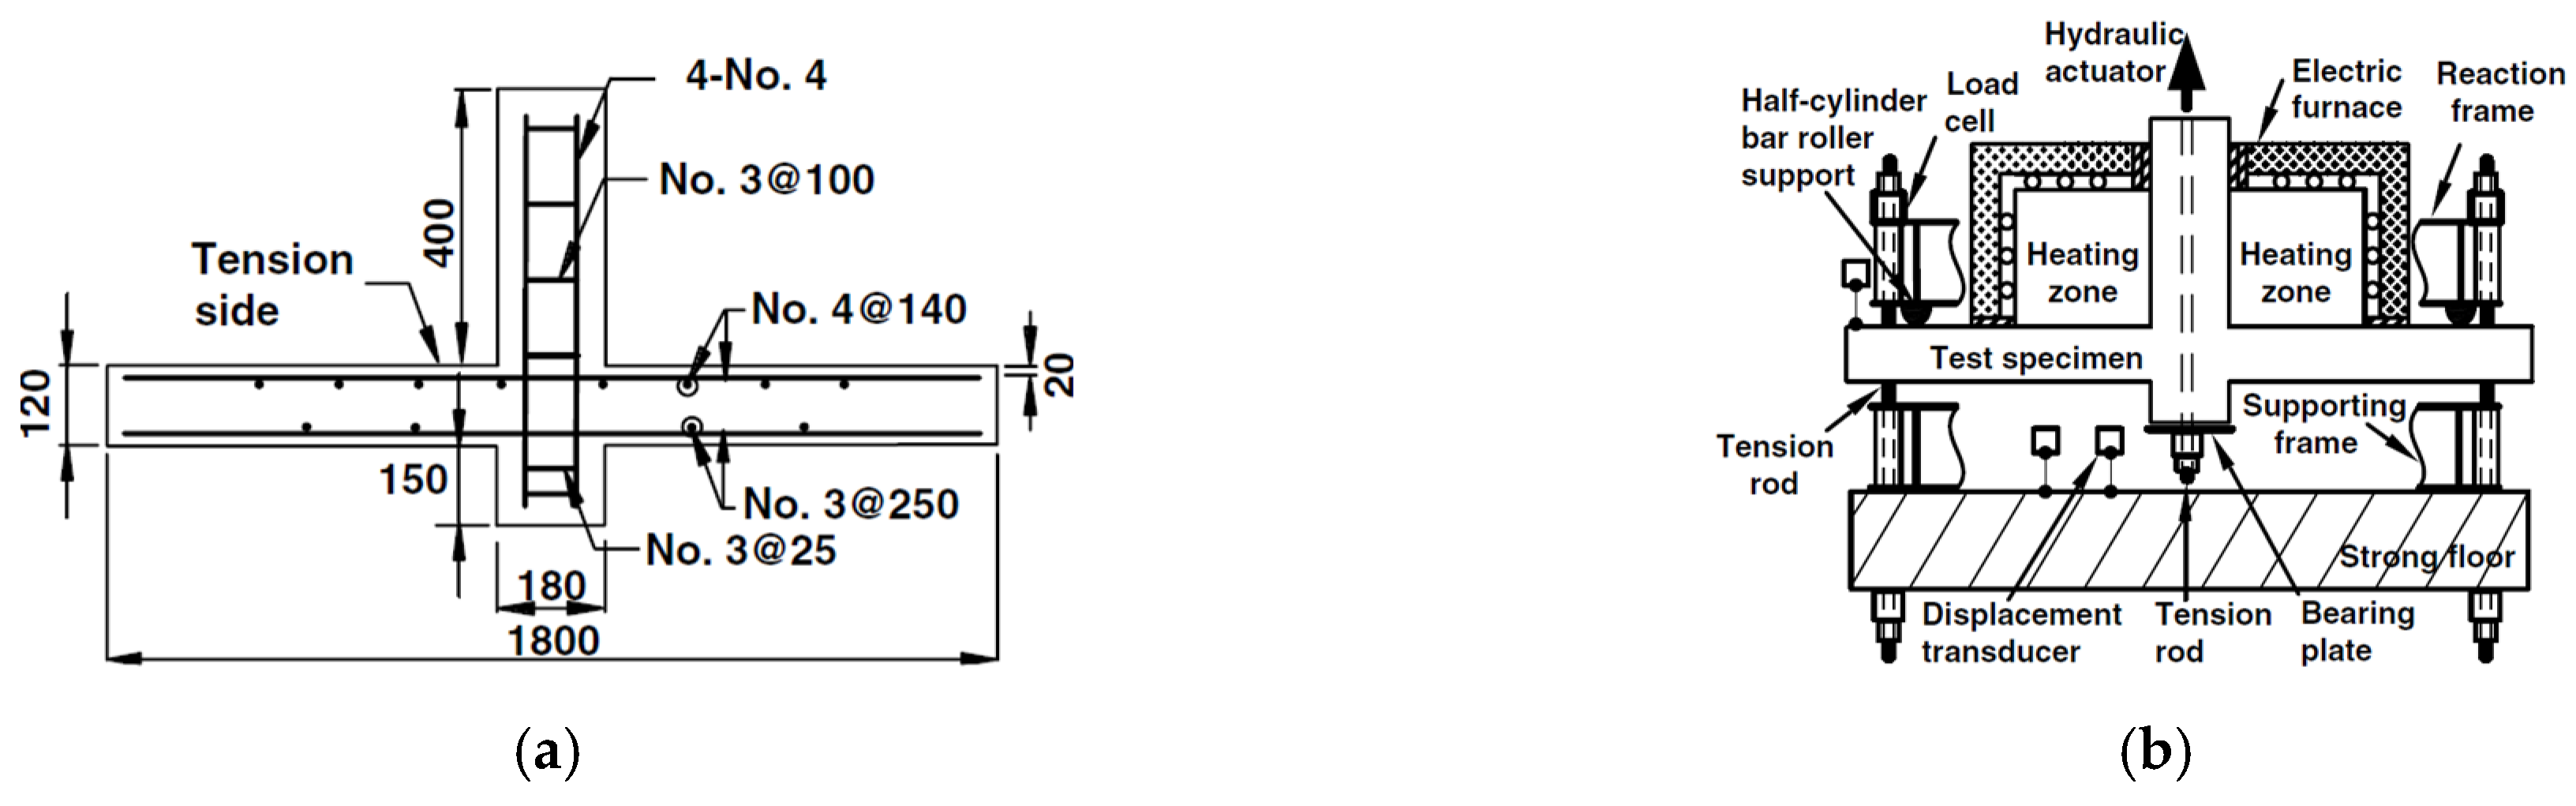
Figure 16.
Slab TS-R1-C1-N tested by Liao et al. [28]: (a) Dimensions and reinforcement and (b) Test setup.
Both slabs had a similar setup, where the load was applied through a column stub at their centre point while being exposed to fire at their top surface, which was in compression for HU75-0.8 and in tension for TS-R1-C1-N. The slabs were supported at their edges and were allowed to expand freely [27,28]. The dimensions, reinforcement, and material properties of the two slabs are shown in Table 3. Slab HU75-0.8 supported a vertical load of 82.8 kN while exposed to elevated temperatures from a radiant panel for 120 min. Slab TS-R1-C1-N supported a load of 116 kN while being exposed to 285 min of ASTM E119 standard fire duration.
Table 3.
Properties of the two modelled slabs.
The slabs were modelled using shell elements. Figure 17 illustrates the FE model for both slabs. Figure 18 shows the resulting temperatures within the thickness of the slabs as a function of the fire durations. Finally, Figure 19 shows the predicted deflections of the slabs at different fire durations. The FE predictions closely matched the experimental results.
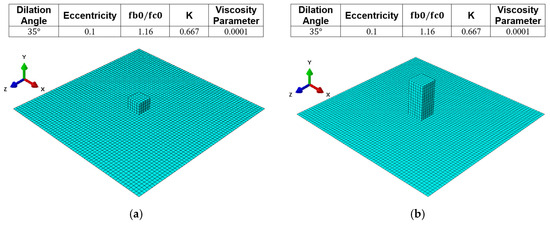
Figure 17.
FE Model of the examined slabs: (a) Slab HU75-0.8 and (b) Slab TS-R1-C1-N.
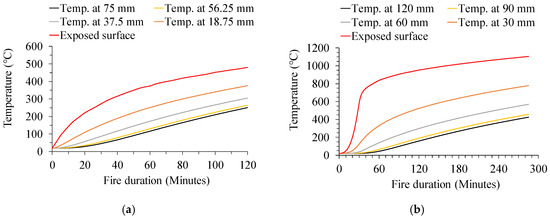
Figure 18.
Temperature at different points through the slab thickness: (a) Slab HU75-0.8 and (b) Slab TS-R1-C1-N.
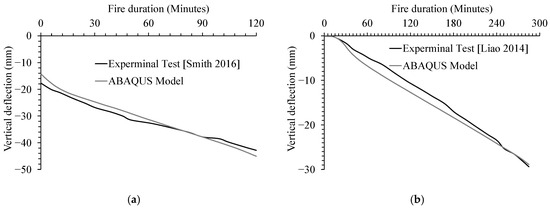
Figure 19.
Variation in slab vertical deflection with fire duration: (a) Slab HU75-0.8 and (b) Slab TS-R1-C1-N.
Concrete ‘plasticity’ parameters, including viscosity (ν), the ratio of initial biaxial to initial uniaxial compressive yield stress (fb0/fc0), the ratio between the second stress invariant on the tension meridian to the compression meridian (K), and eccentricity (ϵ) were defined based on previous research [16].
6.4. Detailed Results for the Prototype Slab
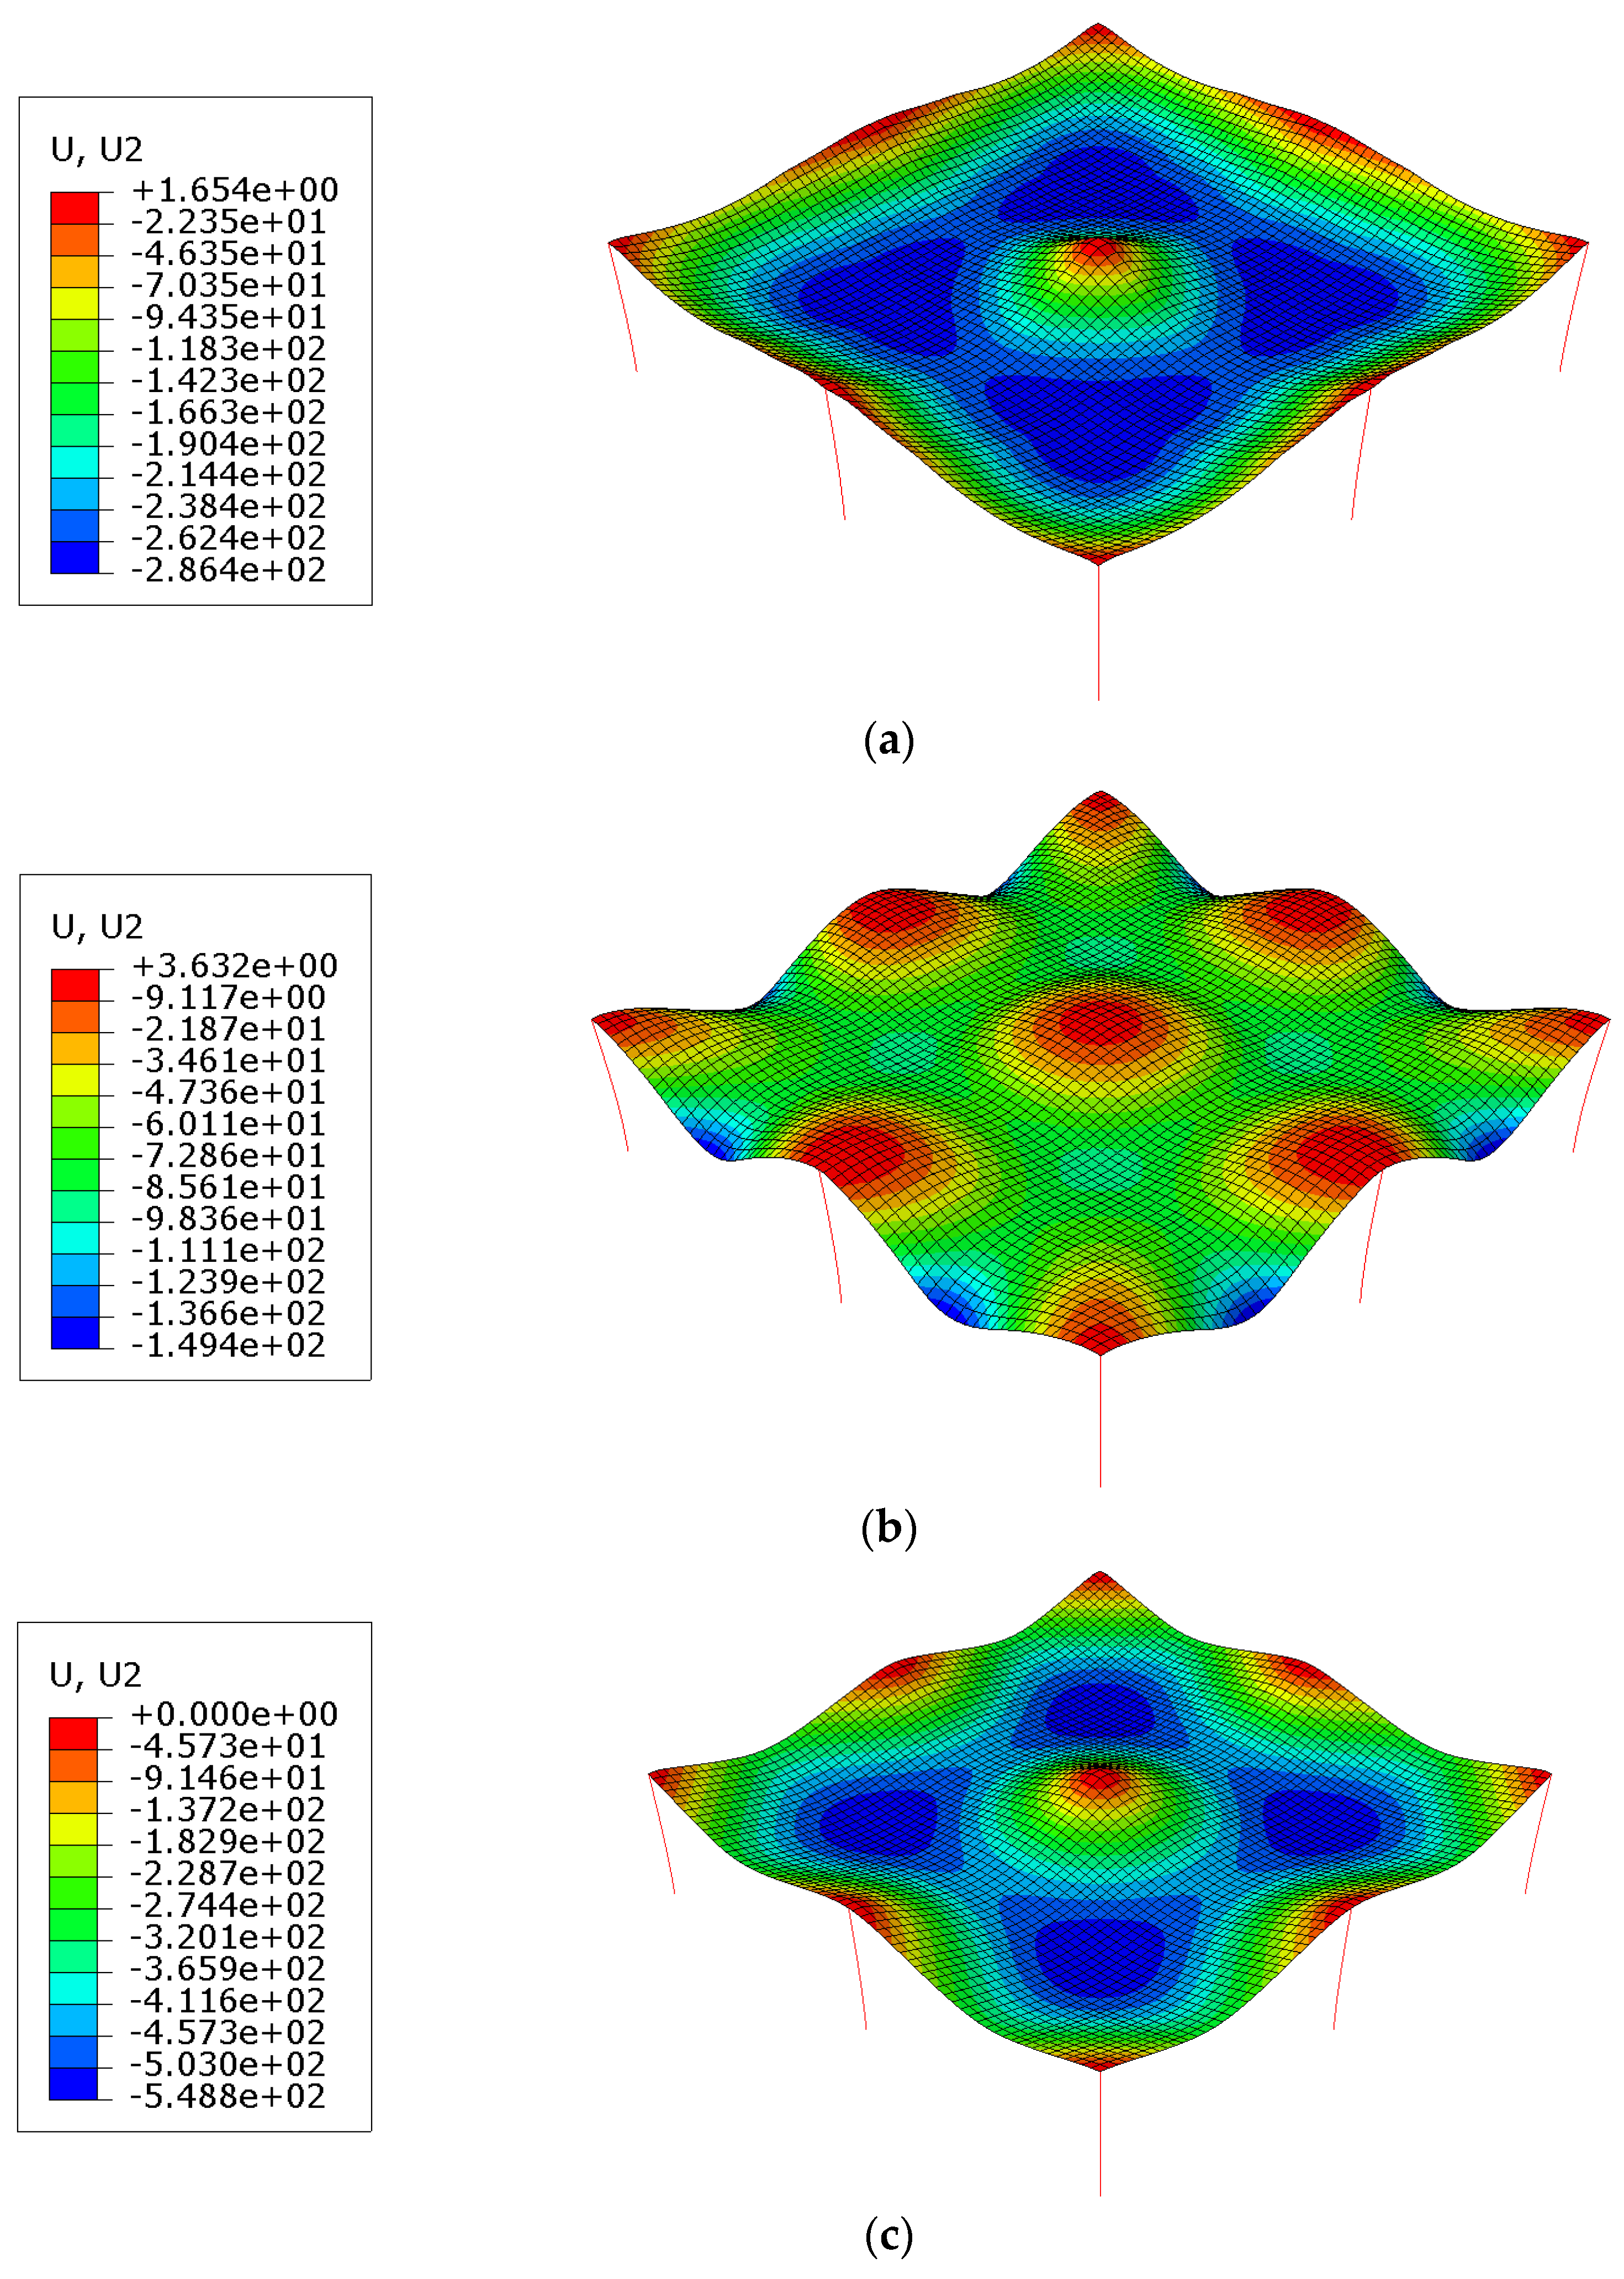
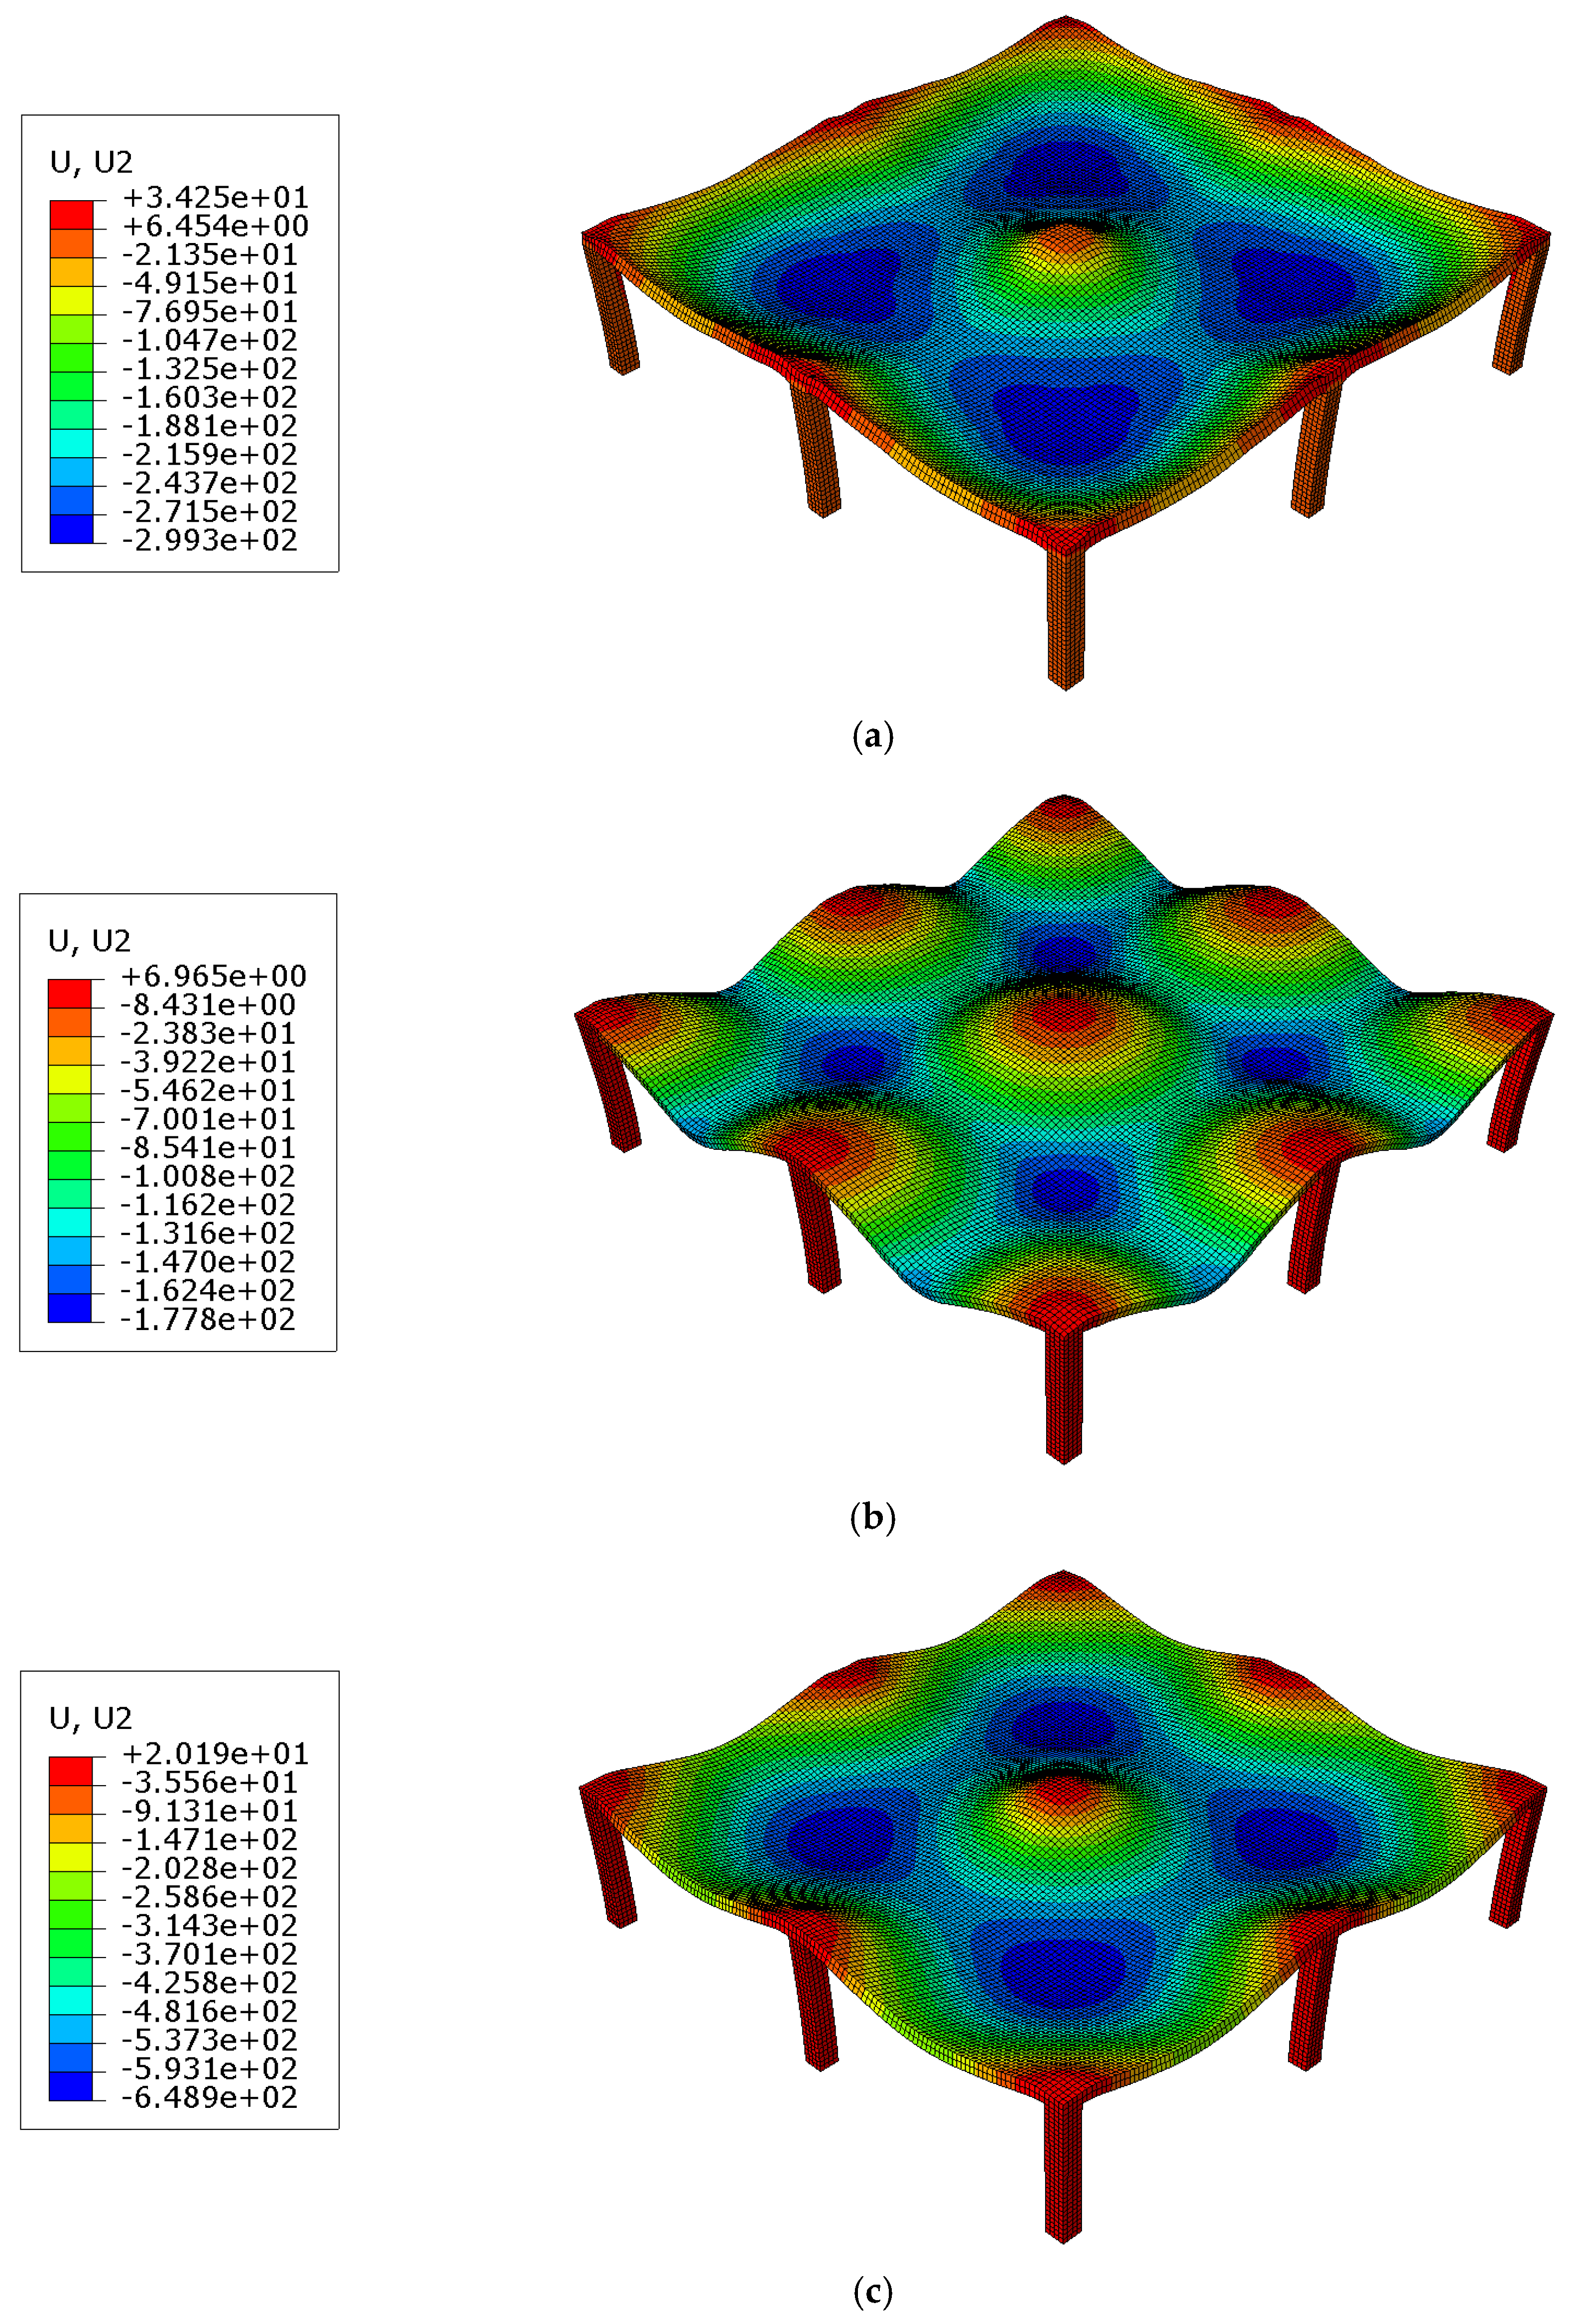
This section presents the detailed results of the prototype’s FE model, considering and φ = 35°. Figure 20 illustrates the deformed shapes after 120 min of exposure to the assumed three fire scenarios.
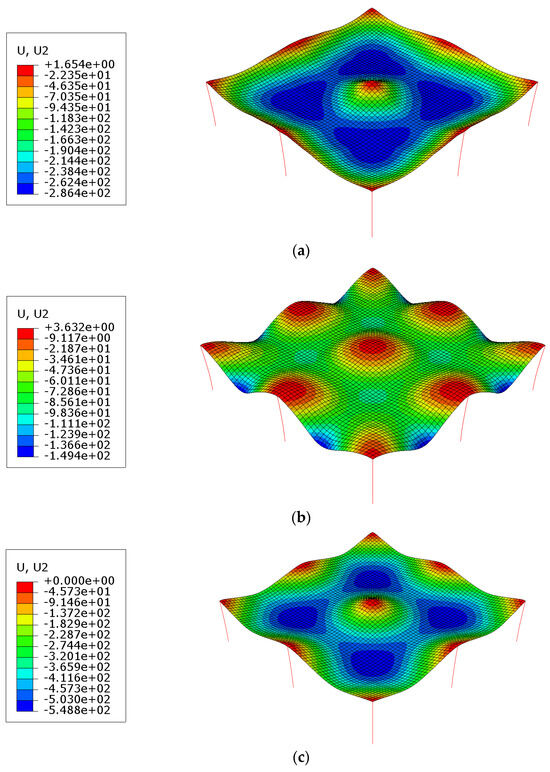
Figure 20.
Vertical displacement of the prototype slab after 120 min of fire exposure using shell elements [values in mm]: (a) Exposure at the bottom surface, (b) Exposure at the top surface, and (c) Exposure at both top and bottom surfaces.
When the floor slab was subjected to fire from the bottom or both sides, it deformed into a catenary shape. However, distinct deformations occurred when the floor slab was exposed to fire from the top. The sagging portions of the floor slab’s middle and column strips experienced noticeable downward deformation, resulting in a concave shape. Conversely, the hogging portion of the floor slab’s exterior and interior column strips bowed upward, creating an arched or domed appearance. The observed deformations highlight that the vertical deflections of the floor slab in the centre of the column strips are smaller than those observed in the centre middle strips for cases of exposure on both sides of the bottom or both sides. Additionally, when the floor slab was exposed to fire from the bottom surface or both surfaces, the highest deflection occurred at the centre of the middle strips of the slab. In contrast, when exposing the floor slab to fire from the top, while the centre of the middle strips experienced higher deflection than those at the centre of the floor slab’s interior column strips, the highest deflection occurred at the centre of the exterior column strips of the floor slab.
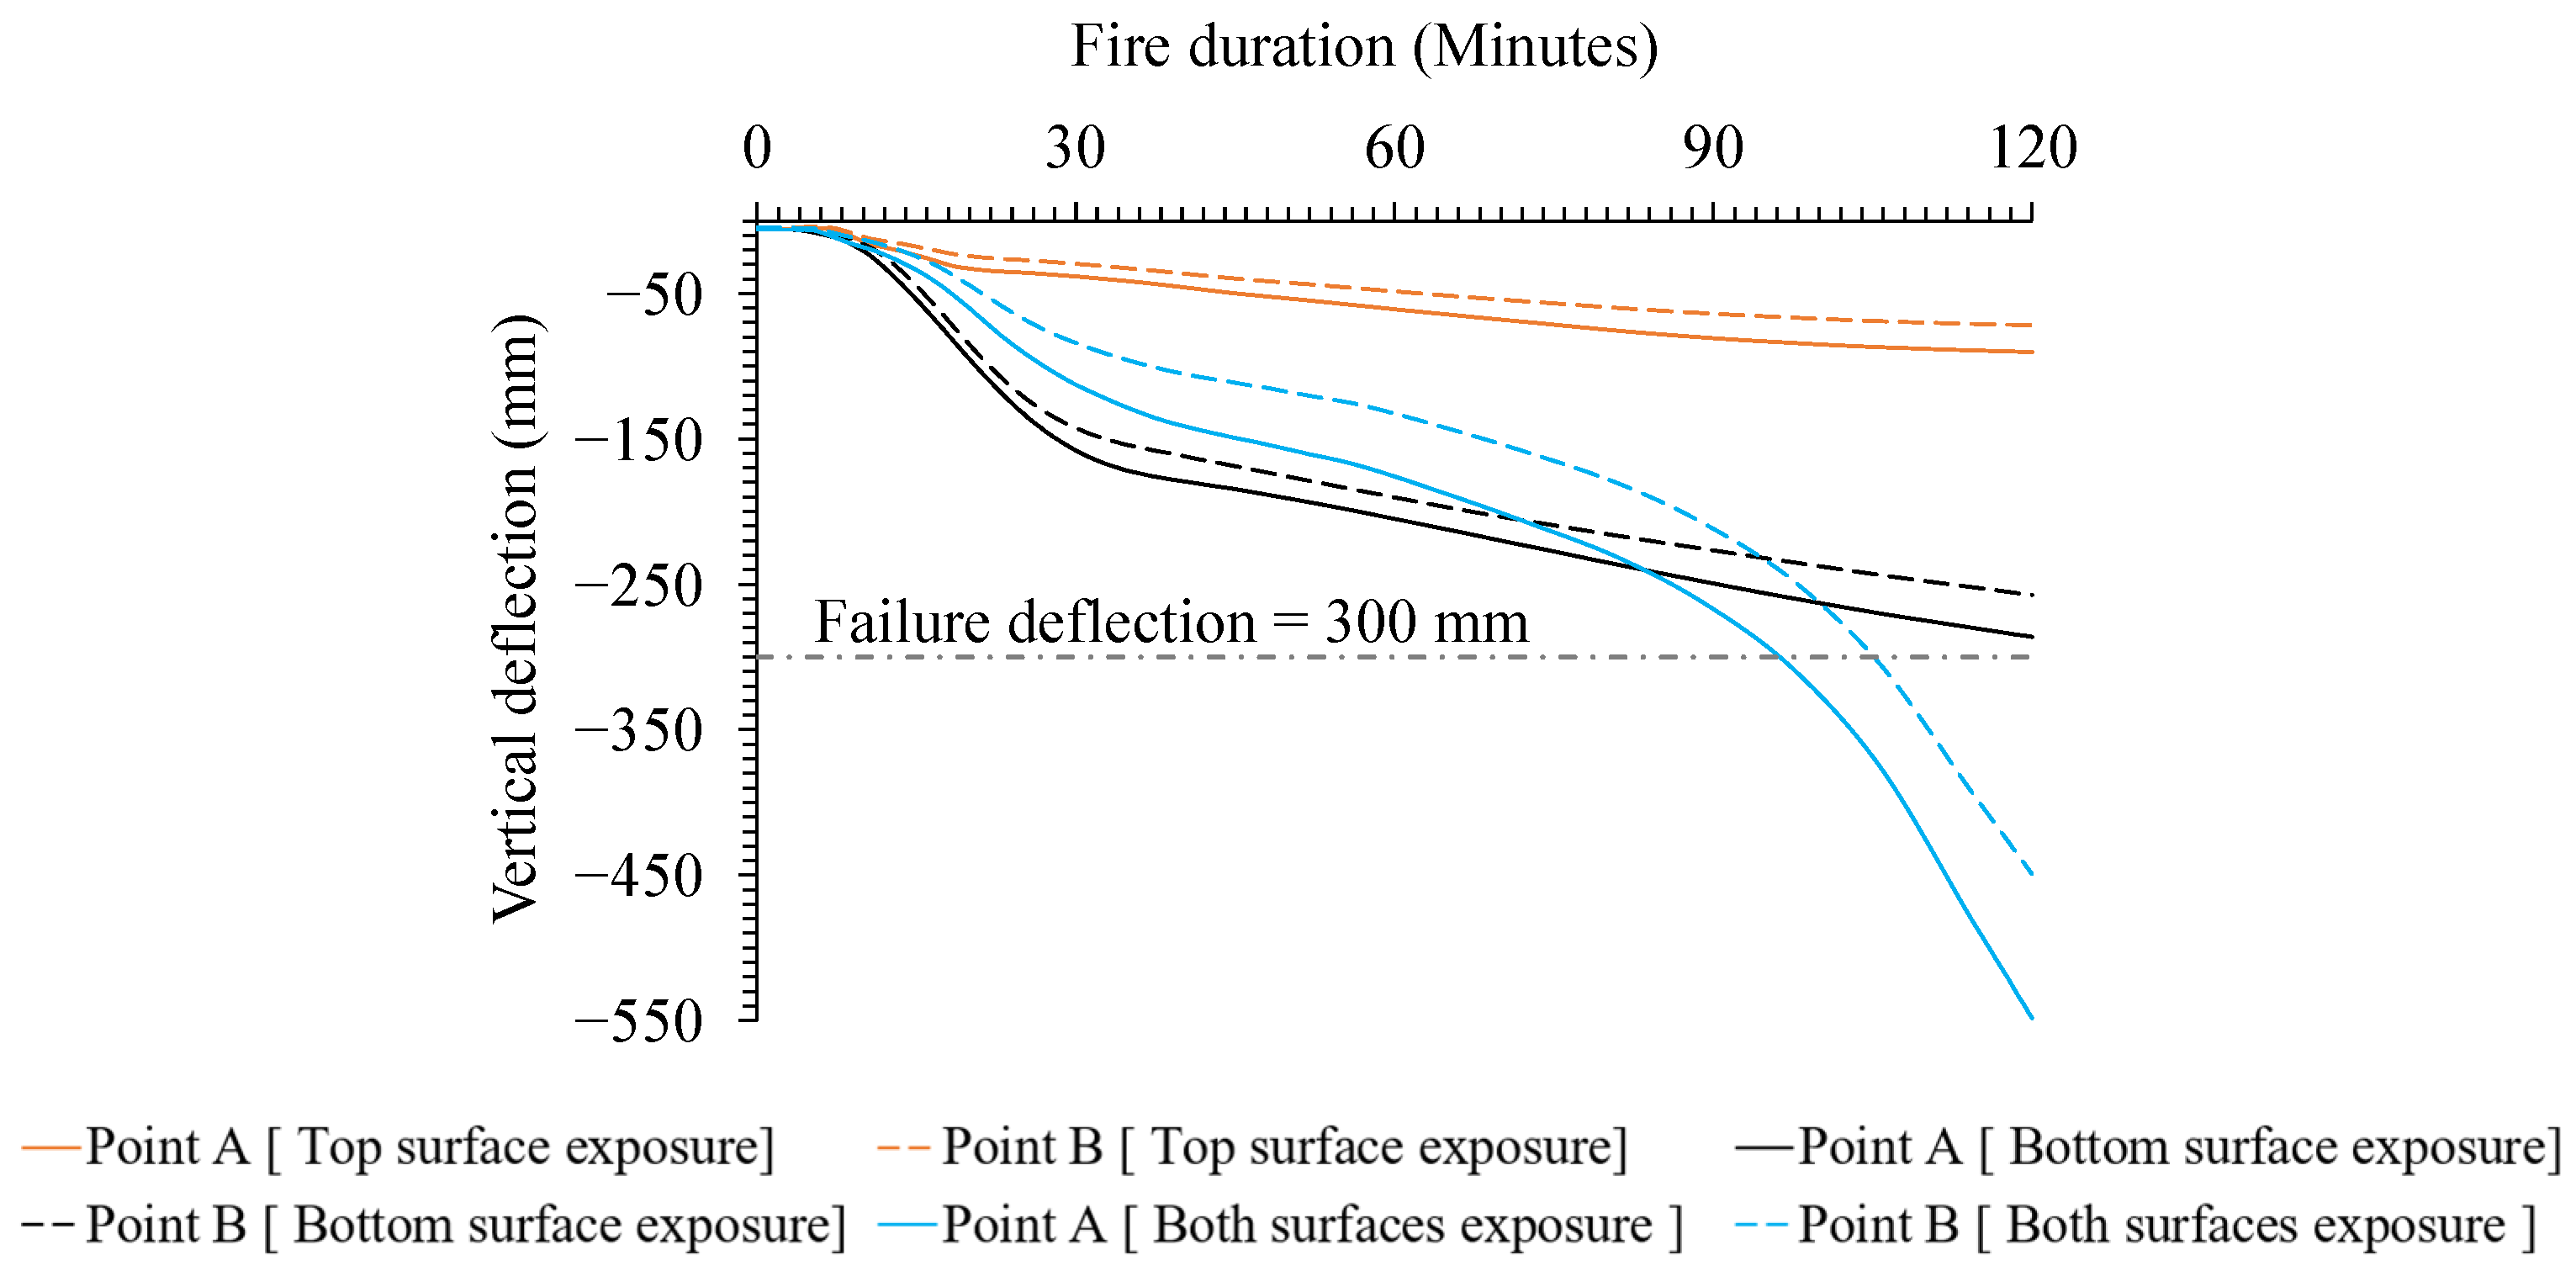
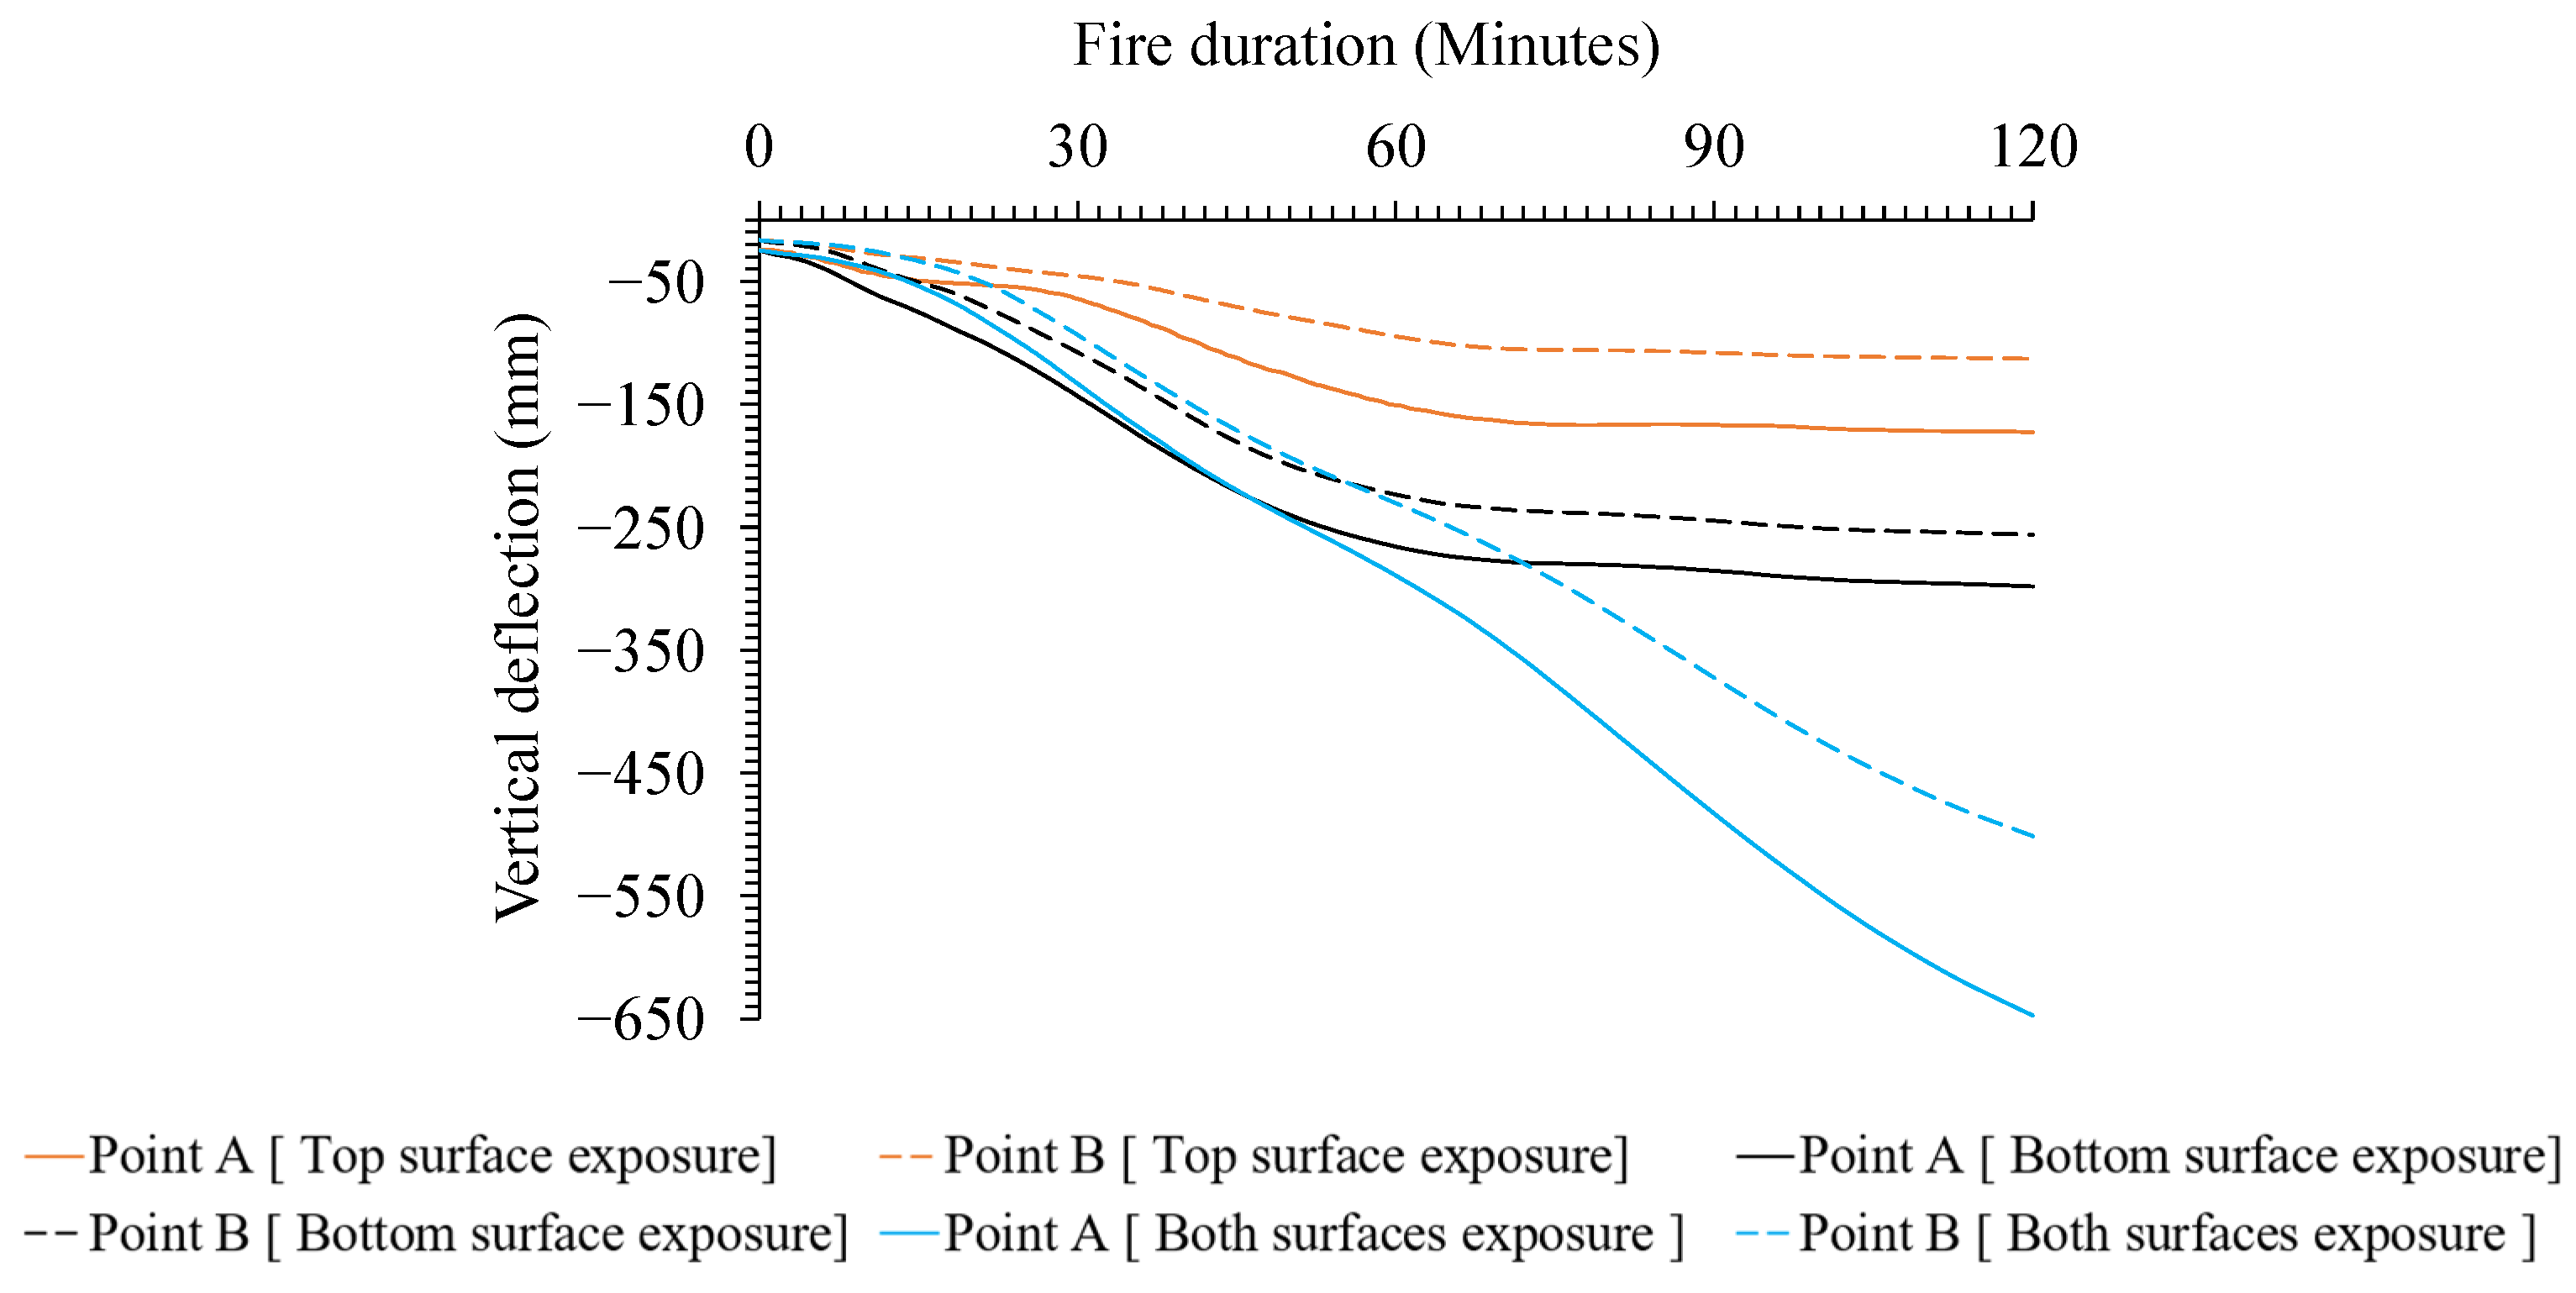
Figure 21 shows the vertical deflection at Points A and B as a function of the fire duration. Points A and B are positioned at the centre of the slab panel and the middle of the column strip, as shown in Figure 3. The deflections of A and B at ambient temperature were 5.62 mm and 4.61 mm, respectively.
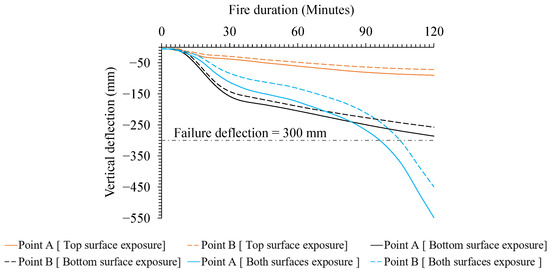
Figure 21.
Vertical displacement at points A and B after 120 min of fire exposure (Shell Modelling).
When the thermal load was applied exclusively to the bottom side, the deflections at Points A and B initially showed minimal differences but then increased significantly, reaching 199.0 mm and 186.3 mm after 60 min and 286.4 mm and 253.3 mm after 120 min. The slab did not fail as deflections were less than 300.0 mm, and the deflection rate was less than 21.6 mm/min. The allowable deflection and the deflection rate are computed by direct substitution into Equations (2) and (3), respectively, where L is the span length of the slab, equal to 6000 mm, and d is the effective depth of the slab, equal to 185 mm.
Deflections during exposure at the top surface were significantly lower than those at the bottom surface, primarily due to the interaction between thermal deformation and the combined effects of applied dead and live loads. In the case of top surface fire exposure, the thermal deformation caused the slab to deflect upward, while the applied dead and live loads induced downward deflection. This opposing interaction reduced the overall deflection. Additionally, the tension steel was not significantly affected by the fire temperature, further contributing to the reduced deflection. After 120 min of fire exposure, deflections at Points A and B were 90.3 mm and 71.7 mm, respectively.
For the case of exposure at the top and bottom surfaces, the deflections at A and B reached much higher values than in the previous two cases. At 90 min, the deflections were 264.5 and 210.2 at A and B, respectively. They then experienced a significant increase, reaching 548.8 mm and 447.8 mm. The slab reached failure deflection at 97 min, with a deflection value of 308 mm and a deflection rate of 8 mm/min.
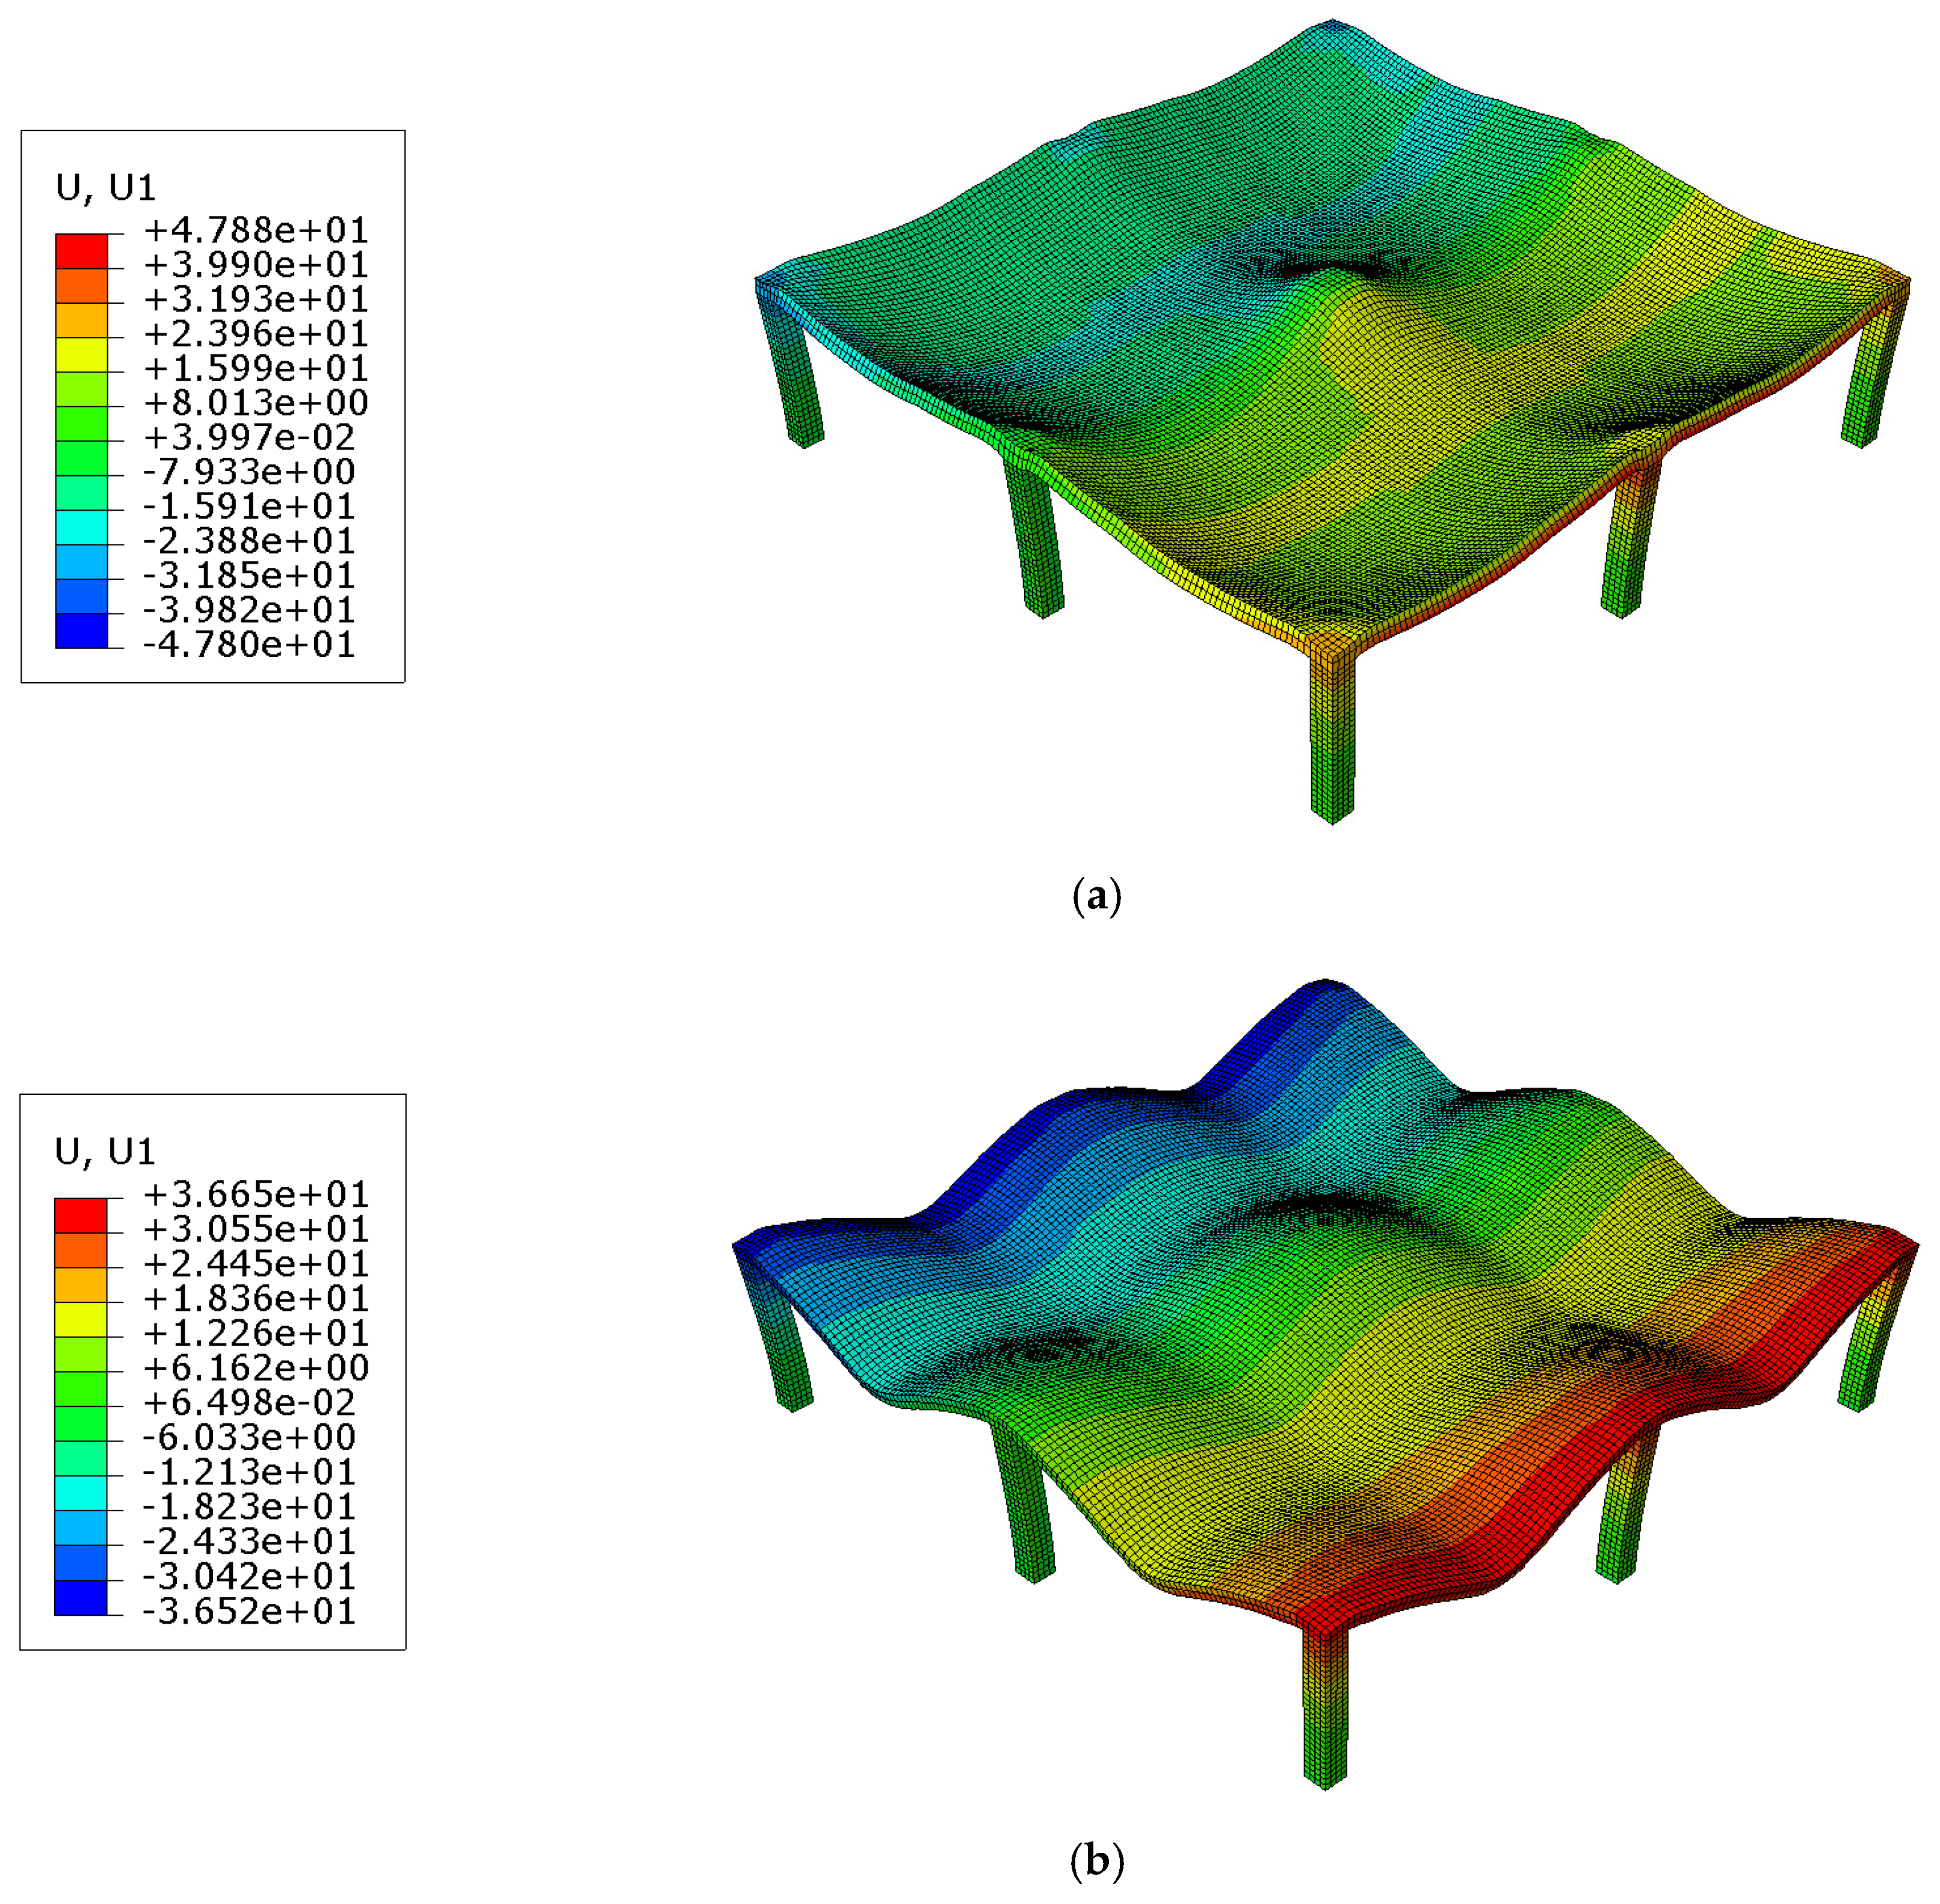
The slab’s thermal elongation exhibited considerable variation across the different exposure conditions, as depicted in Figure 22. Notably, after 120 min of exposure, the slab’s elongation was significantly more pronounced in the two-sided exposure scenario than in bottom- or top-only exposures. This thermal elongation of the slab resulted in substantial horizontal displacement of the columns. The column displacement in the two-sided exposure scenario surpassed that of the bottom-sided exposure by 84% and that of the top-sided exposure by 152%.
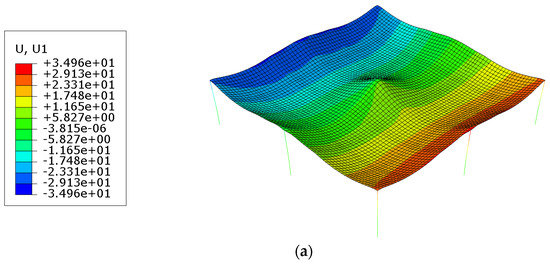
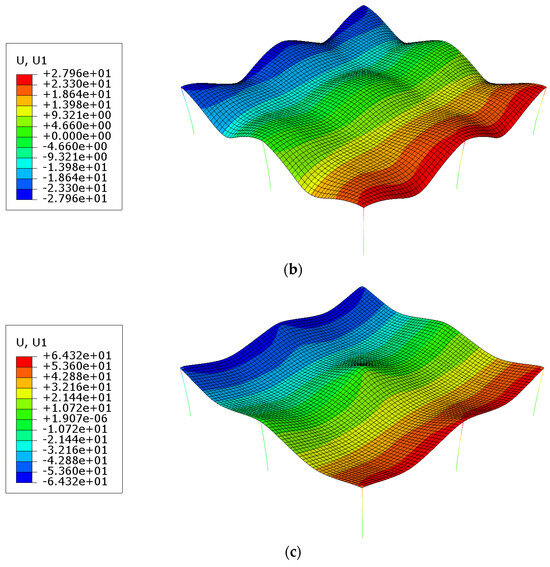
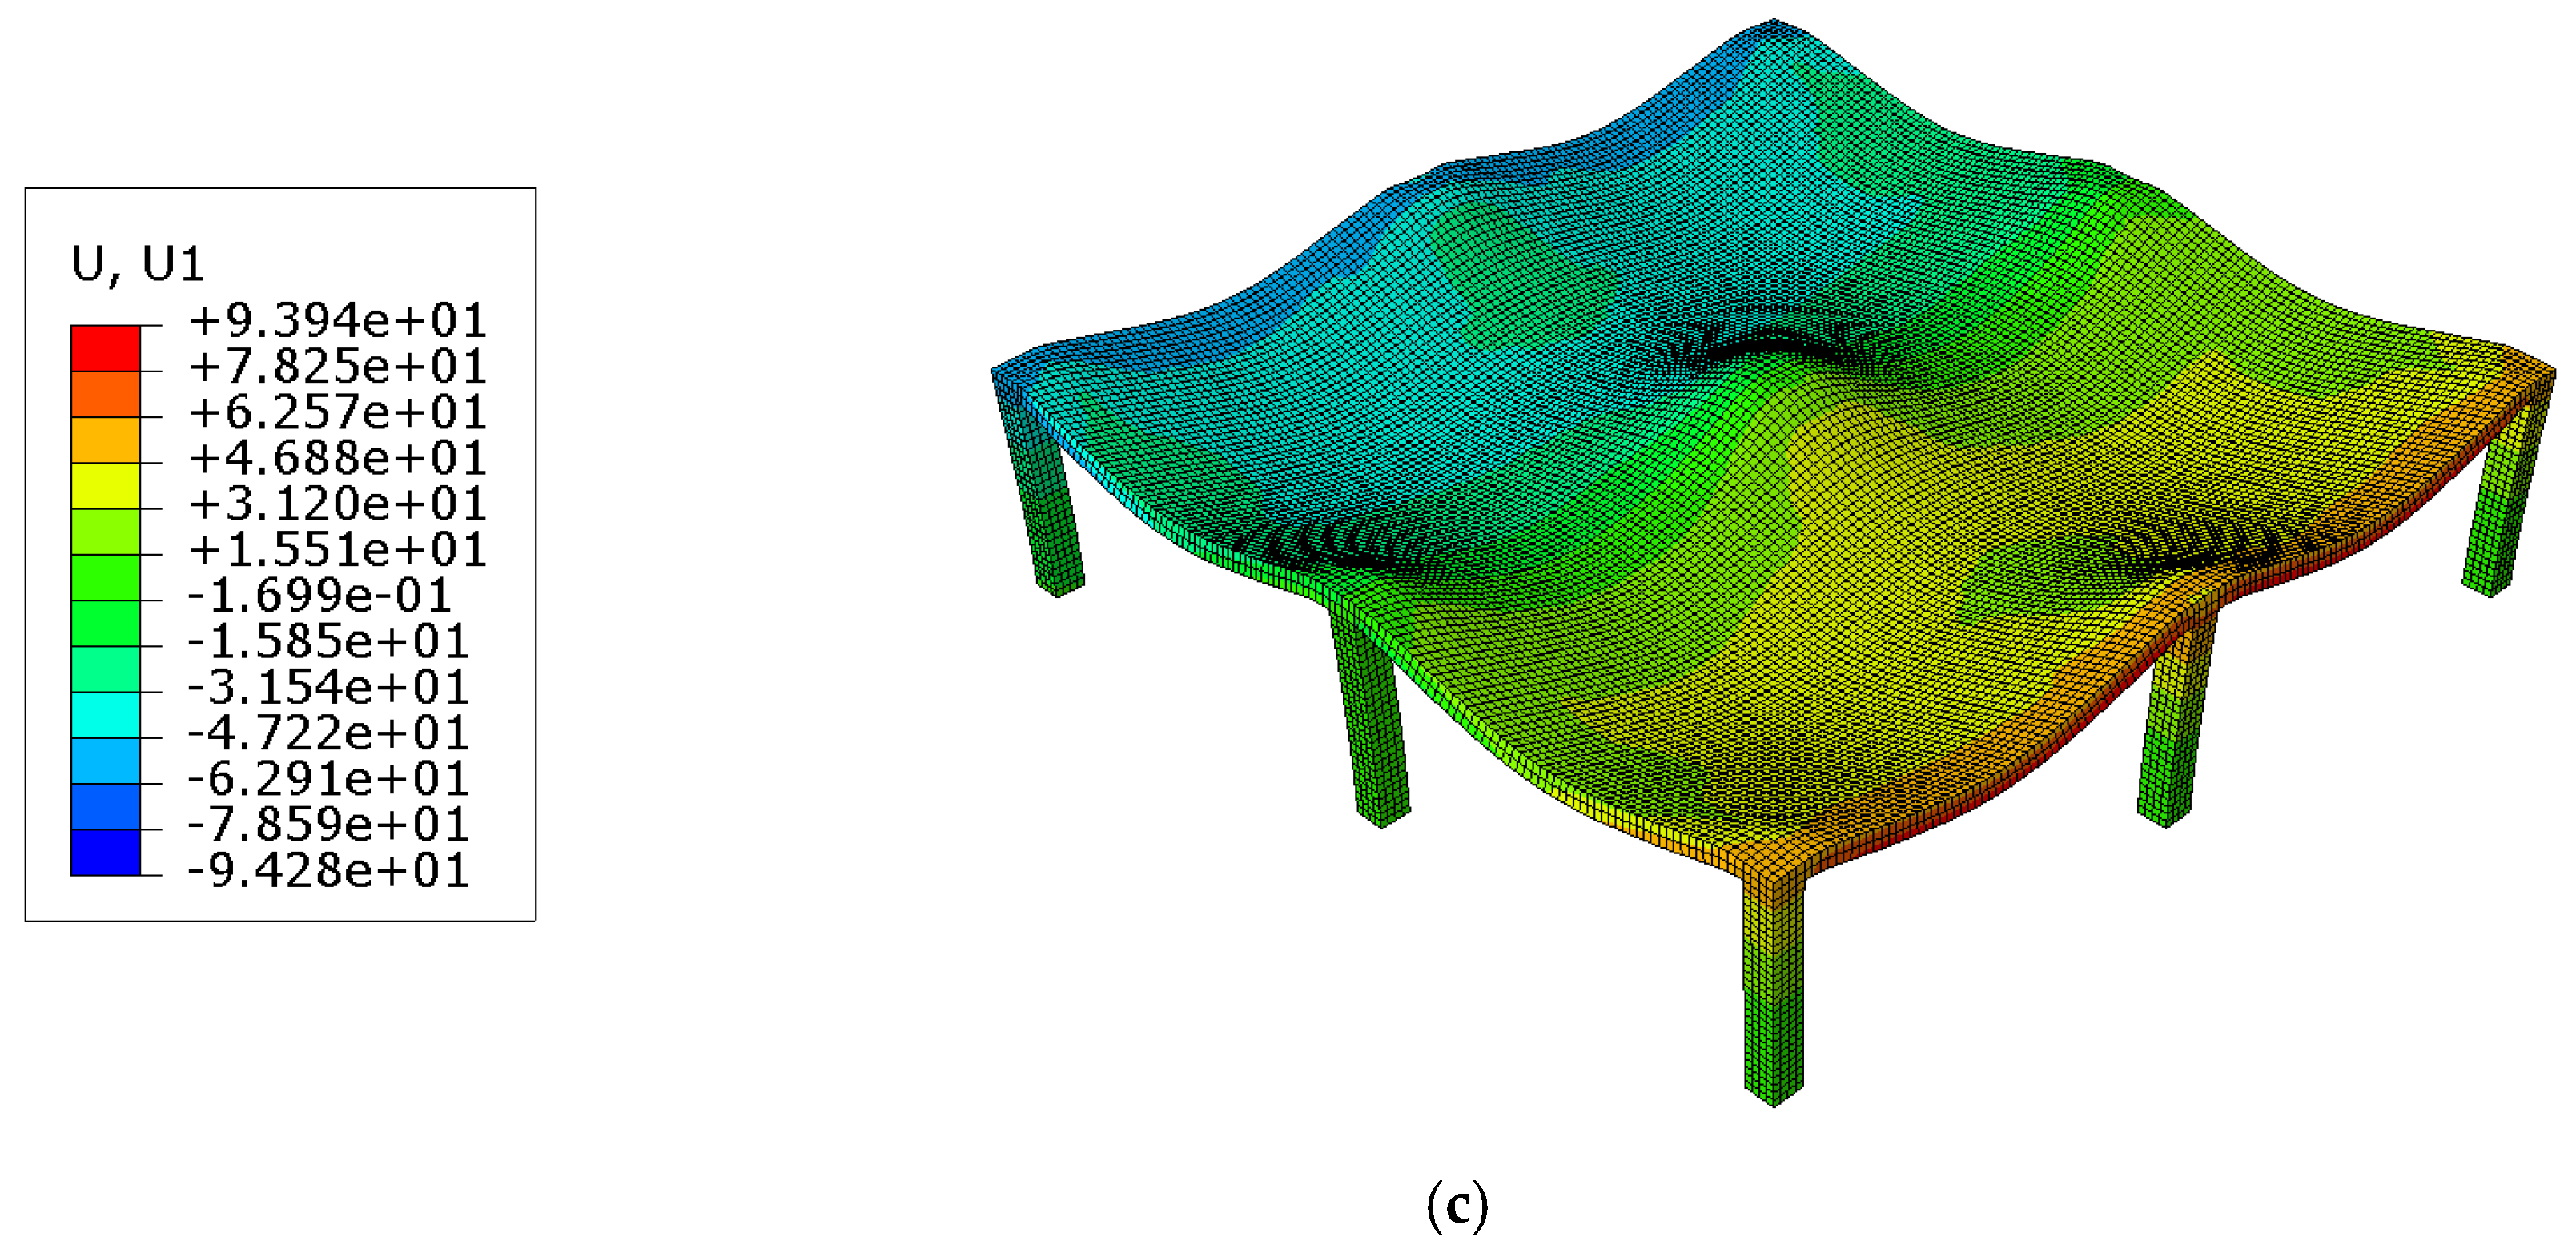
Figure 22.
Horizontal displacement of the flat slab after 120 min of fire exposure [values in mm]: (a) Exposure at the bottom surface, (b) Exposure at the top surface, and (c) Exposure at both top and bottom surfaces.
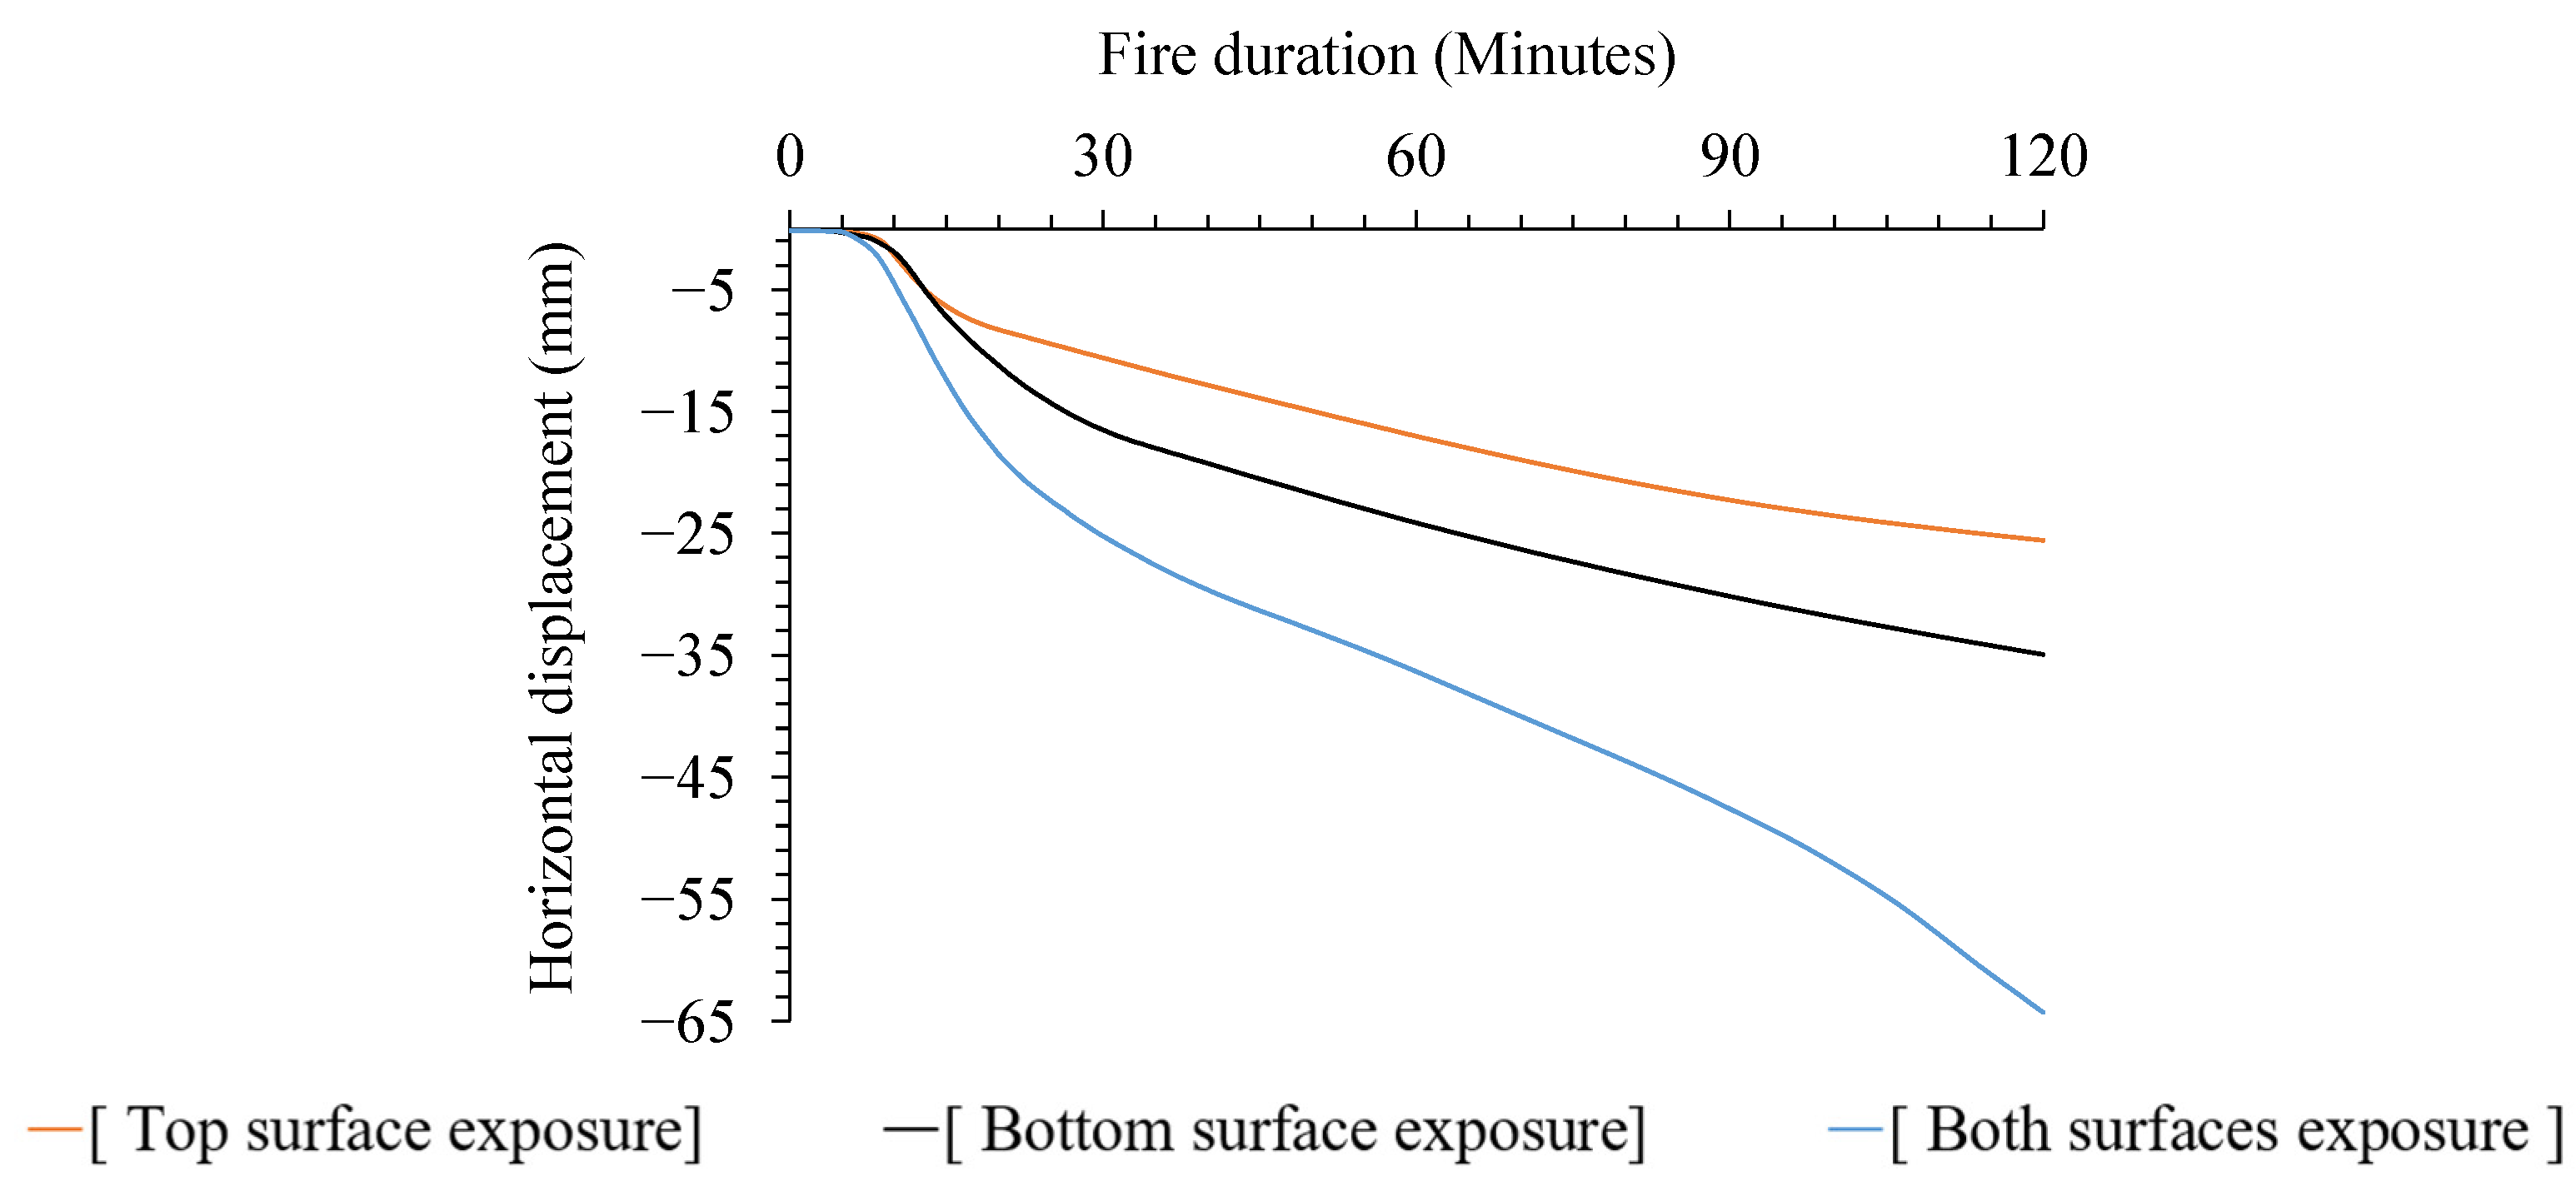
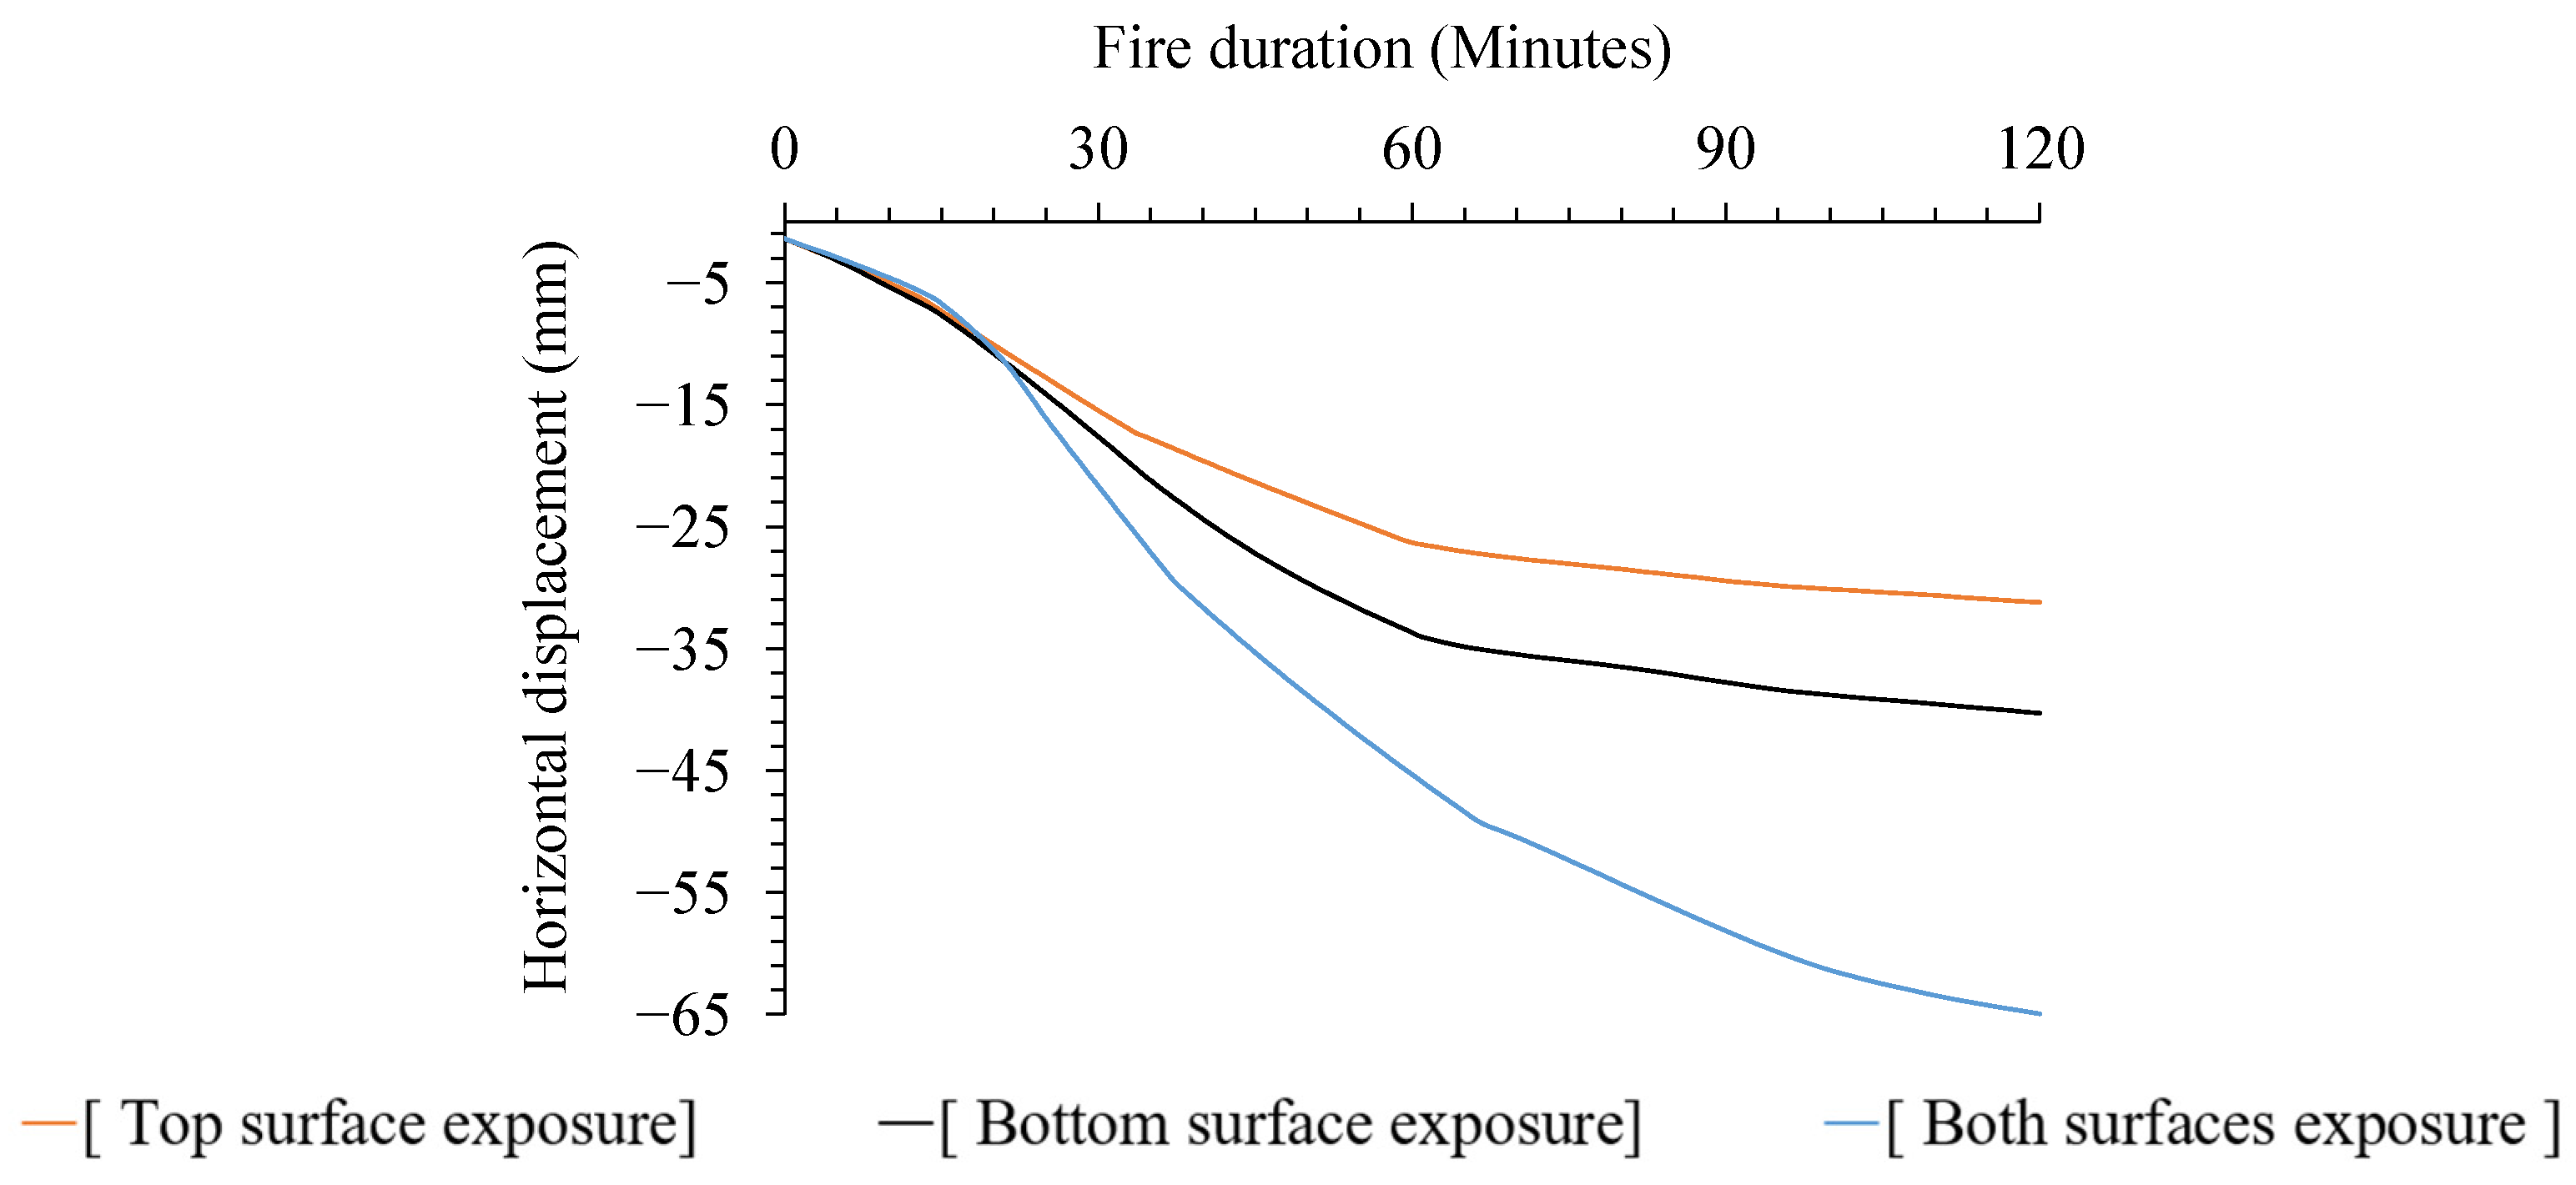
Figure 23 illustrates the horizontal displacement of the column at Point C, which is located at the top end of the column, as depicted in Figure 3. This displacement is a consequence of the axial expansion of the slab. Initially, under the influence of gravitational forces, Point C moved 0.124 mm. However, when thermal heating was applied to the underside, the horizontal motion at Point C progressively increased, reaching 34.9 mm at 120 min. In scenarios where the thermal load was applied to the upper surface, the deflections at Point C increased throughout the heat exposure, reaching 25.5 mm at 120 min. However, when the thermal load was applied to both the upper and lower sides, the displacement at point C continued to increase, resulting in a substantial displacement of 64.3 mm. Heating the floor slab from both sides resulted in significantly more thermal expansion than heating it from just one side. In the case of dual-sided exposure, the horizontal drift at the upper column top at 120 min was 84% higher than that of exposure from the bottom side and 152% higher than that of exposure at the top side alone. This substantial variance in drifts is attributed to the concurrent differential thermal expansion and weakening of materials that occur on both the upper and lower surfaces of the slab when subjected to heat from both sides.

Figure 23.
Horizontal displacement at the top of the column (Point C) as a function of fire duration.
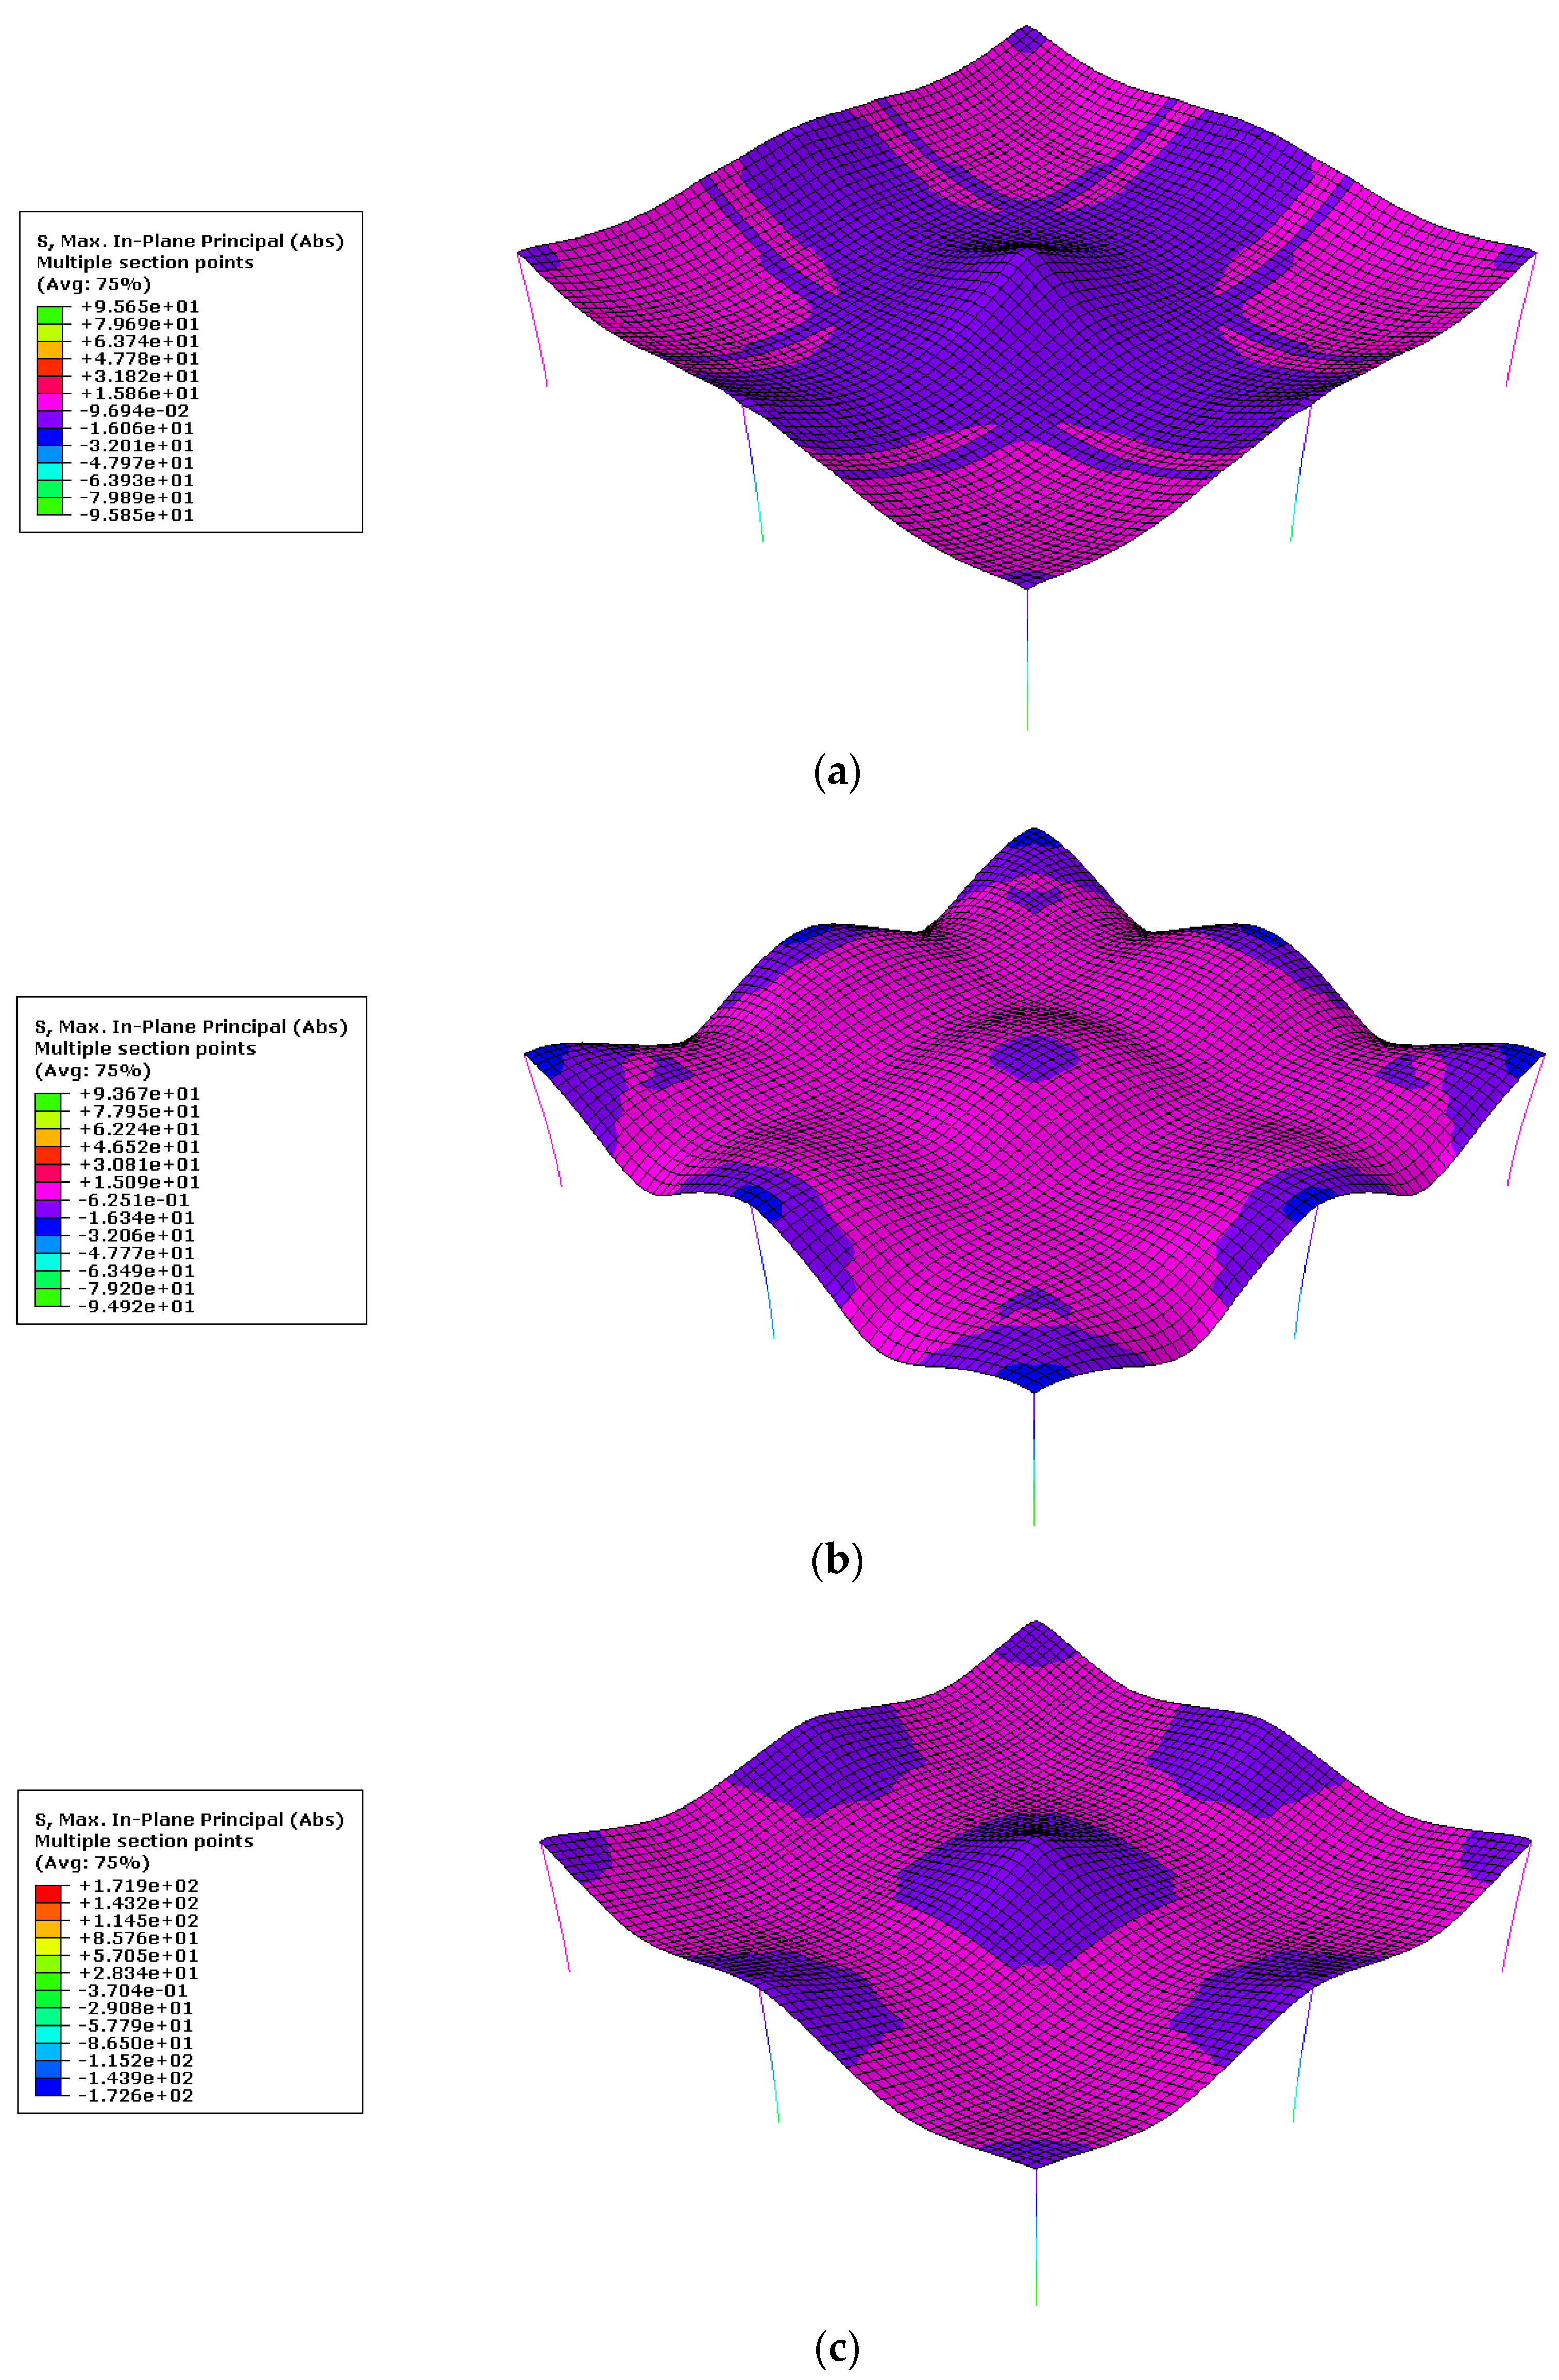
Figure 24 illustrates the distribution of maximum in-plane principal stresses in a flat plate structure after 120 min of the assumed three fire exposure scenarios. When exposed at the bottom surface (Figure 24a), higher stress concentrations develop near the bottom of the slab due to the steep thermal gradient and restraint against expansion. The stress distribution in this case is asymmetric, with the most intense stresses occurring in the lower regions. In contrast, when fire exposure is applied to the top surface, as shown in Figure 24b, the stress profile shifts upward. Elevated stress zones are observed near the top, where the thermal gradient reverses direction and significantly alters the internal stress response. For the case of exposure at both the top and bottom surfaces, as shown in Figure 24c, the stress distribution becomes more symmetric across the slab thickness. However, the intensity of the principal stresses increases overall due to the combined thermal effects acting from both sides. These results highlight the significant impact of fire exposure location on stress development within flat plate structures, which is crucial for assessing their structural performance and identifying potential failure mechanisms under fire conditions.

Figure 24.
Maximum in-plane principal stress distribution under different fire exposure scenarios [values in MPa]: (a) Exposure at the bottom surface, (b) Exposure at the top surface, and (c) Exposure at both top and bottom surfaces.
7. FE Solid Modelling of Prototype
The section presents the numerical model of the prototype slab under fire conditions using three-dimensional solid elements in ABAQUS 2020 [29]. The nonlinear behaviour of concrete under tension was modelled using a stress-crack displacement response. Previous research [30] found that the most accurate model is the exponential function formulated by Cornelissen et al. [31], illustrated by Equation (5).
where is the crack opening displacement, is the crack opening displacement at which stresses can no longer be transferred, which is equal to 5.14 () for normal-weight concrete.
The value of can be calculated using a concrete fracture energy approach [32]. CEB-FIB Model Code 1990 [33] proposed . The fracture energy’s base value () depends on the maximum aggregate size. The FIB Model Code provides values for based on aggregate size. Wittmann [34] proposed that , where is the maximum size of the aggregate. Despite the observed decrease in concrete fracture energy at elevated temperatures [35,36], data on its variation with temperature [36,37] remain scarce.
In the present study, the dependence of fracture energy on temperature was not considered, and a constant value of fracture energy was used, as proposed by Wittmann [34]. The exponential softening curve proposed by Cornelissen et al. [31] was employed. Concrete tensile strength at elevated temperatures is predicted by a simple reduction expression based on EC2-1-2 guidelines [18].
A sequential thermo-mechanical analysis assessed the performance of the prototype building during fire exposure. The numerical model employed a three-dimensional, 8-node linear heat transfer brick element (DC3D8) to represent the concrete slab and columns in the thermal analysis. Meanwhile, the reinforcing bars were modelled using a one-dimensional, 2-node heat transfer link element (DC1D2).
The thermal material properties of concrete and steel reinforcement were assigned to the elements following the EC2-1-2 guidelines [18] and the recommendations of Lie [20]. The floor slab was exposed to three previously described fire scenarios. Fire exposure was simulated using the ASTM E119 standard fire curve for two hours. Heat transfer to the slab’s surface occurred via radiation, with an emissivity value of 0.7, while the columns were assumed to remain thermally protected.
The model transitioned from thermal to structural analysis after completing the heat analysis. The DC3D8 solid elements representing the slab and columns, and the DC1D2 elements representing the steel reinforcement, were replaced by 3D stress elements: an 8-node linear brick element with reduced integration and hourglass control (C3D8R) for the concrete components and a 2-node linear 3D truss element (T3D2) for the steel reinforcement. Mechanical time-dependent temperature properties of concrete and steel, including modulus of elasticity, damage plasticity, thermal expansion, and temperature-dependent properties of reinforcement steel, were assigned to the elements according to the EC2-1-2 guidelines [18] and recommendations by Lie [20].
The perfect bond between steel rebars and concrete was implemented in solid modelling using the Abaqus Embedded Region technique. This method models reinforcements as truss elements embedded within the concrete (host region), ensuring a seamless interaction between the materials.
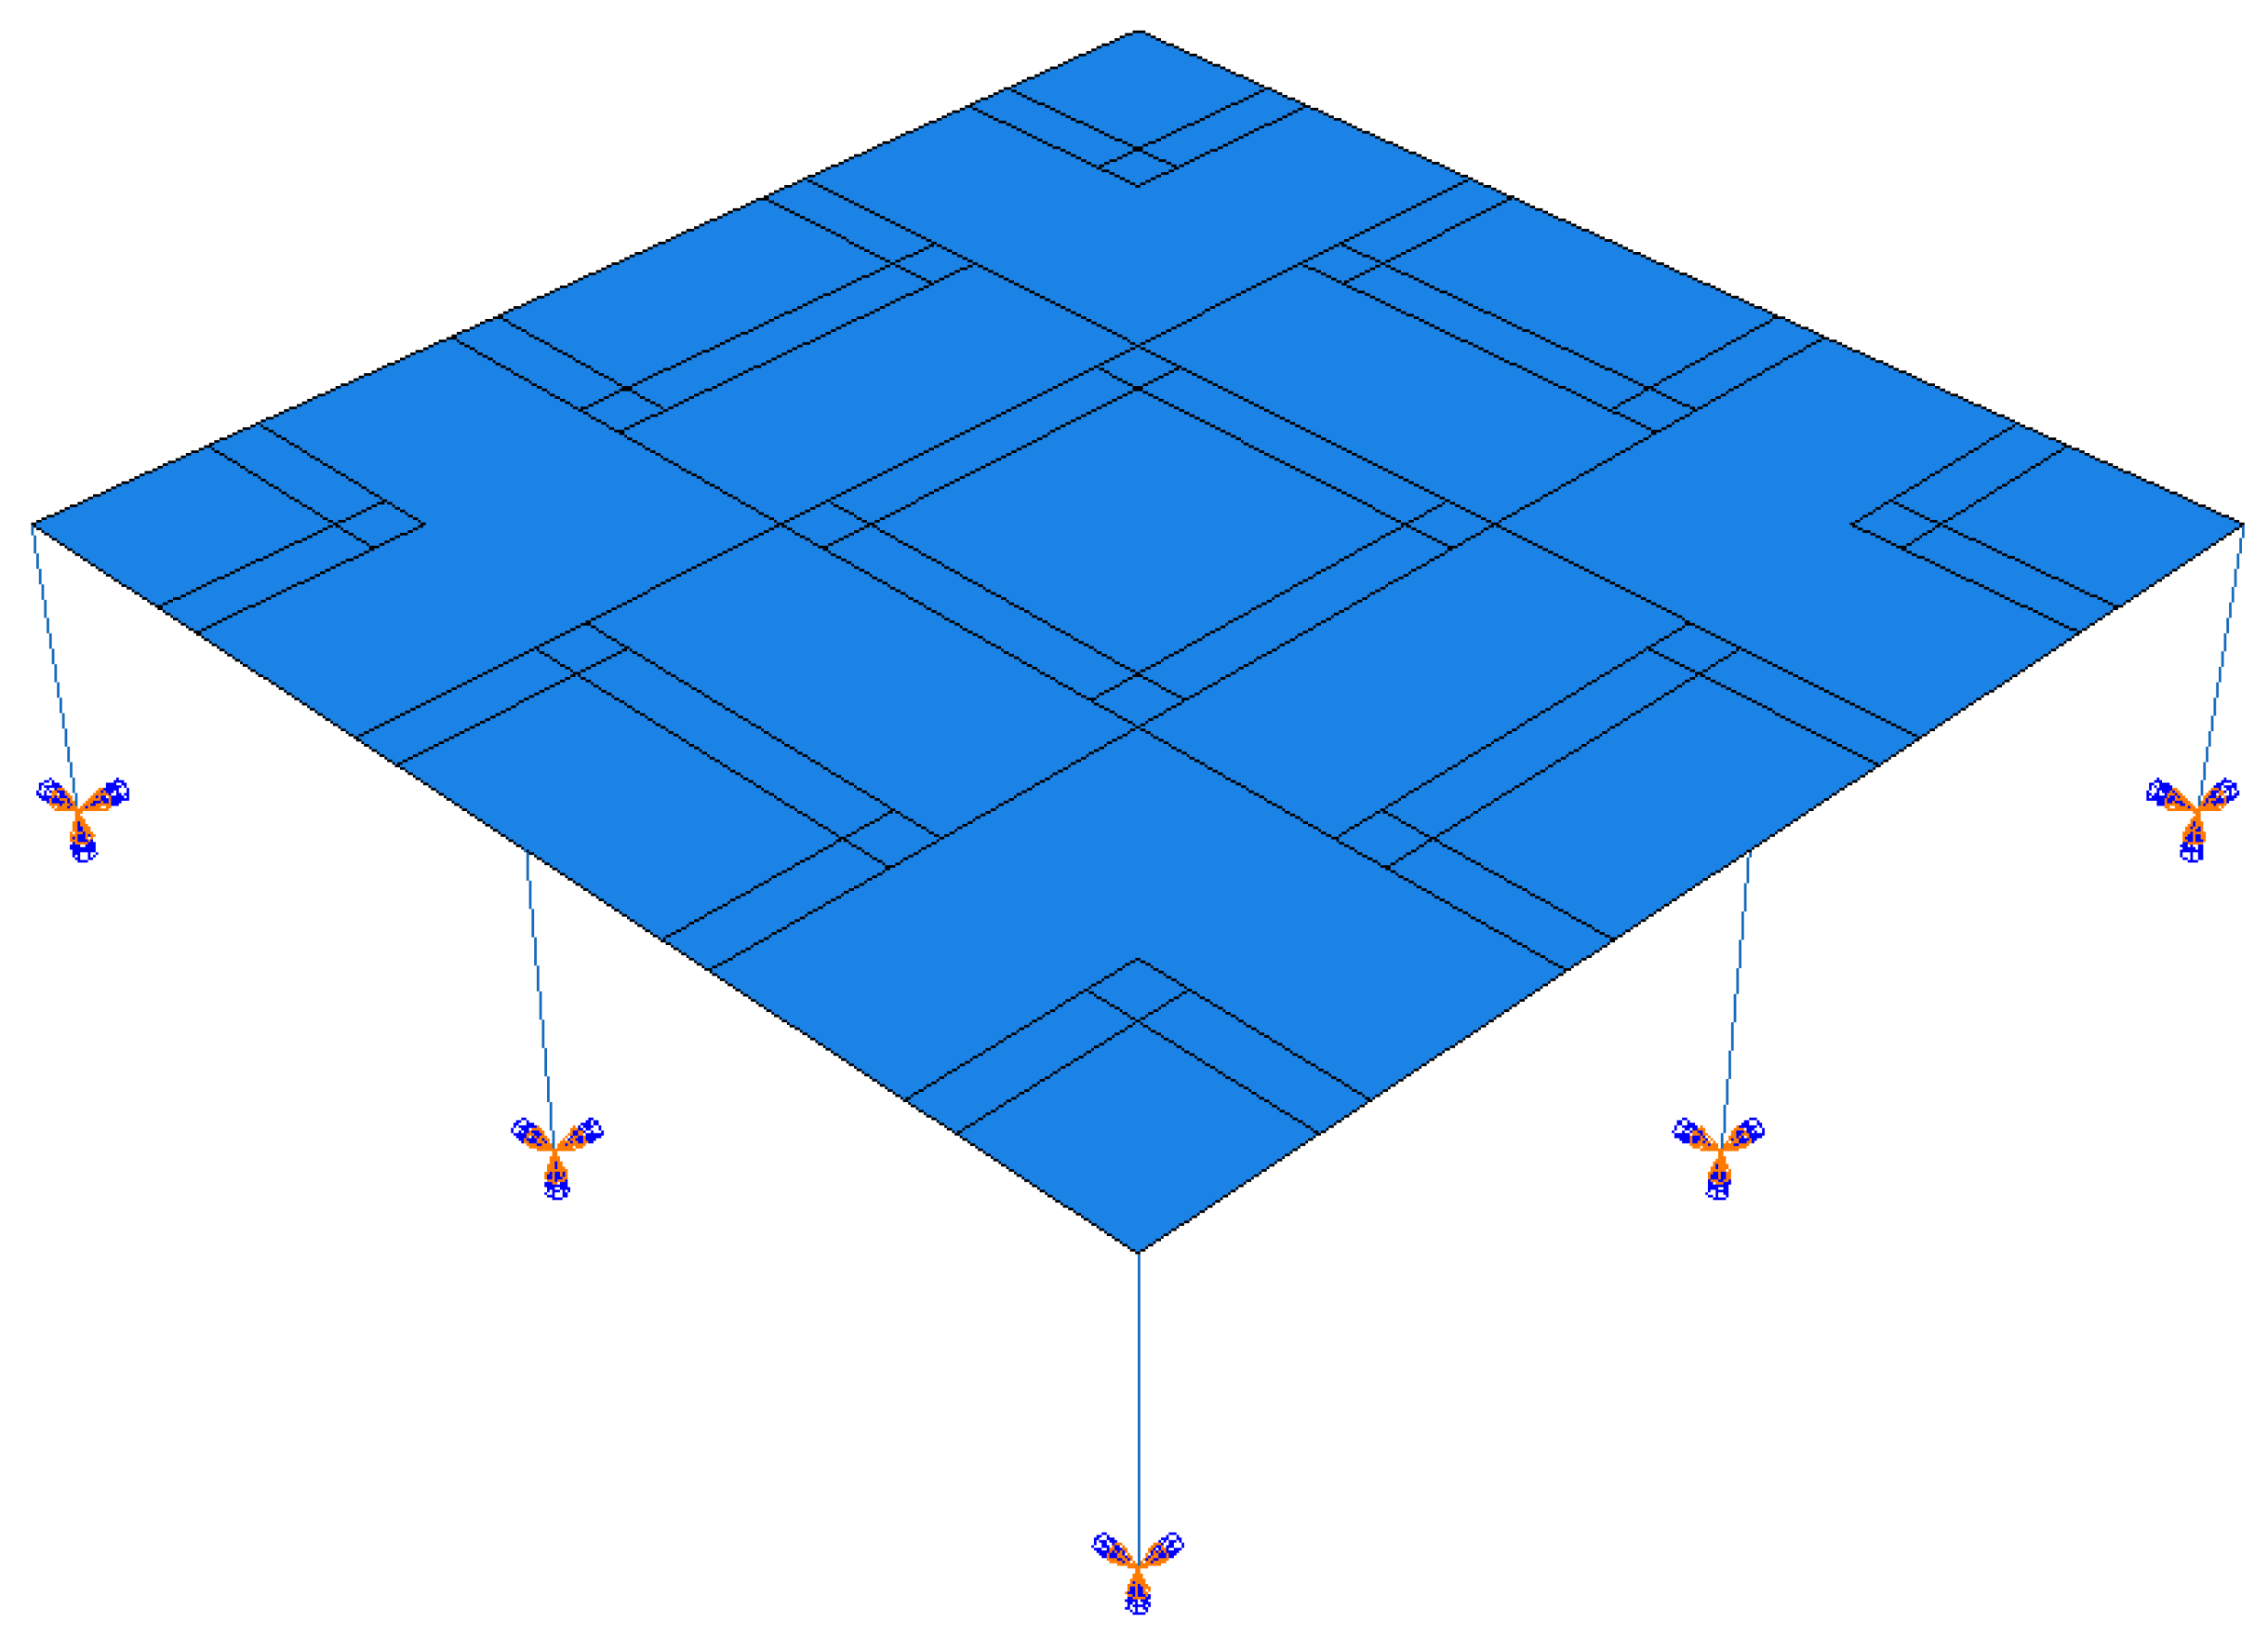
For slab–column connections, surface-to-surface contact with master–slave interactions was utilized in ABAQUS, with the columns fully fixed at their base. The mesh size was set to match half the thickness of the slab to mitigate convergence issues and reduce computational analysis time. Nonlinear analysis was executed using the ABAQUS general static solver. Figure 25 illustrates the FE model of the prototype.
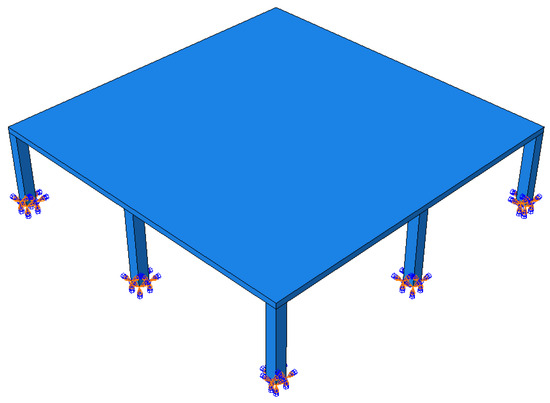
Figure 25.
FE model of the prototype.
FE Solid Performance
Figure 26 presents the vertically deformed shape of the prototype slab at 120 min under the three fire exposure scenarios. The deformed shapes under these scenarios show good agreement with the results obtained using shell modelling. Figure 27 depicts the slab’s vertical displacement at Points A and B. The absence of rotational degrees of freedom in the solid model contributes to differences in vertical deflections compared to the shell model results. Accurately capturing bending behaviour in the solid model would require dividing the slab thickness into many elements, significantly increasing computational cost. This limitation highlights the practicality of the shell model for global structural analysis.
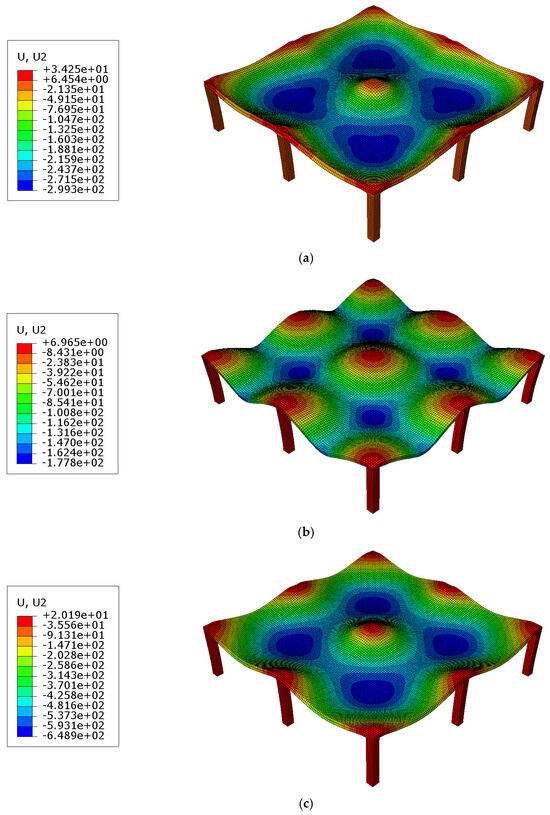
Figure 26.
Vertical displacement of the prototype slab after 120 min of fire exposure using solid elements [values in mm]: (a) Exposure at the bottom surface, (b) Exposure at the top surface, and (c) Exposure at both top and bottom surfaces.

Figure 27.
Vertical displacement at points A and B after 120 min of fire exposure (Solid Modelling).
Figure 28 shows the thermal expansion behaviour of the prototype slab at a 120 min fire duration for the three fire exposure scenarios. In Figure 29, the horizontal displacement of the column at Point C is displayed for the same three fire exposure scenarios, revealing that the solid model predicts higher column horizontal displacements than the shell model. This difference can be attributed to the inclusion of rotational degrees of freedom, which enable the slab to rotate and deform in response to lateral membrane forces induced by thermal deformations. This rotation facilitates better distribution of lateral loads caused by heat, potentially reducing stresses and limiting horizontal expansion. Additionally, the intrinsic kinematic constraints of the shell model may result in greater stiffness compared to the solid model, which could further contribute to the observed behaviour of reduced horizontal displacement.


Figure 28.
Horizontal displacement of the prototype slab after 120 min of fire exposure [values in mm]: (a) Exposure at the bottom surface, (b) Exposure at the top surface, and (c) Exposure at both top and bottom surfaces.

Figure 29.
Horizontal displacement at the top of the column (Point C) due to fire exposure.
In addition to the deformation fields presented, the finite element simulations provided insights into the stress distribution within the concrete slab under fire exposure. The analysis revealed that peak stress concentrations occurred primarily in regions subjected to the highest thermal gradients, notably near the mid-span of the slab and its support zones. These stress concentrations developed over time, correlating with the progression of thermal penetration and material degradation caused by elevated temperatures. The temporal evolution of stress patterns mirrored the deformation behaviour, with areas of significant deflection corresponding to regions of increased stress intensity. This correlation underscores the interplay between thermal loading and structural response, highlighting the critical regions susceptible to failure under fire conditions.
8. Modelling Decision Framework: Shell vs. Solid Elements
Accurate finite element modelling (FEM) is crucial for assessing the structural performance of flat plate systems under fire exposure. The choice between the shell and solid elements has a significant impact on the balance between computational efficiency and the fidelity of the stress–strain representation.
8.1. Shell Elements
Shell elements are well-suited for modelling thin structural components where the thickness is small relative to the other dimensions. They offer both translational and rotational degrees of freedom, enabling the efficient simulation of global behaviours such as bending and in-plane stretching. In our study, shell elements effectively captured the overall deformation patterns of the flat plate under various fire scenarios, providing reliable results with reduced computational demand.
8.2. Solid Elements
Solid elements are advantageous when detailed through-thickness stress analysis is required, particularly in regions susceptible to localized phenomena like spalling or cracking. They provide a comprehensive representation of three-dimensional stress states but at the cost of increased computational resources. In our simulations, solid elements were employed to investigate localized stress concentrations and failure mechanisms, offering deeper insights into the structural response under fire conditions.
8.3. Comparative Analysis
A comparative analysis was conducted between shell and solid element models to evaluate their performance in simulating structural response under fire exposure. The shell model, comprising 4491 nodes and 4351 elements, demonstrated a significant reduction in computational time, completing analyses approximately 15 times faster than the solid model, which consisted of 58,195 nodes and 39,420 elements. Importantly, the maximum mid-span deflection predicted by the shell model differed by less than 5% from that of the solid model, indicating that shell elements provide an efficient and accurate means for assessing global structural behaviour under fire conditions.
8.4. Decision Criteria
The specific objectives of the analysis should guide the selection between shell and solid elements:
- Global Structural Behaviour: Utilize shell elements for efficient modelling of overall deformation and load distribution.
- Localized Stress Analysis: Employ solid elements to capture detailed stress variations and potential failure zones.
- Computational Resources: Consider the available computational capacity, as solid models require significantly more resources.
This framework provides a systematic approach to element selection, ensuring that modelling efforts are aligned with the desired analytical outcomes.
9. Summary and Conclusions
This study presented a comprehensive finite element analysis of flat plate structures under fire exposure, utilizing both shell and solid elements to capture global and localized structural responses. Key findings include:
- Material Modelling: The tensile strength of concrete has a significant influence on its structural response. A peak stress value of provided a balanced representation between stiffness and flexibility, aligning well with experimental observations.
- Dilation Angle Sensitivity: Variations in the dilation angle between 30° and 40° had a negligible impact on deflection outcomes, suggesting that this parameter may be less critical in certain fire scenarios.
- Fire Exposure Scenarios: Two-sided fire exposure resulted in significantly higher deflections and thermal elongations compared to single-sided exposures. This increase is attributed to the elimination of temperature gradient-induced curvature restraint, a more uniform reduction in concrete stiffness across the slab thickness, and greater overall thermal expansion. These factors collectively led to approximately 1.9 times the deflection observed in bottom-only fire scenarios. This finding underscores the importance of considering dual-sided fire exposure in design assessments to ensure structural resilience.
- Column Displacements: Thermal elongation led to substantial horizontal displacements in columns, with two-sided exposure cases exhibiting up to 2.5 times greater displacement than top-sided exposure scenarios.
- Mesh Sensitivity: Solid models demonstrated sensitivity to mesh refinement, particularly in capturing through-thickness stress gradients. Incorporating temperature-dependent fracture energy models could enhance the accuracy of these simulations.
The insights gained from this study inform the selection of modelling techniques for flat plate structures under fire conditions, striking a balance between computational efficiency and the accuracy of stress and deformation predictions. Moreover, the findings underscore the need for design practices to consider the effects of dual-sided fire exposure, which can have a significant impact on structural performance.
10. Future Work
Building upon the findings of this study, several avenues for future research are proposed to enhance the modelling accuracy, computational efficiency, and practical applicability of finite element analyses for flat plate structures subjected to fire exposure:
- Incorporation of Temperature-Dependent Fracture Energy and Spalling Effects: Developing models that account for the degradation of concrete fracture energy at elevated temperatures is essential for accurately predicting crack propagation and failure mechanisms [38]. Additionally, integrating spalling phenomena into simulations can provide a more comprehensive understanding of structural integrity during fire events.
- Exploration of Non-Uniform and Travelling Fire Scenarios: Future studies should consider the impact of non-uniform fire exposures, such as travelling fires [39,40], on flat-plate structures. This research involves modelling varying fire intensities and durations across different slab areas to assess their impact on structural behaviour and failure modes.
- Analysis of Cooling Phase Effects: Investigating the structural response during the cooling phase after fire exposure is crucial, as residual stresses and potential re-cracking can significantly impact the long-term performance and safety of the structure.
- Validation Against Diverse Experimental Data: Expanding the validation of numerical models through comparison with a broader range of experimental results, including full-scale fire tests, will enhance the reliability and generalizability of simulation outcomes.
- Assessment of Alternative Structural Systems: Examining the fire performance of flat plate systems integrated with different lateral load-resisting mechanisms, such as shear walls or braced frames, and exploring the behaviour of post-tensioned slabs under fire conditions can provide insights into designing more resilient structures.
- Development of Simplified Design Tools: Creating user-friendly, simplified analytical methods or design charts based on validated finite element models can aid practicing engineers in assessing the fire performance of flat plate structures without resorting to complex simulations.
- Integration of Advanced Computational Techniques: Leveraging machine learning and artificial intelligence to predict structural responses under fire exposure can offer rapid assessment tools. Training models on extensive simulation and experimental data sets can facilitate the development of predictive algorithms for structural performance.
Addressing these research areas will contribute to the advancement of structural fire engineering, enabling the design of safer and more efficient flat plate structures that can withstand the challenges posed by fire.
Author Contributions
Conceptualization, M.A.Y.; methodology, M.A.Y. and M.H.; software (Modeling), M.H.; validation, M.H.; formal analysis, M.H.; investigation, M.H.; resources, M.A.Y. and M.H.; data curation, M.H.; writing—original draft preparation, M.H.; writing—review and editing, M.A.Y. and S.E.-F.; visualization, M.H.; supervision, M.A.Y. and S.E.-F.; project administration, M.A.Y.; funding acquisition, M.A.Y. All authors have read and agreed to the published version of the manuscript.
Funding
The authors are grateful for the financial support provided by the Libyan Ministry of Education, the National Science and Engineering Research Council of Canada (NSERC), and Western University.
Data Availability Statement
All data generated or analyzed during this study are included in this published article.
Conflicts of Interest
The authors declare that they have no known competing financial interests or personal relationships that could have appeared to influence the work reported in this paper.
References
- Earij, A.; Alfano, G.; Cashell, K.; Zhou, X. Nonlinear three-dimensional finite-element modelling of reinforced-concrete beams: Computational challenges and experimental validation. Eng. Fail. Anal. 2017, 82, 92–115. [Google Scholar] [CrossRef]
- Ab-Kadir, M.A.; Awal, A.A. Finite element modelling of reinforced concrete slab at elevated temperature using ABAQUS. Appl. Mech. Mater. 2015, 752, 623–627. [Google Scholar] [CrossRef]
- Al Hamd, R.K.S. Punching Shear in Heated Interior Reinforced Concrete Slab-Column Connections. Ph.D. Thesis, The University of Manchester, Manchester, UK, 2018. [Google Scholar]
- Buchanan, A.H.; Abu, A.K. Structural Design for Fire Safety; John Wiley & Sons: Chichester, UK, 2017. [Google Scholar]
- Webster, B. Which Abaqus Element Type Should My Finite Element Analysis (FEA) Simulation Use? Fidelis, 2021. Available online: https://www.fidelisfea.com/post/which-abaqus-element-type-should-my-finite-element-analysis-fea-simulation-use (accessed on 5 April 2024).
- George, S.J. Structural Performance of Reinforced Concrete Flat-Plate Buildings Subjected to Fire. Master’s Thesis, University of Nevada, Las Vegas, NV, USA, 2012. [Google Scholar]
- Grassl, P.; Jirásek, M. Plastic model with non-local damage applied to concrete. Int. J. Numer. Anal. Methods Geomech. 2006, 30, 71–90. [Google Scholar] [CrossRef]
- Puddicome, T. Finite Element Analysis of Reinforced Concrete and Steel Fiber Reinforced Concrete Slabs in Punching Shear. Ph.D. Thesis, Memorial University of Newfoundland, St. John’s, NL, Canada, 2018. [Google Scholar]
- Genikomsou, A.S.; Polak, M.A. Finite-element analysis of reinforced concrete slabs with punching shear reinforcement. J. Struct. Eng. 2016, 142, 04016129. [Google Scholar] [CrossRef]
- Annerel, E.; Taerwe, L.; Merci, B.; Jansen, D.; Bamonte, P.; Felicetti, R. Thermo-mechanical analysis of an underground car park structure exposed to fire. Fire Saf. J. 2013, 57, 96–106. [Google Scholar] [CrossRef]
- Arna’ot, F.H.; Abid, S.R.; Özakça, M.; Tayşi, N. Review of concrete flat plate-column assemblies under fire conditions. Fire Saf. J. 2017, 93, 39–52. [Google Scholar] [CrossRef]
- El-Tayeb, E.H.M.; El-Metwally, S.E.; Askar, H.H.; Yousef, A.M. Analysis of RC flat slab system for thermal loads. Int. J. Eng. Innov. Technol. 2015, 4, 62–73. [Google Scholar]
- George, S.J.; Tian, Y. Structural performance of reinforced concrete flat plate buildings subjected to fire. Int. J. Concr. Struct. Mater. 2012, 6, 111–121. [Google Scholar] [CrossRef]
- Moss, P.J.; Dhakal, R.P.; Wang, G.; Buchanan, A.H. The fire behaviour of multi-bay, two-way reinforced concrete slabs. Eng. Struct. 2008, 30, 3566–3573. [Google Scholar] [CrossRef]
- ISO 834; Fire-Resistance Tests—Elements of Buildingonstruction. ISO: Geneva, Switzerland, 1975.
- Wahid, N.; Stratford, T.; Bisby, L. Calibration of concrete damage plasticity model parameters for high temperature modelling of reinforced concrete flat slabs in fire. Appl. Struct. Fire Eng. 2019, 1, 1–8. [Google Scholar]
- Lim, L.; Buchanan, A.; Moss, P.; Franssen, J.-M. Numerical modelling of two-way reinforced concrete slabs in fire. Eng. Struct. 2004, 26, 1081–1091. [Google Scholar] [CrossRef]
- ENV 1992-1-2; Eurocode 2. Design of Concrete Structures, Part 1–2: General Rules—Structural Fire Design. European Committee for Standardization: Brussels, Belgium, 2004.
- Genikomsou, A.S.; Polak, M.A. Finite element analysis of punching shear of concrete slabs using damaged plasticity model in ABAQUS. Eng. Struct. 2015, 98, 38–48. [Google Scholar] [CrossRef]
- Lie, T.T. (Ed.) Structural Fire Protection; ASCE Manuals and Reports on Engineering Practice No. 78; American Society of Civil Engineers: Reston, VA, USA, 1992. [Google Scholar]
- ASTM E119; Standard Test Methods for Fire Tests of Building Construction and Materials. ASTM International: West Conshohocken, PA, USA, 2007; Volume 4, p. 436.
- BS 476-20:1987; Fire Tests on Building Materials and Structures—Part 20: Method for Determination of the Fire Resistance of Elements of Construction (General Principles). BSI: London, UK, 1987.
- Elshorbagi, M.; AlHamaydeh, M. Simulation of RC beams during fire events using a nonlinear numerical fully coupled thermal-stress analysis. Fire 2023, 6, 57. [Google Scholar] [CrossRef]
- Canadian Standards Association. Design of Concrete Structures (CSA A23.3-19); CSA Group: Mississauga, ON, Canada, 2019. [Google Scholar]
- Collins, M.P.; Mitchell, D. Prestressed Concrete Basics; Canadian Prestressed Concrete Institute: Ottawa, ON, Canada, 1987. [Google Scholar]
- Burgess, I.; Sahin, M. Tensile Membrane Action of Lightly-Reinforced Rectangular Composite Slabs in Fire. Structures 2018, 16, 176–197. [Google Scholar] [CrossRef]
- Smith, H.K.M. Punching Shear of Flat Reinforced-Concrete Slabs under Fire Conditions. Ph.D. Thesis, The University of Edinburgh, Edinburgh, UK, 2016. [Google Scholar]
- Liao, J.S.; Cheng, F.P.; Chen, C.C. Fire resistance of concrete slabs in punching shear. J. Struct. Eng. 2014, 140, 04013025. [Google Scholar] [CrossRef]
- Dassault Systèmes Simulia Corp. ABAQUS/Standard User’s Manual, Version 6.14; Dassault Systèmes Simulia Corp.: Providence, RI, USA, 2014. [Google Scholar]
- Malm, R. Shear Cracks in Concrete Structures Subjected to In-Plane Stresses. Ph.D. Thesis, KTH Royal Institute of Technology, Stockholm, Sweden, 2006. [Google Scholar]
- Cornelissen, H.; Hordijk, D.; Reinhardt, H. Experimental determination of crack softening characteristics of normalweight and lightweight concrete. Heron 1986, 31, 45–56. [Google Scholar]
- Rafi, M.M.; Nadjai, A.; Ali, F. Analytical modeling of concrete beams reinforced with carbon FRP bars. J. Compos. Mater. 2007, 41, 2675–2690. [Google Scholar] [CrossRef]
- CEB-FIP. Design of Concrete Structures: CEB-FIP Model Code 1990; British Standards Institution: London, UK, 1993. [Google Scholar]
- Wittmann, F.H. Crack formation and fracture energy of normal and high strength concrete. Sadhana 2002, 27, 413–423. [Google Scholar] [CrossRef]
- Brameshuber, W.; Hilsdorf, H.K. Development of strength and deformability of very young concrete. In Fracture of Concrete and Rock; Shah, S.P., Swartz, S.E., Eds.; Springer: New York, NY, USA, 1989; pp. 23–35. [Google Scholar]
- Rafi, M.M.; Nadjai, A.; Ali, F. Analytical behaviors of steel and CFRP reinforced concrete beams in fire. J. ASTM Int. 2010, 7, JAI102641. [Google Scholar] [CrossRef]
- De Borst, R.; Peeters, P.P. Analysis of concrete structures under thermal loading. Comput. Methods Appl. Mech. Eng. 1989, 77, 293–310. [Google Scholar] [CrossRef]
- Gernay, T.; Franssen, J.-M. A formulation of the Eurocode 2 concrete model at elevated temperature that includes an explicit term for transient creep. Fire Saf. J. 2012, 51, 1–9. [Google Scholar] [CrossRef]
- Bolina, F.L.; Fachinelli, E.G.; Rodrigues, J.P.C. Analysis of Building Structures Subjected to Electric Vehicle Fires. J. Build. Eng. 2025, 107, 112769. [Google Scholar] [CrossRef]
- Yuzbasi, J.; Arslan, H.M. Applied Element Method and Finite Element Method for Progressive Collapse Assessment: A Comparative Study on the Influence of Slab Types, Thicknesses, and Damping via Three Incremental Column Removals. Structures 2025, 73, 108358. [Google Scholar] [CrossRef]


Disclaimer/Publisher’s Note: The statements, opinions and data contained in all publications are solely those of the individual author(s) and contributor(s) and not of MDPI and/or the editor(s). MDPI and/or the editor(s) disclaim responsibility for any injury to people or property resulting from any ideas, methods, instructions or products referred to in the content. |
© 2025 by the authors. Licensee MDPI, Basel, Switzerland. This article is an open access article distributed under the terms and conditions of the Creative Commons Attribution (CC BY) license (https://creativecommons.org/licenses/by/4.0/).