Article

Effects of Rectangular Obstacles on the Flow Characteristics of Ultrafine Dry Powder Fire Extinguishing Agent in Confined Spaces

1
Key Laboratory of Civil Aviation Thermal Hazards Prevention and Emergency Response, Civil Aviation University of China, Tianjin 300300, China
2
School of Safety Science and Engineering (School of Emergency Management), Nanjing University of Science and Technology, Nanjing 210094, China
*
Authors to whom correspondence should be addressed.
Fire 2025, 8(6), 236; https://doi.org/10.3390/fire8060236
Submission received: 26 May 2025 / Revised: 15 June 2025 / Accepted: 16 June 2025 / Published: 18 June 2025
(This article belongs to the Special Issue Building Fire Prediction and Suppression)

Abstract

This study establishes a transient numerical model for the gas–solid two-phase flow of ultrafine dry powder fire extinguishing agents released in the confined space based on the Fluent software platform. The model investigates the spatial flow and diffusion characteristics of ultrafine dry powder under different obstacle volumes and relative positions. The results show that when an obstacle is present, two recirculation zones are formed by the upper surface of the obstacle, and a low-concentration unfavorable region is created around the obstacle. The concentration difference in ultrafine dry powder between the upper and lower recirculation zones increases monotonically with the obstacle volume. When the obstacle volume increases from 8 dm3 to 15.7 dm3, the concentration difference between the upper and lower zones increases by 5 times at 3.2 s. The time required for the average concentration in both zones to reach the minimum extinguishing concentration, as well as the reduction rate of the normalized characteristic dimension of the adverse region, follows an approximately exponential trend with changes in obstacle volume. The concentration difference between the upper and lower recirculation zones decreases as the distance between the obstacle and the nozzle increases. Compared to the upper position, the concentration difference decreases by 89% and 108% when the obstacle is positioned in the middle and lower parts at 3.2 s, respectively. And the reduction rate of the normalized characteristic dimension increases by 12% and 60% when the obstacle is positioned in the middle and lower parts, respectively.

1. Introduction

Automatic sprinkler systems are the primary fire extinguishing method in building fire protection, but their limitations become evident in confined spaces such as electrical equipment rooms, commercial kitchens, and heritage buildings. Water spray can cause collateral damage to energized electrical equipment, exhibits insufficient effectiveness against oil-based fires in kitchen environments, and fails to resolve the smoldering combustion phenomena unique to historic buildings. Therefore, research on alternative fire suppression agents for confined spaces has garnered substantial attention. Among these alternatives, ultrafine dry powder fire extinguishing agents have garnered significant attention owing to their commendable environmental performance and exceptional fire suppression efficiency [1,2,3].
In recent years, substantial research has been conducted globally on ultrafine dry powder fire extinguishing agents. These studies have primarily concentrated on the development of novel ultrafine dry powder formulations [1,2,3,4], the modification of existing agents to enhance their performance [5,6,7,8,9,10,11,12,13], the measurement of agent concentration for effective suppression [14,15], and the inhibition mechanisms of ultrafine dry powders [16,17,18]. For example, Zhao et al. [19] explored the effectiveness of Fe3+ loaded ZSM-5 zeolite in enhancing the fire extinguishing ability of ultrafine dry powder fire extinguishing agents. In addition, adding flame retardants such as copper oxide [20] to ultrafine dry powder for compounding to improve its fire extinguishing performance is also a promising research direction. Additionally, a limited number of investigations have delved into the flow characteristics of these agents. For instance, Fu Haiyan et al. [21] employed the Eulerian two-fluid model within Fluent software to simulate the movement of ultrafine BC dry powder extinguishing agent in a horizontal straight tube, revealing distinct flow behavior patterns and analyzing the impact of varying carrier gas inlet velocities on pressure drop per unit length. Lu Cheng et al. [22] contributed by developing a mathematical framework that describes the application, flow, and diffusion of ultrafine dry powder extinguishing agents during the fire suppression process. They simulated and analyzed the flow rate and concentration distribution of the agent in detail. Ji Jingwei et al. [23] established a simulation model for the flow of ultrafine dry powder extinguishing agent in horizontal straight pipes, emphasizing the analysis of frictional resistance and volume fraction changes along the pipe. They also explored how the initial volume fraction of the agent influences cross-sectional velocity within the pipeline. Cai Yuwu et al. [24] designed an experimental setup to study the spraying and release of ultrafine dry powder extinguishing agent in horizontal straight pipes. Their research focused on the release process, pressure drop along the pipe, and the critical filling ratio of the agent under different conditions of filling ratio and initial charging pressure. Hua Min et al. [25] utilized laser measurement techniques to study the flow process and mass distribution characteristics of particles during jetting, settling, and diffusion within a confined space. They analyzed the mass concentration of particulate extinguishing agent at various points over time after release. Liu Rulin et al. [26] developed a three-dimensional CFD model to simulate the transport and dispersion of Halon 1301 in pipelines and aircraft cabins, and conducted agent concentration tests in a simulated engine nacelle, with experimental results showing good agreement with simulation results. Collectively, these studies provide valuable insights into the behavior and applications of ultrafine dry powder fire suppression agents, contributing to the development of more efficient and environmentally friendly fire-extinguishing technologies for building fire protection and other critical applications.
The majority of existing studies have concentrated on the flow and transportation properties of ultrafine dry powder extinguishing agents within pipelines, primarily aiming to inform the design of pipeline networks for fire extinguishing systems. While a limited number of investigations have examined the flow and diffusion behaviors of ultrafine dry powder in confined spaces, there remains a notable dearth of research regarding the spatial flow and diffusion characteristics of these agents. Obstacles also significantly influence the fire-extinguishing performance of suppressants [27], yet research in this area remains limited. To address this gap, the present paper establishes a simulation model to analyze the spatial flow and diffusion characteristics of ultrafine dry powder fire extinguishing agents. This model is employed to investigate the influence of obstacles on the flow and diffusion behaviors of ultrafine dry powder in confined spaces and ultimately aims to provide valuable insights for the application of ultrafine dry powder in confined spaces.

2. CFD Modeling and Numerical Calculation Schemes

2.1. Governing Equation

A three-dimensional transient computational model of the spatial flow diffusion characteristics of ultrafine dry powder fire extinguishing agent in the presence of rectangular obstacles is established by Fluent software 2024 R1. The physical model is shown in Figure 1a, which is a cube with a side length of 1 m. A structured hexahedral mesh is used to mesh the whole computational domain, and the typical division effect is shown in Figure 1b. Ultrafine powders are tiny solid particles, and its flow process in space is a typical gas–solid two-phase flow, in which the driving gas is the continuous phase and the ultrafine powder particles are the discrete phase [28]. Due to the relatively large volume concentration of solid particles in the confined space after the spraying of ultrafine dry powders, which does not conform to the assumption that the volume fraction of the discrete phase needs to be sufficiently low in the standard Lagrangian multiphase model, the dense discrete phase model (DDPM) is employed to accurately characterize the particle phase in order to overcome this limitation. The mass and momentum conservation equations are as follows [29].
Mass conservation equation:
t α p ρ p + 𝛻 · α p ρ p v p = q = 1 n p h a s e s ( m ˙ q p m ˙ p q )
Momentum conservation equation:
t α p ρ p v p + 𝛻 · α p ρ p v p 2 = α p 𝛻 P + 𝛻 · α p μ p 𝛻 v p + 𝛻 v p T + α p ρ p g + F v m , l i f t + q = 1 n p h a s e s ( K q p v q v p + m ˙ p q v p q m ˙ q p v q p ) + K D P M ( v D P M v p ) + S D P M , e x p l i c i t
The momentum exchange term in Equations (1) and (2) is divided into an explicit part, S D P M , e x p l i c i t , and an implicit part, where v D P M represents the particle-averaged velocity of the discrete phase under consideration and K D P M represents its particle-averaged inter-phase momentum exchange coefficient.

2.2. Turbulence Model

In Fluent software, the k-ε model includes three common variants based on RANS [30]: the standard k-ε model, the realizable k-ε model, and the RNG k-ε model. Researchers have conducted numerous comparative studies to investigate the applicability of these three turbulence models under different conditions, including wind flow diffusion behind windbreaks [31], gaseous pollutant dispersion at low wind speeds [32], and natural ventilation in typical open and semi-open urban environments under different wind directions [33]. These studies found that each model has its advantages under specific conditions. Tominaga et al. [34] used different k-ε models to predict flow and dispersion in a cubic building with a roof vent. Their comparative analysis revealed that the RNG model showed good agreement with experimental results, outperforming the standard k-ε model and the realizable k-ε model.
In order to improve the calculation accuracy of the flow characteristics of ultrafine dry powder in the realized space, the RNG k-ε model is chosen in this paper, in which the specific expressions of k and ε are shown in Equations (3) and (4), respectively [29].
k t + U j k x j = x j ν t σ k k x j + p k ε
ε t + U j x j ¯ ε = x j ν t σ ε ε x j + ε k C ε 1 * P k C ε 2 ε
In the equation, p k = v t S 2 , σ k = 1.0 , c ε 1 * = 1.42 η 1 η 4.38 1 + 0.012 η 3 , η = k ε S , C ε 2 = 1.68 , σ ε = 1.3 .

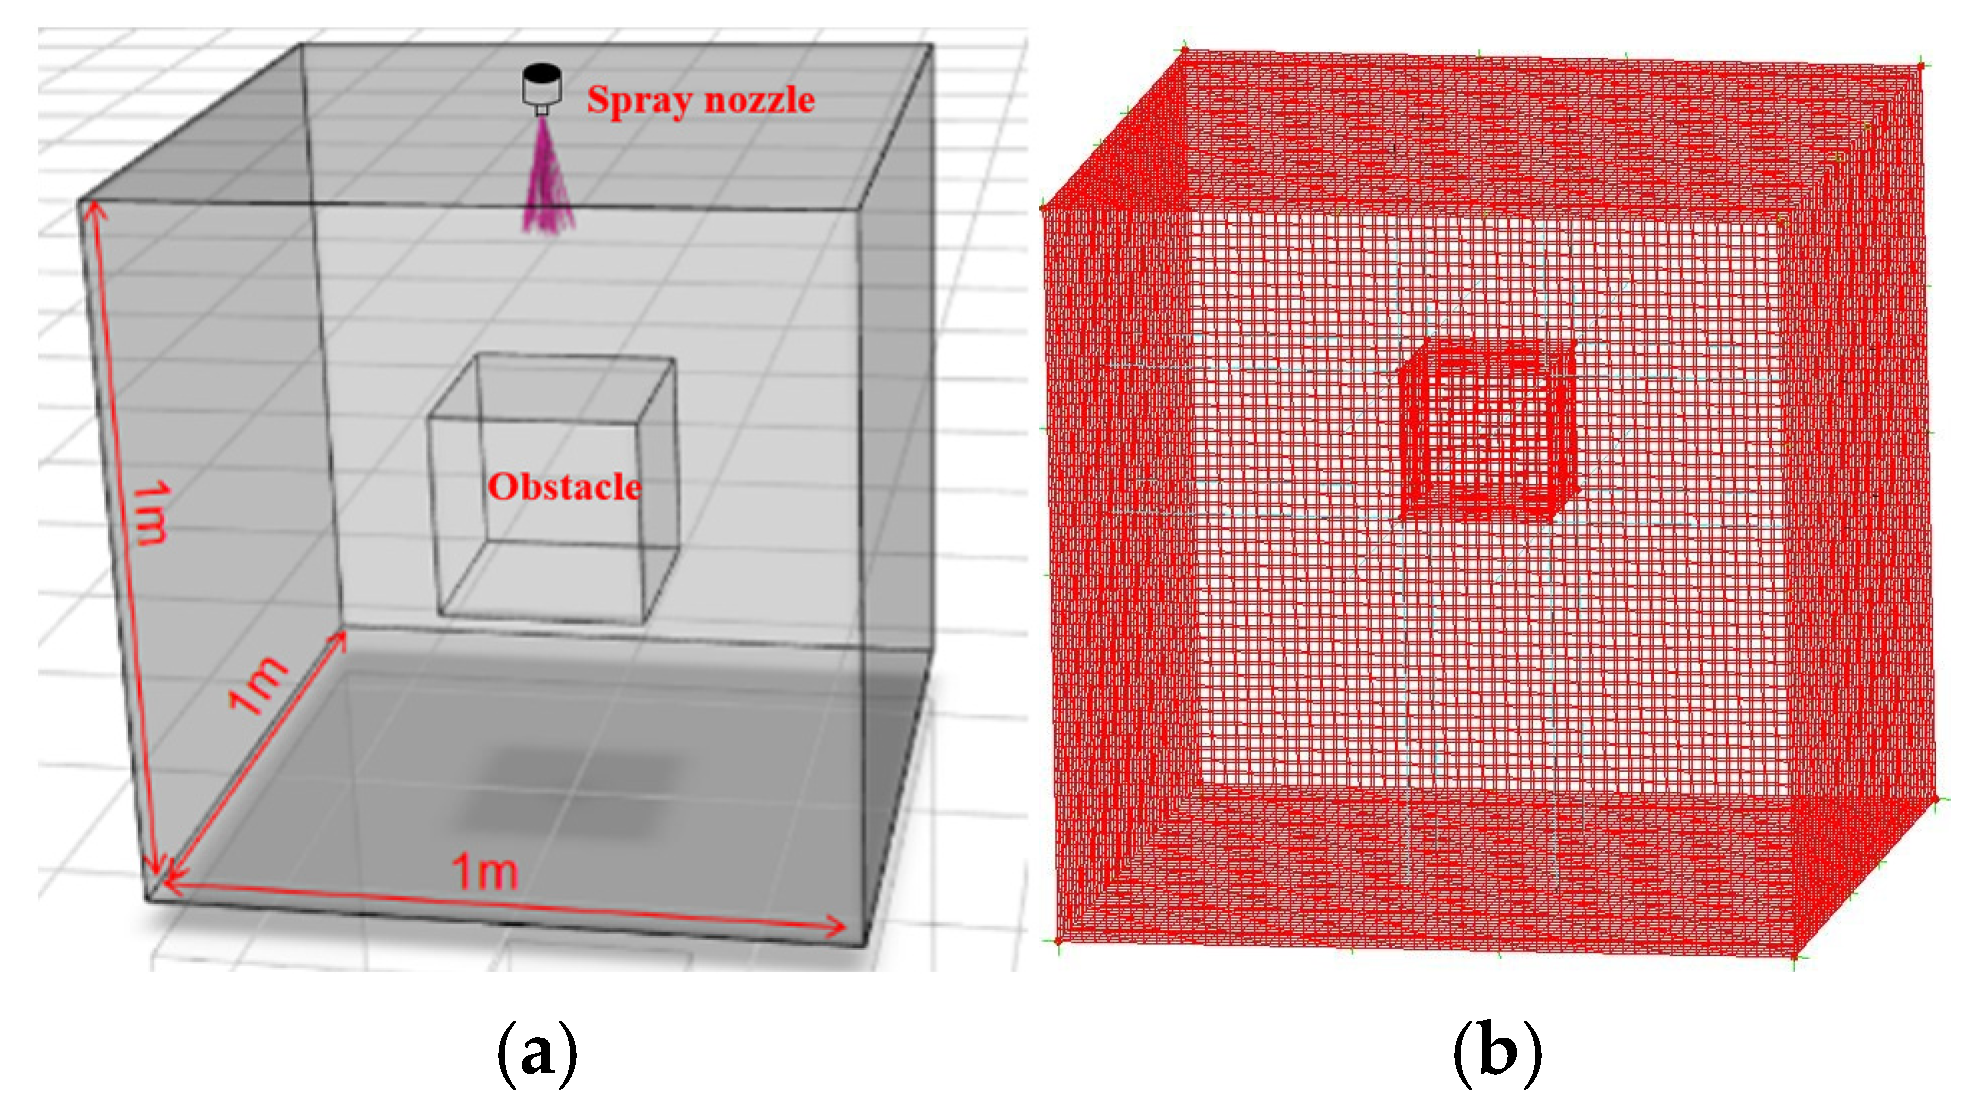
2.3. Boundary Conditions and Numerical Methods

To study the effect of obstacle conditions on the flow and diffusion characteristics of ultrafine dry powder, a nozzle is set at the center of the upper wall surface of the chamber, the spray cone angle is 15°, the initial velocity of the spray is 122 m/s, and the mass flow rate of the spray is 0.03 kg/s. The particle size distribution of particles in the granular phase is double R distribution (Rosin–Rammler), the minimum size is 1.79 μm, the maximum particle size is 10.7 μm, the average particle size is 6.90 μm, and the dispersion coefficient is 1.58.
The chamber and obstacle walls are set as stationary walls, the material is aluminum, and the standard wall roughness model is selected with a roughness constant of 0.5. The Eulerian model is used, the velocity-pressure coupling scheme is selected as phase couple simple, and the density term, momentum term, turbulence kinetic energy term, and turbulence dissipation rate term are all discretized in a two-stage upwind format.

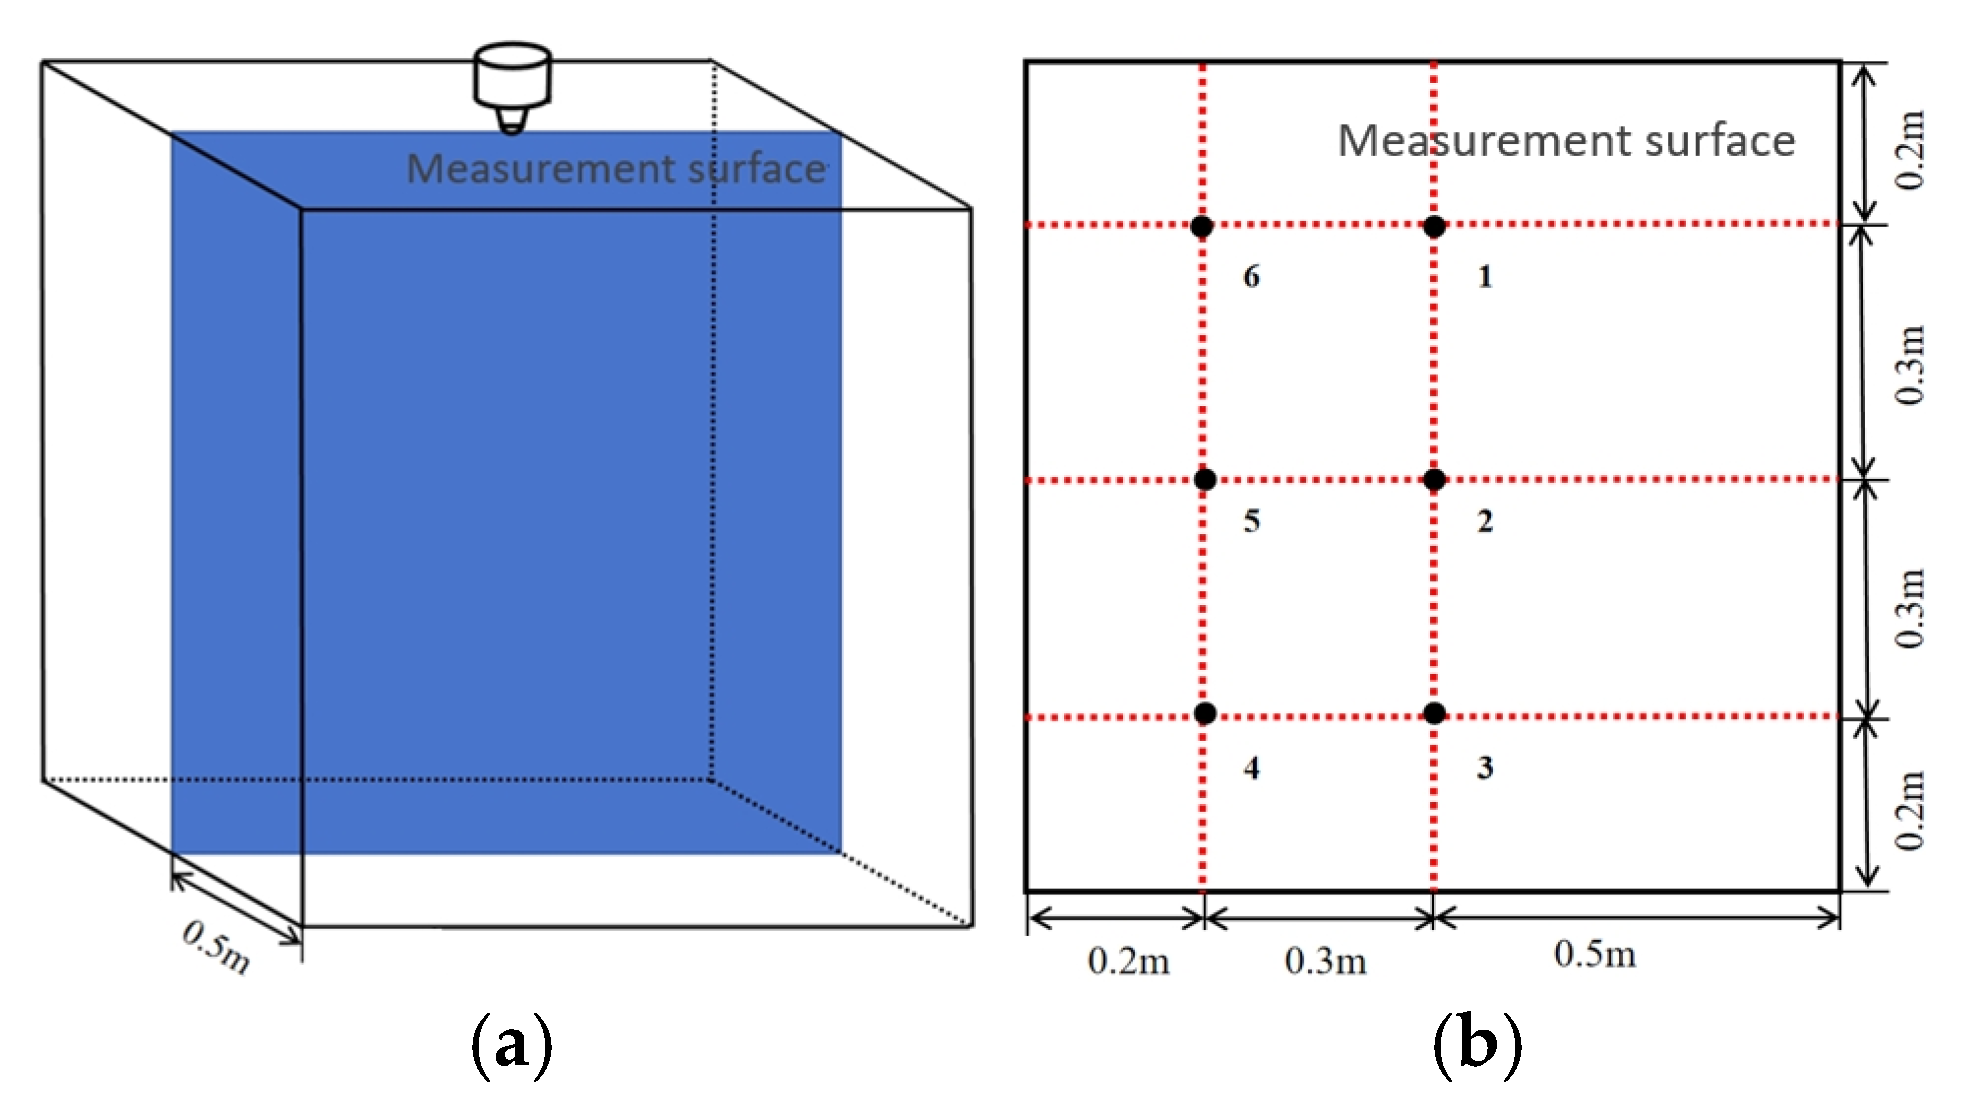
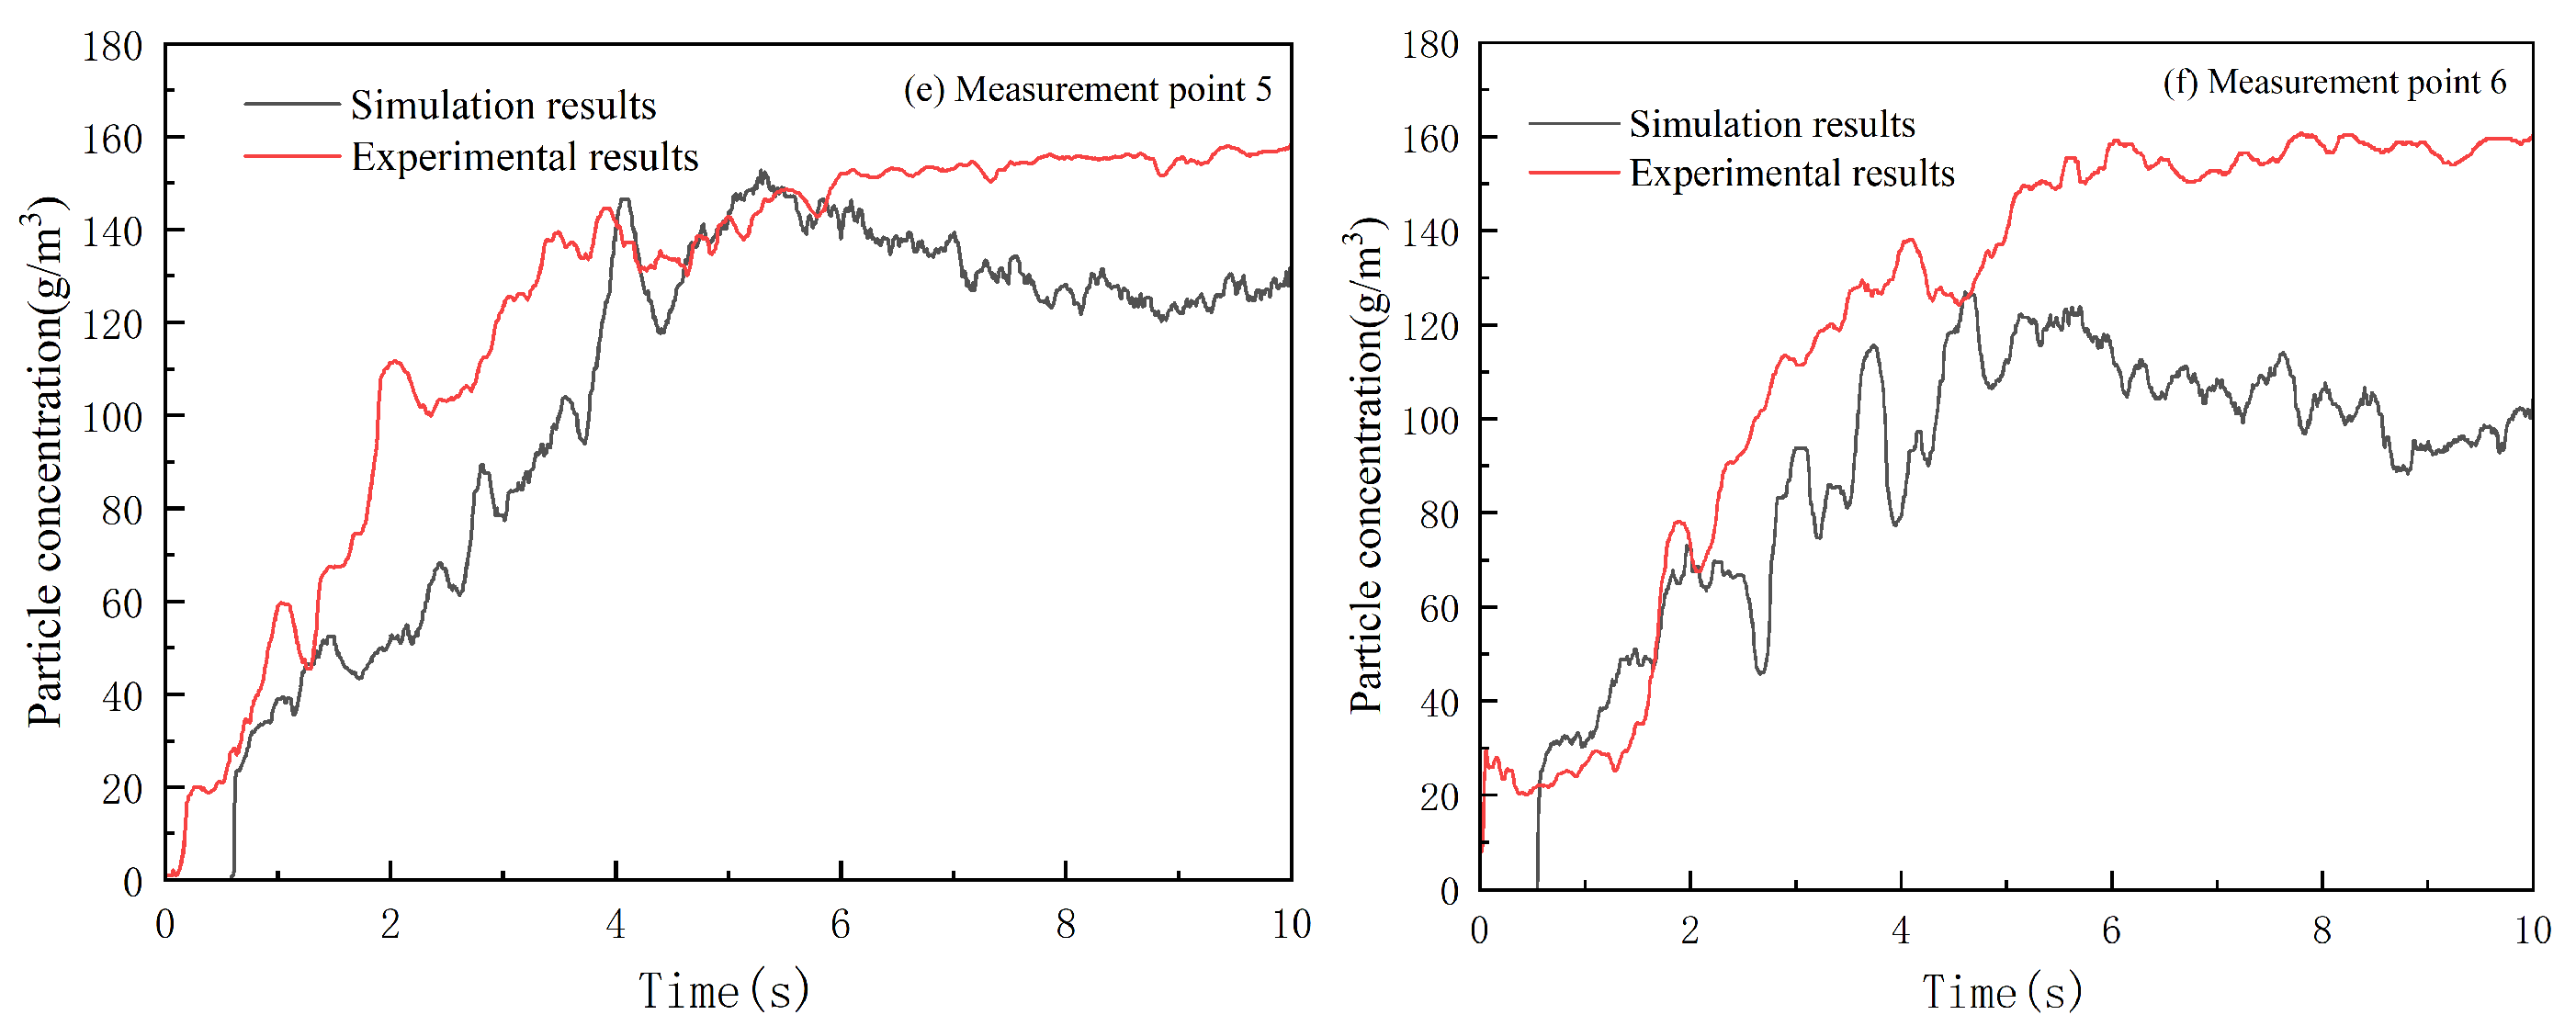
2.4. Validation of Computational Models

An experimental setup consistent with the computational model is established to conduct the ultrafine powder fire extinguishing agent release experiment under the condition of constant injection pressure to verify the accuracy of the model. The measurement surface perpendicular to the bottom surface is selected over the geometric center of the cavity, and a total of six measurement points, as shown in Figure 2b, are set on this measurement surface. The design of the simulation experiment is shown in Figure 3a. Nitrogen is regulated by the pressure regulating valve body and flows towards the powder tank, causing the ultrafine dry powder in the tank to spray into the chamber. At the same time, a ball valve with a manual device is installed at the outlet of the powder storage tank to control the release of the ultrafine dry powder. Figure 3b shows the physical picture of the chamber used in the simulation experiment.
It can be seen from Figure 4 that the simulation results of each measurement point and the trend of the experimental measured results are more in line with each other. Since the ball valve is closed instantaneously at the 5th second during the simulation process, the experimental closure of the ball valve has a process of about 1 s; there is a certain time deviation between the experimental and simulated results in terms of the persistence of the concentration directly below the nozzle (measurement points 1, 2, and 3). Overall, the simulation model established in this paper can more accurately simulate the flow diffusion process of ultrafine dry powder fire extinguishing agent in the confined space.

2.5. Grid Independence Verification

The grid number is 125,000, 216,000, and 343,000 with 51, 61, and 71 nodes on each edge, respectively, and the curves of particle concentration at the center point with time under 1 MPa are selected to verify the grid independence. From Figure 5, it can be seen that the difference between the grid number of 216,000 and 343,000 particles is small, so the encrypted grid has no great influence on the simulation results, and the model with 216,000 grids can meet the calculation requirements.

2.6. Calculated Working Condition Design

In this paper, the cubic obstacle is selected and set in the center of the restricted space, with reference to the size and location of the obstacle in confined spaces within buildings, the side length of the obstacle is set as 0.2 m, 0.25 m, 0.3 m, 0.35 m, and 0.4 m, and the corresponding volume of the obstacle is 8 dm3, 15.7 dm3, 27 dm3, 42.9 dm3, and 64 dm3. The cubic obstacle with a volume of 8 dm3 is selected, the distance of its top surface from the nozzle is changed to investigate the influence of the relative position of the obstacle on the spatial flow diffusion characteristics of the ultrafine dry powder, and the distances of the top surface of the obstacle from the nozzle are 0.2 m, 0.4 m, and 0.6 m, which are called the upper, middle, and lower obstacles, respectively. From the size of the obstacle and the distance of the obstacle from the nozzle, respectively, alterations are made to explore the influence of rectangular obstacles on the flow and diffusion characteristics of ultrafine dry powder in the restricted space. The specific working conditions shown in Table 1.

3. Results and Discussion

3.1. Analysis of the Flow Process of the Extinguishing Agent

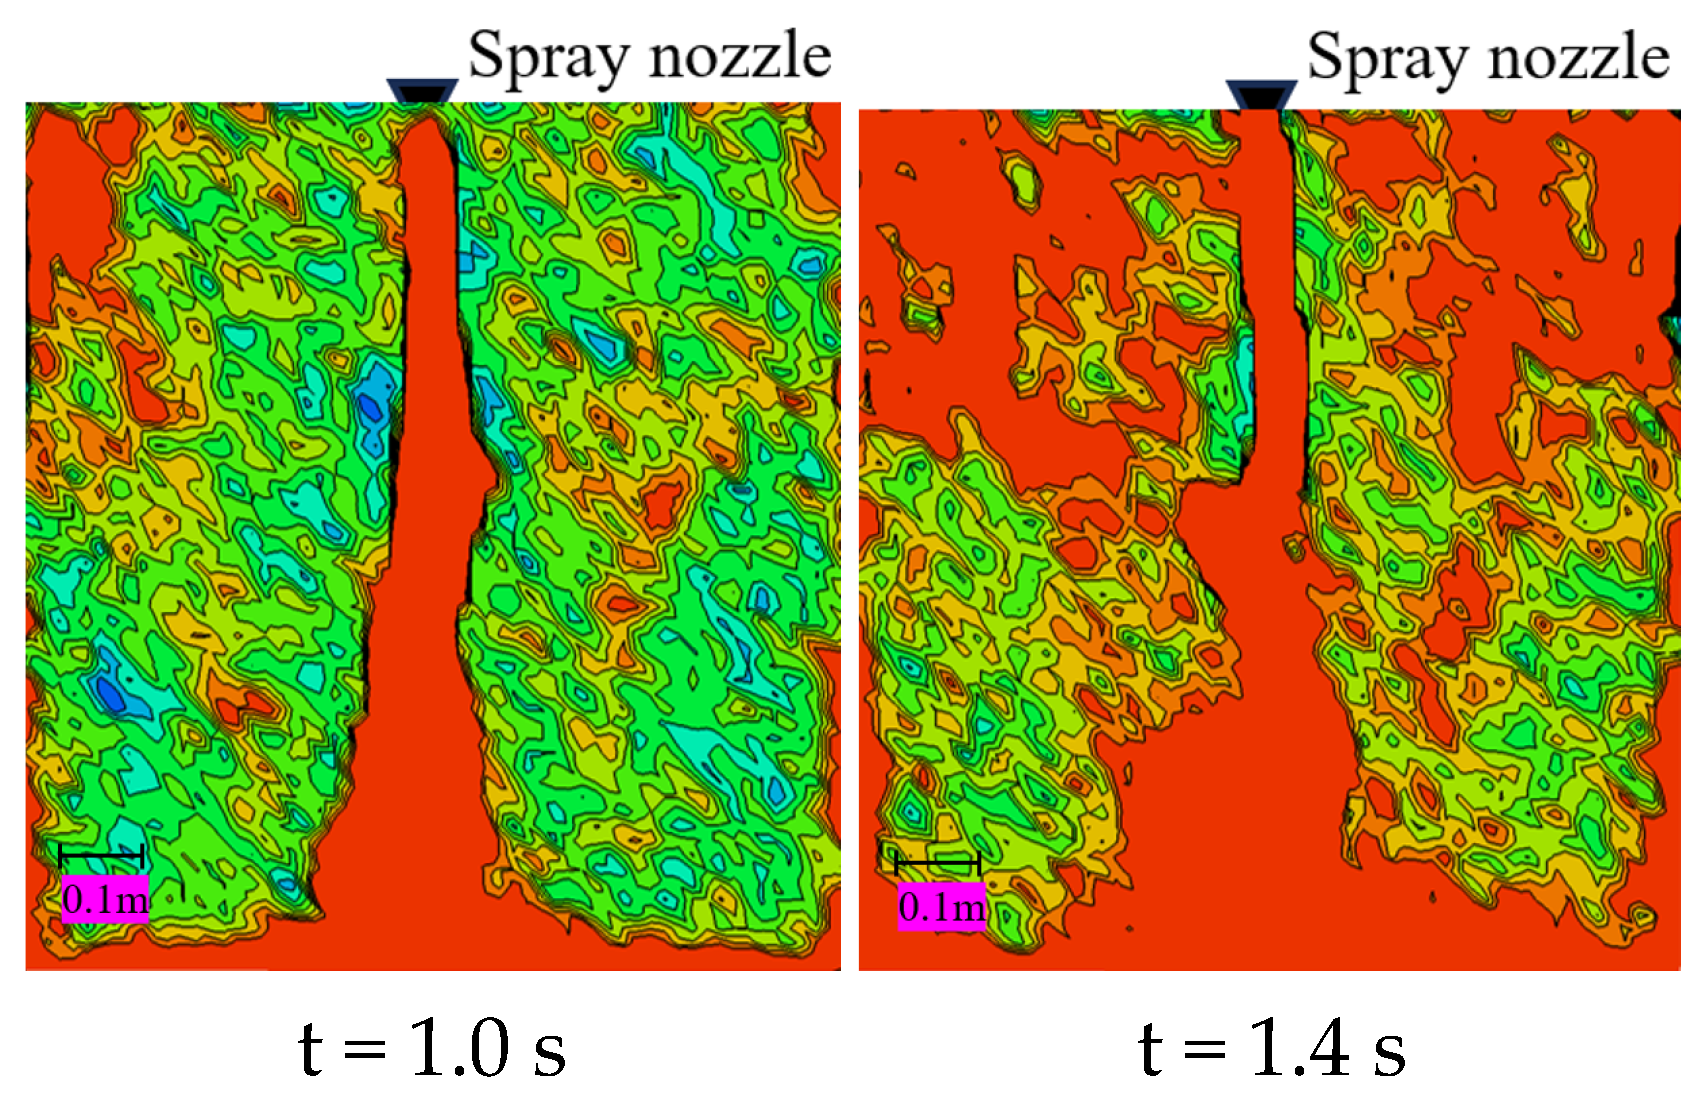
3.1.1. Spatial Flow Diffusion Process of Ultrafine Dry Powder Under Barrier-Free Conditions

Figure 6 gives some typical results of the spatial concentration distribution of ultrafine dry powder fire extinguishing agent after release in the confined space. From the figure, it can be clearly seen that after the extinguishing agent is vertically sprayed, it quickly reaches the bottom of the chamber, forms a horizontal jet due to the restriction of the bottom surface and forms a more symmetrical vortex in the whole space, then gradually fills the whole restricted space. Specifically, under the continuous and stable driving pressure and gravity, the ultrafine dry powder fire extinguishing agent forms a jet in the space, and the fire extinguishing agent particles flow to the bottom surface about 0.2 s after being sprayed out and form a horizontal jet spreading to both sides; due to the further obstruction of the vertical wall, the movement direction of the fire extinguishing agent particles is constantly shifted, the reflux effect is gradually strengthened throughout the space, and the particles reach the chamber when they are sprayed out about 0.6 s after being sprayed out. Ultrafine dry powder particles arrive at the top of the cabin and begin to move downward; with the continuation of spraying and under the action of reflux, the entire restricted space, from the wall area to the internal area, is gradually completely filled by the fire extinguishing agent in 1.4 s. Most of the areas in the entire space can reach a concentration of ultrafine dry powder of more than 0.05 kg/m3.

3.1.2. Spatial Flow Diffusion Process of Ultrafine Dry Powder Under Barrier Conditions

When there is an obstacle in the confined space, the spatial flow diffusion process after the release of ultrafine dry powder has a very significant difference compared to that of no obstacle; the typical process of flow diffusion of ultrafine dry powder in the confined space after the release of ultrafine dry powder when the volume of the obstacle is 27 dm3 is given in Figure 7. As can be seen from the figure, as shown in the cloud diagram at the moment of 0.4 s, the ultrafine dry powder will first contact the upper surface of the obstacle after being vertically ejected, and then form a horizontally oriented jet after being obstructed, and then diffuse up and down in two directions after flowing through the side wall of the obstacle, and due to the influence of the Saffman lift, the ultrafine dry powder is mainly transported upward and then turned to the horizontal direction after arriving at the upper wall surface of the chamber; the restricted space at the time of 0.6 s is first reached in the upper wall area of the space. The lowest fire extinguishing concentration of 0.05 kg/m3 is reached in the upper wall surface area of the space first, and the ultrafine dry powder gradually gathers in the part above the upper wall surface of the obstacle in the restricted space. Then, it gradually spreads to the part below the upper wall surface of the obstacle, and gradually spreads along the wall surface of the restricted space from the outside to the inside, as shown in the concentration distribution of 0.8 s–1.8 s, and there is a more obvious low-concentration area (unfavorable area) in the restricted space in this process (unfavorable region). According to the above analysis of the flow diffusion process, the movement of ultrafine dry powder fire extinguishing agent in the restricted space under the condition of the obstacle can be divided into upper and lower parts, as shown in Figure 8, with the upper surface of the obstacle as the boundary. The whole cavity can be divided into upper and lower two reflux zones, in which there are obvious unfavorable areas around the obstacle in the lower reflux zone, and it is especially obvious in the area near the height of the top surface of the side wall of the obstacle. In the lower reflux zone, there are obvious unfavorable areas around the obstacle, and it is especially obvious in the area near the height of the top of the obstacle, and the farthest horizontal distance from the obstacle side wall of the point below the minimum fire extinguishing concentration here is recorded as the characteristic size of the unfavorable area D.

3.2. Effect of Obstacle Volume on the Flow Characteristics of Ultrafine Dry Powders

3.2.1. Effect of Obstacle Volume on the Upper and Lower Recirculation Zones

The curves of the mean volumetric concentration of ultrafine dry powder in the upper and lower reflux zones as a function of time for different obstacle volume conditions are given in Figure 9. From the figure, it can be seen that the average concentration in both the upper and lower reflux zones tends to increase approximately linearly with the continuation of the jetting, and at the same moment, the average concentration in the upper zone increases monotonically with the increase in the volume of the obstacle, whereas in the lower zone, except for the smallest obstacle (volume of 8 dm3), the difference in the average concentration with the increase in the volume of the obstacle is relatively small. To further compare the differences between the upper and lower reflux zones, the differences were plotted against time and the results are shown in Figure 10. From the figure, it can be seen that when the volume of the obstacle is small (volume 8 dm3), the difference between the average concentration in the upper and lower return area is small, and the overall change over time is not large. Meanwhile, when the volume of the obstacle is larger than 8 dm3, the difference in this concentration over time shows a trend of rapid increase followed by a gradual leveling of the trend. The difference in the concentration monotonically increases with the increase in the volume of the obstacle. At the end of 3.2 s monitoring, when the volume of obstacle increased from 8 dm3 to 15.7 dm3, the difference between the upper and lower concentration increased 5 times, and when it increased from 15.7 dm3 to 64 dm3, the difference between the upper and lower concentration increased 42.5%, which indicates that the size of obstacle has a significant effect on the dispersion of ultrafine dry powder extinguishing agent in the confined space.
Figure 11 gives the curve of the time required for the average concentration of the upper and lower regions to reach the minimum extinguishing concentration with the volume of the obstacle. As can be seen from the figure, under the same conditions, the time required for the upper and lower reflux zones to reach the minimum fire-extinguishing concentration with the increase in the volume of the obstacle shows an opposite trend; the upper region decreases with the increase in volume and the lower region increases with the increase in volume. When the volume of the obstacle increased from 8 dm3 to 15.7 dm3, the time to reach the minimum extinguishing concentration increased by 18% in the lower region and decreased by 24% in the upper region. This also indicates that the volume of the obstacle has a more significant effect on the flow and diffusion of ultrafine dry powder in the confined space.

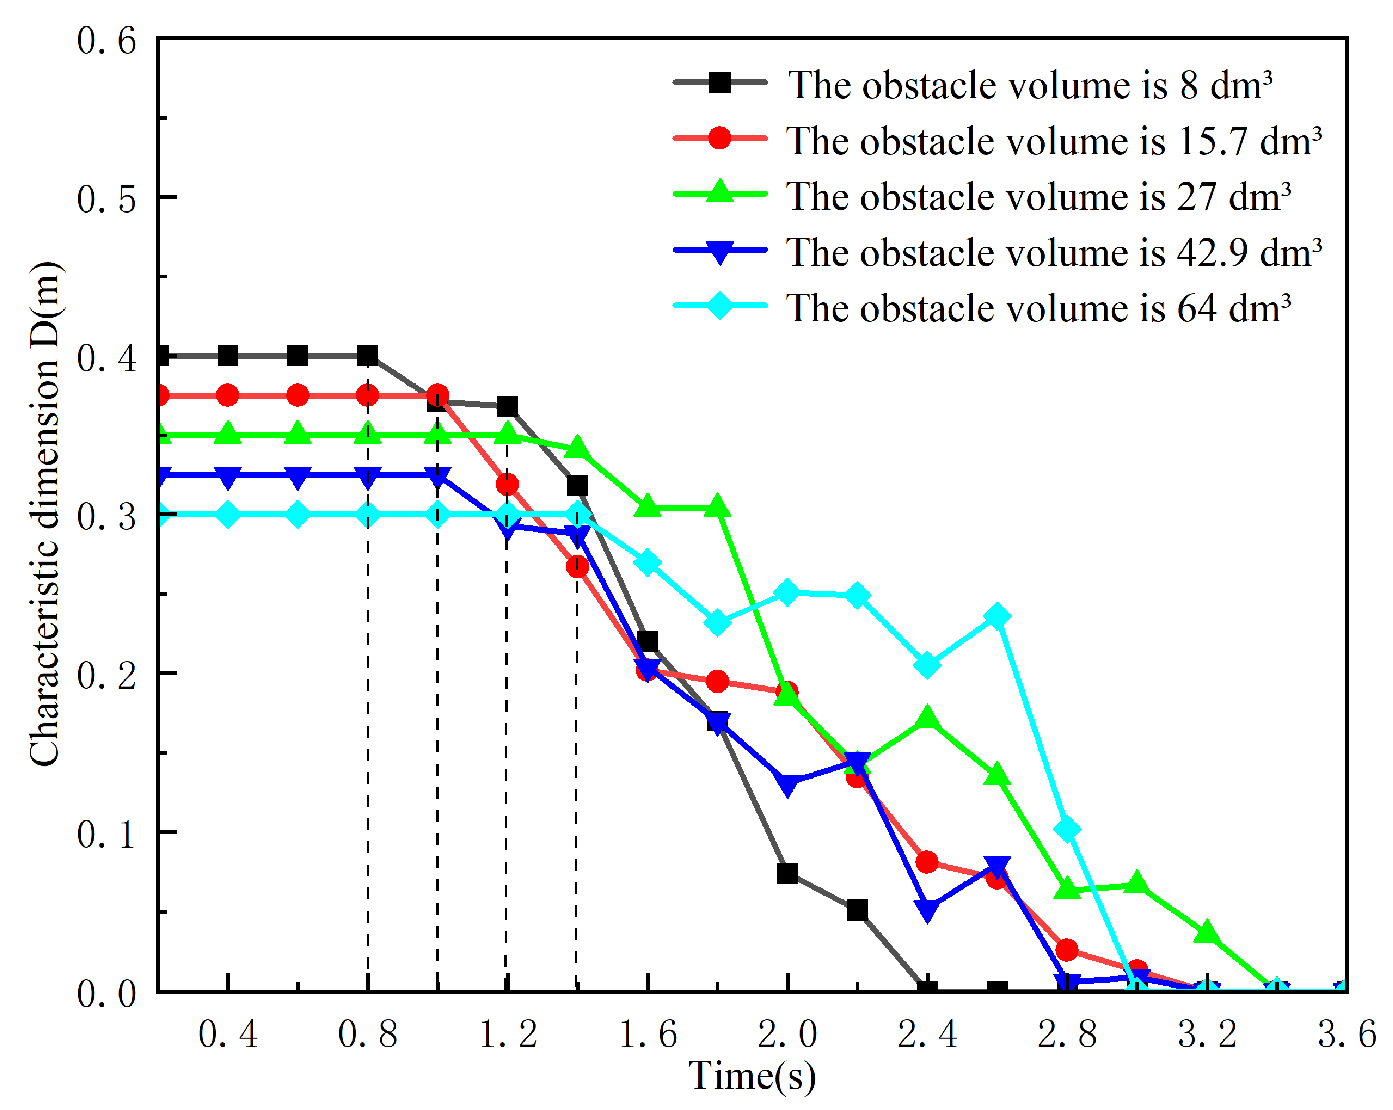
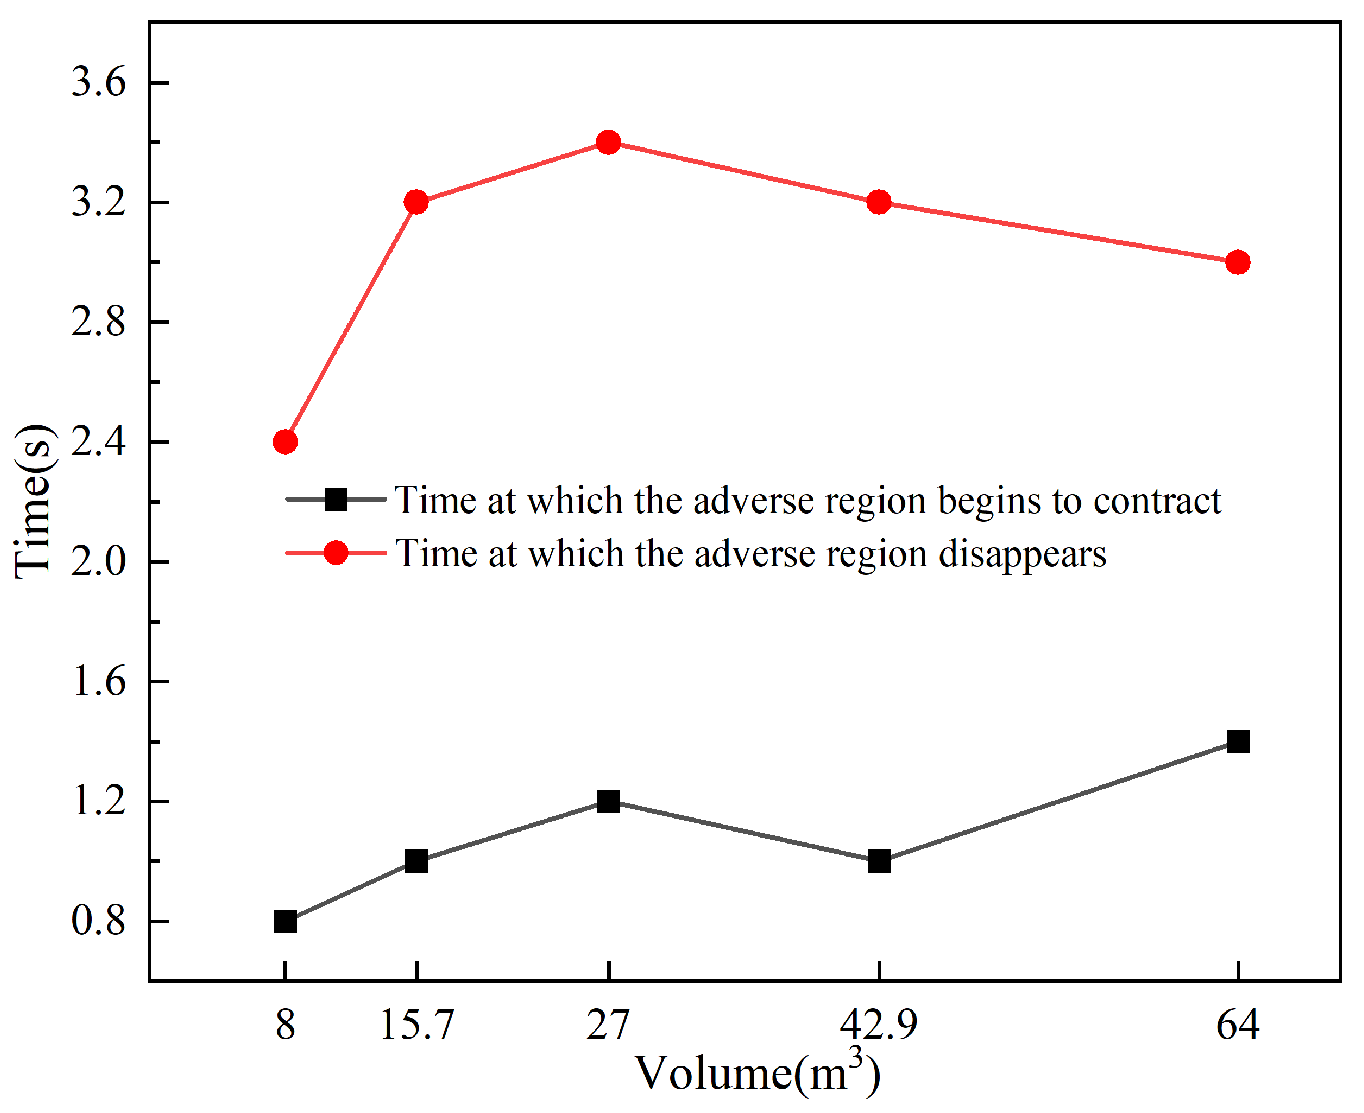
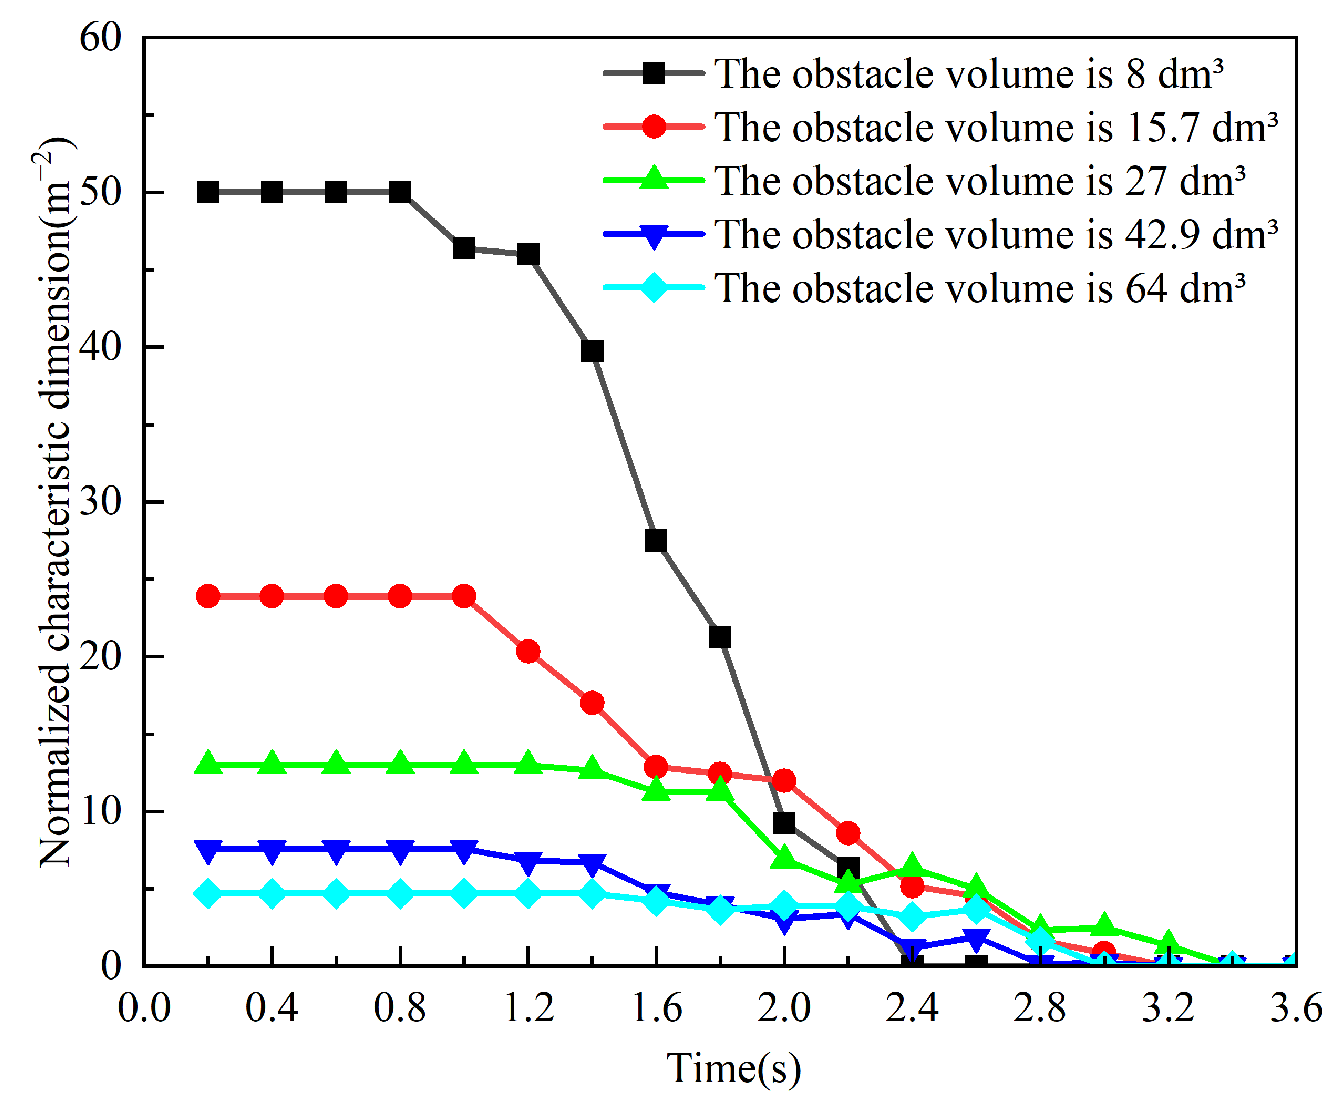
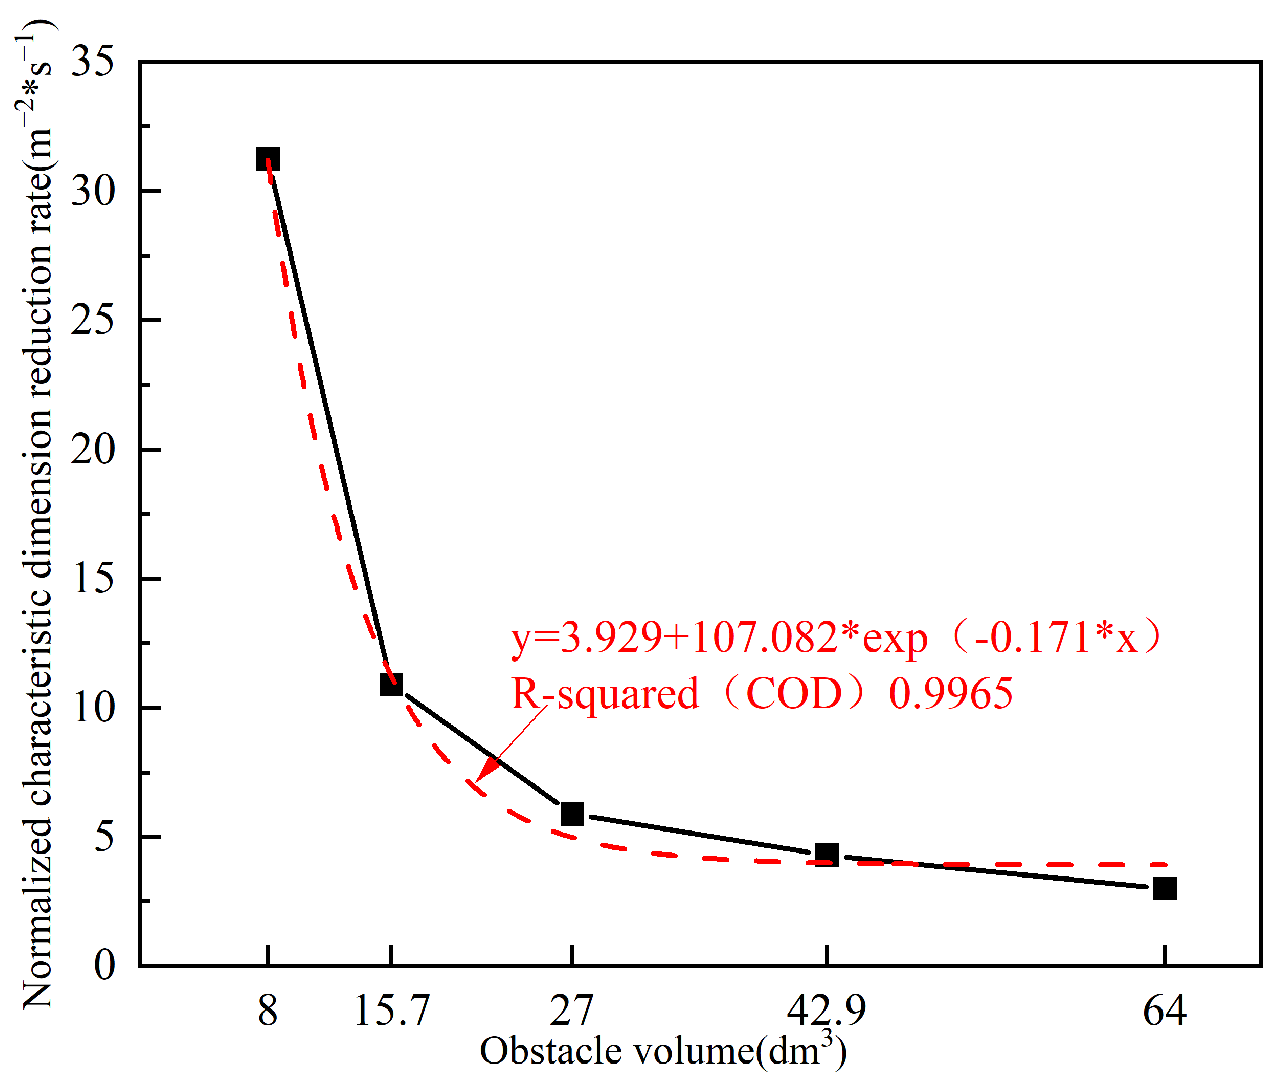
3.2.2. The Impact of Variably Sized Obstacles on Adverse Regions

Figure 12 presents a comparative cloud diagram of the concentration distribution of ultrafine dry powder on the vertical cross-section along the central axis of the confined space at the same moment under different obstacle volumes. As illustrated in the figure, when the obstacle volume is small (8 dm3), the intensity of the horizontal jet of ultrafine dry powder above the obstacle surface is relatively weak and a portion of the ultrafine dry powder bypasses the obstacle and migrates to the recirculation zone below. Consequently, the unfavorable region around the obstacle is relatively small at this stage, and it contracts rapidly as the release continues. In contrast, when the obstacle volume exceeds 8 dm3, the unfavorable region significantly expands, and its contraction slows down with continued release Figure 13 depicts the variation curve of the characteristic dimension D of the unfavorable region over time under different obstacle volumes. It can be observed that the characteristic dimension D initially remains constant and then begins to decrease. However, the time at which D starts to decrease and reaches zero varies depending on the obstacle volume. For clearer comparison, the times at which D begins to decrease and reaches zero are plotted against the obstacle volume, as shown in Figure 14. From the figure, it is evident that the time at which D starts to decrease increases approximately linearly with the obstacle volume, while the time at which D reaches zero initially increases and then decreases with increasing obstacle volume. This phenomenon may be attributed to two factors: on one hand, the increase in obstacle volume results in a higher concentration of fire suppressant in the upper region during the initial release phase, which hinders the diffusion of ultrafine dry powder to the lower region; on the other hand, the increase in obstacle volume reduces the available space in the lower region, facilitating the filling of ultrafine dry powder. These findings highlight the significant influence of obstacle volume on the spatial and temporal distribution of ultrafine dry powder in confined spaces, providing valuable insights for optimizing fire suppression strategies in environments with varying obstacle configurations.
The characteristic dimension D is divided by the obstacle volume to obtain the normalized characteristic dimension. Figure 15 illustrates the variation curves of the normalized characteristic dimension over time for different obstacle volumes. As shown in the figure, the normalized characteristic dimension exhibits an approximately linear decreasing trend during the contraction phase. To compare the reduction rates of the normalized characteristic dimension, the slopes of the contraction phase are plotted against the obstacle volume, as presented in Figure 16. The results indicate that the reduction rate decreases monotonically with increasing obstacle volume. Specifically, when the obstacle volume increases from 8 dm3 to 15.7 dm3, the reduction rate decreases by 65%, and when the volume increases from 15.7 dm3 to 64 dm3, the reduction rate decreases by 73%. The relationship curve between the volume of obstacles and the normalized feature size reduction rate of unfavorable areas was fitted. From the results, it can be seen that there is a clear exponential relationship between them; that is, the efficiency of filling unfavorable areas with ultrafine dry powder decreases exponentially with the increase in obstacle volume. This provides a quantitative basis for studying the influence of obstacle volume on the diffusion process of ultrafine dry powder.

3.3. The Influence of Obstacle Position on Flow Characteristics

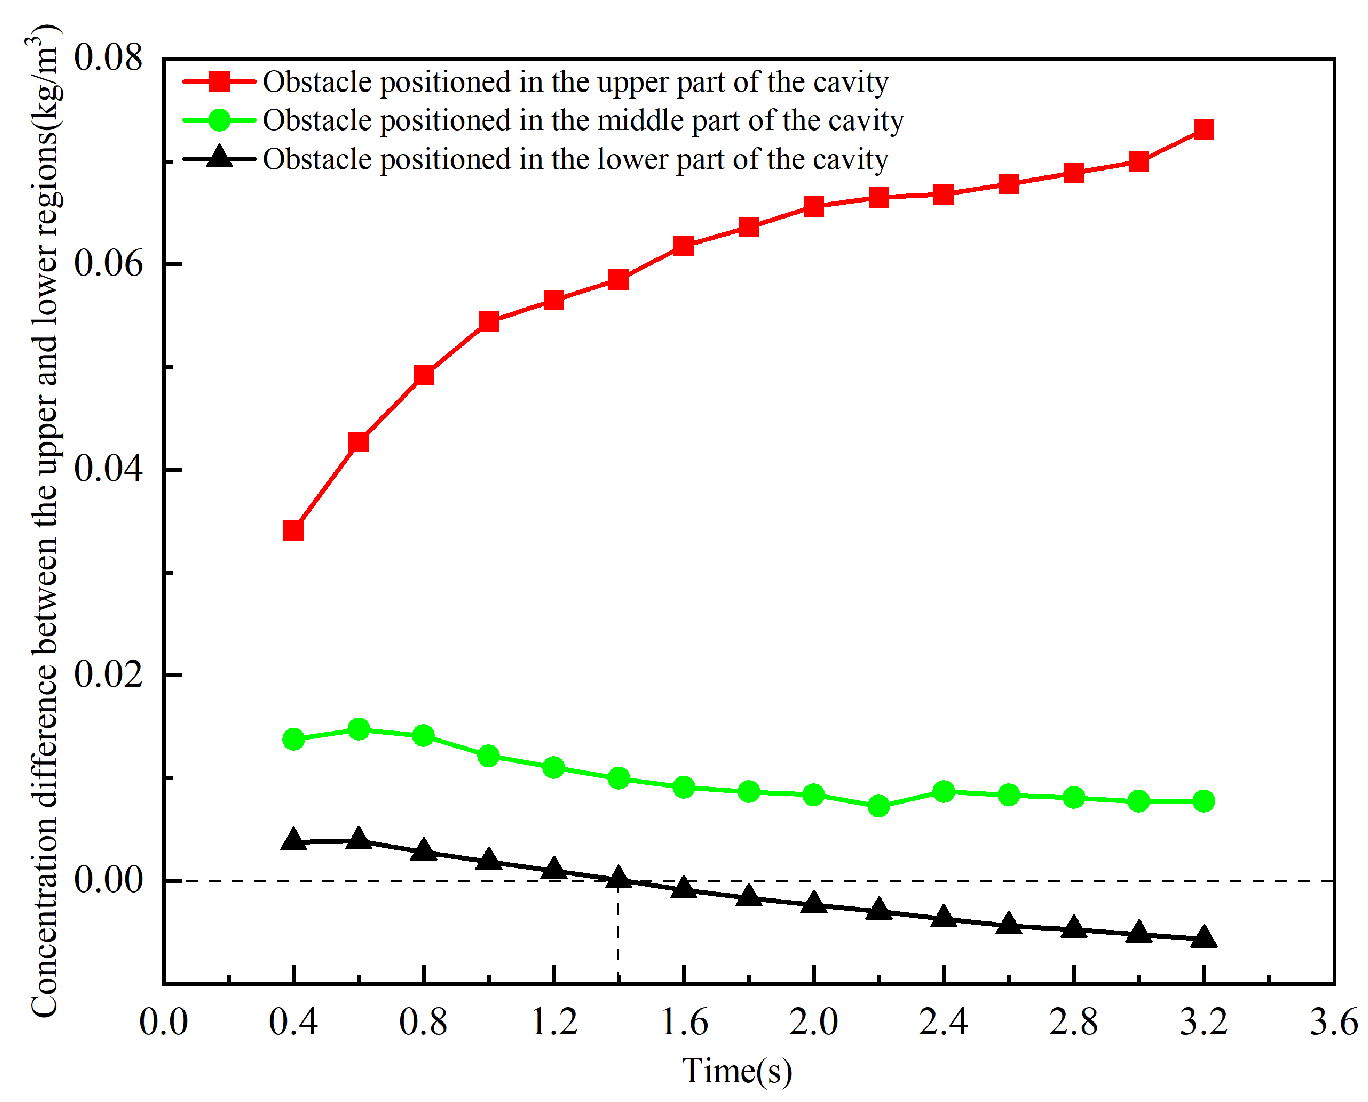
3.3.1. The Influence of Obstacle Position on Upper and Lower Regions

Figure 17 presents the temporal variation curves of the average volume concentration of ultrafine dry powder in the recirculation zones above and below the obstacle under different obstacle positions. As shown in the figure, the average concentration in both the upper and lower recirculation zones exhibits an approximately linear increase over time during the release process. At any given time, the average concentration in the upper region decreases as the distance between the obstacle and the nozzle increases, while the average concentration in the lower region shows the opposite trend. Specifically, when the obstacle is positioned closer to the nozzle (as indicated by the upper curve), the average concentration in the upper region is significantly higher than that observed in the other two positions, whereas the average concentration in the lower region is notably lower. In contrast, when the obstacle is positioned farther from the nozzle, the difference in average concentration between the upper and lower regions becomes relatively smaller. These results demonstrate that the distance between the obstacle and the nozzle significantly influences the flow and diffusion of ultrafine dry powder within the space, with a closer proximity leading to a more pronounced impact.
To further compare the differences between the upper and lower recirculation zones, the temporal variation in the concentration difference between the two zones is plotted, as shown in Figure 18. From the figure, it can be observed that when the obstacle is positioned at a moderate distance from the nozzle (middle position), the difference in average concentration between the upper and lower recirculation zones is relatively small and remains largely stable over time. When the obstacle is positioned closer to the nozzle, the concentration difference initially increases rapidly and then gradually stabilizes over time. Conversely, when the obstacle is positioned farther from the nozzle, the concentration difference shows a gradual decreasing trend over time. At 1.39 s into the release, the concentration of ultrafine dry powder in the lower region equals that in the upper region and subsequently exceeds it. By the end of the monitoring period at 3.2 s, the concentration difference between the upper and lower regions decreases by 89% and 108% for the middle and lower obstacle positions, respectively, compared to the upper position. These results further underscore the significant influence of obstacle position on the dispersion of ultrafine dry powder fire suppressant within the confined space.

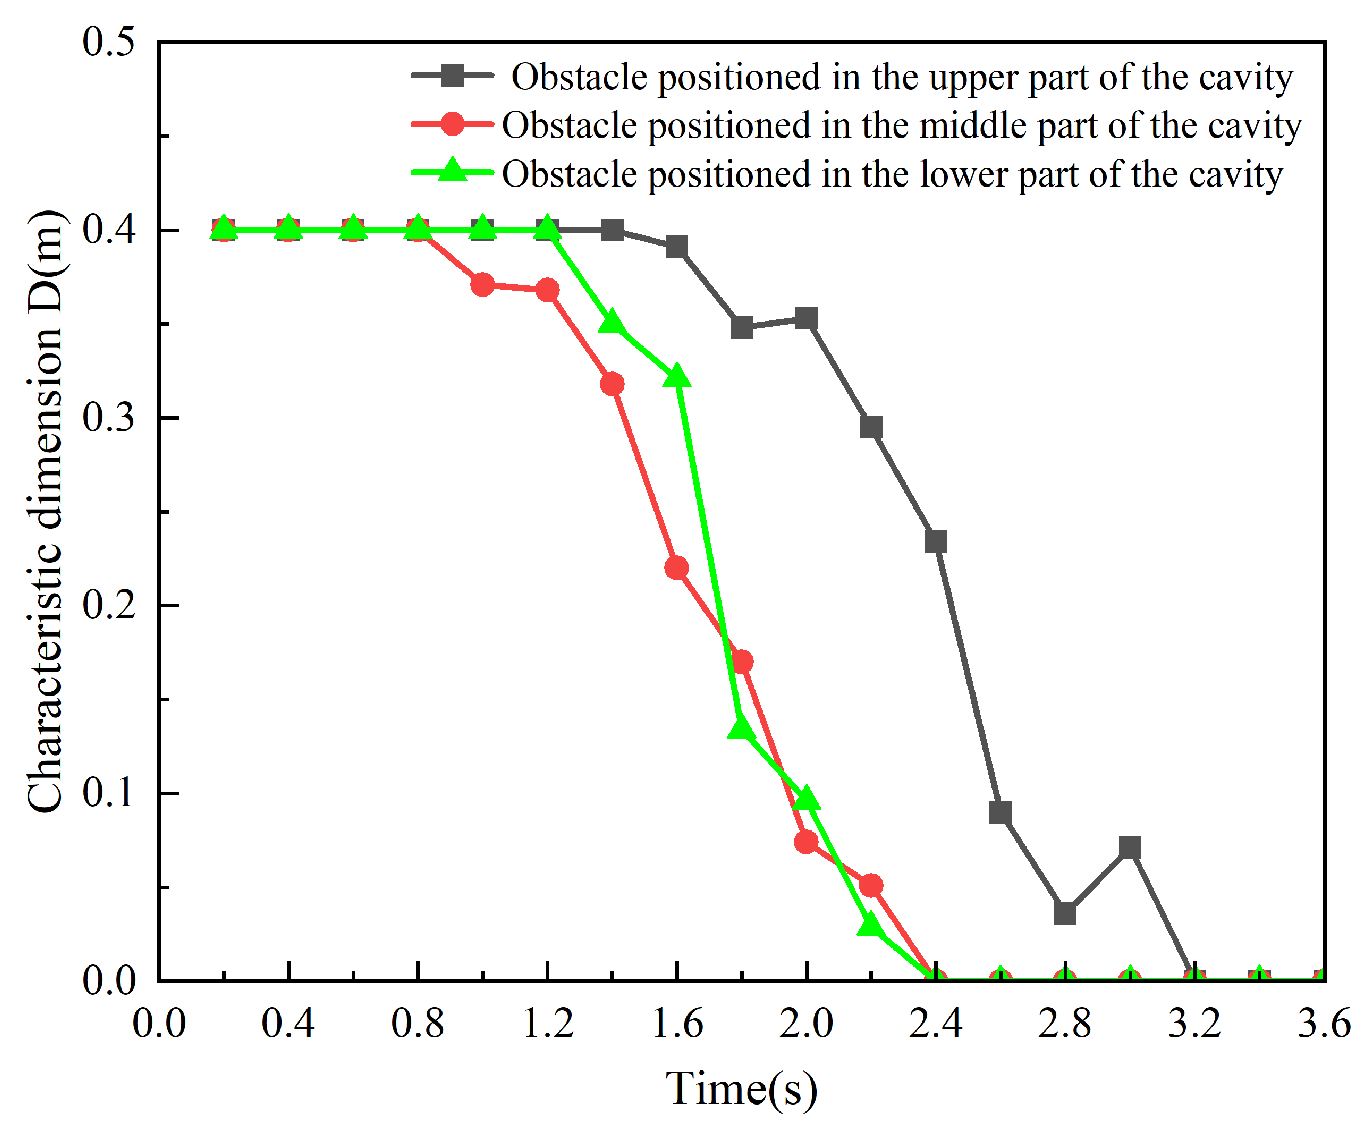
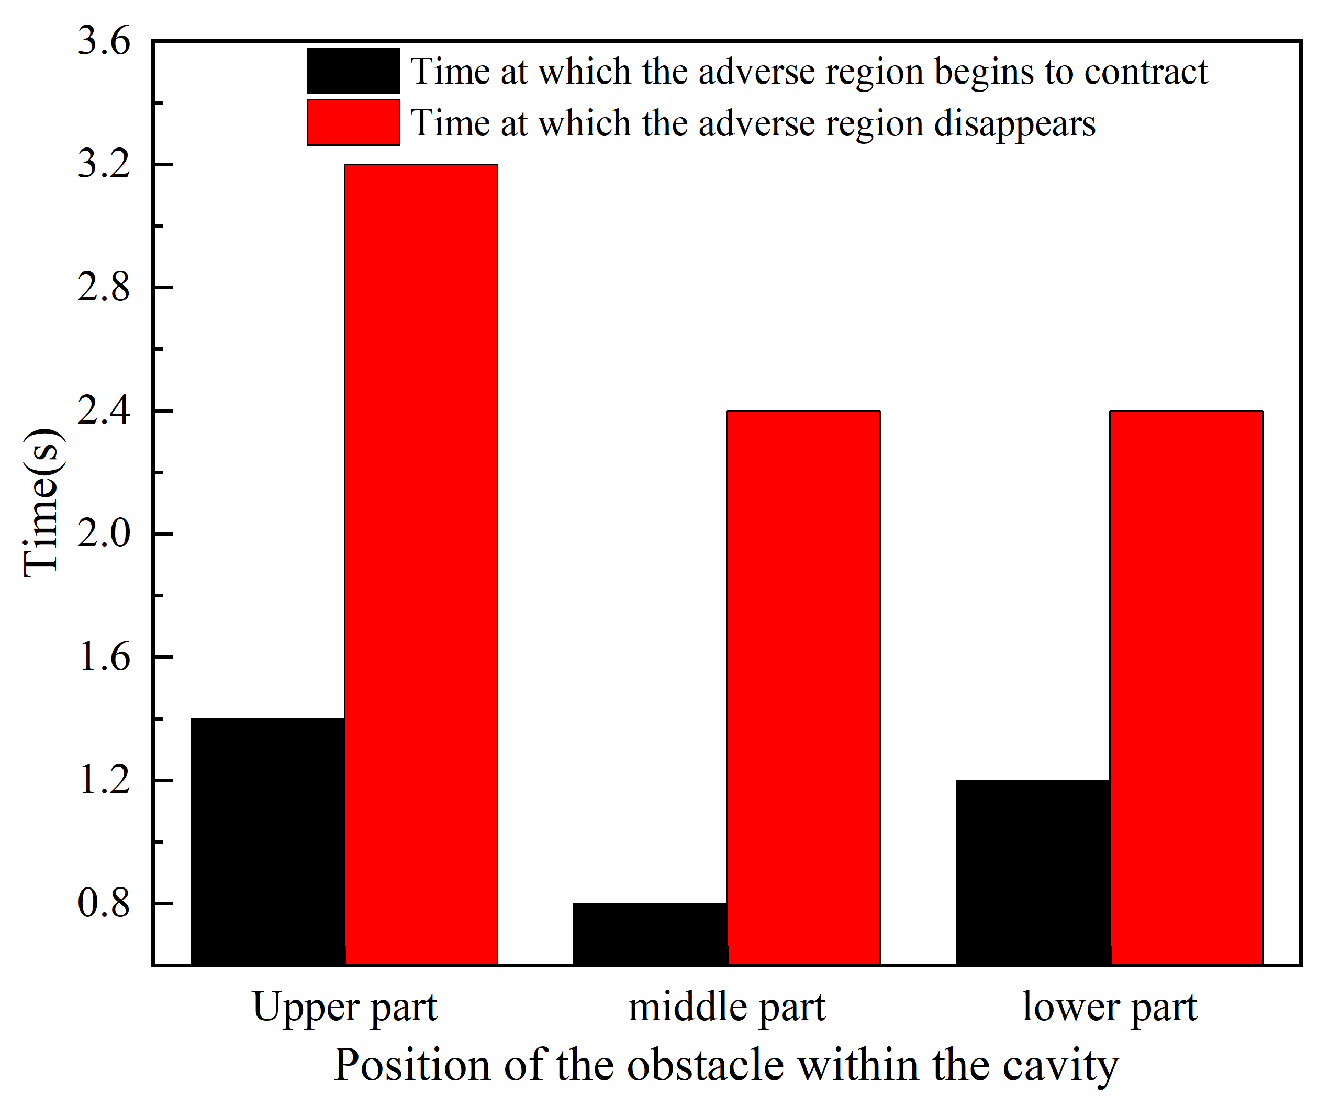
3.3.2. The Influence of Obstacle Position on Unfavorable Regions

Figure 19 presents a comparative cloud diagram of the concentration distribution of ultrafine dry powder fire suppressant on the central axis cross-section of the confined space for different obstacle positions. As shown in the figure, when the position of the obstacle changes, the distance between the nozzle and the upper surface of the obstacle varies. Although the overall flow and diffusion path of the ultrafine dry powder remains largely consistent, the reduction rate of the unfavorable region changes significantly. When the obstacle is positioned in the upper part of the cavity, the closer proximity to the nozzle results in a more pronounced accumulation of fire suppressant in the region above the obstacle. Consequently, the unfavorable region around the obstacle is notably larger and contracts more slowly. In contrast, as the distance between the obstacle and the nozzle increases, the unfavorable region around the obstacle shrinks more significantly. These observations highlight the critical influence of obstacle position on the dynamics of unfavorable region formation and evolution within the confined space.
Figure 20 presents the comparison curves of the characteristic dimension D of the unfavorable region for different obstacle positions. As shown in the figure, when the obstacle is positioned in the middle or lower part of the confined space, the temporal variation trends of the characteristic dimension D are relatively similar. However, when the obstacle is positioned in the upper part, the reduction in the characteristic dimension D is significantly delayed. The times at which the characteristic dimension D begins to decrease and reaches zero are plotted against the obstacle position, as illustrated in Figure 21. From the figure, it can be observed that when the obstacle is positioned in the middle part of the confined space, the unfavorable region begins to shrink at approximately 0.8 s after the release and disappears at around 2.4 s.
When the obstacle is positioned in the lower part of the confined space, the unfavorable region begins to shrink at approximately 1.2 s after the release and disappears at around 2.4 s. When the obstacle is positioned in the upper part of the confined space, the unfavorable region begins to shrink at approximately 1.4 s after the release and disappears at around 3.2 s. These results highlight the significant influence of obstacle position on the temporal evolution of the unfavorable region, with upper positioning causing the most pronounced delay in both the initiation and completion of the region’s reduction.
Figure 22 and Figure 23 present the temporal variation curves of the normalized characteristic dimension and the comparison of its reduction rates, respectively, for different obstacle positions within the confined space. Since the obstacle volume remains unchanged, the trends in the normalized characteristic dimension over time (Figure 22) are consistent with those observed before normalization (Figure 20). The reduction rate of the normalized characteristic dimension (Figure 23) increases monotonically as the obstacle position shifts from the upper to the lower part of the confined space. Specifically, compared to the upper position, the reduction rate increases by 12% and 60% when the obstacle is positioned in the middle and lower parts, respectively. These results indicate that the farther the obstacle is from the nozzle, the greater the flow and diffusion rate of ultrafine dry powder in the unfavorable region surrounding the obstacle. There may be two reasons for this phenomenon. On the one hand, as the distance between the obstacle and the nozzle decreases, the time for ultrafine powder to reach the obstacle advances, and the concentration of ultrafine powder accumulated in the upper space decreases. At the same time, when the obstacle approaches the nozzle, the ultrafine powder jet directly impacts it at high speed, causing more sudden jet fragmentation and local turbulence. This increased turbulence may promote upward diffusion and accumulation above obstacles, while suppressing effective downward diffusion caused by complex recirculation flows. In addition, close range interactions may cause local turbulence dissipation before the jet fully develops and entrains surrounding air, thereby weakening its penetration into the lower region. On the other hand, as the distance increases, the space below decreases, leading to more ultrafine dry powder diffusing towards unfavorable areas. This demonstrates a clear relationship between obstacle position and the dynamics of ultrafine dry powder dispersion within the confined space.

4. Conclusions

This study employs Fluent software to construct a transient simulation model for the flow and diffusion process of an ultrafine dry powder fire suppressant in a confined space. The spatial flow and diffusion characteristics of the suppressant under different obstacle conditions are investigated through numerical simulations. The main conclusions are as follows:
(1) The established gas–solid two-phase simulation model based on the Dense Discrete Phase Model (DDPM) accurately calculates the spatial flow and diffusion process of ultrafine dry powder fire suppressant. The model provides a clear and intuitive representation of the dynamic flow and diffusion process of the suppressant within the confined space.
(2) Obstacles significantly influence the flow and diffusion process of ultrafine dry powder in the confined space. Unlike scenarios without obstacles, the presence of an obstacle creates two distinct recirculation zones separated by the upper surface of the obstacle. A low-concentration unfavorable region forms around the obstacle, affecting the overall distribution of the suppressant.
(3) The volume and position of obstacles have a significant impact on the flow and diffusion of ultrafine dry powder in confined spaces. The larger the volume of the obstacle, the longer it takes for the space below to reach the minimum extinguishing concentration, and the slower the contraction speed of the unfavorable area, indicating that the obstacle will significantly hinder the downward propagation of ultrafine dry powder. In addition, the closer the obstacle is to the nozzle, the more pronounced the concentration difference between the upper and lower zones. As the distance increases, the distribution of ultrafine dry powder becomes more uniform, and the unfavorable areas are reduced more rapidly.
The above results provide important engineering guidance for optimizing the design of fire extinguishing systems in enclosed spaces, especially for nozzle layout and obstacle structure configuration. In subsequent research, a combustion model can be further introduced based on actual fire scenarios to explore the flow and fire extinguishing coupling mechanism of ultrafine dry powder under the action of heat sources. At the same time, research on the distribution pattern of ultrafine dry powder under the conditions of multi nozzle synergy and complex obstacle geometry can be carried out to improve the engineering applicability of simulation results and the design optimization ability of fire extinguishing systems.

Author Contributions

Conceptualization, resources, writing—review and editing, supervision, project administration, funding acquisition, Q.L. (Quanwei Li); investigation, validation, formal analysis, data curation, writing—original draft, visualization, Q.L. (Qingshan Liu); methodology, software, writing—original draft, investigation, formal analysis, C.L.; investigation, validation, formal analysis, data curation, L.T.; investigation, data curation, visualization, D.W.; resources, writing—review and editing, funding acquisition, X.H. All authors have read and agreed to the published version of the manuscript.

Funding

This research was funded by the Key Laboratory of Civil Aviation Thermal Hazards Prevention and Emergency Response (No. RZH2022-KF-02).

Data Availability Statement

The original contributions presented in the study are included in the article, further inquiries can be directed to the corresponding authors.

Conflicts of Interest

The authors declare that they have no known competing financial interests or personal relationships that could have appeared to influence the work reported in this paper.

References

  1. Wang, Z.; Zhang, Y.; Liu, Y.; Wang, J.; Zhou, X.; Pan, R. Study on the Pyrolysis and Fire Extinguishing Performance of High-Temperature-Resistant Ultrafine Dry Powder Fire Extinguishing Agents for Aviation Applications. Molecules 2024, 29, 3500. [Google Scholar] [CrossRef] [PubMed]
  2. Zhang, Y.; Wang, Z.; Liu, J.; Li, Q.; Pan, R.; Zhou, X. Alkaline potassium aluminum carbonate: A novel high-efficiency dry powder extinguishing agent with high heat-resistant. J. Anal. Appl. Pyrolysis 2023, 173, 106038. [Google Scholar] [CrossRef]
  3. Zhao, J.; Yin, Z.; Usman Shahid, M.; Xing, H.; Cheng, X.; Fu, Y.; Lu, S. Superhydrophobic and oleophobic ultra-fine dry chemical agent with higher chemical activity and longer fire-protection. J. Hazard. Mater. 2019, 380, 120625. [Google Scholar] [CrossRef] [PubMed]
  4. Jiang, H.; Jiang, Y.; Fan, R. Extinguishing capability of novel ultra-fine dry chemical agents loaded with iron hydroxide oxide. Fire Saf. J. 2022, 130, 103578. [Google Scholar] [CrossRef]
  5. Du, D.; Shen, X.; Feng, L.; Hua, M.; Pan, X. Efficiency characterization of fire extinguishing compound superfine powder containing Mg(OH)2. J. Loss Prev. Process Ind. 2019, 57, 73–80. [Google Scholar] [CrossRef]
  6. Guo, X.; Pan, X.; Zhang, L.; Hua, M.; Li, H.; Li, S.; Zhang, H. The inhibitory combustion reaction performance and tail gas analysis of composite ultra-fine dry powder extinguishing agent containing different additives. J. Loss Prev. Process Ind. 2020, 65, 104153. [Google Scholar] [CrossRef]
  7. Ji, J.; Li, W.; Zhang, H.; Zheng, Y.; Zhang, T.; Du, J.; Zhang, H.; Shi, B. A Novel Dual Phase-Change Composite Fire Extinguishing Powder for Extinguishing of Flaming and Smoldering Combustion in Magnesium Fires on Non-horizontal Surfaces. Fire Technol. 2025; in press. [Google Scholar] [CrossRef]
  8. Lu, G.; Zhao, J.; Zhou, Y.; Fu, Y.; Lu, S.; Zhang, H. Study on Flowability Enhancement and Performance Testing of Ultrafine Dry Powder Fire Extinguishing Agents Based on Application Requirements. Fire 2024, 7, 146. [Google Scholar] [CrossRef]
  9. Ni, X.; Zhang, K.; Zheng, Z.; Wang, W.; Hu, S. Application of Composite Dry Powders for Simultaneous Fire Extinguishment and Liquid Solidification of Methanol. Fire 2025, 8, 69. [Google Scholar] [CrossRef]
  10. Zhang, C.; Li, H.; Guo, X.; Li, S.; Zhang, H.; Pan, X.; Hua, M. Experimental and theoretical studies on the effect of Al(OH)3 on the fire-extinguishing performance of superfine ABC dry powder. Powder Technol. 2021, 393, 280–290. [Google Scholar] [CrossRef]
  11. Zhao, J.; Lu, S.; Fu, Y.; Shahid, M.U.; Zhang, H. Application of ultra-fine dry chemicals modified by POTS/OBS for suppressing aviation kerosene pool fire. Fire Saf. J. 2020, 118, 103148. [Google Scholar] [CrossRef]
  12. Zhou, X.; Guo, S.; Wang, J.; Wang, Y.; Pan, R. Construction of NaHCO3 fire extinguishing agent modified by fluoroalkyl silane containing short fluorocarbon Chain: Improve its anti-reignition performance. Therm. Sci. Eng. Prog. 2023, 41, 101814. [Google Scholar] [CrossRef]
  13. Zhou, Y.; Zhao, J.; Fu, Y.; Yu, Z.; Lu, S.; Zhang, H.; Jiang, Y. Study on the hydrophobic nano silica particles as flow-enhancing additives for ultrafine dry powder fire extinguishing agent. Adv. Powder Technol. 2024, 35, 104397. [Google Scholar] [CrossRef]
  14. Ma, W.; Liu, S.; Lu, S.; Shi, L.; Zhang, H. Anti-contamination calibration method for ultra-fine dry chemical agent: Achieving wide measurement range and high measurement accuracy. Measurement 2023, 223, 113743. [Google Scholar] [CrossRef]
  15. Moumen, A.; Stirbu, B.; Grossen, J.; Laboureur, D.; Gallant, J.; Hendrick, P. Particle image velocimetry for velocity measurement of muzzle flow: Detailed experimental study. Powder Technol. 2022, 405, 117509. [Google Scholar] [CrossRef]
  16. Liu, J.; Meng, X.; Yan, K.; Wang, Z.; Dai, W.; Wang, Z.; Li, F.; Yang, P.; Liu, Y. Study on the effect and mechanism of Ca(H2PO4)2 and CaCO3 powders on inhibiting the explosion of titanium powder. Powder Technol. 2022, 395, 158–167. [Google Scholar] [CrossRef]
  17. Wang, Z.; Guo, X.; Liu, J.; Zhang, Z.; Pan, X.; Hua, M.; Wu, Z.; Jiang, J. Experimental study on the inhibition of hydrogen deflagration by flame-retardant compounded ultrafine dry powder fire extinguishing media containing zinc hydroxystannate. Renew. Energy 2024, 228, 120644. [Google Scholar] [CrossRef]
  18. Yan, K.; Meng, X. An investigation on the aluminum dustexplosion suppression efficiency and mechanism of a NaHCO3/DE composite powder. Adv. Powder Technol. 2020, 31, 3246–3255. [Google Scholar] [CrossRef]
  19. Zhou, Y.; Zhao, J.; Wang, T.; Yu, Z.; Fu, Y.; Jiang, Y.; Cheng, X.; Zhang, H. Design of a high-efficiency ultrafine dry powder fire extinguishing agent incorporated with Fe/ZSM-5 zeolite. Powder Technol. 2025, 462, 121133. [Google Scholar] [CrossRef]
  20. Yu, X.; Li, H.; Miao, X.; Kang, N.; Yao, W.; Xu, M. Robust Ambient-Stable 2D Heterostructure of Copper Oxides Intercalating Black Phosphorus for Flame Retardancy and Catalytic Removal of Carbon Monoxide. Green Energy Environ. 2025; in press. [Google Scholar] [CrossRef]
  21. Fu, H.Y.; Cal, Y.W.; Xuan, Y.; Yln, W.H.; Pan, R.M.; Li, Q.W. Simulative experimental study on the relationship between the inlet velocity of the gascarrier and the current resistance of the superfine powder extinguishing agent. J. Saf. Environ. 2016, 16, 91–95. [Google Scholar]
  22. Lu, C.; Lv, X.D.; Wei, W.; Zhang, L.B. Numerical Simulation Analysis of Dischargand Flow of Ultrafine Powders. China Powder Sci. Technol. 2014, 20, 17–20+24. [Google Scholar]
  23. Ji, J.W.; Cai, W.M.; Tian, Z.J.; Kou, J. Research on flow characteristies of ultra-finedry powder gas-solid two-phase flow inhorizontal straight pipe. Fire Sci. Technol. 2022, 41, 1445–1450. [Google Scholar]
  24. Cai, Y.W.; Xuan, Y.; Li, Q.W.; Wang, H.; Pan, R.M. On the effects of the filling conditions on the discharge releasing rate of the superfine fire-extinguishing powder in the horizontal pipeline. J. Saf. Environ. 2015, 15, 154–157. [Google Scholar]
  25. Hua, M.; Yin, Z.P.; Pan, R.M. On the releasing characteristie features of superfine fire-extinguishing powder. J. Saf. Environ. 2012, 12, 217–221. [Google Scholar]
  26. Liu, R.; Shi, H.; Zhou, Q.; Ma, W.; Wang, T.; Lu, S. Simulation of Fire Extinguishing Agent Transport and Dispersion in Aircraft Engine Nacelle. Fire 2022, 5, 97. [Google Scholar] [CrossRef]
  27. Yu, H.-Z.; Zhou, X. Enclosure fire extinguishment with water mist and nitrogen as affected by fire size, obstruction and ventilation. Fire Saf. J. 2024, 142, 104051. [Google Scholar] [CrossRef]
  28. Pu, W.; Zhao, C.; Xiong, Y.; Liang, C.; Chen, X.; Lu, P.; Fan, C. Numerical simulation on dense phase pneumatic conveying of pulverized coal in horizontal pipe at high pressure. Chem. Eng. Sci. 2010, 65, 2500–2512. [Google Scholar] [CrossRef]
  29. Fluent Corporation. Ansys Fluent Theory Guide; Ansys Inc.: Canonsburg, PA, USA, 2024. [Google Scholar]
  30. Gong, M.; Shen, Y. Study on heat flow decay in vertical jet of aircraft deicing fluid based on phase field and realizable k-ε turbulence model. Therm. Sci. Eng. Prog. 2025, 60, 103446. [Google Scholar] [CrossRef]
  31. Santiago, J.L.; Martín, F.; Cuerva, A.; Bezdenejnykh, N.; Sanz-Andrés, A. Experimental and numerical study of wind flow behind windbreaks. Atmos. Environ. 2007, 41, 6406–6420. [Google Scholar] [CrossRef]
  32. Rahimi, A.; Tavakoli, T.; Zahiri, S. Computational Fluid Dynamics (CFD) Modeling of Gaseous Pollutants Dispersion in Low Wind Speed Condition: Isfahan Refinery, a Case Study. Pet. Sci. Technol. 2014, 32, 1318–1326. [Google Scholar] [CrossRef]
  33. Hang, J.; Luo, Z.; Sandberg, M.; Gong, J. Natural ventilation assessment in typical open and semi-open urban environments under various wind directions. Build. Environ. 2013, 70, 318–333. [Google Scholar] [CrossRef]
  34. Tominaga, Y.; Stathopoulos, T. Numerical simulation of dispersion around an isolated cubic building: Comparison of various types of k–ε models. Atmos. Environ. 2009, 43, 3200–3210. [Google Scholar] [CrossRef]
Figure 1. Simulation model. (a) Physical model, (b) Grid diagram.
Fire 08 00236 g001
Figure 2. Schematic diagram of measurement points location. (a) Measurement surface, (b) Measurement points.
Fire 08 00236 g002
Figure 3. Simulation verification experiment diagram. (a) Experimental system diagram, (b) Experimental chamber.
Fire 08 00236 g003
Figure 4. Comparison of experimental and simulation.
Fire 08 00236 g004aFire 08 00236 g004b
Figure 5. Verification of lattice independence.
Fire 08 00236 g005
Figure 6. Particle concentration distribution at the confined chamber.
Fire 08 00236 g006aFire 08 00236 g006b
Figure 7. Particle concentration distribution at the confined chamber with obstacles.
Fire 08 00236 g007
Figure 8. Flow process diagram of ultrafine dry powder.
Fire 08 00236 g008
Figure 9. Comparison of average concentration in the upper and lower regions.
Fire 08 00236 g009
Figure 10. Comparison of the concentration difference between the upper and lower regions.
Fire 08 00236 g010
Figure 11. Comparison of the time to reach the minimum fire extinguishing concentration.
Fire 08 00236 g011
Figure 12. Comparison of concentration distribution of ultrafine dry powder under different obstacle volume conditions.
Fire 08 00236 g012
Figure 13. Comparison of feature size D for different obstacle volumes.
Fire 08 00236 g013
Figure 14. Comparison of duration of unfavorable areas for different obstacle volumes.
Fire 08 00236 g014
Figure 15. Comparison of the effect of obstacle volume on normalized feature size.
Fire 08 00236 g015
Figure 16. The change of normalized feature size reduction rate with obstacle volume.
Fire 08 00236 g016
Figure 17. Comparison of average concentration in the area above and below the barrier.
Fire 08 00236 g017
Figure 18. Comparison of the effect of obstacle location on the concentration difference between the upper and lower regions.
Fire 08 00236 g018
Figure 19. Comparison of concentration distribution of ultrafine dry powder under different obstacle location conditions.
Fire 08 00236 g019
Figure 20. Comparison of feature size D for different obstacle locations.
Fire 08 00236 g020
Figure 21. Comparison of duration of unfavorable areas for different obstacle locations.
Fire 08 00236 g021
Figure 22. Comparison of the effect of obstacle position on normalized feature size.
Fire 08 00236 g022
Figure 23. The change of normalized feature size reduction rate with obstacle locations.
Fire 08 00236 g023
Table 1. List of simulation conditions.
Serial NumberObstacle
Volume/dm3
Distance of Nozzle from Top Surface/mDistance from Side Wall/mInjection
Pressure/MPa
Nozzle Speed/m s−1Extinguishing Agent Mass Flow Rate/kg s−1
1nonenonenone11220.03
280.40.411220.03
315.70.40.37511220.03
4270.40.3511220.03
542.90.40.32511220.03
6640.40.311220.03
780.20.411220.03
880.60.411220.03
Disclaimer/Publisher’s Note: The statements, opinions and data contained in all publications are solely those of the individual author(s) and contributor(s) and not of MDPI and/or the editor(s). MDPI and/or the editor(s) disclaim responsibility for any injury to people or property resulting from any ideas, methods, instructions or products referred to in the content.

