Article

Numerical Studies on the Combined Effect of Curvature and Area Expansion Rate on Gaseous Detonation Propagation in Curved Channels

1
State Key Laboratory of Chemical Safety, Qingdao 266071, China
2
SINOPEC Research Institute of Safety Engineering Co., Ltd., Qingdao 266071, China
*
Author to whom correspondence should be addressed.
Fire 2025, 8(6), 218; https://doi.org/10.3390/fire8060218
Submission received: 7 April 2025 / Revised: 23 May 2025 / Accepted: 26 May 2025 / Published: 29 May 2025

Abstract

Here, a pure and systematic numerical study is conducted to investigate the detonation propagation in a curvature bend by focusing on the combined effect of curvature and cross-section area with a simple two-step chemical reaction model. In a channel with a small radius of curvature R/λ < 10, the detonation wave presents a periodical failure-reinitiation mode. The detonation wave near the inner wall cannot sustain itself due to the strong curvature effect. In contrast, the compression of the outer wall strengthens the front and can form a transverse detonation wave to re-initiate the failed detonation near the inner wall. In a channel with a large radius of curvature R/λ > 10, the inner wall’s weak rarefaction effect is not strong enough to completely quench the detonation wave. In the same way, the numerical results also show that a large area expansion rate inevitably produces a strong rarefaction effect near the inner wall, causing wave front decoupling and even failure. According to the radius of the curvature and the area increase rate, there are three different modes of detonation propagation: stable, critical, and unstable. By defining a new parameter κ to characterize different detonation modes and by considering both the curvature and area expansion effect, we found that the threshold κ = 0.33 can be used to distinguish the unstable and critical modes.

1. Introduction

Research on detonation propagation has significant implications for various fields, including aerospace, combustion engineering, and safety science. The study of cellular detonation waves propagating through curved channels could provide an attractive configuration for research due to the fact that it combines many basic detonation phenomena, such as diffraction, reflection, detonation failure, and re-initiation [1,2,3]. The present study can facilitate the design of the chamber of the rotating detonation engine by optimizing the wave front structure, as well as the venting facility of gas explosion in channels by supplying the failure criterion of detonation propagation. The propagation mechanism is governed by the interaction between the rarefaction wave formed on the inner wall and the reflection structure generated on the outer wall [4]. Both the diffraction [5,6,7] and Mach reflection [8,9,10] processes have been fully studied and are still active research fields. In a diffraction process, the detonation undergoes a rarefaction effect and may fail near its limit with the presence of a completely decoupled front. In contrast, in a reflection process, the detonation is compressed and evolves into a Mach or regular reflection depending on the wall angle.
Takayama et al. [11] studied the interaction of complex wave systems when a plane shock wave propagates in a 90° bend. The results show that the shock wave velocity ratio of the concave and convex walls of the bend is related to the radius of curvature of the bend. Qualitatively, the propagation of detonation waves in a curved pipe with a large radius of curvature is similar to that of a plane shock wave. Obviously different from the shock wave is that the detonation wave front is a non-planar structure, and there are transverse waves on the wave front. When the radius of the curvature of the elbow is small, the detonation wave will be extinguished and a second detonation may occur [1,2,3]. As found by many researchers, the decoupled detonation can be re-initiated by the transverse detonation from the reflection on the outer wall. It is also found that basically three different modes exist for the detonation propagation in bends. Achasov and Penyaz’kov [12] studied the changes in the cell lattice of gas-phase detonation waves propagating in a circular pipe. Frolov et al. [13] studied the propagation of shock waves in U-tubes, including the initial state, propagation process, and gaseous fuel stable detonation process. However, their numerical study only considers a fixed curvature and thus the effect of different curvatures on detonation propagation is not clear. Thomas and Williams [14] studied the interaction of gas–phase detonation waves with constraints such as wedges and bends, and elaborated the micro-structures such as shear waves in the propagation process of detonation waves and their influence on the propagation characteristics of detonation waves. The failure criterion and transient change in detonation front is not reported since they only examined the smoked foils. In most of the numerical simulation and experiments, the smoked foils are usually used to record the cellular structures to analyze the propagation of the detonation. In addition, the open shutter photography techniques can also be used to capture the detonation front and cellular structures [15,16,17,18,19]. For instance, Sato et al. [15] study the propagation characteristics of methane–air premixed flames in small-size 90° semi-closed pipes only focusing on the transient wave shape. The propagation velocity and the failure mechanism are not discussed. Kudo et al. [16] studied the propagation mechanism of detonation in five different bends, and found that the detonation can maintain a stable mode near the inner wall when its radius of curvature is about 14–40 times the cell size. While Kudo et al. [16] demonstrated stability at large radii, it remains unclear how moderate curvature combined with area expansion would impact quenching thresholds. Following the study of Kudo et al. [16], Nakayama et al. [17] found a criterion to characterize the detonation propagation modes by examining the relationship between the velocity and curvature. However, the transient evolution of the wave structure of the detonation in a curved channel is not studied due to the lack of Schlieren photography. There are relevant studies in the literature on detonation diffraction into wider areas, or on detonation attenuation in expanding ducts [18,19,20,21,22]. They found that the decaying of detonation is highly influenced by the diverging rate, and may fail completely when the diverging rate is larger than a critical value. The detonation propagation in curved channels with a combined effect of curvature and cross-sectional area is more complicated and the relevant research is still lacking.
Most previous studies focus on the curvature or the diverging effect on detonation separately. In the present study, we study these two effects together by considering a curved channel with an expanding width to reveal more of the physics of detonation propagation. We also compare the results of shock and detonation waves to highlight the effect of chemical reactions. The channel’s geometry is specially designed to study the effect of different radii and diverging rates. A planar detonation with a CJ state is used as an initial condition to observe its evolution in the channel. In the present study, we examine the evolution of the detailed structure of the detonation front, which is significantly different from the previous studies. Here, a systematic numerical study is conducted to investigate the combined effect of curvature and cross-section area on detonation propagation in curvature bend, with a particular focus on the quench and reinitiation mechanism.

2. Numerical Methodology

2.1. Governing Equations

The present simulation of detonation propagation in curved channels is based on the inviscid, reactive Euler equations for two-dimensional flows. Written in conserved form, these equations are represented by the following:
ρ t + ρ u x + ρ v y = 0
ρ u t + ρ u 2 + p x + ρ u v y = 0
ρ v t + ρ u v x + ρ v 2 + p y = 0
E t + E + p u x + E + p v y = 0
ρ y I t + ρ u y I x + ρ v y I y = ω I
ρ y R t + ρ u y R x + ρ v y R y = ω R
where ρ ,   u ,   v ,   p ,   E are density, velocity in the x-direction, velocity in the y-direction, pressure and total energy. y I and y R are the progress of induction and reaction stages. ω I and ω R are the reaction rates of induction and reaction stages.
Assuming a polytropic equation of state and an ideal thermal equation of state, we obtain the following:
E = p γ 1 + ρ u 2 + v 2 2 ρ y R Q
The conservation laws are coupled with a two-step chain-branching type reaction model [20]. The first step represents a thermally neutral induction zone, with a temperature-sensitive Arrhenius form of the reaction rate given by the following:
ω I = H 1 y I ρ k I e x p E I 1 R T s 1 R T
where k I and E I are the pre-exponential factor and activation energy of the induction stage. T s is the temperature behind the shock front of the ZND detonation. H 1 y I is a step function defined as follows:
H 1 y I = 1       i f   y I < 1
H 1 y I = 0       i f   y I 1
At the end of the induction zone, the second step describes the rapid energy release after the branched-chain thermal explosion and the slow heat release in the radical recombination stage. The reaction rate for this step is given by the following:
ω R = 1 H 1 y I ρ k R 1 y R e x p E R R T
where k R and E R are the pre-exponential factor and activation energy of the reaction stage.
The induction length I is controlled by the induction rate constant k I , and the reaction rate constant k R determines the length of the reaction zone R . Thus, the reaction rate constant k R is also used as a bifurcation parameter to control the ratio of the reaction length R to the induction length I , or the stability of a detonation wave. Generally, the induction length is simply defined as the length of the thermally neutral period. As pointed out by Ng et al. [23], no standard definition exits for the reaction length R . In the ZND detonation model, we determine this scale from the thermicity profile, i.e., R is the half-height width of the thermicity pulse. Thus, the overall thicknesses of the detonation front can be obtained, i.e., = I + R .
In the present calculation, the global heat release Q is determined in order to reproduce the correct CJ Mach number, given for a perfect gas by the following:
Q R T 0 = γ 2 γ 2 1 M C J 1 M C J 2
Some reaction parameters are evaluated and shown in Table 1. Typical values for E 1 R T V N usually range from 4 (for hydrogen–oxygen mixtures) to 12 (for heavy hydrocarbon mixtures). In contrast, the second step involves only reactions between energetic free radicals. For typical chain-branching reactions, the induction stage generally has a larger activation energy as compared to the reaction stage. Hence, we simply set E R R T V N = 1 for the present study. The simplest way to obtain an inert shock within the framework of ZND detonations with the present two-step model is to reduce the induction rate constant k I to obtain a very large induction zone. The induction zone is thermally neutral, and in essence, the “frozen” ZND detonation corresponds to an inert shock. Thus, the isentropic exponent and the Mach number of inert shock waves are the same as ZND detonation waves. By maintaining k I as a constant value and varying k R , we obtained ZND detonations with the same induction lengths but different reaction widths. In the present study, the k I and k R are chosen so that the induction length is exactly 0.1 mm and the corresponding detonation is weakly unstable. The detonation cell size in the CJ state based on the parameters from Table 1 is about 50 times the induction length, i.e., 5 mm.
Calculating the detonation properties of stoichiometric H2-O2-Ar with dilution from 20% to 80% using the Chemkin and detailed chemical reaction mechanism reveals that the activation energies range from 4 to 6, and the Mach number of detonations is about 5. Thus, the present model and parameters mimic the stoichiometric H2-O2-Ar with dilution from 20% to 80% with initial pressure below 50 kPa.

2.2. Numerical Methods

Adaptive mesh refinement techniques are widely used in computational mechanics to increase computation efficiency. In the present study, the governing equations were solved using a parallel AMROC code [24] built with a block-structured adaptive mesh refinement (AMR) technique [25]. A fractional steps method was used to decouple the hydrodynamic transport and the chemical reaction numerically. The reactive Euler equations were then solved with an explicit second-order Godunov-type scheme incorporating a hybrid Roe-solver-based method. Slip wall conditions were imposed on solid boundaries. The upper and lower boundaries as well as the wedge surface were all set as solid walls. The outlet boundary condition was imposed on the right boundary. The simulation was initialized with a planar ZND detonation placed at the wedge apex. The left boundary was fixed with the CJ solution such that there is no expansion wave behind the CJ point of the ZND detonation wave.

2.3. Resolution Test

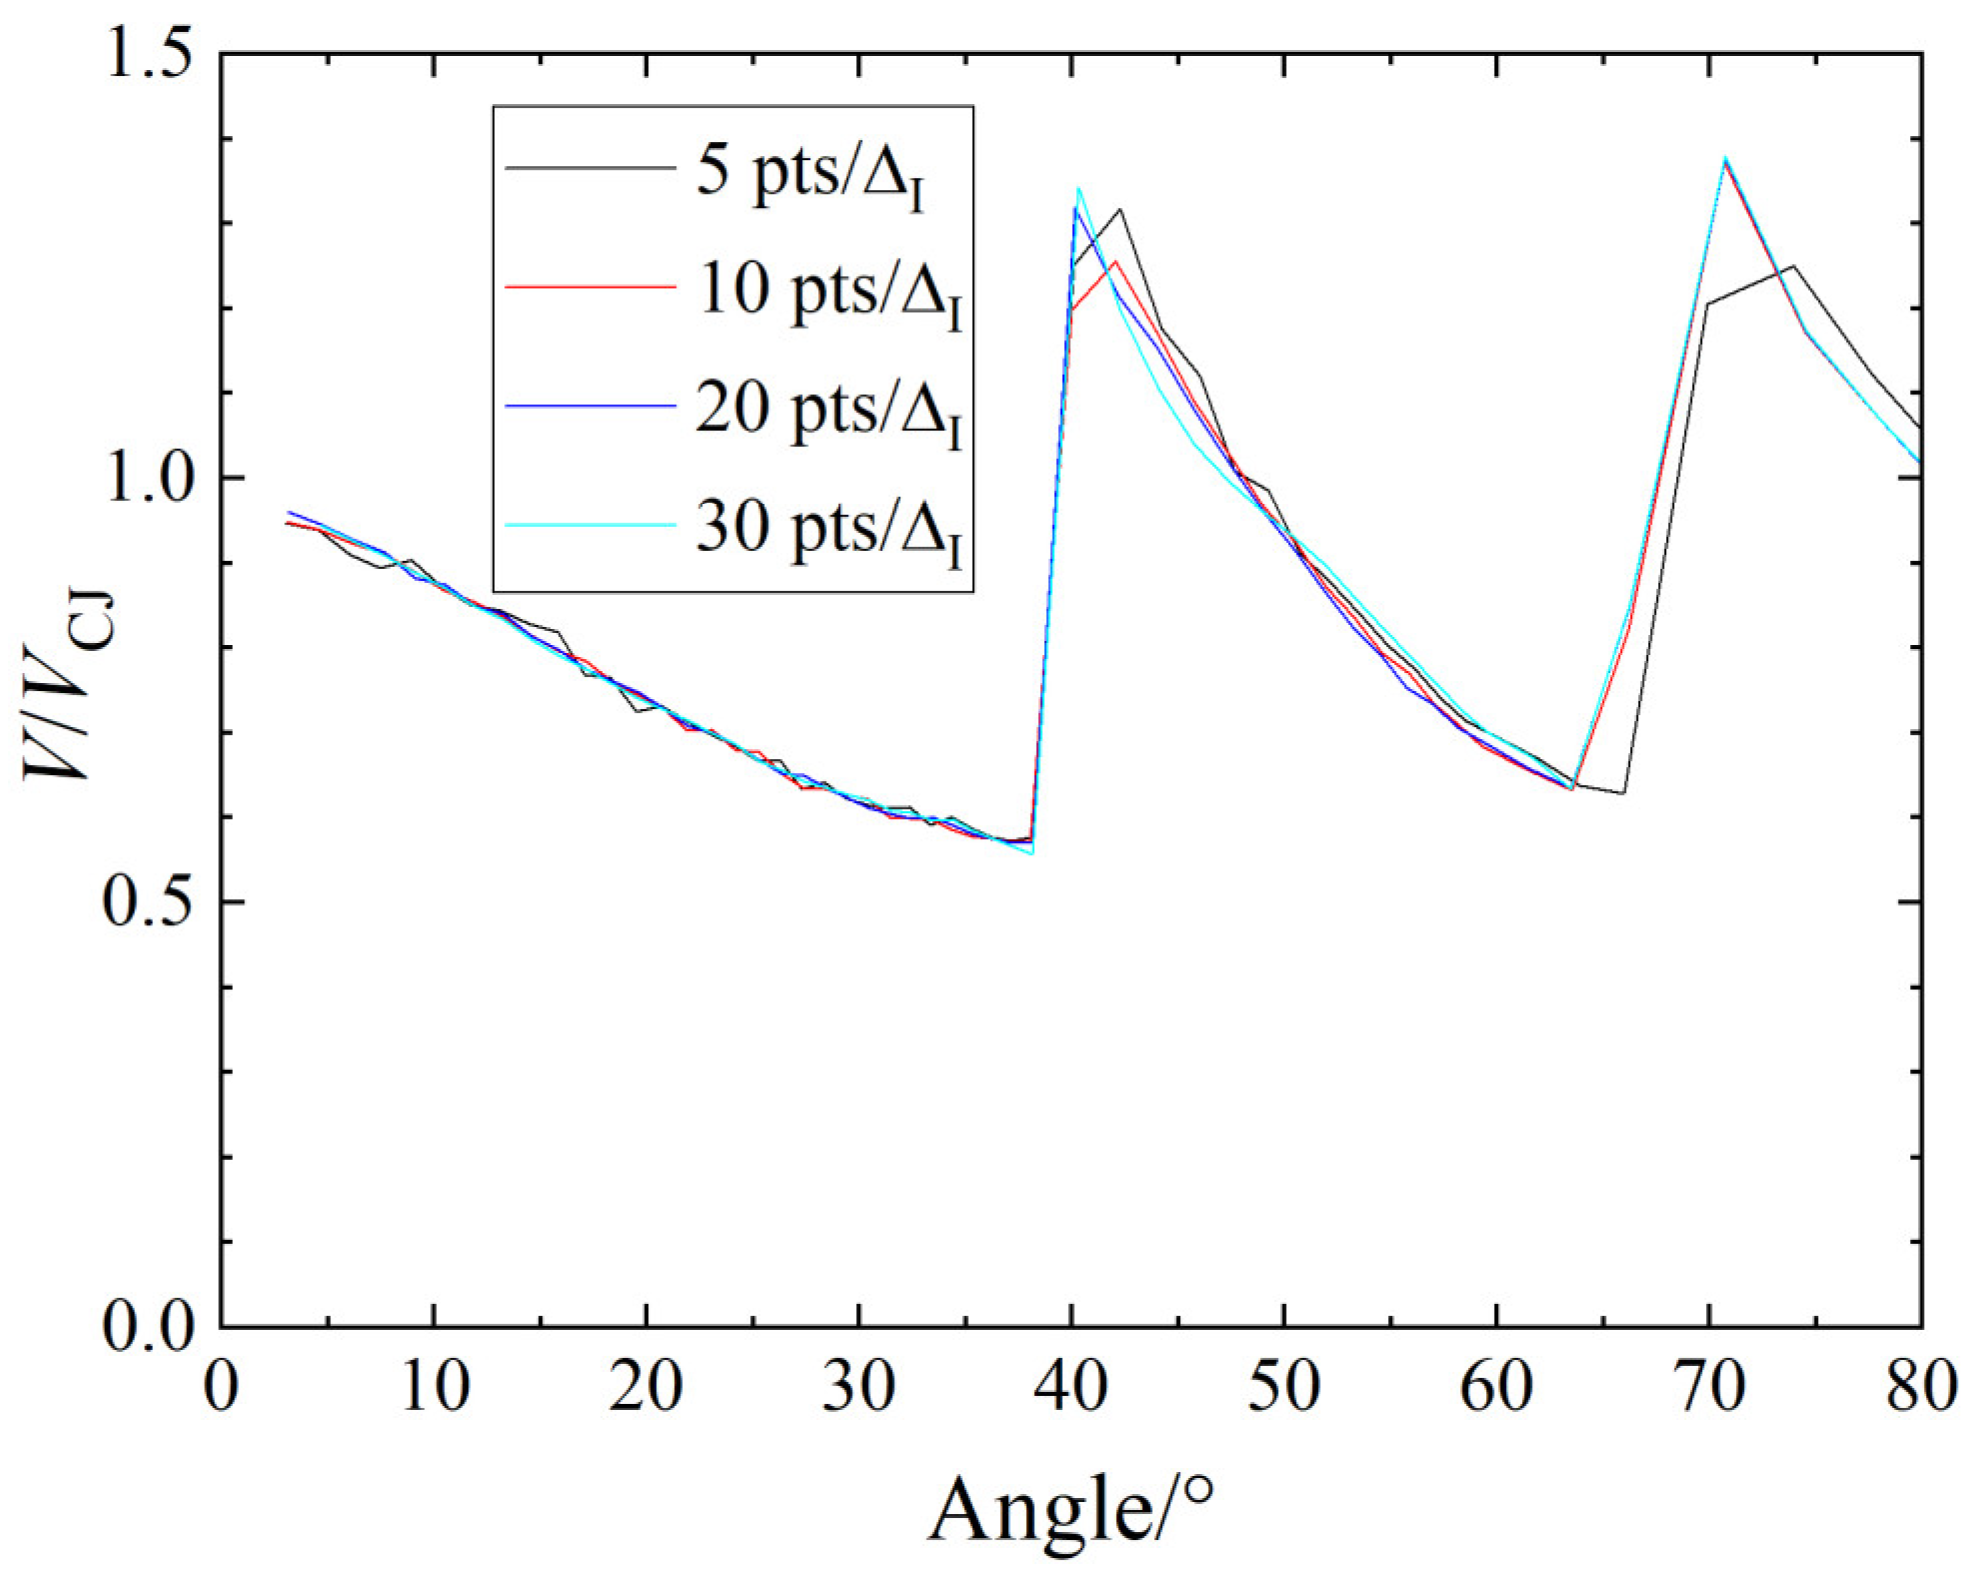
A grid convergence test for detonation propagation in the curved channel as shown in Figure 1 and Figure 2 using four different grid sizes 10 pts/ΔI, 15 pts/ΔI, 20 pts/ΔI, and 30 pts/ΔI were carried out to determine the adequate grid size. The resulting and flow fields at a specific moment are illustrated in Figure 1. A comparison of these flow fields revealed the flow fields from the grid resolutions of 20 pts/ΔI and 30 pts/ΔI simulations demonstrated considerable similarity, particularly regarding the fluid structures. In addition, the propagation velocity curves along the inner wall from Figure 1 are plotted in Figure 2 for comparison. It was observed that the maximum pressure history curves for grid sizes 20 pts/ΔI and 30 pts/ΔI almost completely overlapped. These results indicate that a grid size of 20 pts/ΔI provides an accurate resolution of the flow field, thereby justifying its use in the present study.

2.4. Numerical Setups

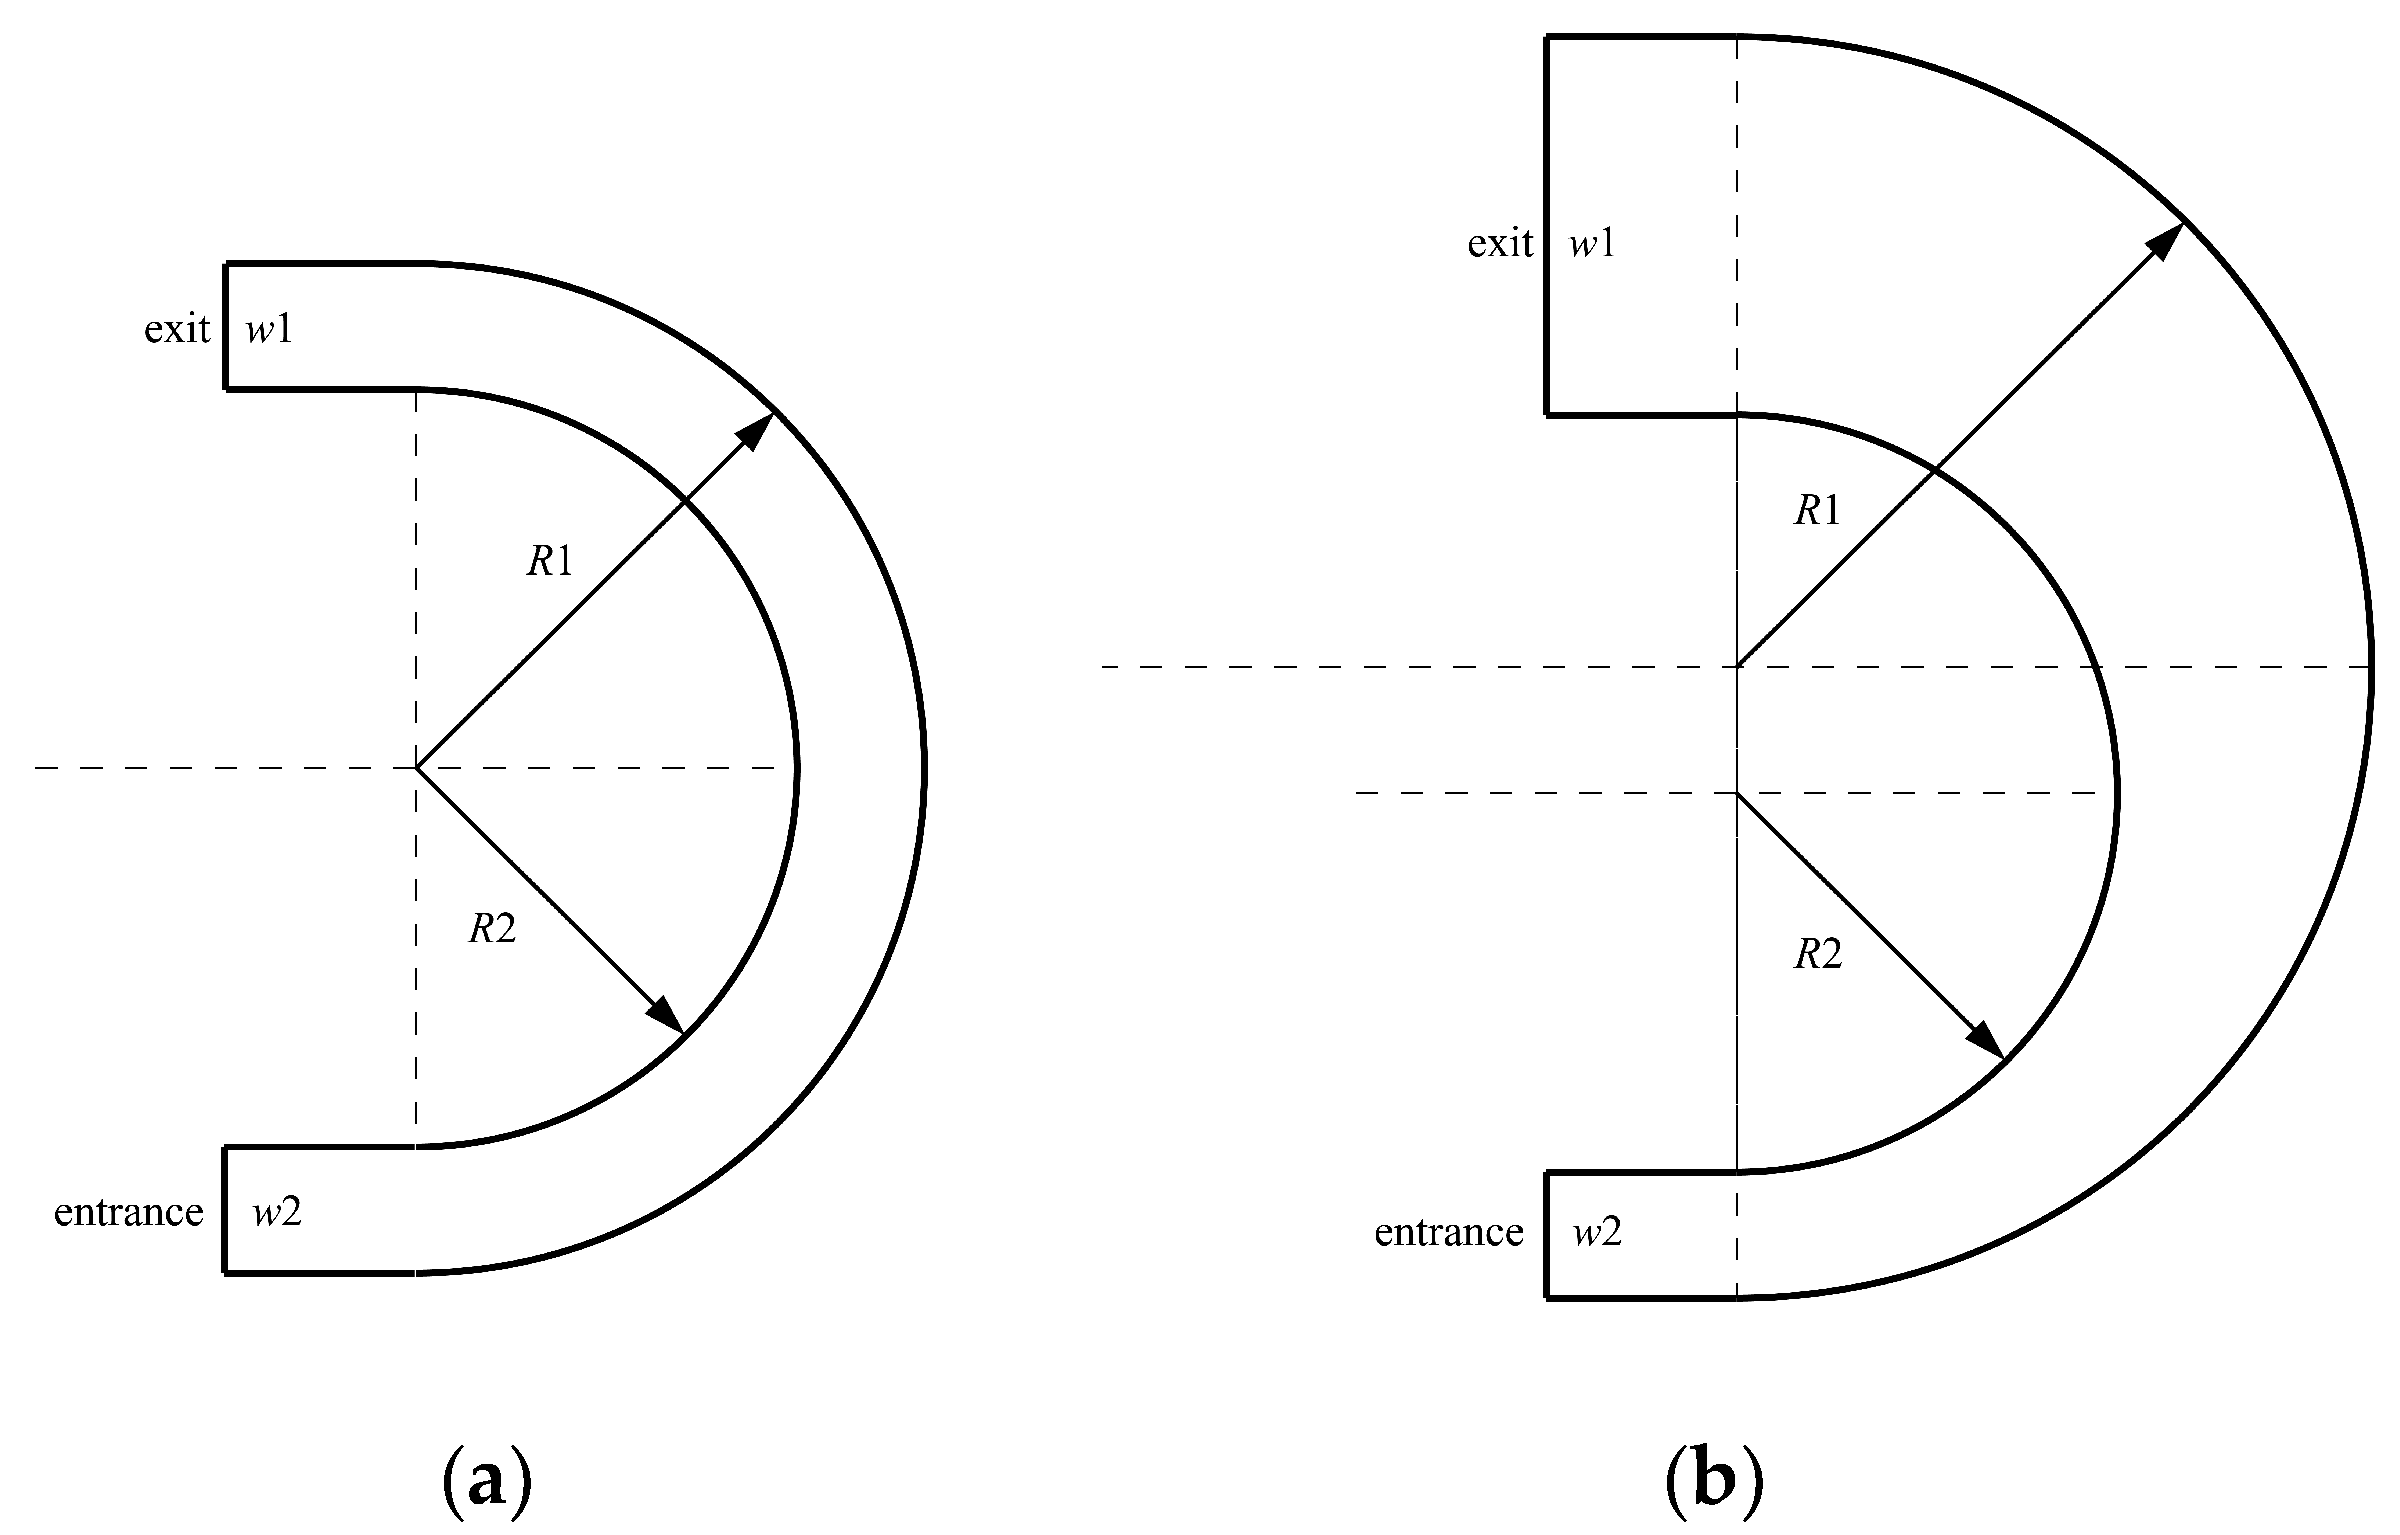
As shown in Figure 3, two different curved channels are used in the present study. The first one with a fixed cross-sectional area of w1 comprises two straight channels connected with a curved channel of 90°. The curvature radii of the inner and outer walls of the curved channel are R1 and R2, respectively. By changing the radius of curvature, R1 and R2 of the inner and outer walls and their centers, the second one, i.e., a curved channel with the varying cross-sectional area can be obtained. The boundary conditions for the entrance and exit are both set as out flow conditions. The boundary conditions for the inner and outer walls are both set as slip wall conditions. In the present numerical studies, the grid resolution is at least 20 grids within an induction zone to ensure the convergence of the simulation.

3. Results and Discussions

The simulation of shock waves propagating in the curved channel is first studied to supply a benchmark for the detonation propagation as shown in the following section. In addition, cases in curved channels with constant and varying cross-section are both studied, respectively, to reveal the combined effect of curvature and cross-section variation.

3.1. Shock Propagation in Coverture Bend with Constant Cross-Section Area

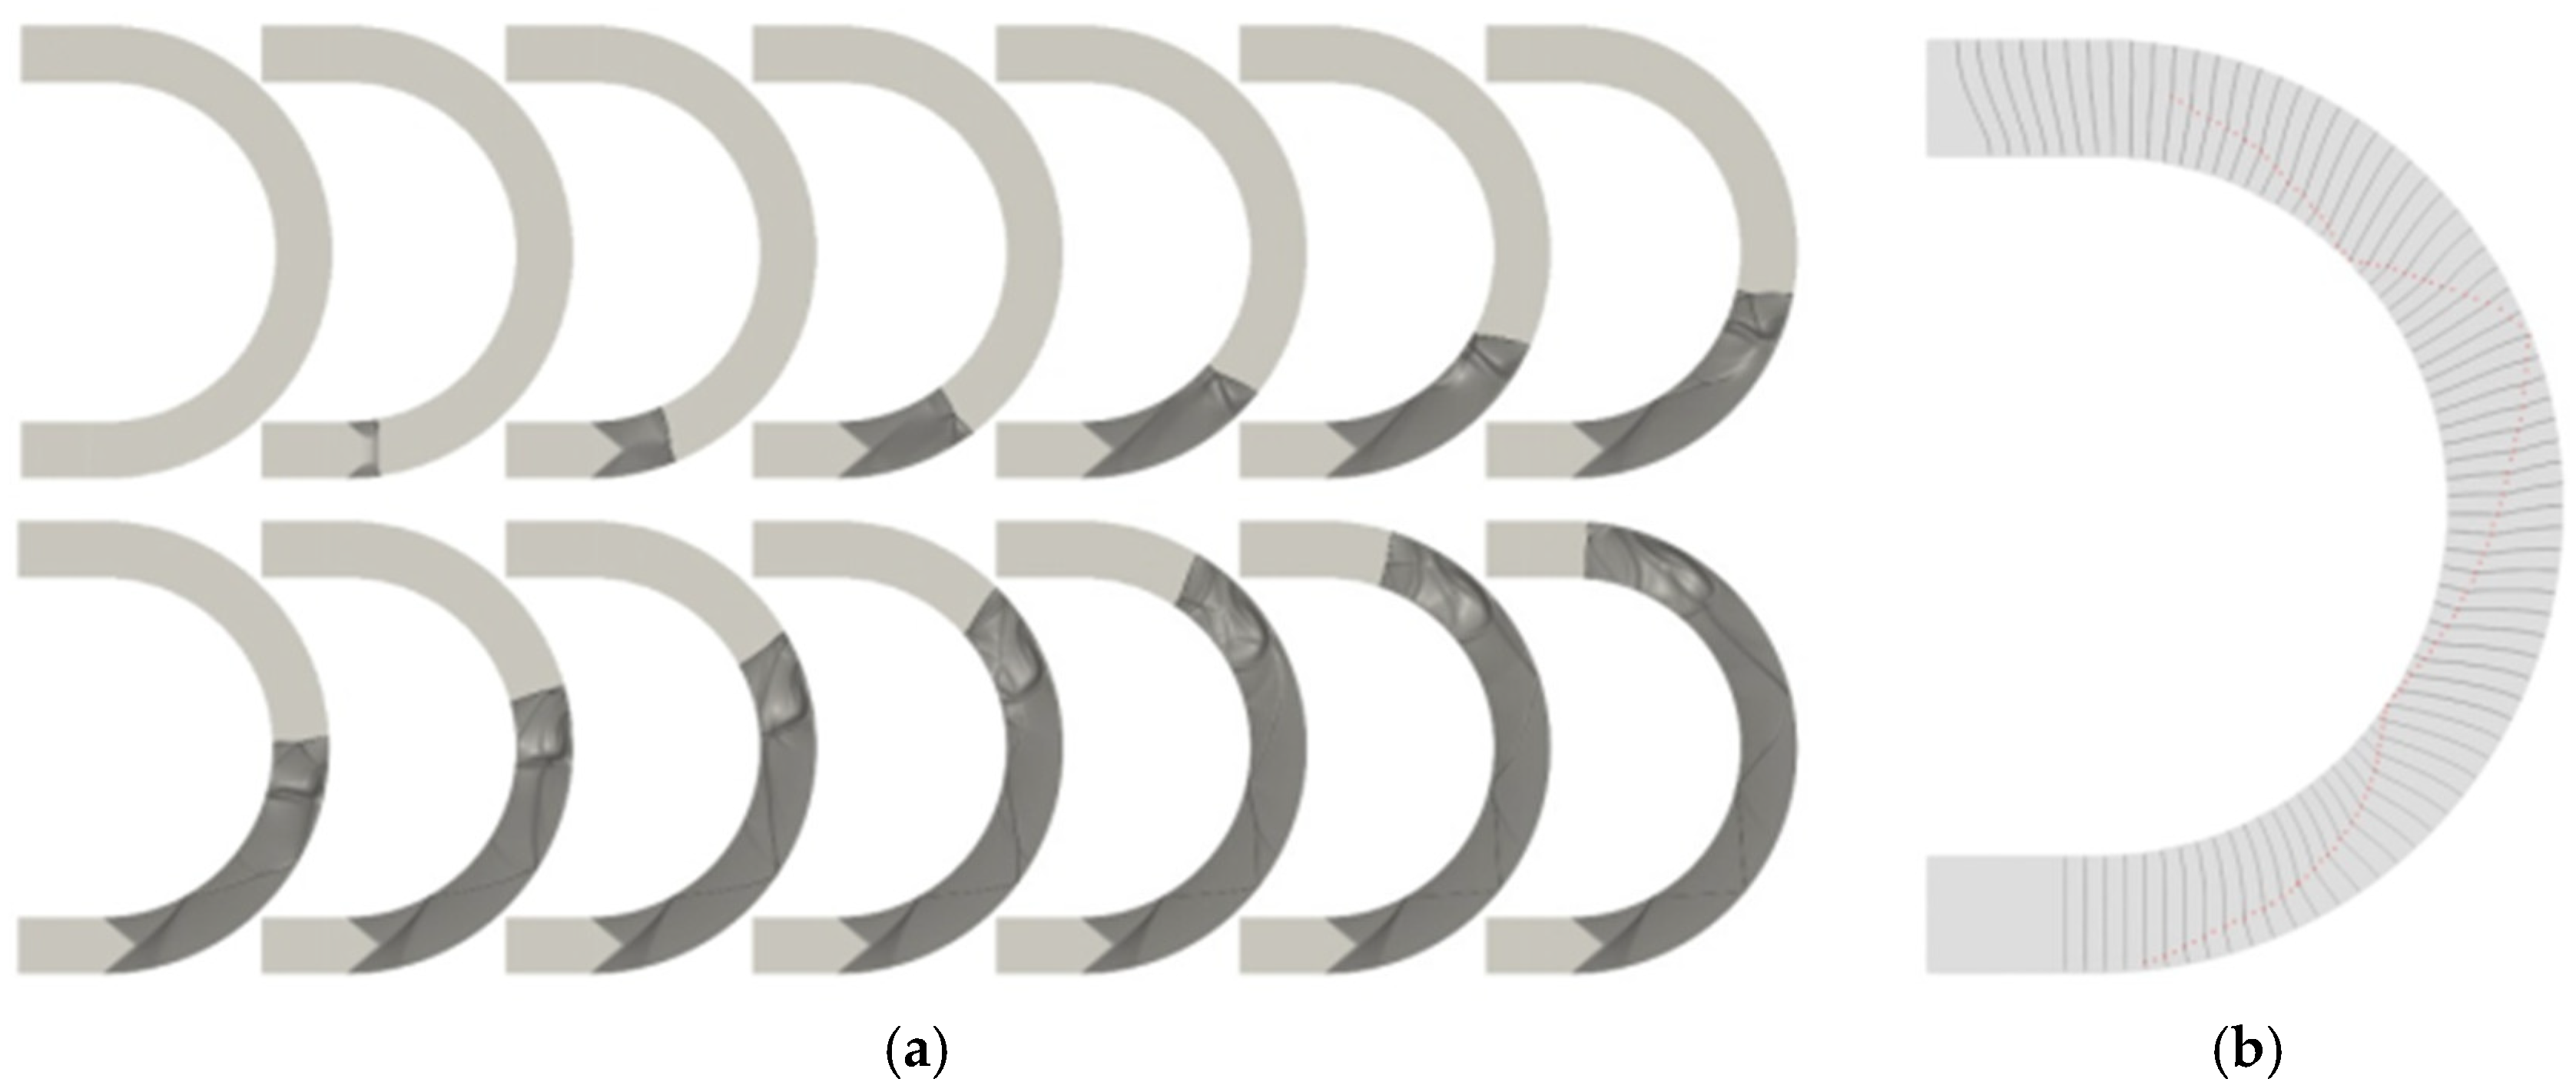
As shown in Table 2, to study the propagation of shock waves in curved channel with a constant cross-section, four cases with different radii of curvature are studied. The cross-sectional area of all four cases is the same, i.e., w1 = w2 = 10 mm. Figure 4 shows the wave front Schlieren diagrams and triple-point trajectory with R1 = 30 mm and R2 = 40 mm at different moments during the propagation. Numerical Schlieren diagram is essentially a density gradient, and thus the structures of the wave front can be clearly observed, especially the shocks and contact discontinuity. It can be seen that after the plane shock wave entering the elbow, diffraction occurs on the inner wall, and Mach reflection occurs on the outer wall and forms a triple-wave structures on the shock front. As the shock wave continues to propagate forward in the curved channel, the wave front becomes curved, but both ends of the wave front are perpendicular to the inner and outer walls, as shown in Figure 4b. At the same time, it can also be observed that the triple-wave structure repeatedly collides with the inner and outer walls, which apparently affect the shape distribution, pressure and velocity distributions of the wave front.
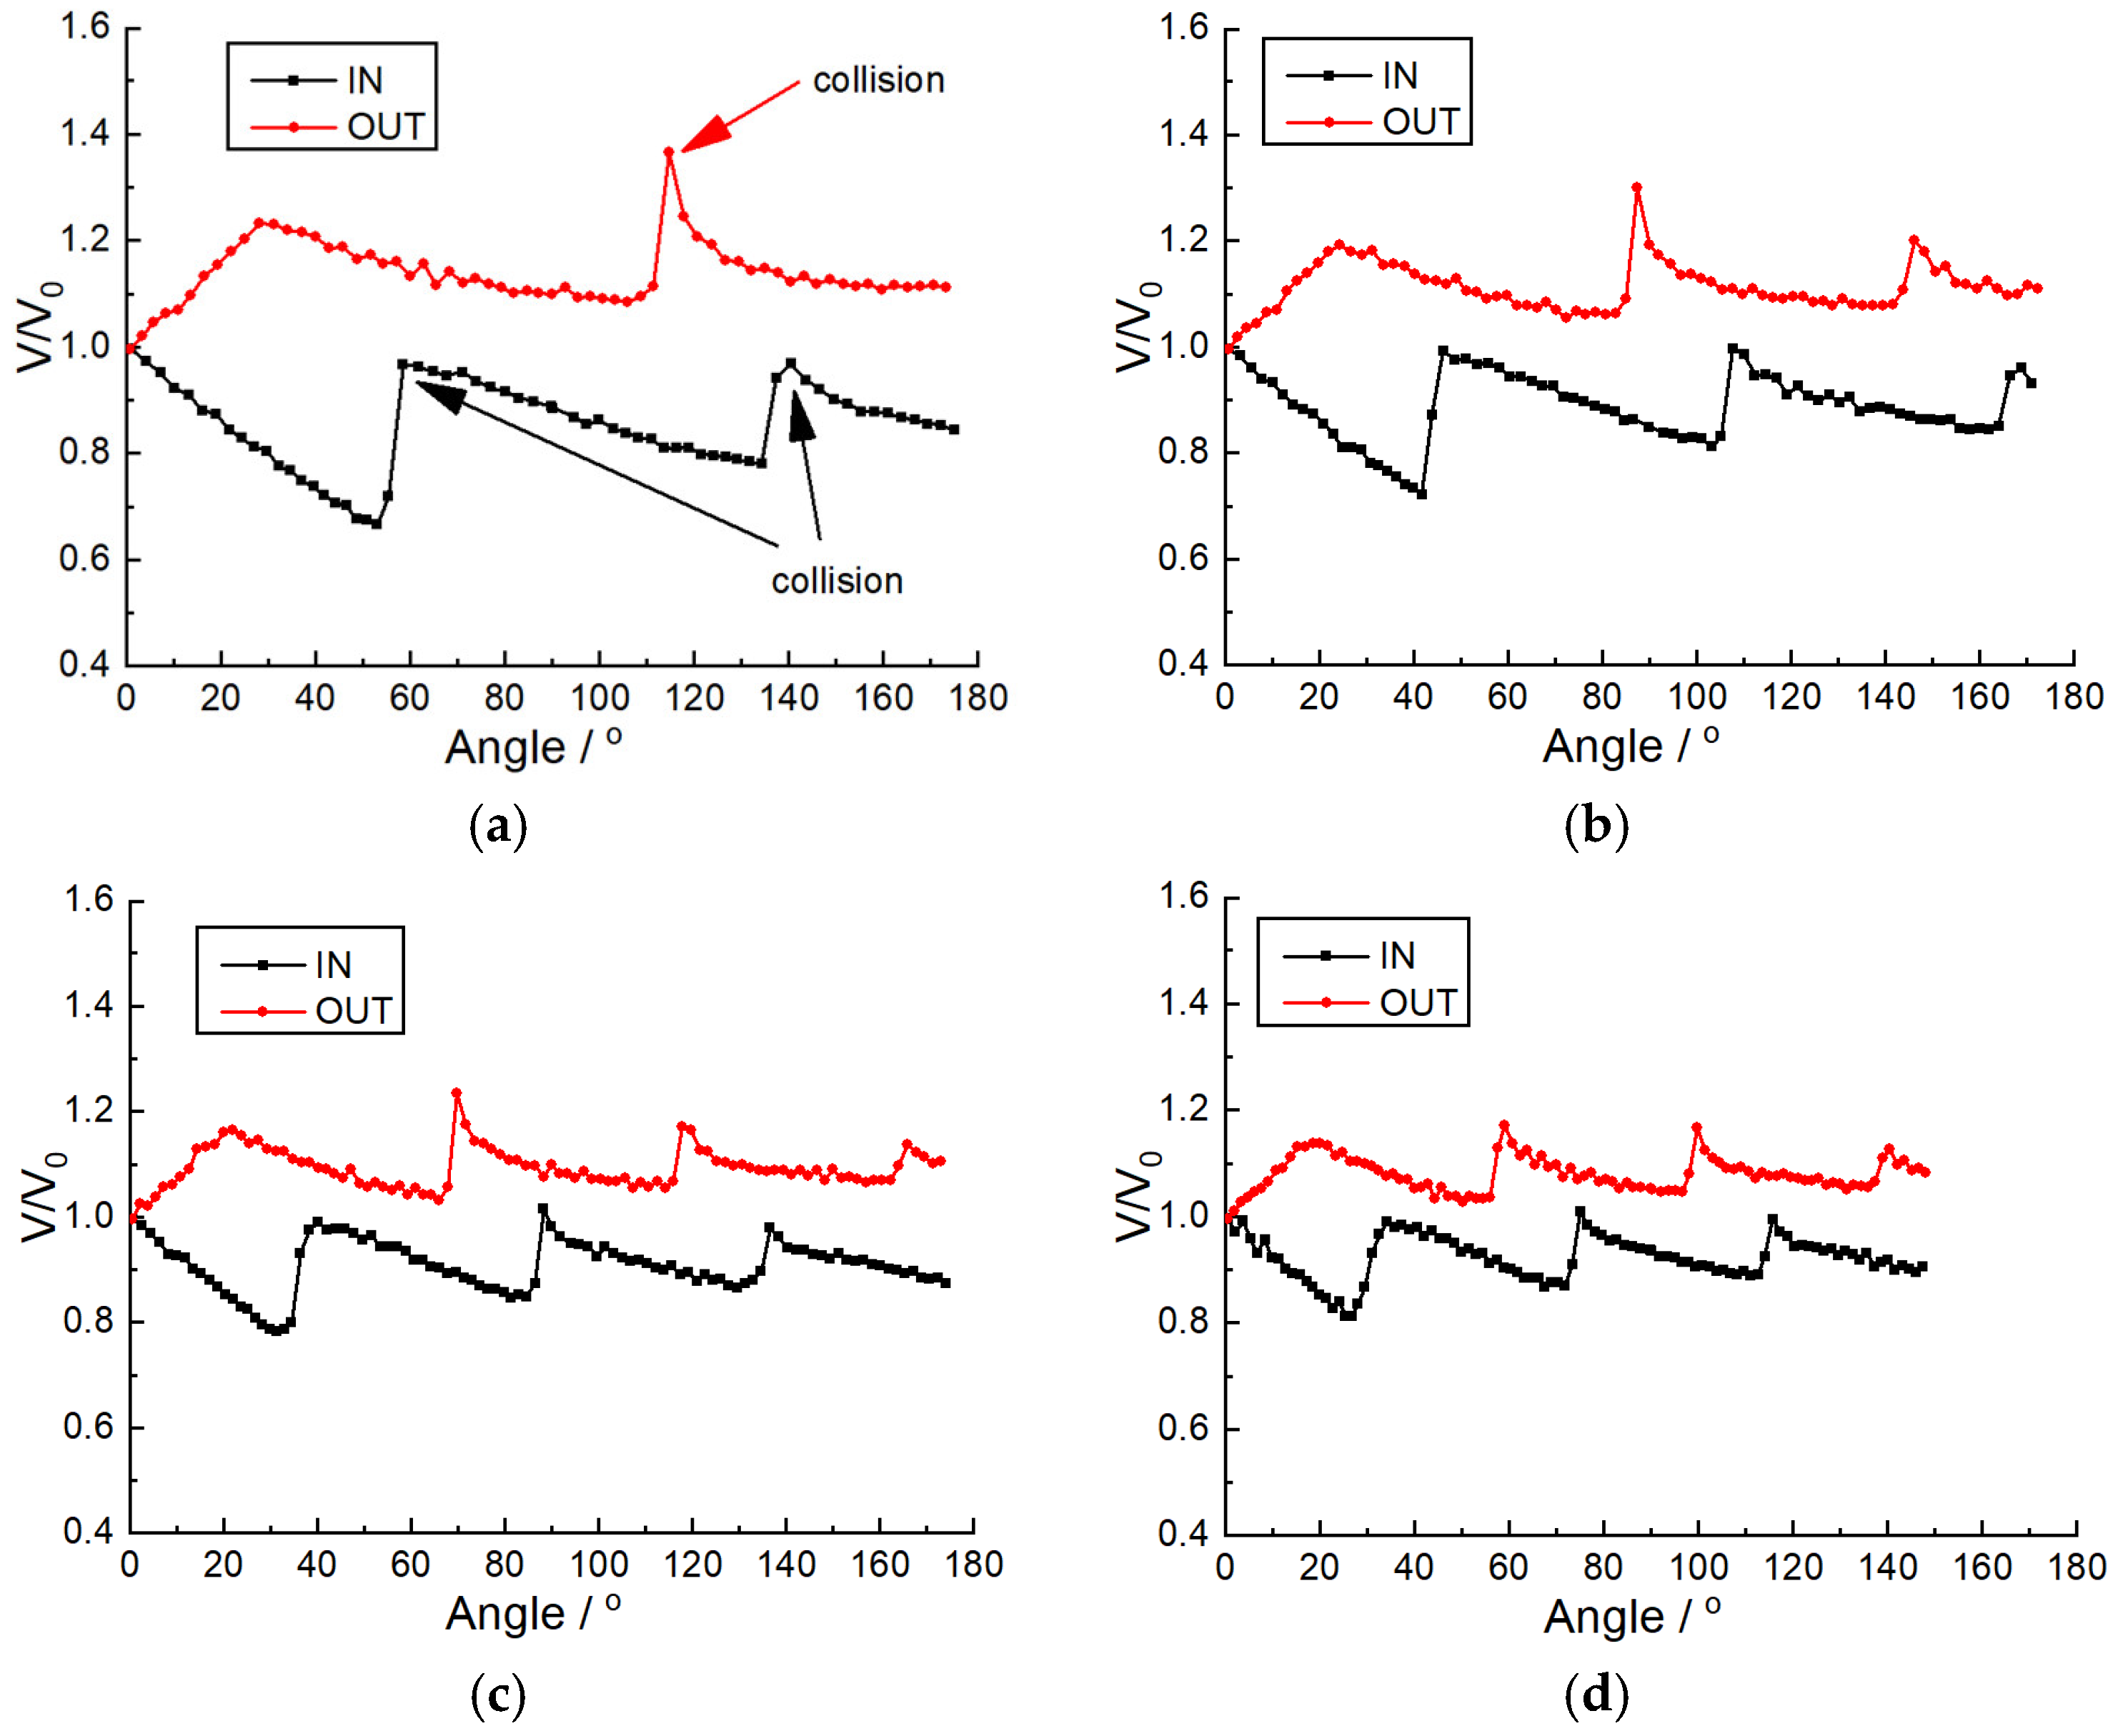
Figure 5 shows the propagation velocity of the wave front along both the inner and outer walls for all four cases as shown in Table 2. It can be observed that, as the shock wave entering the curved channel, the speed along the inner wall decreases, while the speed of along outer wall increases. As the shock wave propagates in the channel, the wave front’s propagation velocity starts to oscillate because of the reflection of the triple wave structures between the inner and outer walls. After reflection, the pressure will generally increase by two times, and the velocity is also increased accordingly. Due to the small cross-section of the curved channel, two reflections occurred on the inner wall surface and one reflection occurred on the outer wall surface, within the range of 180°. However, in a bend with a large radius of curvature, the amplitude of the speed oscillation is relatively small. This is because the shock wave fully develops itself in the bend with a large curvature, and the peaks of the inner and outer walls caused by the reflection of the triple-wave structure are also weak. At the same time, it can be seen that due to the greatly increased distance, the number of collision points on the inner and outer walls have also increased by one.
Figure 6 shows the Mach number change along the curved channel. With the increase in radius R2, the velocity loss along the inner wall decreases accordingly. It is expected that, if the radius is large enough, no velocity loss can be found through the curved channel.
Figure 7 compares the present numerical results with the experimental results of Takayama et al. [11]. Even though the parameters of geometry are not exactly the same, our numerical results are within the range of experimental results, which also validates their accuracy.

3.2. Detonation Propagation in Curvature Bends with a Constant Cross-Sectional Area

In the previous section, the propagation of the shock wave in the curvature bend was studied, especially the influence of the radius of curvature on both the diffraction and reflection. This section focuses on the propagation of detonation waves in curved bend with a constant cross-section area. The setup was shown in Table 3. As compared with shock waves, detonation waves present more complicated cellular structures due to the nonlinear coupling of chemical kinetics and fluid dynamics. When a detonation wave propagates in the bend, the multiple and local triple-wave structures on its front will interact with the global Mach configuration generated due to reflection on the inner and outer walls.
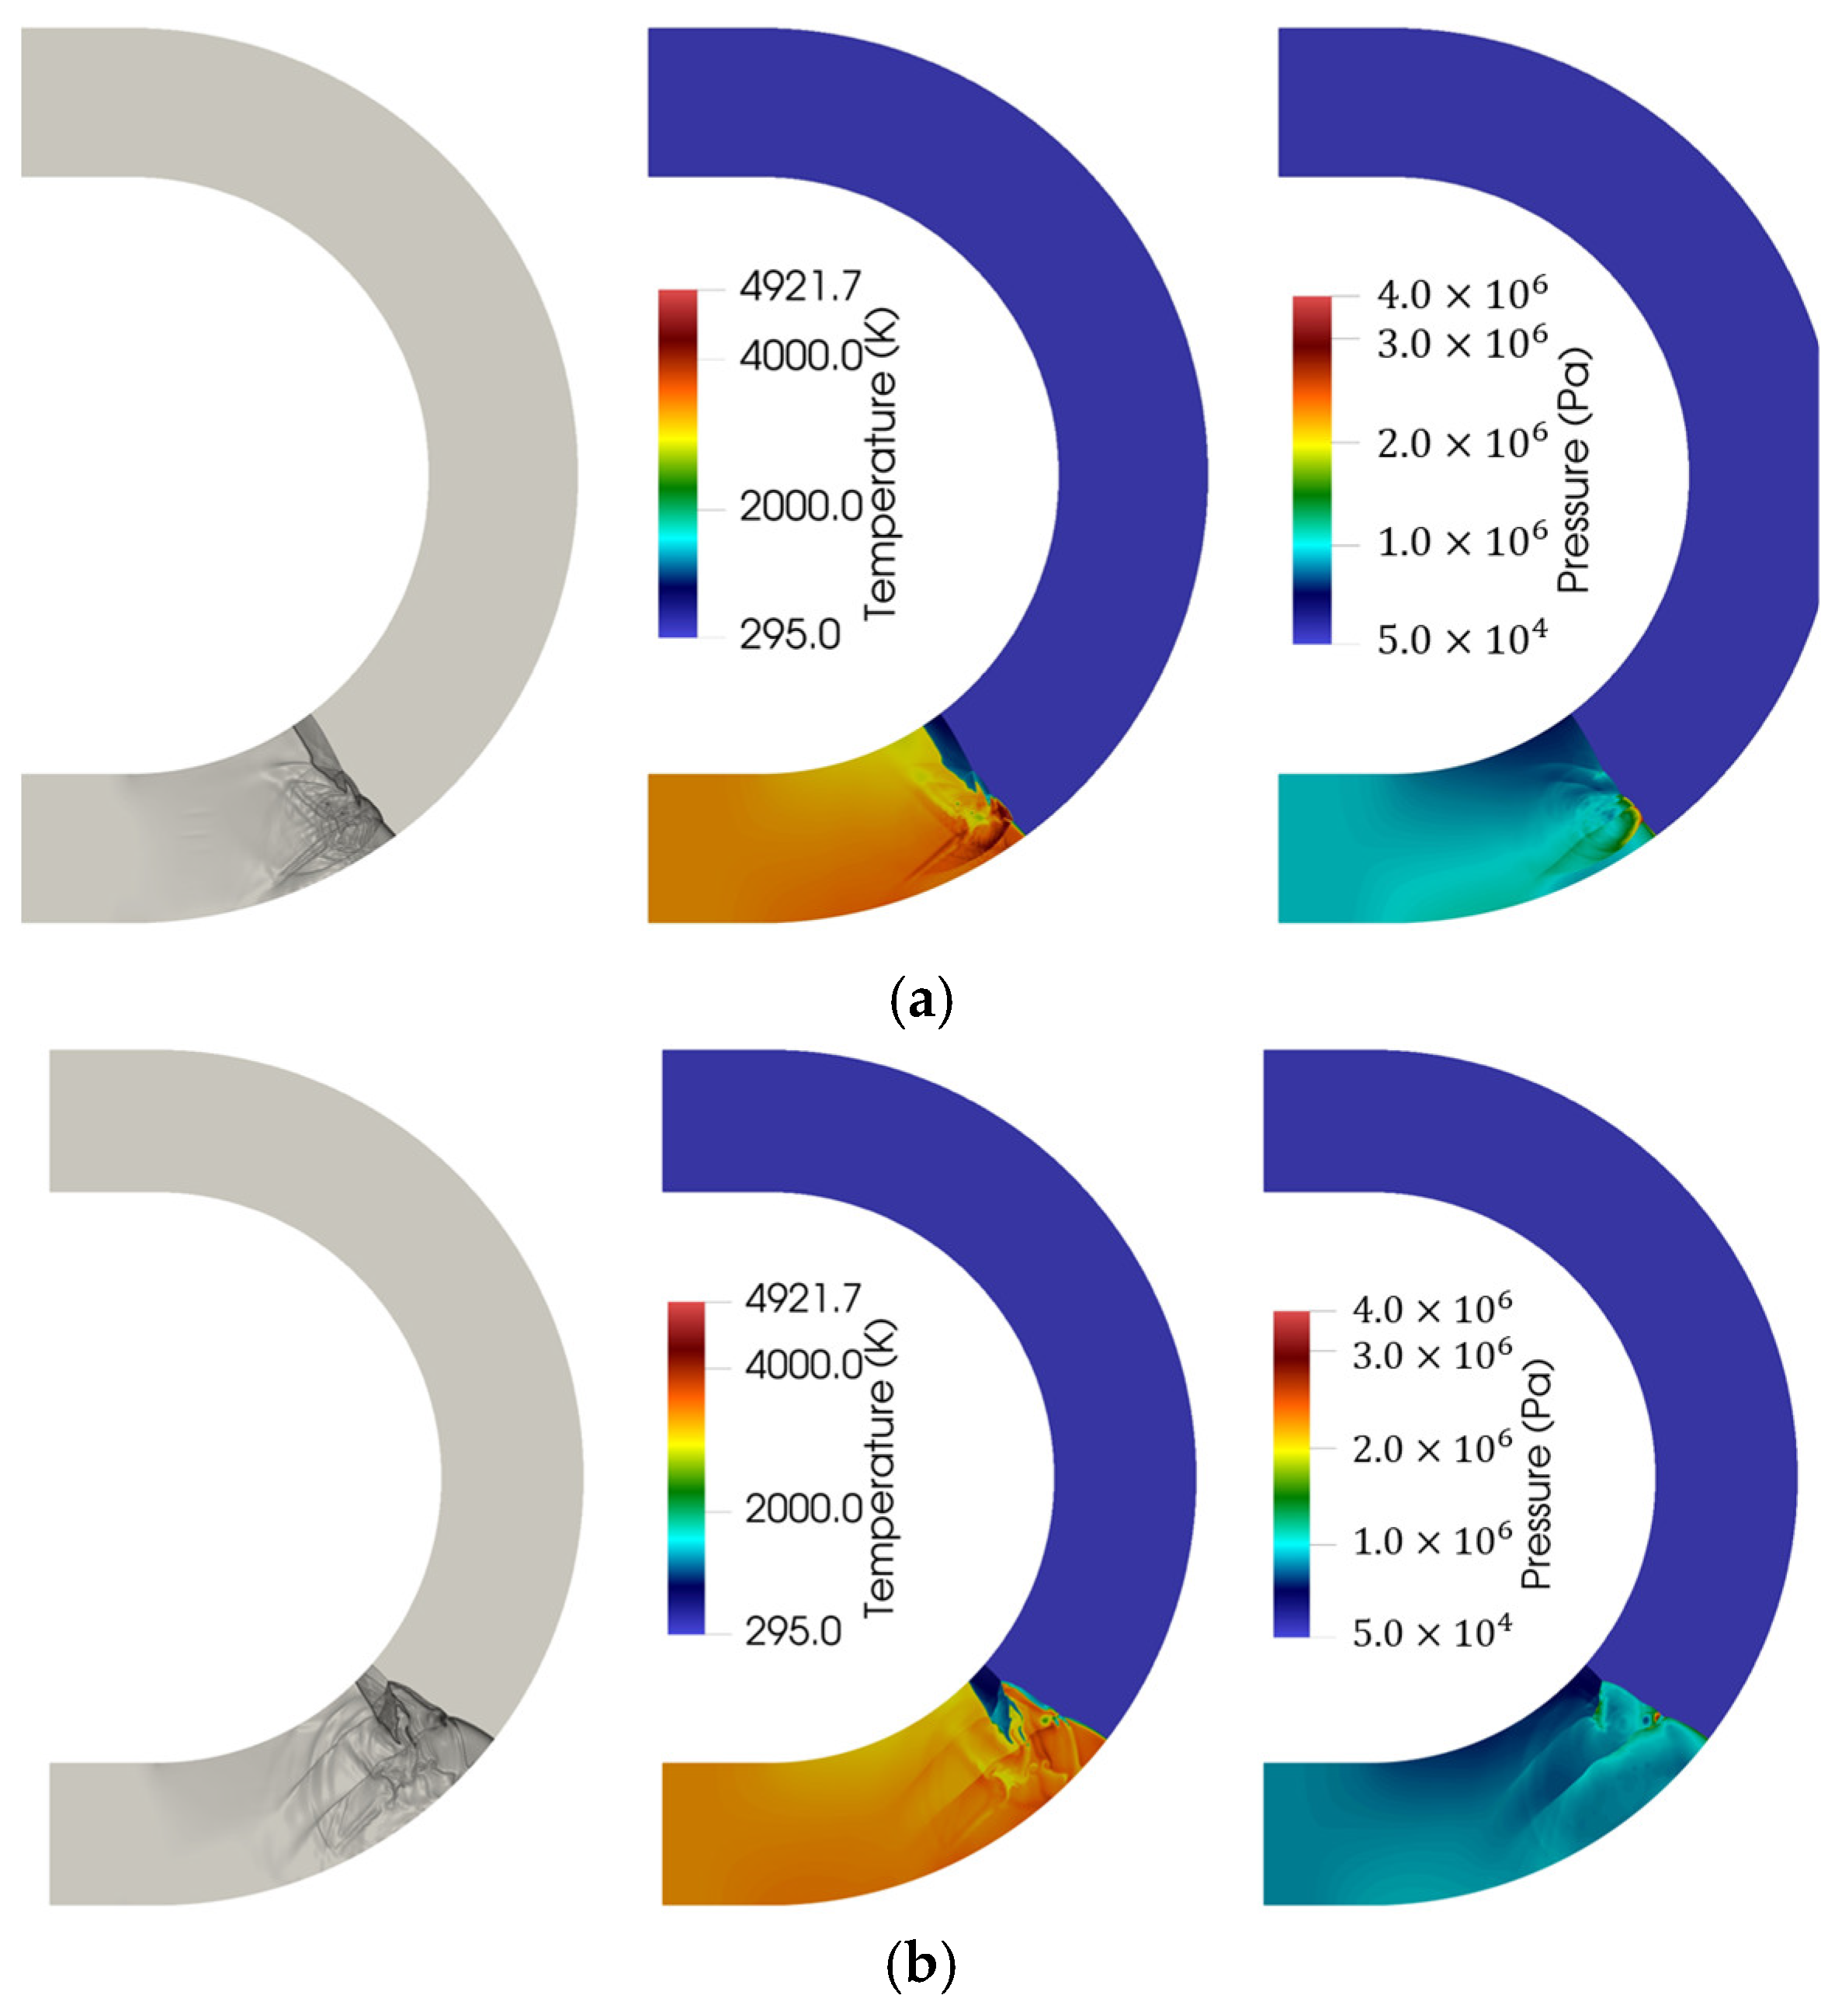
The detonation wave propagates at a CJ speed in a straight pipe, and then adapts itself to the bending boundary in the curvature channel. As shown in Figure 8a, the detonation wave near the outer wall is compressed and Mach reflection thus occurs. Because the angle of the outer wall is increasing, the reflection type also changes accordingly, from the simple Mach reflection at the very beginning to the double Mach reflection, and to triple Mach reflection, and finally to regular reflection as the wall angle exceeds a critical value. Due to the space expansion of the inner wall, the rarefaction wave generated will weaken the detonation wave, resulting in a locally decoupled zone. As shown in Figure 8b, the leading shock wave and the subsequent reaction surface can be seen and their separation keeps increasing, causing the continuous decrease in velocity, pressure and temperature. Therefore, the temperature is not sufficient to re-initiate the failed detonation, and the reaction rate continues to decrease accordingly in a manner of positive feedback.
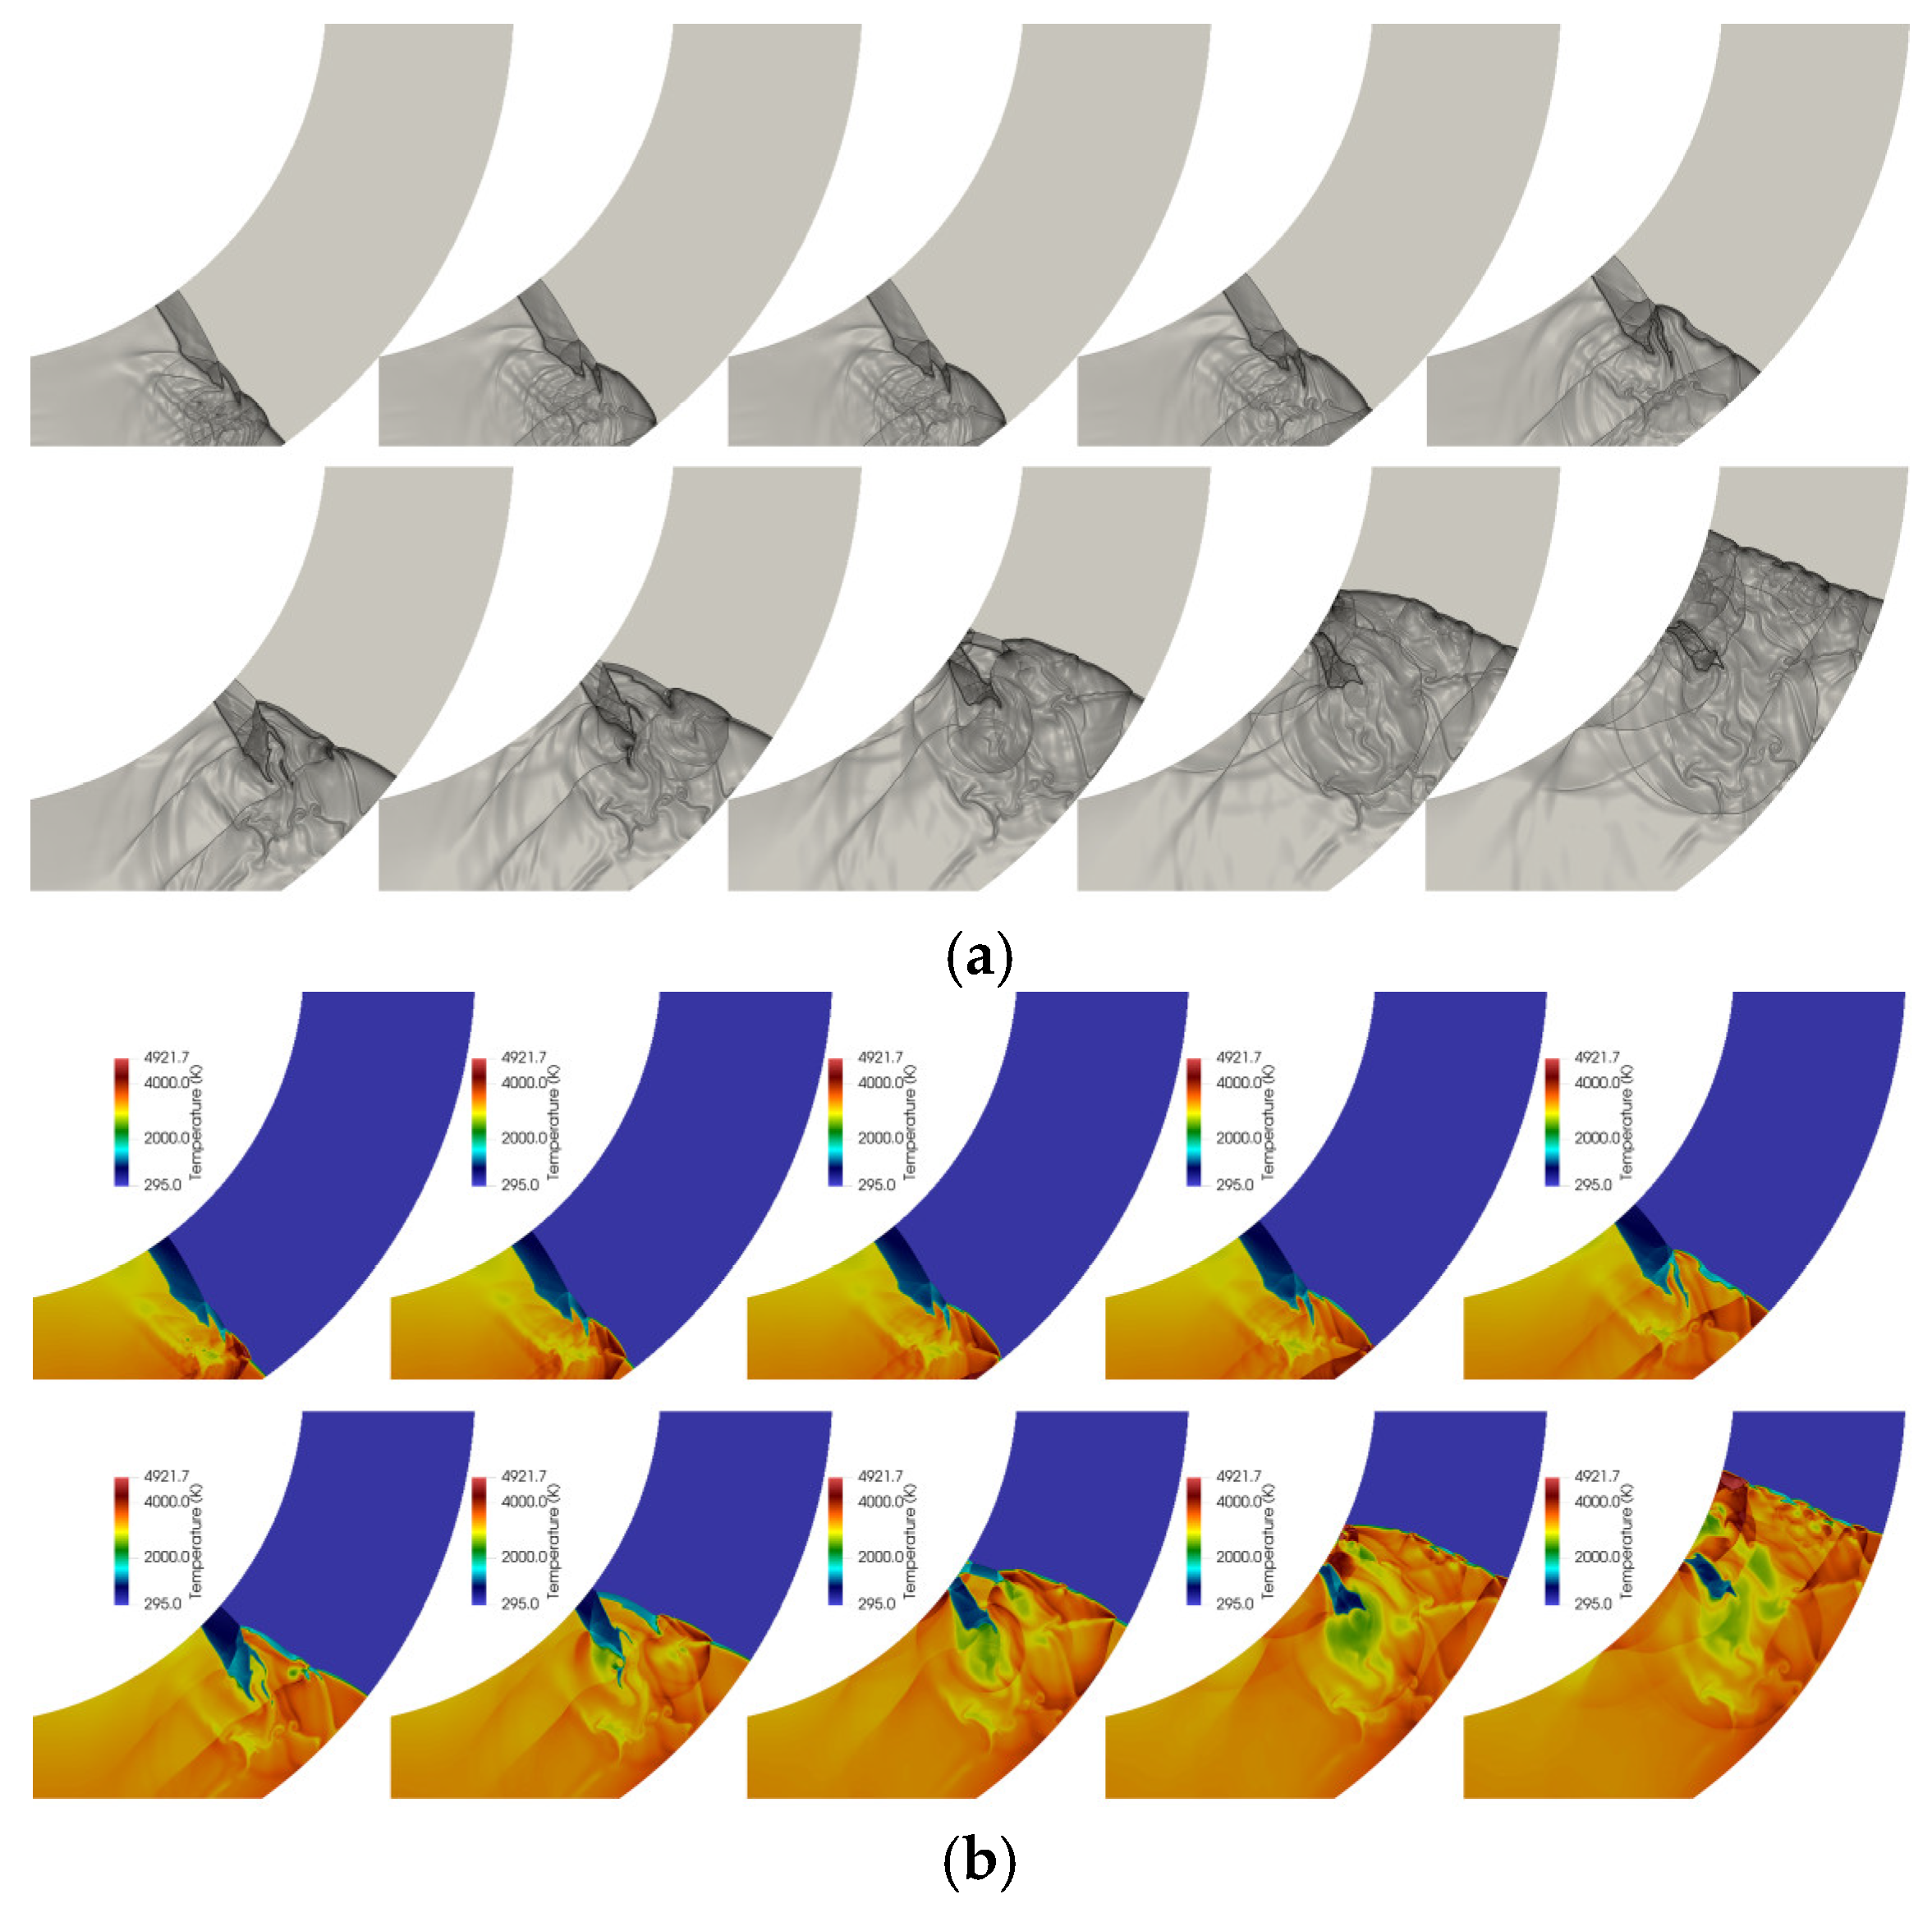
When the head of the rarefaction wave meets the triple-point of the Mach reflection, the rarefaction and compression waves begin to interact with each other, which further produce a more complicated wave structure. Figure 9 shows the evolution of the wave structure under the effect of both the compression and rarefaction waves. The triple-point of the Mach reflection from the outer wall travels towards the inner wall with the expansion and decay of the Mach stem. This can be confirmed by the presence of locally decoupled zone on the Mach stem. However, a second triple-point structure are form on the decoupled Mach stem because of the amplification of the intrinsic instability of detonation. The first weak and second strong triple-point structure hit the inner wall one after the other, resulting in a new complicated reflection, which eventually re-initiate the decoupled detonation.
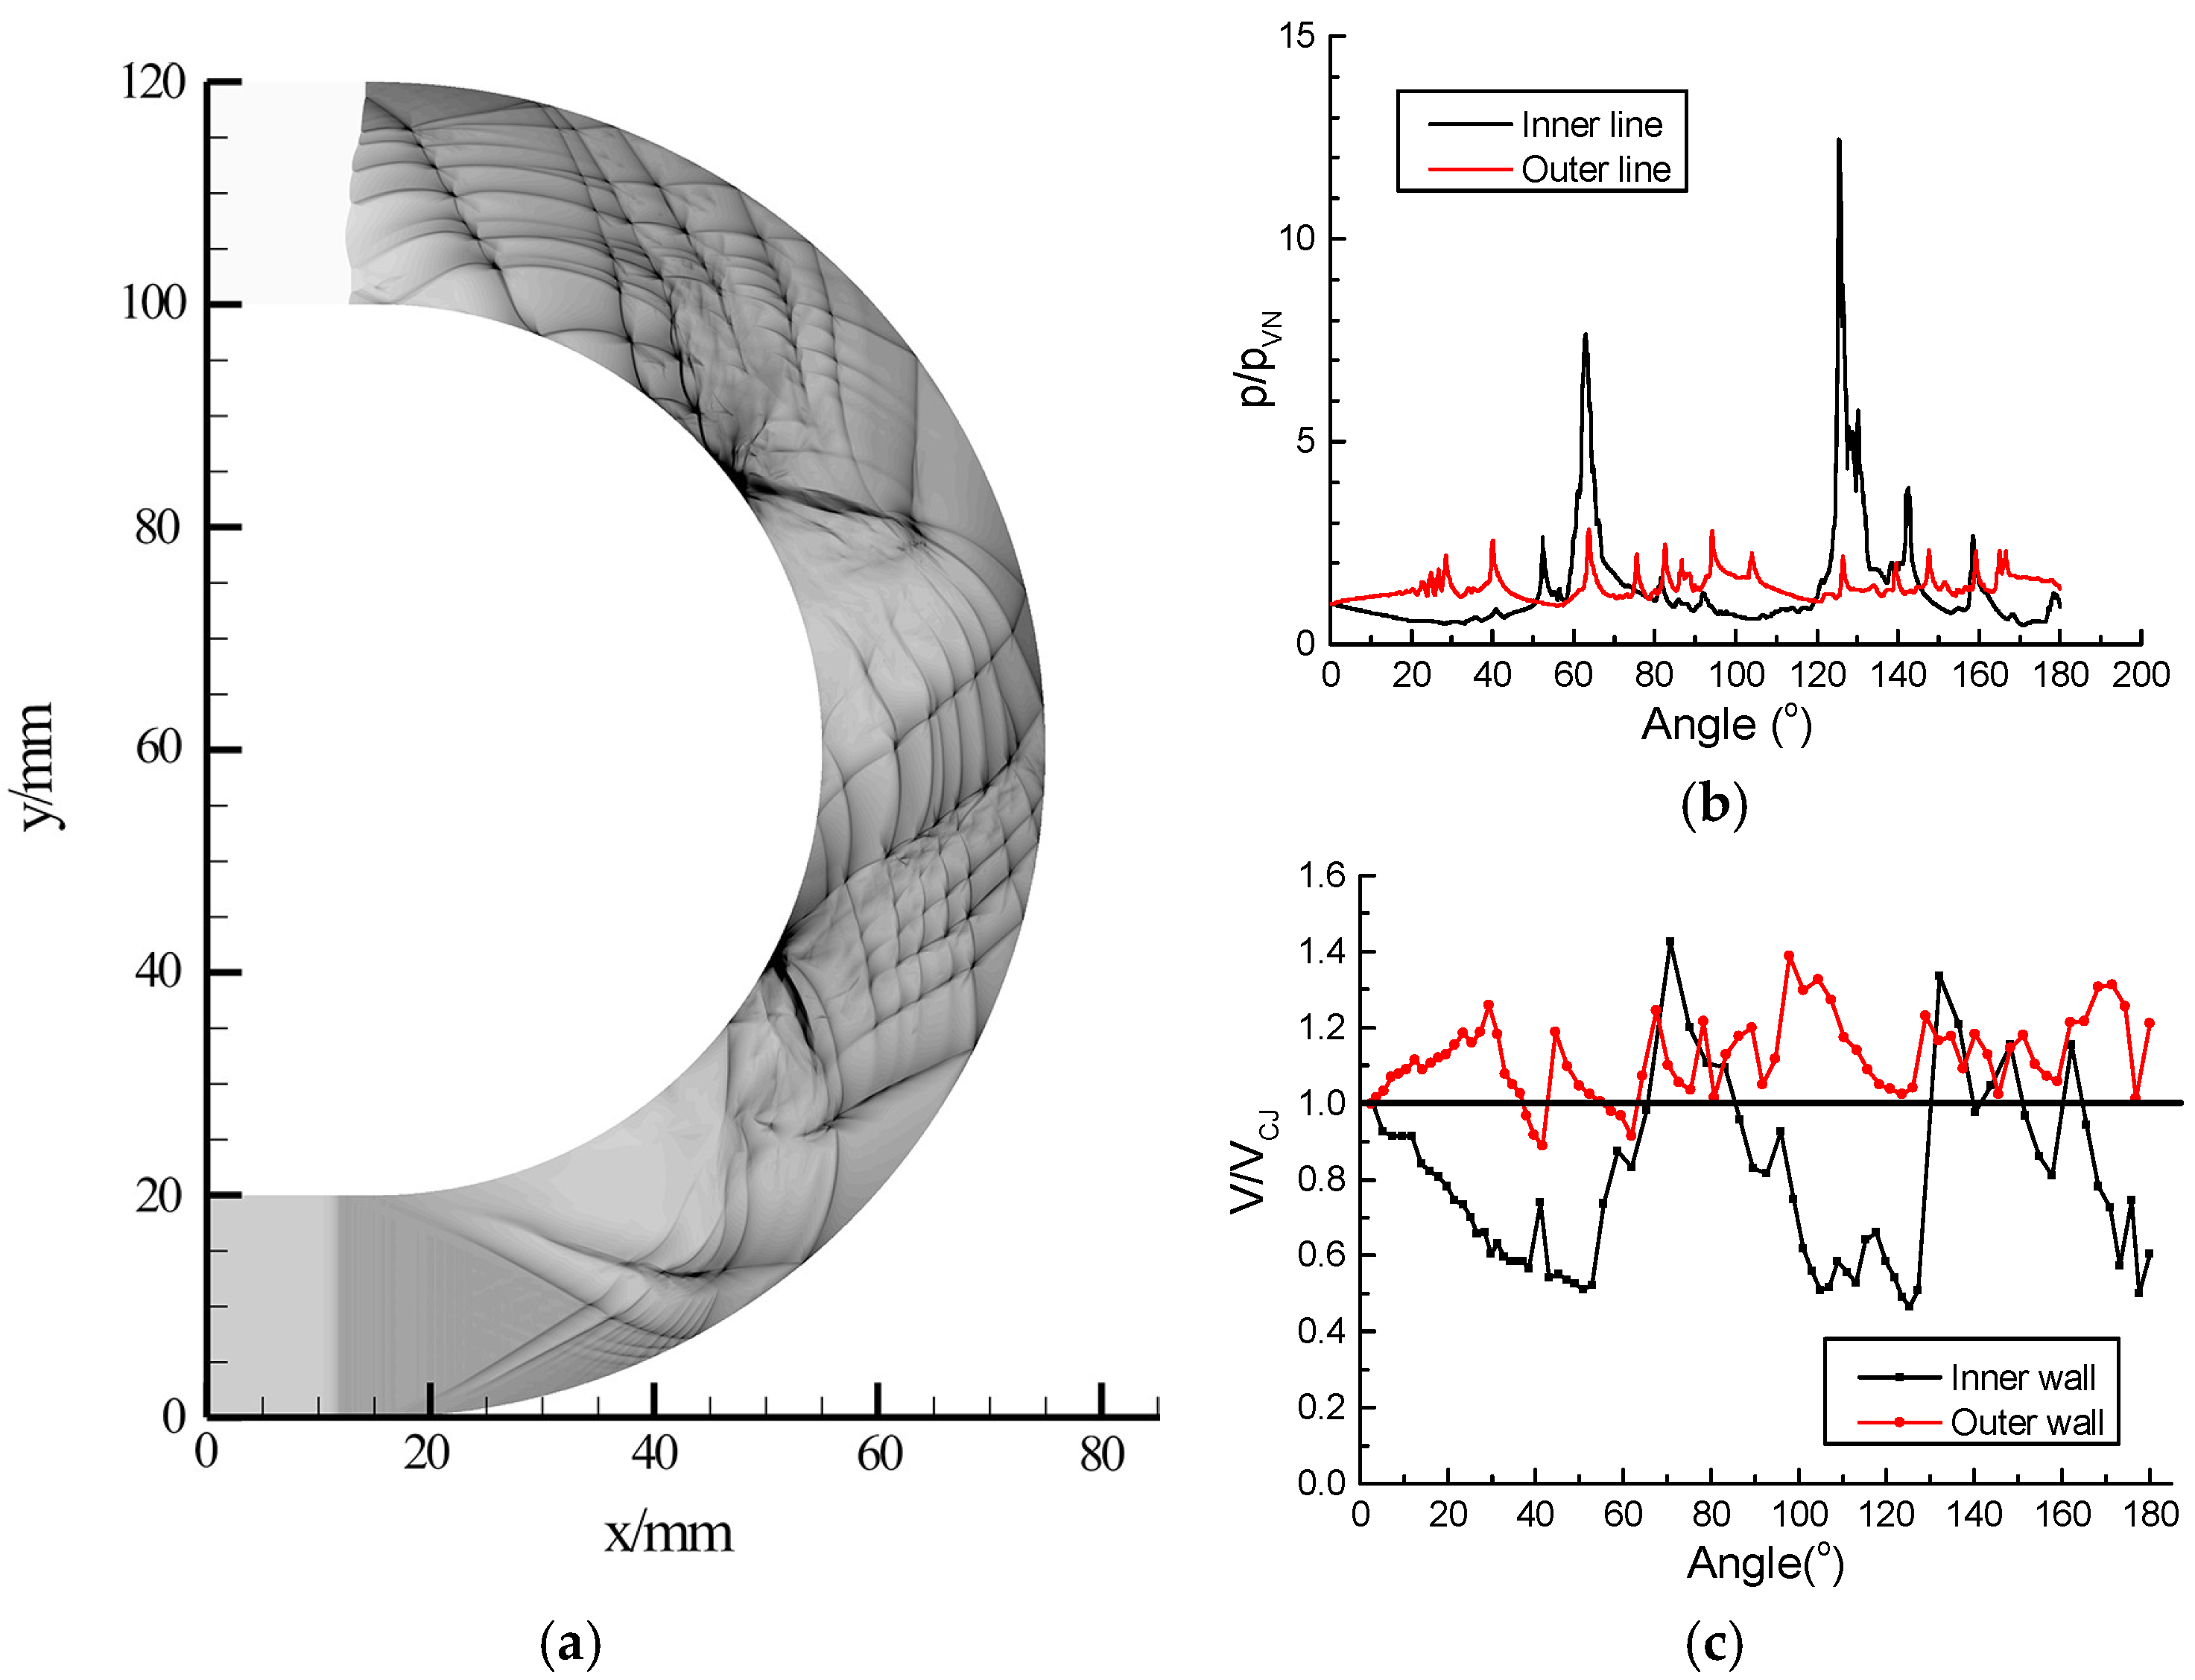
The numerical smoked foils in Figure 10a, calculated from the maximum pressure history, also show the evolution of the detonation wave described above. The interaction between the wave head of the rarefaction wave and the three-wave structure of the Mach reflection, as well as the generation of the new three-wave point can be clearly observed. The above-mentioned second strong triple-point structure (dark black represents high pressure) that interacts with the inner wall can also be seen following the first weak triple-point trajectory. The inner wall is under the action of the rarefaction wave, the detonation wave is under-driven, and the cell size increases, and the outer wall is under the action of the compression wave, and the detonation wave is overdriven and the cell size decreases. Meanwhile, detonation failure and subsequent re-initiation processes occur near the inner wall. This failure-reinitiation process is found to happen twice in the numerical smoked foil. It is foreseeable that if the detonation wave continues to propagate in the channel, this failure-reinitiation process will continue to repeatedly occur, which can be regarded as a specific steady propagation mode.
Figure 10b,c show the maximum pressure history and propagation velocities along both the inner and outer walls. It can be observed that there are two local high-pressure peaks on the inner wall, representing the re-initiation process formed by two impacts of triple-point structures in the decoupled zone, while the low-pressure area on both sides of the peaks represents two decoupled zones. The relatively regular pressure oscillation due to the interactions of natural traverse waves on the outer wall suggests that a coupled detonation front is maintained. This can also be confirmed by the wave front velocity near the outer wall that an overdrive mode with an averaged velocity of about 1.2 VCJ is obtained. On the inner wall, by examining the velocity distribution, the process of failure (as low as 0.6 VCJ) and re-initiation (up to 1.4 VCJ) can be seen with a regular pattern.
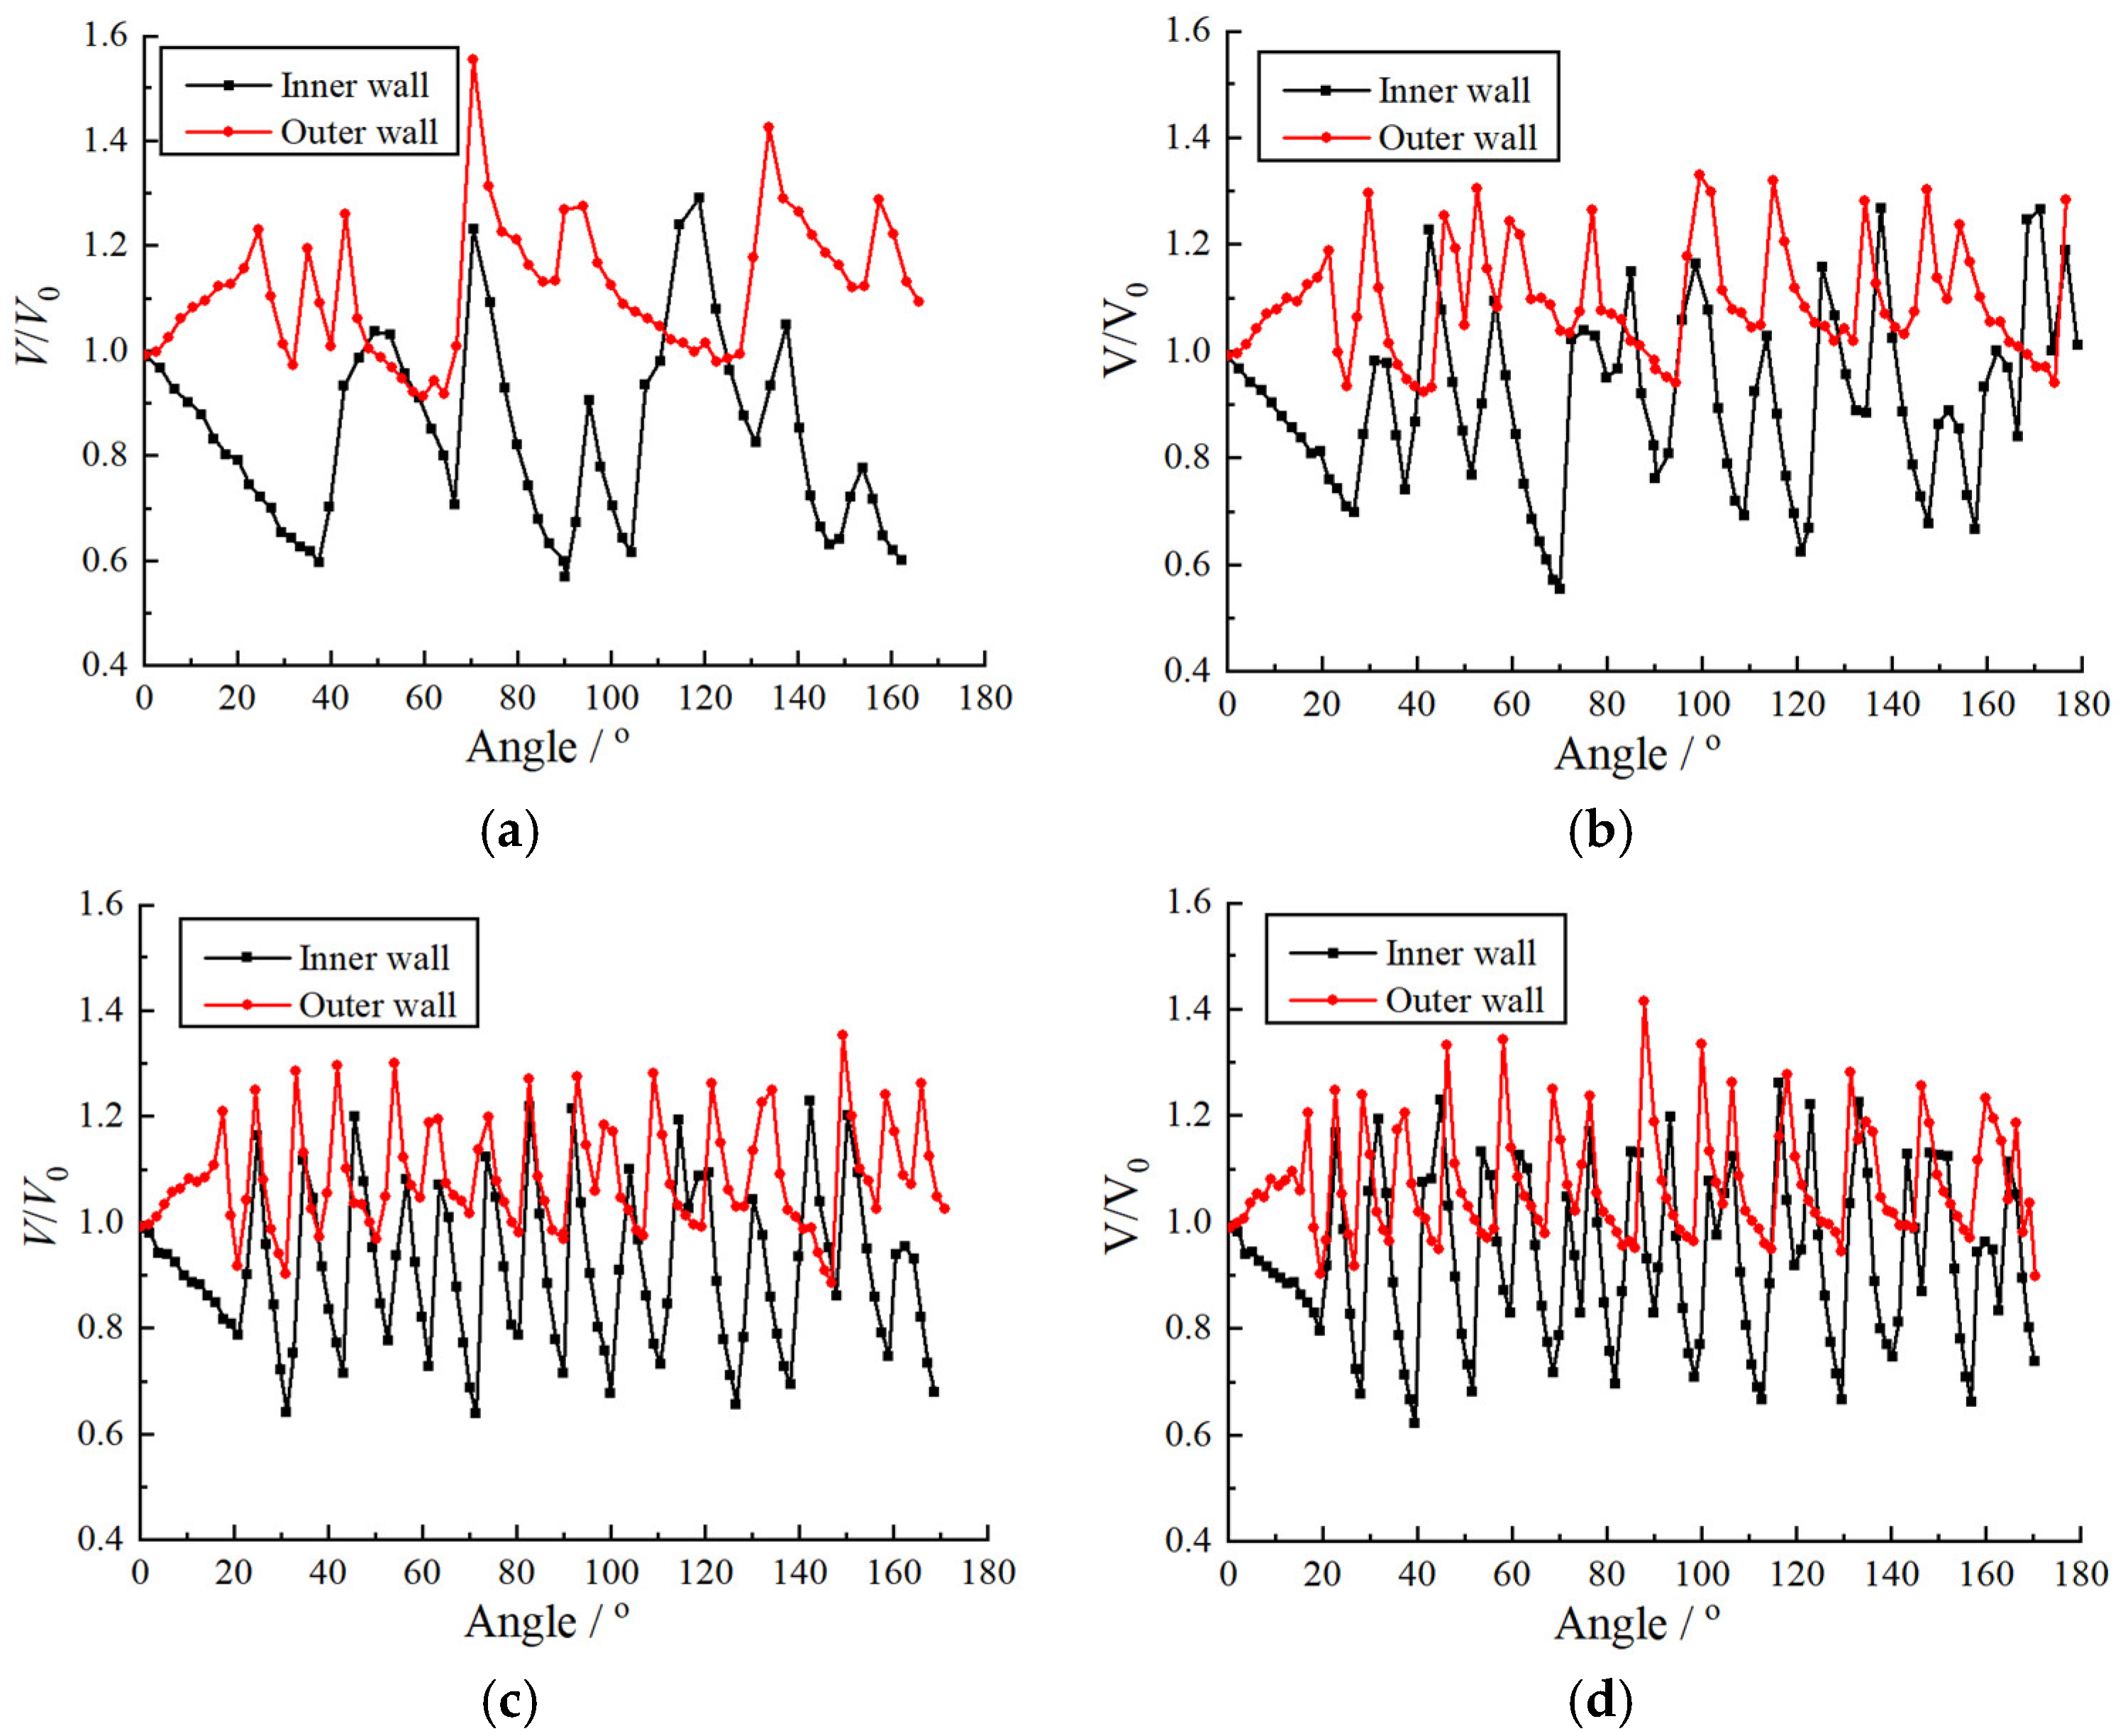
Figure 11 shows the propagation velocity of detonation waves on the inner and outer walls for cases with different radii of curvature. It can be seen that as the radius of curvature increases, the propagation velocity of the inner and outer walls becomes closer to the CJ velocity. This suggests that a smaller radius of curvature has a greater negative impact on the detonation wave, and the detonation wave is more likely to decouple and even fail on the inner wall. This is why, in a case with a large radius of curvature shown in Figure 11a, the initial inner wall surface velocity drops to 0.6 VCJ that is a typical speed at which the detonation waves fail completely. However, this value increases to 0.8 VCJ for a case with a large radius of curvature, as shown in Figure 11d. In addition, the propagation velocity of the detonation wave presents an intensive oscillation caused by the collision of the cellular (triple-point) structures. It suggests no obvious failure and re-initiation process occur near the inner all compared with the case with a small radius of curvature shown in Figure 11a. In Figure 11, it can also be observed that, even in the bend with large radius of curvature, the average velocity on the inner wall is stabilizes at a value of 0.9 VCJ slightly lower than VCJ. The velocity of the outer wall is slightly higher than the value of VCJ, which is approximately 1.1 VCJ. These suggest that even in a channel with a large radius of curvature, the rarefaction effect on the inner and compression effect on the outer walls always exist. In a channel with a small radius of curvature, the detonation wave presents a failure-reinitiation mode. This is because, with the large curvature, the rarefaction effect on the inner wall is too strong, so that the detonation wave cannot be maintained and decouples and fails. The compression of the outer wall will form a transverse detonation wave to re-initiation the decoupled wave front near the inner wall. In a channel with a large radius of curvature, the curvature effect of the inner wall surface is not strong enough to cause the wave to fail, but instead weakens it. Therefore, the detonation wave presents a steady propagation mode that is weakly underdriven on the inner wall and slightly overdriven on the outer wall.
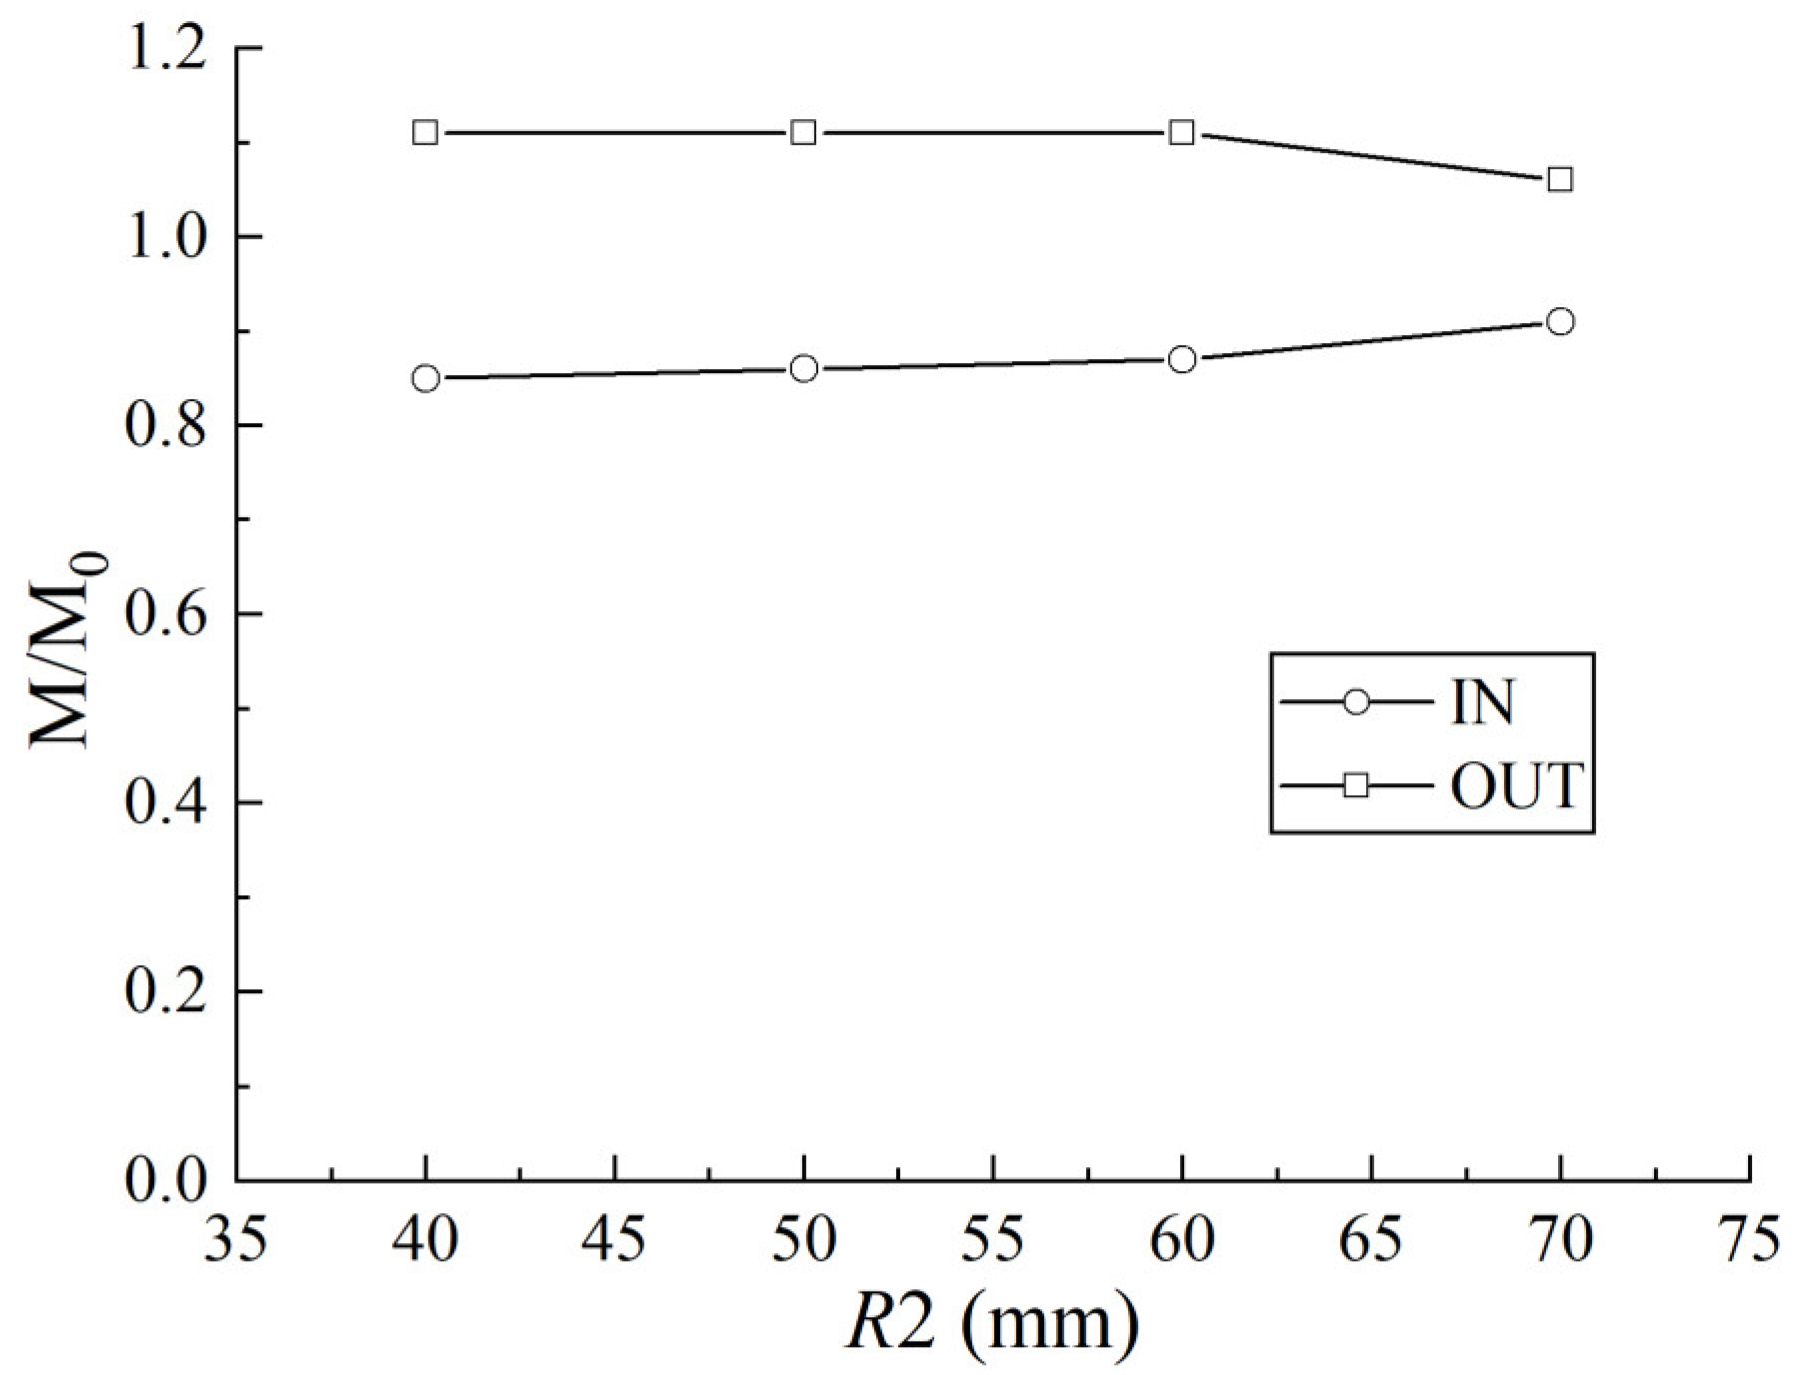
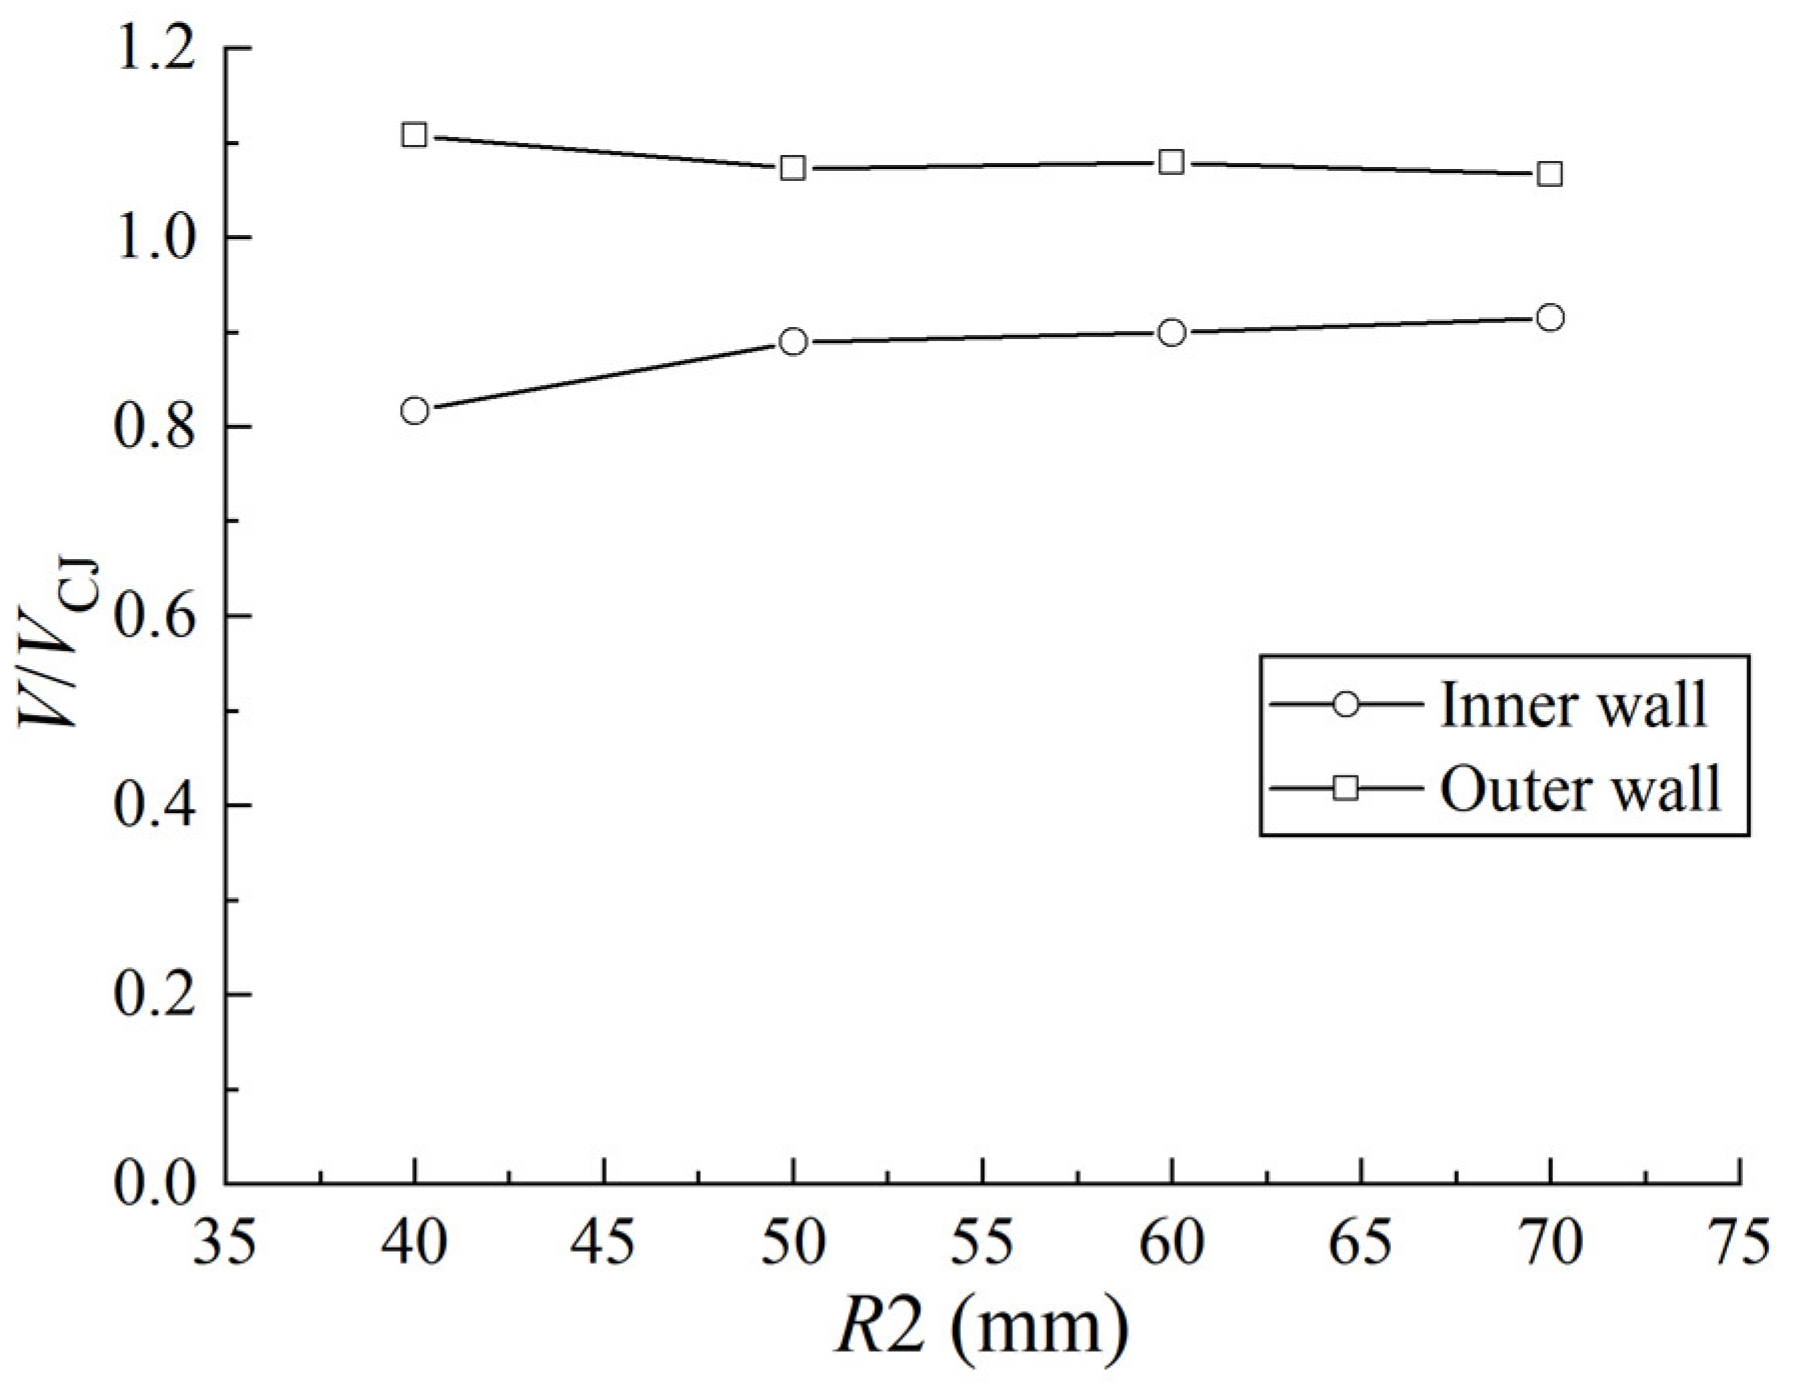
Figure 12 shows the average detonation velocity near the boundaries for cases with different curvature. With the increase in radius R2, the velocity loss along the inner wall diminishes, and both the velocities along the inner and outer wall approach V/VCJ = 1.
The transition mode in the present study is intrinsically the same as the work by Kudo et al. and Nakayama et al. [17,18]. The propagation mode that consistently satisfies the relation V/VCJ > 0.8 is defined as the stable mode, the mode that cannot meet the relation V/VCJ > 0.8 but can consistently satisfy the relation V/VCJ > 0.6 is defined as the critical mode and the mode in which V/VCJ < 0.6 even just once is defined as the unstable mode in the present study. The experimental results from Kudo et al. or Nakayama et al. indicate that the propagation mode of a curved detonation wave in a curved channel transitions to the critical mode from the unstable mode approximately at R/λ = 13–14 for three different mixtures. Based on the same mode definition, the critical condition in the present study is R/λ = 10. Considering the simple two-step chemical reaction used in the present study, our criterion is sufficiently close to the experimental results.

3.3. Shock Propagation in Curvature Bends with a Varying Cross-Sectional Area

In the previous two sections, the propagation process of both the shock and detonation wave in curvature channels with constant cross-section areas are studied to investigate the effect of curvature effect on the propagation mechanism. In this section, the propagation processes of shock waves in a curvature bend with a varying cross-section area are studied. Consistent with the methodology in the previous two sections, the shock wave is studied before the detonation wave. The study focuses on the propagation mechanism and scale effect of detonation waves under the combined effects of curvature and area expansion. The geometry parameters of the bend are shown in Table 4. The entrance width w1 is set as 10 mm. Cases 3.1–3.3 present a group with a fixed radius of curvature of the inner wall, but varying radius of curvature of the outer wall. On the contrary, in cases 3.3–3.5, we fix the radius of the curvature of the outer wall and change the radius of the curvature of the inner wall.
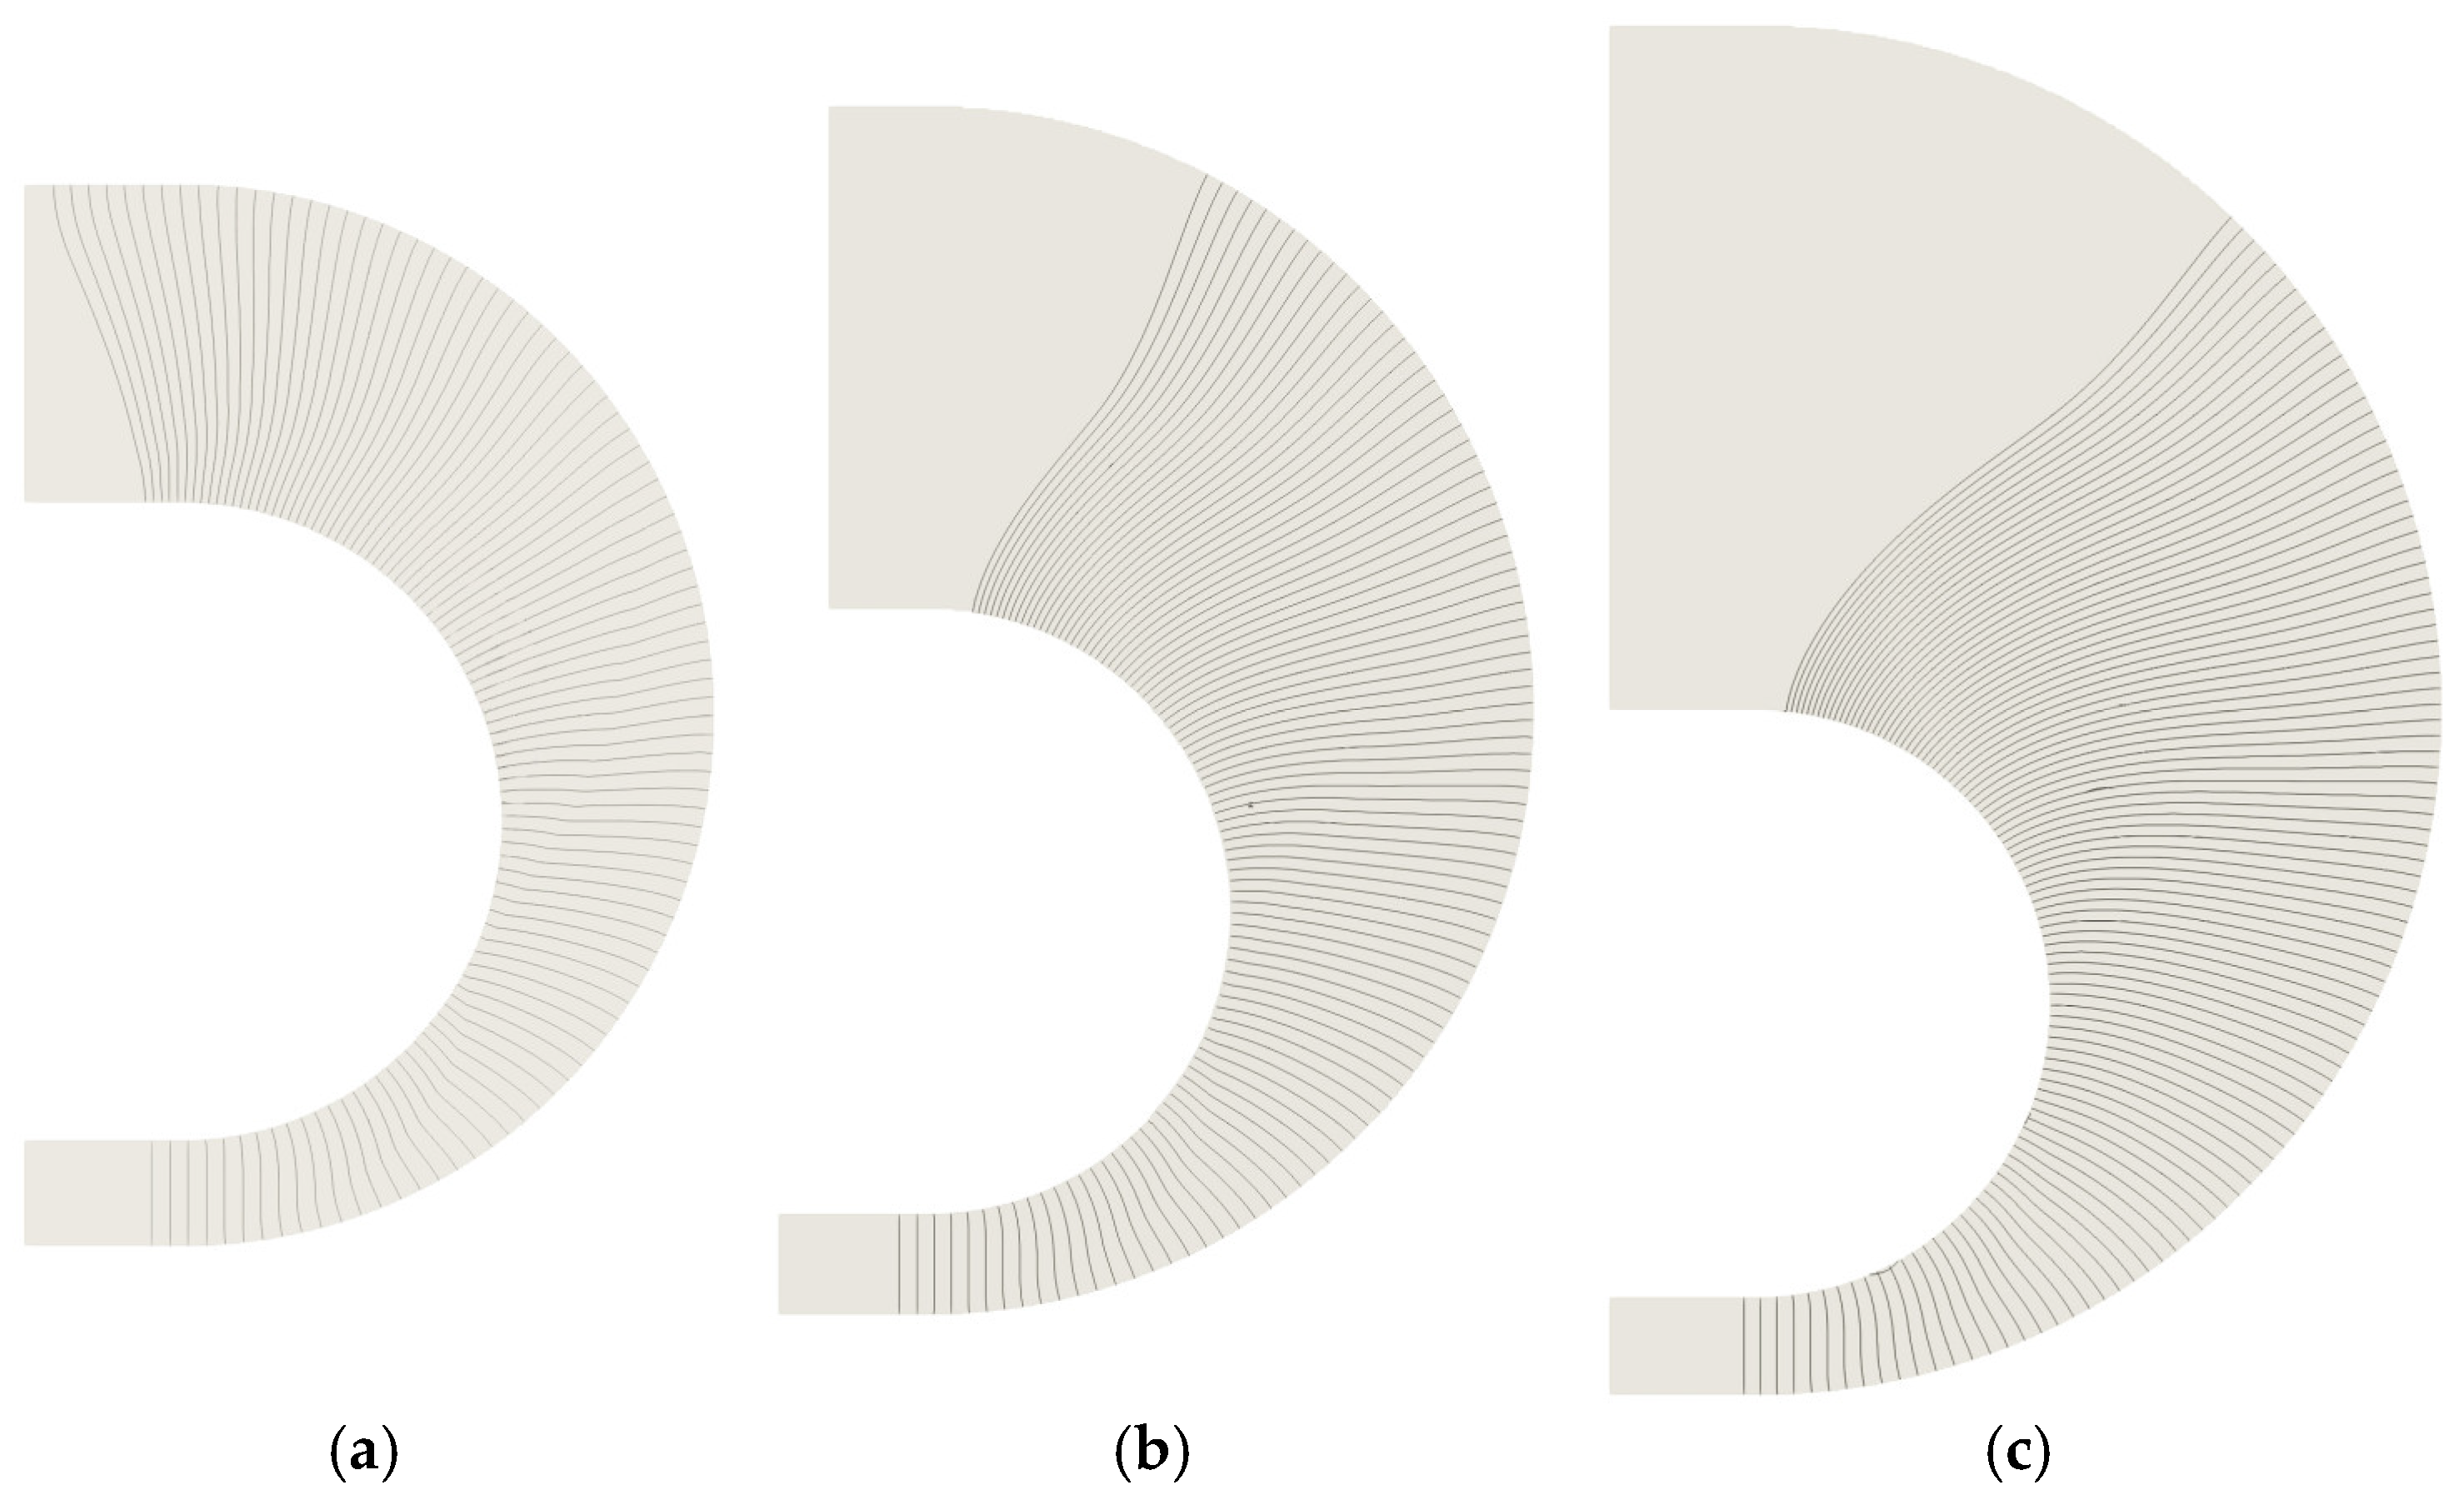
In Figure 13, corresponding to cases 3.1–3.3, shock wave fronts at three successive moments are shown. The corresponding propagation velocities of shock waves along the inner and outer walls are shown in Figure 14. The shock wave near the inner wall surface is affected by the rarefaction effect of the inner wall surface, and the velocity is continuously reduced. While the shock wave near the outer wall surface is affected by the compression effect, and therefore the propagation velocity finally stabilizes at a certain value slightly higher than the initial velocity. In addition, it can also be found that as the radius of curvature of the outer wall increases (or as the rate of cross-sectional area change increases), the propagation velocity of the inner and outer walls decreases faster. In particular, the propagation velocity along the outer wall in case 3.3 is attenuated to the initial velocity due to the increase in the effect of the cross-sectional area. Meanwhile, it can also be observed that there is a local peak in the velocity curve, which is, as discussed in the two above sections, caused by the collision of the Mach reflection with the inner walls. Moreover, the velocity peaks decrease as the radius of curvature of the outer wall increases. Similar phenomena can also be found in Figure 15 and Figure 16 where the radius of curvature of the outer wall is fixed and the radius of curvature of the inner wall is changed.
Figure 17 shows the shock decay along the inner wall with both the curvature and expansion effect. The radius effect tends to weaken the shock decay. However, the expansion effect has the opposite effect and trends to strengthen the shock decay. By defining a new parameter κ = π d w R 2 d θ considering both the curvature and expansion effect, we can find that the parameter exactly influences the shock decay. It is also observed that when the angle is small, the shock decay loci are the same for all the cases until the reflection from the outer wall comes into play.

3.4. Detonation Propagation in Curvature Bends with Varying Cross-Sectional Area

In this section, the propagation of a detonation wave in the curvature bend with varying cross-section area is studied. The geometry parameters are shown in Table 5. The entrance width w1 is fixed as 10 mm. A total of nine cases are divided into three groups and each group is defined with a fixed R1 but different R2.
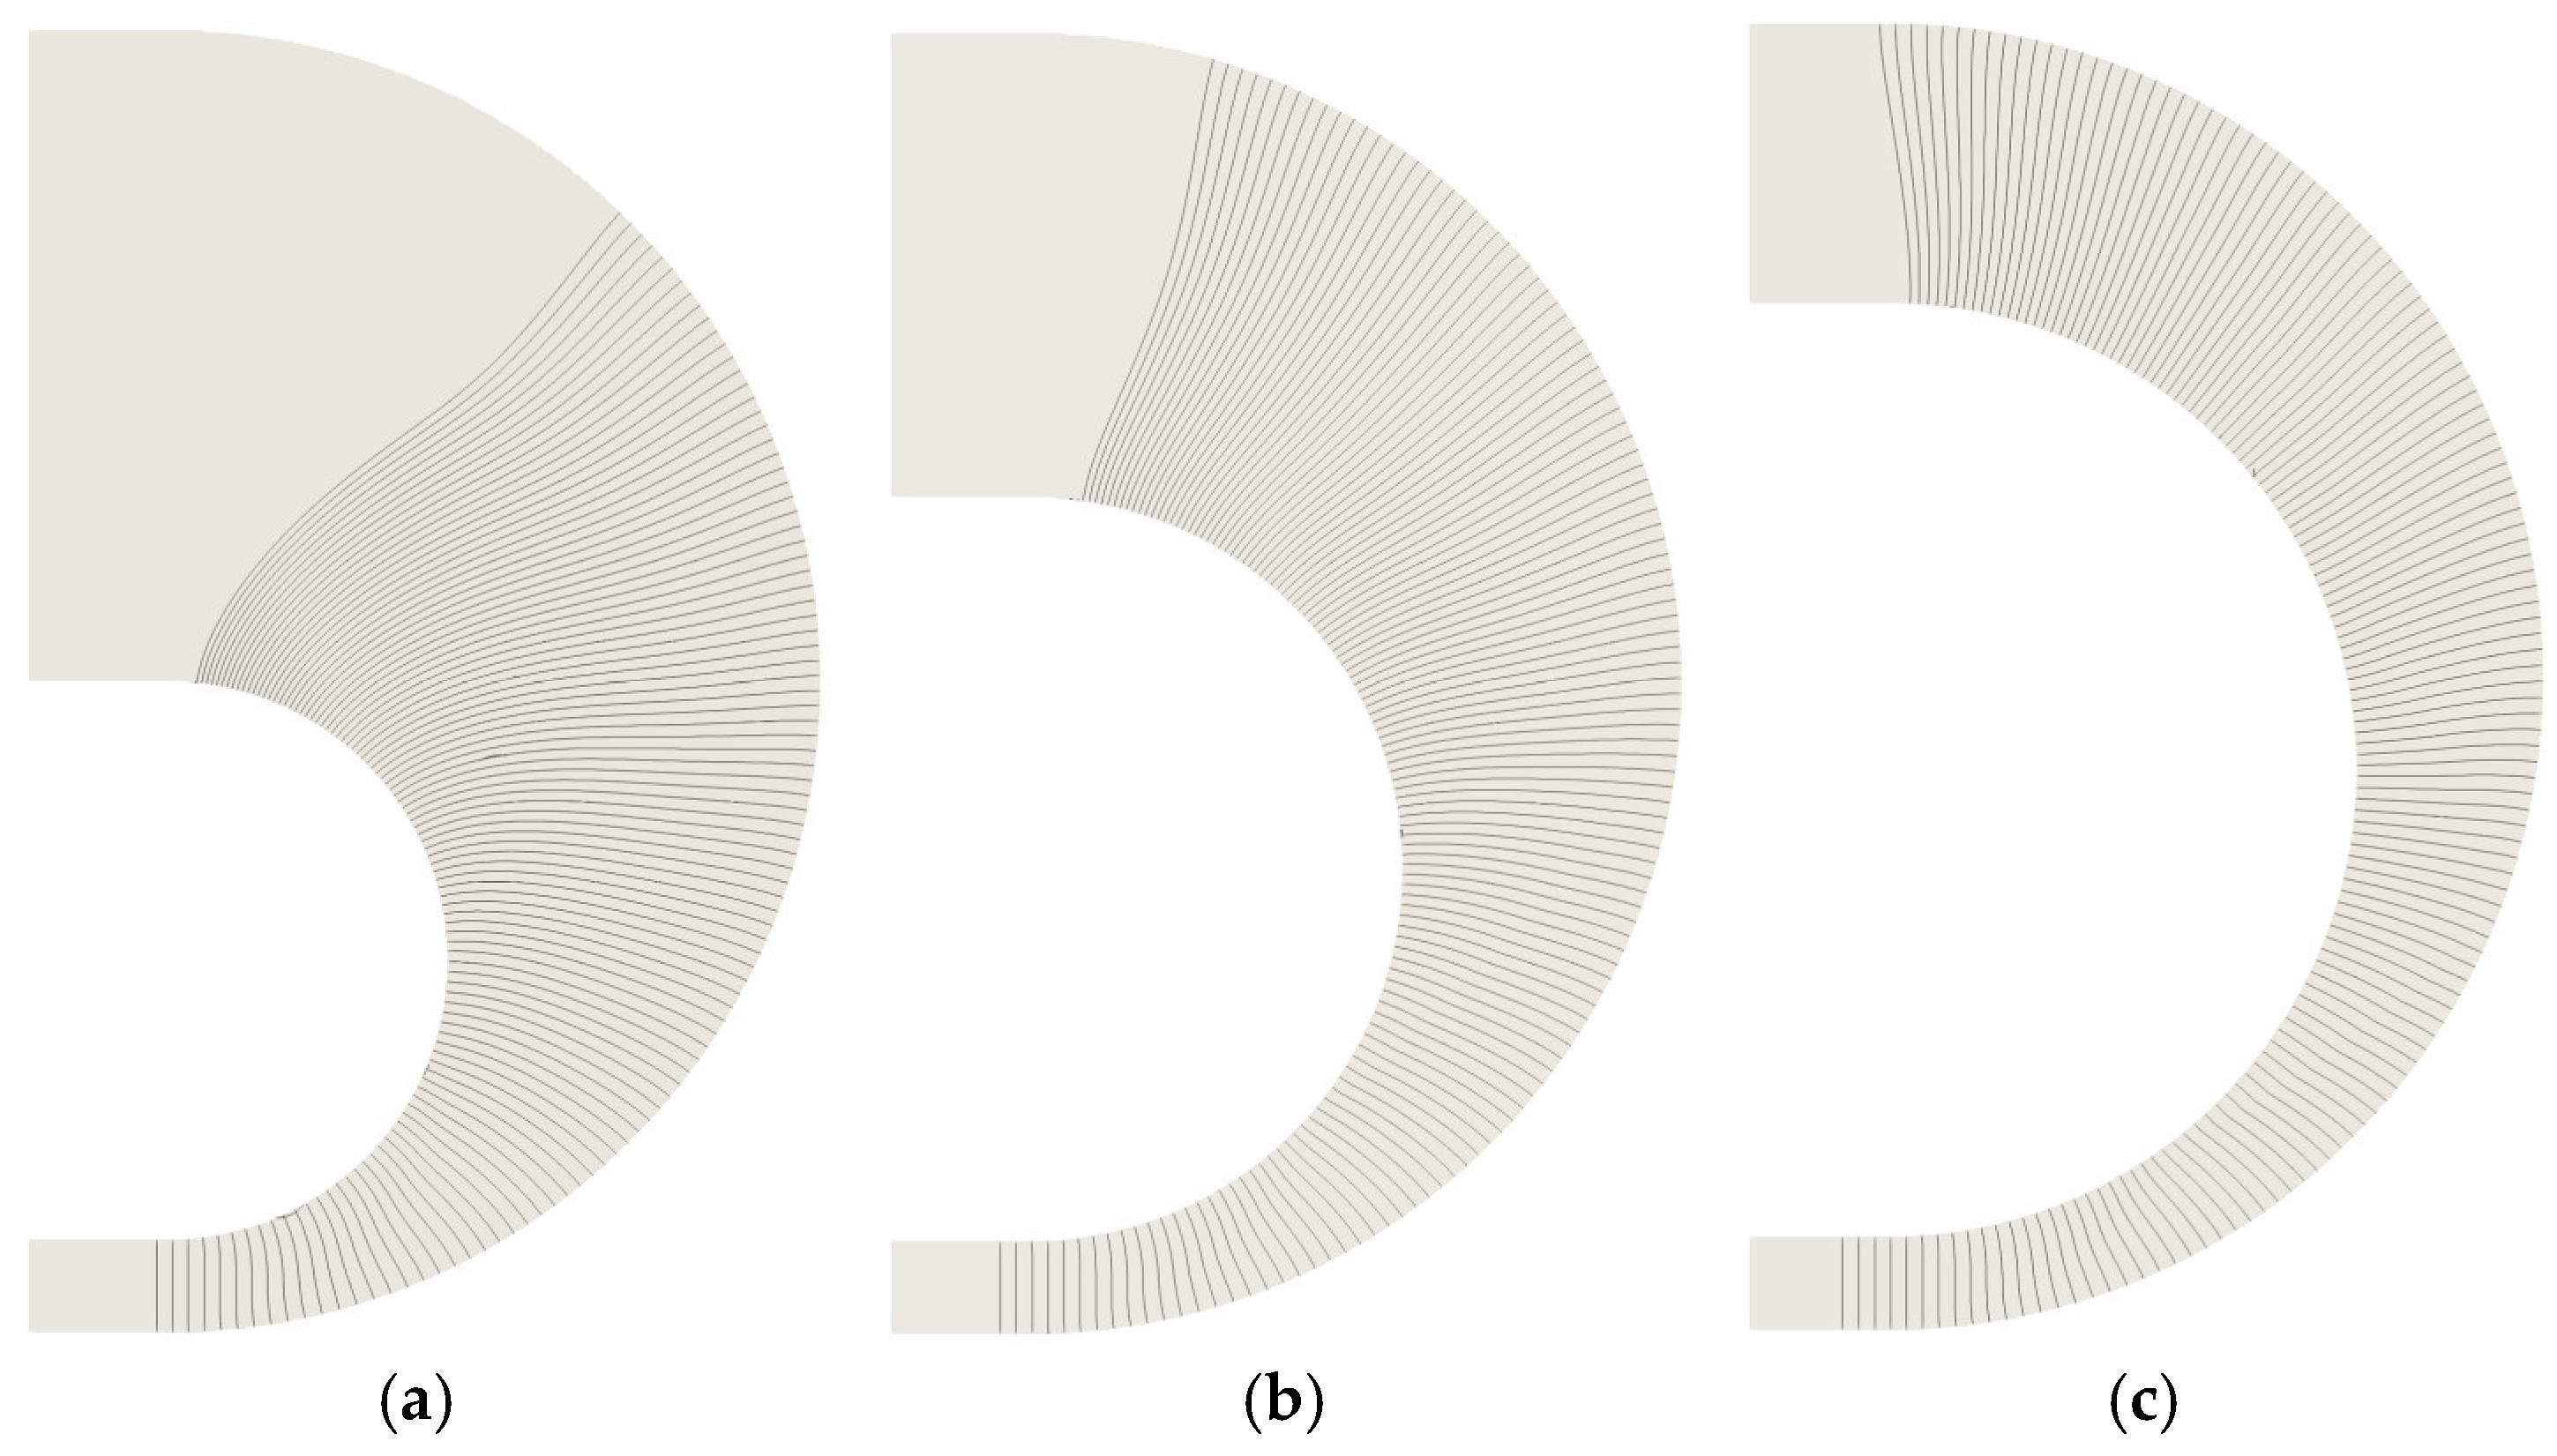
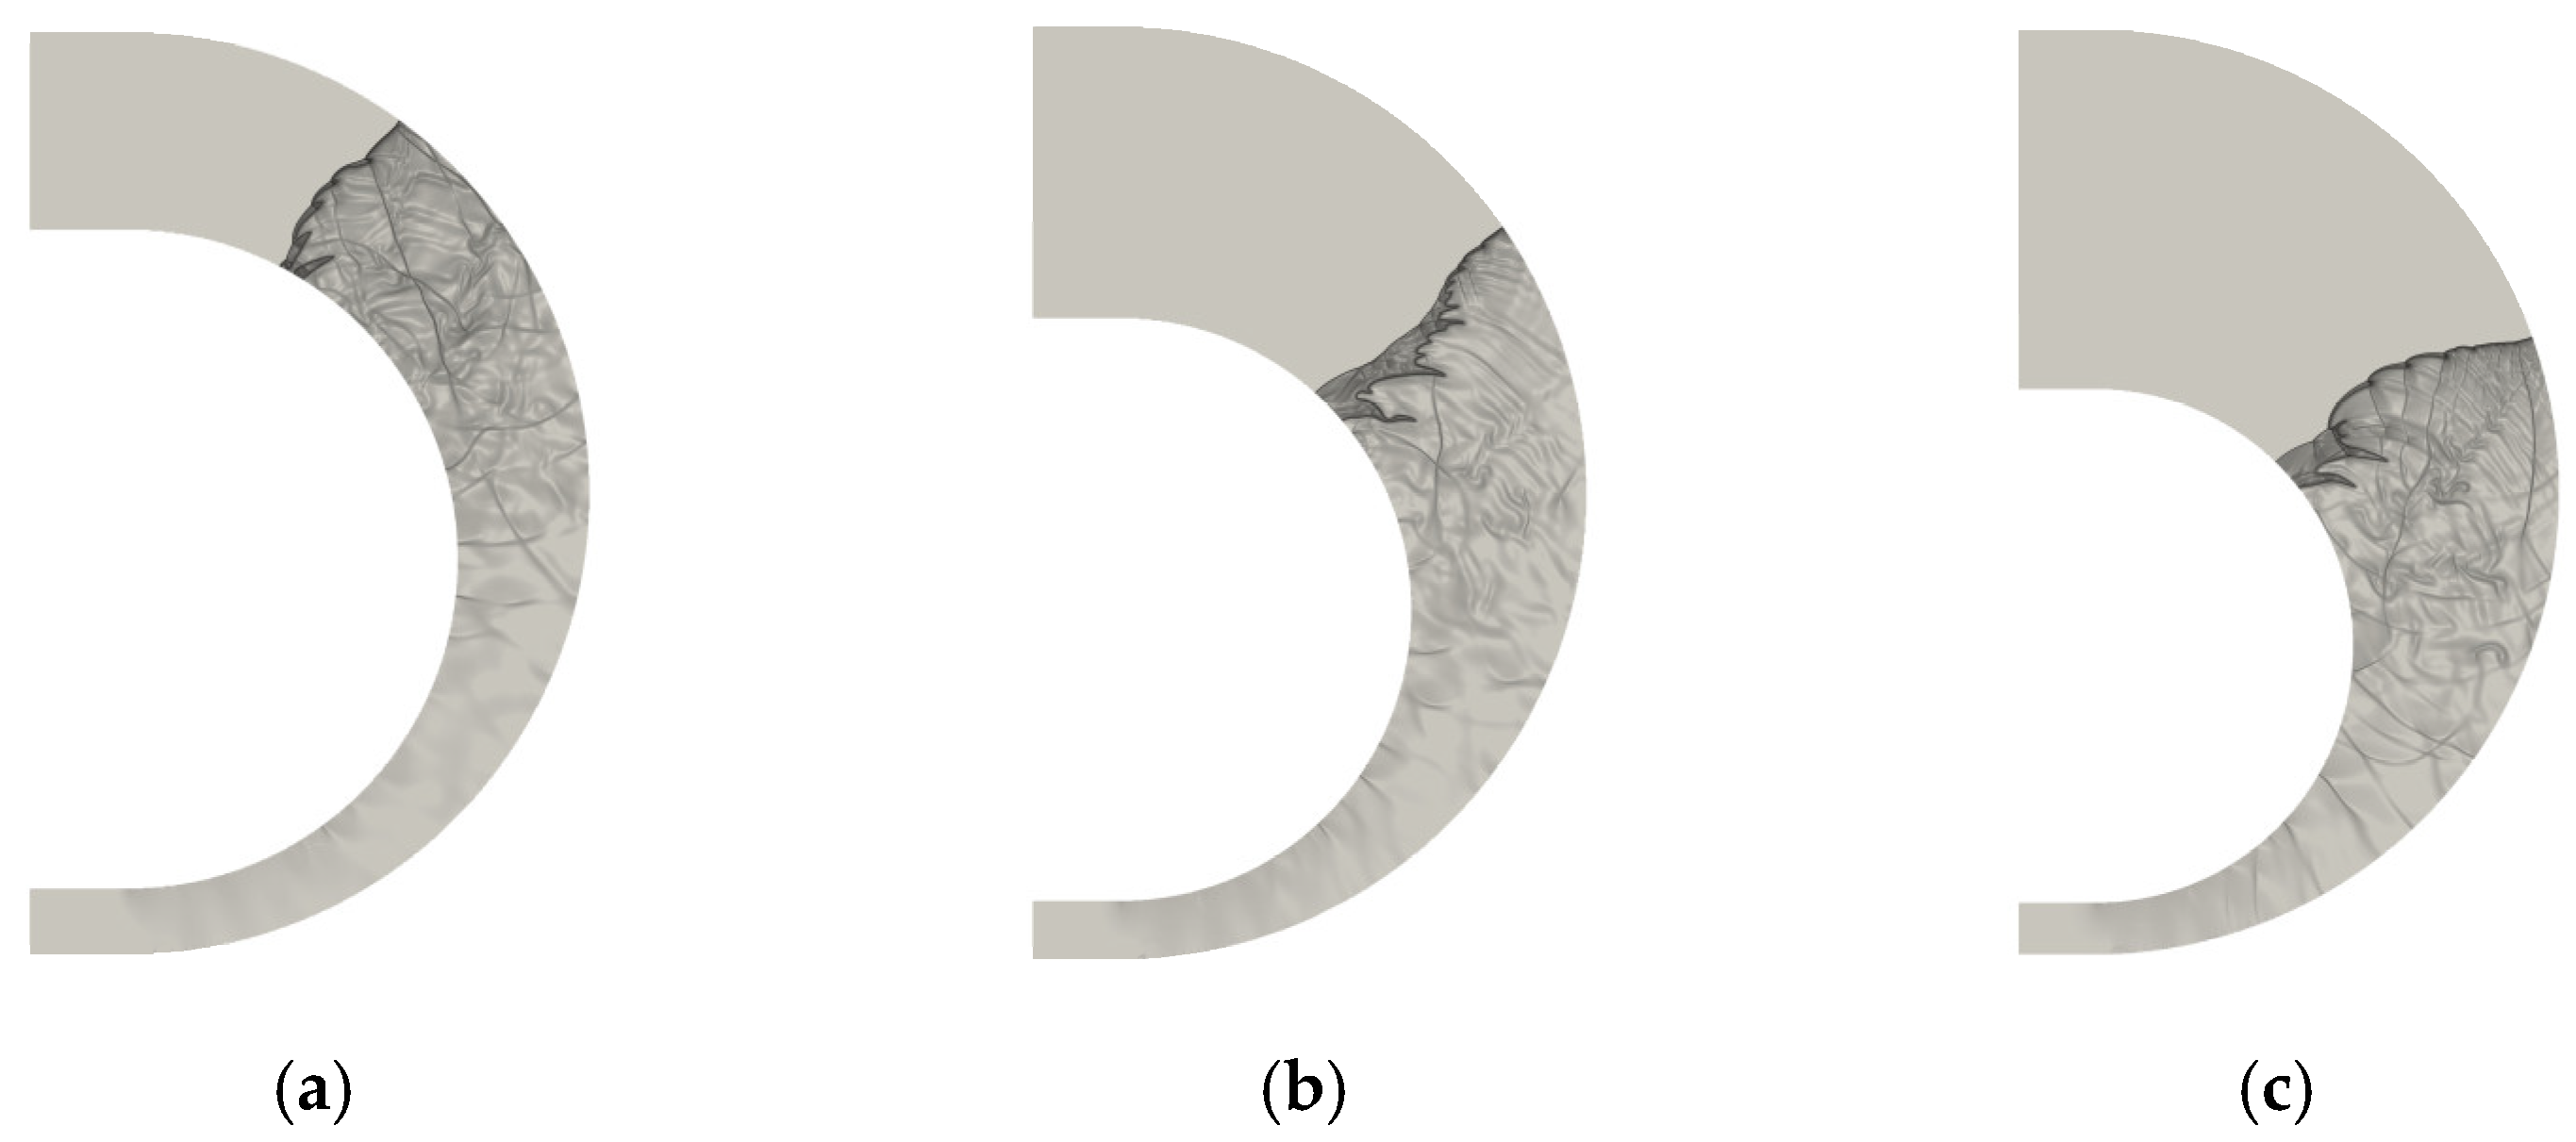
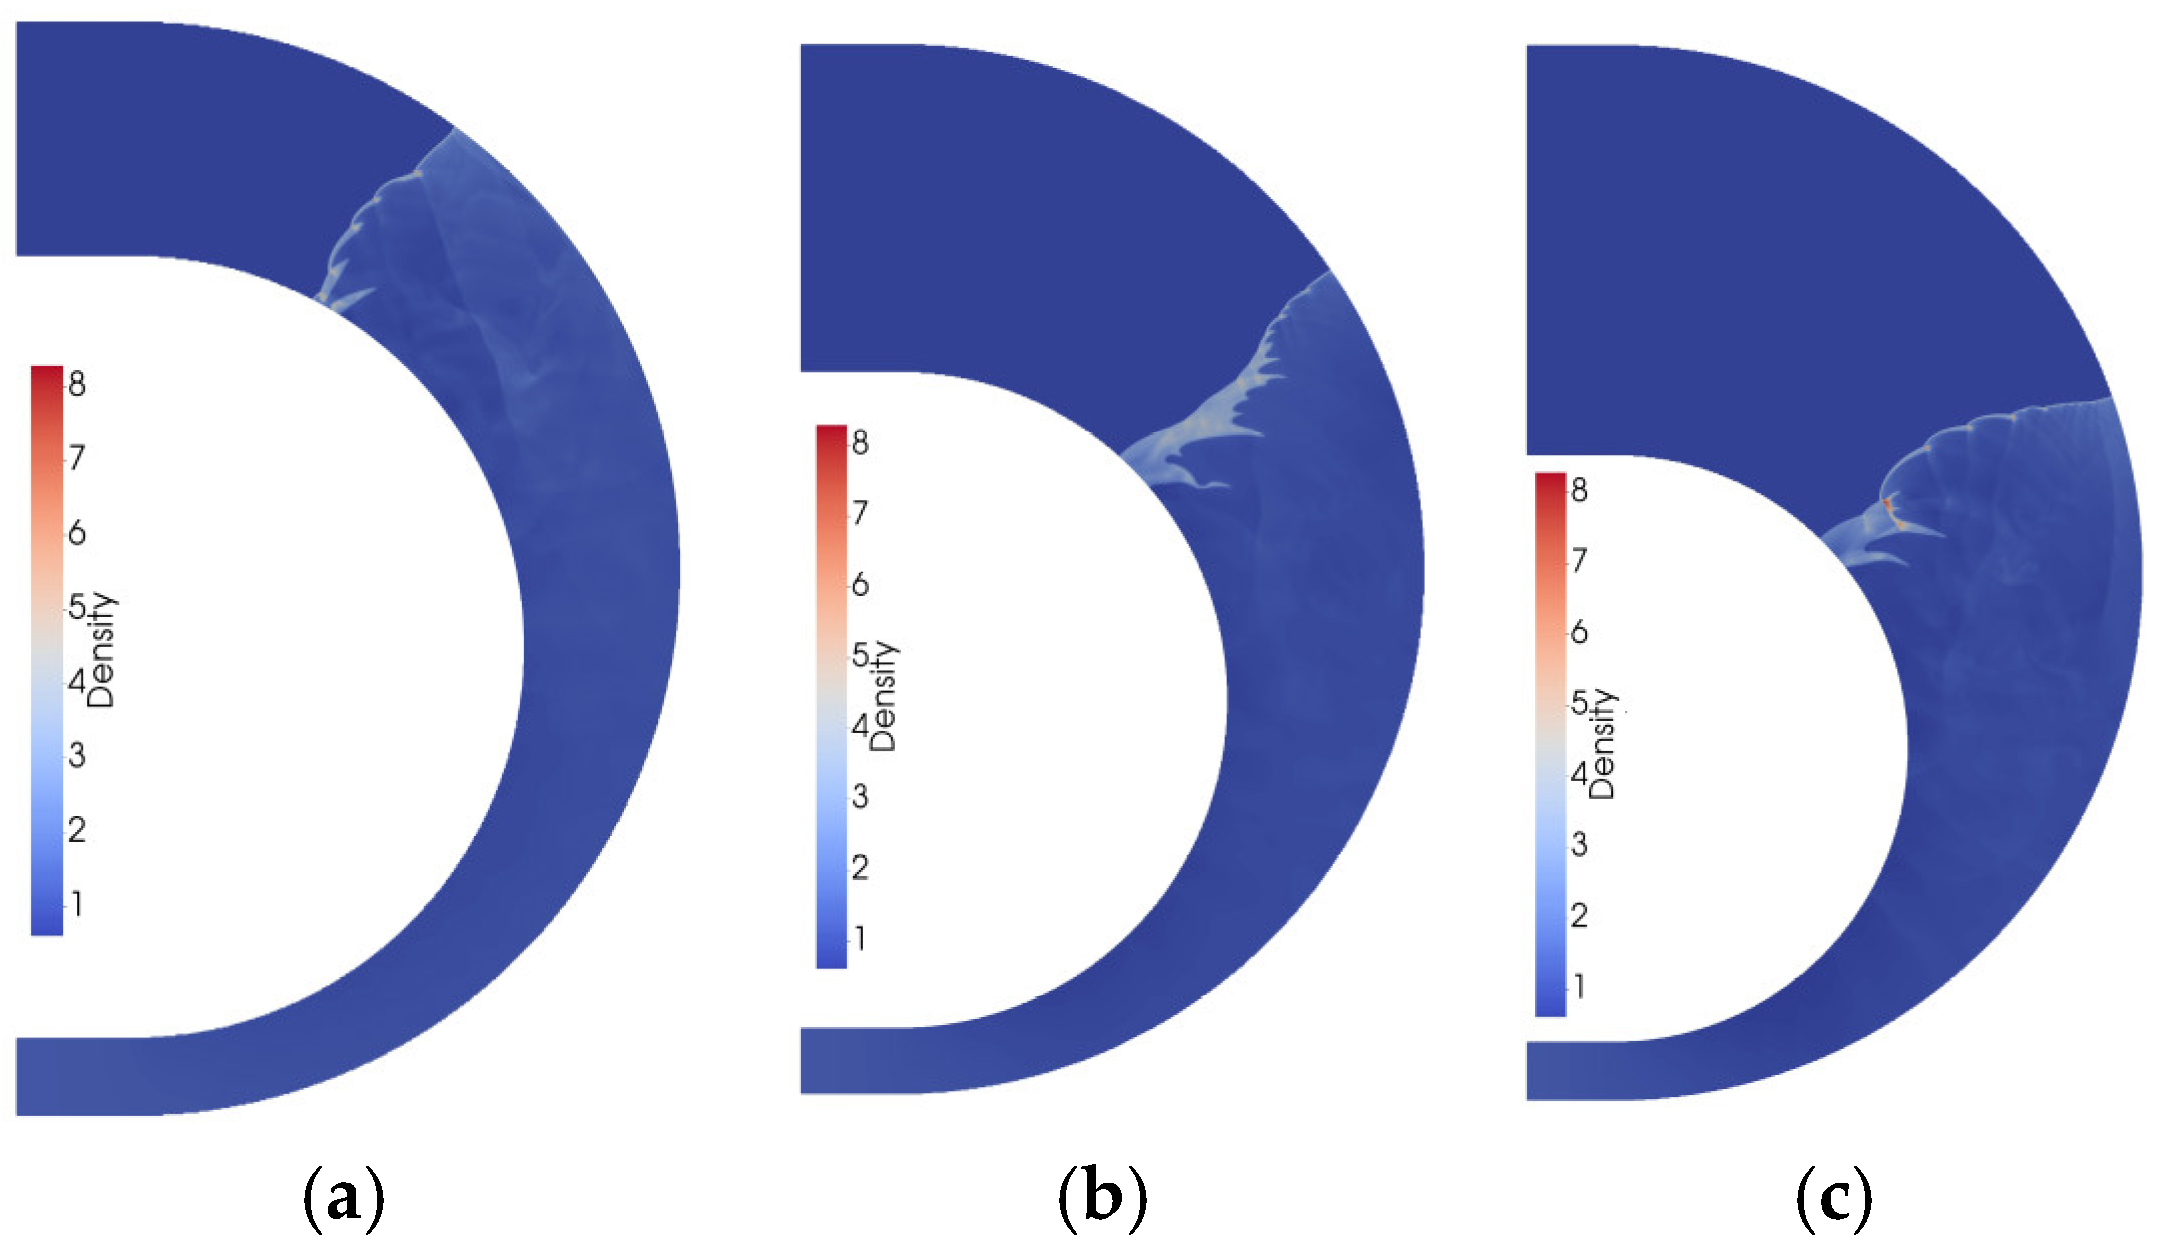
The fixed inner wall radius R1 is 50 mm, and the outer wall radius R2 is changed to 70 mm, 80 mm, 90 mm, corresponding to Cases 4.7–4.9 in Table 5. In these three cases, the growth rate of the cross-section area of the bend is increasing, so the attenuation of the detonation wave front keeps increasing. At a certain time, as shown in Figure 18 and Figure 19, it can be clearly seen that in Case 4.7, the wave front of the detonation wave maintains the normal state of the detonation wave. Only very close to the inner wall partial decoupling occurs in a small area. However, the width of the induced zone from outside to inside along the wave front has increased, indicating the influence of the curvature effect. In Case 4.8 and Case 4.9, the decoupling of the detonation wave front near the inner wall is obvious. The induced distance between the leading shock wave and the reaction zone has increased by more than ten times compared with the CJ state, but the detonation wave front near the inner wall has increased by more than ten times. Nearby, the leading shock wave and the reaction zone remain coupled. Comparing Cases 4.8 and 4.9, the overdriven degree of coupled and uncoupled wave fronts is also different. The two in Case 4.8 can basically be regarded as an asymptotic transition state, while in Case 4.9, there is an obvious discontinuity between the coupled and decoupled wave fronts separated by a transverse detonation wave.
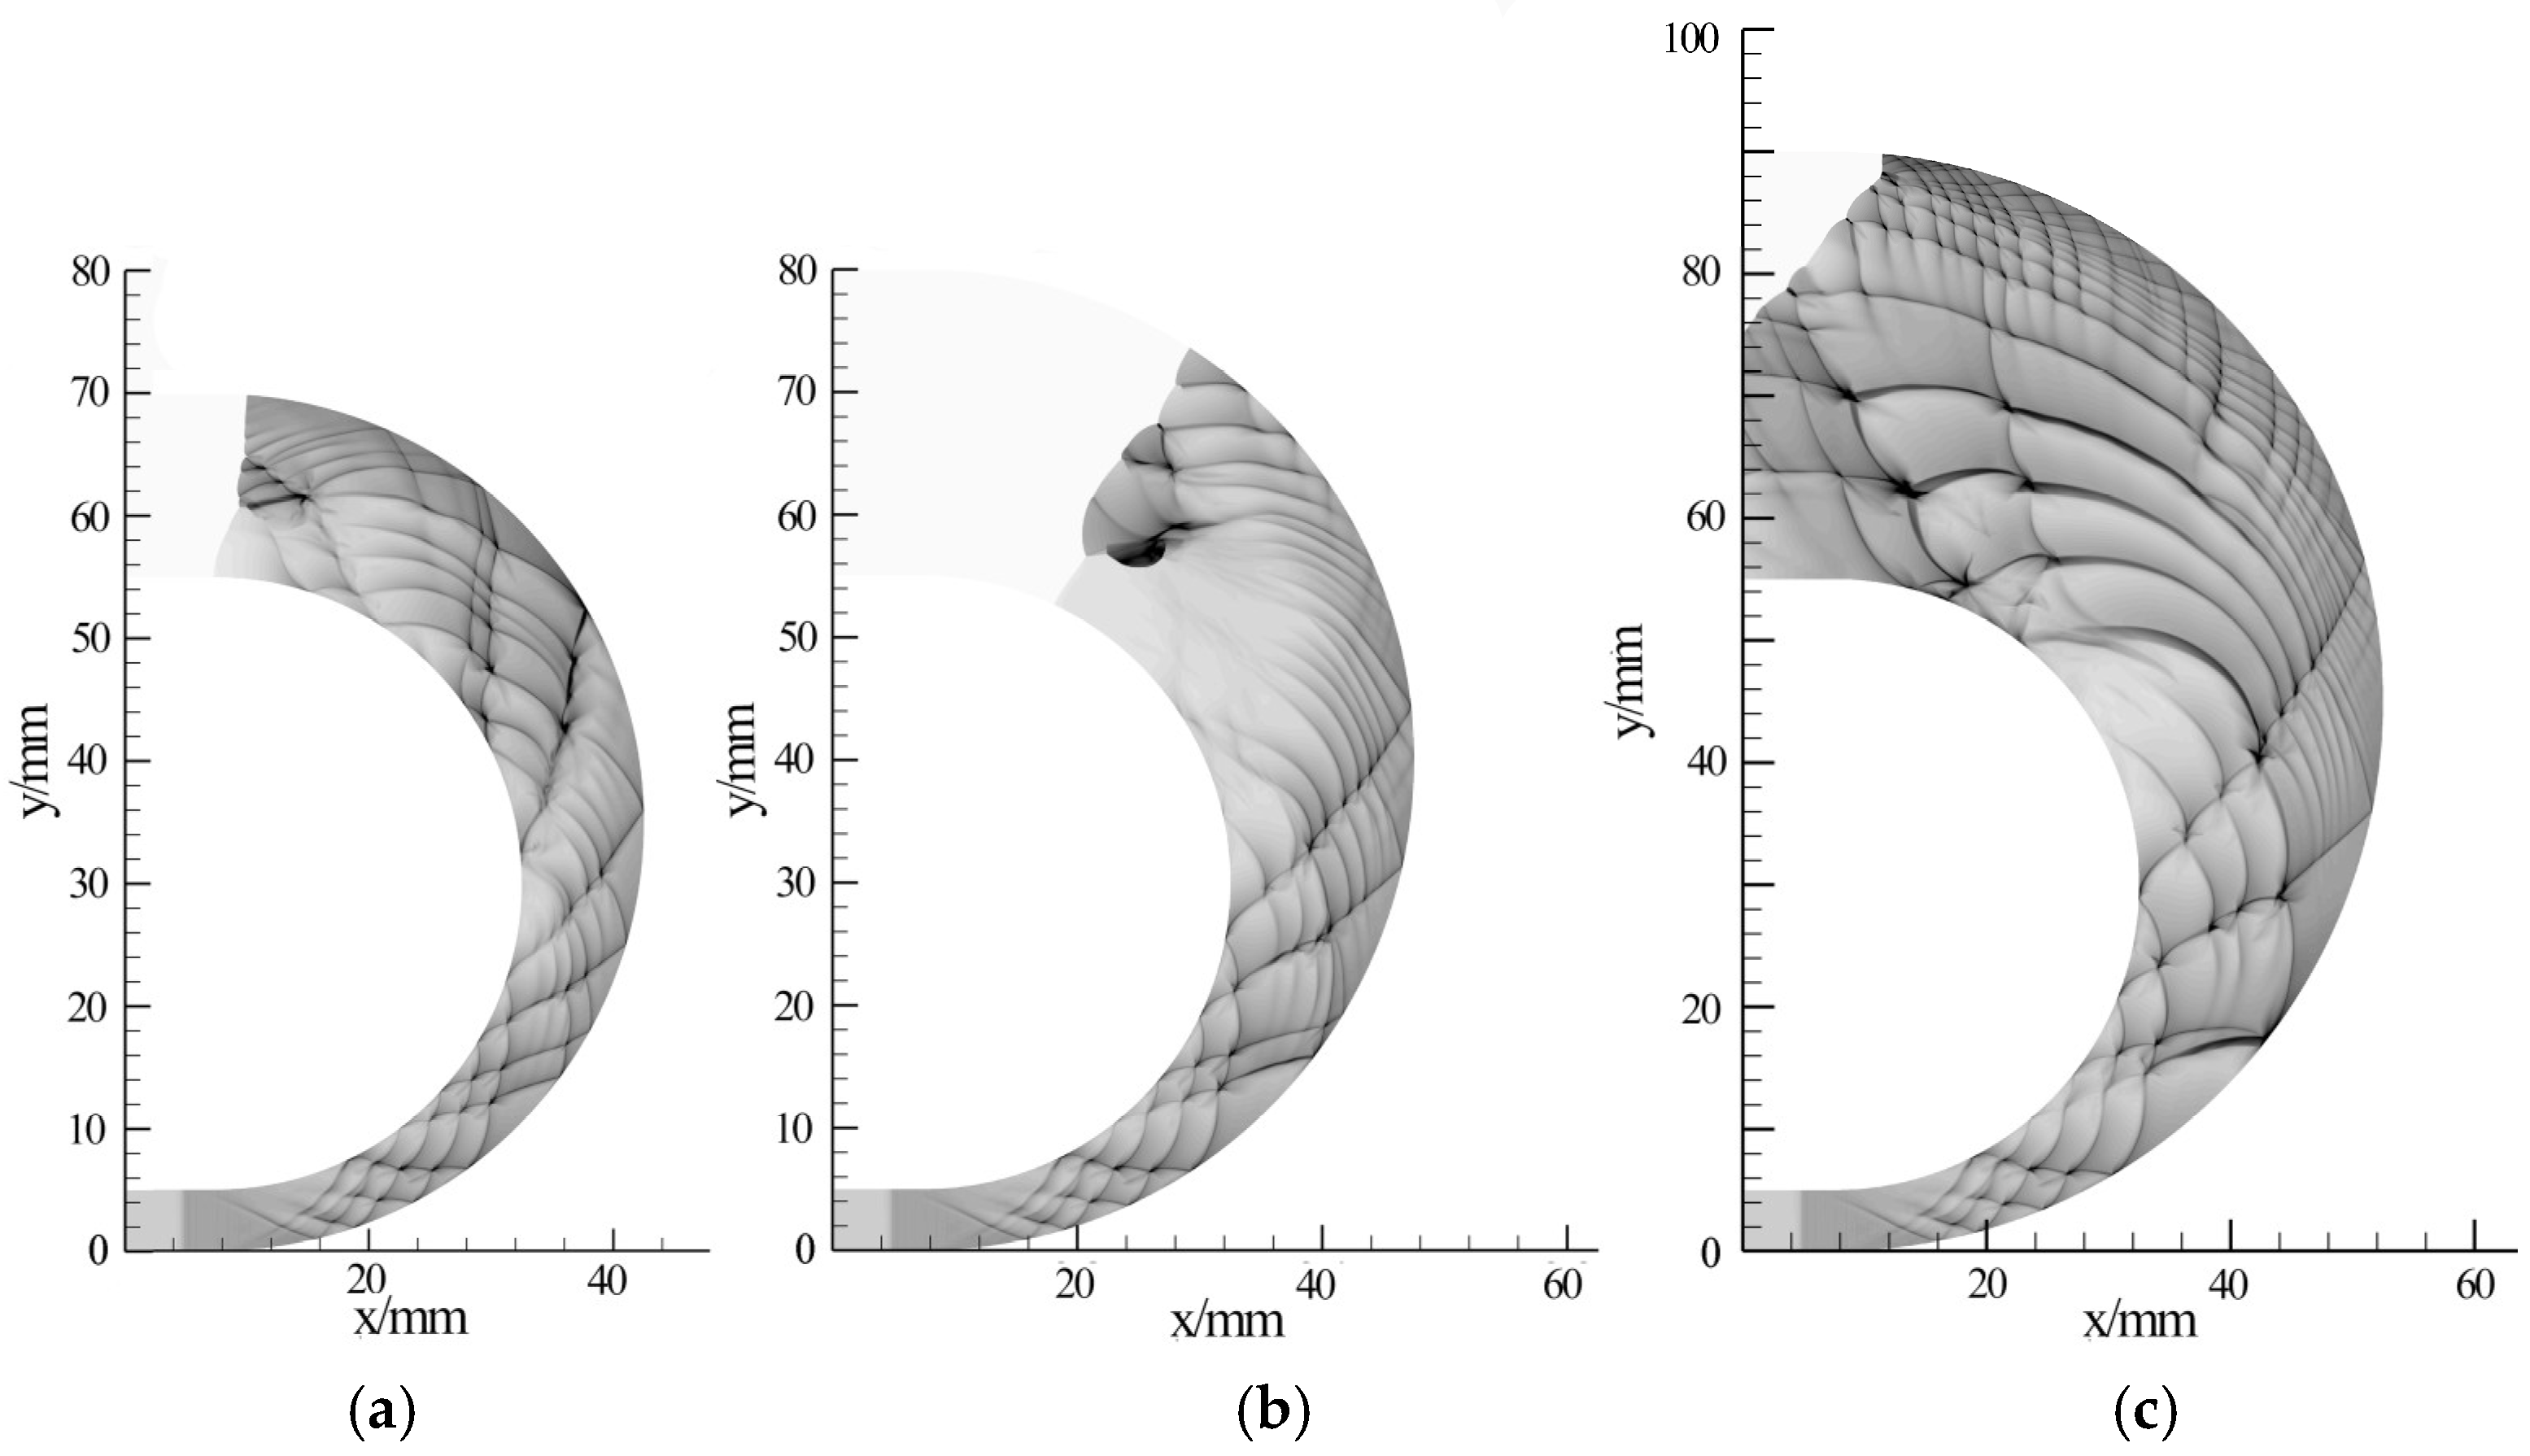
Figure 20 and Figure 21 show the cell structure and the wave front velocity distribution of the inner and outer walls in three different calculation examples. The corresponding cells and velocity deficit are shown in Figure 22 and Figure 23, respectively. This information is used to analyze the different propagation modes of detonation waves. Case 4.7 represents a uniformly changing mode. The inner and outer walls propagate at a relatively stable speed. The speed of the inner wall is lower than the CJ speed, and the speed of the outer wall is higher than the CJ speed. This can be called a stable propagation mode. In Case 4.9, the wave front propagation velocity on the outer wall is relatively stable, slightly higher than the CJ velocity, but the wave front propagation velocity on the inner wall continues to decrease. At about 120 degrees, the wave speed is already lower than 0.5 VCJ, indicating a completely decoupled state. However, at about 150 degrees thereafter, the transverse detonation wave formed on the outer wall re-initiated the failure wave front on the inner side, and then reflected on the inner wall surface to form a local overdrive detonation wave, the velocity was once higher than the CJ velocity, which suggest a mode of extinguishing and re-initiating, or an unstable mode. In Case 4.8, the wave front propagation velocity on the outer wall is relatively stable, slightly higher than the CJ velocity, but the wave front propagation velocity on the inner wall continues to decrease uniformly, indicating a critical mode.
By comparing the above three groups of examples, as shown in Figure 21, Figure 22 and Figure 23, it can be seen that the cross-section area growth rate in the first group is the largest, and the latter two groups are reduced accordingly. A large change rate of cross-section area inevitably produces a strong rarefaction effect near the inner wall surface, which makes the wave front decoupling and failure more thorough.
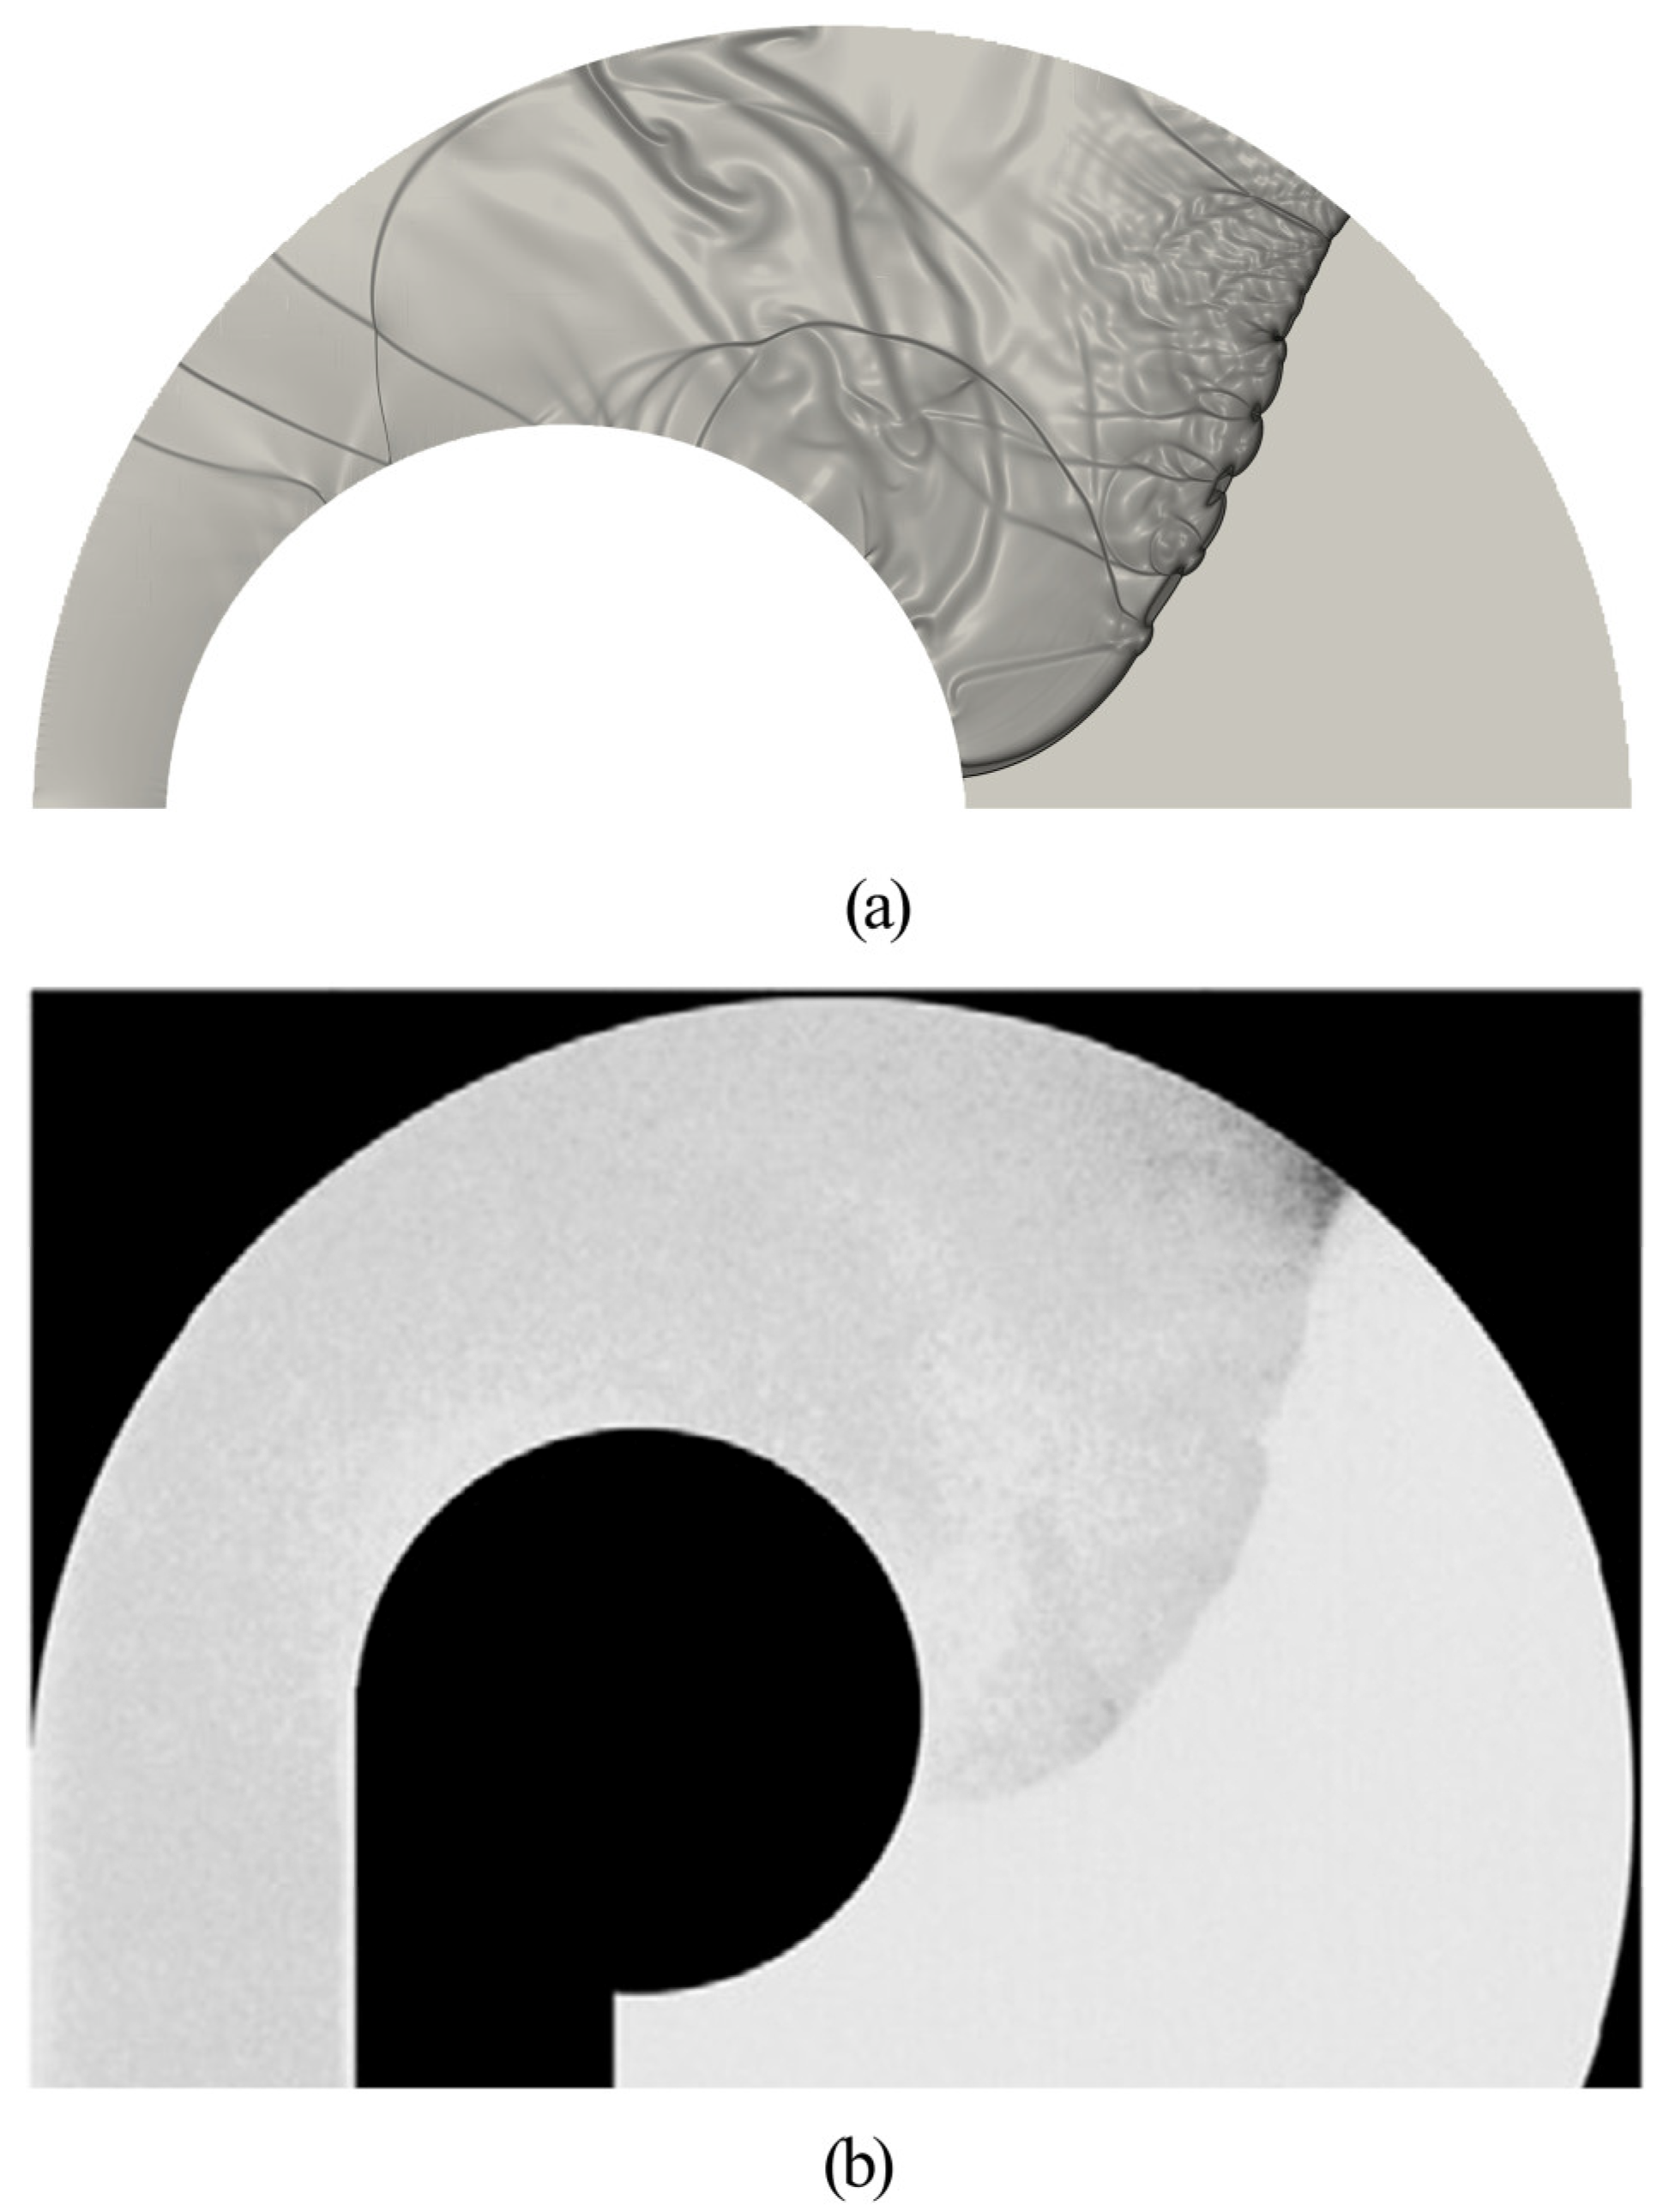
Only Melguizo-Gavilanes et al. [26] studied the combined effect of the curvature and area expansion effect. However, the geometry in the literature is not exactly the same as in the present study. We compare our numerical and experimental results from the literature for two close geometries, as shown in Figure 23 and Figure 24. The two results are close to observing the curvature of the wave front. Melguizo-Gavilanes et al. [26] did not examine the different propagation modes in the literature, so we cannot directly compare our results with them. However, the transient structure of the detonation fronts in the literature is similar to our numerical results.
Here, we define a new parameter κ = π d w R 2 d θ to characterize different detonation modes by considering both the curvature and area expansion effect. Based on our numerical results, we found that the thresholds κ = π d w R 2 d θ = 0.33 can be used to distinguish the unstable and critical modes. Table 6 shows the results where “x” represents the critical mode and “o” refers to an unstable mode.

4. Conclusions

In the present study, systematic numerical studies are conducted to investigate the combined effect of curvature and area expansion. In a channel with a small radius of curvature R/λ < 10, the detonation wave presents a failure–reinitiation–failure–reinitiation mode. In a channel with a large radius of curvature R/λ > 10, the curvature of the inner wall surface is not enough to completely structure the detonation wave. Still, there is a certain loss, so the detonation wave presents a stable mode. Next, we pay attention to the propagation mechanism and scale effect of detonation waves under curvature and area expansion combined. The results show that a large area expansion rate inevitably produces a significant rarefaction effect near the inner wall surface, which makes the wave-front decoupling and even failure more thorough. According to the radius of curvature and the area increase rate, there are three modes of detonation propagation: stable, critical, and unstable. By defining a new parameter κ = π d w R 2 d θ to characterize different detonation modes by considering both the curvature and area expansion effect, we found that the thresholds κ = 0.33 can be used to distinguish the unstable and critical modes.
The present study mainly focuses on the combined effect of curvature and cross-sectional area on detonation propagation in curved channels. We did not consider the diffusion effect because the time scale of detonation is much smaller than that of the diffusion transport. If the flame acceleration is studied, the transport effect should be considered. In the present study, only a simple two-step reaction model is used to study the transient detonation process in the current geometry analytically. Despite the simplicity of the two-step model, it is widely used by numerous researchers to study detonation dynamics. More relevant literature can be found as follows. The real gas effect should be more relevant to the reality. However, due to the complexity of the detailed chemistry, it is difficult to resolve the transient structure of the detonation front.
Our current study contributes to pipeline safety design by analyzing the maximum pressure distribution. Additionally, it aids in the design of initiation tubes for detonation propulsion engines by establishing the critical conditions for detonation failure in complex geometries.

Author Contributions

Conceptualization, P.W., W.D. and A.Y.; data curation, P.W. and L.B.; funding acquisition, P.W.; investigation, P.W. and L.B.; methodology, P.W. and W.D.; project administration, P.W.; software, P.W., L.B. and C.G.; supervision, A.Y.; validation, P.W. and L.B.; writing—original draft, P.W.; writing—review and editing, P.W. and A.Y. All authors have read and agreed to the published version of the manuscript.

Funding

This research was funded by the Ministry of Science and Technology of SINOPEC, grant number 325048.

Institutional Review Board Statement

Not applicable.

Informed Consent Statement

Not applicable.

Data Availability Statement

Data are contained within the article.

Conflicts of Interest

All authors were employed by the company SINOPEC Research Institute of Safety Engineering Co., Ltd. The authors declare that the research was conducted in the absence of any commercial or financial relationships that could be construed as a potential conflict of interest.

References

  1. Yuan, X.; Zhou, J.; Lin, Z.; Cai, X. Adaptive simulations of detonation propagation in 90-degree bent tubes. Int. J. Hydrogen Energy 2016, 41, 18259–18272. [Google Scholar] [CrossRef]
  2. Li, J.; Ren, H.; Ning, J. Numerical application of additive Runge-Kutta methods on detonation interaction with pipe bends. Int. J. Hydrogen Energy 2013, 38, 9016–9027. [Google Scholar] [CrossRef]
  3. Li, J.; Ning, J.-G.; Zhao, H.; Hao, L.; Wang, C. Numerical Investigation on the Propagation Mechanism of Steady Cellular Detonations in Curved Channels. Chin. Phys. Lett. 2015, 32, 144–147. [Google Scholar] [CrossRef]
  4. Edwards, D.H.; Thomas, G.O. The diffraction of detonation waves in channels with 90° bends. Combustions 1983, 3, 65–76. [Google Scholar]
  5. Mitrofanov, V.V.; Soloukhin, R.I. The Diffraction of Multifront Detonation Waves. Sov. Phys. Dokl. 1965, 9, 1055–1058. [Google Scholar]
  6. Zhang, B.; Mehrjoo, N.; Ng, H.D.; Lee, J.H.S.; Bai, C. On the dynamic detonation parameters in acetylene–oxygen mixtures with varying amount of argon dilution. Combust. Flame 2014, 161, 1390–1397. [Google Scholar] [CrossRef]
  7. Meredith, J.; Ng, H.D.; Lee, J.H.S. Detonation diffraction from an annular channel. Shock Waves 2010, 20, 449–455. [Google Scholar] [CrossRef]
  8. Li, J.; Ning, J.; Lee, J.H.S. Mach reflection of a ZND detonation wave. Shock Waves 2015, 25, 293–304. [Google Scholar] [CrossRef]
  9. Li, J.; Lee, J.H.S. Numerical simulation of Mach reflection of cellular detonations. Shock Waves 2016, 26, 673–682. [Google Scholar] [CrossRef]
  10. Li, J.; Ren, H.; Wang, X.; Ning, J. Length scale effect on Mach reflection of cellular detonations. Combust. Flame 2018, 189, 378–392. [Google Scholar] [CrossRef]
  11. Takayama, K.; Honda, M.; Onoders, O. Shock propagation along 90 degree bends. Rep. Inst. High Speed Mech. 1977, 35, 83–111. [Google Scholar]
  12. Achasov, O.V.; Penyaz’kov, O.G. Investigation of the dynamic properties of the cellular structure of a gas-detonation wave. J. Eng. Phys. Thermophys. 2000, 73, 915–920. [Google Scholar] [CrossRef]
  13. Frolov, S.M.; Aksenov, V.S.; Shamshin, I.O. Shock wave and detonation propagation through U-bend tubes. Proc. Combust. Inst. 2007, 31, 2421–2428. [Google Scholar] [CrossRef]
  14. Thomas, G.O.; Williams, R.L. Detonation interaction with wedges and bends. Shock Waves 2002, 11, 481–492. [Google Scholar] [CrossRef]
  15. Sato, K.; Sakai, Y.; Chiga, M. Flame Propagation Along 90° Bend in an Open Duct. In Twenty-Sixth Symposium (International) on Combustion; Combustions Institute: Naples, Italy, 1996; pp. 931–937. [Google Scholar]
  16. Kudo, Y.; Nagura, Y.; Kasahara, J.; Sasamoto, Y.; Matsuo, A. Oblique detonation waves stabilized in rectangular-cross-section bent tubes. Proc. Combust. Inst. 2011, 33, 2319–2326. [Google Scholar] [CrossRef]
  17. Nakayama, H.; Moriya, T.; Kasahara, J.; Matsuo, A.; Sasamoto, Y.; Funaki, I. Stable detonation wave propagation in rectangular cross-section curved channels. Combust. Flame 2012, 159, 859–869. [Google Scholar] [CrossRef]
  18. Nakayama, H.; Kasahara, J.; Matsuo, A.; Funaki, I. Front shock behavior of stable curved detonation waves in rectangular-cross-section curved channels. Proc. Combust. Inst. 2013, 34, 1939–1947. [Google Scholar] [CrossRef]
  19. Sugiyama, Y.; Nakayama, Y.; Matsuo, A.; Nakayama, H.; Kasahara, J. Numerical investigations on detonation propagation in a Two-Dimensional Curved Channel. Combust. Sci. Technol. 2014, 186, 1662–1679. [Google Scholar] [CrossRef]
  20. Thomas, G.; Edwards, D.; Lee, J.; Knystautas, R.; Moen, I.; Wei, Y. Detonation diffraction by divergent channels. Dyn. Explos. Prog. Astronaut. Aeronaut. 1986, 106, 144–154. [Google Scholar]
  21. Sorin, R.; Zitoun, R.; Khasainov, B.; Desbordes, D. Detonation diffraction through different geometries. Shock Waves 2009, 19, 11–23. [Google Scholar] [CrossRef]
  22. Monnier, V.; Rodriguez, V.; Vidal, P.; Zitoun, R. Three-dimensional dynamics of detonation cells in linearly diverging channels: Experimental analysis of the cross-sectional shape and a detonation-shock dynamics interpretation. Exp. Fluids 2024, 65, 154. [Google Scholar] [CrossRef]
  23. Ng, H.D.; Radulescu, M.I.; Higgins, A.J.; Nikiforakis, N.; Lee, J.H.S. Numerical investigation of the instability for one-dimensional Chapman-Jouguet detonations with chain-branching kinetics. Combust. Theory Model. 2003, 9, 385–401. [Google Scholar] [CrossRef]
  24. Deiterding, R. Parallel Adaptive Simulation of Multi-Dimensional Detonation Structures. Doctoral Thesis, Brandenburgische Technische Universität Cottbus, Cottbus, Germany, 2003. [Google Scholar]
  25. Berger, M.J.; Colella, P. Local adaptive mesh refinement for shock hydrodynamics. J. Comput. Phys. 1989, 8, 64–84. [Google Scholar] [CrossRef]
  26. Melguizo-Gavilanes, J.; Rodriguez, V.; Vidal, P.; Zitoun, R. Dynamics of detonation transmission and propagation in a curved chamber: A numerical and experimental analysis. Combust. Flame 2021, 223, 460–473. [Google Scholar] [CrossRef]
Figure 1. Schlieren plots of detonation front for different grid resolutions, (a) 10 pts/ΔI, (b) 15 pts/ΔI, (c) pts/ΔI and (d) pts/ΔI.
Fire 08 00218 g001
Figure 2. Detonation velocities near the inner wall for different grid resolutions.
Fire 08 00218 g002
Figure 3. Computational domain, (a) a curved channel with a constant radius of curvature, and (b) a curved channel with varying radii of curvature.
Fire 08 00218 g003
Figure 4. Shock propagation in curved channel with constant cross-section for case 1.1 with R1 = 30 mm, R2 = 40 mm, (a) Schlieren diagram, and (b) shock fronts and triple-point trajectory.
Fire 08 00218 g004
Figure 5. Velocity distribution for shock propagation in curved channel with constant cross-section for a case with (a) R1 = 30 mm, R2 = 40 mm, (b) R1 = 40 mm, R2 = 50 mm, (c) R1 = 50 mm, R2 = 60 mm, and (d) R1 = 60 mm, R2 = 70 mm.
Fire 08 00218 g005
Figure 6. Mach number loss through the channel with different curvature.
Fire 08 00218 g006
Figure 7. Comparison between the present numerical results with experimental results of Takayama et al. [11].
Fire 08 00218 g007
Figure 8. The Schlieren photography, temperature and pressure of the decoupled detonation front at two successive moments, (a) t = 0.1, (b) t = 0.11.
Fire 08 00218 g008
Figure 9. The decoupled detonation front at successive moments: (a) Schlieren photography and (b) temperature.
Fire 08 00218 g009
Figure 10. The numerical smoked foil for case 2.3, (a) and the velocity distribution along the (b) inner wall and (c) outer wall.
Fire 08 00218 g010
Figure 11. Propagation velocity on both the inner and outer wall for different cases, (a) Case 2.4, (b) Case 2.5, (c) Case 2.6, (d) Case 2.7.
Fire 08 00218 g011
Figure 12. Average velocity of detonation near the boundaries for cases with different curvature.
Fire 08 00218 g012
Figure 13. The shock front at successive moments in curvature bend with varying cross-section area, (a) Case 3.1: R1 = 30 mm, R2 = 50 mm, (b) Case 3.2: R1 = 30 mm, R2 = 60 mm, (c) Case 3.3: R1 = 30 mm, R2 = 70 mm.
Fire 08 00218 g013
Figure 14. The propagation velocity on both the inner and outer wall for different cases, (a) Case 3.1: R1 = 30 mm, R2 = 50 mm, (b) Case 3.2: R1 = 30 mm, R2 = 60 mm, (c) Case 3.3: R1 = 30 mm, R2 = 70 mm.
Fire 08 00218 g014
Figure 15. Shock front at different moments in curvature bend with varying cross-section area, (a) Case 3.3: R1 = 30 mm, R2 = 70 mm, (b) Case 3.4: R1 = 40 mm, R2 = 70 mm, (c) Case 3.5: R1 = 50 mm, R2 = 70 mm.
Fire 08 00218 g015
Figure 16. The propagation velocity on both the inner and outer wall for different cases, (a) Case 3.3: R1 = 30 mm, R2 = 70 mm, (b) Case 3.4: R1 = 40 mm, R2 = 70 mm, (c) Case 3.5: R1 = 50 mm, R2 = 70 mm.
Fire 08 00218 g016
Figure 17. The velocity loss along the channel with different radii and area expansion rates.
Fire 08 00218 g017
Figure 18. The Schlieren photography of detonation front, (a) Case 4.7 with R1 = 50 mm, R2 = 70 mm, (b) Case 4.8 with R1 = 50 mm, R2 = 80 mm, (c) Case 4.9 with R1 = 50 mm, R2 = 90 mm.
Fire 08 00218 g018
Figure 19. The density of detonation front, (a) Case 4.7 with R1 = 50 mm, R2 = 70 mm, (b) Case 4.8 with R1 = 50 mm, R2 = 80 mm, (c) Case 4.9 with R1 = 50 mm, R2 = 90 mm.
Fire 08 00218 g019
Figure 20. Numerical smoked foils, (a) Case 4.7 with R1 = 50 mm, R2 = 70 mm, (b) Case 4.8 with R1 = 50 mm, R2 = 80 mm, (c) Case 4.9 with R1 = 50 mm, R2 = 90 mm.
Fire 08 00218 g020
Figure 21. Propagation velocities at the inner and outer walls, (a) Case 4.7 with R1 = 50 mm, R2 = 70 mm, (b) Case 4.8 with R1 = 50 mm, R2 = 80 mm, (c) Case 4.9 with R1 = 50 mm, R2 = 90 mm.
Fire 08 00218 g021
Figure 22. Propagation velocities at the inner and outer walls, (a) Case 4.1 with R1 = 30 mm, R2 = 50 mm, (b) Case 4.2 with R1 = 30 mm, R2 = 60 mm and (c) Case 4.3 with R1 = 30 mm, R2 = 70 mm.
Fire 08 00218 g022
Figure 23. Propagation velocities at the inner and outer walls, (a) Case 4.4 with R1 = 40 mm, R2 = 60 mm, (b) Case 4.5 with R1 = 40 mm, R2 = 70 mm and (c) Case 4.6 with R1 = 40 mm, R2 = 80 mm.
Fire 08 00218 g023
Figure 24. Comparison between (a) the present numerical results and (b) experimental results from literature.
Fire 08 00218 g024
Table 1. Reaction parameters.
Model ParametersValueUnit
R218.79J/kg·K
p 0 50.0kPa
T 0 295K
ρ 0 0.775kg/m3
Q / R T 0 19.7
γ 1.44
M C J 5.6
E I / R T V N 4.8
E R / R T V N 1.0
k I γ / c 0 1.3875
k R γ / c 0 2.0
Table 2. Setup for shock propagation in curved channel with constant cross-section.
R1 (mm)R2 (mm)w1 (mm)
Case 1.1304010
Case 1.2405010
Case 1.3506010
Case 1.4607010
Table 3. Setup for detonation propagation in a curved channel with a constant cross-section area.
R1 (mm)R2 (mm)w1 (mm)
Case 2.1204020
Case 2.2305020
Case 2.3406020
Case 2.4304010
Case 2.5405010
Case 2.6506010
Case 2.7607010
Table 4. Setup for shock propagation in curvature bend with a varying cross-section area.
R1 (mm)R2 (mm)w1 (mm)w2 (mm) π d w d θ (mm/rad) κ = π d w R 2 d θ
(1/rad)
Case 3.130501020100.20
Case 3.230601030200.33
Case 3.330701040300.43
Case 3.440701030200.29
Case 3.550701020100.14
Table 5. Setup for detonation propagation in curvature bend with varying cross-section area.
R1 (mm)R2 (mm)w1 (mm)w2 (mm) π d w d θ (mm/rad) κ = π d w R 2 d θ (1/rad)
Case 4.130501020100.20
Case 4.230601030200.33
Case 4.330701040300.43
Case 4.440601020100.17
Case 4.540701030200.29
Case 4.640801040300.38
Case 4.750701020100.14
Case 4.850801030200.25
Case 4.950901040300.33
Table 6. Different propagation modes with both the curvature and expansion effects.
κ = 0.14κ = 0.17κ = 0.20κ = 0.25κ = 0.29κ = 0.33κ = 0.33κ = 0.38κ = 0.43
π d w d θ = 30 ooo
π d w d θ = 20 xxo
π d w d θ = 10 xxx
Disclaimer/Publisher’s Note: The statements, opinions and data contained in all publications are solely those of the individual author(s) and contributor(s) and not of MDPI and/or the editor(s). MDPI and/or the editor(s) disclaim responsibility for any injury to people or property resulting from any ideas, methods, instructions or products referred to in the content.