
Full-Scale Experimental Investigation of Temperature Distribution and Smoke Flow in a Road Tunnel with a Novel Water Mist Fire Fighting System


Abstract
1. Introduction
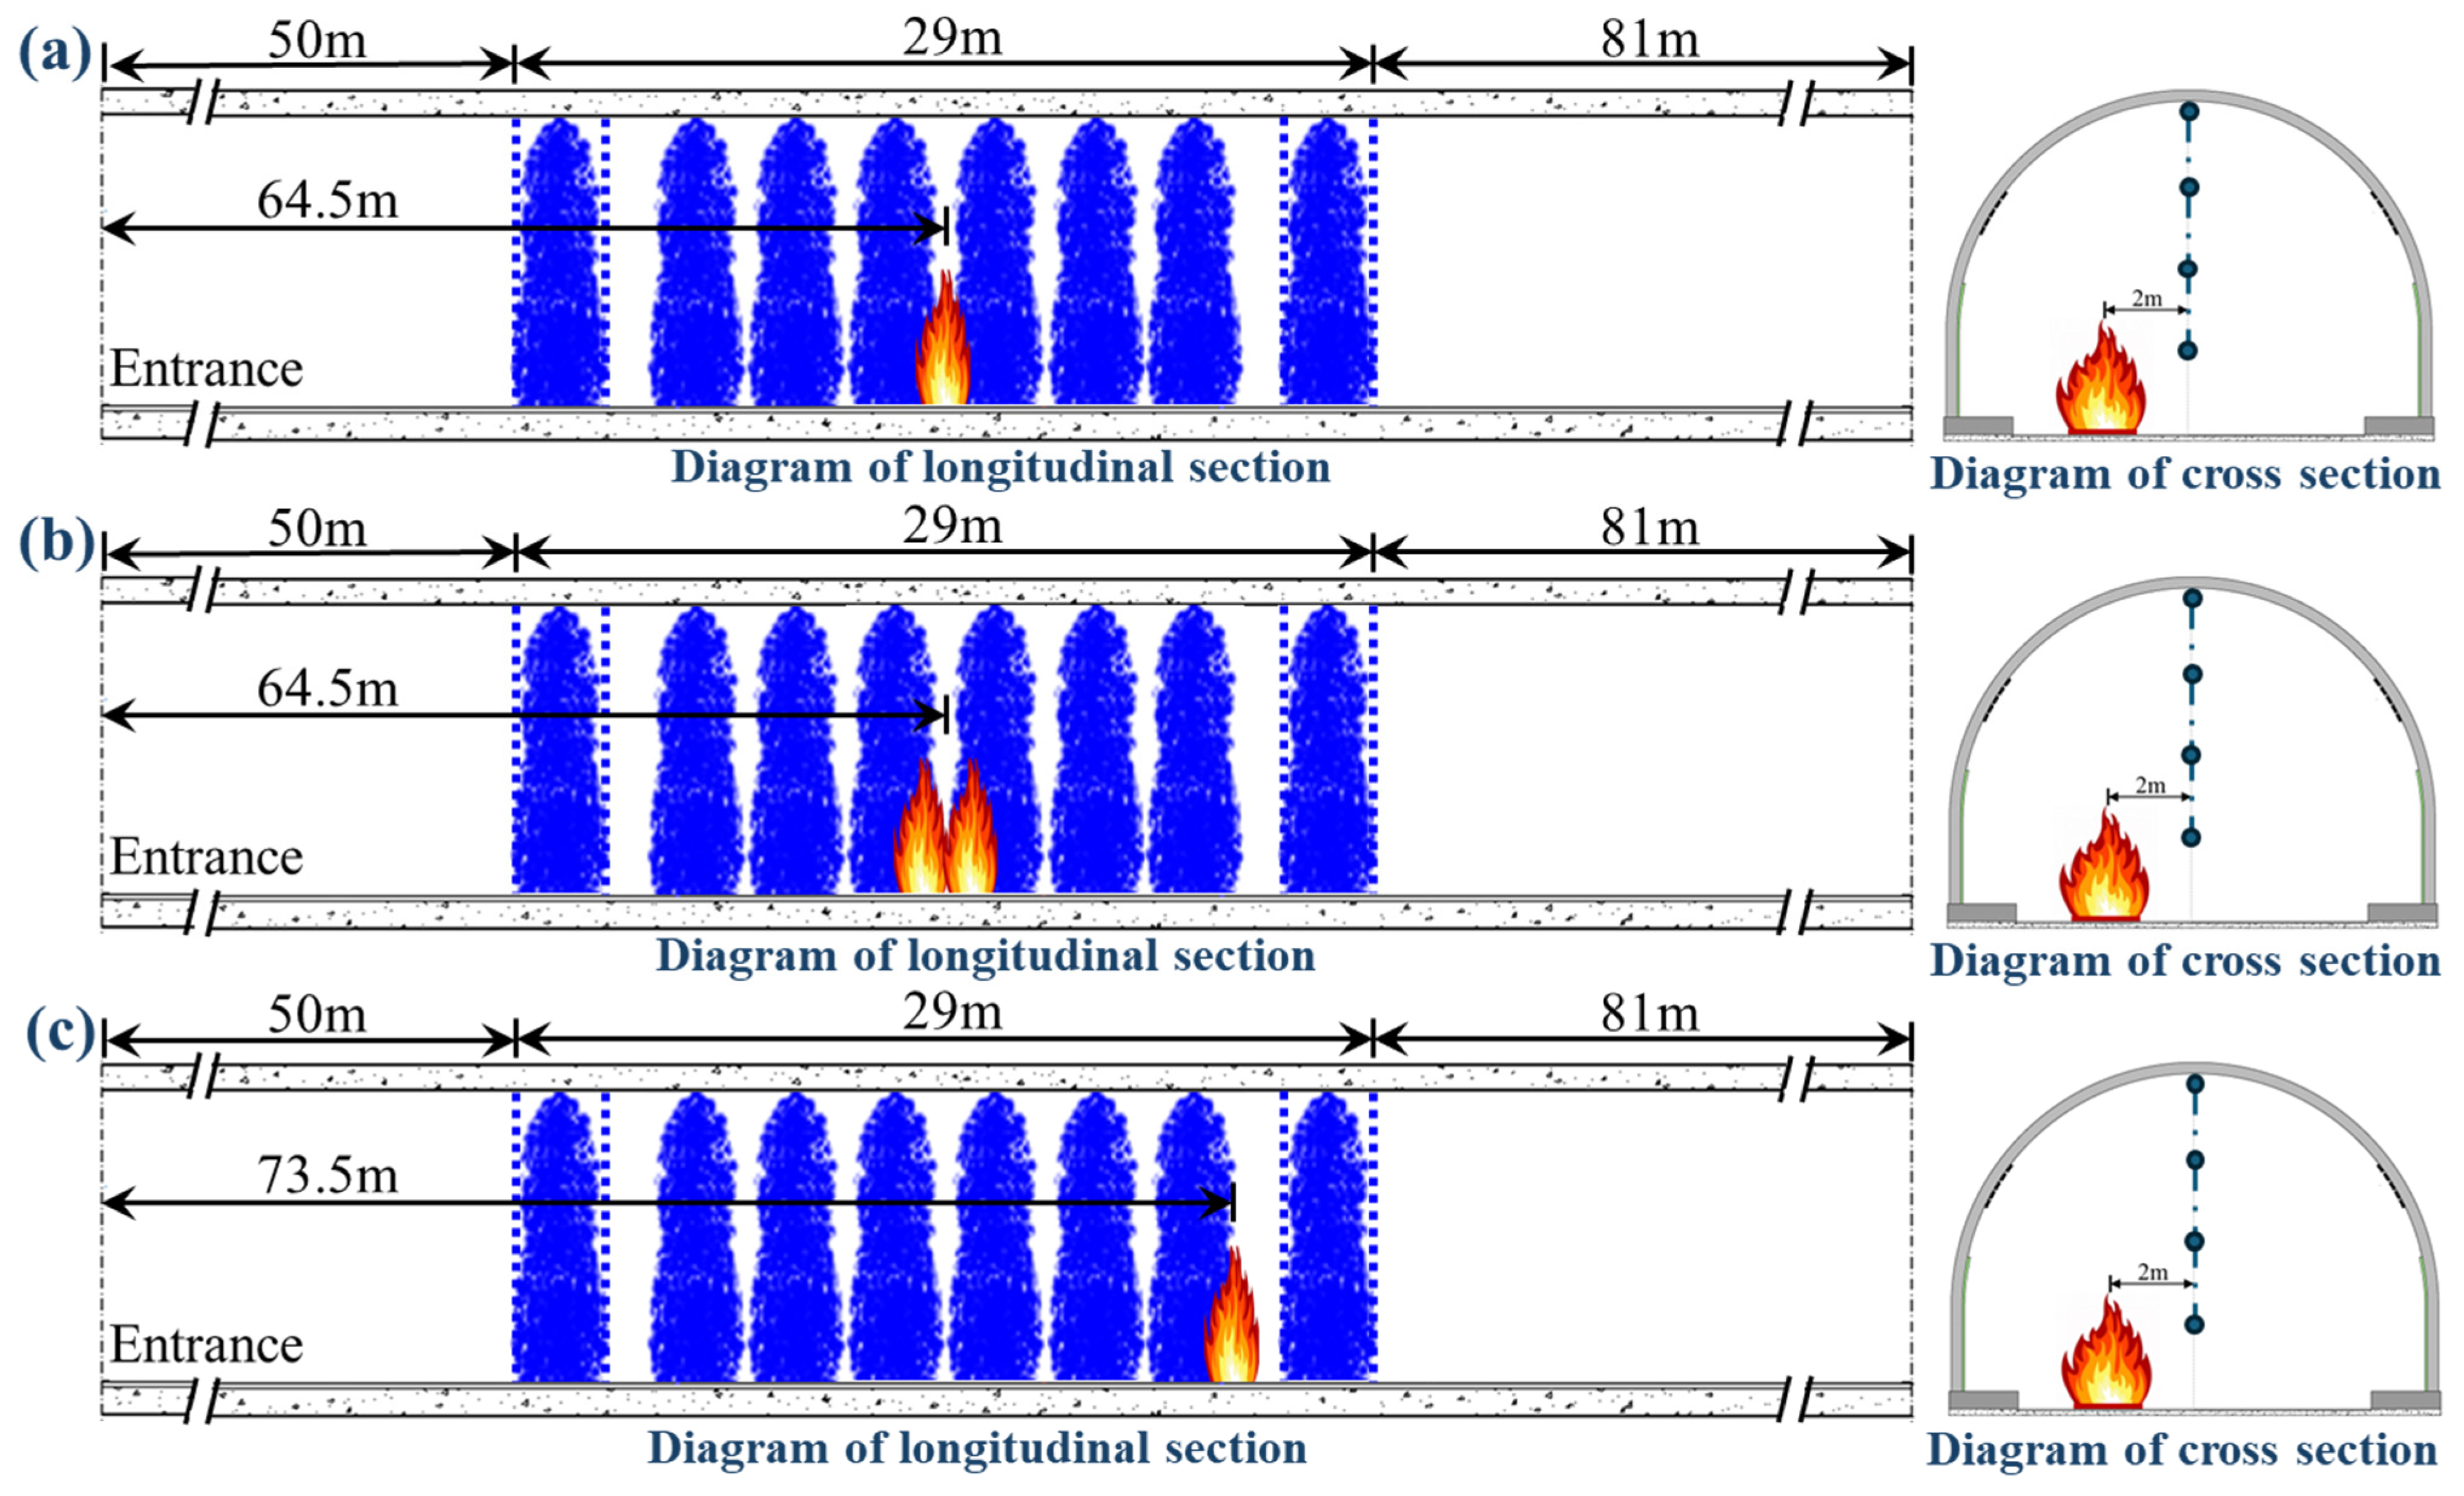
2. Fire Test Description
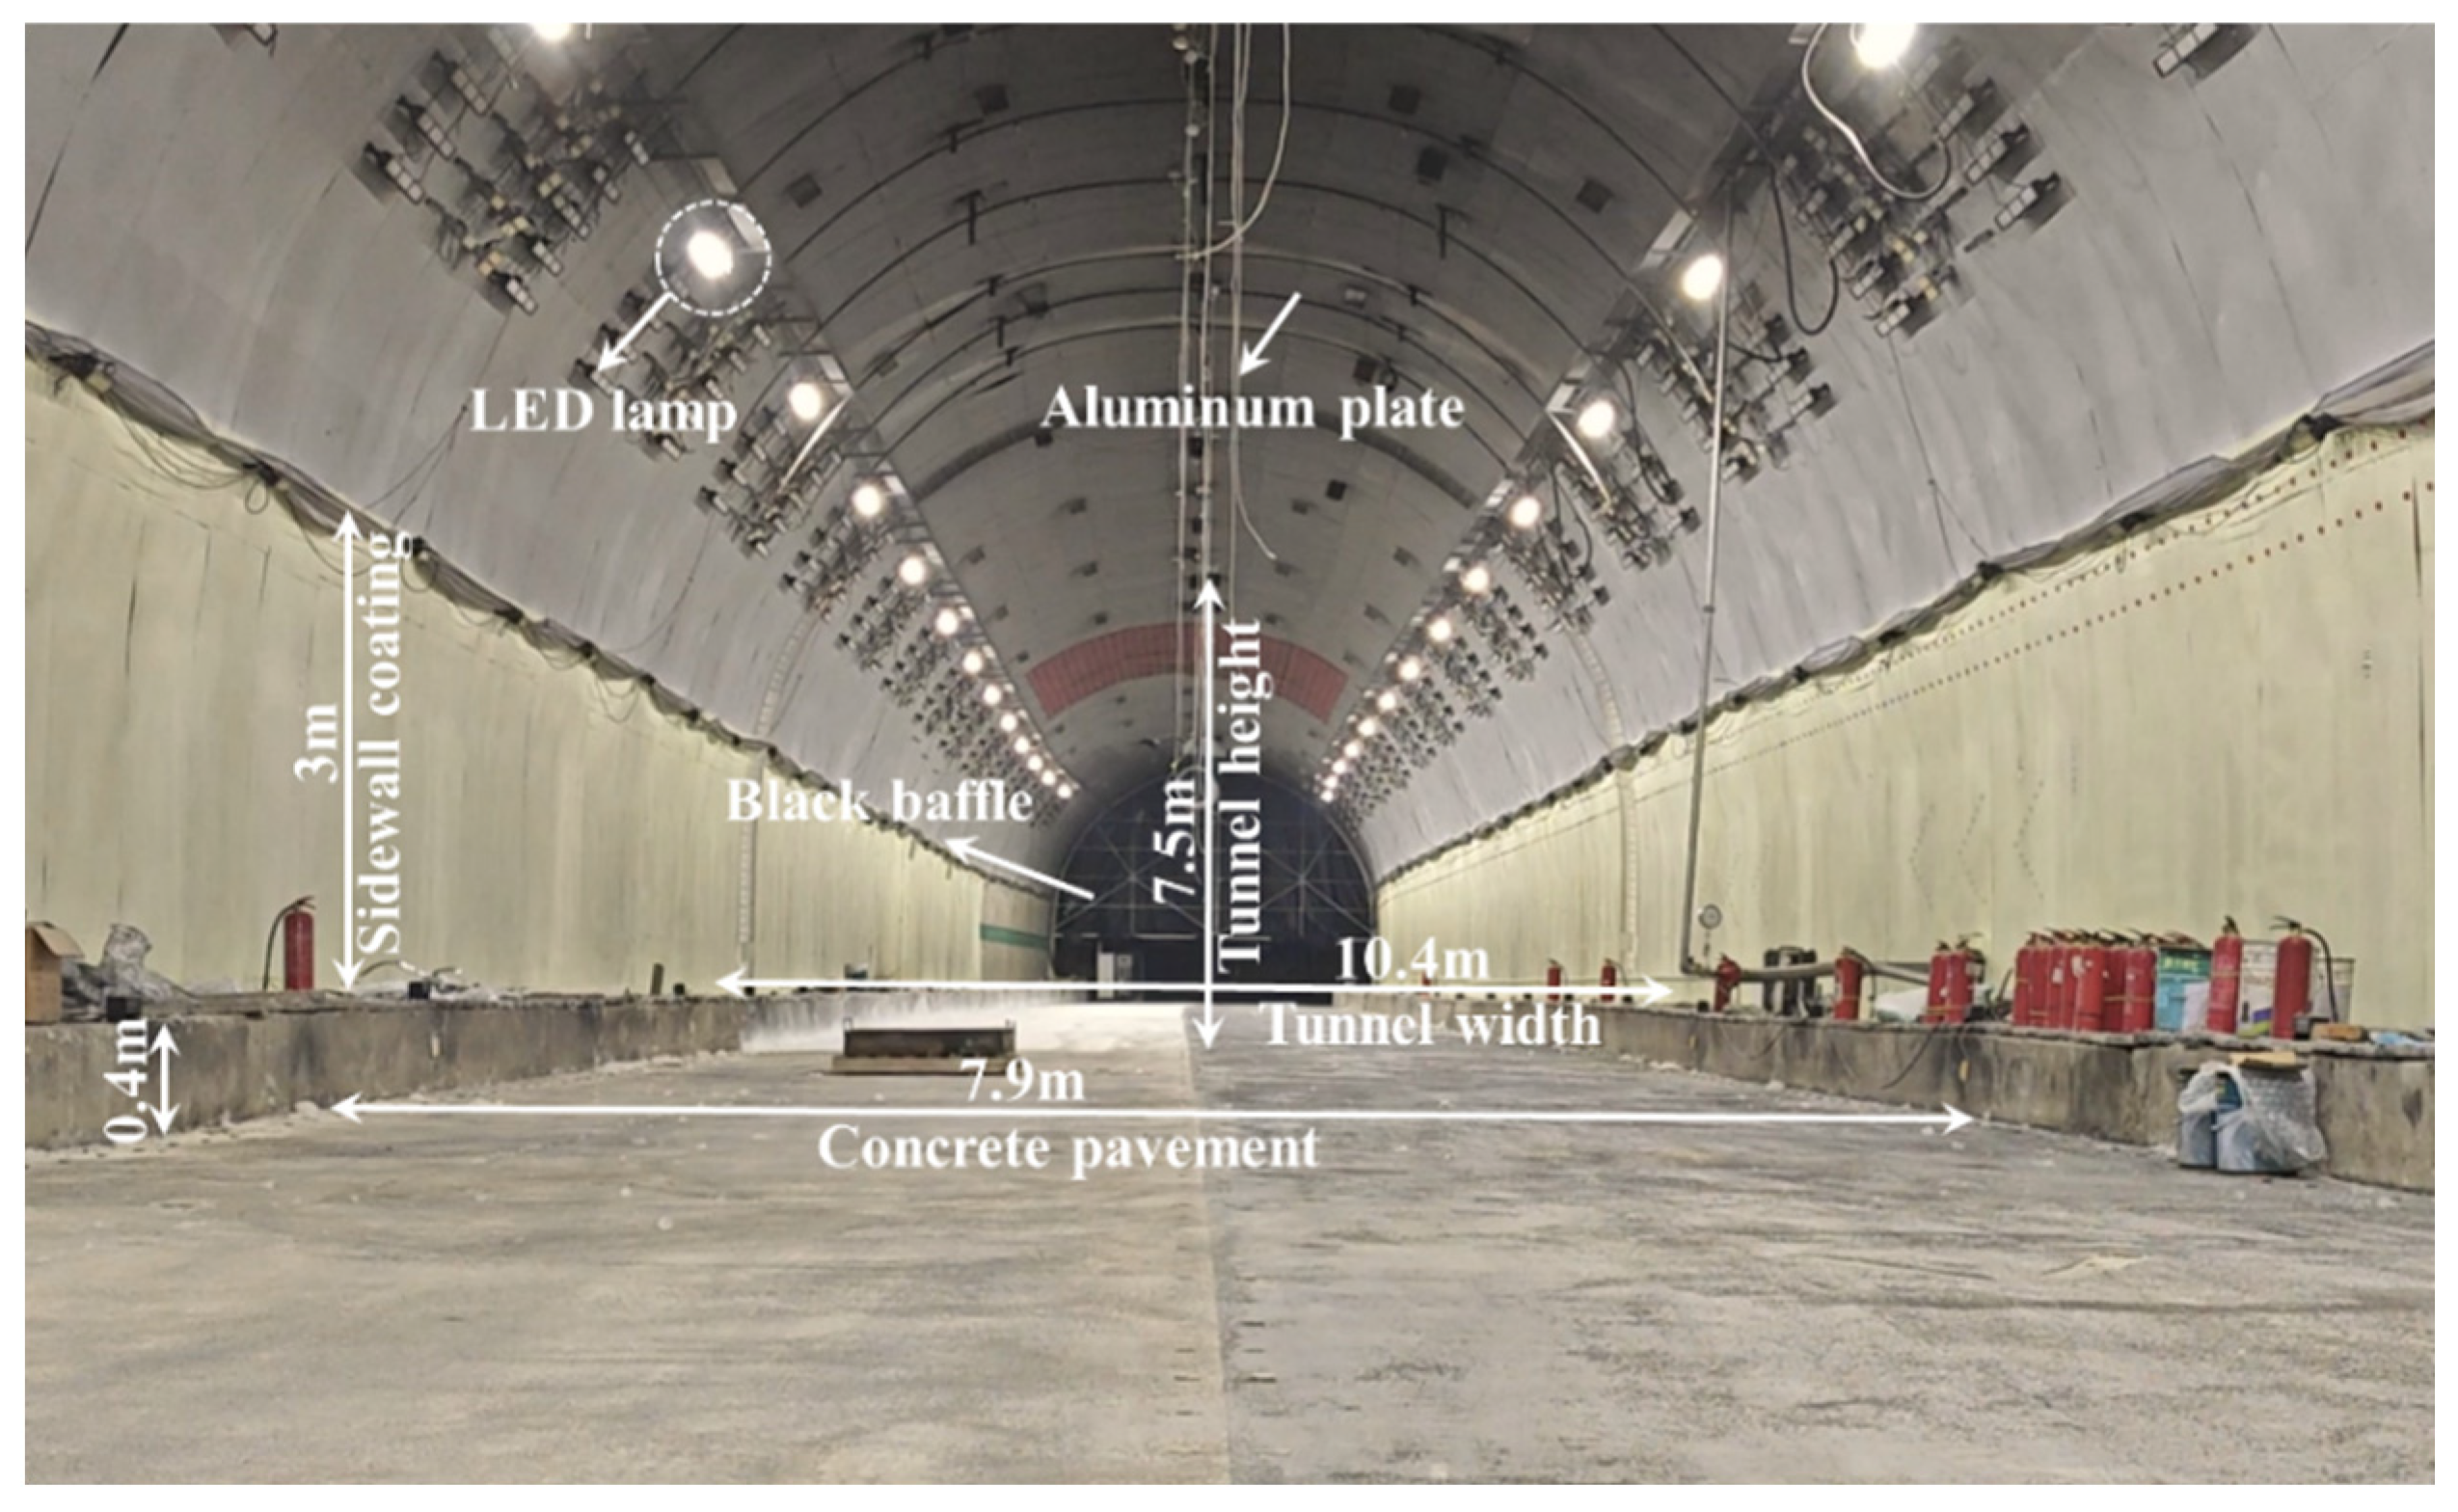
2.1. Full-Scale Test Tunnel
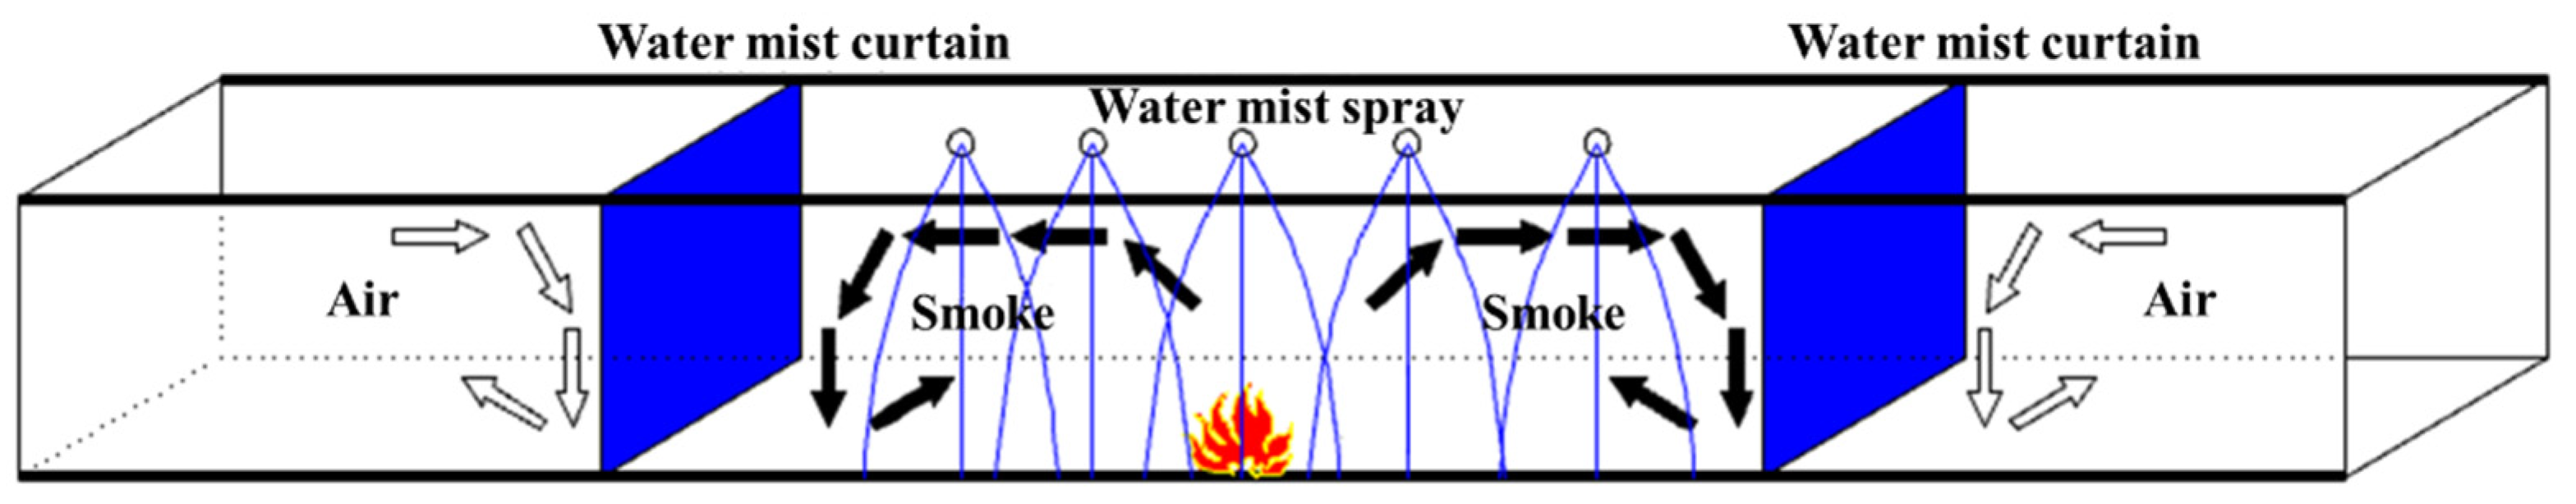
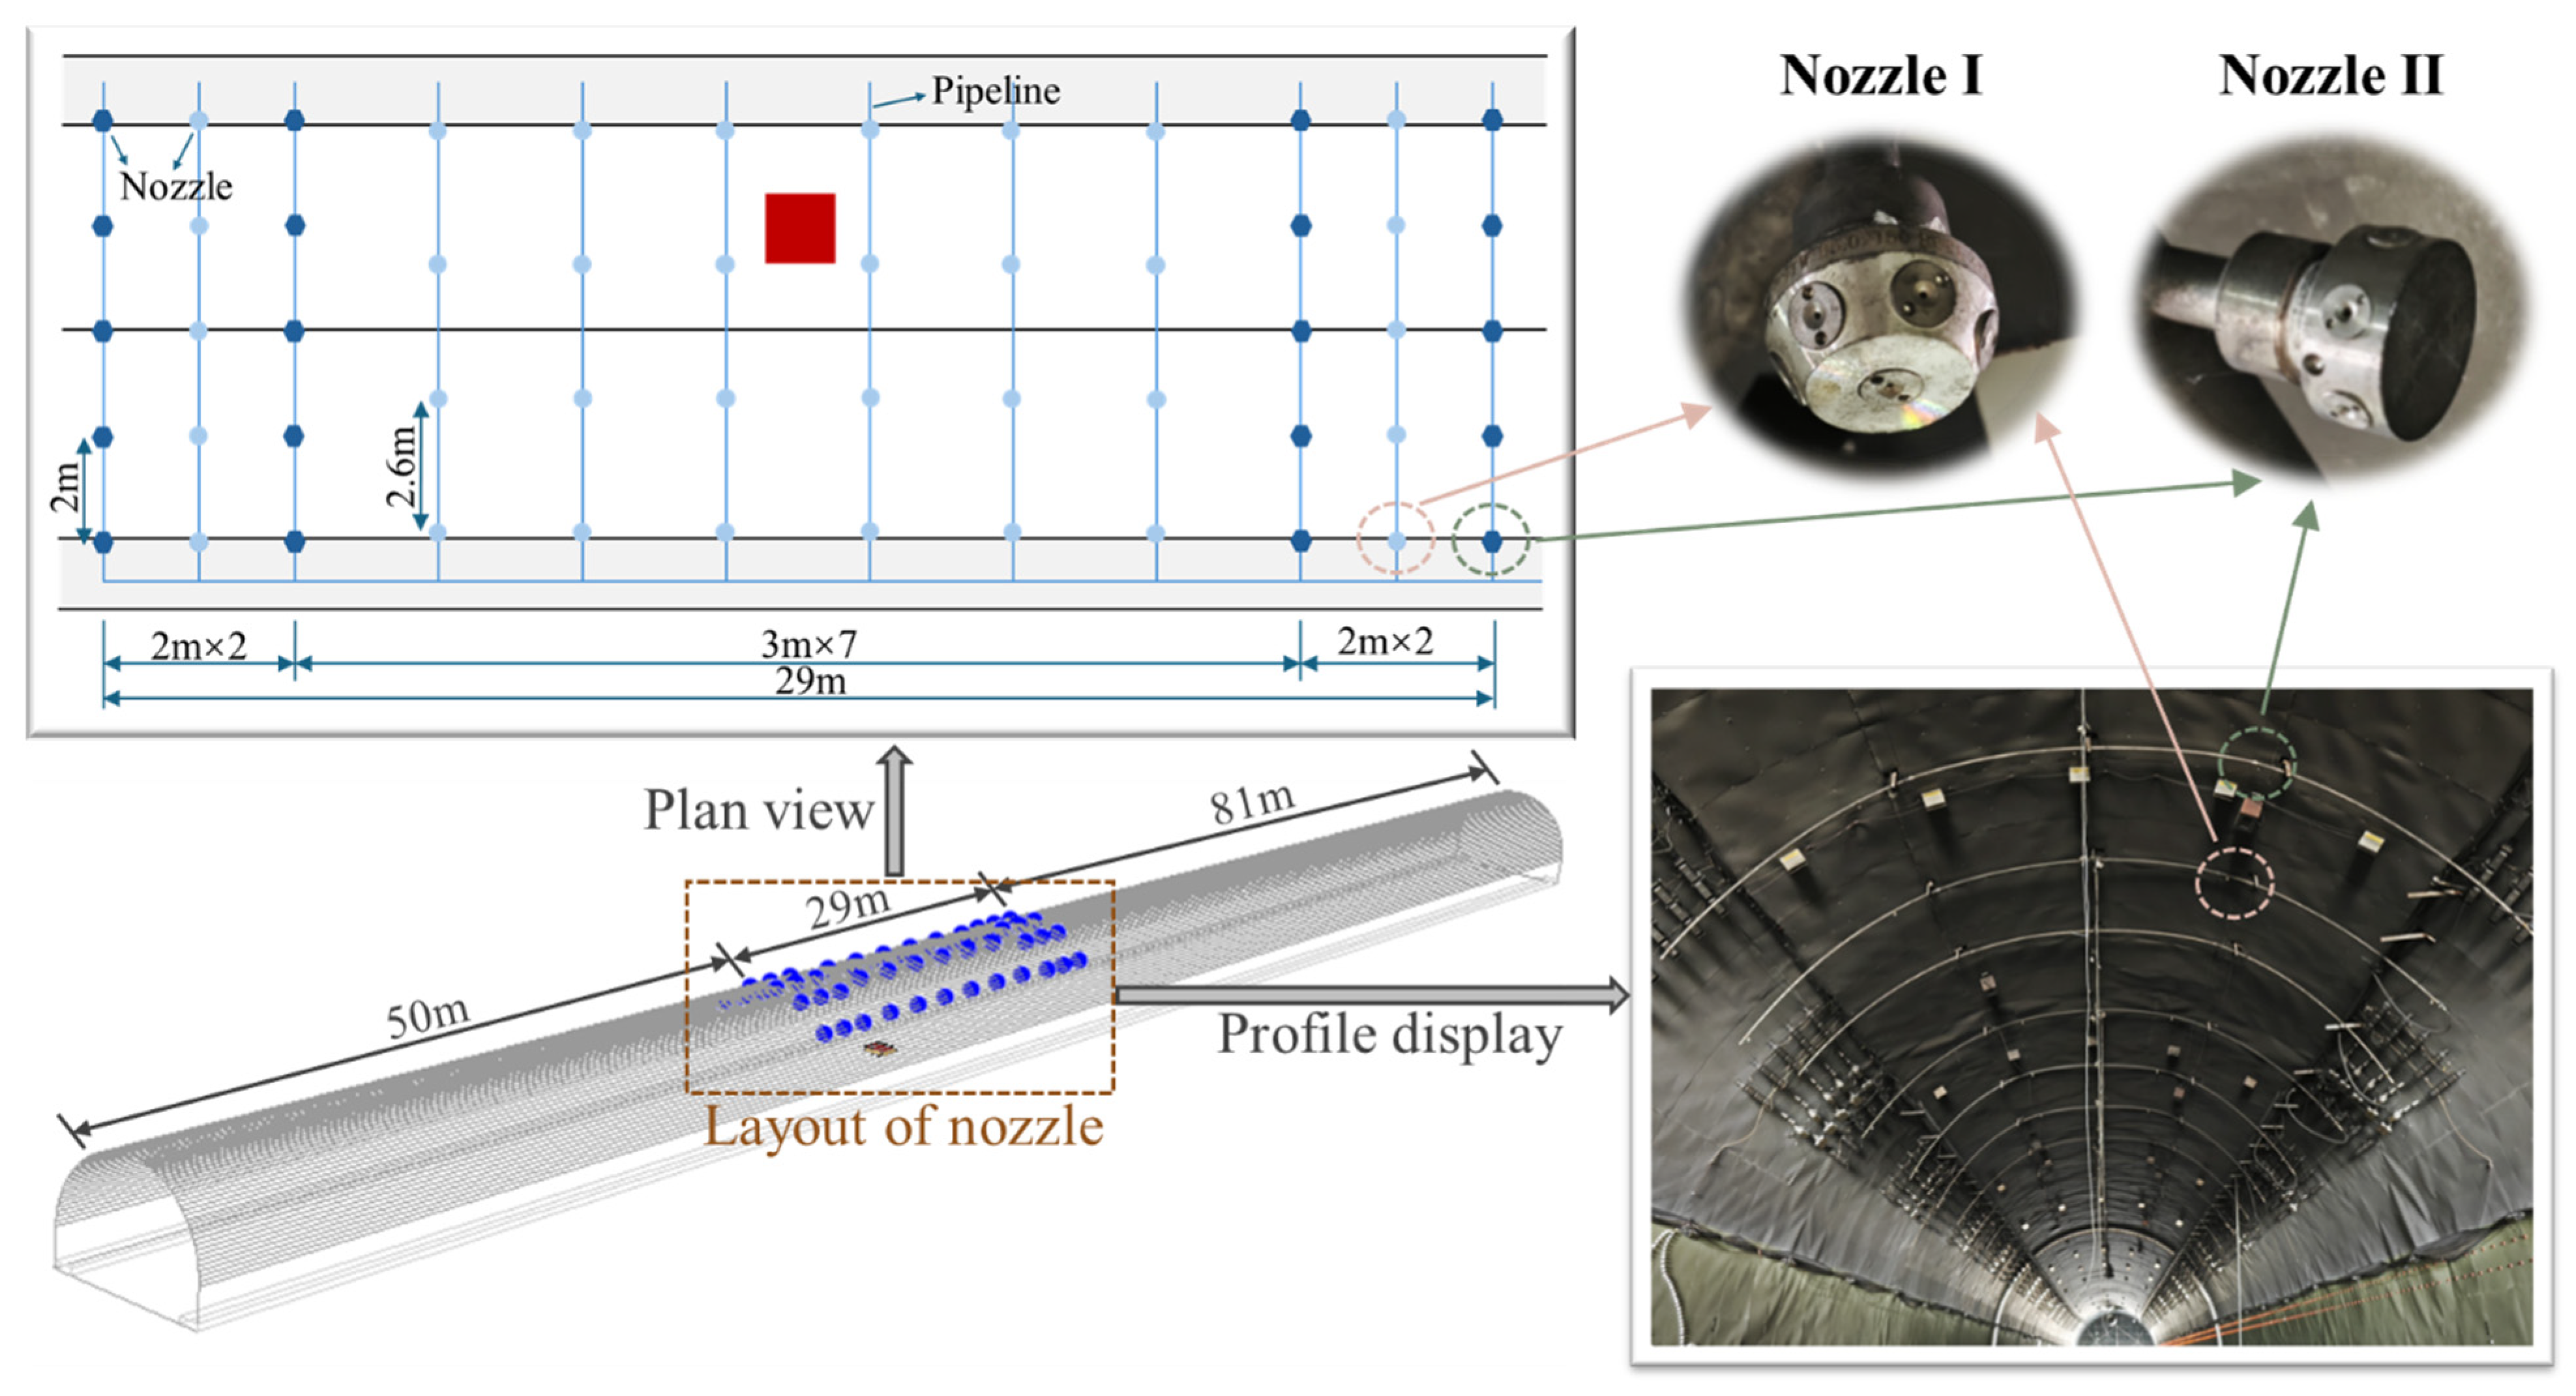
2.2. Water Mist Fire Fighting System (WMFFS)
2.3. Fire Source
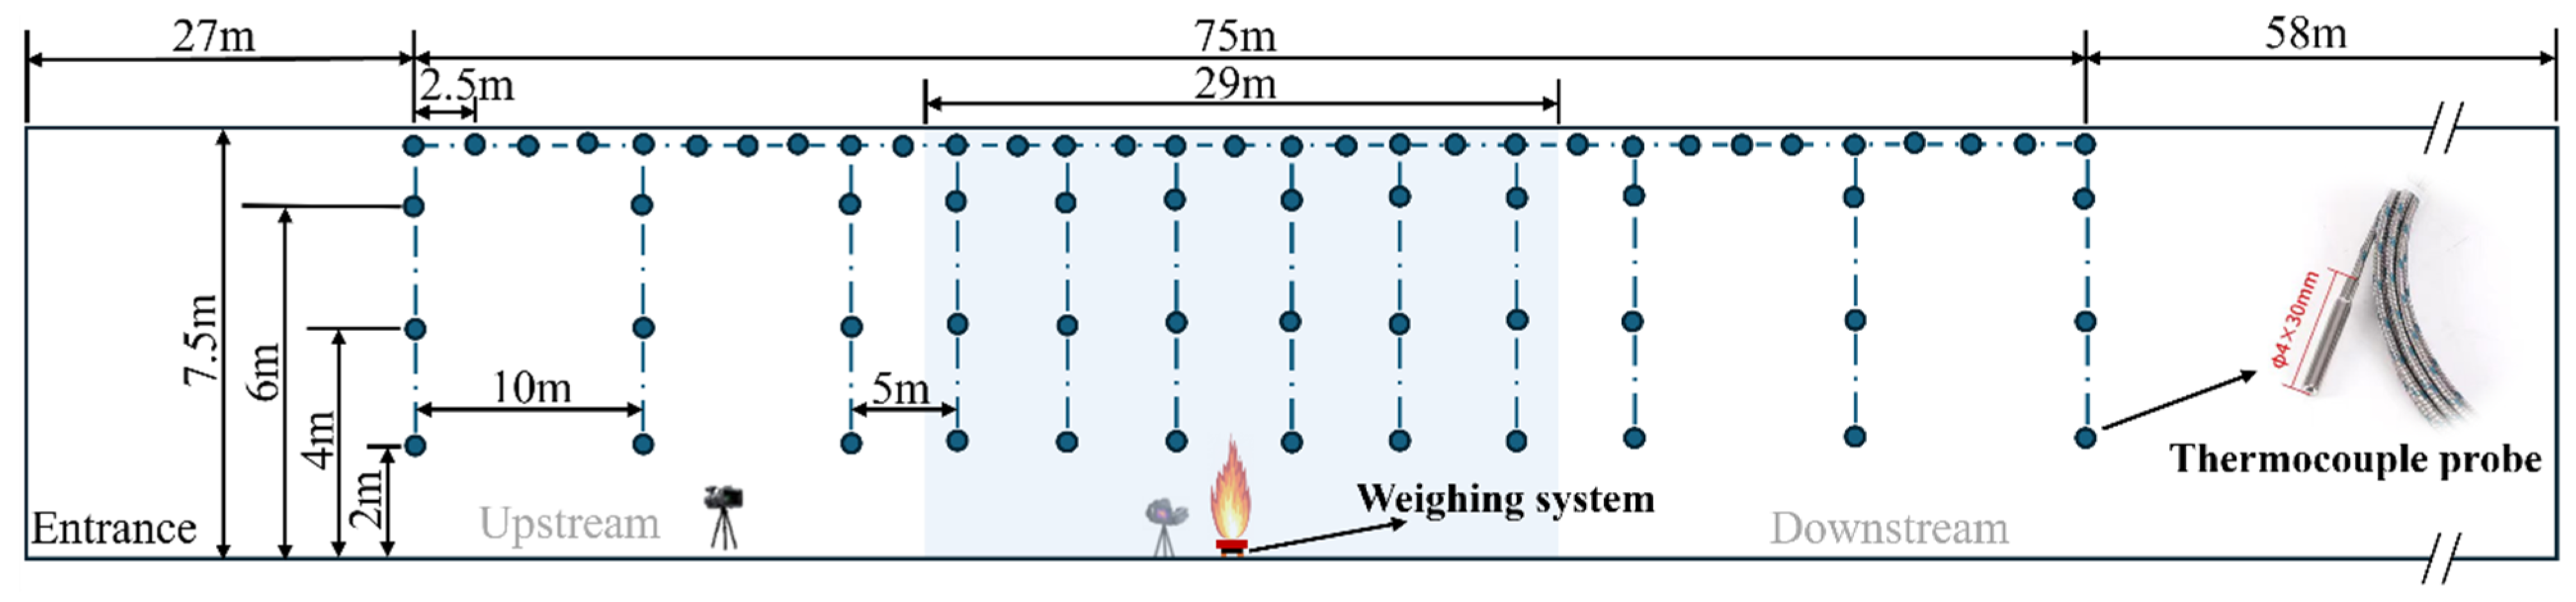
2.4. Test Methods
2.5. Process of Tests
3. Results
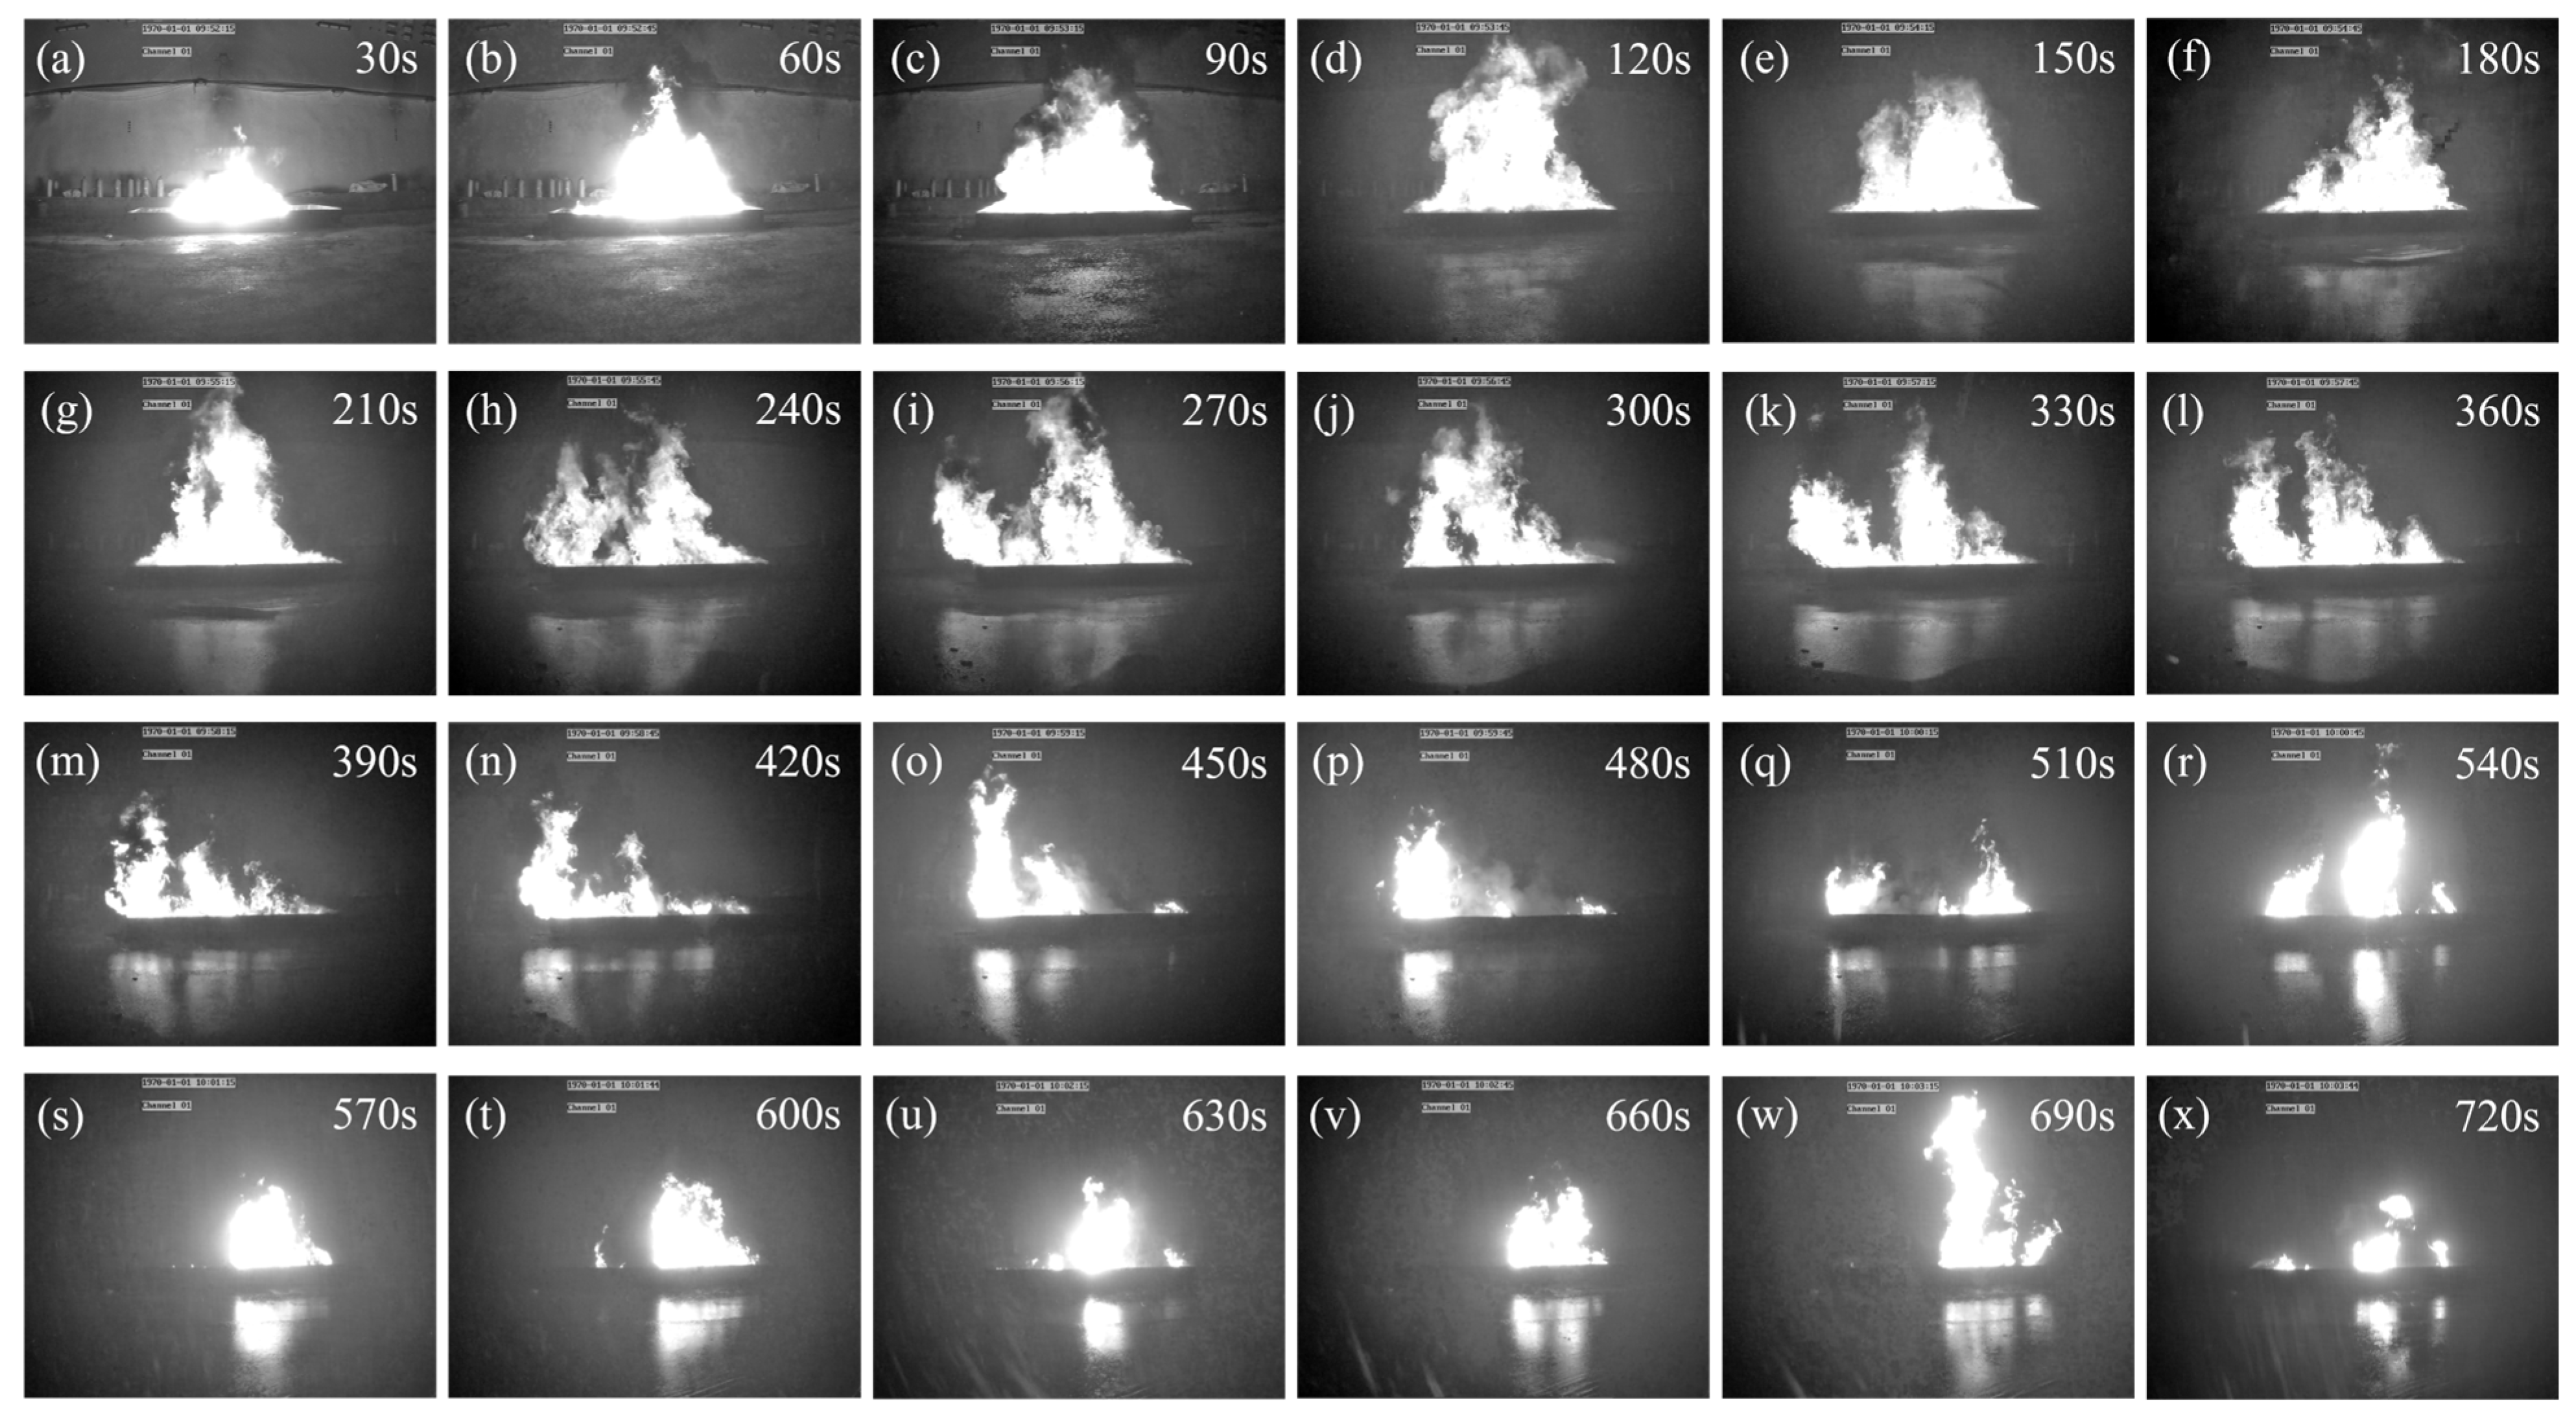
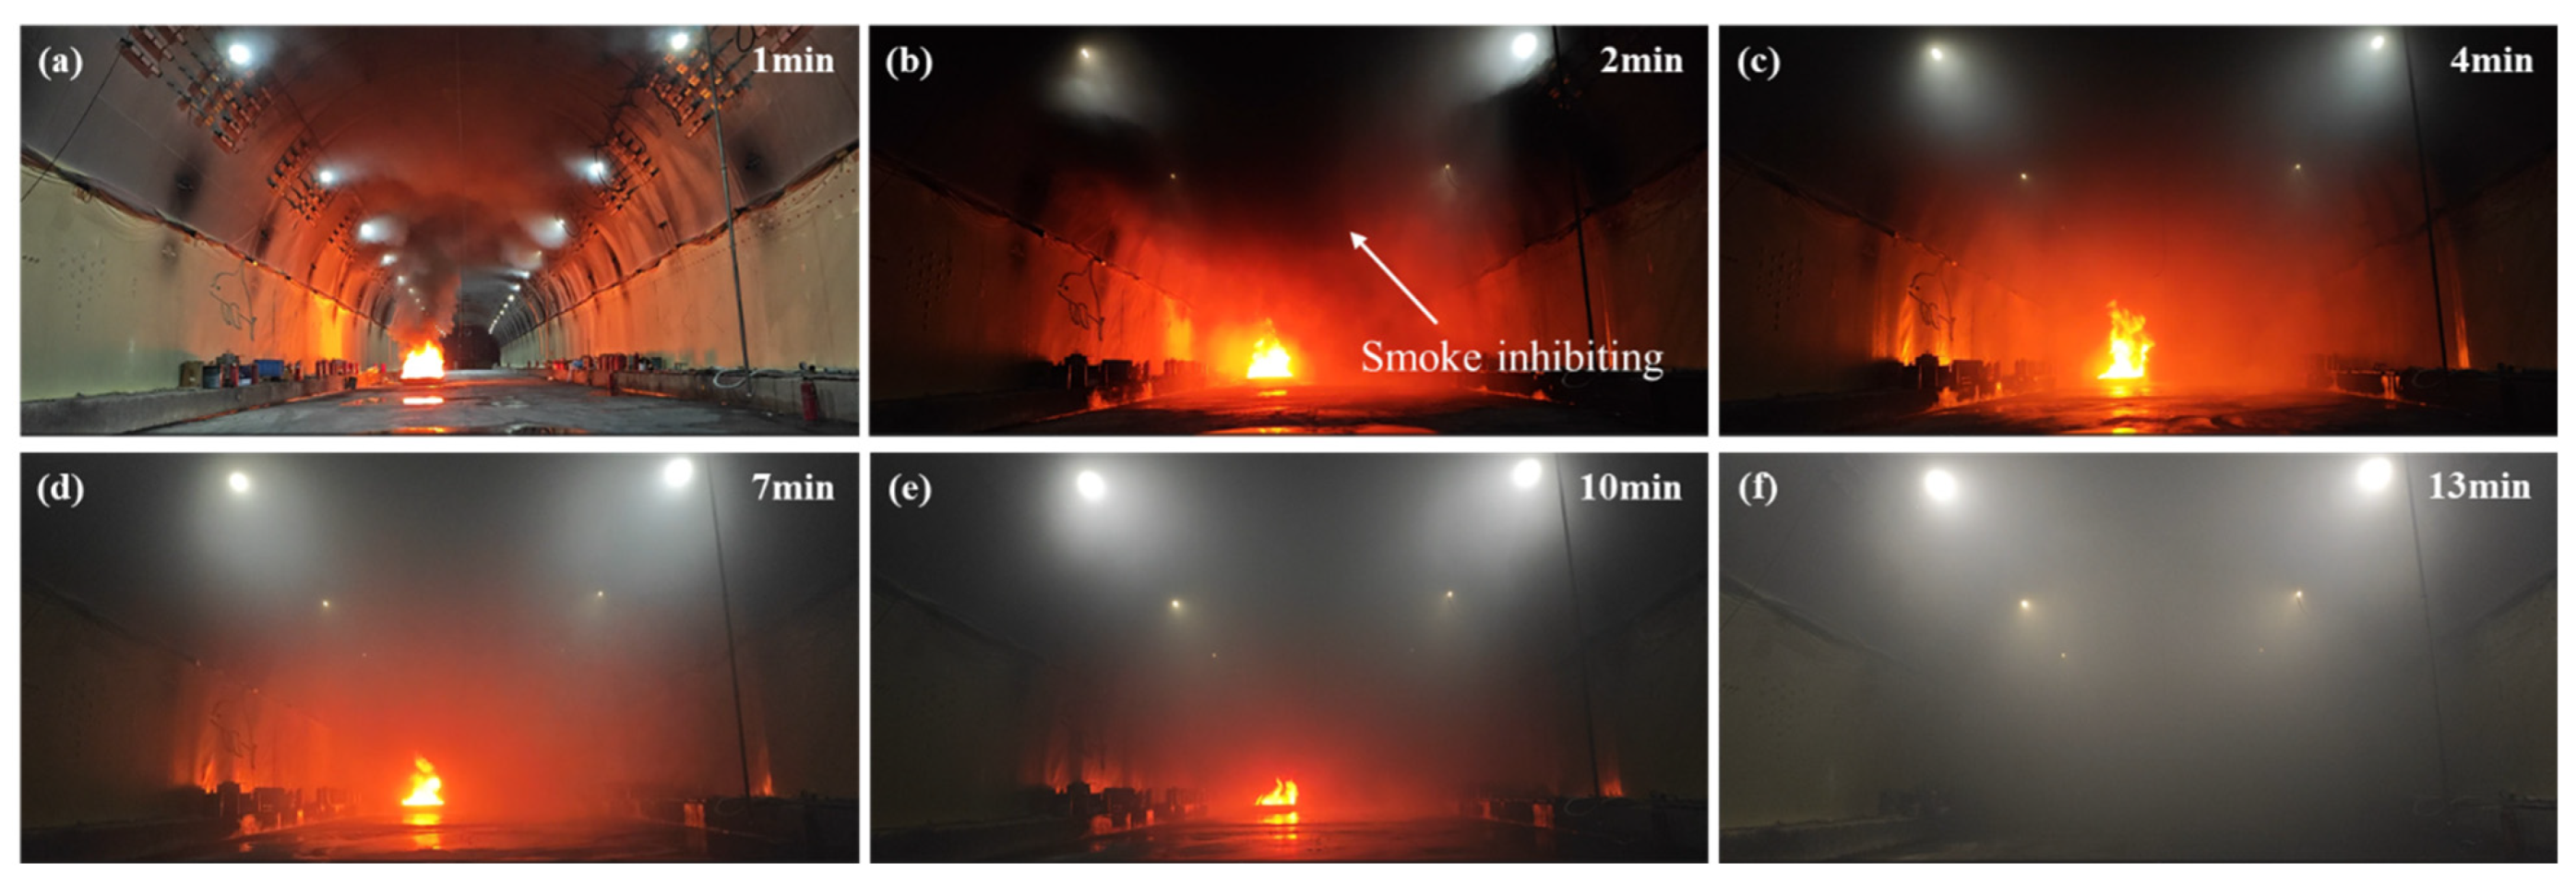
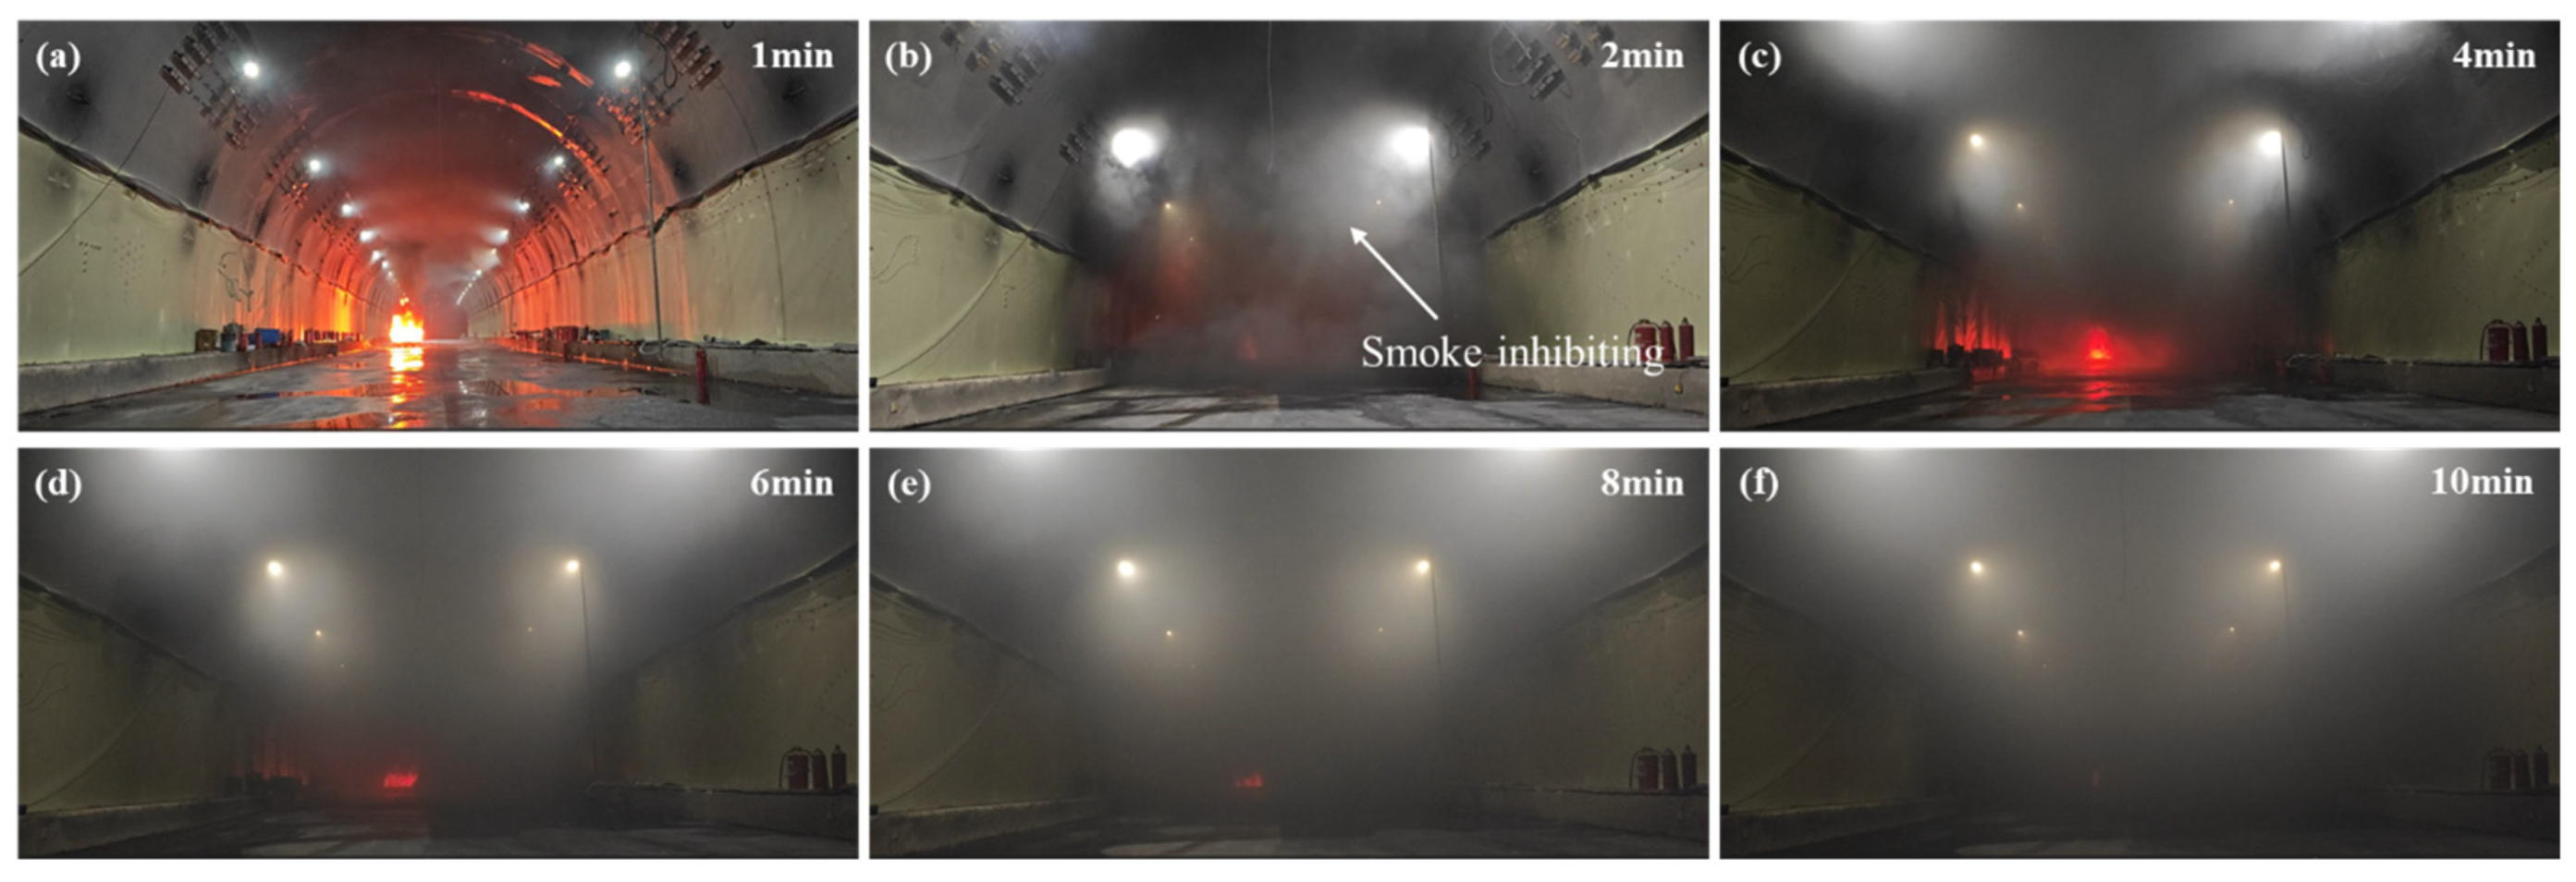
3.1. Process of Fire Source Suppression by WMFFS
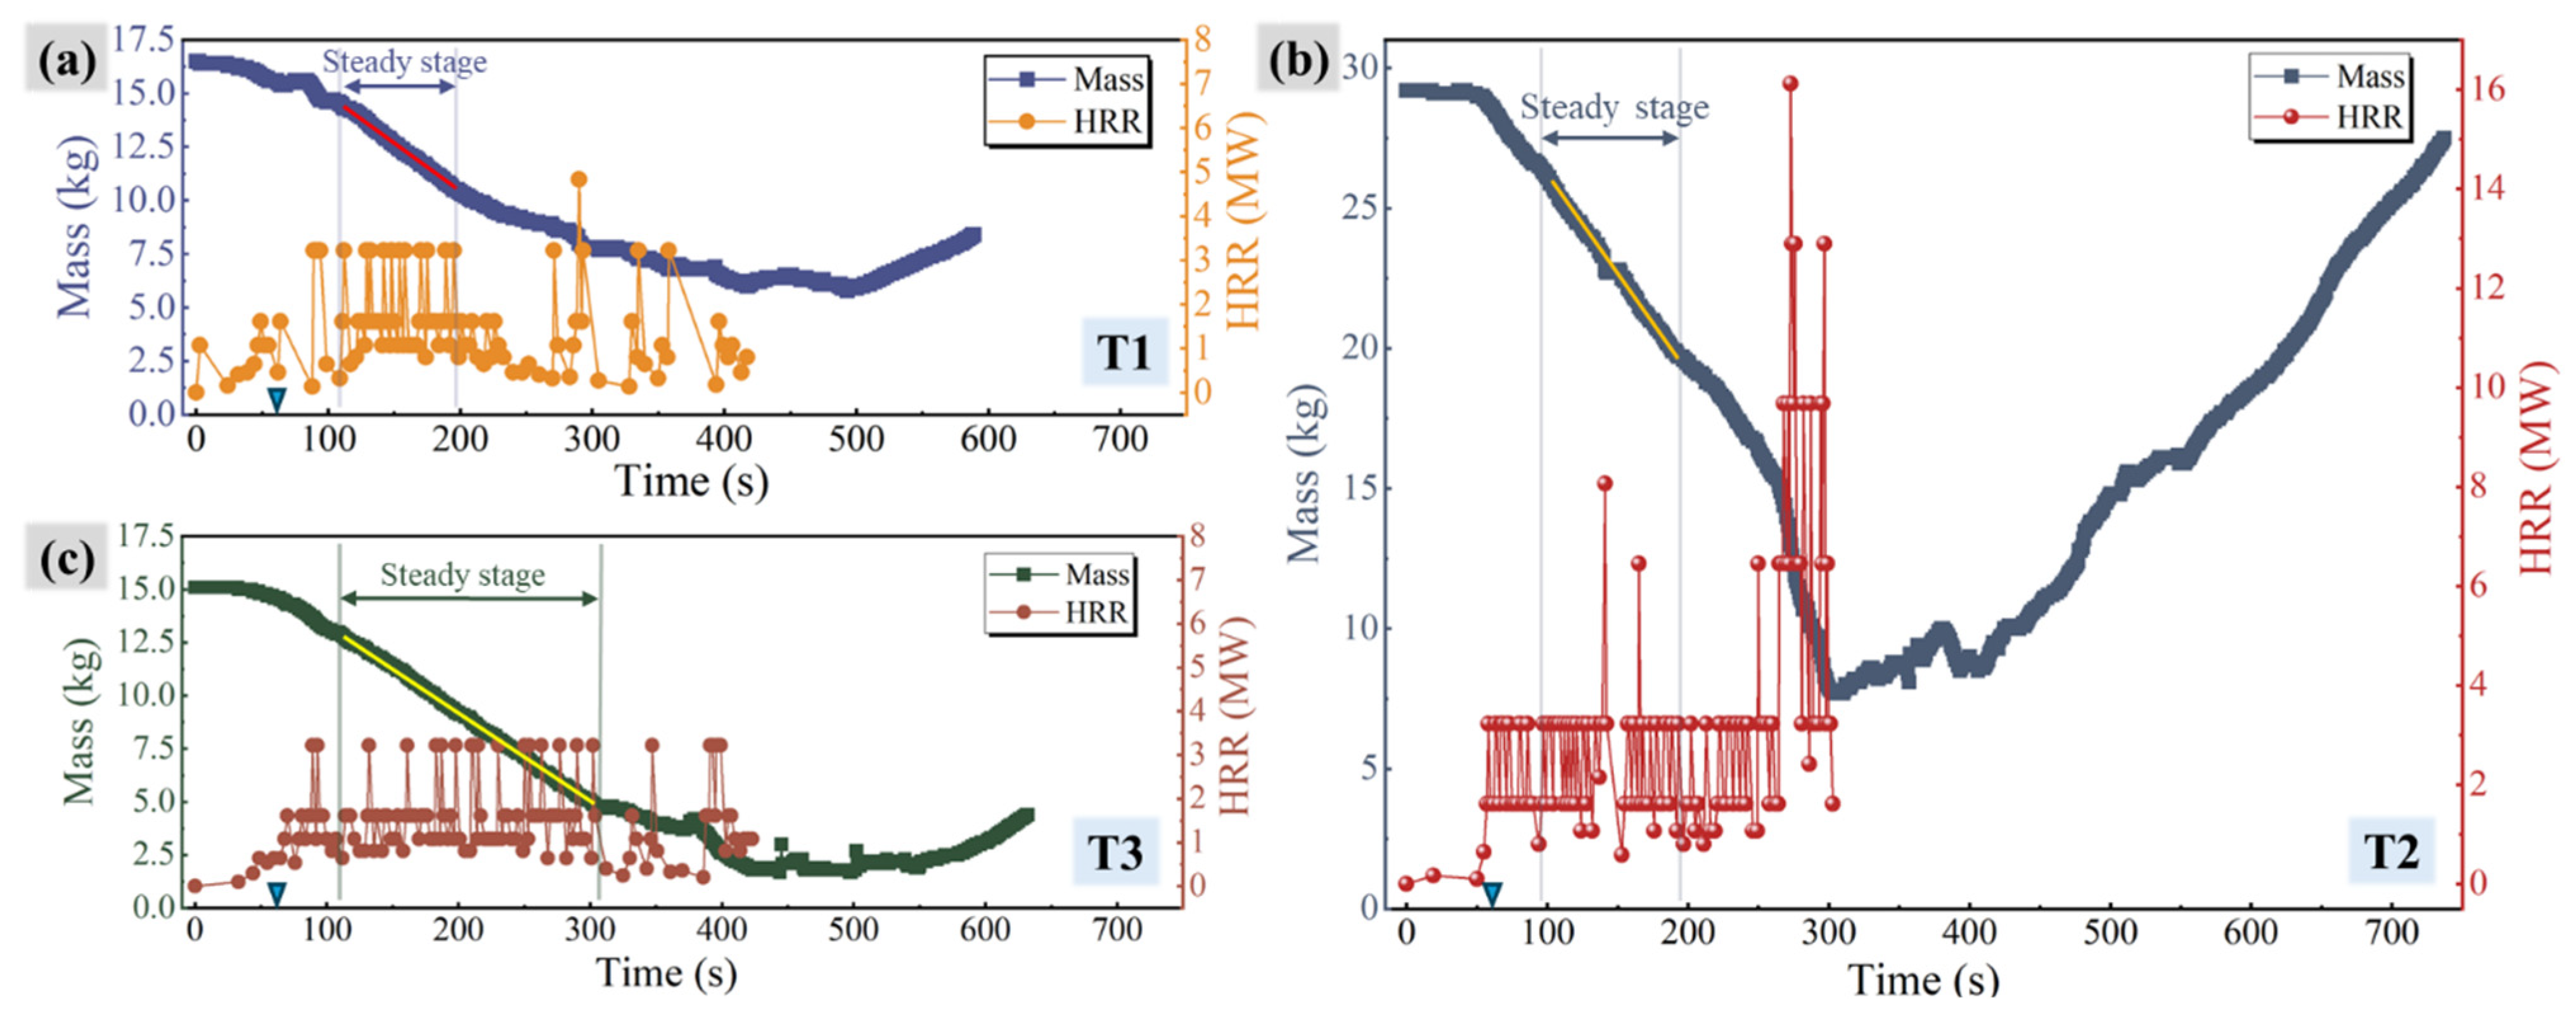
3.2. HRR
3.3. Tunnel Ceiling Temperature
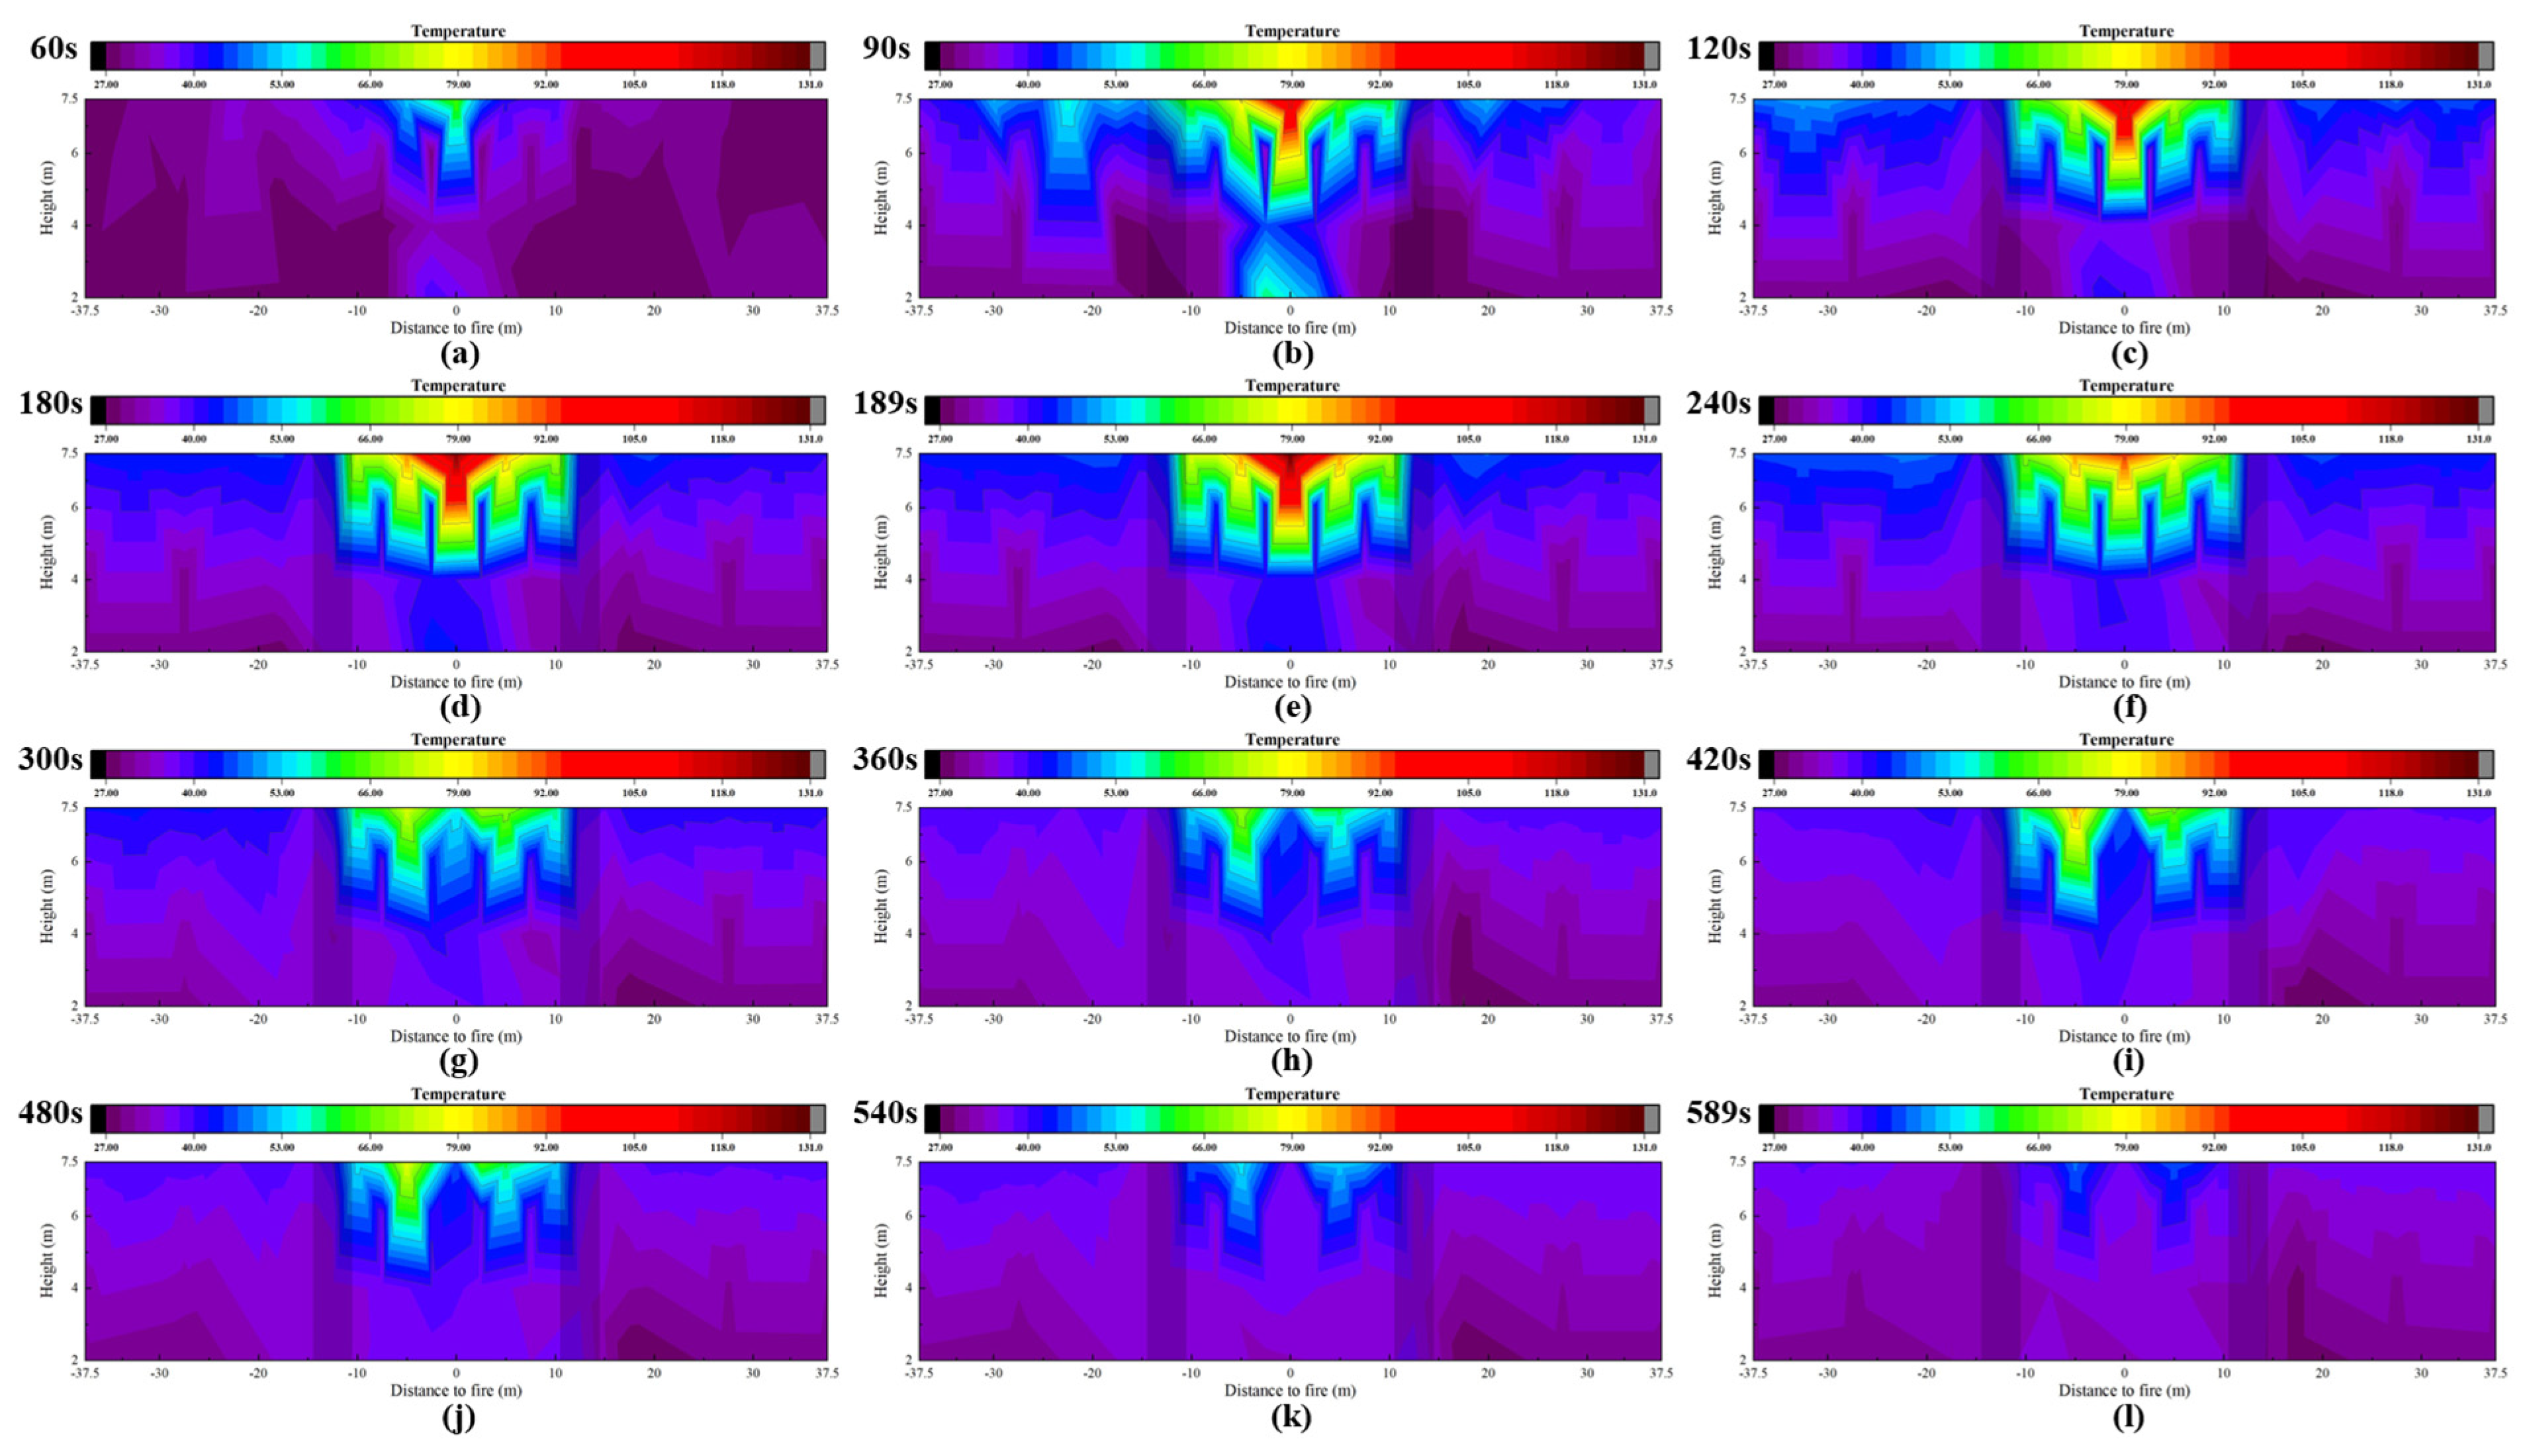
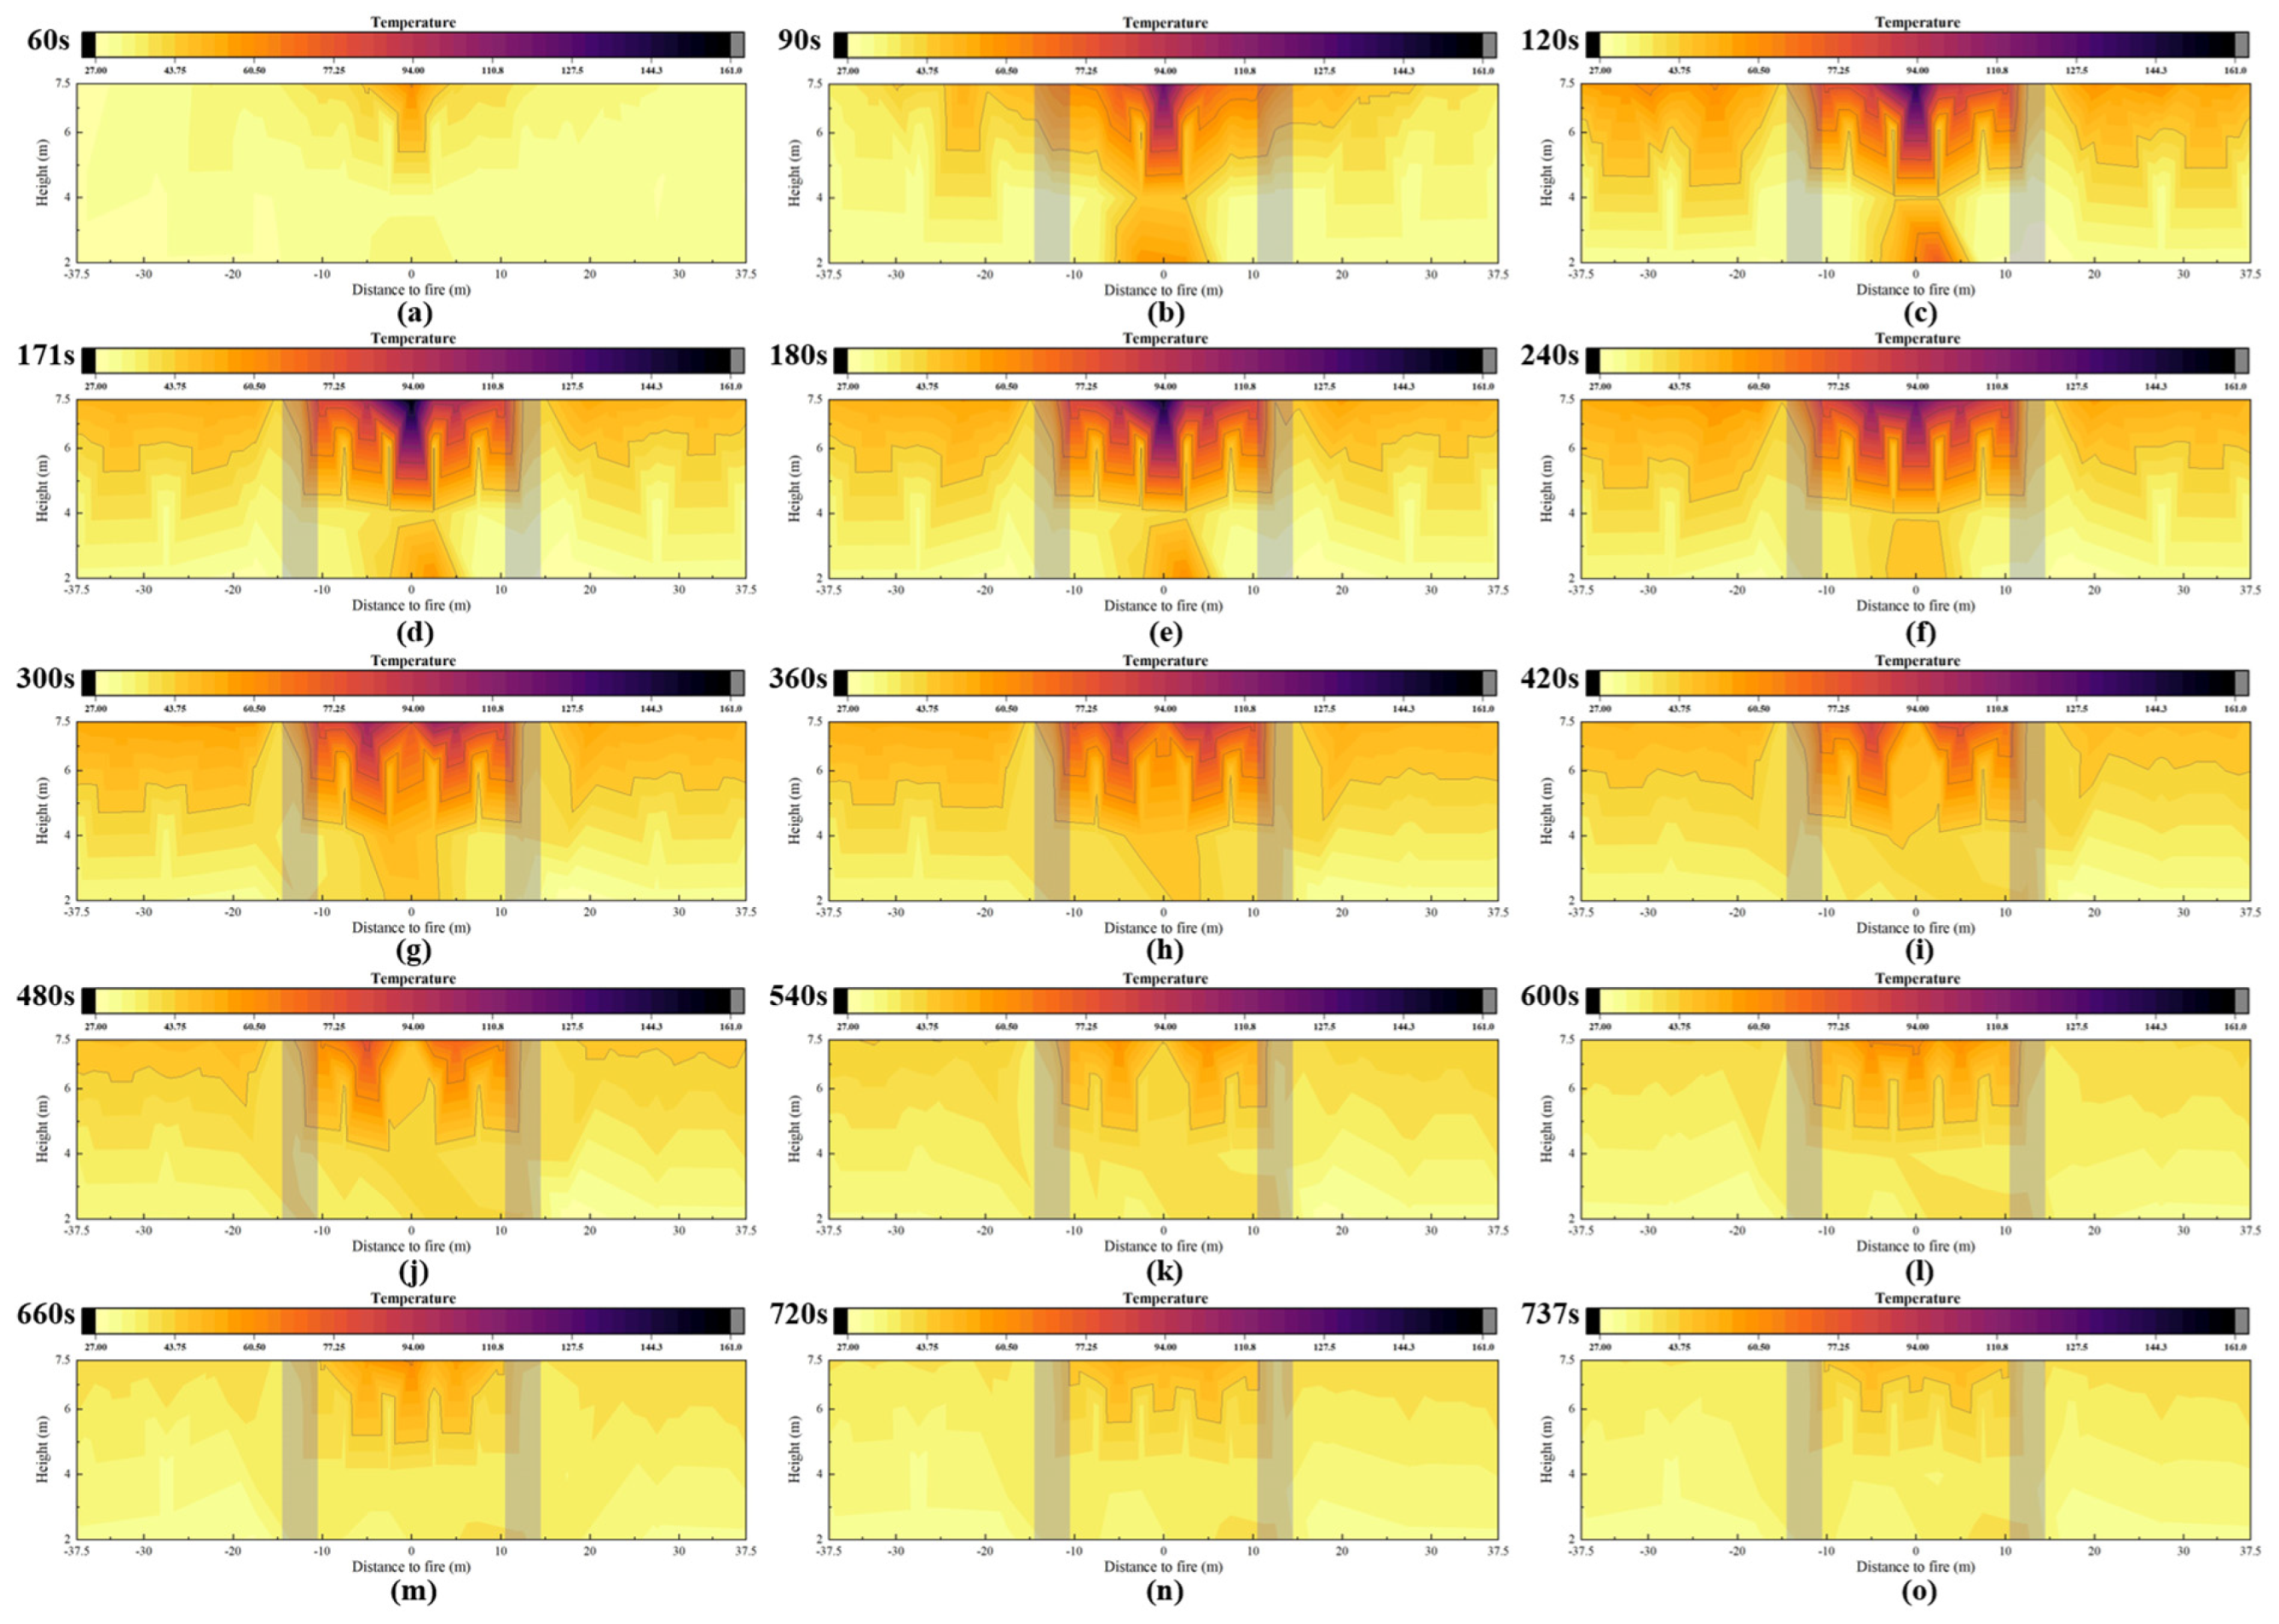
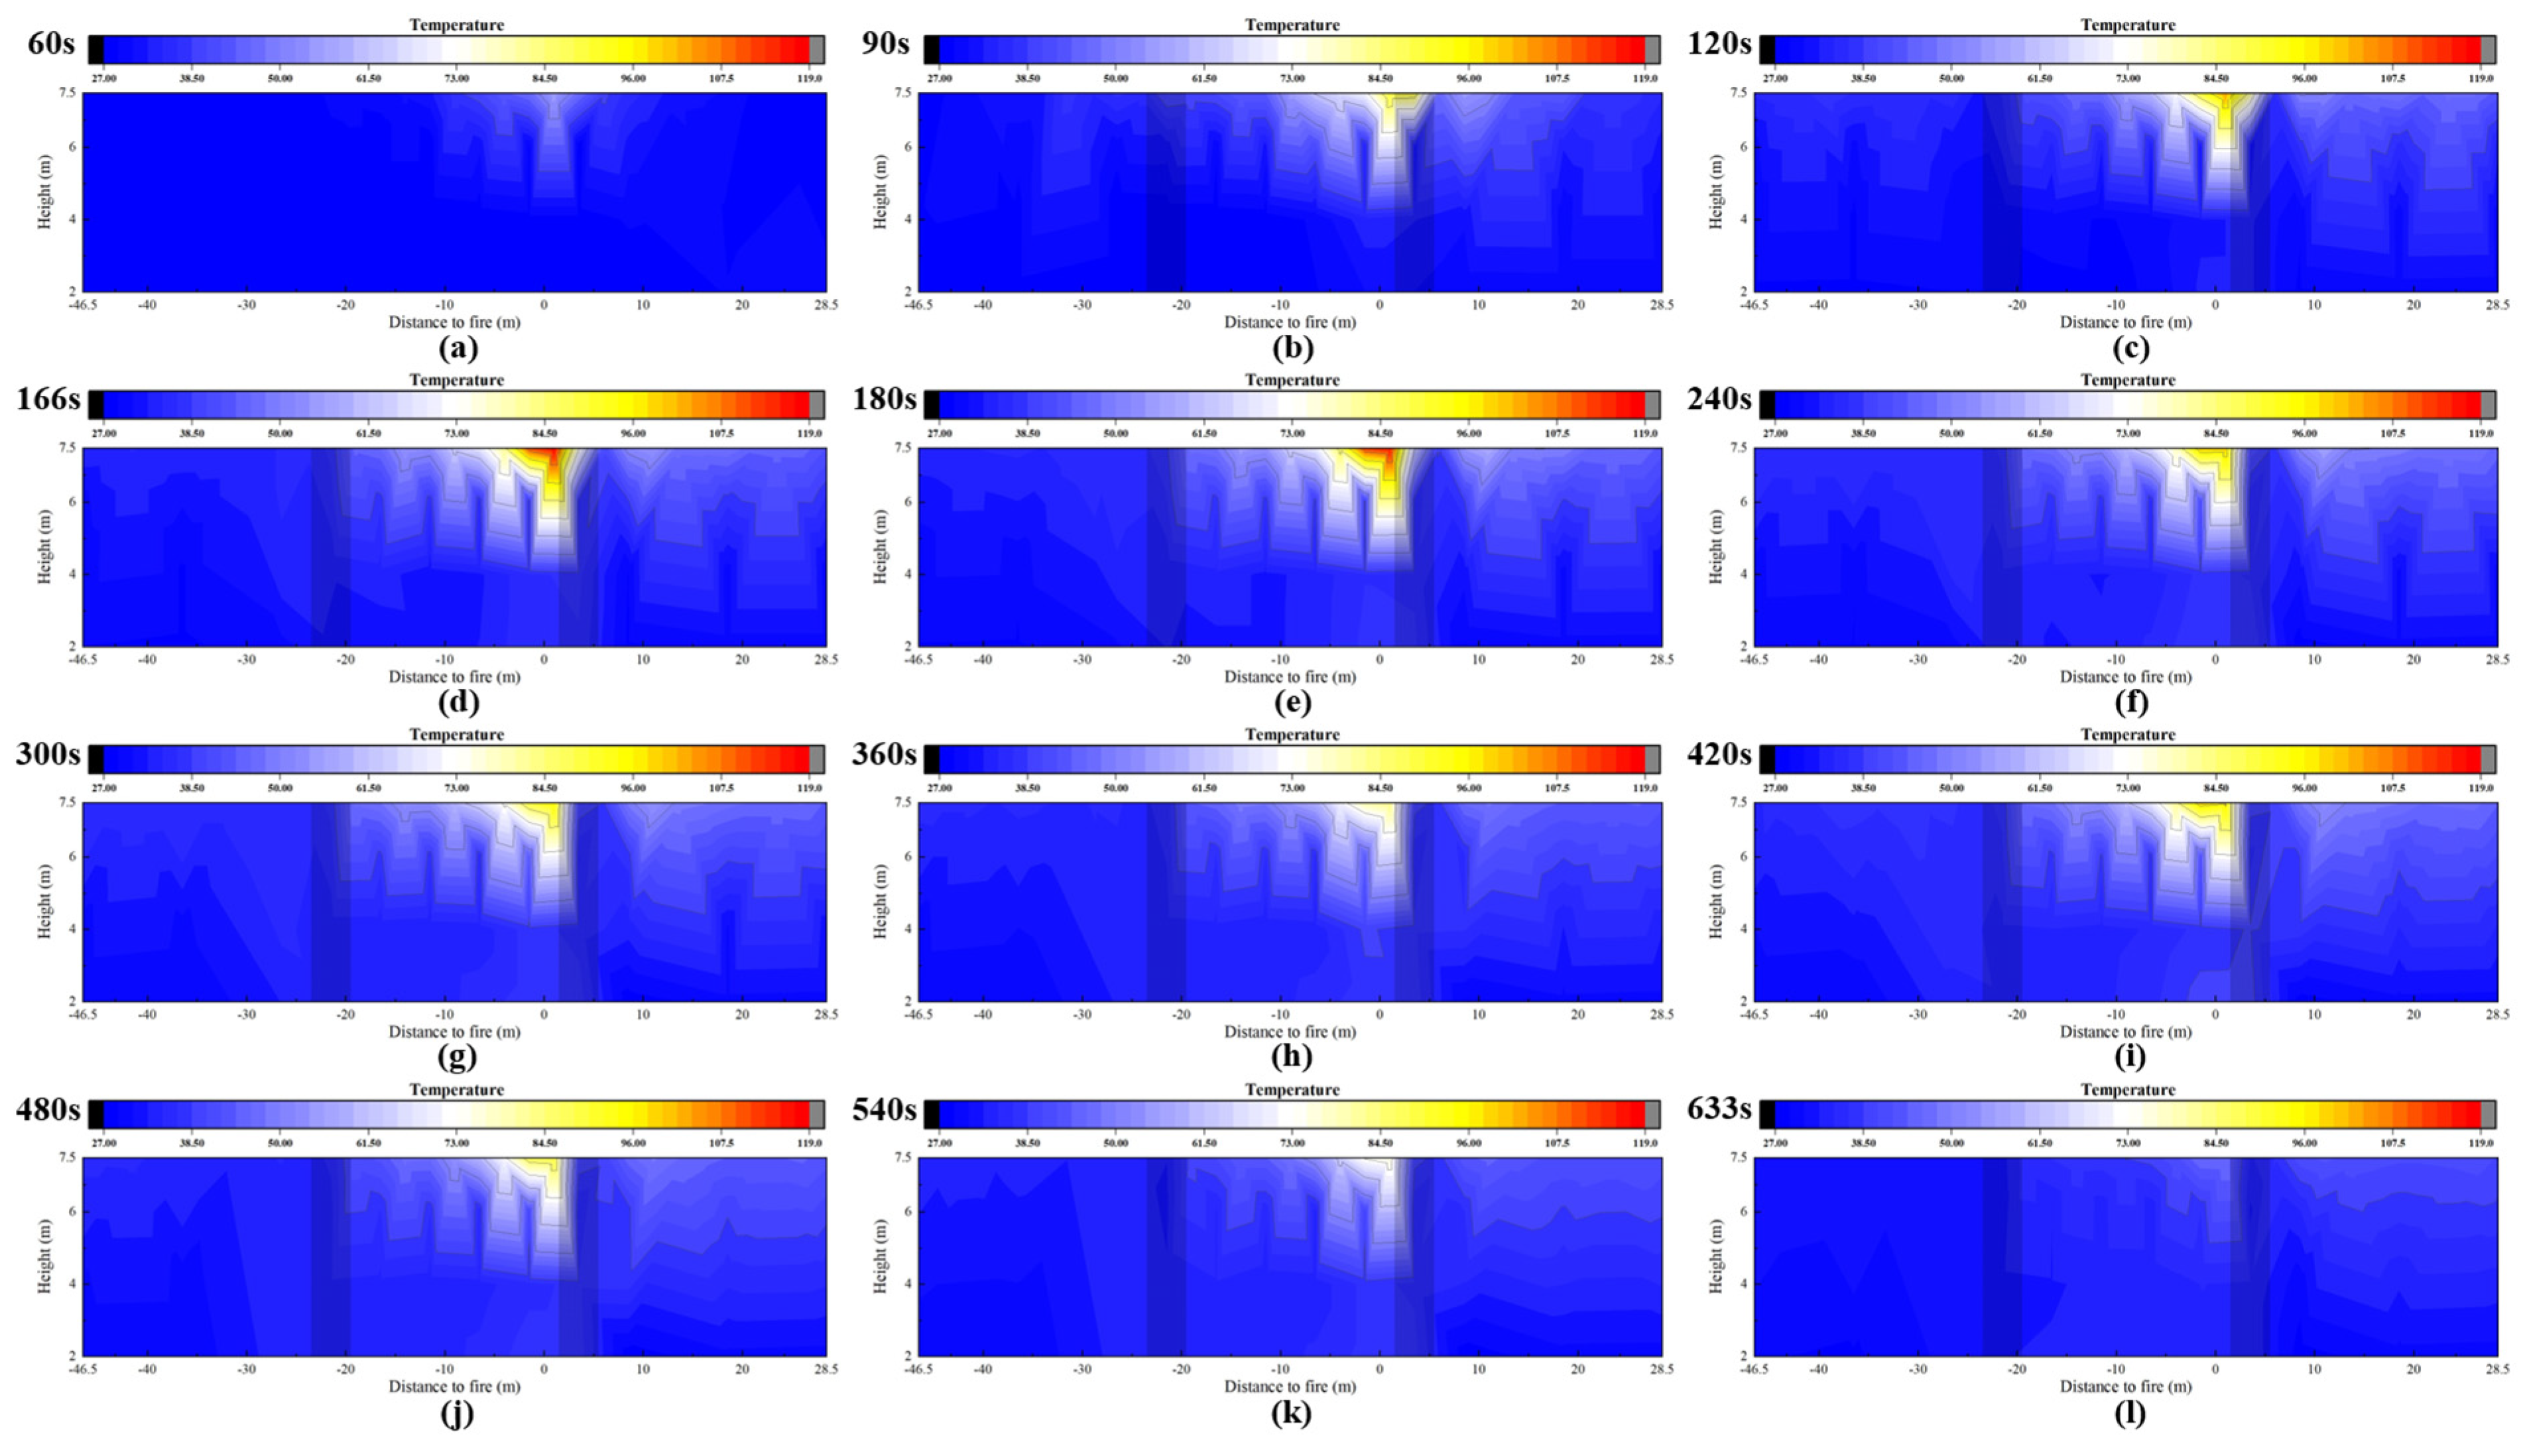
3.3.1. Spatiotemporal Distribution of Temperature Rise Under the Tunnel Ceiling with Water Mist
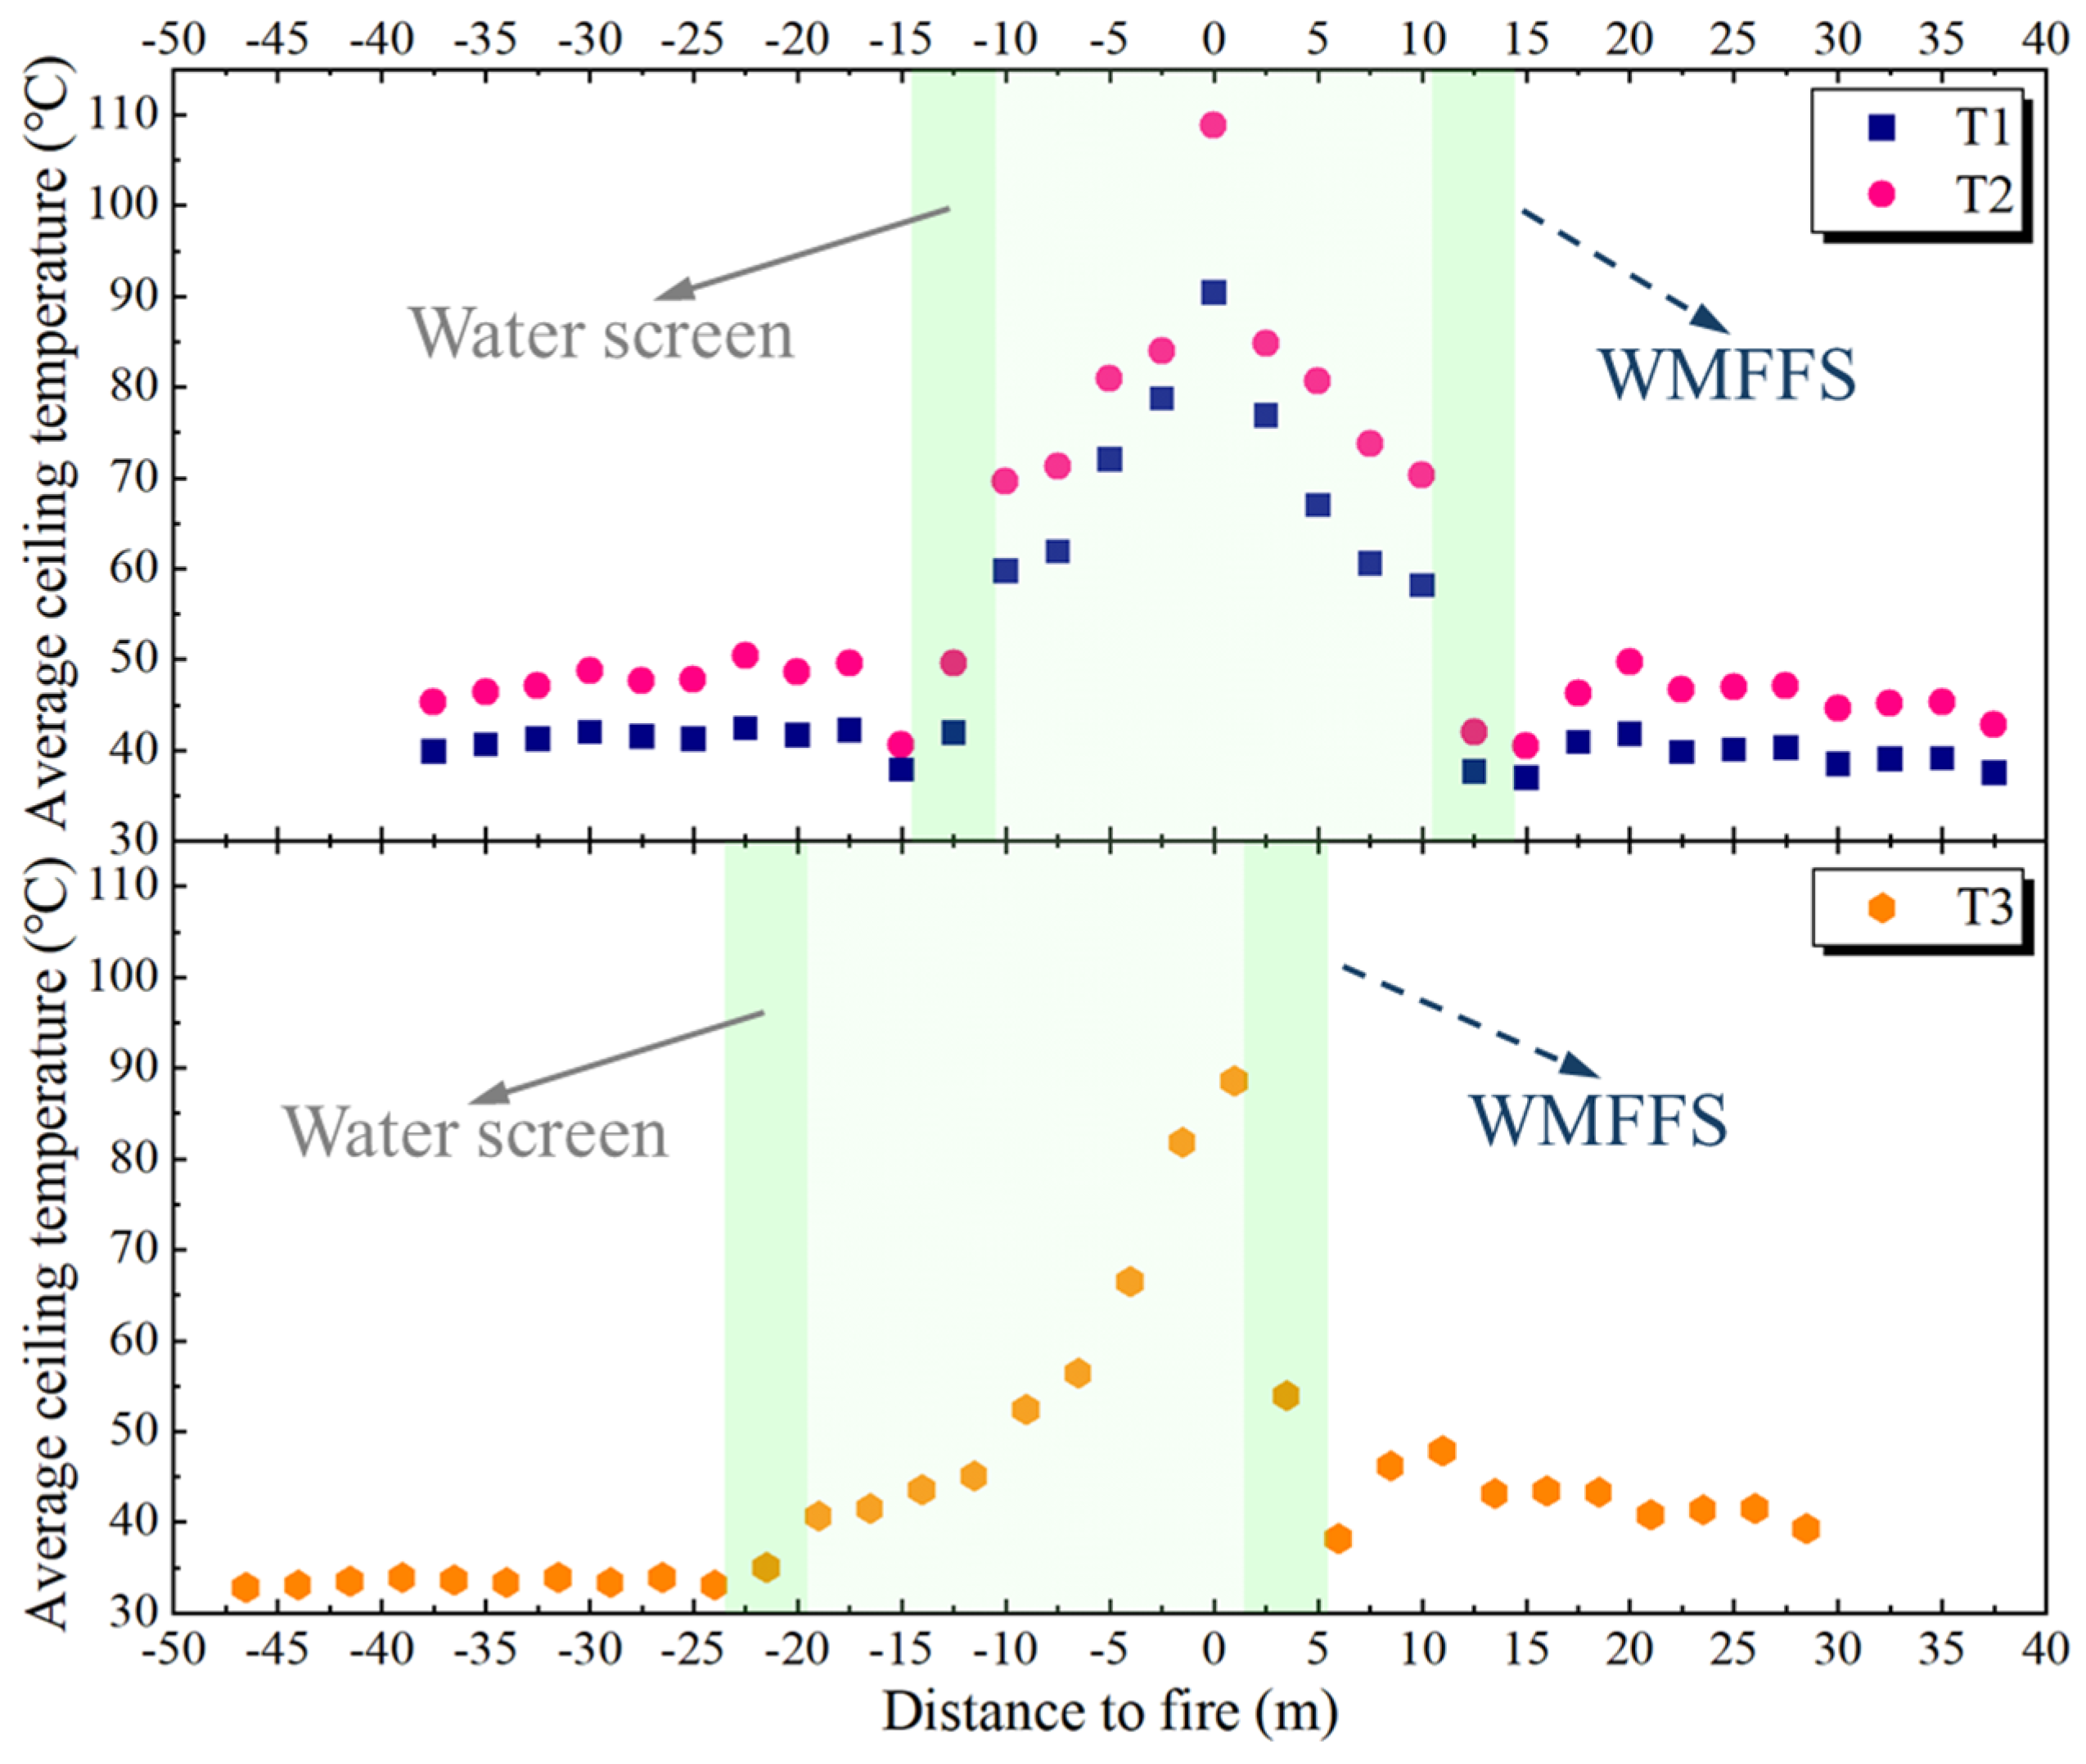
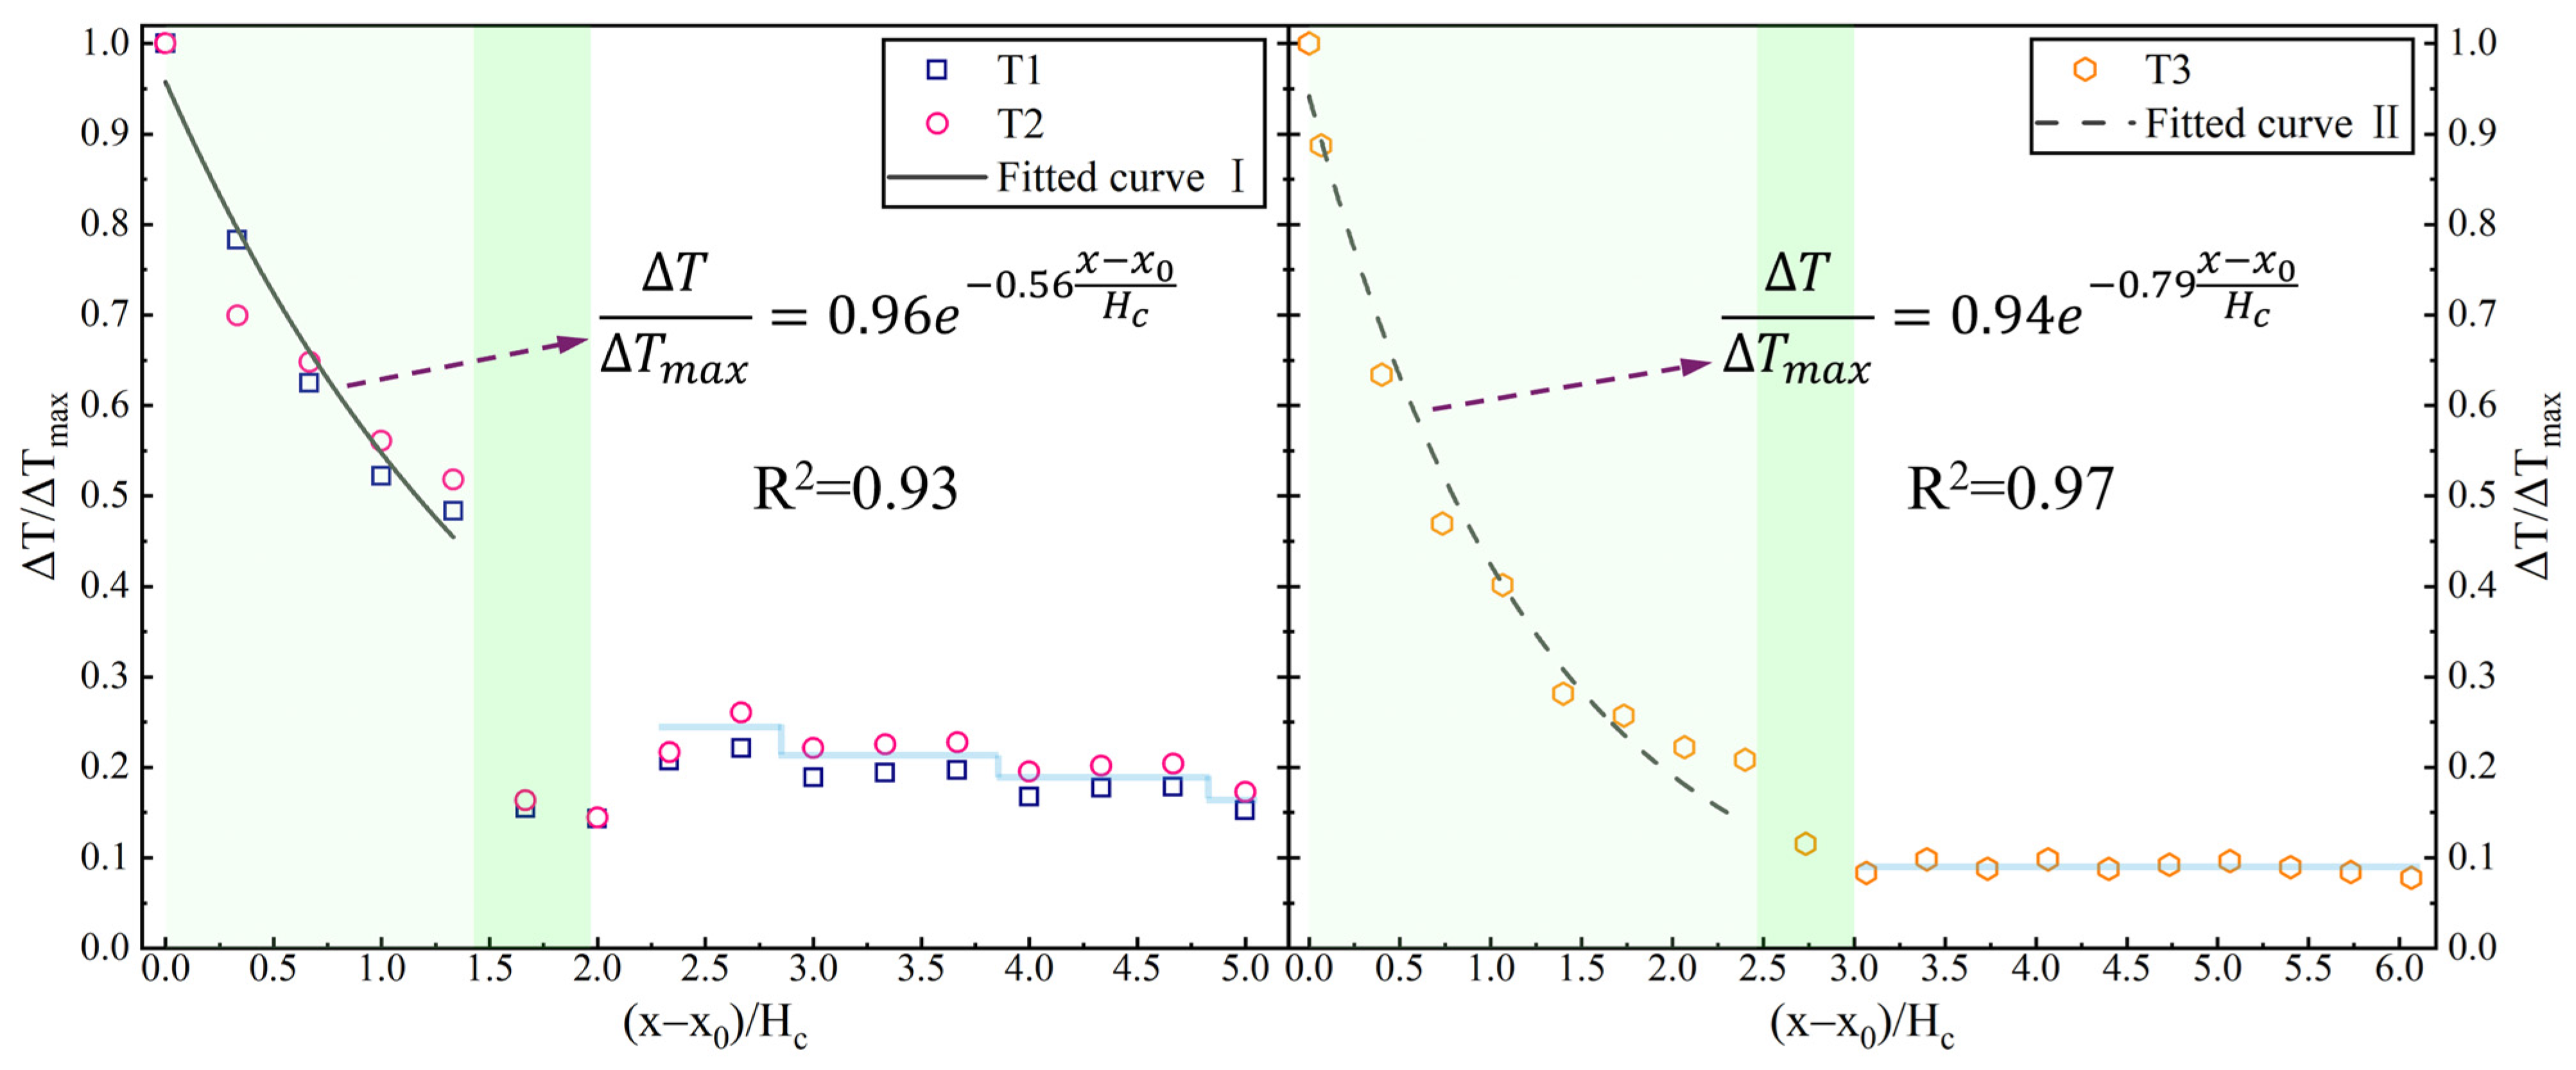
3.3.2. Longitudinal Temperature Distribution of the Tunnel Ceiling
3.4. Temperature Distribution Within the Tunnel
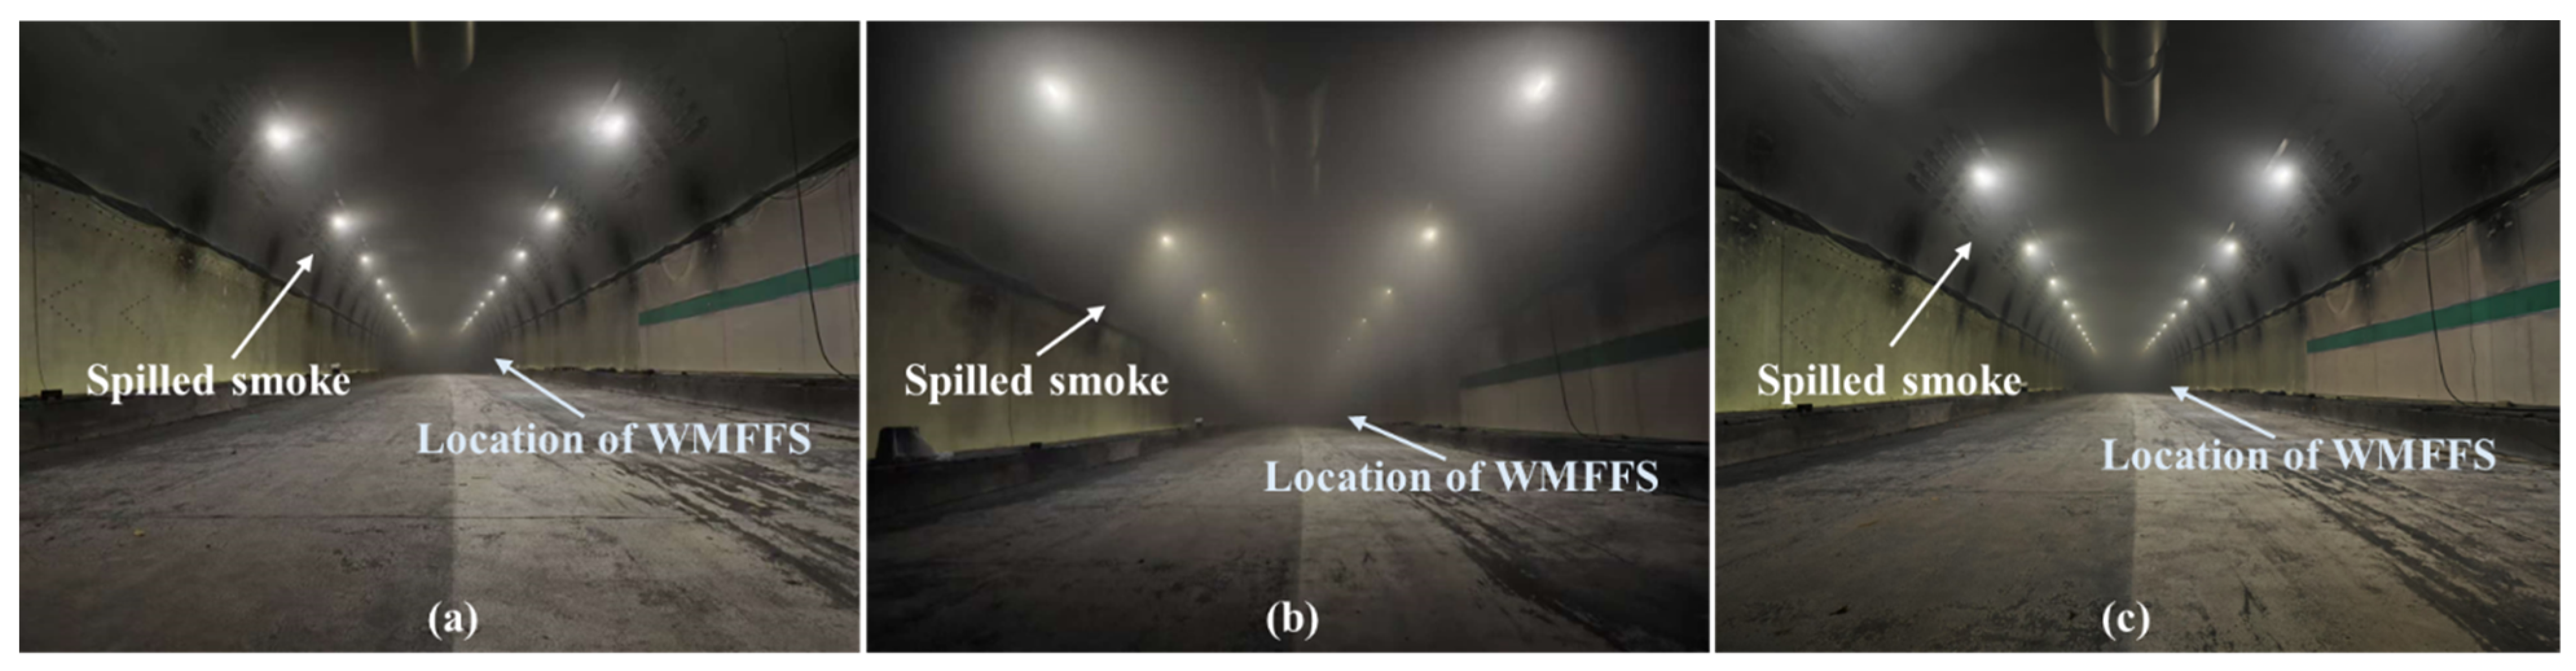
3.5. Smoke Conditions Inside the Tunnel
4. Discussion
5. Conclusions
Author Contributions
Funding
Institutional Review Board Statement
Informed Consent Statement
Data Availability Statement
Conflicts of Interest
References
- Zhou, L.; Feng, S.; Kan, D.; Mao, W. Investigation on effect of pavement material on obstacle visibility and lighting energy consumption in road tunnel. Tunn. Undergr. Space Technol. 2025, 156, 106249. [Google Scholar] [CrossRef]
- El-Fadel, M.; Hashisho, Z. Vehicular emissions and air quality assessment in roadway tunnels: The Salim Slam tunnel. Transp. Res. Part D Transp. Environ. 2000, 5, 355–372. [Google Scholar] [CrossRef]
- Wan, H.; Jiang, Y.; Jiang, J. A survey of fire accidents during the process of highway tunnel operation in China from 2010 to 2021: Characteristics and countermeasures. Tunn. Undergr. Space Technol. 2023, 139, 105237. [Google Scholar] [CrossRef]
- Feng, S.; Gao, W.; Zhou, L.; Li, J.; Mao, W.; Liu, X. Experimental study on obstacle visibility and driving safety in lighting environment of road tunnel interior zone. Tunn. Undergr. Space Technol. 2024, 146, 105641. [Google Scholar] [CrossRef]
- Yu, T.; Zhang, Y.; Yan, Z. A new generation method of tunnel progressive defect status random field (TPDSRF) for subway tunnel structure. Tunn. Undergr. Space Technol. 2023, 141, 105340. [Google Scholar] [CrossRef]
- Zhou, Z.; Shen, Y.; Yang, W.; Yan, Z.; Zhu, H. Coupled CFD-FEM methodology for structural fire safety of composite lining shield tunnel. Tunn. Undergr. Space Technol. 2024, 150, 105834. [Google Scholar] [CrossRef]
- Li, Y.Z.; Ingason, H. Overview of research on fire safety in underground road and railway tunnels. Tunn. Undergr. Space Technol. 2018, 81, 568–589. [Google Scholar] [CrossRef]
- Guo, C.; Pan, Y.; Wang, K.; Zhou, X.; Yan, Z. Full-scale experimental study on combustion characteristics and smoke temperature of double-source fires in different tunnels. Fire Saf. J. 2024, 146, 104177. [Google Scholar] [CrossRef]
- Chen, L.; Zhu, W.; Cai, X.; Pan, L.; Liao, G. Experimental study of water mist fire suppression in tunnels under longitudinal ventilation. Build. Environ. 2009, 44, 446–455. [Google Scholar] [CrossRef]
- Lin, X.; Yan, Z.; Shen, Y.; Guo, C.; Hu, L. Combined ventilation mode in extra-long road tunnels: Energy efficient channel utilization with the inclined shafts. Build. Environ. 2025, 269, 112342. [Google Scholar] [CrossRef]
- Jiao, W.; Chen, C.; Lei, P.; Zhang, Y. Experimental study on the effects of branch tunnel ventilation on the smoke movement and temperature characteristics in bifurcated tunnel fires. Tunn. Undergr. Space Technol. 2024, 144, 105529. [Google Scholar] [CrossRef]
- Chen, L.; Mao, P.; Zhang, Y.; Xing, S.; Li, T. Experimental study on smoke characteristics of bifurcated tunnel fire. Tunn. Undergr. Space Technol. 2020, 98, 103295. [Google Scholar] [CrossRef]
- Carvel, R.O.; Beard, A.N.; Jowitt, P.W. Fire Spread Between Vehicles in Tunnels: Effects of Tunnel Size. Fire Technol. 2005, 41, 271–304. [Google Scholar] [CrossRef]
- Deng, T.; Norris, S.; Wang, M.; Yu, L.; Yan, Z.; Sharma, R.N. Performance of water-based fixed fire fighting systems in road tunnels: A review. Tunn. Undergr. Space Technol. 2025, 157, 106313. [Google Scholar] [CrossRef]
- Liu, Z.; Kim, A.K.; Carpenter, D. A study of portable water mist fire extinguishers used for extinguishment of multiple fire types. Fire Saf. J. 2007, 42, 25–42. [Google Scholar] [CrossRef]
- Lv, D.; Tan, W.; Zhu, G.; Liu, L. Gasoline fire extinguishing by 0.7 MPa water mist with multicomponent additives driven by CO2. Process Saf. Environ. Prot. 2019, 129, 168–175. [Google Scholar]
- Lu, Z.-N.; Chen, H.; Hao, Y.; Wang, J.; Song, X.; Mok, T.M. economic development and public health: Evidence from China. J. Clean. Prod. 2017, 166, 134–147. [Google Scholar] [CrossRef]
- Tsai, W.-T.; Chou, Y.-H. Governmental policies on hydrochlorofluorocarbons (HCFCs) mitigation and its cleaner production measures—Case study in Taiwan. J. Clean. Prod. 2008, 16, 646–654. [Google Scholar] [CrossRef]
- Fan, C.; Bu, R.; Xie, X.; Zhou, Y. Full-scale experimental study on water mist fire suppression in a railway tunnel rescue station: Temperature distribution characteristics. Process. Saf. Environ. Prot. 2021, 146, 396–411. [Google Scholar] [CrossRef]
- Wang, J.; Gao, D.; Kong, X.; Jiang, X.; Lu, K. Water spray effects on fire smoke temperature distribution beneath a symmetrical V-shaped tunnel ceiling. Case Stud. Therm. Eng. 2023, 51, 103568. [Google Scholar] [CrossRef]
- Alenezi, M.H.; Sadek, H. Fire-suppression performance of high-pressure water mist system inside scaled-down road tunnel section. J. Eng. Res. 2023, 11, 100024. [Google Scholar] [CrossRef]
- Cui, Y.; Liu, J. Research progress of water mist fire extinguishing technology and its application in battery fires. Process. Saf. Environ. Prot. 2021, 149, 559–574. [Google Scholar] [CrossRef]
- Ingason, H.; Li, Y.Z. Large scale tunnel fire tests with different types of large droplet fixed fire fighting systems. Fire Saf. J. 2019, 107, 29–43. [Google Scholar] [CrossRef]
- Chang, H.-P.; Ho, S.-P.; Chen, C.-S.; Chien, S.-W. Performance of a spray system in a full-scale tunnel fire test. Tunn. Undergr. Space Technol. 2017, 67, 167–174. [Google Scholar] [CrossRef]
- Li, J.; Li, Y.; Bi, Q.; Chow, W.; Cheng, C.; To, C.; Chow, C. Performance evaluation on fixed water-based firefighting system in suppressing large fire in urban tunnels. Tunn. Undergr. Space Technol. 2019, 84, 56–69. [Google Scholar] [CrossRef]
- Ingason, H. Model scale tunnel tests with water spray. Fire Saf. J. 2008, 43, 512–528. [Google Scholar] [CrossRef]
- Li, Y.Z.; Ingason, H. Model scale tunnel fire tests with automatic sprinkler. Fire Saf. J. 2013, 61, 298–313. [Google Scholar] [CrossRef]
- Blanchard, E.; Boulet, P.; Fromy, P.; Desanghere, S.; Carlotti, P.; Vantelon, J.P.; Garo, J.P. Experimental and Numerical Study of the Interaction Between Water Mist and Fire in an Intermediate Test Tunnel. Fire Technol. 2014, 50, 565–587. [Google Scholar] [CrossRef]
- Sun, J.; Fang, Z.; Tang, Z.; Beji, T.; Merci, B. Experimental study of the effectiveness of a water system in blocking fire-induced smoke and heat in reduced-scale tunnel tests. Tunn. Undergr. Space Technol. 2016, 56, 34–44. [Google Scholar] [CrossRef]
- Hamzehpour, A.; Verda, V.; Borchiellini, R. Experimental study of extinguishing shielded fires by a low-pressure multi-orifice water mist nozzle. Fire Saf. J. 2024, 146, 104175. [Google Scholar] [CrossRef]
- Tanaka, F.; Harada, N.; Yamaoka, S.; Moinuddin, K.A. Fire control and self-extinguishment by blocking smoke flow with water spray in a tunnel fire. Fire Saf. J. 2024, 142, 103999. [Google Scholar] [CrossRef]
- Li, Q.; Tang, Z.; Fang, Z.; Yuan, J.; Wang, J. Experimental study of the effectiveness of a water mist segment system in blocking fire-induced smoke and heat in mid-scale tunnel tests. Tunn. Undergr. Space Technol. 2019, 88, 237–249. [Google Scholar] [CrossRef]
- Chen, Y.; Jia, J.; Che, G.; Zhu, Z.; Shen, Z.; Wu, Y. Study on smoke blocking and thermal radiation attenuation by water curtain in tunnel fire. Sci. Rep. 2023, 13, 237. [Google Scholar] [CrossRef] [PubMed]
- Nishino, R.; Ren, N.; Noda, Y.; Tanaka, F. Large eddy simulation of smoke blocking by water sprays in a tunnel fire. Tunn. Undergr. Space Technol. 2022, 121, 104278. [Google Scholar] [CrossRef]
- Kan, D.; Feng, S.; Yan, Z.; Zhou, L.; Zhu, H. Full-scale experimental study on the smoke and thermal insulation of a water mist fire extinguishing system in a short road tunnel with natural ventilation. Tunn. Undergr. Space Technol. 2025, 158, 106414. [Google Scholar] [CrossRef]
- Li, Q.; Chen, C.; Deng, Y.; Li, J.; Xie, G.; Li, Y.; Hu, Q. Influence of traffic force on pollutant dispersion of CO, NO and particle matter (PM2.5) measured in an urban tunnel in Changsha, China. Tunn. Undergr. Space Technol. 2015, 49, 400–407. [Google Scholar] [CrossRef]
- Wang, M.; Wang, X.; Yu, L.; Deng, T. Field measurements of the environmental parameter and pollutant dispersion in urban undersea road tunnel. Build. Environ. 2019, 149, 100–108. [Google Scholar] [CrossRef]
- Tong, Y.; Wang, X.; Zhai, J.; Niu, X.; Liu, L. Theoretical predictions and field measurements for potential natural ventilation in urban vehicular tunnels with roof openings. Build. Environ. 2014, 82, 450–458. [Google Scholar] [CrossRef]
- Zhang, G.; Peng, T.; Tong, Y.; Gong, Y.; Chen, Z.; Huang, W.; Dai, B. Full-scale experiments on the fire smoke extraction from naturally ventilated shafts for shallow-buried urban road tunnels in hot summer. Tunn. Undergr. Space Technol. 2024, 143, 105441. [Google Scholar] [CrossRef]
- PIARC Committee on Road Tunnels. Fire and Smoke Control in Road Tunnels; World Road Association (PIARC): Paris, France, 1999. [Google Scholar]
- Yan, Z.-G.; Guo, Q.-H.; Zhu, H.-H. Full-scale experiments on fire characteristics of road tunnel at high altitude. Tunn. Undergr. Space Technol. 2017, 66, 134–146. [Google Scholar] [CrossRef]
- Guo, C.; Zhang, T.; Guo, Q.; Yu, T.; Fang, Z.; Yan, Z. Full-scale experimental study on fire characteristics induced by double fire sources in a two-lane road tunnel. Tunn. Undergr. Space Technol. 2023, 131, 104768. [Google Scholar] [CrossRef]
- Zhou, Y.; Tong, Z.; Tong, Y.; Xiong, D.; Liu, Z.; Chen, K.; Zhang, G.; Gong, Y. Full-scale experiments on fire smoke spreading respectively under natural and hybrid ventilation in a real urban road tunnel with shafts. Appl. Therm. Eng. 2025, 260, 124865. [Google Scholar] [CrossRef]
- Babrauskas, V. Estimating large pool fire burning rates. Fire Technol. 1983, 19, 251–261. [Google Scholar] [CrossRef]
- Guo, Q.; Zhu, H.; Zhang, Y.; Shen, Y.; Zhang, Y.; Yan, Z. Smoke flow in full-scale urban road tunnel fires with large cross-sectional vertical shafts. Tunn. Undergr. Space Technol. 2020, 104, 103536. [Google Scholar] [CrossRef]
- Anghel, I.; Octavian, L.; Codescu, S.; Pesic, D.J.; Brăniteanu, B.; Constantin, P. Experimental investigation on the characteristics of fire in reduced 1/10 scale road tunnel using different combustible liquid pools. Acta Tech. Napoc.-Ser. Appl. Math. Mech. Eng. 2017, 60, 217–226. [Google Scholar]
- Ministry of Transport of the People’s Republic of China. Technical Requirements for Highway Tunnel Fire Alarm Equipment (JTT 610-2016); China Communications Press: Beijing, China, 2016. [Google Scholar]
- Liu, Y.; Fang, Z.; Tang, Z.; Beji, T.; Merci, B. The combined effect of a water mist system and longitudinal ventilation on the fire and smoke dynamics in a tunnel. Fire Saf. J. 2021, 122, 103351. [Google Scholar] [CrossRef]
- Hu, L.; Huo, R.; Wang, H.; Li, Y.; Yang, R. Experimental studies on fire-induced buoyant smoke temperature distribution along tunnel ceiling. Build. Environ. 2007, 42, 3905–3915. [Google Scholar] [CrossRef]
- Delichatsios, M. The flow of fire gases under a beamed ceiling. Combust. Flame 1981, 43, 1–10. [Google Scholar] [CrossRef]
- Heskestad, G. Virtual origins of fire plumes. Fire Saf. J. 1983, 5, 109–114. [Google Scholar] [CrossRef]
- Zhang, T.; Wang, G.; Li, J.; Wu, K.; Wang, L. Modelling the maximum ceiling temperature with bifurcated plume in tunnel fires. Fire Saf. J. 2024, 150, 104249. [Google Scholar] [CrossRef]
- Liu, Z.; Kim, A.K. A Review of Water Mist Fire Suppression Systems—Fundamental Studies. J. Fire Prot. Eng. 1999, 10, 32–50. [Google Scholar] [CrossRef]


Disclaimer/Publisher’s Note: The statements, opinions and data contained in all publications are solely those of the individual author(s) and contributor(s) and not of MDPI and/or the editor(s). MDPI and/or the editor(s) disclaim responsibility for any injury to people or property resulting from any ideas, methods, instructions or products referred to in the content. |
© 2025 by the authors. Licensee MDPI, Basel, Switzerland. This article is an open access article distributed under the terms and conditions of the Creative Commons Attribution (CC BY) license (https://creativecommons.org/licenses/by/4.0/).
Share and Cite
Feng, S.; Kan, D.; Guo, C. Full-Scale Experimental Investigation of Temperature Distribution and Smoke Flow in a Road Tunnel with a Novel Water Mist Fire Fighting System. Fire 2025, 8, 216. https://doi.org/10.3390/fire8060216
Feng S, Kan D, Guo C. Full-Scale Experimental Investigation of Temperature Distribution and Smoke Flow in a Road Tunnel with a Novel Water Mist Fire Fighting System. Fire. 2025; 8(6):216. https://doi.org/10.3390/fire8060216
Chicago/Turabian StyleFeng, Shouzhong, Deyuan Kan, and Chao Guo. 2025. "Full-Scale Experimental Investigation of Temperature Distribution and Smoke Flow in a Road Tunnel with a Novel Water Mist Fire Fighting System" Fire 8, no. 6: 216. https://doi.org/10.3390/fire8060216
APA StyleFeng, S., Kan, D., & Guo, C. (2025). Full-Scale Experimental Investigation of Temperature Distribution and Smoke Flow in a Road Tunnel with a Novel Water Mist Fire Fighting System. Fire, 8(6), 216. https://doi.org/10.3390/fire8060216