1. Introduction
Electrical systems that move electrical energy from one location to another depend on power cables. They are essential for efficiently and safely transporting power across long distances [
1,
2]. Medium-voltage cables are used in many applications, such as residences, tunnels, industries, underground, and nuclear power plants. The primary function of a wire or cable is to transport electric current to the appropriate device or place, regardless of whether it is being used to convey communications or electric power [
3,
4,
5]. An electrical cable consists of one or more insulated electrical conductors covered by an outer sheath. Conductors carry electricity or signals, often manufactured from materials with high electrical conductivity, such as copper or aluminium [
6]. Cable structures use various polymeric materials, each with its own chemical composition, thickness, and additional elements [
7]. When burned, these materials can produce significant heat and combustion gases, which can be toxic but are not considered here [
8].
Fires in buildings, nuclear power plants, wildfires, manufactories, and homes can potentially result from the ignition and combustion of electrical cables. This is recognised as a prevalent hazard associated with fire incidents. Moreover, a cable fire can quickly spread and lead to significant losses to nearby places connected along the cable network [
9,
10,
11,
12,
13]. Electrical cable and wire fires can occur directly due to factors like unsuitable contact, short-circuiting, ground faults, or external heating, resulting in the ignition of polymer insulation [
14,
15]. Heat transfer mechanisms manage the spread of most fires; in certain situations, cables may experience a reduction in performance or safety due to heating [
16]. Assessing fire risks and setting material standards are crucial to prevent cable fires. Evaluating temperature rise during design ensures safety, cost optimisation, and controlled temperature limits [
17,
18].
Many investigations have been conducted on the behaviour of electrical cables and wires, particularly those with single layers of insulation, to understand how they behave when they ignite or burn, or when flames spread, considering factors including wire type, ambient pressure, gravity, wind, and oxygen concentration [
19,
20,
21,
22,
23,
24,
25,
26,
27,
28]. Some previous studies have also explored different parameters affecting fire performance, such as inclination angle, as seen in [
29,
30]. While numerous studies have investigated heat transfer in electrical cables, most have primarily focused on cables with thinner diameters. Limited research has been conducted on the thermal behaviour of fire-resistant cables with thick diameters under external heat sources, particularly considering variations in conductor radii. The differences in radii can significantly impact the cable’s inner thermal structure and overall fire resistance. To address this gap, our study analyses and develops the inner thermal structure of a fire-resistant cable exposed to external heat flux. By examining the effect of different conductor radii, we aim to enhance the understanding of heat transfer mechanisms in such cables and contribute to the improvement of fire-resistant cable design. This study considered the heating conditions according to the fire test codes, providing a comprehensive understanding of how cable radius interacts with thermal properties. These findings clarify the critical role of cable radius in optimising thermal performance. And this study represents a significant step toward improving the efficiency, safety, and reliability of electrical power cables across various operational conditions.
3. The Boundary Conditions and Equations
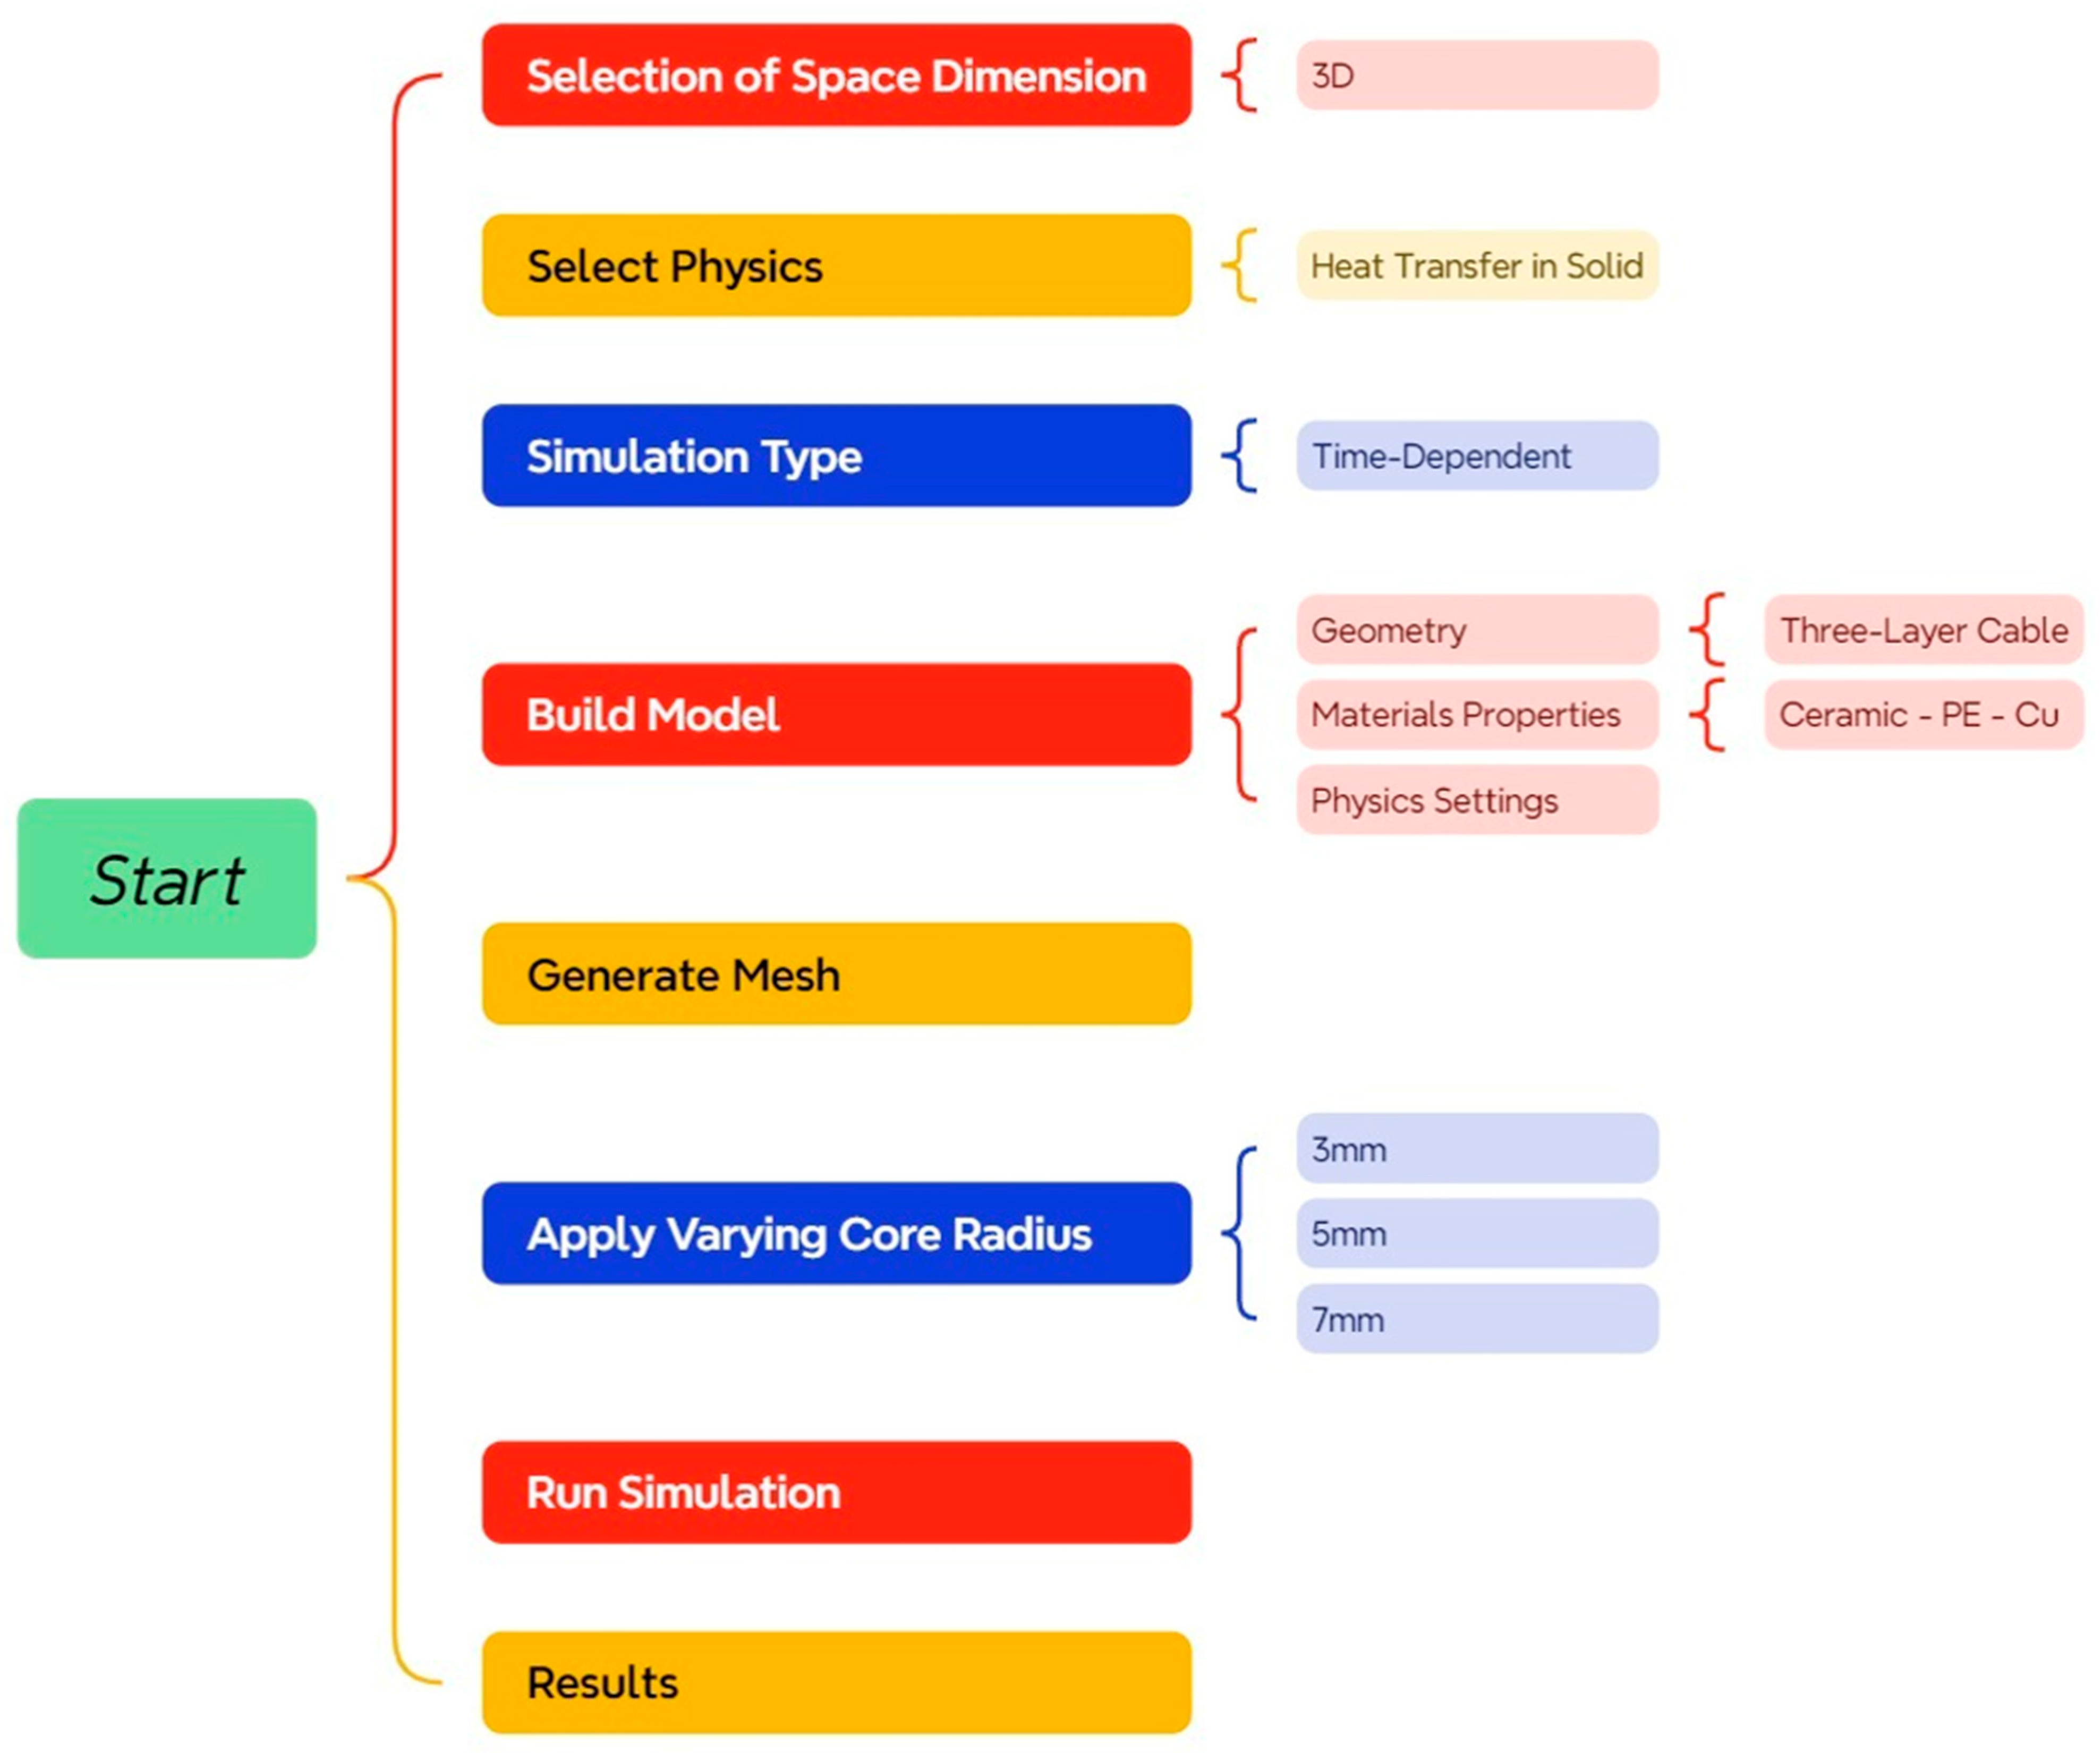
The simulation was conducted using COMSOL Multiphysics version 6.1, a Finite Element (FE) solver widely utilised in engineering and physics research for multiphysics analysis. A three-dimensional approach was employed to represent the cable geometry accurately. The study focused on heat transfer in solids, with the simulation parameters aligned with IEC (International Electrotechnical Commission) standards, setting the runtime at 90 min.
Figure 2 illustrates the simulation workflow for heat transfer analysis in the cables. The three-dimensional model was used to obtain more accurate numerical results. The cable models were created in the model builder, and the material properties of the conductor, insulation, and outer layer were defined as shown in
Table 1. The Heat Traverse in Solid (ht) physics interface was used to compute the temperature distributions in the cable through the time-dependent study.
To simulate the effects of an external heat source, the central section of the cable (1000–1500 mm) was designated as the heat source zone, and the temperature at the outer boundary of this section was set to 750 °C, in accordance with standard fire exposure conditions defined in the IEC 60331 and IEC 60332 tests [
35,
36]. The reference temperature was defined as 20 °C, with ambient air temperature and pressure set at 20 °C and 1 atm, respectively. A heat transfer coefficient of 10 W/m
2·K was applied, with thermal conduction being the primary heat transfer mode within the solid structure. In addition, surface-to-ambient radiation was applied to the cable surfaces, and the emissivity of the materials is shown in
Table 1. This study investigated the impact of external heat flux on the internal thermal response of the cable by analysing three different conductor radii (3, 5, and 7 mm), providing a comprehensive assessment of how conductor size influences heat transfer characteristics.
The equation describing heat transfer within the cable layers corresponds to the heat conduction equation for a transient (time-dependent) process in a solid medium [
37], which describes how temperature changes over time and space, taking into account various heat transfer mechanisms. This can be expressed as
where
ρ is the density of the material kg/m3;
is the specific heat capacity at constant pressure J/(kg·K);
the rate of change in temperature with time in units like K/s or °C/s;
the velocity vector, which accounts for convection,
is measured in units like m/s;
the gradient operator, which involves spatial derivatives;
the temperature of the material, which can vary with both time and spatial coordinates;
the rate of conduction heat transfer W/m3;
any additional heat sources or sinks in the material W/m3;
any additional time-dependent heat sources W/m3.
And Fourier’s law of heat conduction can be expressed as
where
is the heat flux vector, which represents the rate of heat transfer er unit area W/m2;
represents the thermal conductivity of the material W/(m·K);
represents the temperature gradient, indicating how temperature changes with respect to spatial coordinates (°C/m).
Stefan–Boltzmann Law expresses the radiation of the surface of the cable to the ambient environment:
where
represents the heat flux in watts (W);
ε is the emissivity of the material (it is a dimensionless number between 0 and 1 that describes how effectively a material emits thermal radiation);
σ is the Stefan–Boltzmann constant, approximately ;
is the ambient temperature in Kelvin (K);
T is the surface temperature in Kelvin (K).
According to Equation (4), the cable is affected by natural convection from the surrounding environment.
It represents the heat flux between the cable and its surroundings due to the temperature difference, where
heat transfer rate );
heat transfer coefficient ;
the temperature of the surrounding environment in Kelvin (K);
the cable surface temperature in Kelvin (K).
4. Meshing
The mesh plays a crucial role in the simulation process, possibly necessary for achieving the highest quality results in the shortest time [
38,
39,
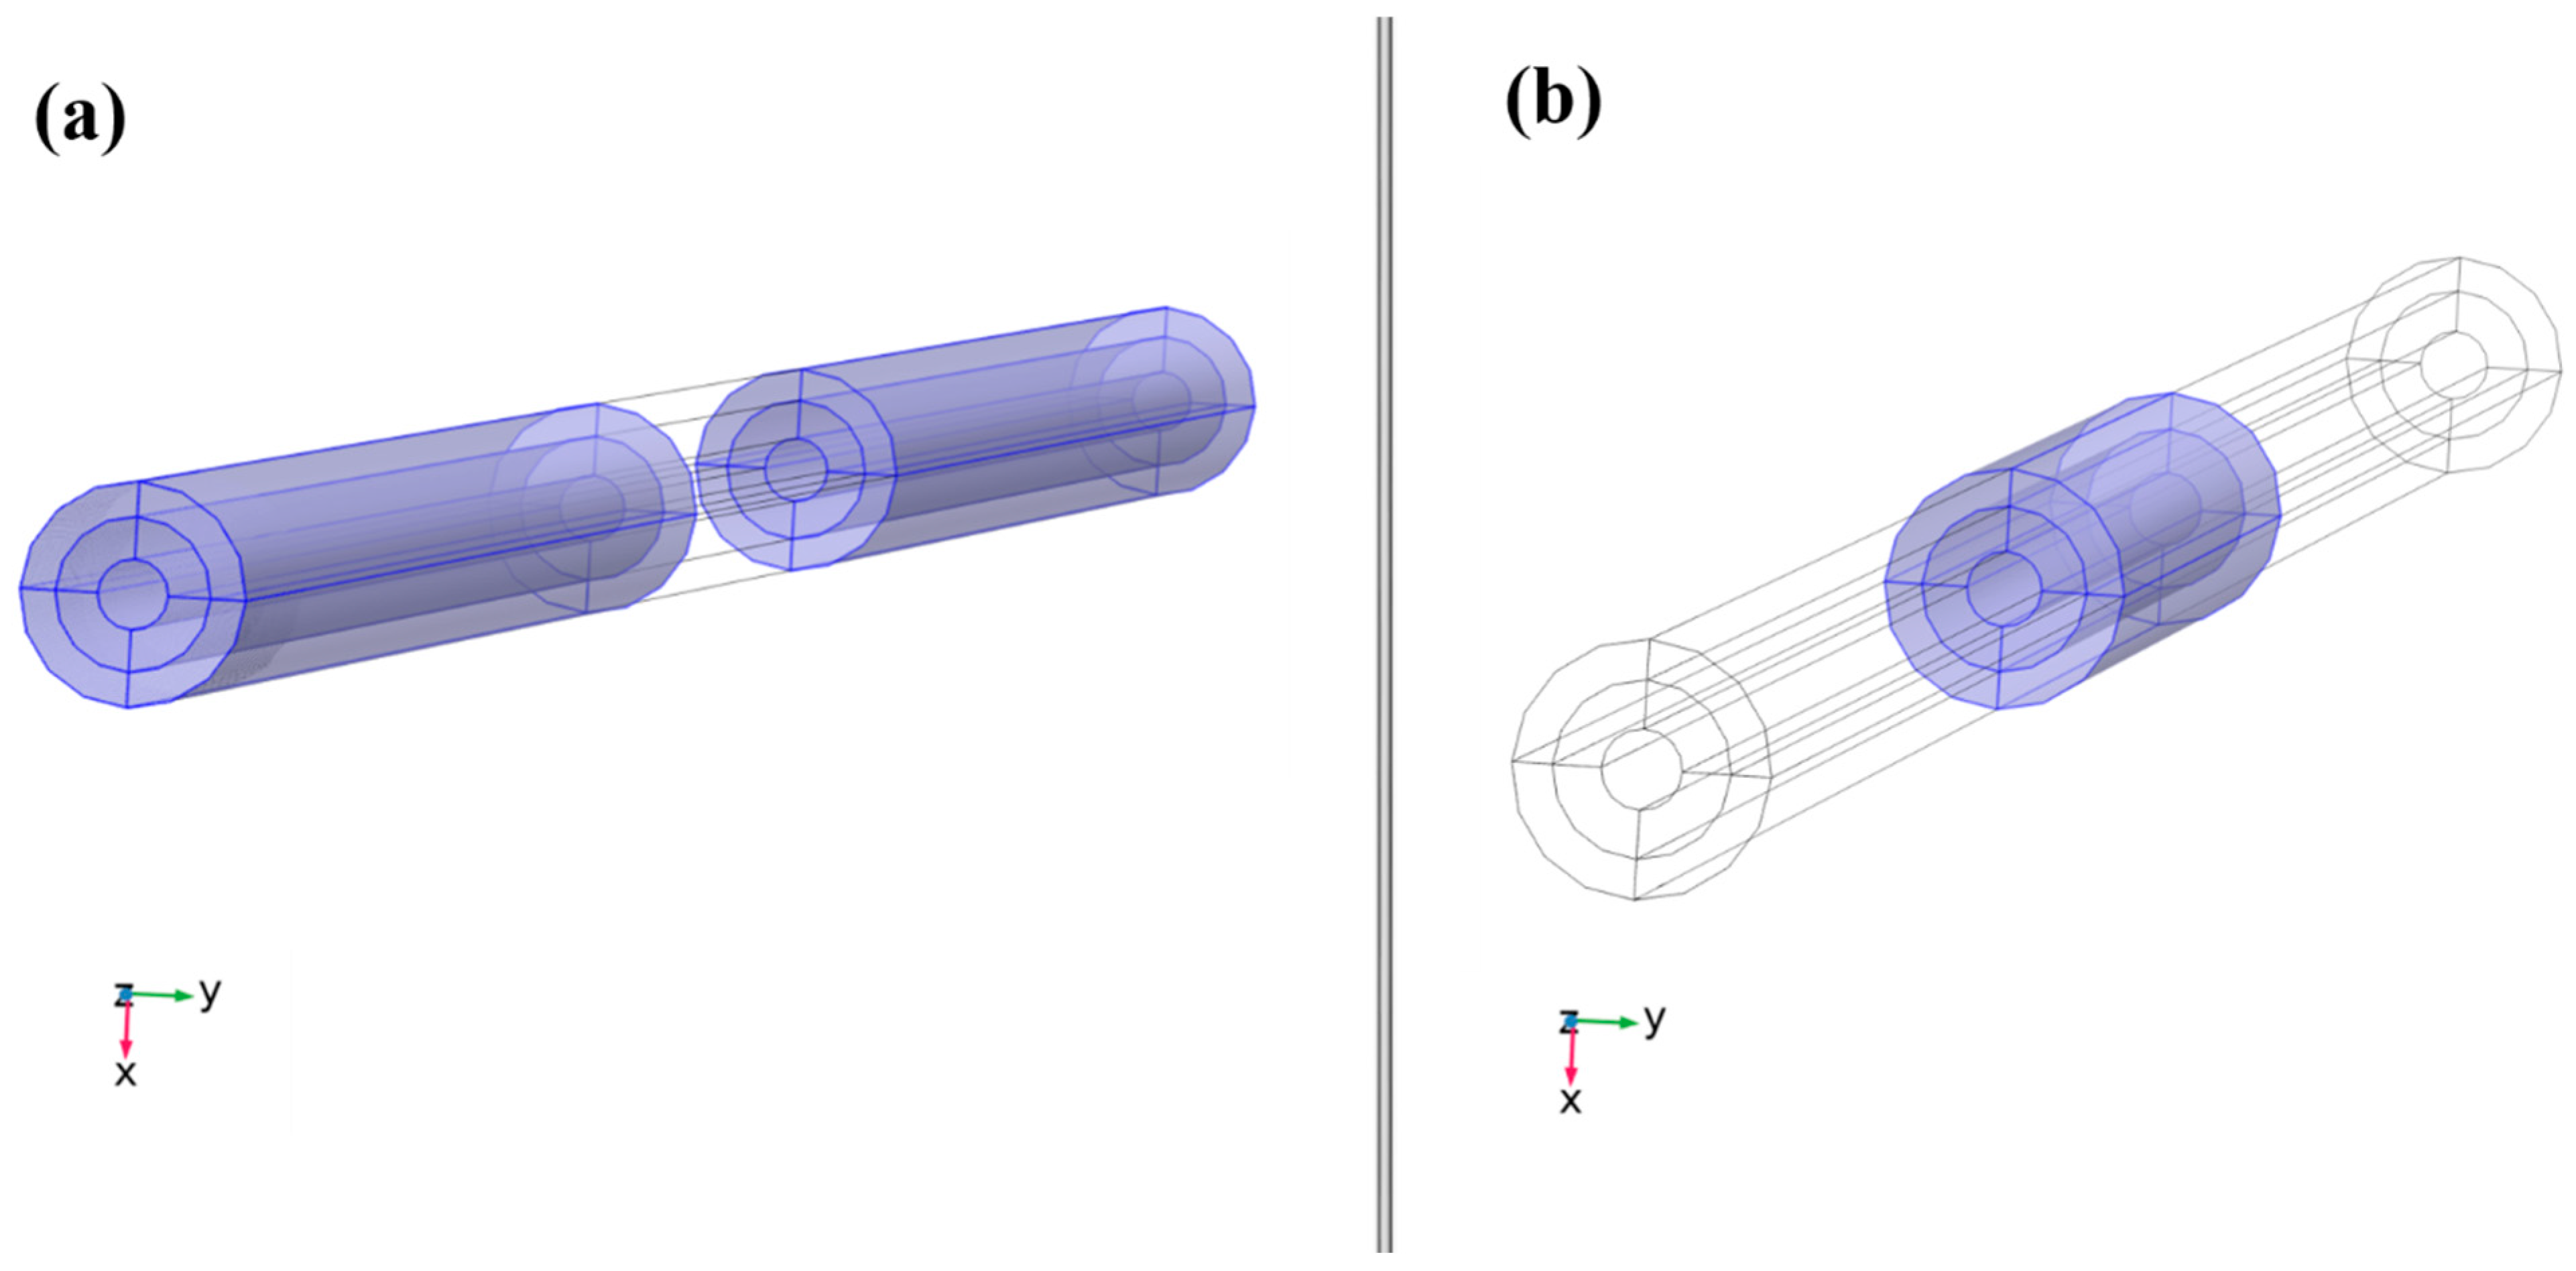
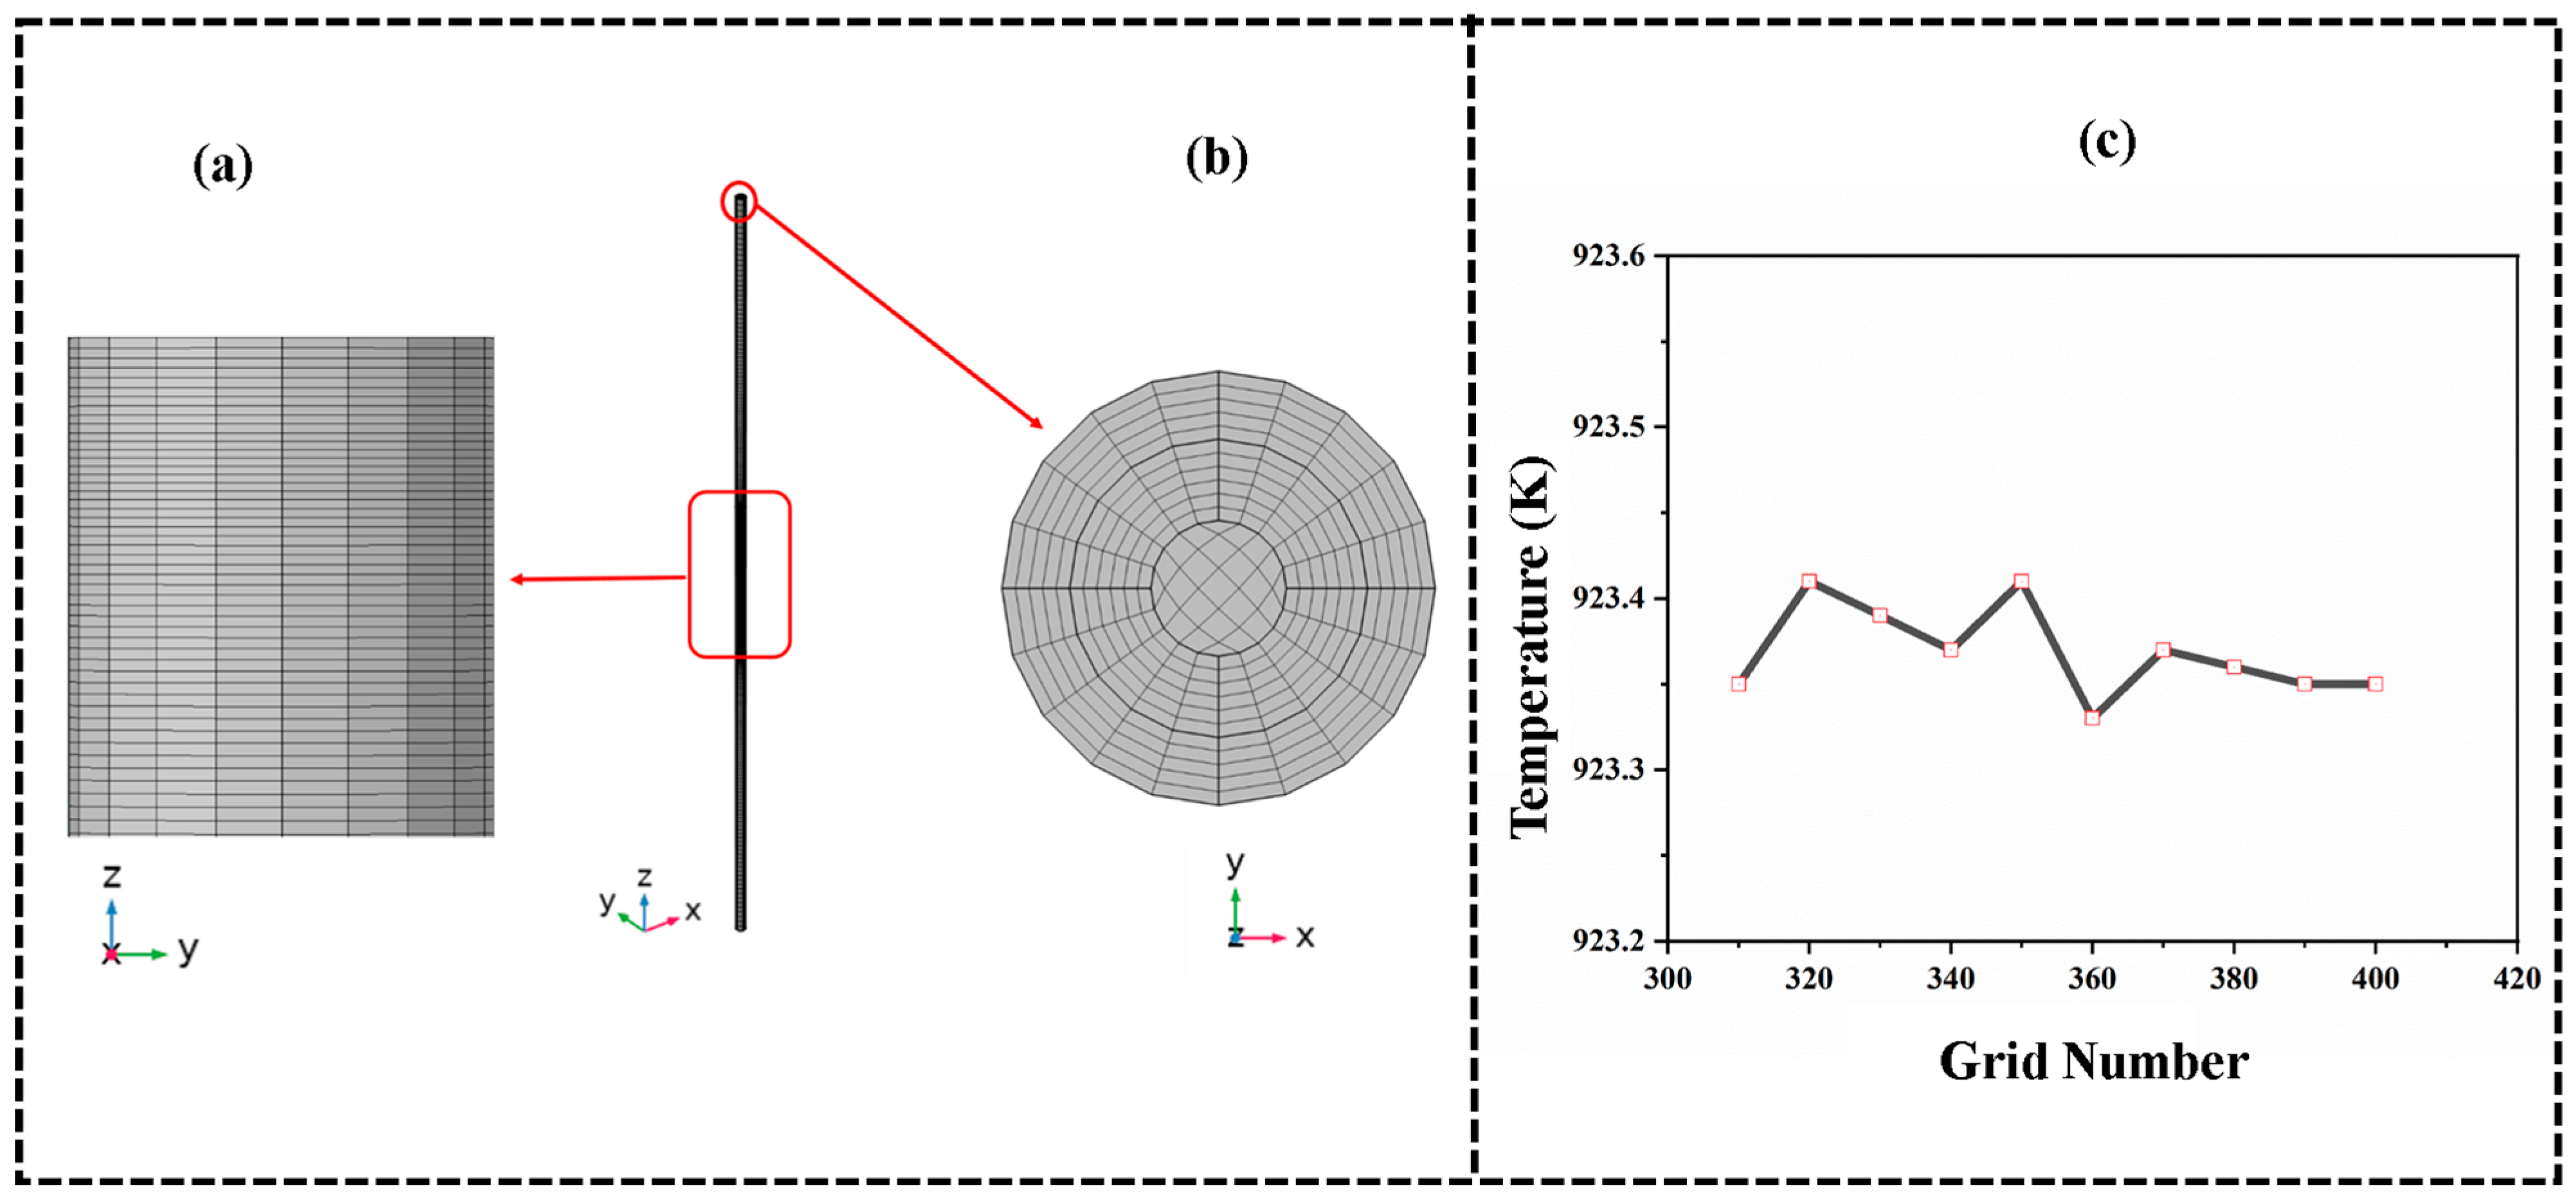
40]. The swept element was chosen for the conductor, insulation, and outer layers, while the mapped mesh was used to determine the distribution of elements along the cable sections. The length of the heat source section was divided into 400 elements, the non-heat source section was divided into 100 elements, and the diameters of the conductor layer, insulation layer, and outer layers were divided into five elements and six elements along the radius. The mesh configuration for the simulation consists of 147,000 elements distributed across three cable sections. The sections in
Figure 3a (0–1000 mm) and (1500–2500 mm), both non-heat source sections, each contain 24,500 elements, with 100 grids of 10 mm per side.
Figure 3b (1000–1500 mm), the heat source section, has a higher density with 98,000 elements, divided into 400 grids of 1.5 mm per side. This mesh design ensures an accurate representation of thermal behaviour, with finer resolution in the heat source area, to capture detailed heat transfer dynamics while maintaining computational efficiency, as shown in
Figure 4a,b.
Figure 4c illustrates the grid independence verification conducted to ensure an optimal balance between simulation accuracy and computational efficiency. The figure shows the relationship between mesh density and the maximum temperature of the polyethylene (PE) insulation layer in the heat source region. To determine the optimal mesh density, the middle segment of the insulation layer was discretised using 300 to 400 elements.
The results show that the variation in simulated temperature becomes negligible (within 0.08 K) as the number of elements increases. For element counts below 390, the temperature distribution exhibits noticeable fluctuations, indicating mesh sensitivity. However, the temperature stabilises when the number of elements is between 390 and 400, confirming that the simulation results are mesh-independent in this range. Based on these observations, a mesh configuration using 400 elements was selected for the final model to ensure both accuracy and efficiency.
5. Results and Discussion
5.1. Temperature Distribution Along the Cable Length for Varying Conductor Radii
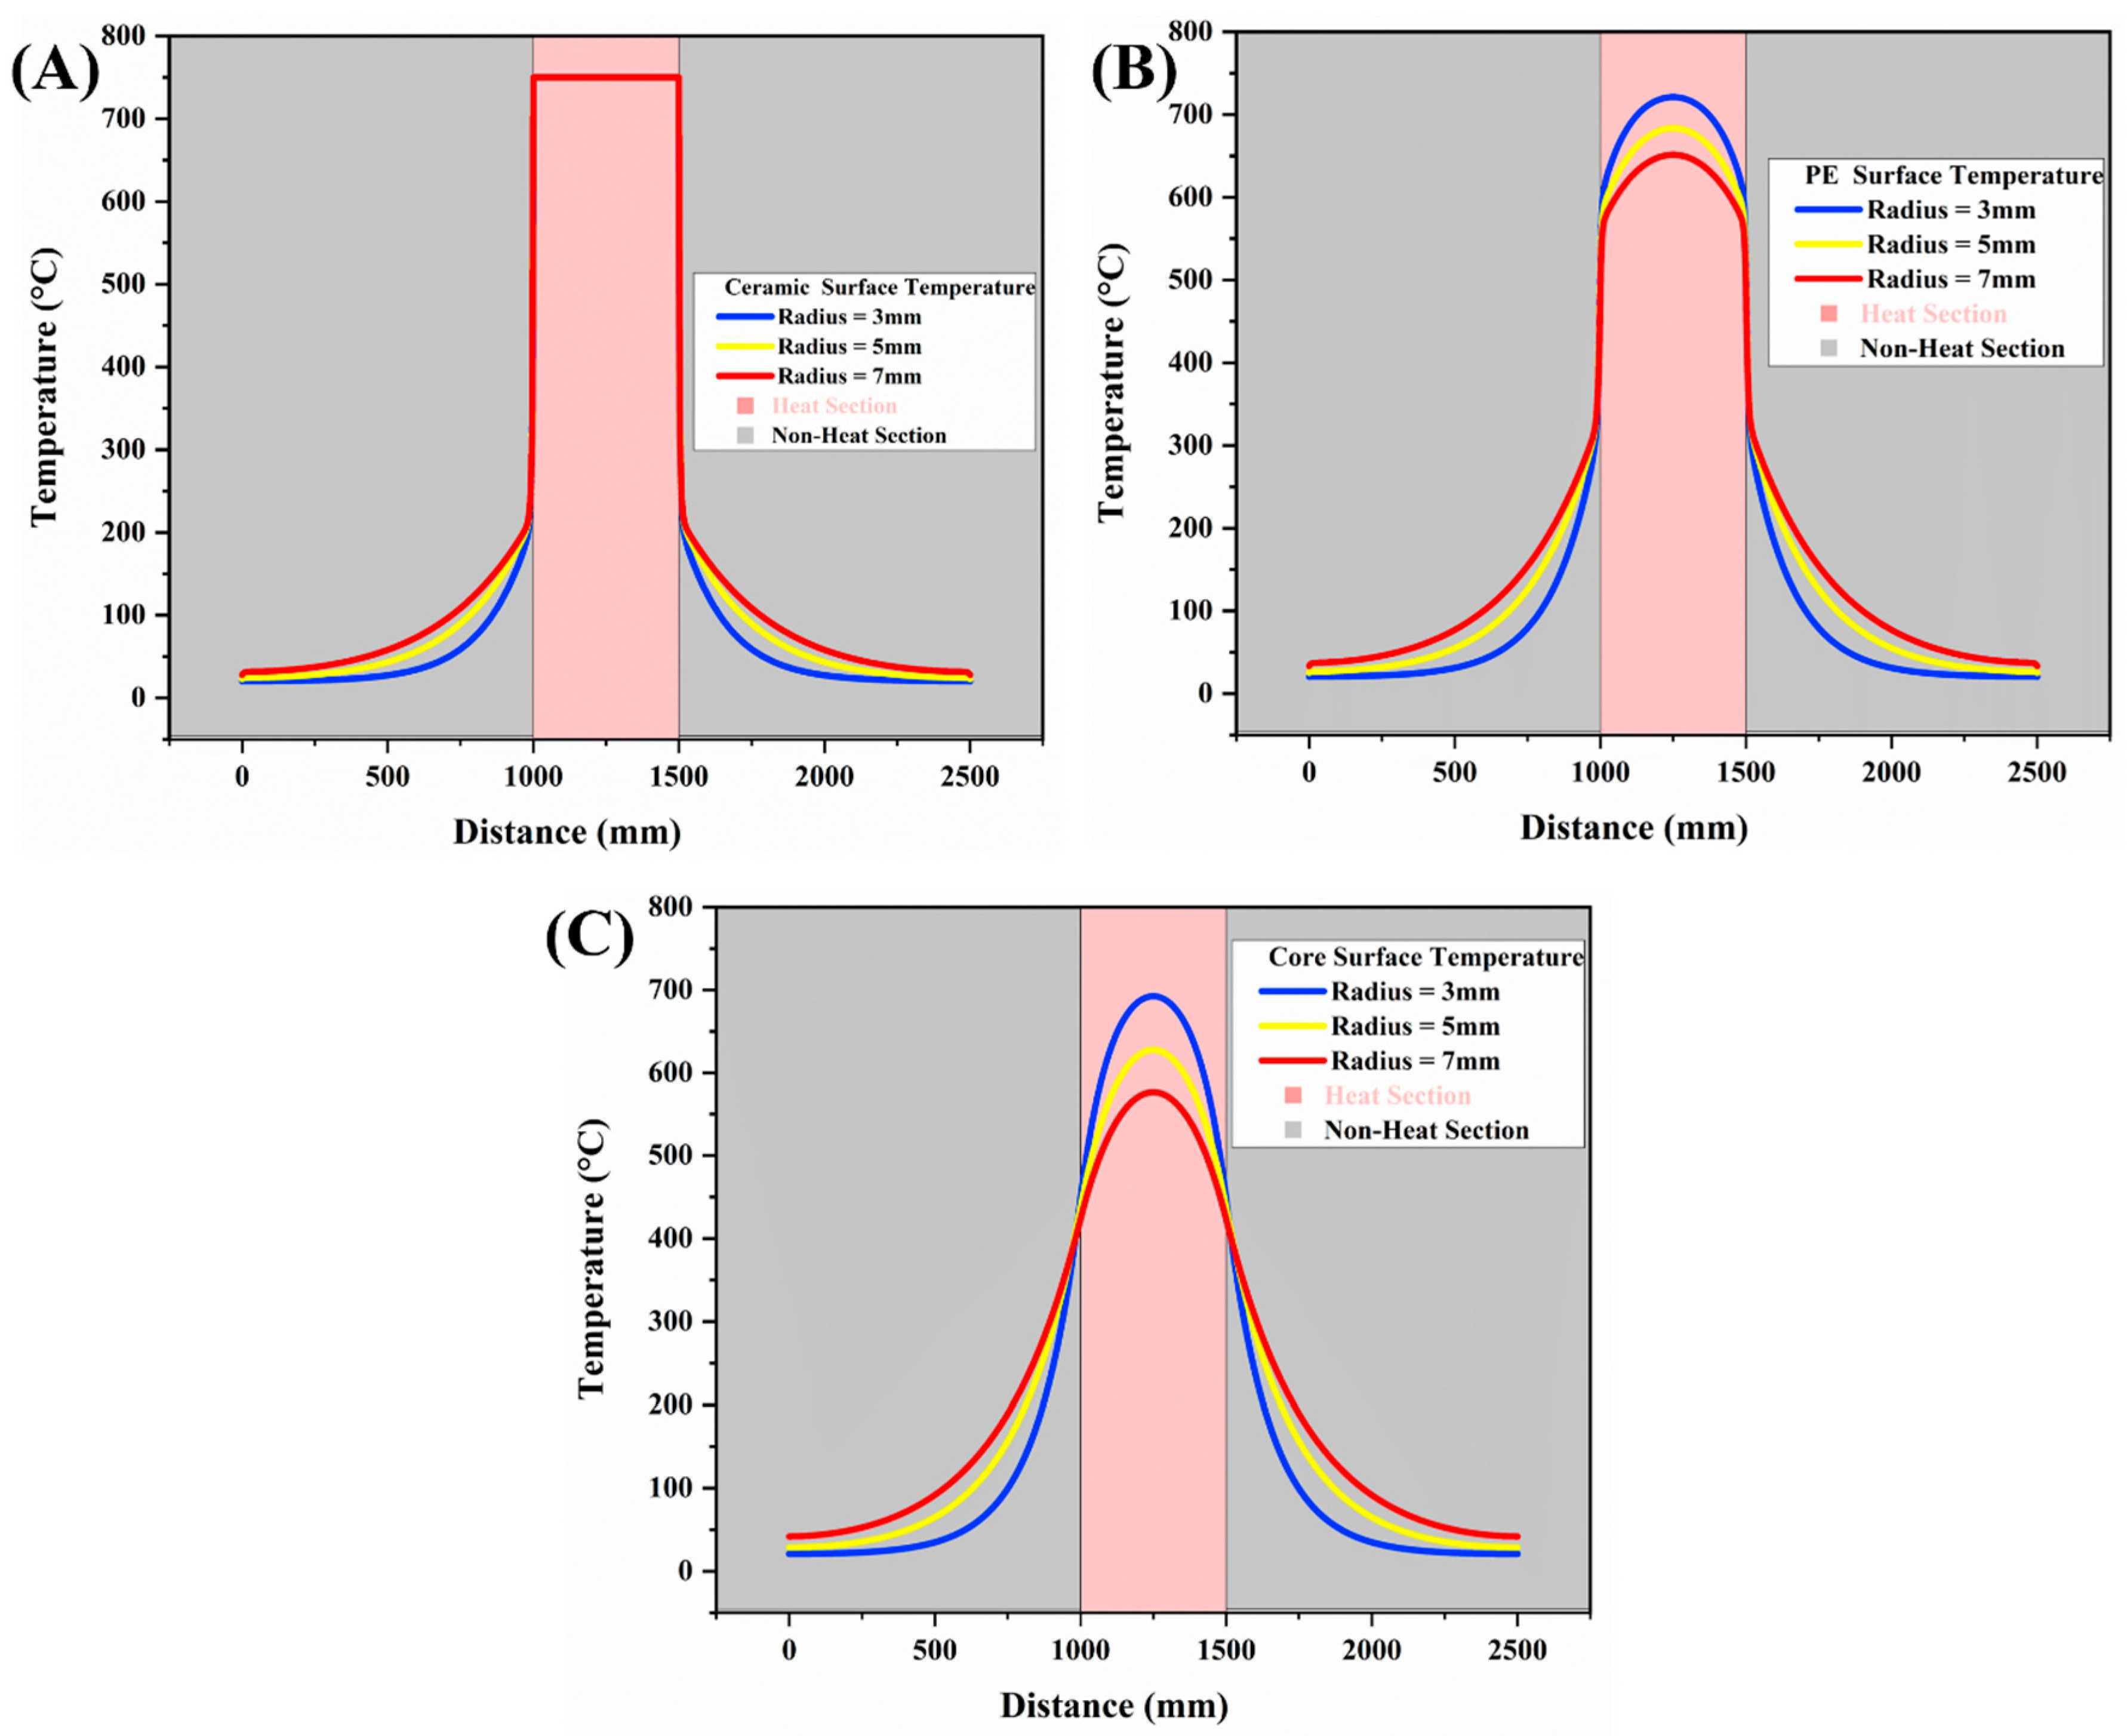
The results of the temperature profiles along the cable length for varying conductor radii (3 mm, 5 mm, and 7 mm) provide significant insights into the thermal behaviour of fire-resistant cables. The ceramic surface, functioning as the outermost thermal barrier, consistently reaches the maximum temperature of 750 °C in the heated section (1000–1500 mm) for all radii, as shown in
Figure 5A. This uniformity results in its direct exposure to the external heat source and efficiency in resisting outward heat transfer. However, notable differences emerge in the intermediate polyethylene (PE) layer as shown in
Figure 5B, where maximum surface temperatures decrease with increasing conductor radius: 721 °C, 683 °C, and 651 °C for 3 mm, 5 mm, and 7 mm radius, respectively. This trend indicates that a larger conductor radius reduces the heat transfer rate from the conductor to the ceramic layer, highlighting the PE layer’s insulating role. Similarly, from
Figure 5C, the copper conductor’s surface temperatures follow a decreasing trend: 692 °C for 3 mm, 627 °C for 5 mm, and 576 °C for 7 mm radius. This reduction is attributed to larger conductors’ increased thermal mass and surface area, which distribute heat more uniformly and lower the surface intensity. The temperature drop across the layers is more pronounced for larger radii, with a 173 °C difference from Cu to ceramic in the 7 mm radius compared to 57 °C for the 3 mm radius. This enhanced thermal dissipation reduces heat flux intensity, thereby improving resistance to thermal shocks and fire conditions. While the ceramic layer maintains its shielding efficiency, a larger radius necessitates proportional increases in its thickness to counteract the higher heat flux from the conductor.
The observed temperature differences stem from variations in heat transfer dynamics influenced by the conductor’s geometry. A smaller radius leads to higher heat intensities due to a smaller cross-sectional area, which concentrates heat generation and reduces the heat path to the surroundings. Conversely, a larger radius reduces the thermal resistance between the conductor and surrounding layers, allowing heat to dissipate more effectively across the insulation and ceramic layers. While the ceramic layer demonstrates robust thermal resistance by maintaining the external temperature at 750 °C, the intermediate and inner layers display the effects of radius-induced thermal gradients. These indicate that increasing conductor radius improves thermal management by distributing heat more evenly. However, careful insulation and barrier material optimisation is required to maintain fire resistance. Notably, in the heated zone, the copper conductor consistently exhibits lower surface temperatures than the outer ceramic layer due to inward radial heat transfer. However, in the non-heated sections, the conductor shows higher temperatures, serving as the primary heat source for these regions. This is because the conductor facilitates axial heat transfer, acting as a thermal conduit that transports heat from the heated zone to the adjacent non-heated sections, followed by outward heat transfer to the surrounding upper layers.
5.2. Heat Map of Temperature Distribution
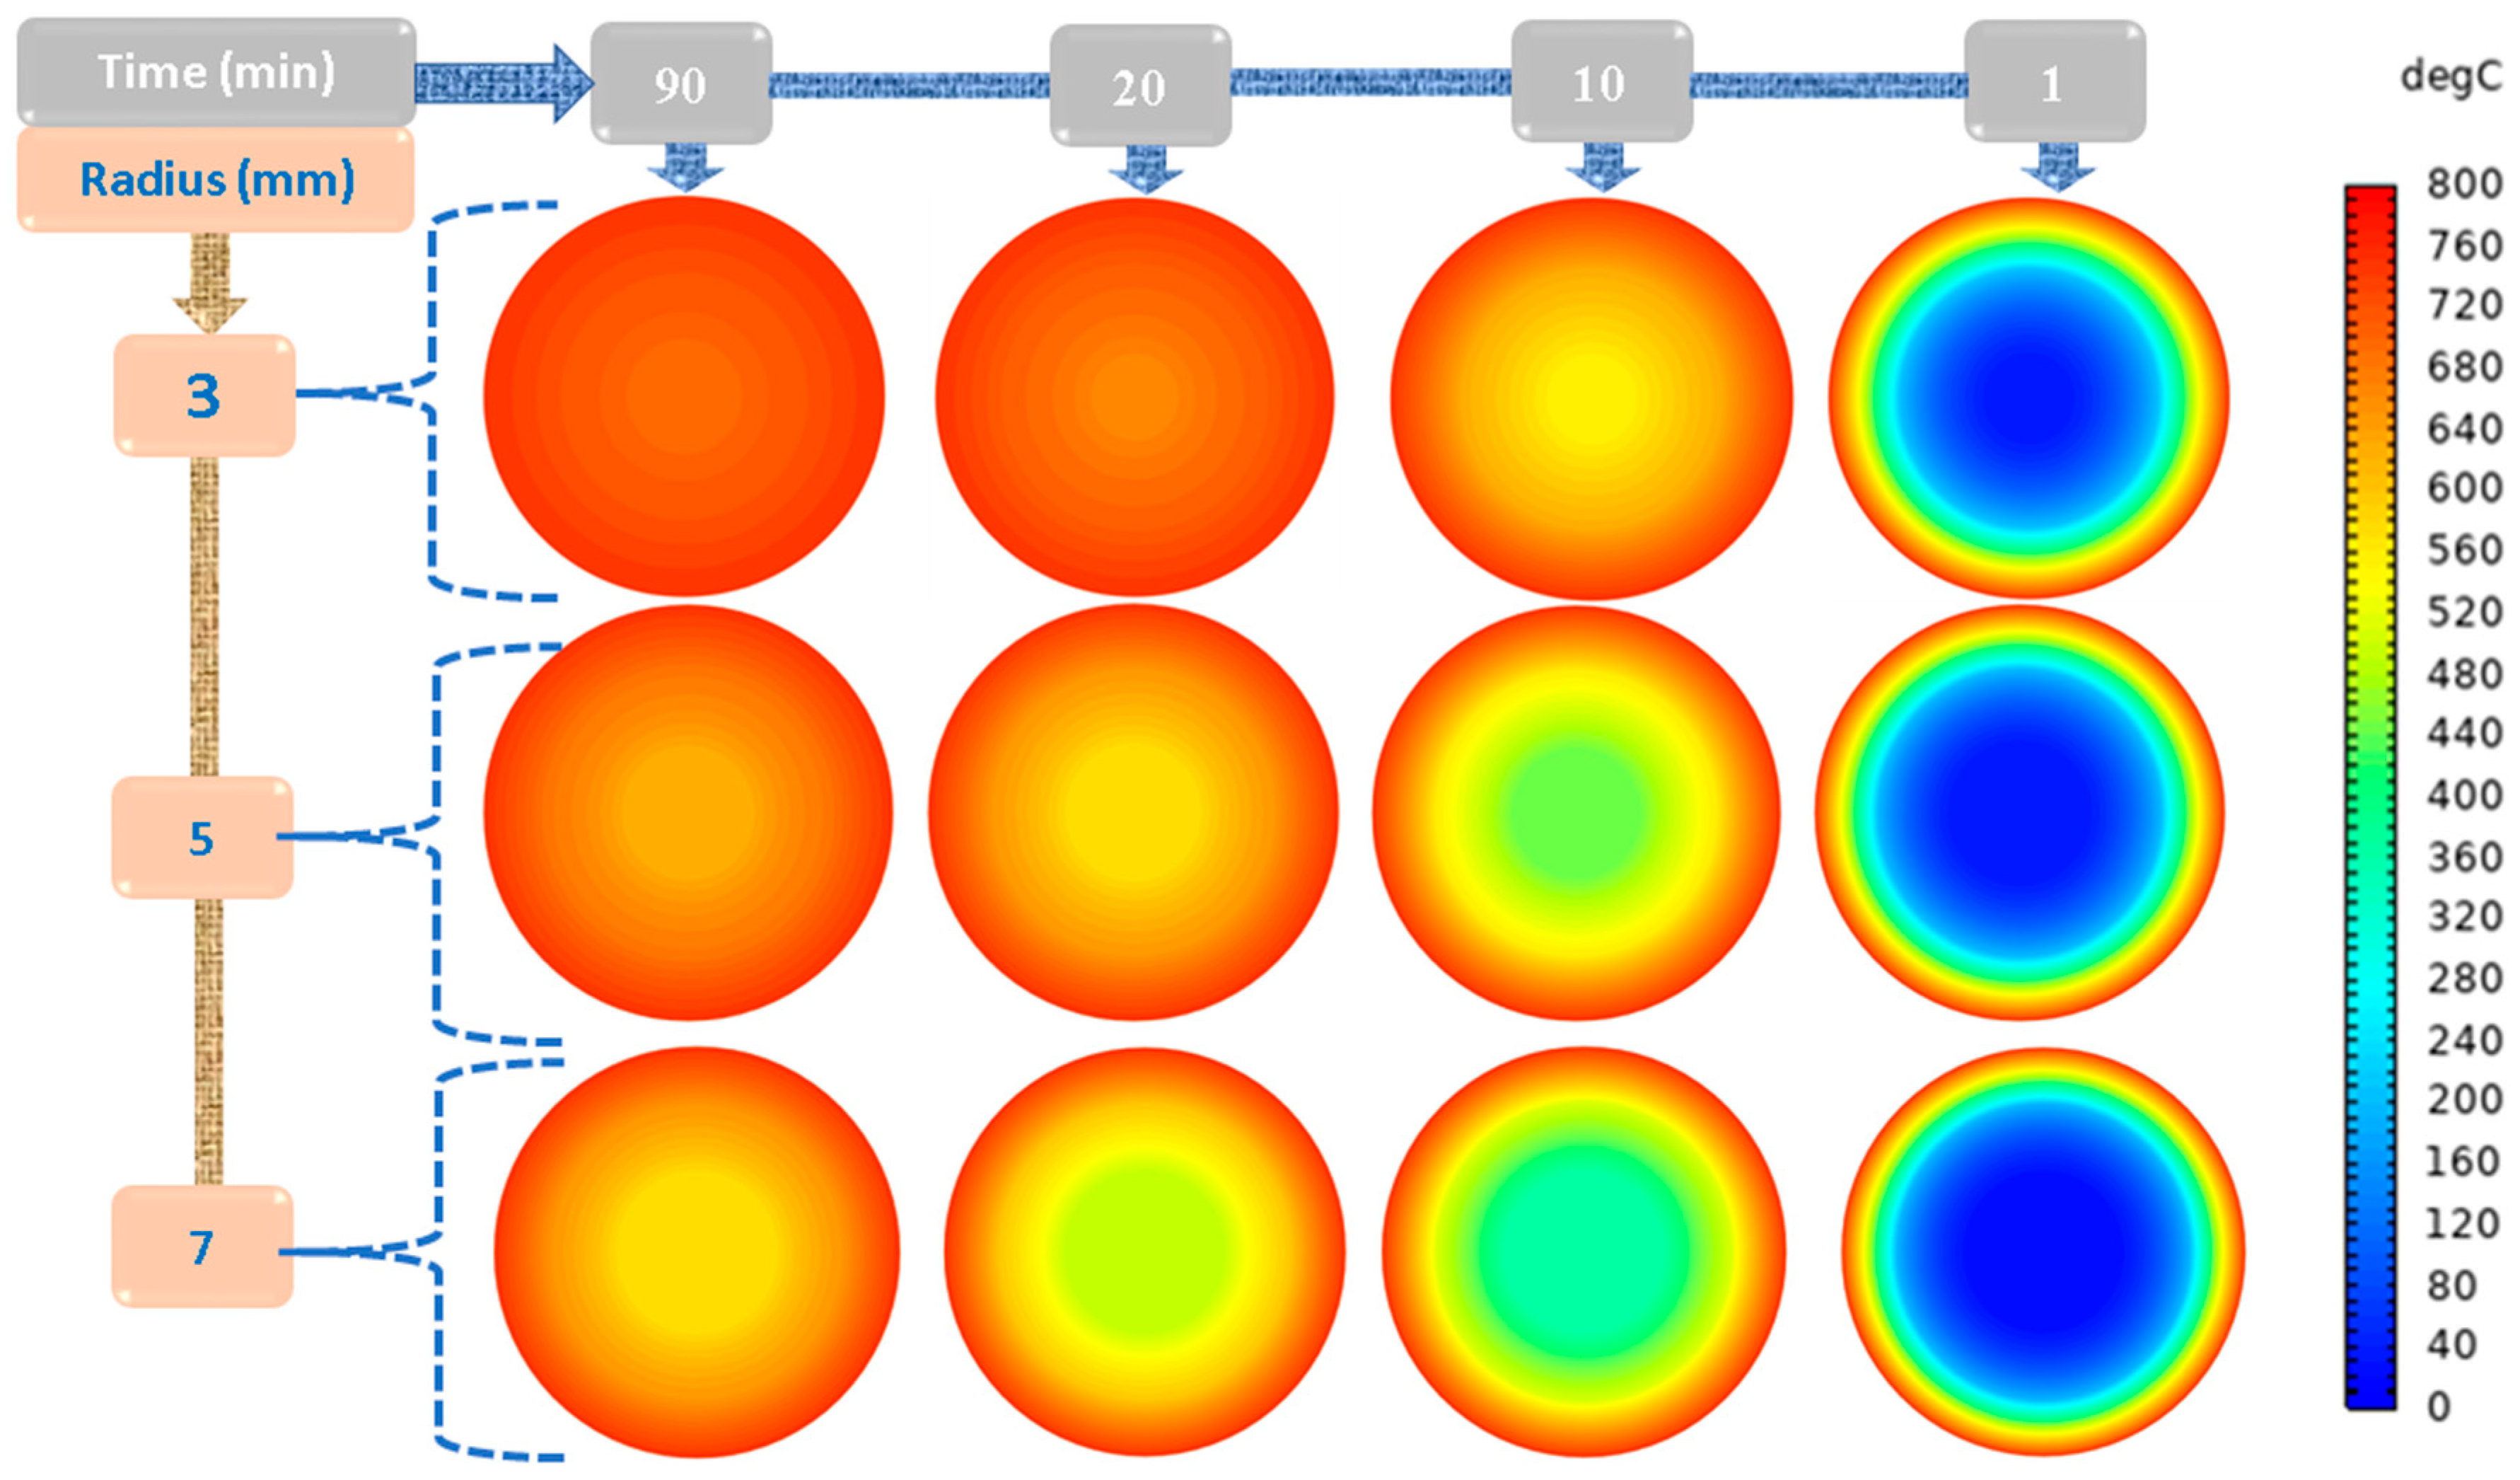
The heat source section’s heat map for different conductor radii (3, 5, and 7 mm) over time (1 min, 10 min, 20 min, and 90 min) reveals significant insights into heat transfer dynamics in the cable. We notice from
Figure 6 that for the smallest radius (3 mm), the core temperature is highly concentrated and rises rapidly due to the limited thermal mass, resulting in steep gradients and slower heat propagation to the outer layers. This leads to pronounced thermal stress in the intermediate polyethylene (PE) and ceramic layers, making them less stable under prolonged heat exposure. For the 5 mm radius, the heat distribution improves, with the core experiencing lower peak temperatures and a more gradual outward propagation of heat over time.
The 7 mm radius shows the most uniform temperature distribution across all layers, with significantly reduced core temperatures and faster heat dissipation to the outer ceramic layer, even at earlier time intervals. A larger radius demonstrates enhanced thermal stability due to the increased thermal mass and surface area, which buffer heat more effectively, reduce thermal stress, and ensure greater fire resistance. In contrast, a smaller radius exhibits higher localised heat accumulation, posing a greater risk of thermal failure under extreme conditions. These findings emphasise the thermal efficiency of a larger radius for fire-resistant cables, with the 7 mm radius outperforming smaller options in minimising temperature gradients and enhancing heat dissipation. The heat map analysis for the non-heat source section demonstrates the differences in heat transfer dynamics between conductor radii of 3 mm, 5 mm, and 7 mm over time, as shown in
Figure 7. Initially, at 1 min, minimal residual heat is observed uniformly across all radii, with temperatures close to 0 °C, indicating negligible conduction from the heat source section. As time progresses, residual heat transfers from the heat source to the non-heat source section, revealing the influence of conductor geometry on heat propagation. The smaller radius (3 mm) exhibits sharper thermal gradients and higher core temperatures, indicating a more efficient transfer of heat from the heat source to the non-heat source section. This behaviour is due to the smaller cross-sectional area, which limits the conductor’s thermal mass and results in a steeper temperature gradient, driving heat more effectively between sections.
In contrast, larger radii (5 mm and 7 mm) demonstrate a more uniform heat distribution and lower peak temperatures. The 7 mm radius, in particular, shows the lowest core temperatures and the broadest temperature zones, reflecting its superior ability to dissipate heat within the heat source section itself. This reduces the amount of heat transferred to the non-heat source section, as the larger thermal mass and surface area buffer the heat more effectively, decreasing the thermal gradient and slowing heat conduction outward. While the smaller radius is more effective at transferring heat to the non-heat source section due to its higher thermal gradient, it also experiences more significant thermal stress and localised heating. Conversely, the larger radius prioritises thermal stability by retaining and evenly distributing heat within the heat source section, reducing the risk of overheating in the non-heat source section.
5.3. Time to Steady State for Core Surface Temperature Across Varying Radii
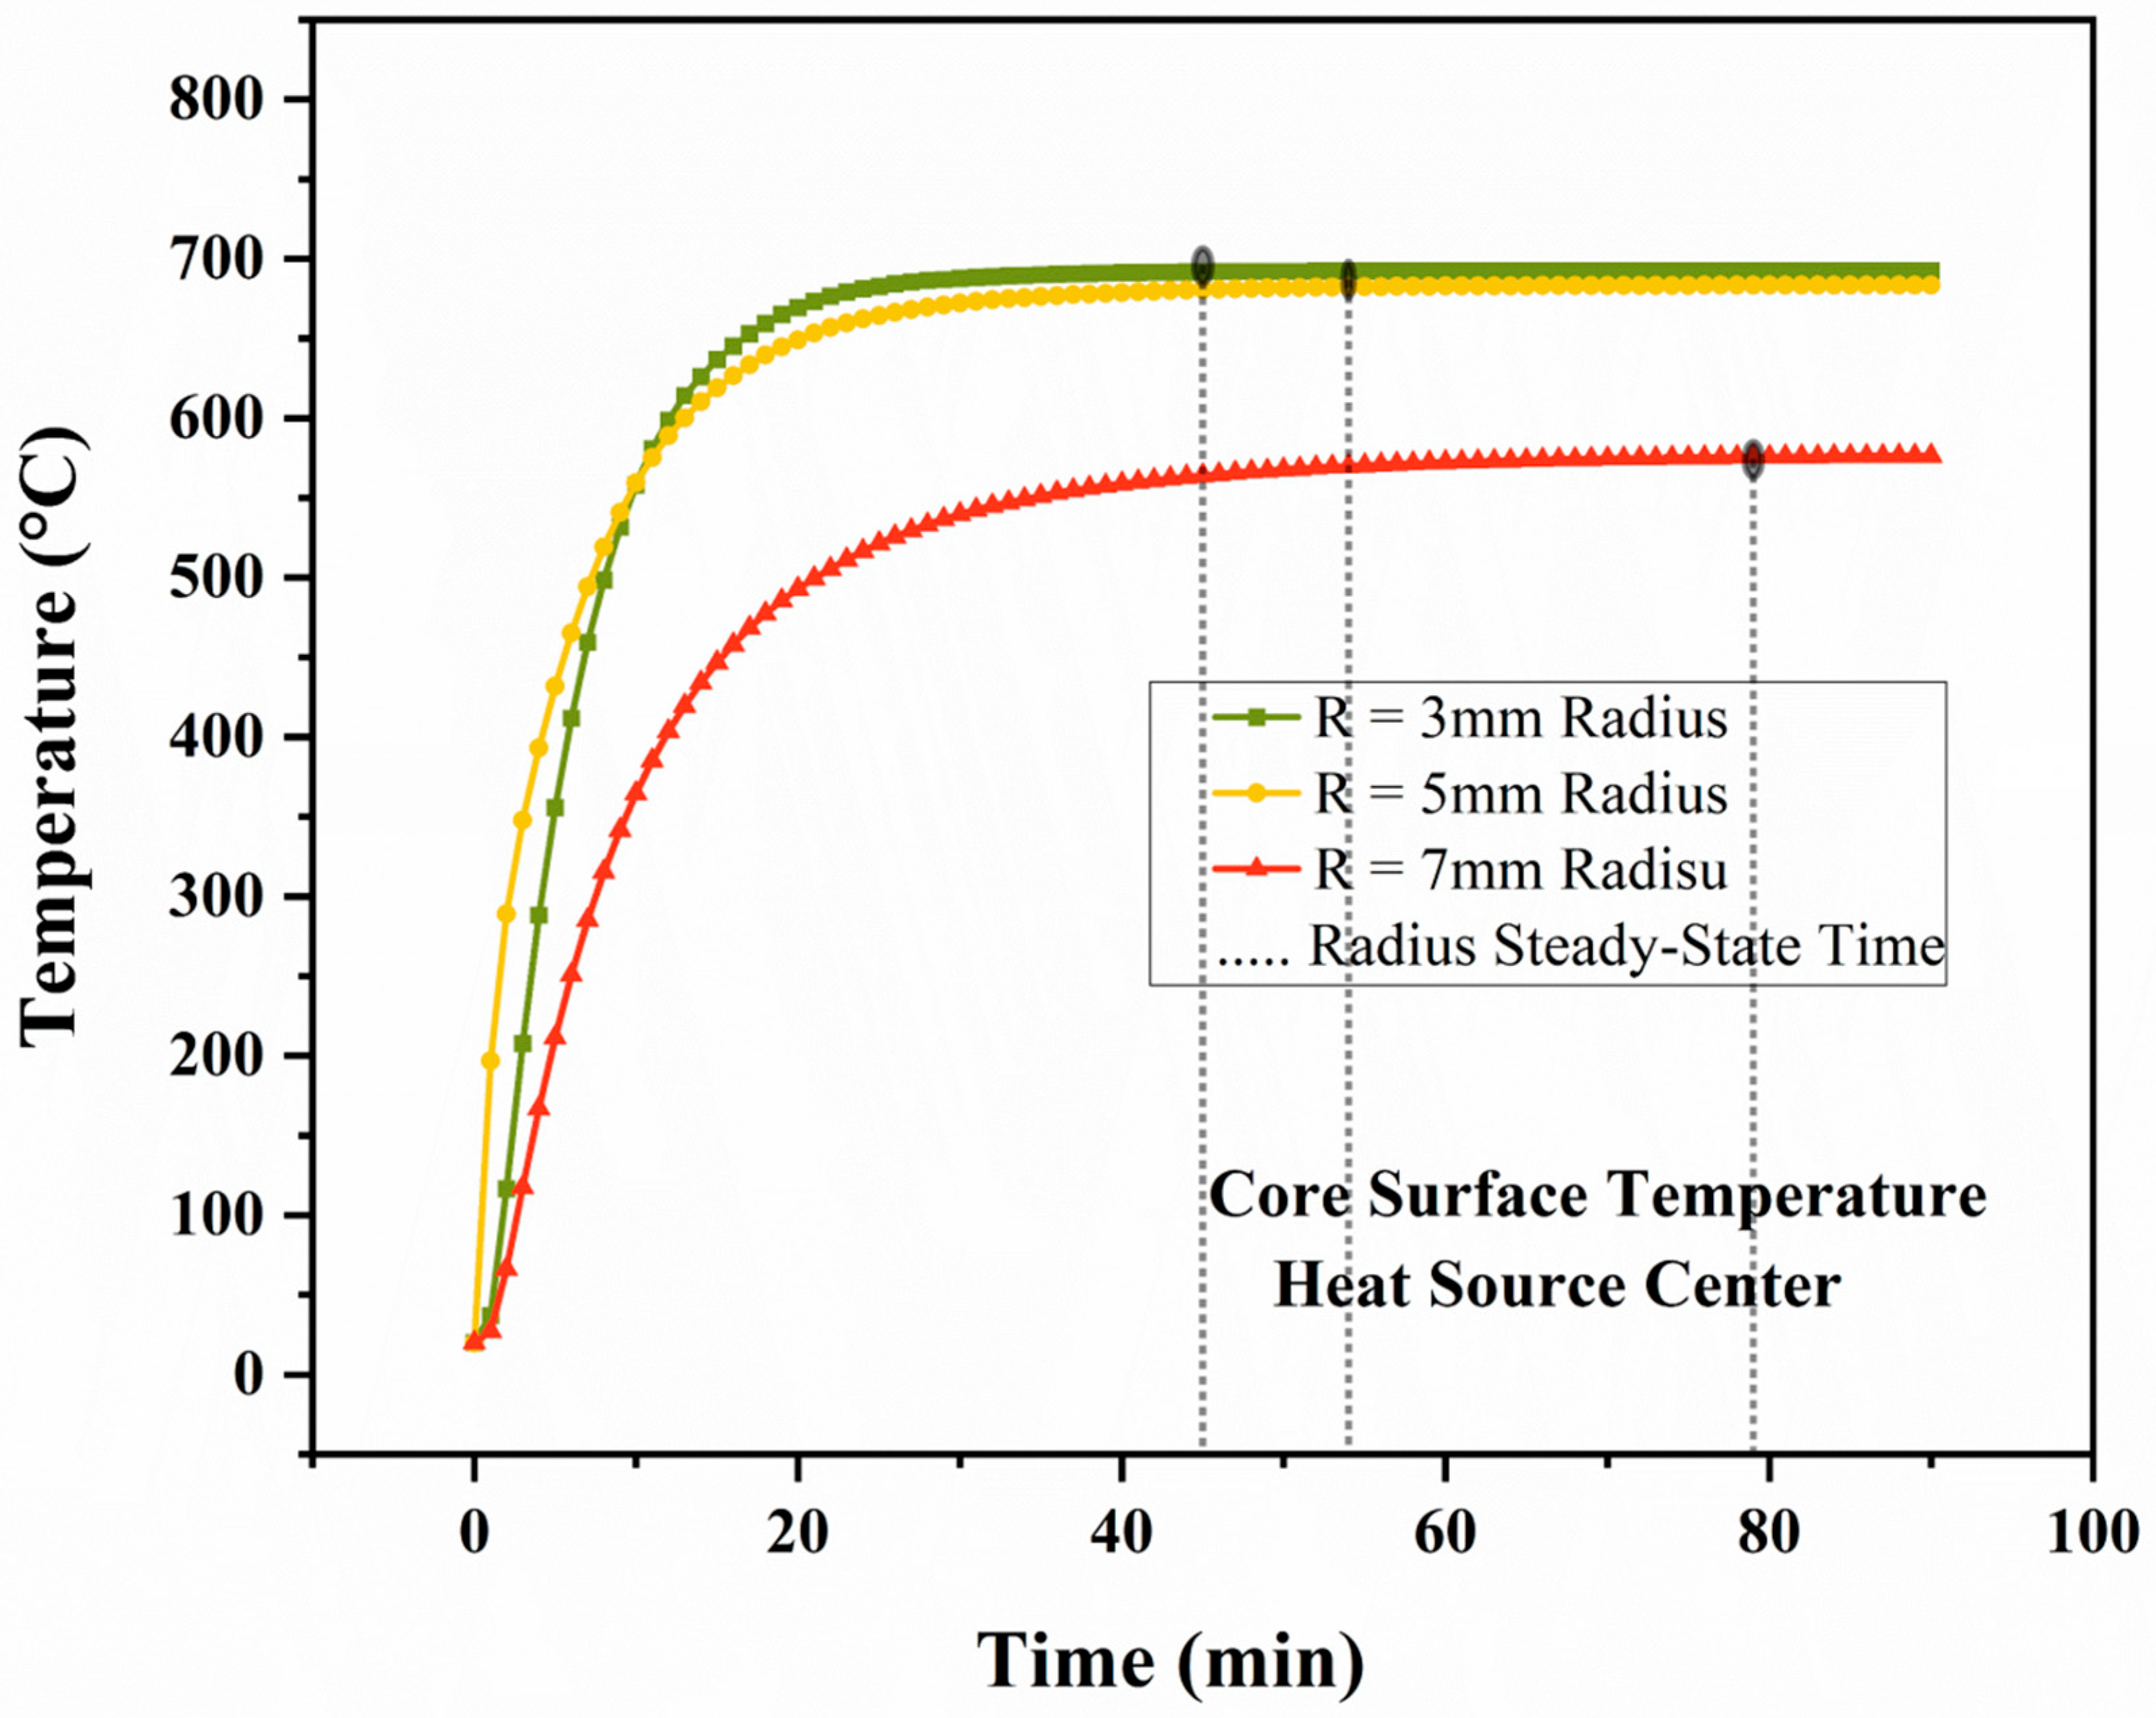
The results in
Figure 8 indicate a rapid temperature increase during the transient phase, stabilising after approximately 30 min. For R = 3 mm, the steady-state temperature reached 746 °C, closely approaching the applied heat source temperature, indicating insufficient thermal dissipation. Increasing the radius to
R = 5 mm reduced the steady-state temperature to 696 °C, while R = 7 mm achieved the most significant improvement with a steady-state temperature of 556 °C, marking a 25% reduction compared to R = 3 mm; this trend is attributed to the enhanced thermal mass and heat dissipation capability provided by the larger conductor cross-sectional area, which delays the temperature rise and reduces the thermal gradient. The initial heating rate was calculated as 25 °C/min, 22 °C/min, and 18 °C/min for R = 3 mm, R = 5 mm, and R = 7 mm, respectively, using the following:
: Change in temperature during the initial time interval.
: Corresponding time interval.
Figure 8.
Core surface temperature vs. time for different radii.
Figure 8.
Core surface temperature vs. time for different radii.
The reduced temperature gradient for a larger radius improves thermal stability in the heat source section. Further numerical evaluation of the time to reach 90% of the steady-state temperature reveals t90 = 15 min, 18 min, and 22 min for R = 3 mm, R = 5 mm, and R = 7 mm, respectively, demonstrating that a larger radius significantly increases the cable’s ability to withstand high-temperature exposure by improving thermal resistance. We notice that there is an overlap in thermal behaviour among conductors of varying radii back to similar thermal mass, the dominance of heat input, and similar surface area-to-volume ratios. Both the 3 mm and 5 mm radius conductors possess relatively small cross-sectional areas when compared to the 7 mm radius; thus, the thermal mass, represented by the product of mass and specific heat capacity (m⋅cp), is mainly dependent on the volume, which is proportional to the square of the radius (∝ R2). This leads to a minor difference in thermal mass between the 3 mm and 5 mm radii, resulting in comparable heat absorption and dissipation rates.
Additionally, with a uniform heat source of 750 °C, the thermal response in the smaller conductors (3 mm and 5 mm) is characterised by rapid heat absorption and limited dissipation due to their smaller surface area. In contrast, the larger 7 mm radius exhibits a significantly increased thermal mass that slows temperature rise and enhances heat dissipation, causing its temperature curve to be considerably lower than those of the 3 mm and 5 mm radii. Finally, the surface area-to-volume ratio for both the 3 mm and 5 mm conductors is relatively high compared to the 7 mm radius; this ratio significantly influences the heat dissipation efficiency to the environment, with minimal differences observed between the smaller radii.
5.4. Time to Reach Steady-State Temperature
A system is considered at steady state when the temperature changes by less than a predefined threshold over a specific time interval. For this analysis, as shown in
Figure 8, the criteria used are that the system reaches a steady state when ∣
∣ < ϵ, where
ϵ = 0.1 °C/min. Based on the temperature versus time data, i.e., the time to steady state (when the rate of temperature change falls below 0.1 °C/min) for each radius, we found that for the 3 mm radius, the steady state is reached at 45 min; for the 5 mm radius, it is reached at 54 min; and for the 7 mm radius, it takes 79 min. This indicates that the smaller radius stabilises faster due to its smaller thermal mass, which heats up quickly and achieves thermal equilibrium sooner, while the larger 7 mm radius takes significantly longer due to its greater thermal mass, which slows the rate of temperature rise and delays stabilisation. Although the larger radius exhibits better fire resistance by maintaining lower steady-state temperatures, it also necessitates a longer time to fully stabilise. The delayed steady state in larger conductors is due to lower thermal diffusivity and higher thermal mass, which enhance resistance to heat flux and improve thermal stability, an outcome that aligns with previous studies [
14,
41].
5.5. Total Thermal Resistance of the Cable System
The thermal resistance of the three-layer (copper core, polyethylene insulation, and ceramic outer layer) was calculated for varying conductor radii R = (3, 5, and 7) mm to evaluate the heat transfer performance under fire conditions using the following:
In this study, L is taken as 500 mm, corresponding to the length of the heat source section of the cable.
Figure 9 shows that the total thermal resistance decreases with increasing conductor radius. The total thermal resistance (
Rtotal) was calculated using Equation (6) for each conductor size. For radii of 3 mm, 5 mm, and 7 mm, the corresponding
Rtotal values were 1.0019 K/W, 0.7845 K/W, and 0.6514 K/W, respectively. These values indicate that increasing the conductor radius significantly reduces thermal resistance.
This reduction is attributed to enhanced heat conduction across the thicker polyethylene and ceramic layers. The copper core exhibited negligible thermal resistance (Rcu ≈ 0) due to its high thermal conductivity (k = 385 W/(m⋅K)). In contrast, the ceramic layer accounted for the largest resistance contribution, with values ranging from 0.5023 K/W (3 mm) to 0.3699 K/W (7 mm), followed by the polyethylene layer (RPE = 0.4996 K/W to 0.2815 K/W). The results highlight that increasing the conductor radius will significantly improve heat dissipation by reducing the thermal resistance of the insulating layers.
5.6. Analysis of Heat Dissipation
To analyse heat dissipation efficiency by radius, it is essential to evaluate how effectively each conductor radius dissipates heat under steady-state conditions. Heat dissipation efficiency can be quantified by comparing the heat flux through the cable surface and examining the steady-state temperatures for the different radii. The heat dissipation rate
Q is determined by the following equation:
where Δ
T represents the temperature difference between the heat source and the steady-state surface temperature (
Tsource −
Tsteady), and
Rtotal denotes the total thermal resistance (in K/W).
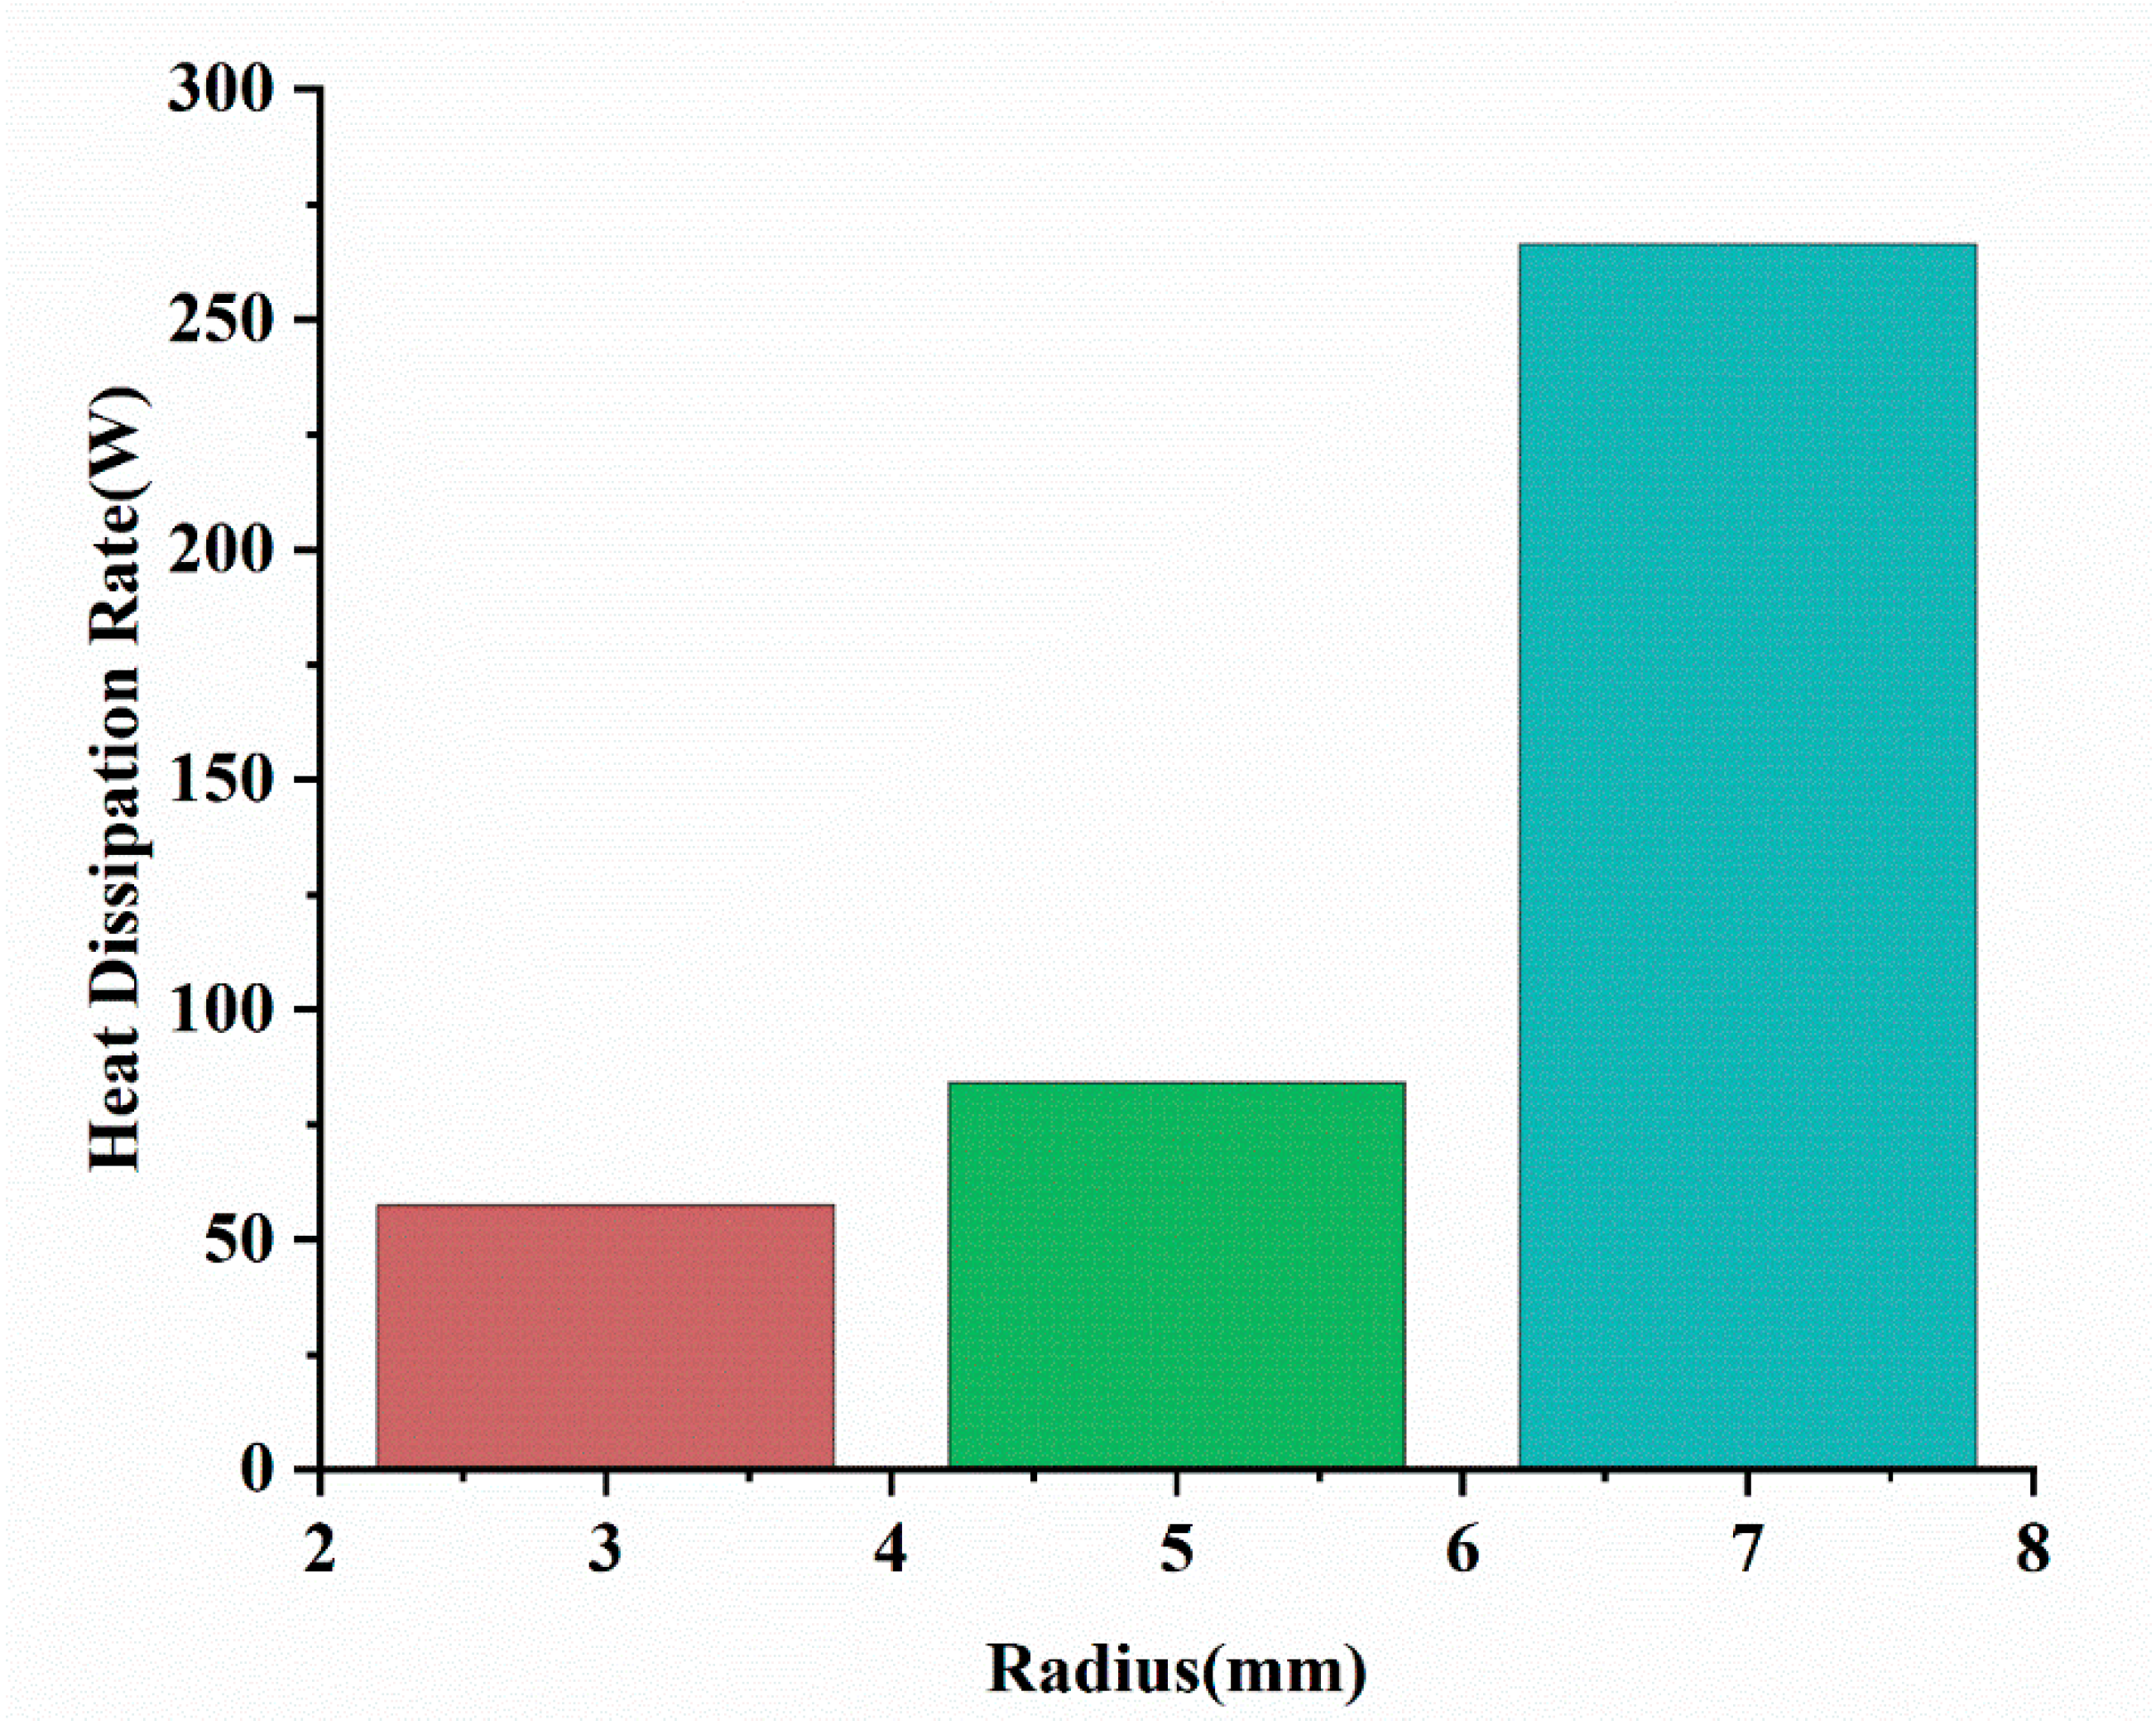
Based on a thorough analysis of the heat dissipation efficiency for each conductor radius, including steady-state temperatures, thermal resistances, and heat dissipation rates presented in
Table 2 and
Figure 8,
Figure 9 and
Figure 10 we observed that conductor radius has a critical impact on the cable’s overall thermal performance. As the conductor radius increases from 3 mm to 7 mm, the steady-state temperature decreases significantly, from 692 °C to 574 °C, due to improved heat dissipation and reduced thermal stress. Thermal resistance also decreases from 1.0019 K/W to 0.6514 K/W, highlighting the enhanced efficiency of larger radii in conducting heat through the cable layers. Notably, the heat dissipation rate increases dramatically, from 57.5 W for the 3 mm radius to 266.4 W for the 7 mm radius, showing that larger radii allow the cable to handle extreme thermal loads more effectively. These findings reveal a non-linear relationship, where larger radii provide disproportionately greater thermal benefits. Such findings align with existing research on the role of geometry in enhancing conductive and convective heat dissipation in cable systems [
42,
43].
5.7. Effect of Polyethylene and Ceramic Conductivities on Thermal Resistance and Temperature Dynamics
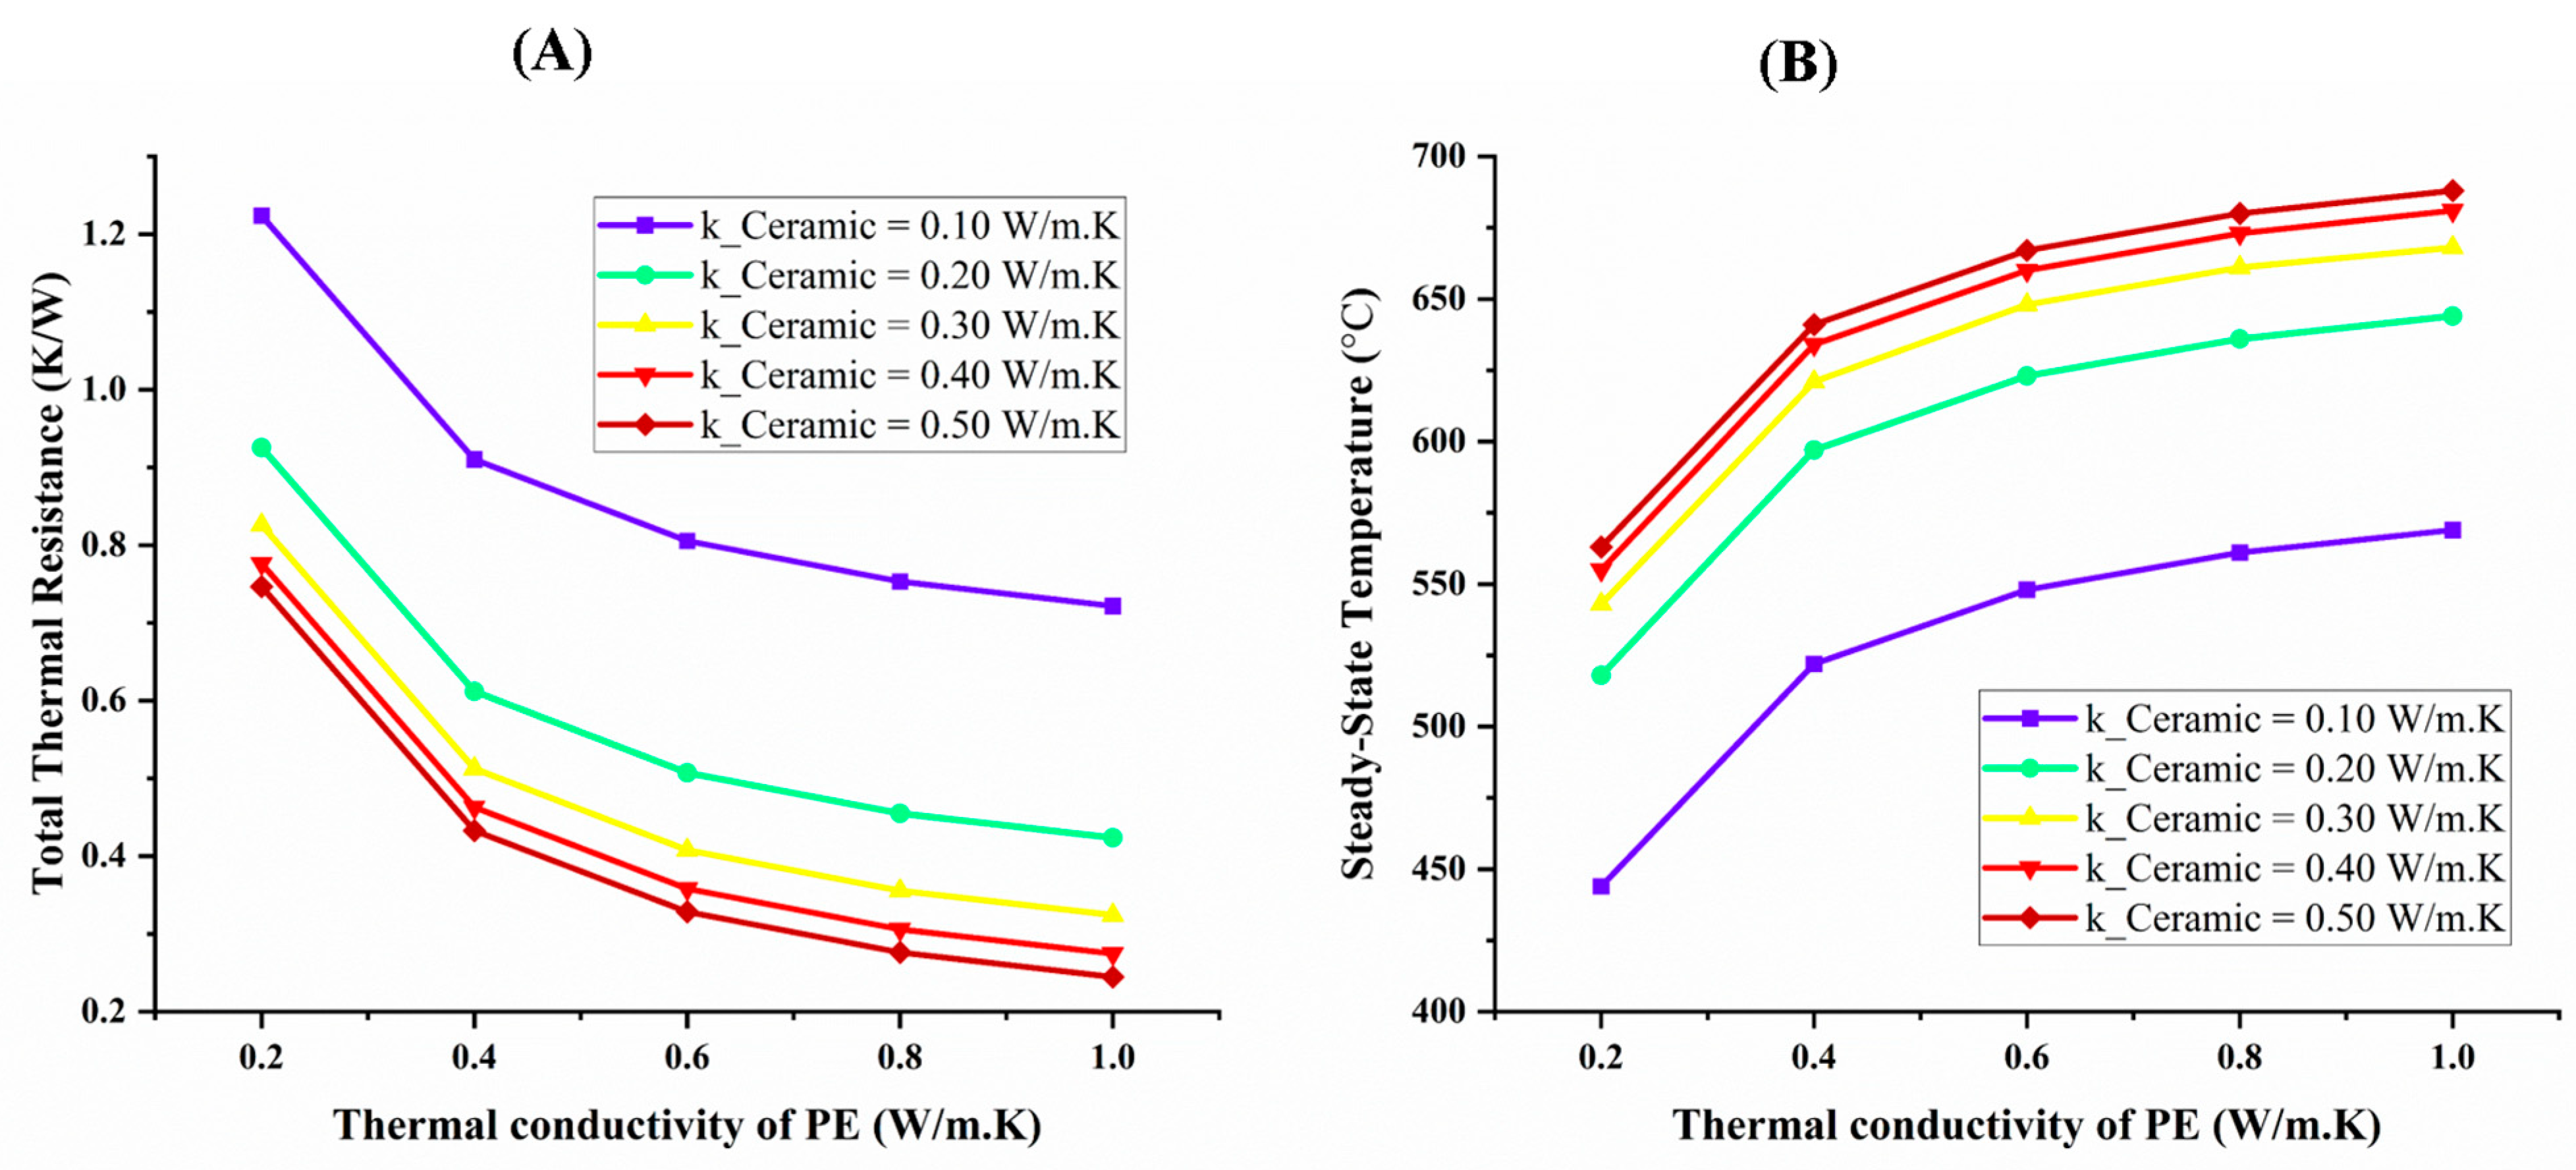
The provided figure illustrates the relationship between the thermal conductivity of polyethylene (K
PE) and two critical thermal performance parameters of the cable: total thermal resistance (R
total) and steady-state temperature (
TSteady). In
Figure 11A, R
total decreases significantly as K
PE increases, with the rate of decline becoming less pronounced for higher values of K
PE. For example, at K
PE = 0.2 W/m·K, R
total is 1.22 kW for K
Ceramic = 0.1 W/m·K, but it reduces to 0.72 kW at K
PE = 1.0 W/m·K, demonstrating diminishing returns for higher PE conductivities. This trend is observed across all ceramic layer conductivities (K
Ceramic), emphasising the diminishing returns of increasing K
PE at high thermal conductivity levels. Notably, R
total is consistently lower for higher K
Ceramic values, such as 0.41 kW at K
Ceramic = 0.5 W/m·K compared to 0.72 kW at K
Ceramic = 0.1 W/m·K, demonstrating the critical role of the ceramic layer in improving overall thermal performance. In
Figure 11B,
TSteady shows an inverse trend to R
total, with a notable increase as K
PE increases. For instance, at K
PE = 0.2 W/m·K and K
Ceramic = 0.1 W/m·K,
TSteady is 444 °C, but it rises to 569 °C at K
PE = 1.0 W/m·K. However, this increases plateaus for higher K
PE, indicating that further enhancements in PE conductivity yield minimal benefits beyond a certain threshold. The impact of K
Ceramic on
TSteady is substantial, with higher K
Ceramic leading to significantly higher steady-state temperatures at K
PE = 0.2 W/m·K, where
TSteady rises from 444 °C at K
Ceramic = 0.1 W/m·K to 563 °C at K
Ceramic = 0.5 W/m·K. This highlights that optimising K
Ceramic is more impactful than increasing K
PE. This analysis reveals that optimising thermal performance necessitates a balanced consideration of polyethylene’s thermal conductivity (K
PE and ceramic thermal conductivity (K
Ceramic)) to achieve optimal thermal performance, with a focus on maximising K
Ceramic for substantial gains in heat dissipation efficiency and conductor temperature reduction.
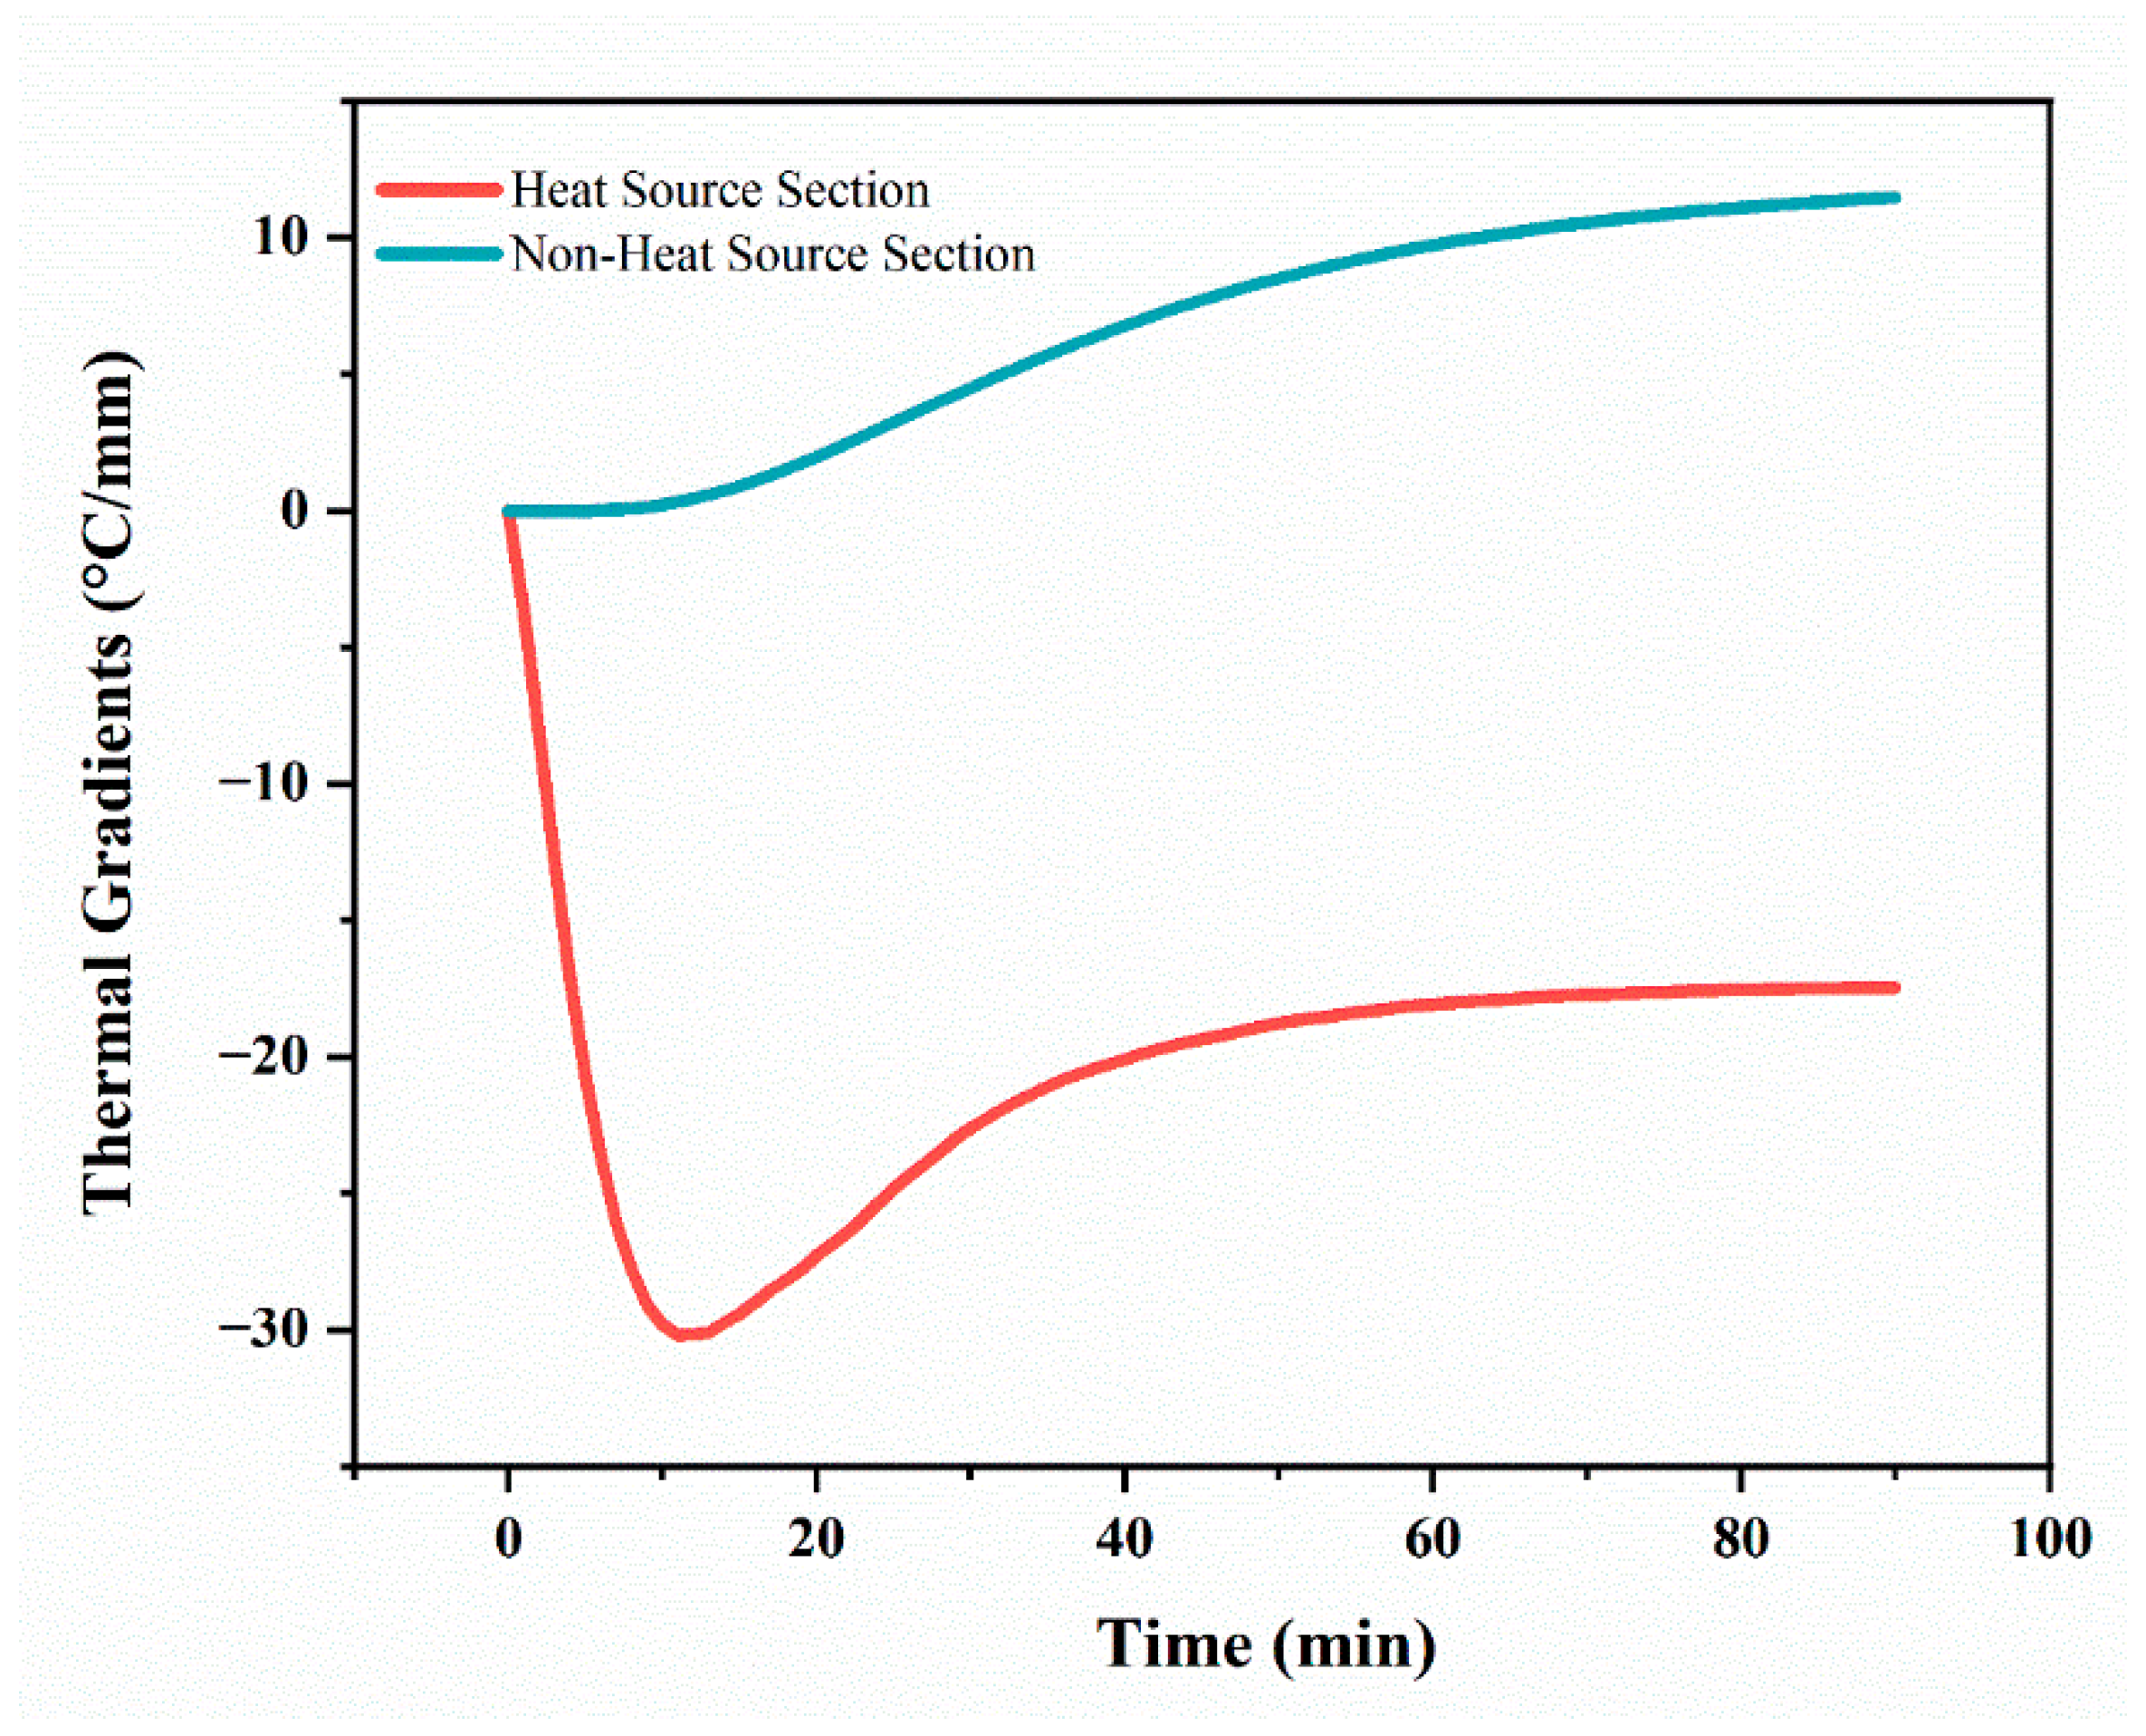
5.8. PE Surface Temperature and Thermal Gradient Analysis in Heat and Non-Heat Source Sections over Time
The analysis of PE surface temperature versus time and thermal gradient evaluation across heat and non-heat source sections offers profound insights into the thermal dynamics and fire resistance characteristics of medium-voltage cables. As shown in
Figure 12, in the heat source section (1250 mm), the PE surface temperature curves initially rise steeply, followed by a gradual stabilisation, reflecting the dominance of heat conduction during early exposure and a transition to thermal equilibrium. For a conductor radius of 3 mm, the surface temperature rapidly peaks at 721 °C, while 5 mm and 7 mm radii exhibit slower increases, peaking at 683.46 °C and 651 °C, respectively. These trends indicate that a larger radius enhances thermal inertia, delaying and reducing peak surface temperatures, which is critical for fire resistance. The slower temperature rise observed in larger radii highlights their ability to dampen heat transfer, ensuring a more uniform temperature profile over time. In the non-heat source section (2000 mm), the PE surface temperature curves show only minor increases over time, reaching maximum values of 31 °C, 55 °C, and 77 °C for conductor radii of 3 mm, 5 mm, and 7 mm, respectively. This trend highlights the limited impact of radial thermal conduction in regions away from direct heating, where the cable’s insulation plays a significant role in maintaining low surface temperatures. In
Figure 13, the thermal gradient analysis complements these findings, showing increasingly negative gradients in the heat source section, with the steepest gradient reaching −17.15 °C/mm. This steepening gradient reflects the higher temperature retention at a smaller radius and emphasises the role of radius in controlling heat dissipation. In the non-heat source section, the gradients remain negligible, peaking at 0.002 °C/mm, indicating a nearly uniform temperature distribution without external heating.
The influence of conductor radius extends beyond surface temperature trends to impact heat directionality in the vertical and horizontal axes. Smaller radii, such as 3 mm, exhibit more pronounced heat flow vertically toward the cable surface, resulting in higher surface temperatures and steeper thermal gradients. This indicates an enhanced vertical heat transfer rate due to reduced thermal resistance. Conversely, a larger radius, such as 7 mm, facilitates greater lateral (horizontal) heat spreading within the conductor core, leading to a more uniform heat distribution along the cable’s length and circumference. This lateral redistribution reduces localised thermal stresses and enhances overall thermal stability. These findings confirm the importance of optimising conductor radius to balance vertical and horizontal heat transfer dynamics, contributing to superior fire-resistant cable designs.
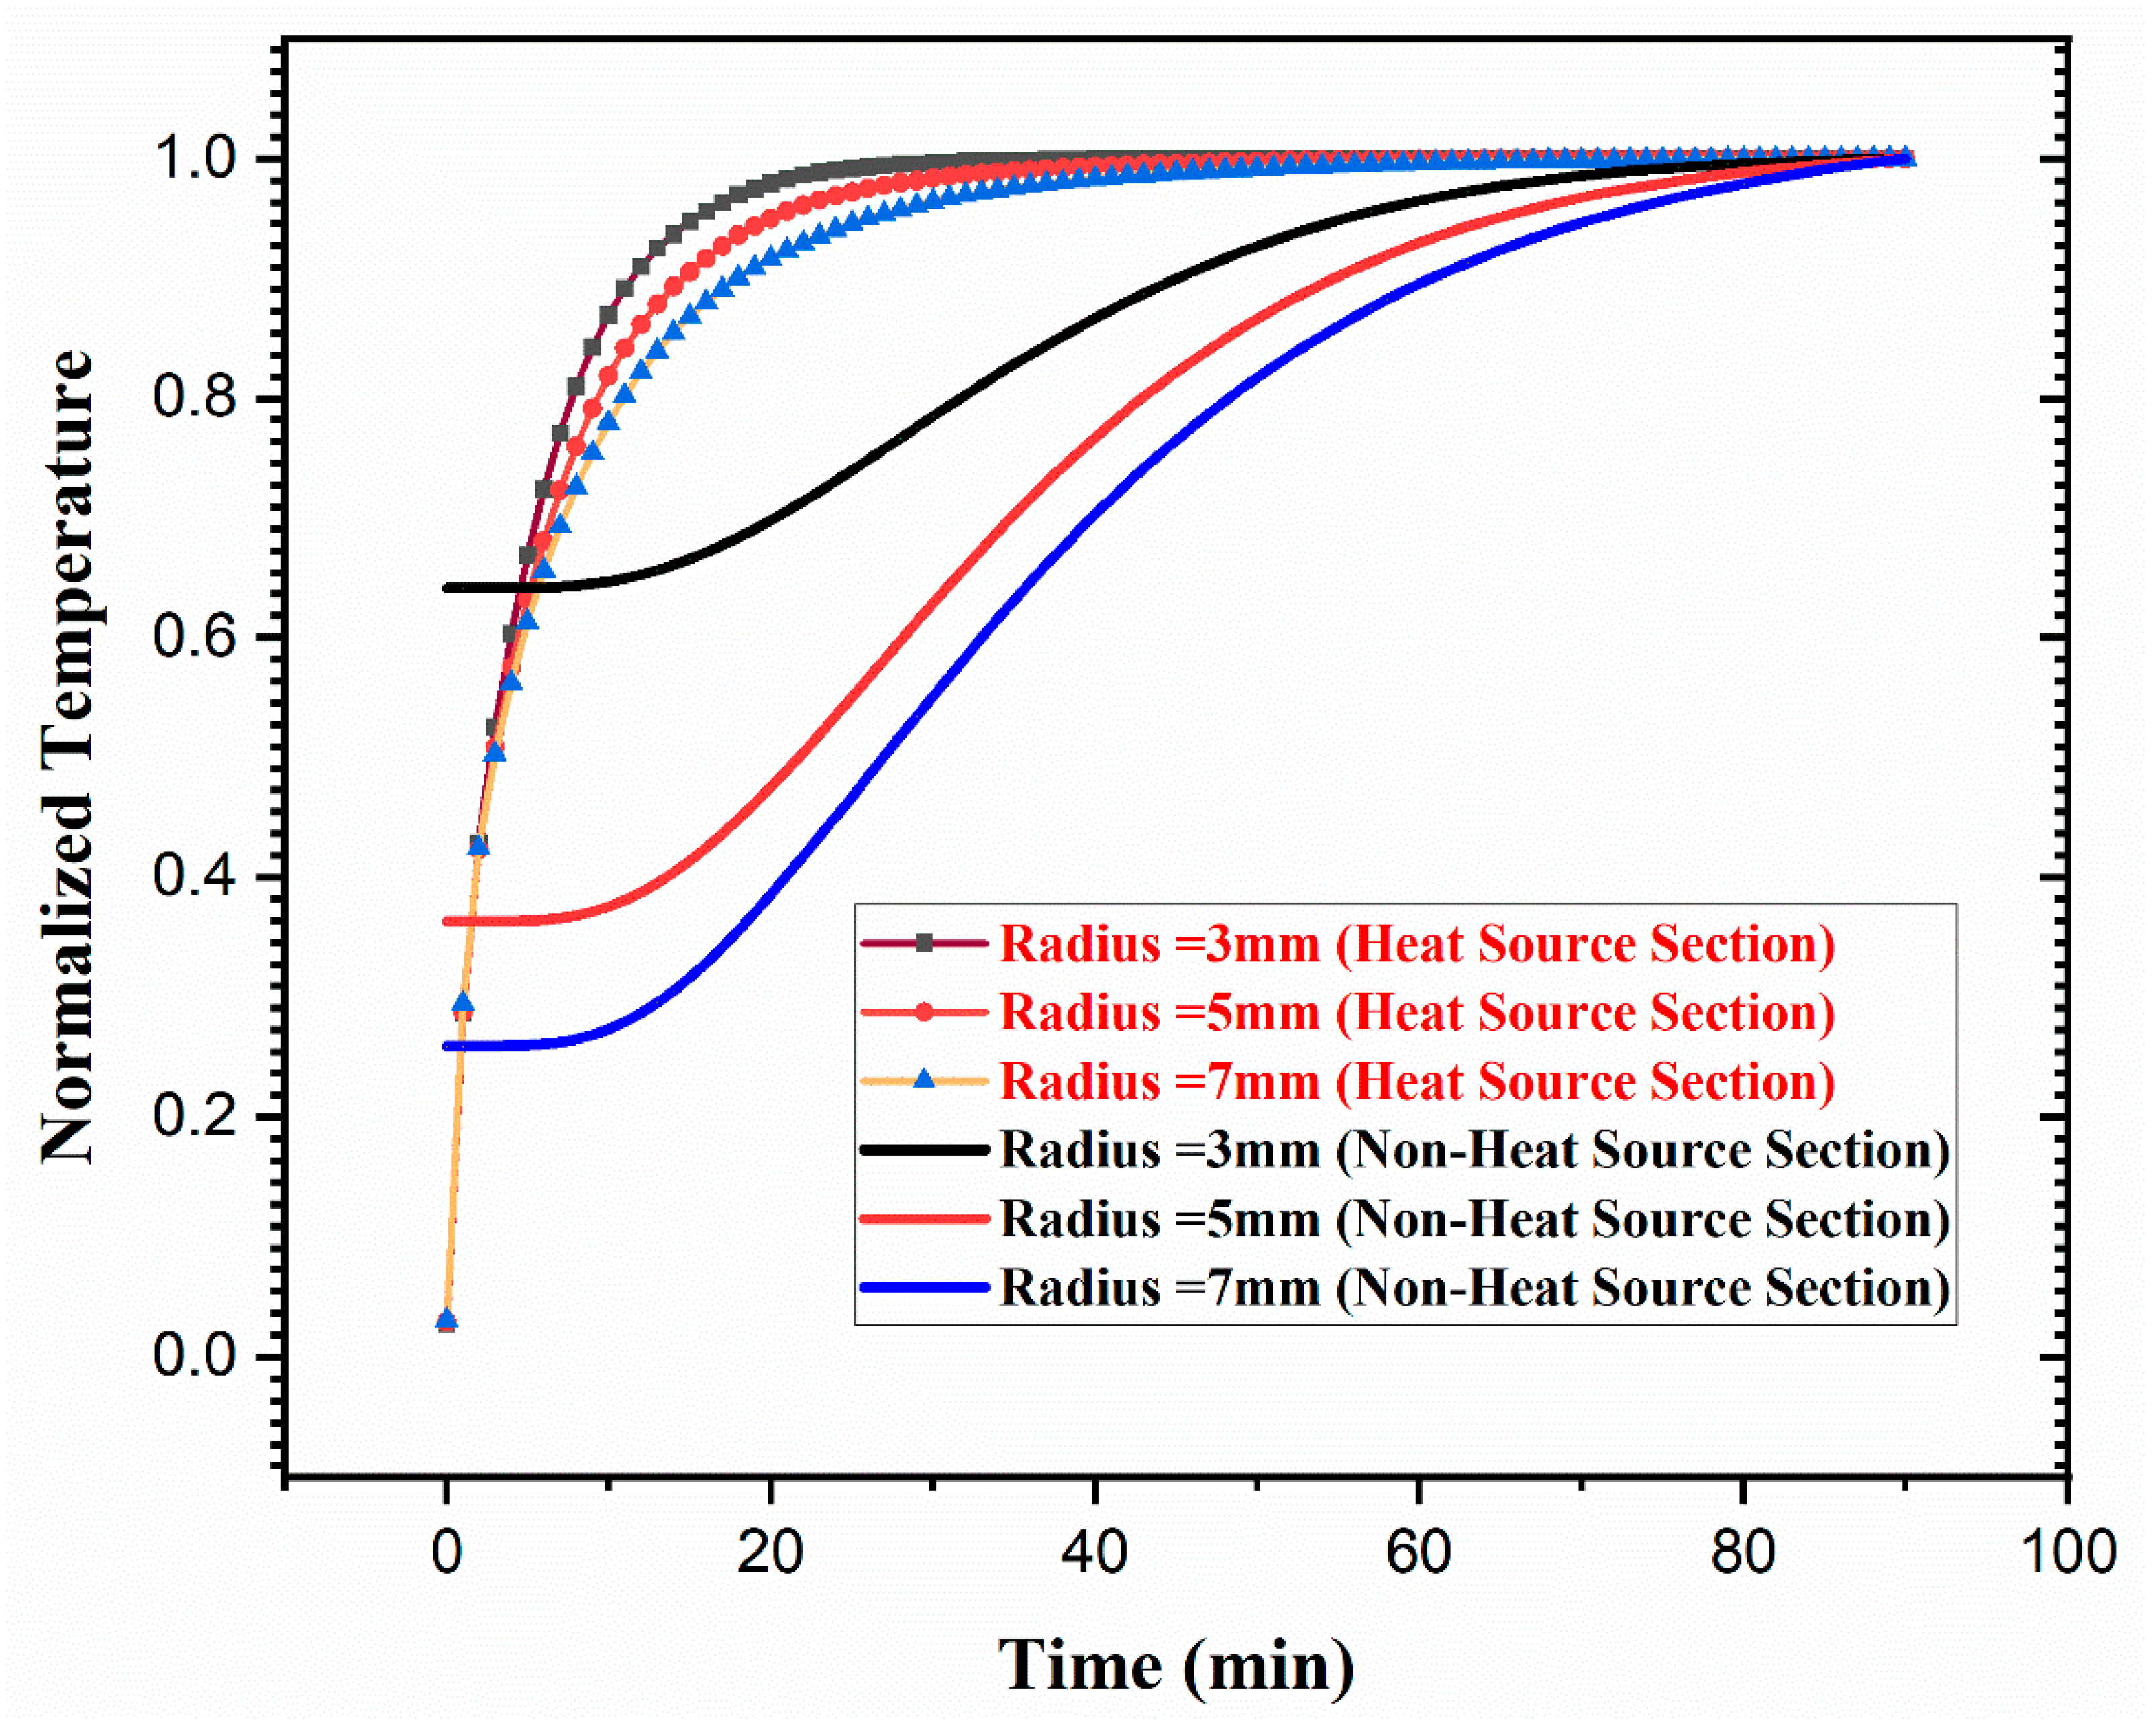
5.9. Normalised PE Surface Temperature Trends and Thermal Gradient Analysis
Figure 14 shows the normalised PE surface temperature analysis, highlighting distinct heat transfer dynamics for conductor radii of 3 mm, 5 mm, and 7 mm across both the heat source and non-heat source sections. In the heat source section, the smaller radius (3 mm) exhibits a rapid initial temperature rises, stabilising at steady state (normalised value = 1.0) within 30 min due to higher thermal resistance, which limits axial heat dissipation and retains heat locally. Conversely, the larger radius of 7 mm shows a slower stabilisation process, requiring over 50 min to reach a steady state, as its superior axial heat conduction distributes heat more effectively along the conductor. In the non-heat source section, the 3 mm radius reaches 90% of its steady-state value in approximately 40 min, while the 7 mm radius requires over 60 min, reflecting its greater thermal capacity and enhanced heat distribution efficiency. The smaller radius exhibits sharper thermal gradients, with a normalised temperature difference of approximately 0.3 between the heat and non-heat source sections at 20 min, compared to only 0.15 for the 7 mm radius. These findings indicate that while a smaller radius concentrates heat near the source, enhancing fire resistance by limiting heat propagation, a larger radius optimises thermal management by reducing localised overheating and enabling better axial heat dissipation, which is crucial for maintaining cable longevity and performance under sustained heat exposure.
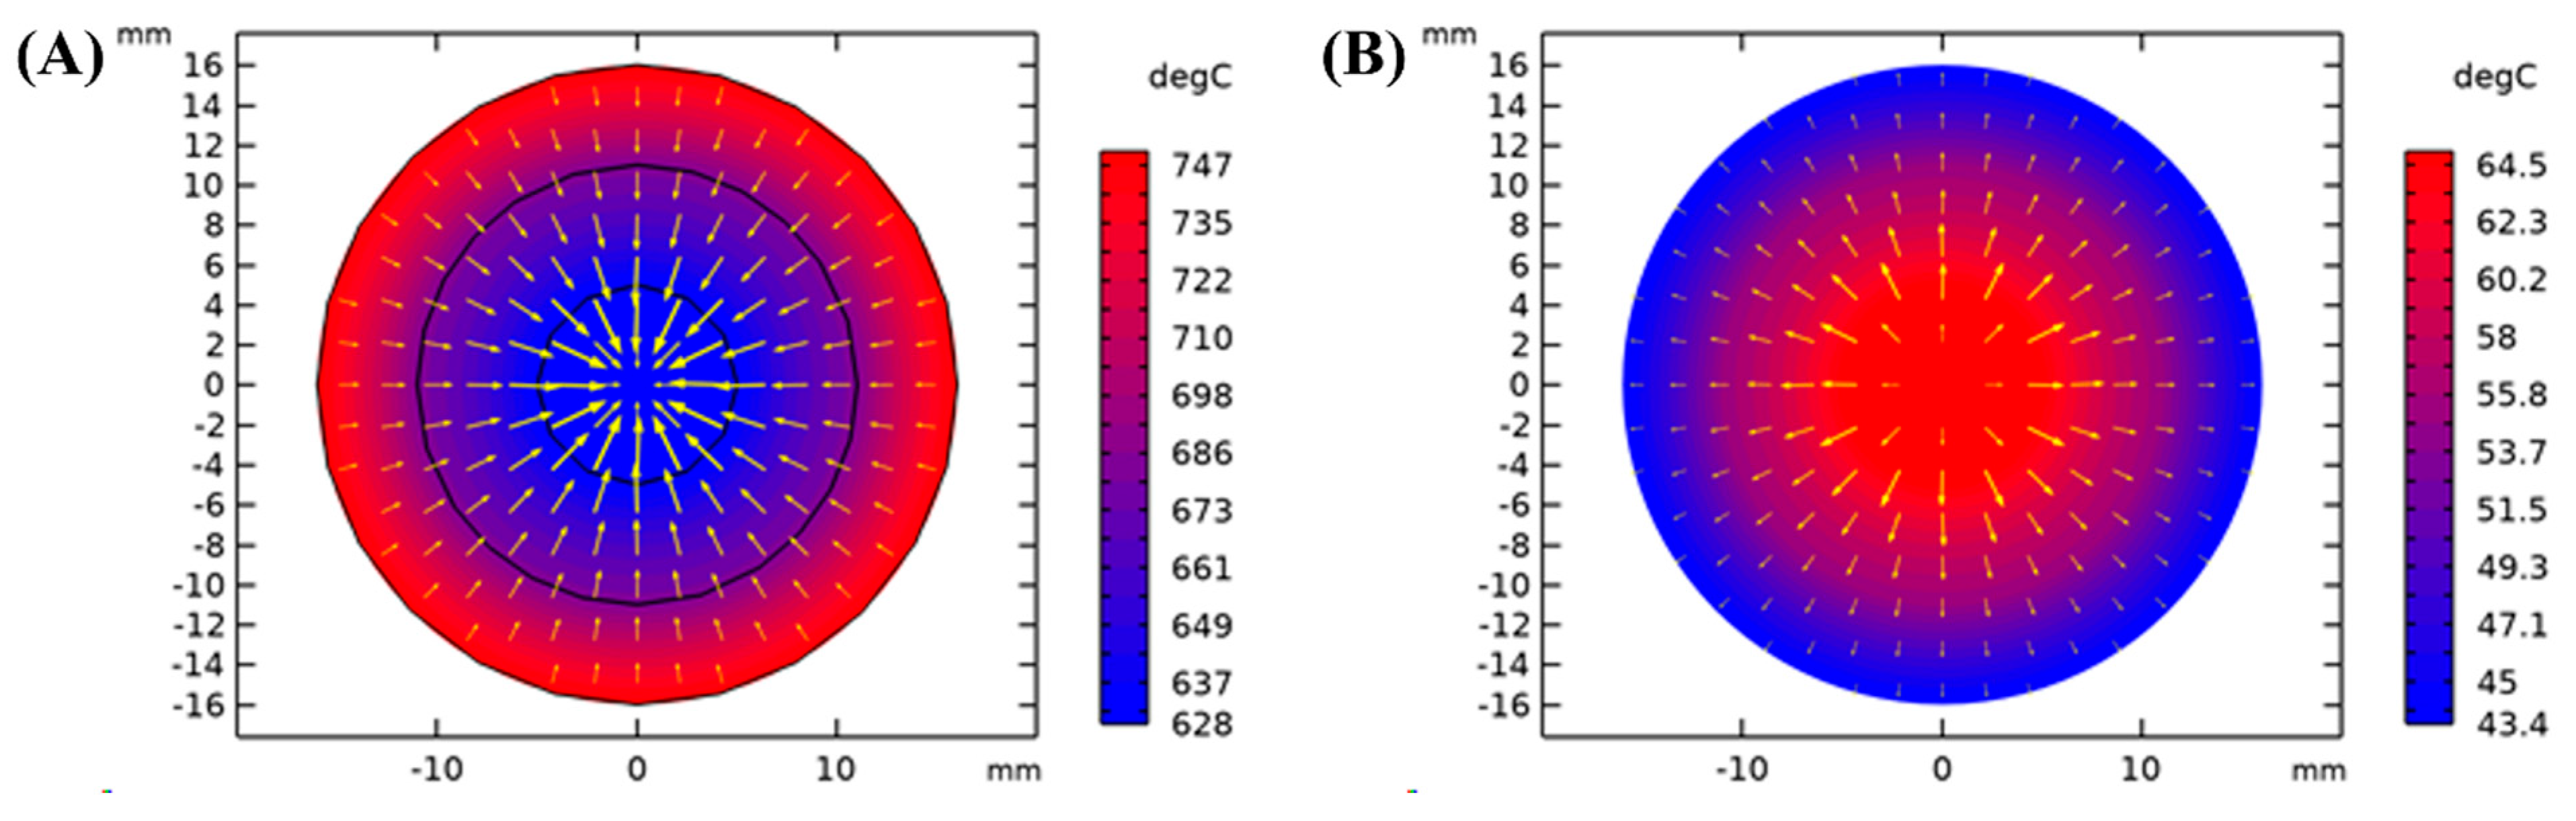
5.10. Direction of Conductive Heat Flux in the Heat Source and Non-Heat Source Sections of the Cable
The heat flux colour maps in
Figure 15 reveal distinct thermal behaviours in the heat source and non-heat source sections of the cable, highlighting key differences in heat transfer direction. In the heat source section, heat flux is concentrated near the core (copper conductor), where temperatures reach approximately 747 °C and gradually decrease toward the outer ceramic layer. Here, heat transfer is predominantly inward, driven by the external 750 °C heat source. This inward flux underscores the ceramic layer’s function as a thermal barrier, absorbing and redirecting heat toward the inner layers, resulting in steep thermal gradients. The outer ceramic layer stabilises temperatures, preventing excessive heat propagation and enhancing the cable’s fire-resistant properties. In contrast, the non-heat source section exhibits an outward heat transfer pattern. Heat flows from the conductor toward the ceramic layer before dissipating into the surroundings. This outward flux results from residual heat conduction along the cable length, with the conductor maintaining a lower temperature (~43 °C at the core) compared to the ceramic surface (~64 °C). The thermal gradient in this section highlights the insulating effectiveness of the polyethylene (PE) and ceramic layers, which regulate residual heat and ensure cooler cable temperatures in non-heated regions.
Comparing the two regions, the heat source section experiences significantly higher flux intensity and steeper gradients due to direct external heating, leading to inward heat transfer. Conversely, the non-heat source section operates under a dissipative regime, where heat moves outward from the conductor to the environment. These directional differences emphasise the importance of the cable’s layered structure in adapting to varying thermal conditions. This observation aligns with the findings of [
27,
44,
45], which highlight how the core materials and cable configurations play a crucial role in determining the stability of fire-resistant cables. The ceramic layer plays a dual role of blocking heat from penetrating the inner layers in the heat source section while facilitating outward dissipation in the non-heat source section. This functionality is crucial for maintaining the cable’s thermal stability and fire resistance under different operating conditions.


