Article

Wildfire Mitigation and Evaluation of Firebreaks Through FlamMap Simulations in High-Susceptibility Areas of the Metropolitan District of Quito

by
Juan Gabriel Mollocana-Lara
1,*,
Katiuska Jajaira Obando-Proaño
2 and
Betsy Germania Córdova-Luspa
3
1
Grupo de Investigación Ambiental en el Desarrollo Sustentable GIADES, Carrera de Ingeniería Industrial, Universidad Politécnica Salesiana, Quito 170525, Ecuador
2
Dirección Técnica de Ecosistemas de Emprendimiento e Innovación, Universidad Politécnica Salesiana, Quito 170525, Ecuador
3
Carrera de Ingeniería Ambiental, Universidad Politécnica Salesiana, Quito 170702, Ecuador
*
Author to whom correspondence should be addressed.
Fire 2025, 8(5), 189; https://doi.org/10.3390/fire8050189
Submission received: 6 April 2025 / Revised: 27 April 2025 / Accepted: 29 April 2025 / Published: 8 May 2025
(This article belongs to the Section Fire Science Models, Remote Sensing, and Data)

Abstract

Wildfires represent a growing concern worldwide, and their frequency has increased due to climate change and human activities, posing risks to biodiversity and human safety. In the Metropolitan District of Quito (DMQ), the combination of flammable vegetation and steep slopes increases the wildfire susceptibility. Although there are no formally designated firebreaks in these areas, many natural and artificial elements, such as roads, water bodies, and rocky terrain, can effectively function as firebreaks if properly adapted. This study aimed to evaluate the wildfire behavior and assess the effectiveness of both adapted existing barriers and proposed firebreaks using FlamMap simulations. Geospatial and meteorological data were integrated to generate landscape and weather inputs for simulating wildfires in nine high-susceptibility areas within the DMQ. Fuel vegetation models were obtained by matching the national land-cover data with Scott and Burgan fuel models, and OpenStreetMap data were used to identify the firebreak locations. The simulation results show that adapting existing potential firebreaks could reduce the burned area by an average of 42.6%, and the addition of strategically placed firebreaks could further reduce it by up to 70.2%. The findings suggest that implementing a firebreak creation and maintenance program could be an effective tool for wildfire mitigation.

1. Introduction

Wildfires have historically been part of the ecological equilibrium, but their frequency and intensity have increased in recent decades due to environmental and human factors [1]. The topography plays a key role, as fire spreads more rapidly on steep slopes due to wind effects and heat transfer [2]. Additionally, extreme climatic conditions, such as high temperatures, low humidity, and strong winds, enhance the ignition and fire expansion, increasing its intensity and making it harder to control [3]. Flammable vegetation, such as grasslands, facilitates fire propagation and complicates containment efforts. Human activities, including agricultural waste burning and urban expansion into high-risk areas, further increase the probability of ignition [4]. Climate change has exacerbated these patterns, extending dry periods and reducing the natural regeneration capacity of affected ecosystems [5].
Various wildfire simulation models have been developed to assess the spread of fires under complex environmental conditions. For instance, CAWFE (Coupled Atmosphere–Wildland Fire Environment) and WRF–Fire couple atmospheric dynamics with fire behavior, offering detailed information about fire–atmosphere interactions under diverse scenarios [6,7]. Recent developments also include the application of artificial intelligence, such as recurrent convolutional neural networks, which enhance the prediction accuracy in dynamic environments [8]. Additionally, advection–diffusion–reaction models have been used to study how the wind and fuel density affect the fire front behavior [9]. These advancements in modeling have been applied in various case studies, supporting decision-making in wildfire management and optimizing the safety of ecosystems and communities exposed to such events.
Wildfire modeling and simulation are essential tools for understanding and predicting fire behavior in different environments. Among the most widely used software is FlamMap, a system that projects potential fire behavior in specific landscapes by considering variables such as the topography, fuels, and meteorological conditions [10,11]. This model has been applied in studies such as that of Bohemian Switzerland National Park, where different fire propagation scenarios were evaluated under varying fuel and climate conditions [12]. Furthermore, research in Golestan National Park has compared the effectiveness of FlamMap with other algorithms, demonstrating its accuracy in predicting fire expansion [13]. The integration of remote sensing techniques and geographic information systems with FlamMap has enabled a detailed evaluation of fire behavior in regions such as the western Black Sea region of Turkey [14]. Similarly, FlamMap has been applied to assess the role of forest grazing as a wildfire mitigation strategy in Mediterranean ecosystems, suggesting a potential reduction in fire severity [15]. Finally, some studies conducted in the DMQ have used national land-cover data to approximate fuel models by matching them with the Scott and Burgan classification. These studies have validated the resulting simulations, achieving moderate-to-acceptable levels of agreement based on the Sorensen and Cohen’s Kappa coefficients [16,17]. However, there is limited empirical evidence supporting the effectiveness of wildfire mitigation strategies, such as firebreaks, in the DMQ and in Ecuador more broadly, despite their frequent mention in the global fire management literature [18].
This study aimed to simulate wildfire behavior in nine areas identified as highly or critically susceptible within the DMQ using FlamMap version 6.1. The simulations were based on national topographic and land-cover data, along with meteorological records from local stations. Potential firebreaks identified from OpenStreetMap were integrated to evaluate their influence on the fire spread. Additional strategically placed firebreaks were also considered to explore their potential to reduce the fire extent. Finally, model validation was carried out by simulating a past wildfire event and assessing the agreement between simulated and observed fire extensions.

2. Materials and Methods

Figure 1 presents the methodological workflow used for the wildfire simulation with FlamMap version 6.1 in this study. The process began with the selection of geospatial and meteorological datasets, followed by data processing to generate ignition points, landscape, and weather inputs. A Sentinel-2 satellite image was also selected to identify the extent of a past wildfire event. The simulation evaluated the fire spread in terms of arrival times and major propagation paths. The model validation for the historical wildfire was conducted using the Sorensen and Cohen’s Kappa coefficients. Finally, the workflow included the analysis of both the existing and proposed firebreaks to assess their influences on the wildfire severity.

2.1. Data Selection

The input data used for the FlamMap simulations are referenced to the WGS84 UTM Zone 17S coordinate system and were obtained from a combination of national and worldwide sources. Table 1 summarizes the type of information collected and its corresponding source. These datasets provided the necessary inputs for FlamMap simulation, including the ignition points, meteorological conditions, and locations of existing and potential firebreaks. Additionally, the data enabled the validation of one historical wildfire event by comparing its observed and simulated extents.

2.2. Data Processing
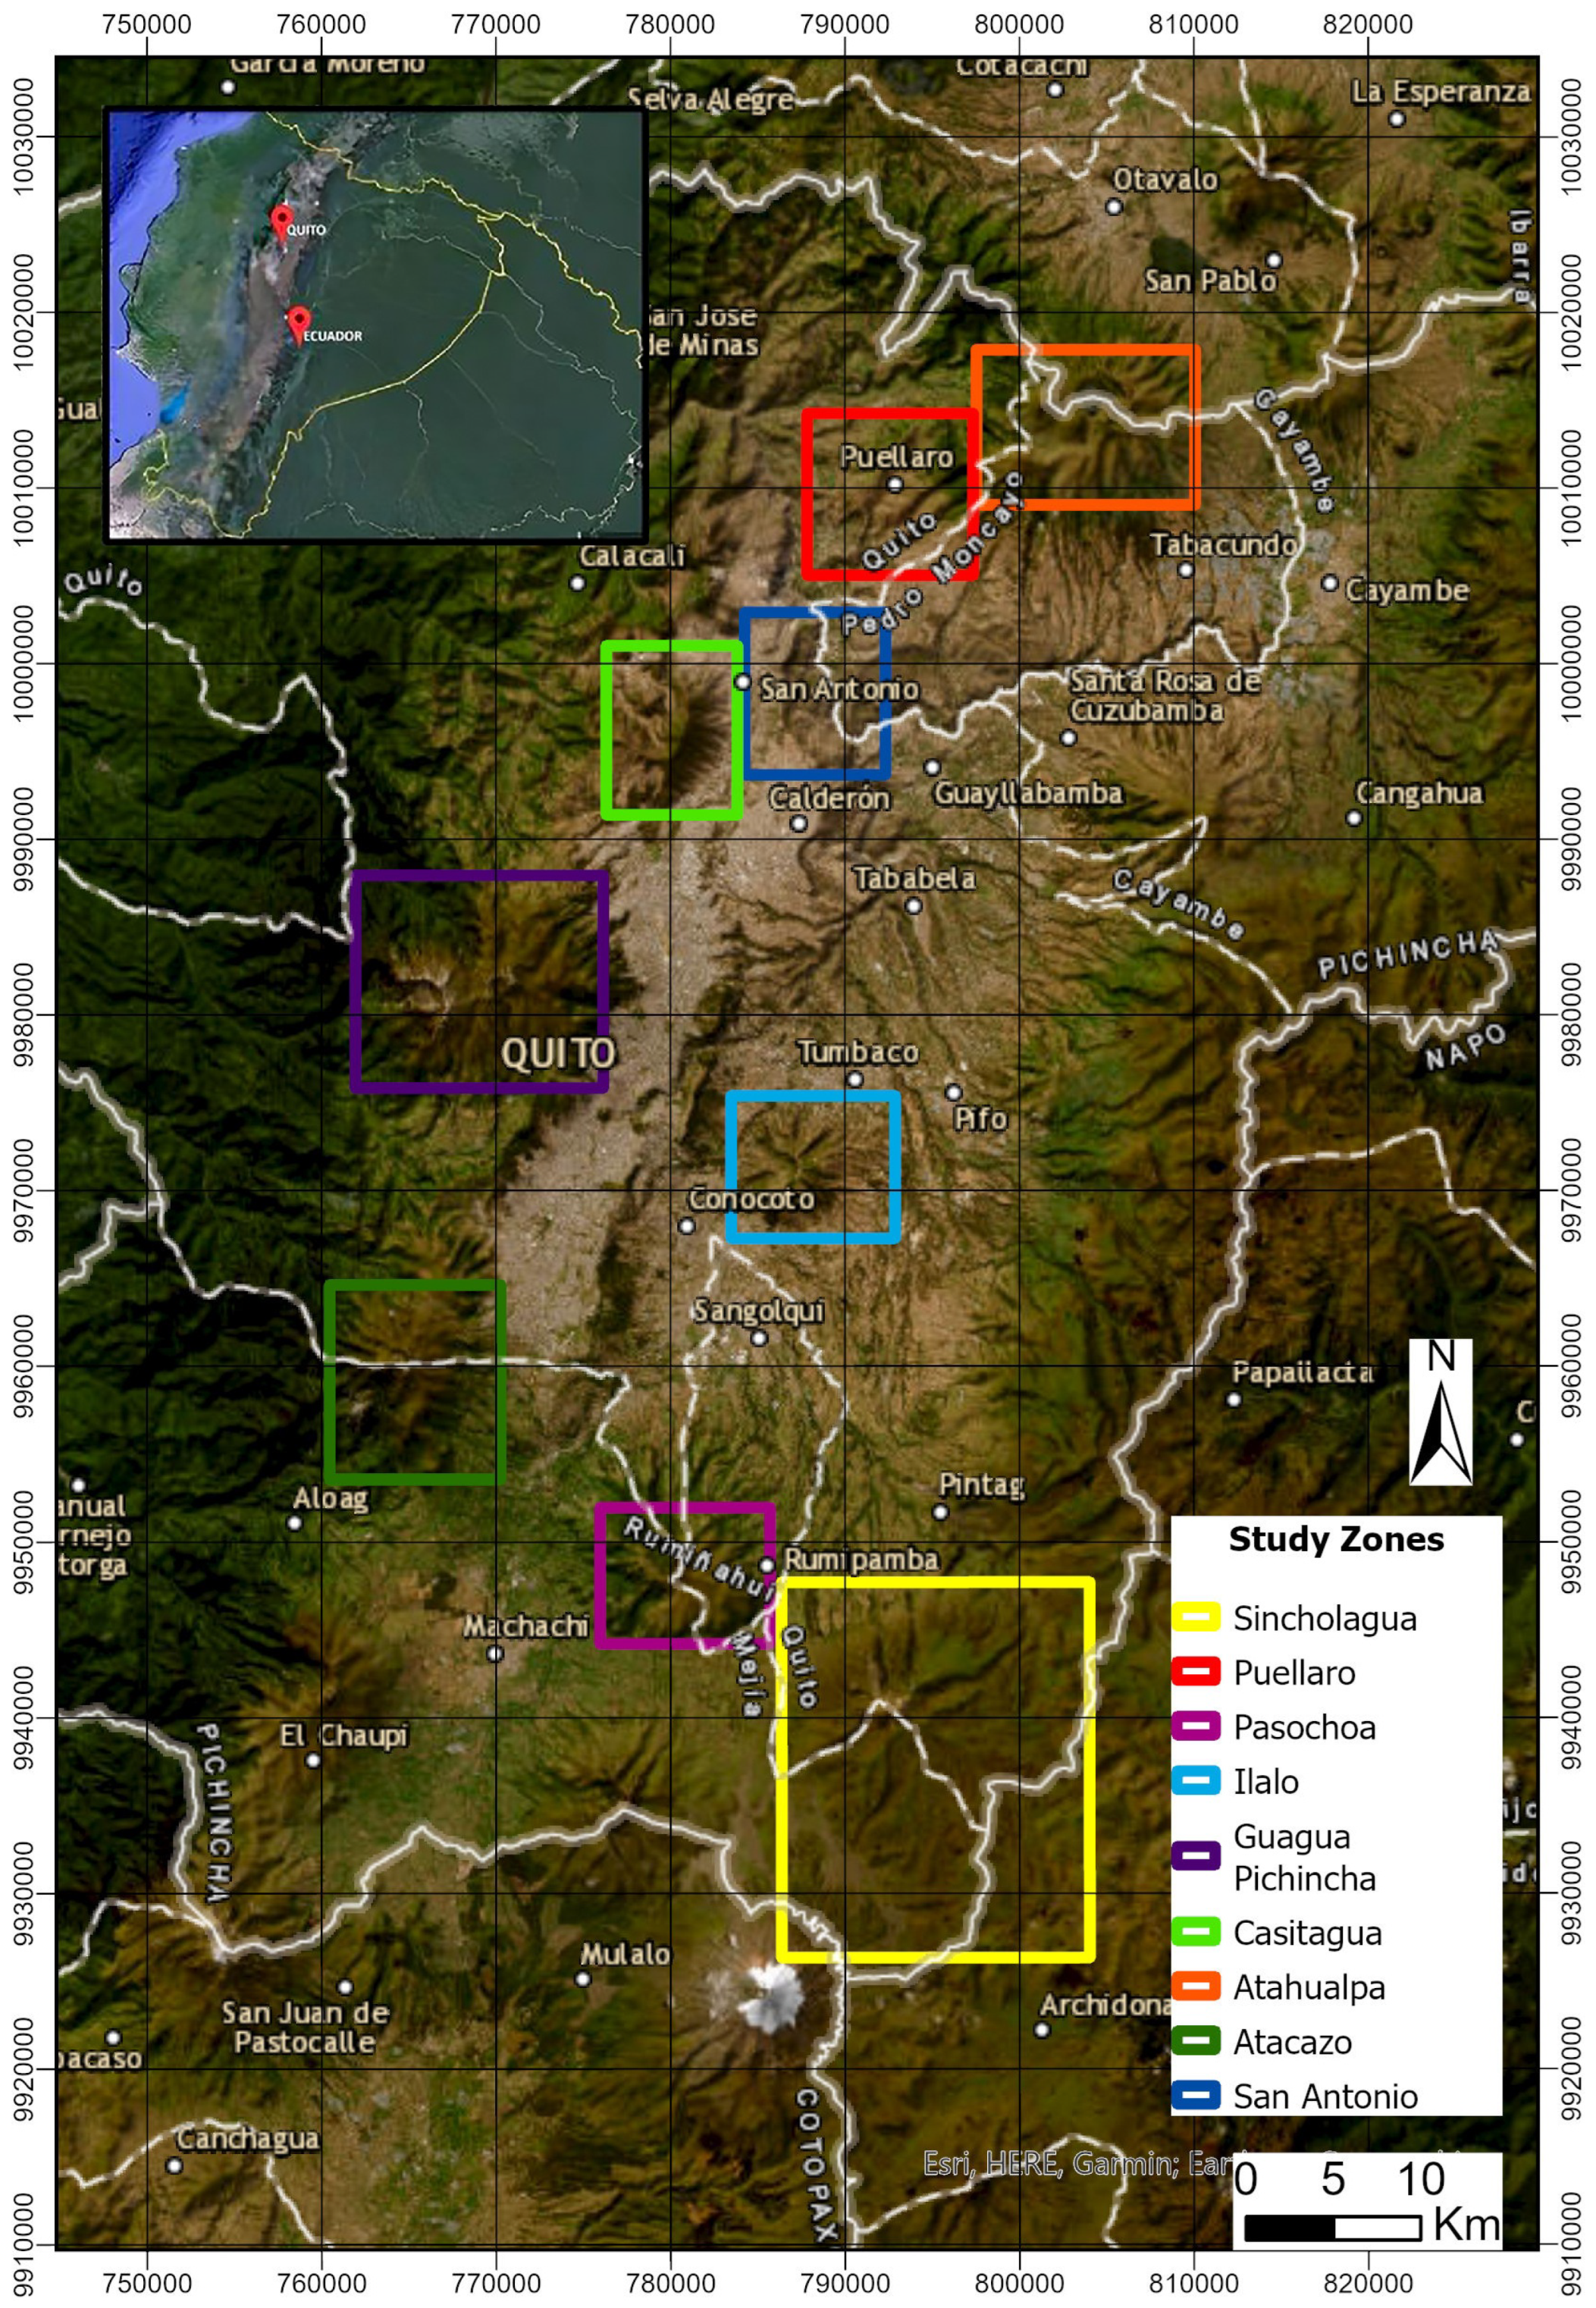
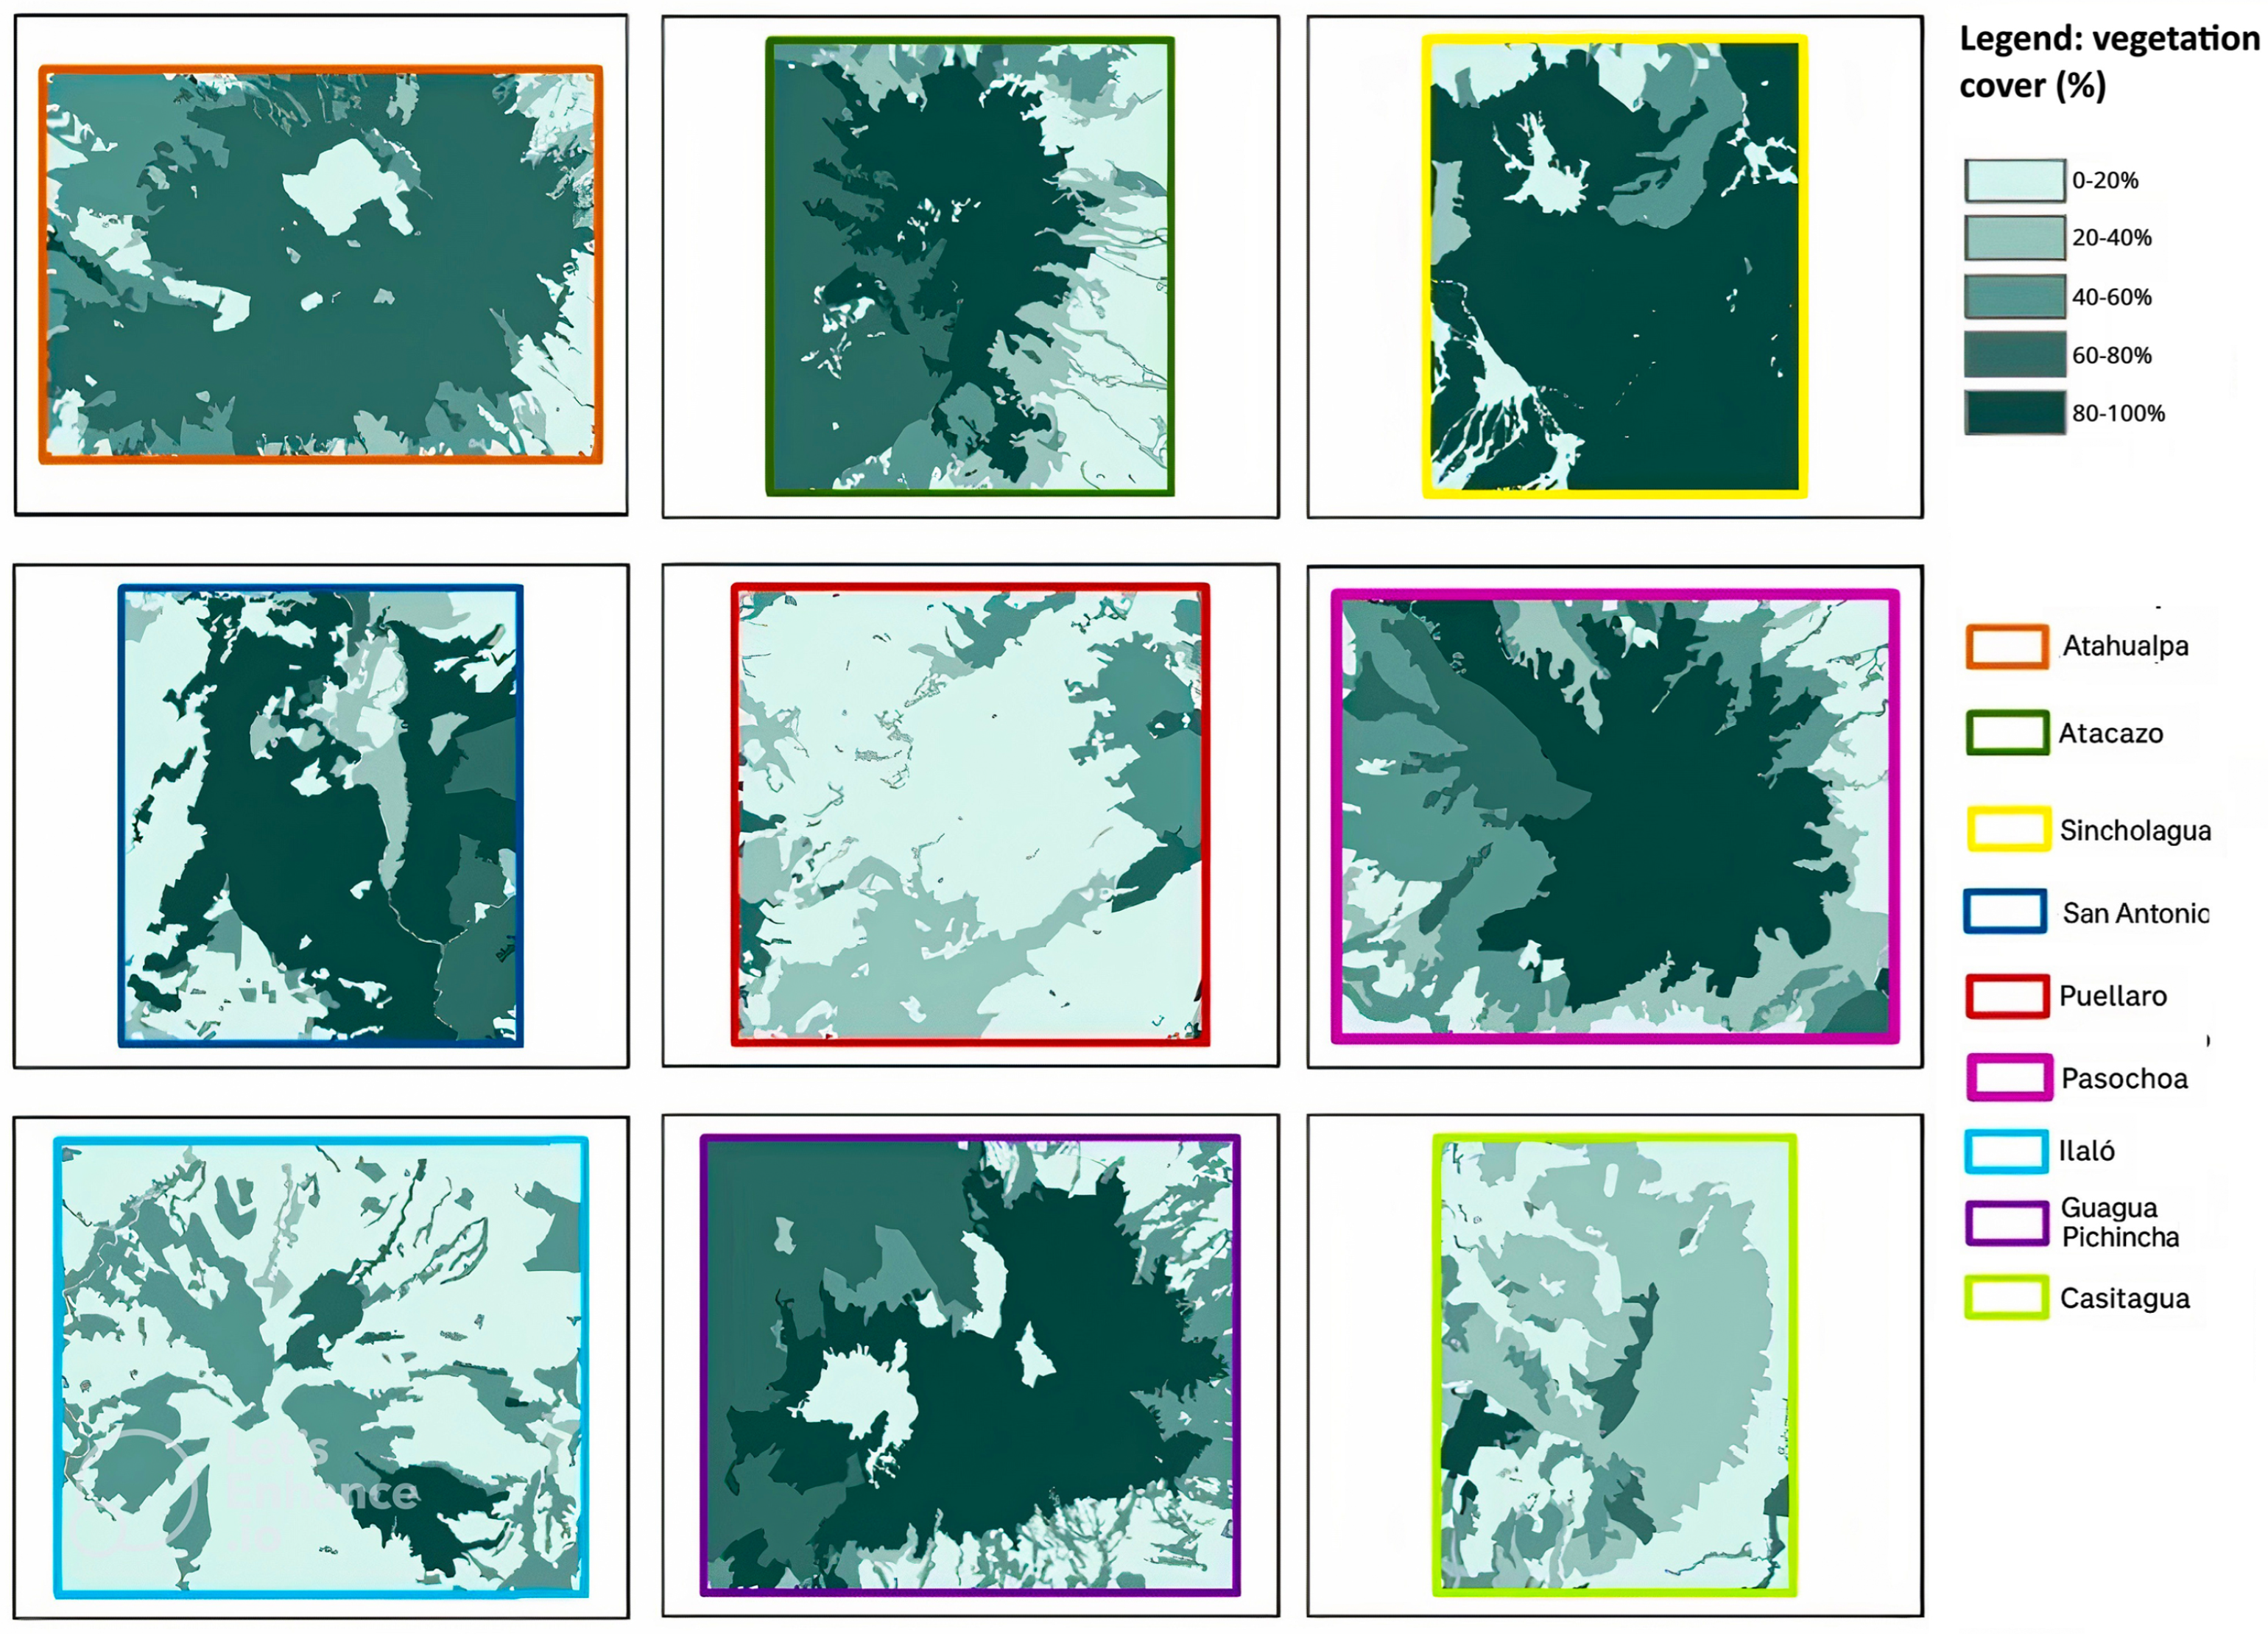
2.2.1. Study Areas

For this research, nine study areas were selected based on the wildfire susceptibility map of the DMQ [19], as shown in Figure 2. These areas are classified as highly and critically susceptible to wildfires due to the combination of steep topography, the presence of highly flammable vegetation, frequent human activity near wildland–urban interfaces, and prolonged dry periods that increase the ignition risk and fire spread. The selected study areas were the Sincholagua Volcano, Atahualpa Parish, San Antonio Parish, Puellaro Parish, Pasochoa Volcano, Ilaló Volcano, Guagua Pichincha Volcano, Casitagua Volcano, and Atacazo Volcano.

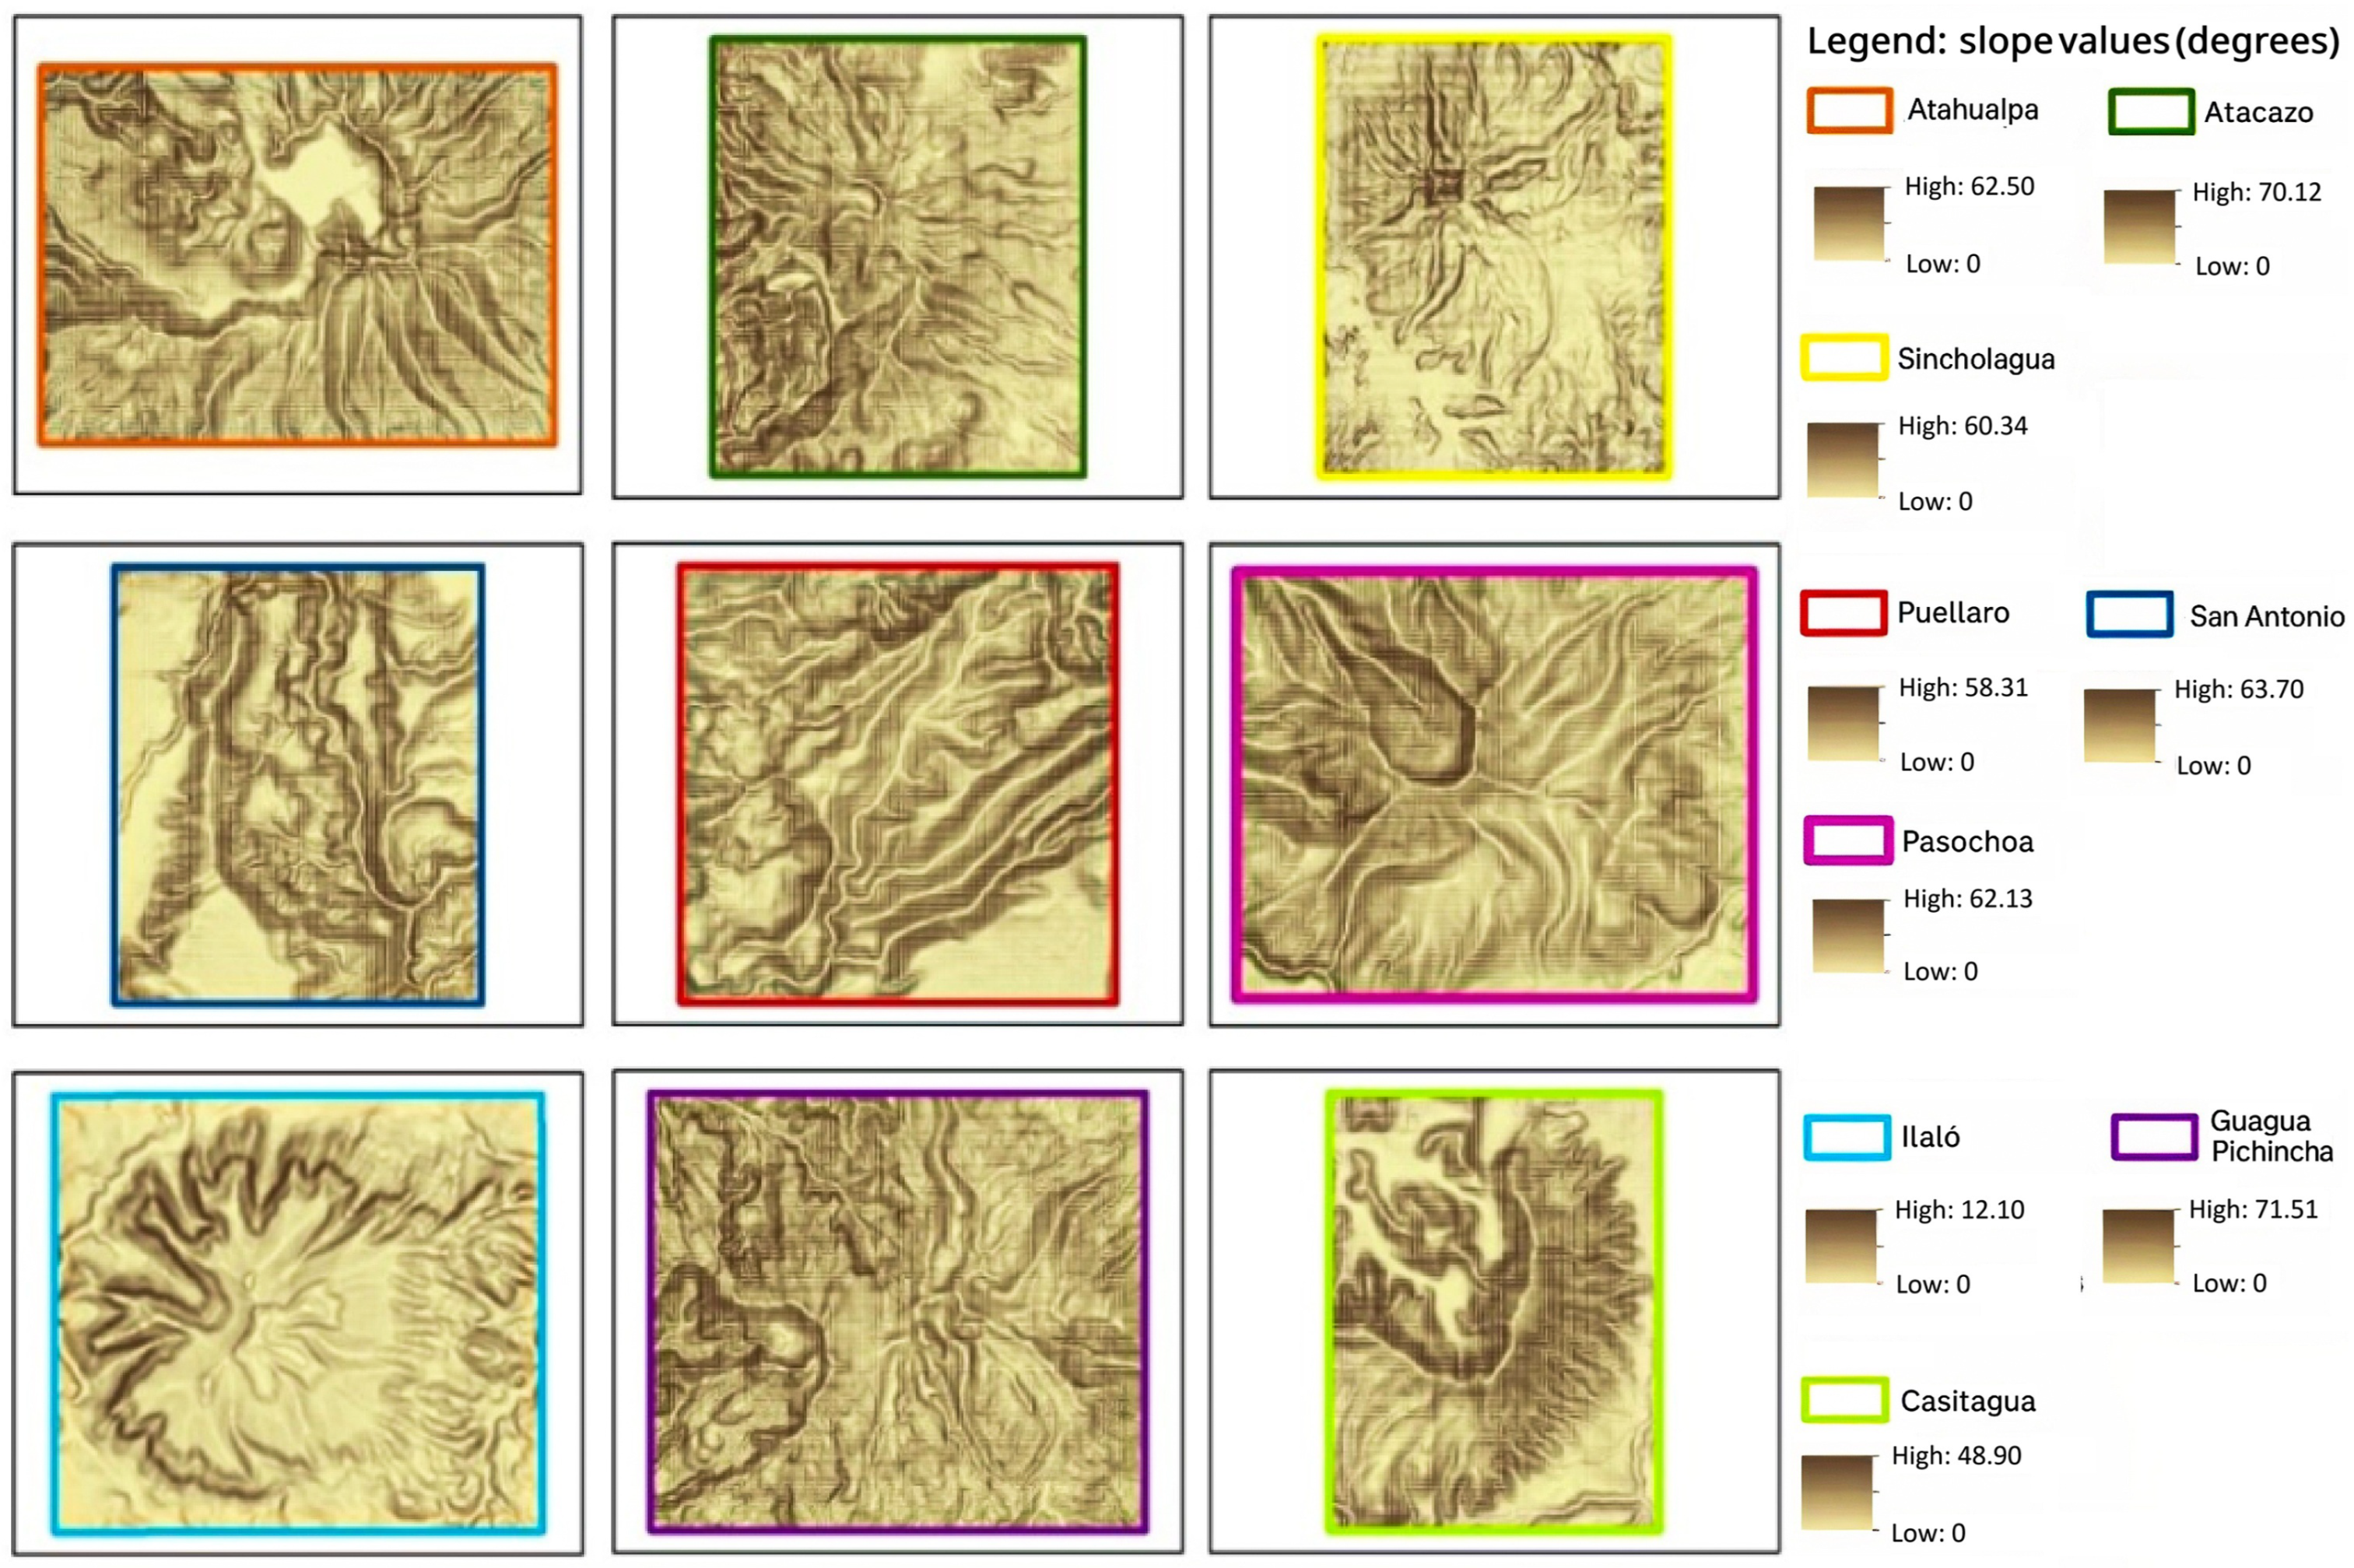
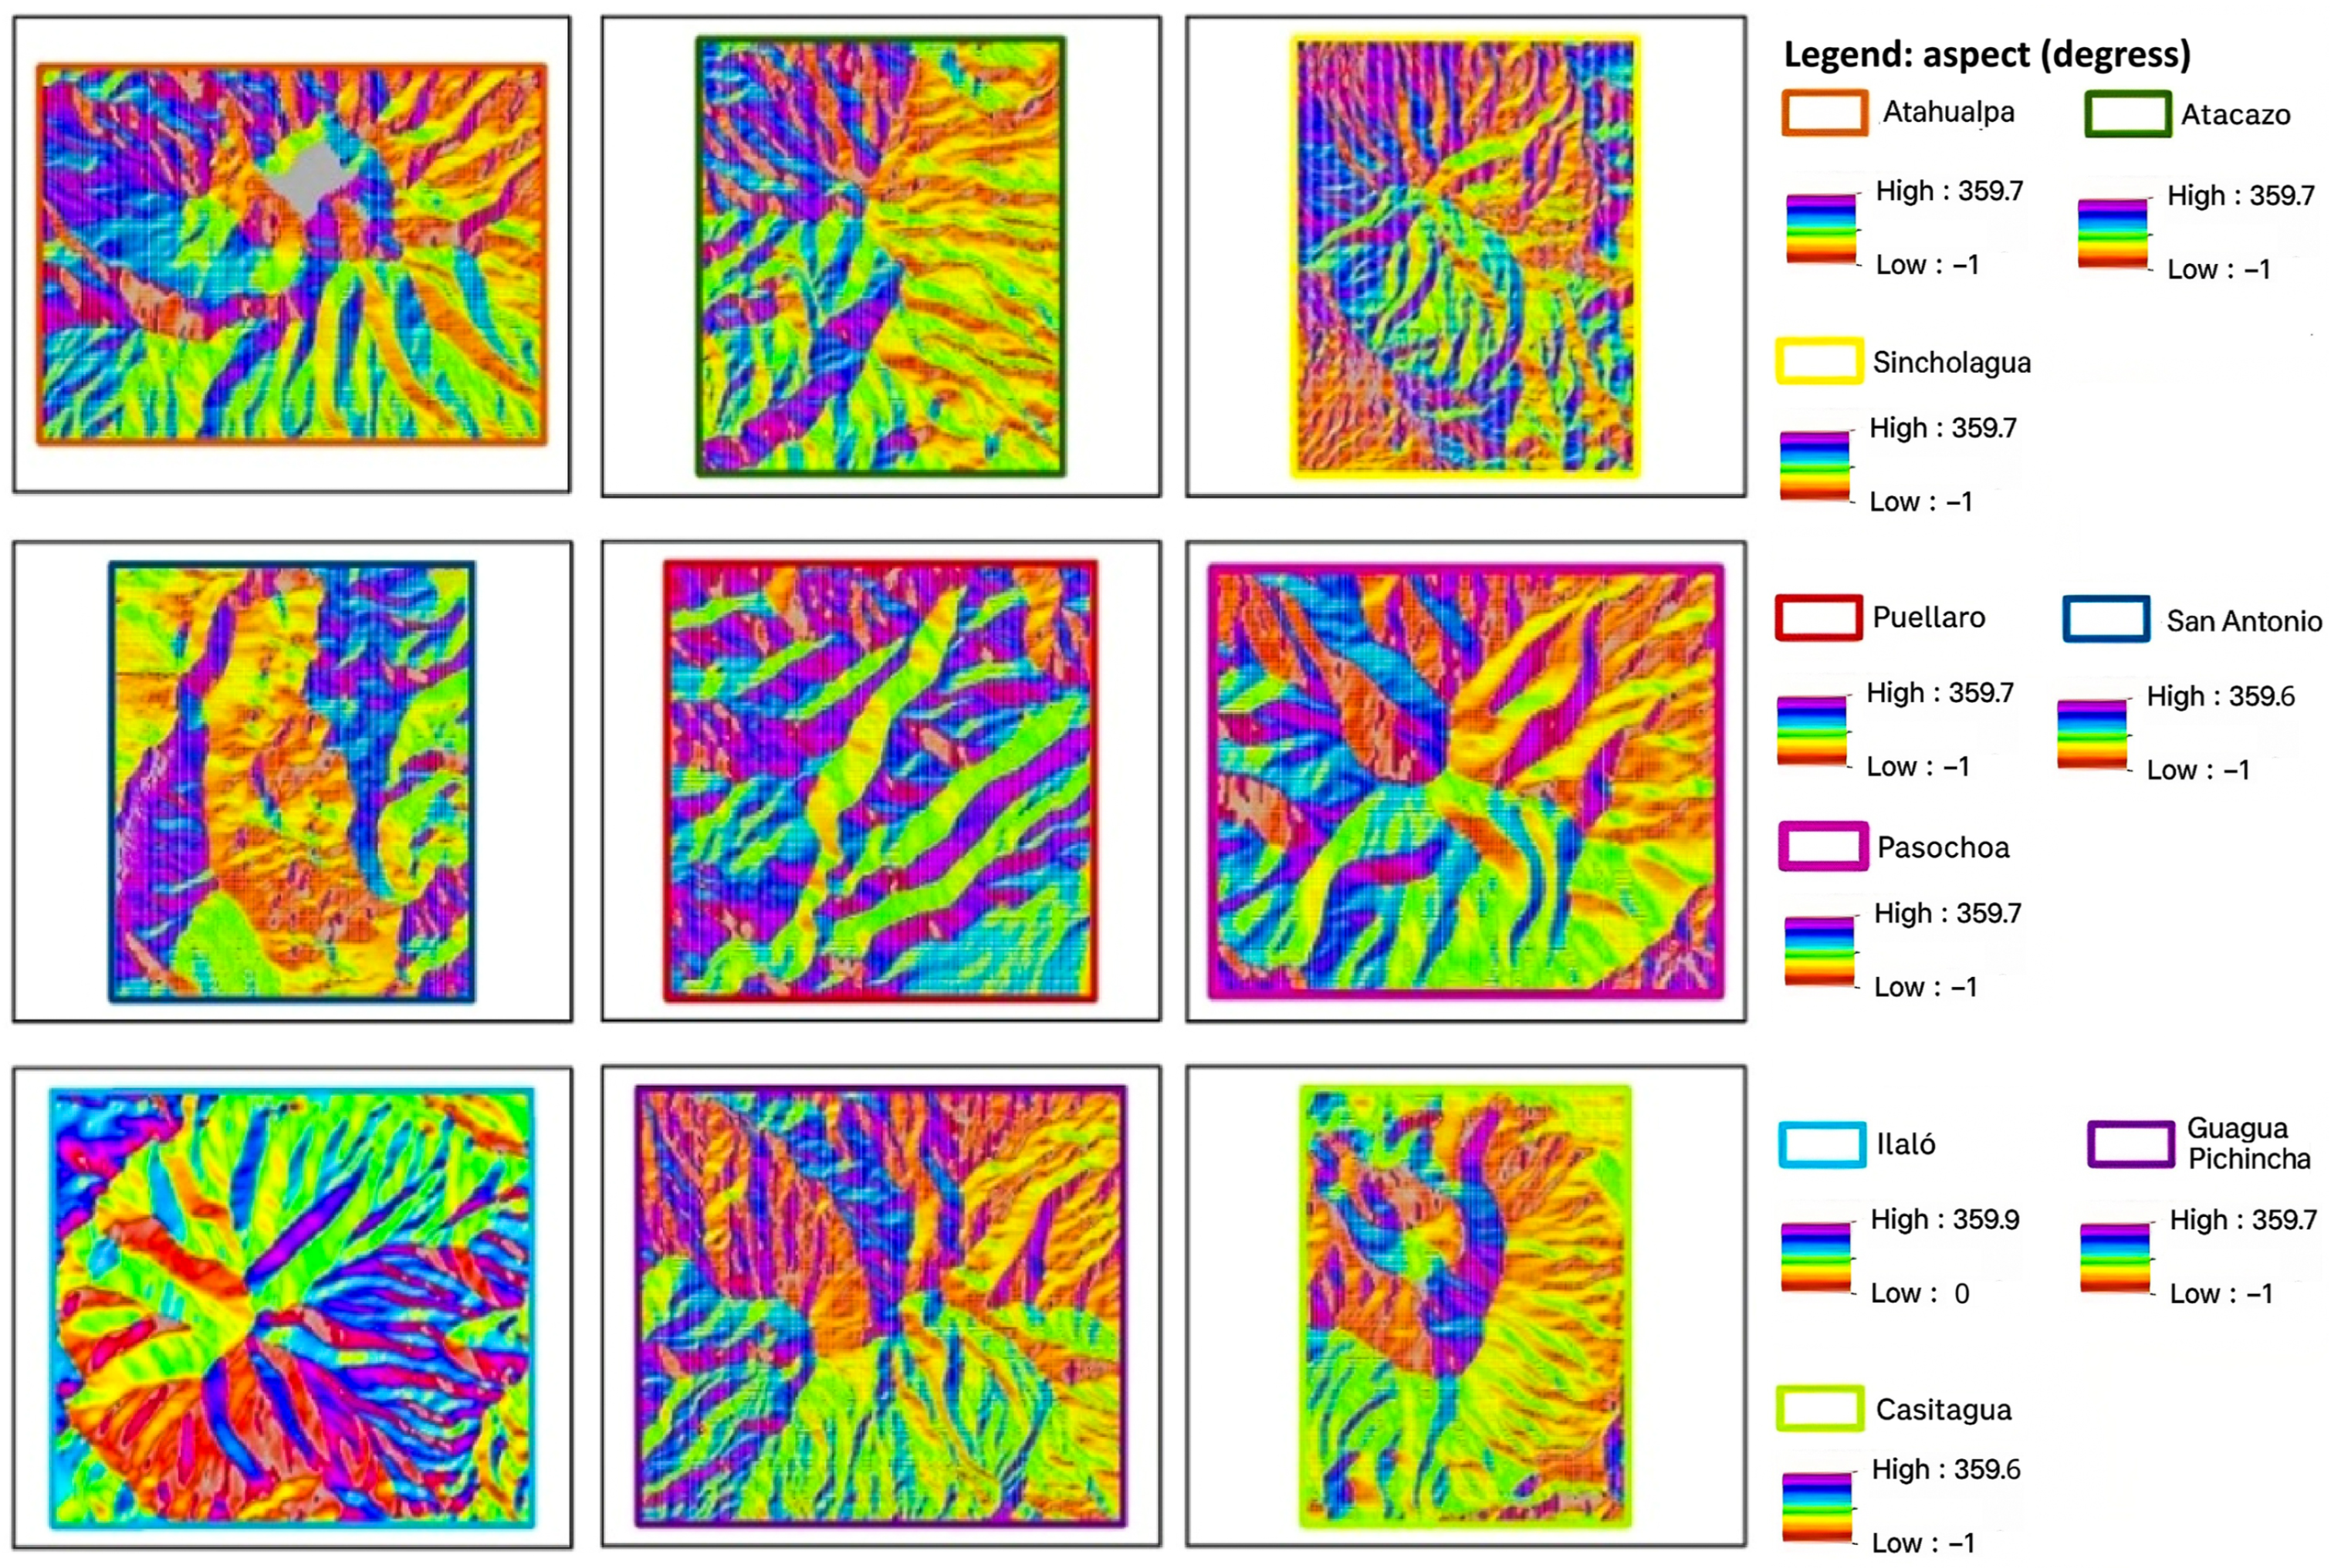
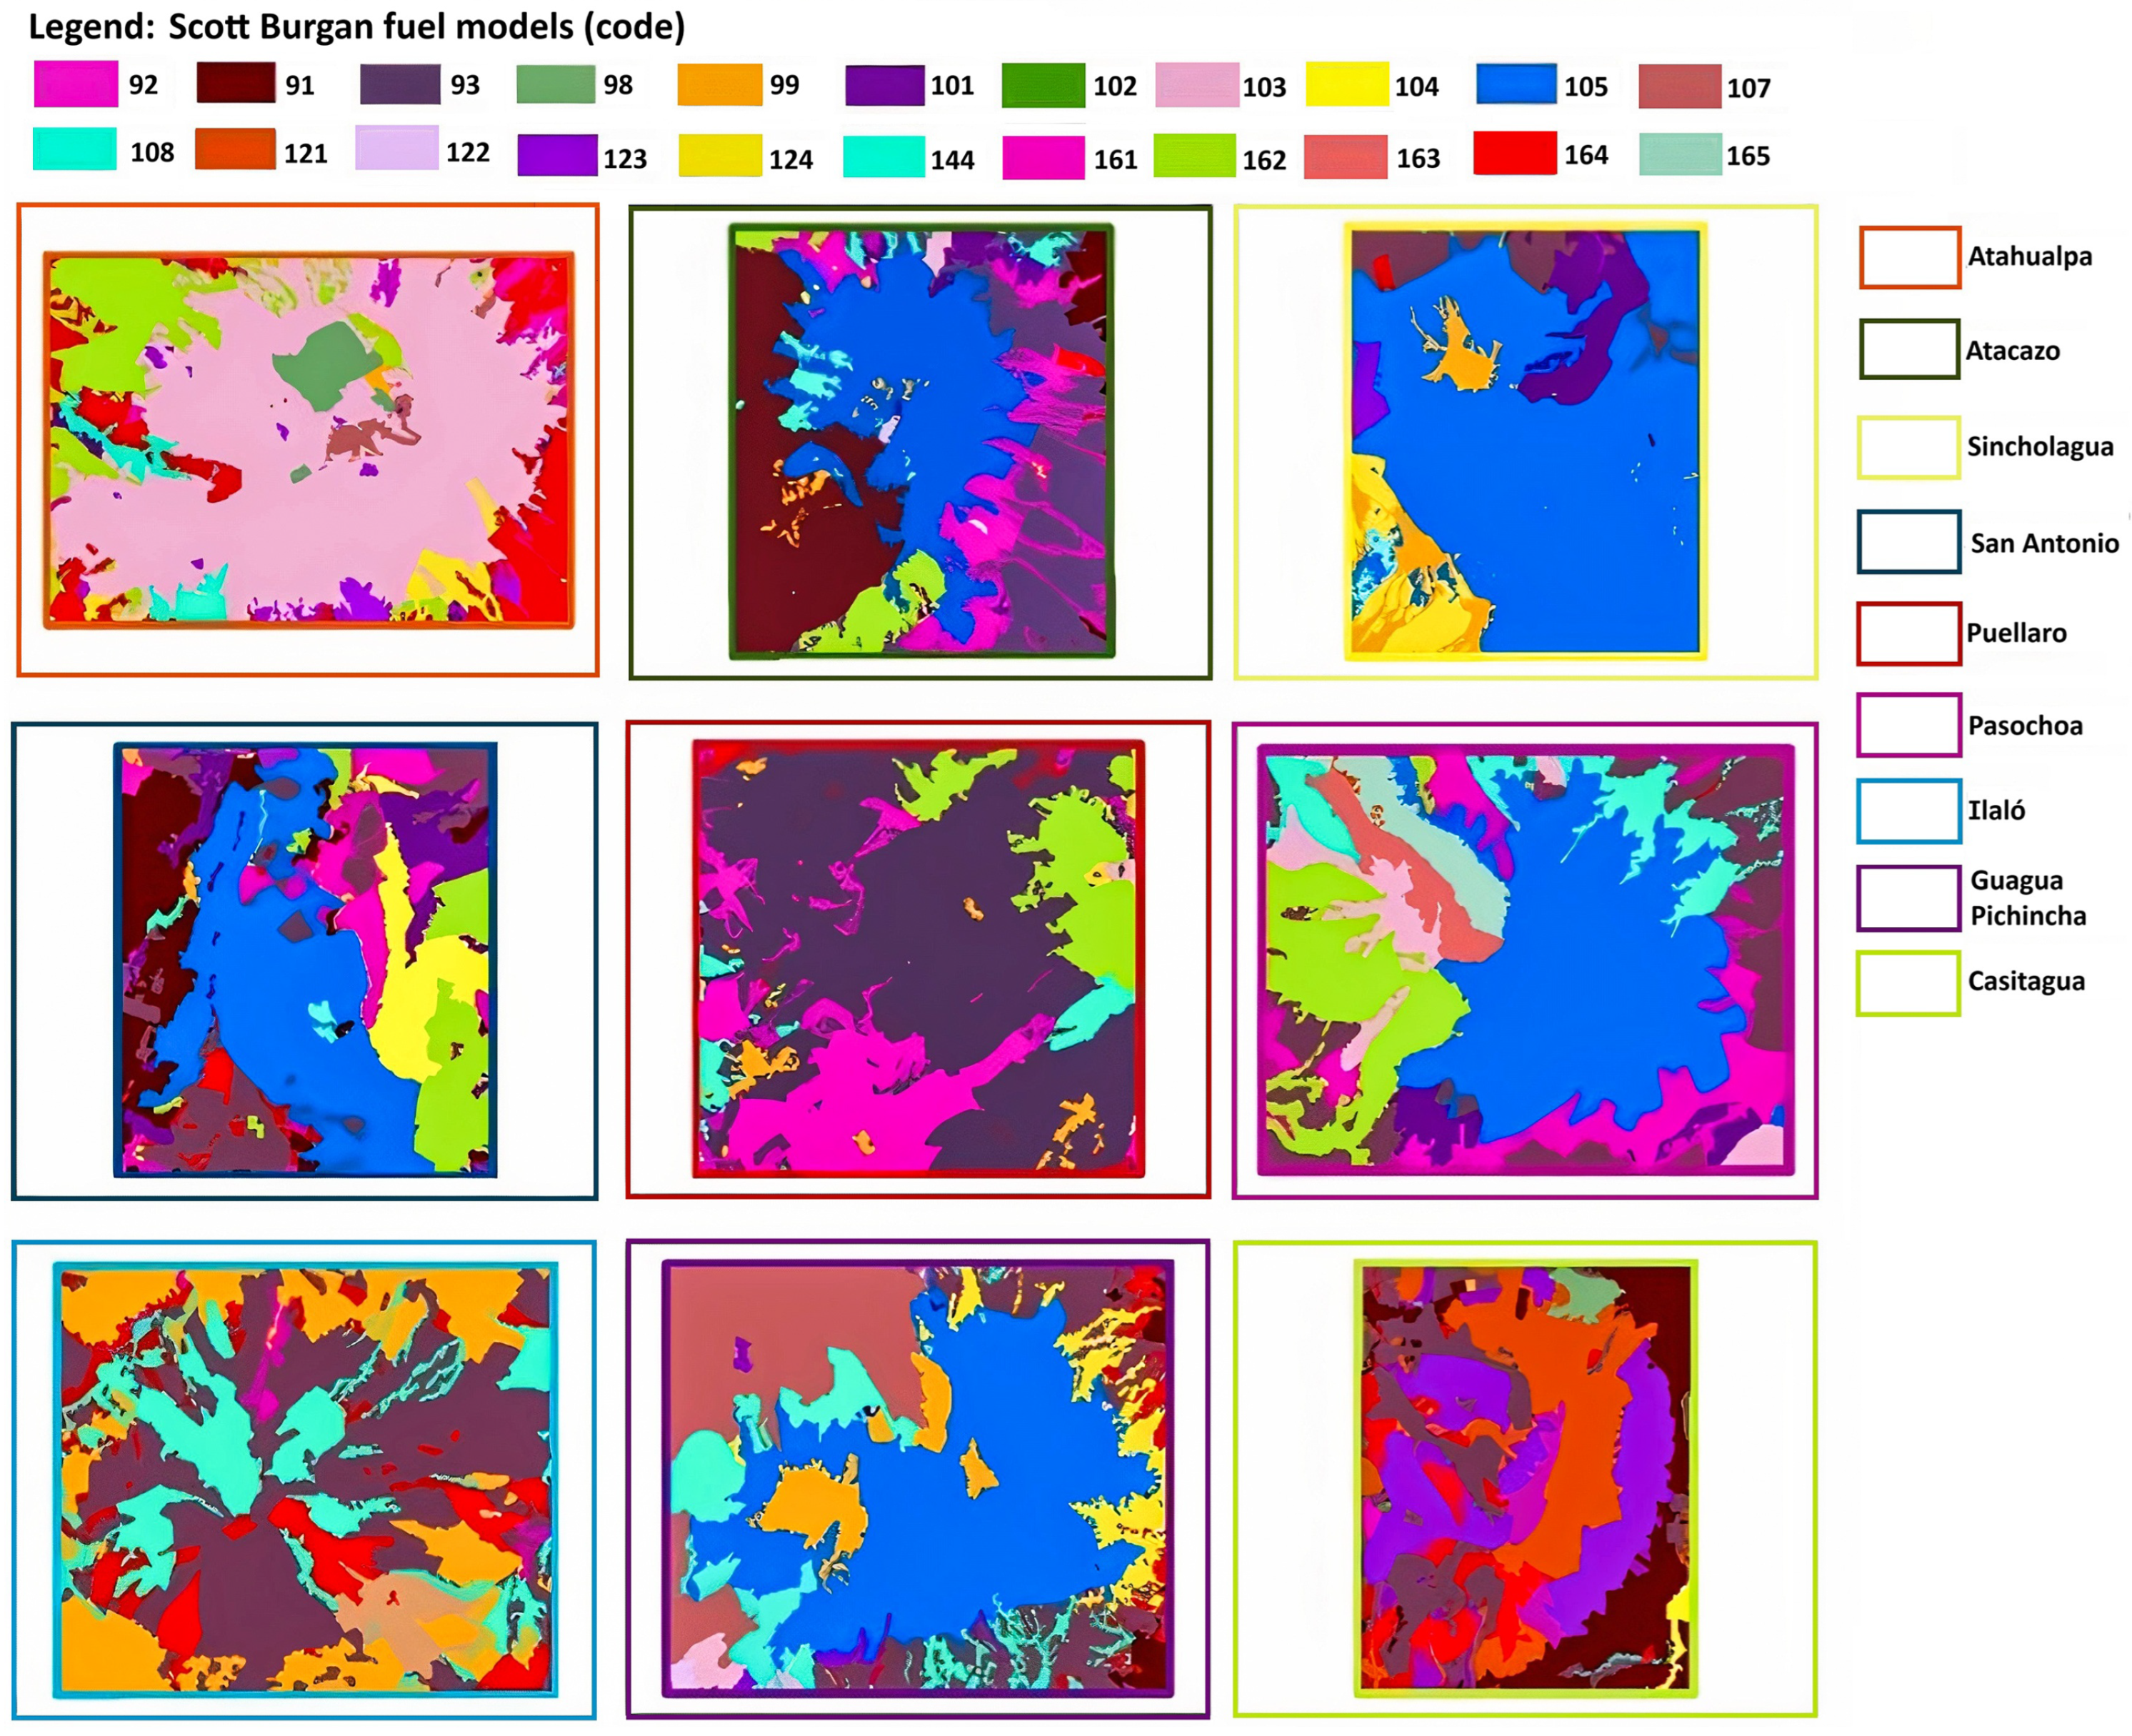
2.2.2. Landscape Input Data

The landscape data input required by FlamMap version 6.1 is provided through a generated landscape file (.LCP) composed of five mandatory raster layers: elevation, slope, aspect, vegetation cover, and fuel models, with each corresponding to the selected study areas. To ensure the simulation execution in FlamMap version 6.1, all raster layers must share the same spatial resolution, be perfectly aligned with identical cell distribution, and cover the exact geographic extent of the area of analysis. If these conditions are not met, FlamMap version 6.1 will not execute the simulation.
For the nine study areas, the elevation, slope, and aspect rasters were generated in ArcMap using topographic contour lines as the primary data source. The `Topo to Raster’ tool was applied to create a Digital Elevation Model (DEM) with a 20-m cell size (see Figure 3). From this DEM, the `Aspect’ tool was used to generate the aspect raster (see Figure 4), which represented the slope orientation, and the ’Slope’ tool was used to produce the slope raster (see Figure 5), indicating the terrain steepness. A consistent spatial resolution and alignment across all layers were ensured by setting a shared environment configuration within the ArcMap processing tools.
The MAGAP land-cover map was used to generate the vegetation fuel model raster (see Figure 6) and vegetation cover percentage raster (see Figure 7). The land-cover categories were matched to the Scott and Burgan fuel models (see [26]) through a comparison of characteristics, a previously used approach when specific fuel model data are unavailable [27]. Additionally, the vegetation cover percentages were estimated by differentiating the levels of alteration based on the categories defined in the MAGAP land-cover map.
The matching process between the MAGAP land-cover classes and the Scott and Burgan fuel models took into account the fact that the MAGAP classification distinguishes various types of natural ecosystems and anthropogenic land uses. For the latter, categories such as urban settlements and infrastructure (e.g., schools, cemeteries, industrial areas) were assigned to non-burnable fuel models: NB1 for all urban and infrastructure classes, and NB3 for all agricultural areas. Additional non-burnable categories included glaciers (NB2), open water bodies (NB8), and bare ground (NB9).
Natural vegetation classes were assigned to Scott and Burgan fuel models based on the vegetation structure (herbaceous, shrubland, forest); climatic condition (dry or humid); and defined alteration level, which reflects the landscape fragmentation due to trails, agriculture, and other human activities. In the absence of specific data on fuel loads, the level of alteration was used as a proxy for the fuel load. Classes with a high alteration were associated with low-fuel-load models (e.g., GR1), while less-altered classes were linked to a high fuel load (e.g., TU5). The paramo ecosystem (alpine grassland), classified separately in the MAGAP map, was assumed to have humid conditions based on its typical ecological and hydrological characteristics.
In total, 98 MAGAP land-cover classes were assigned to 22 Scott and Burgan standard fuel models (see Table 2).

2.2.3. Meteorological Data

A weather file (.WXS) was generated as the input for the FlamMap simulations, which incorporated the following meteorological variables: temperature, relative humidity, cloud cover, precipitation, wind speed, and wind direction. The meteorological data were obtained from the Carapungo, El Camal, Guamaní, Tumbaco, and San Antonio stations of the REMMAQ network, as these stations were the closest to the study areas.

2.3. Simulation and Validation

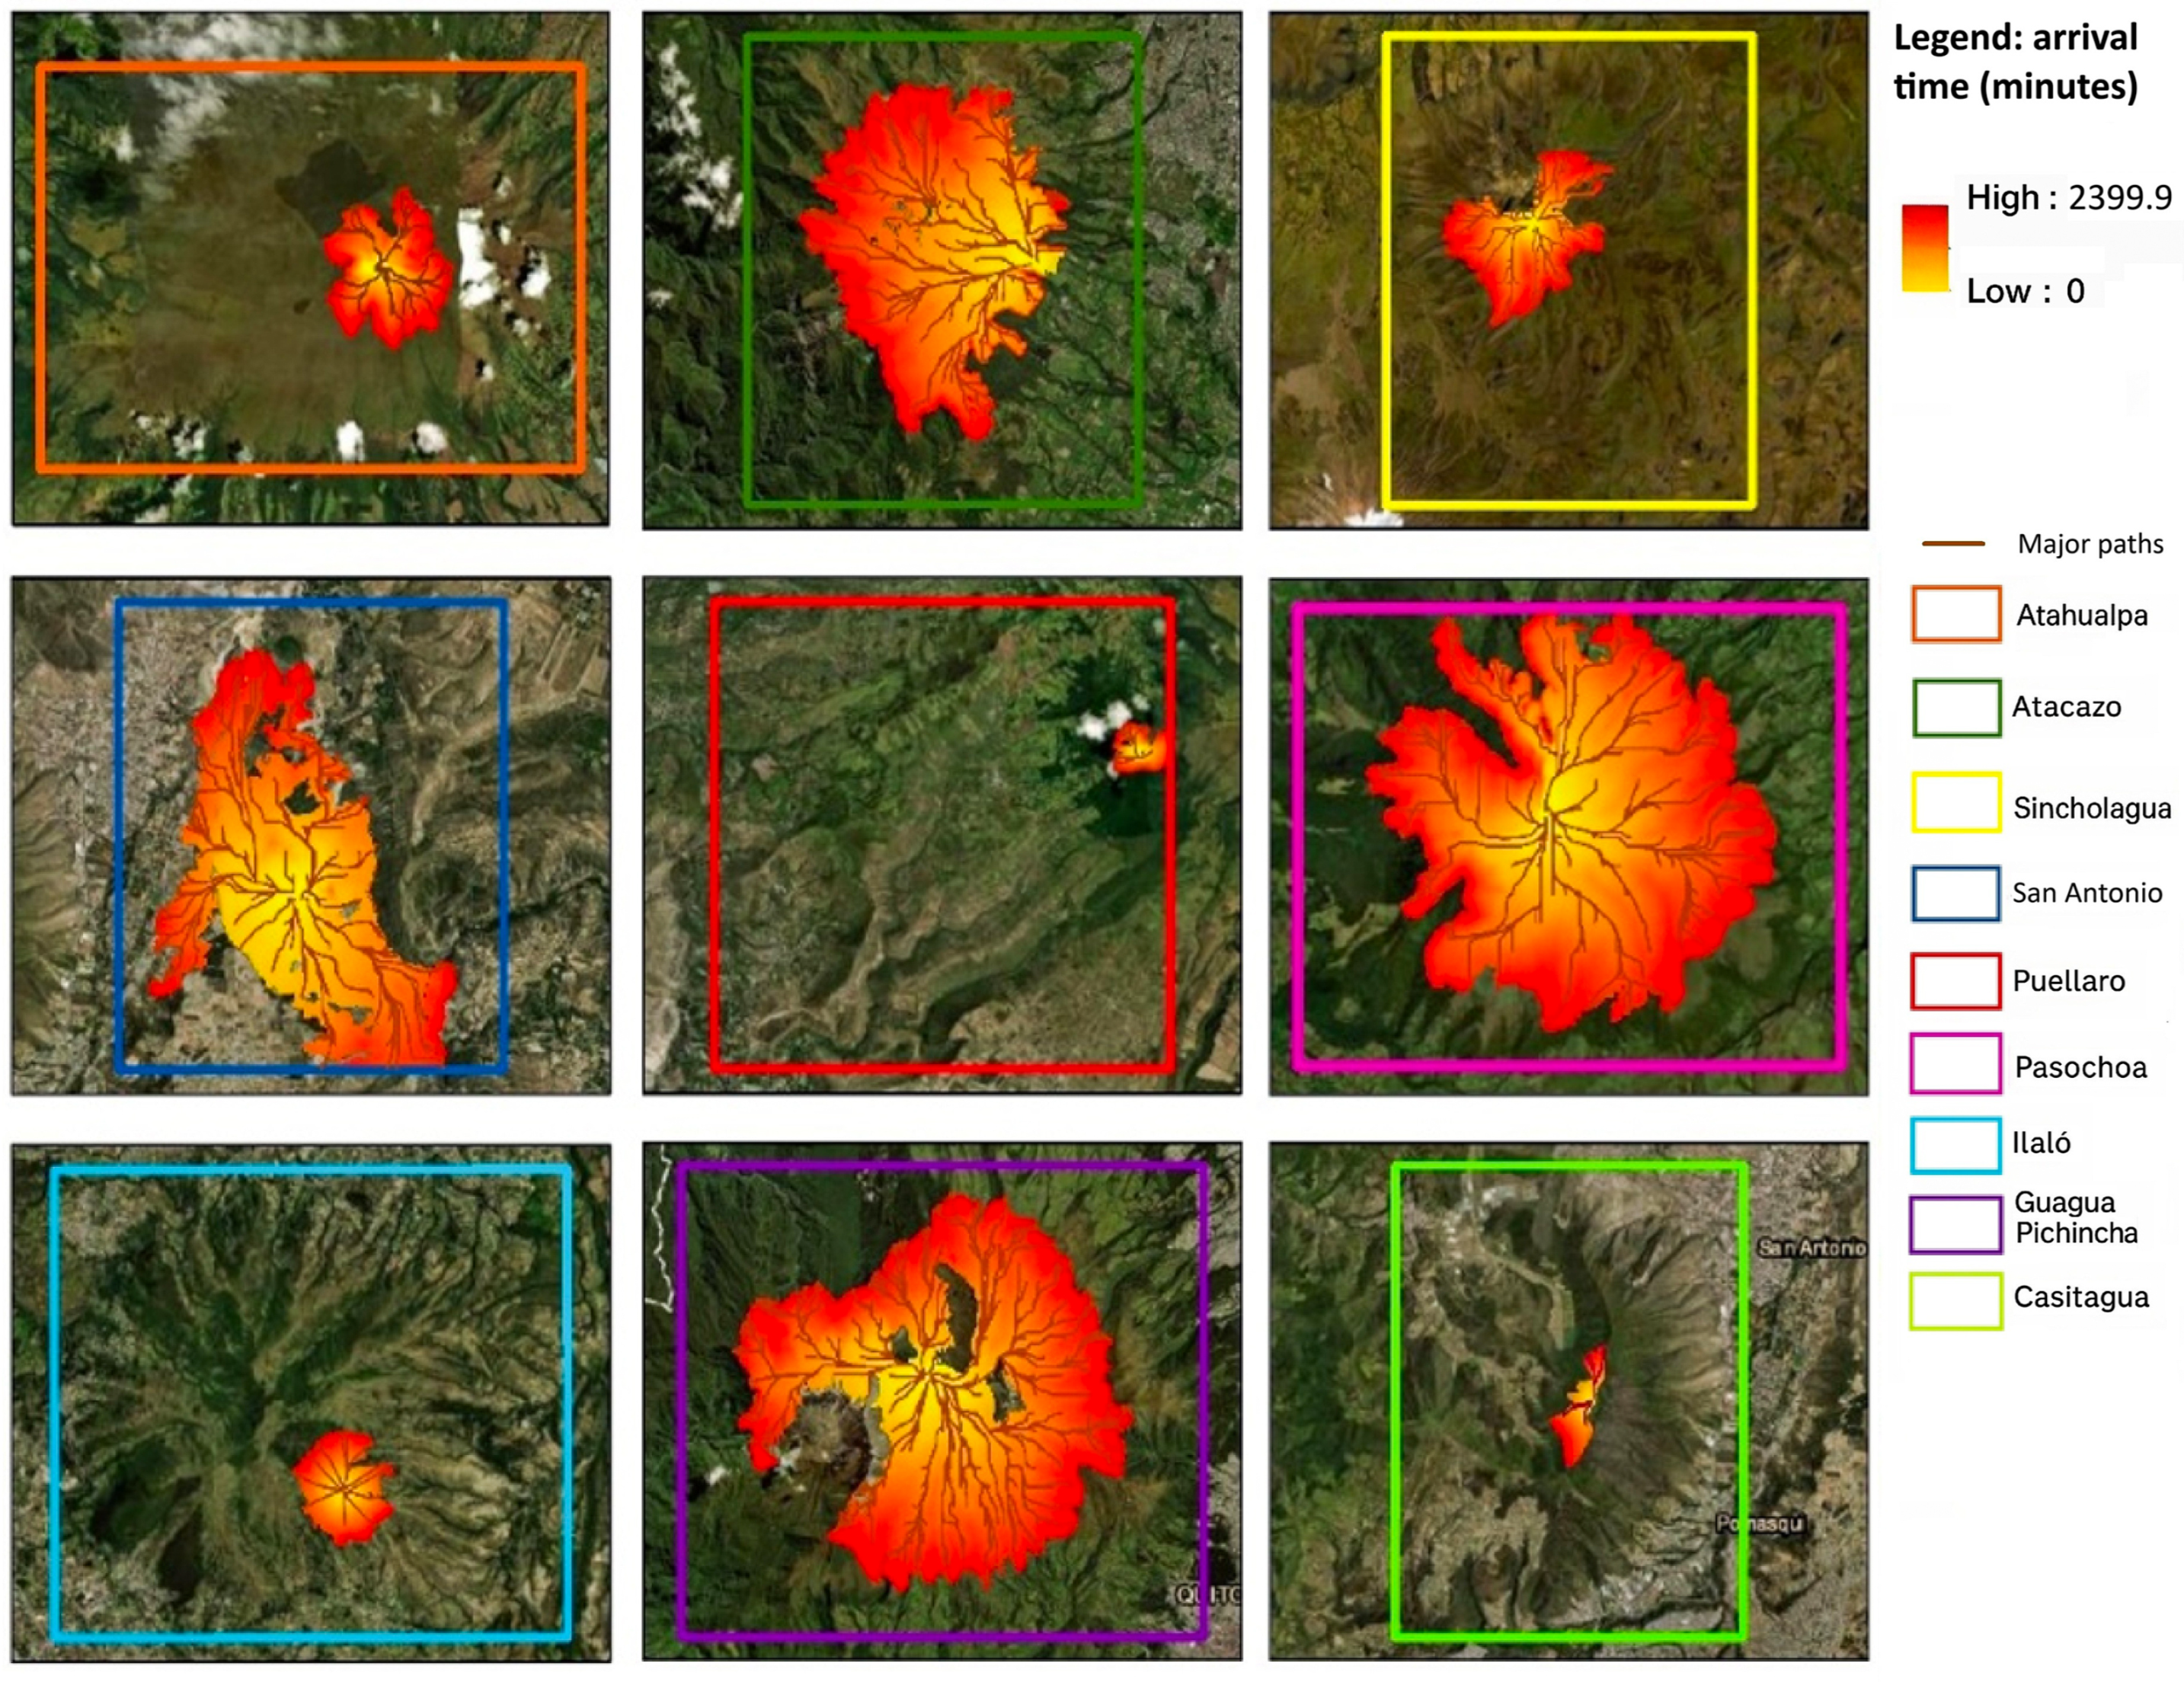
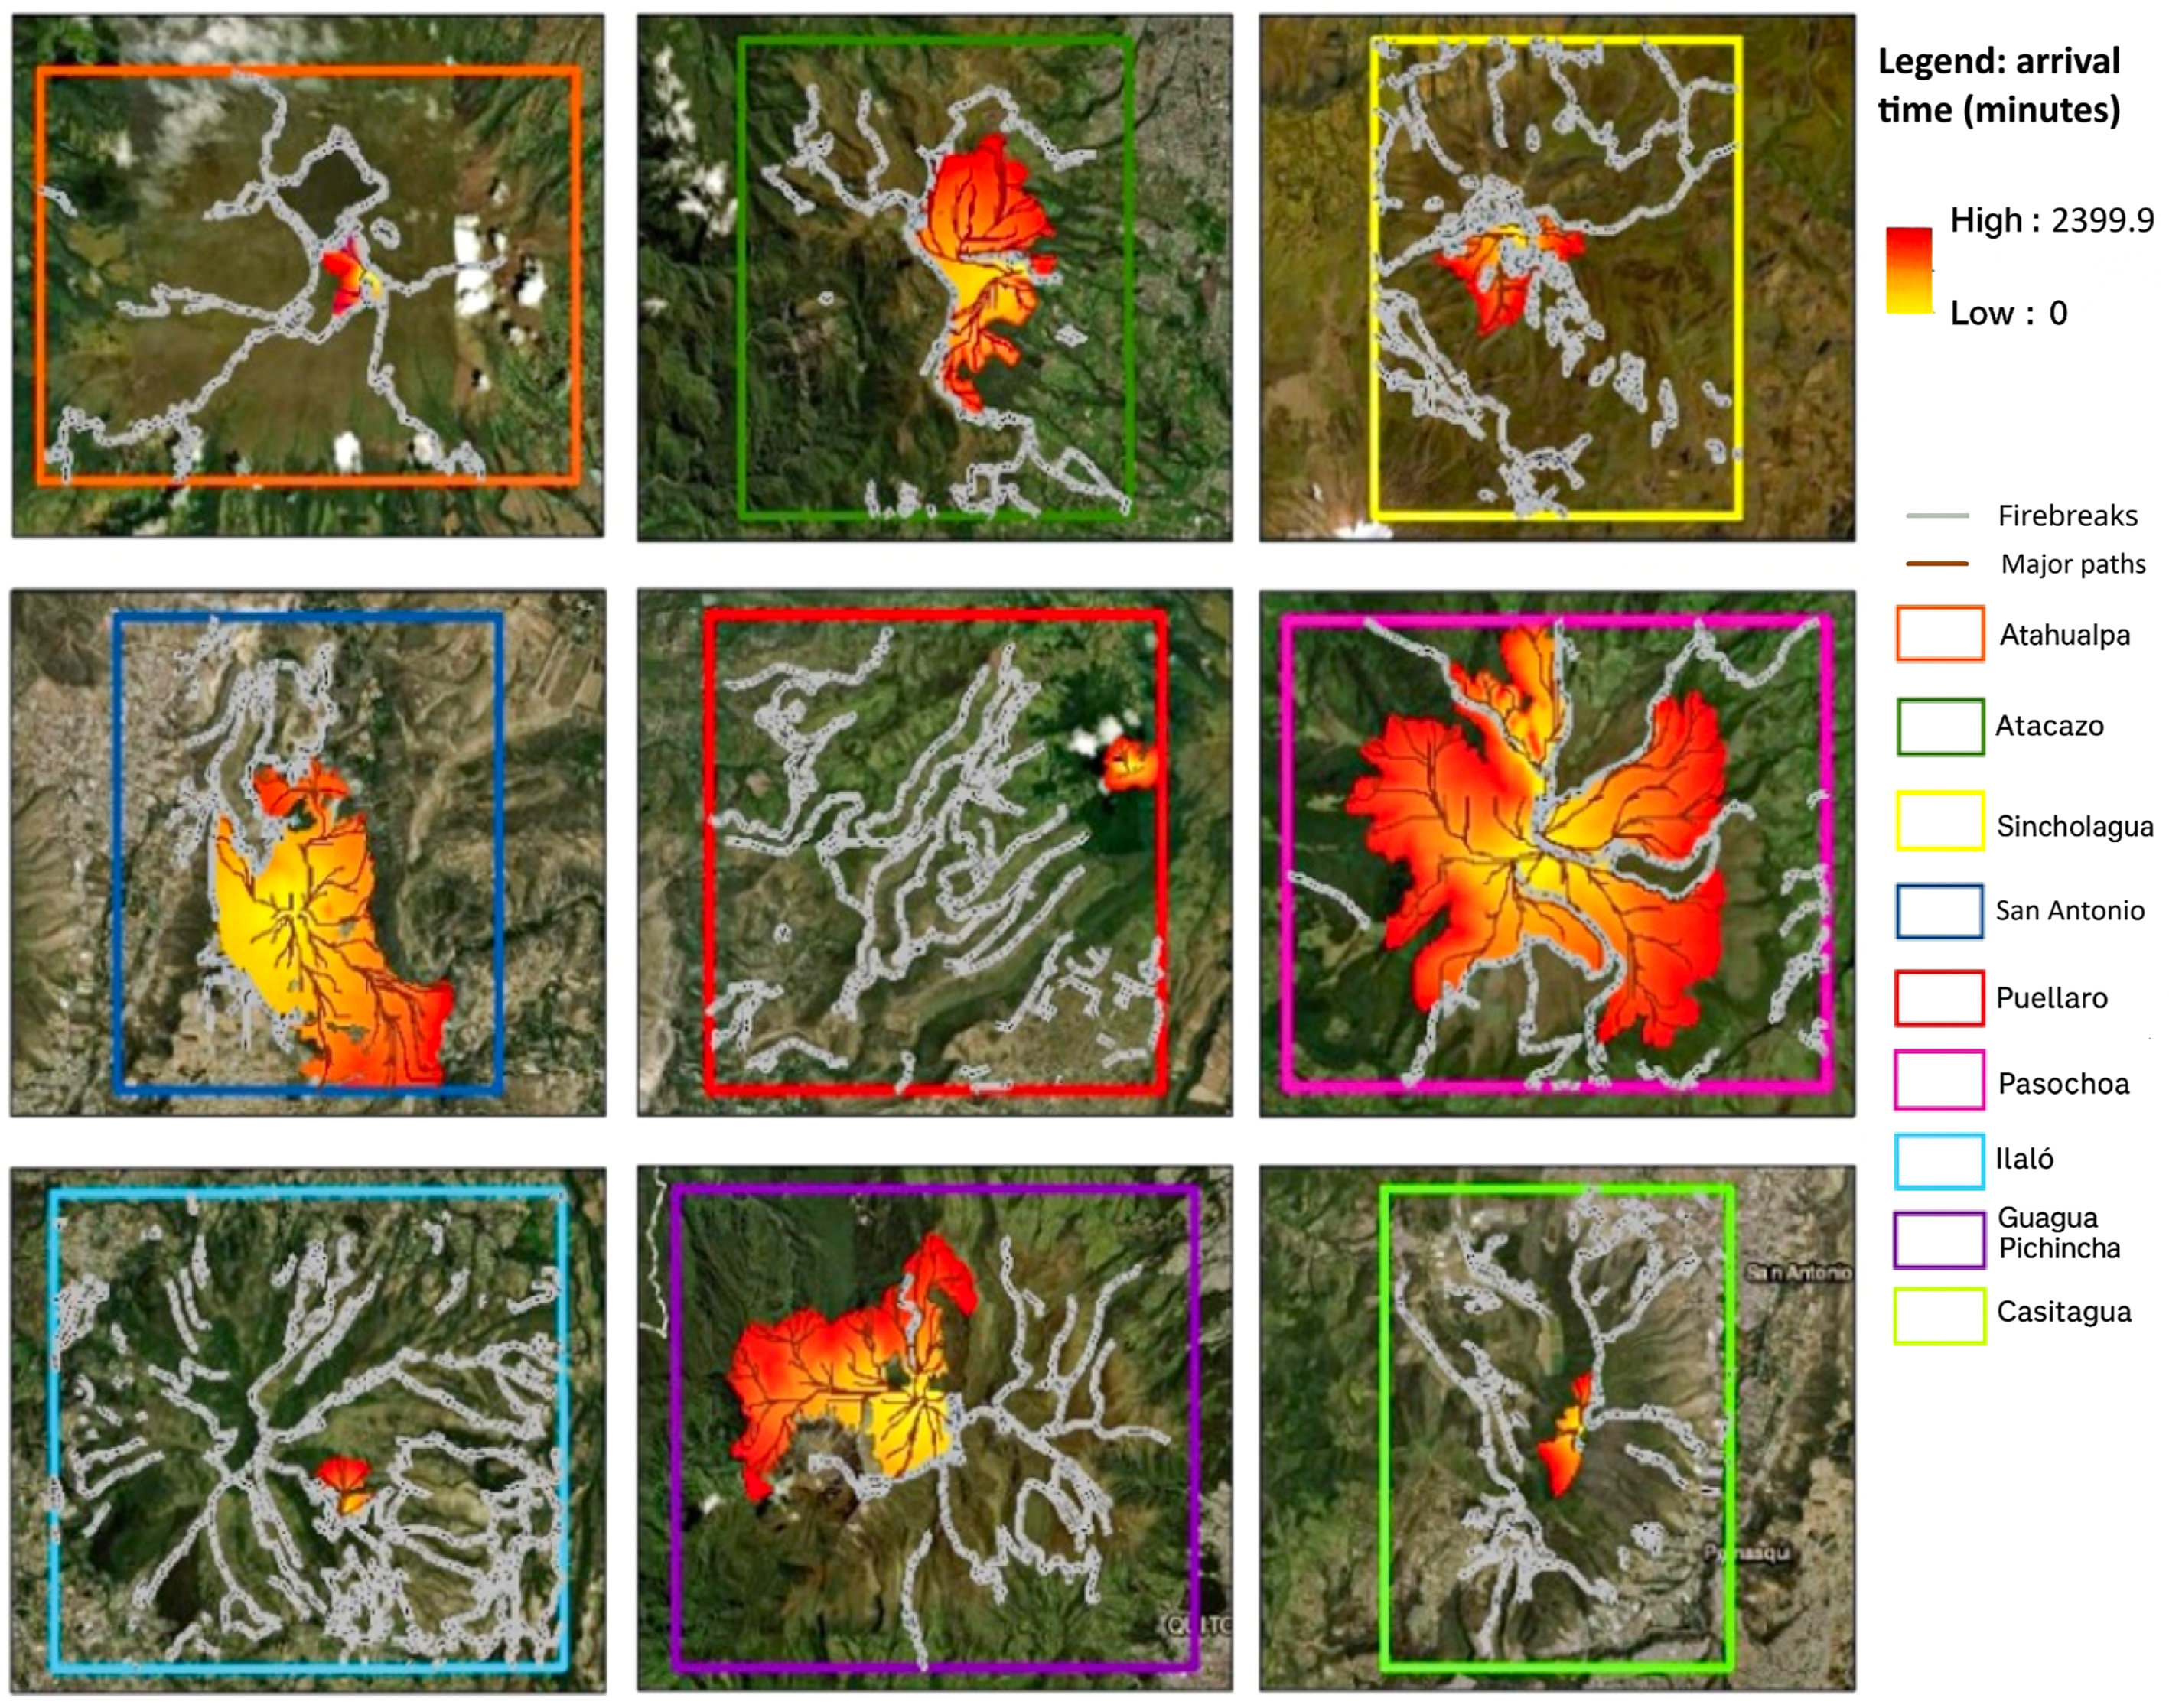
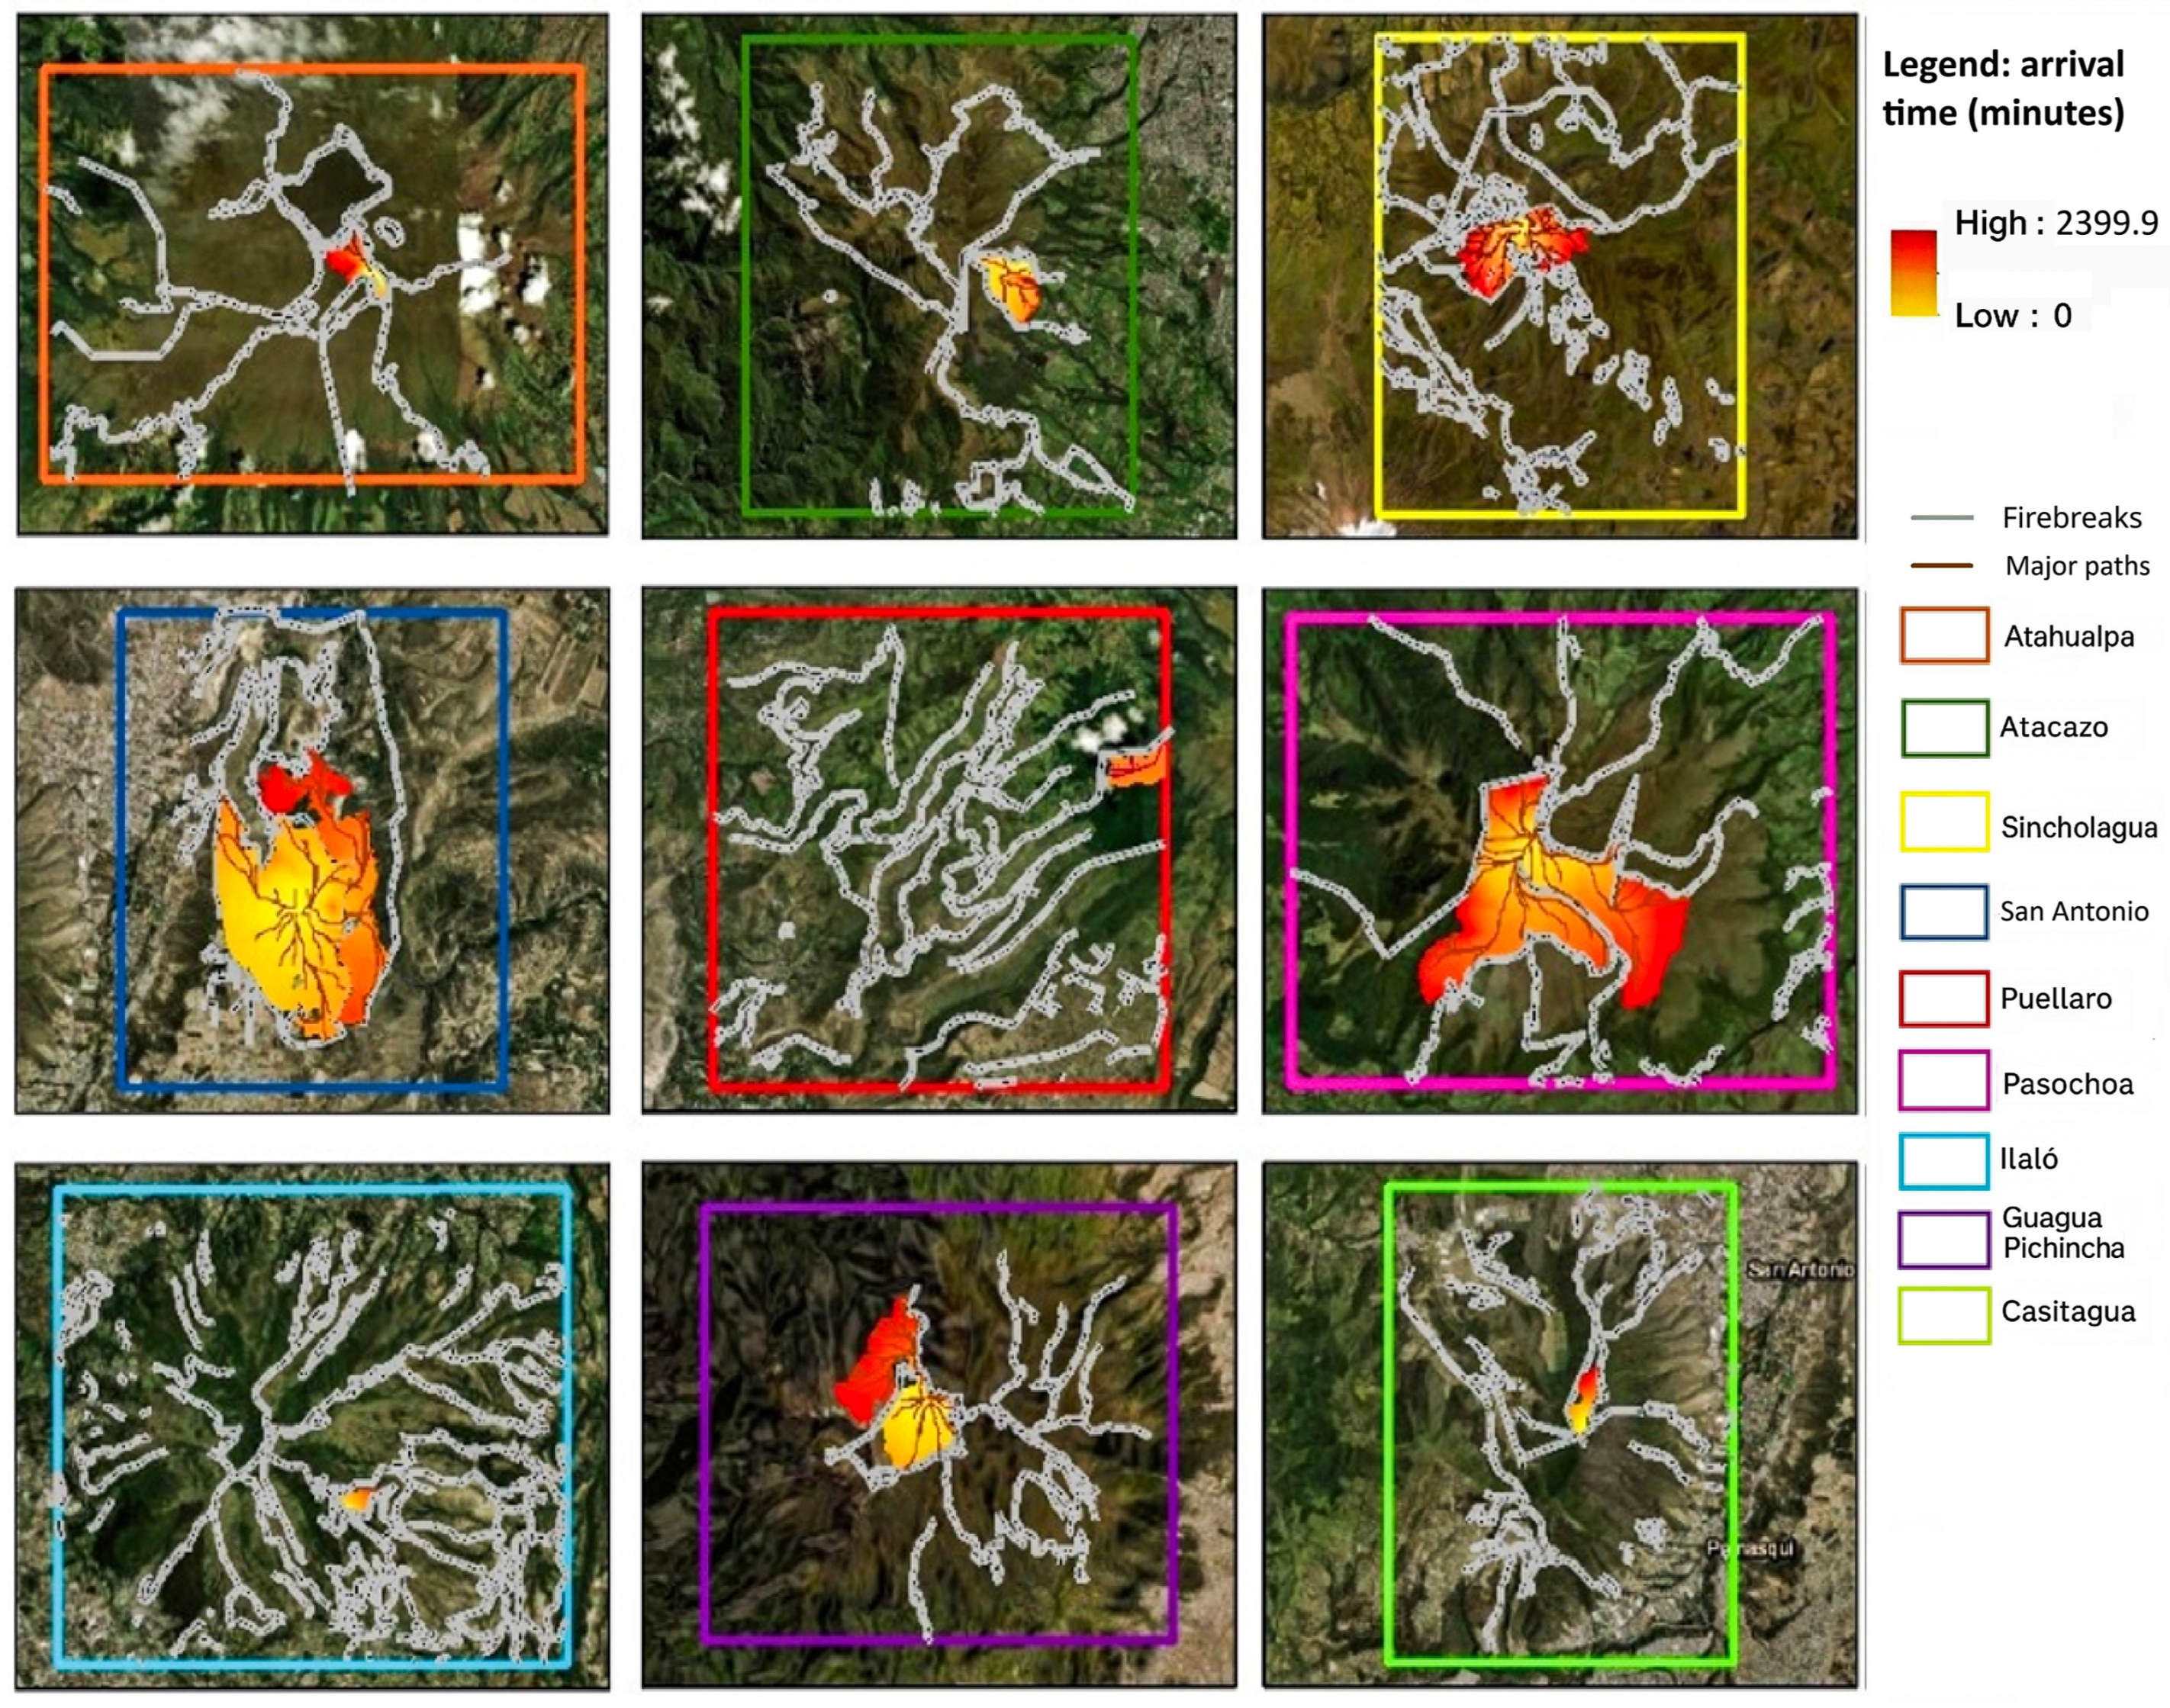
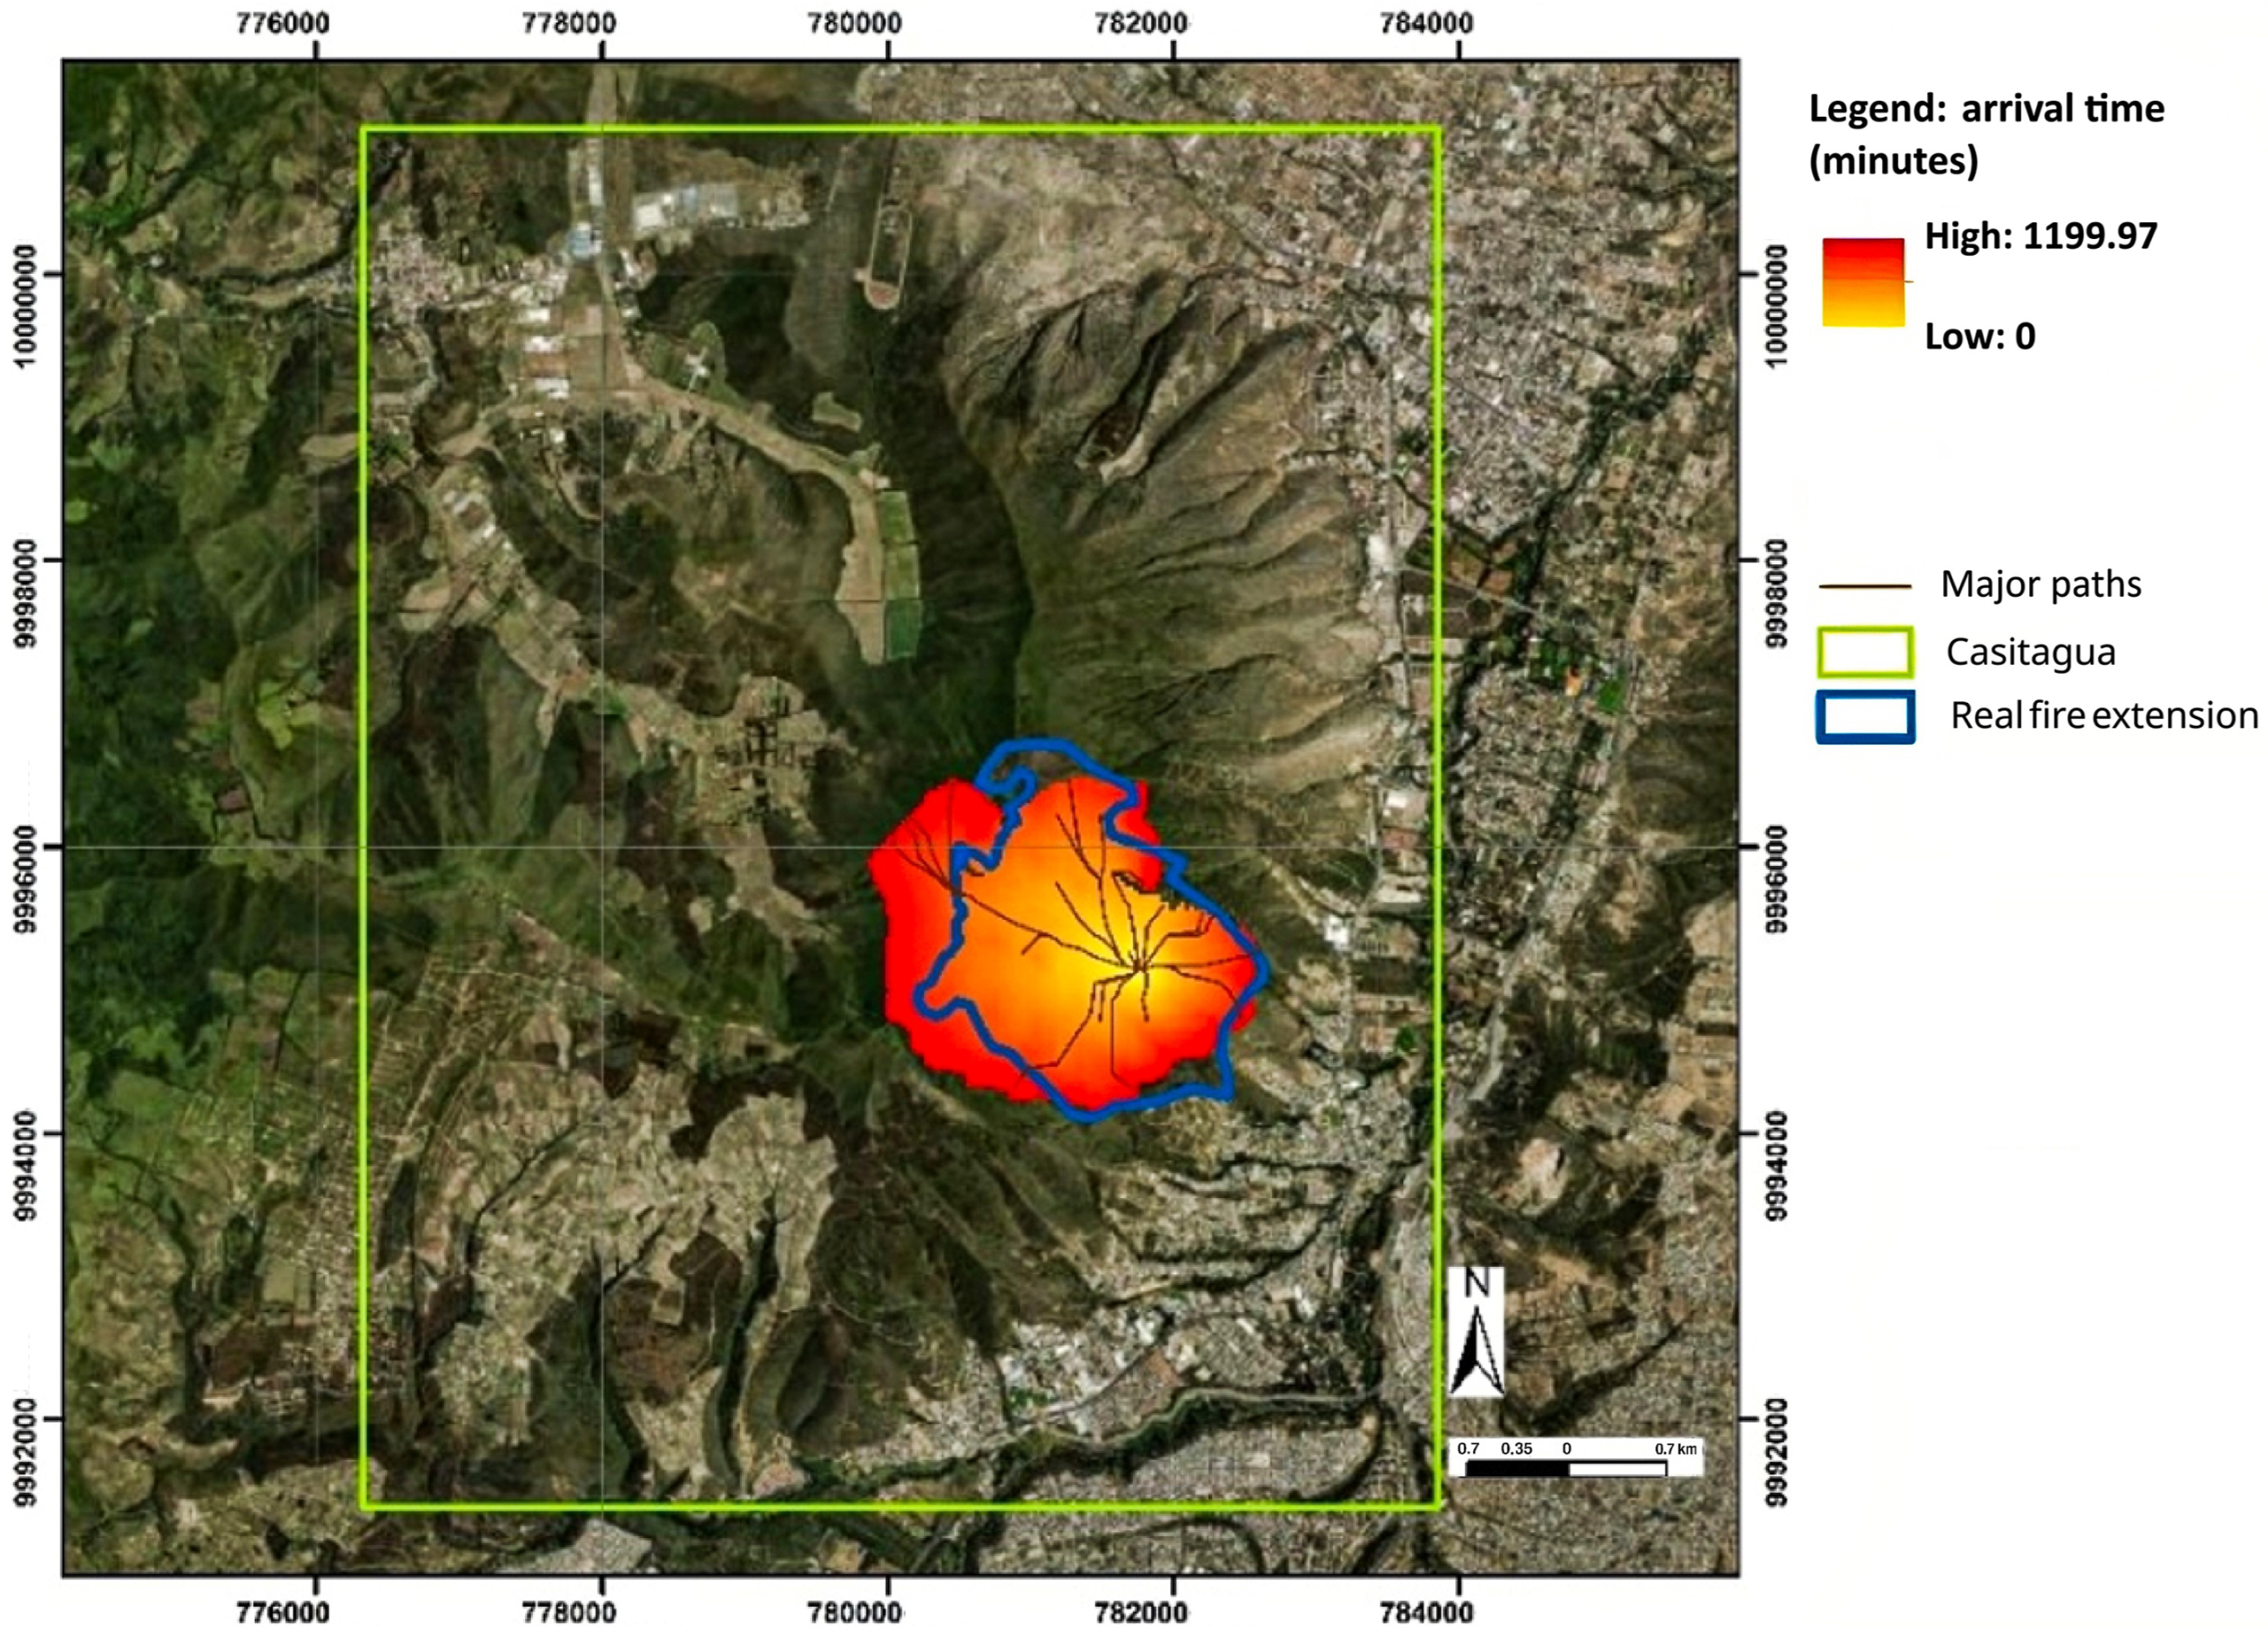
2.3.1. Simulation in FlamMap and Firebreaks Evaluation

The simulations in FlamMap version 6.1 were conducted using the Minimum Time to Travel (MTT) two-dimensional fire growth model. The results obtained include the simulation of major paths and arrival times. The major path maps help determine key areas where firebreaks can be strategically placed to intercept the fire, while the arrival time maps depict the fire spread over time.
Landscape (.LCP) and weather (.WXS) files were loaded into FlamMap version 6.1 to execute the MTT simulations. Ignition points were approximated based on the NASA FIRMS data of past wildfire events within the study area. Three distinct simulations were performed: the first simulation did not incorporate any firebreaks; the second included firebreaks derived from OpenStreetMap data (including roads, paths, tracks, water bodies, bare rock, and scree); and the third simulation evaluated the effect of new strategically located firebreaks to assess the potential impacts of these mitigation strategies within the DMQ. These additional firebreaks were located by following existing hiking trails visible in the satellite imagery that connected existing firebreaks. In areas where such trails were absent, firebreaks were positioned to cut the major paths from the previous MTT simulation to disrupt the potential fire progression. These data were processed in ArcGIS Pro 3.1 to generate a shapefile, which was subsequently integrated into FlamMap version 6.1 using the Barrier File functionality in the MTT interface, enabling the modeling of the firebreaks’ influence on fire propagation dynamics.

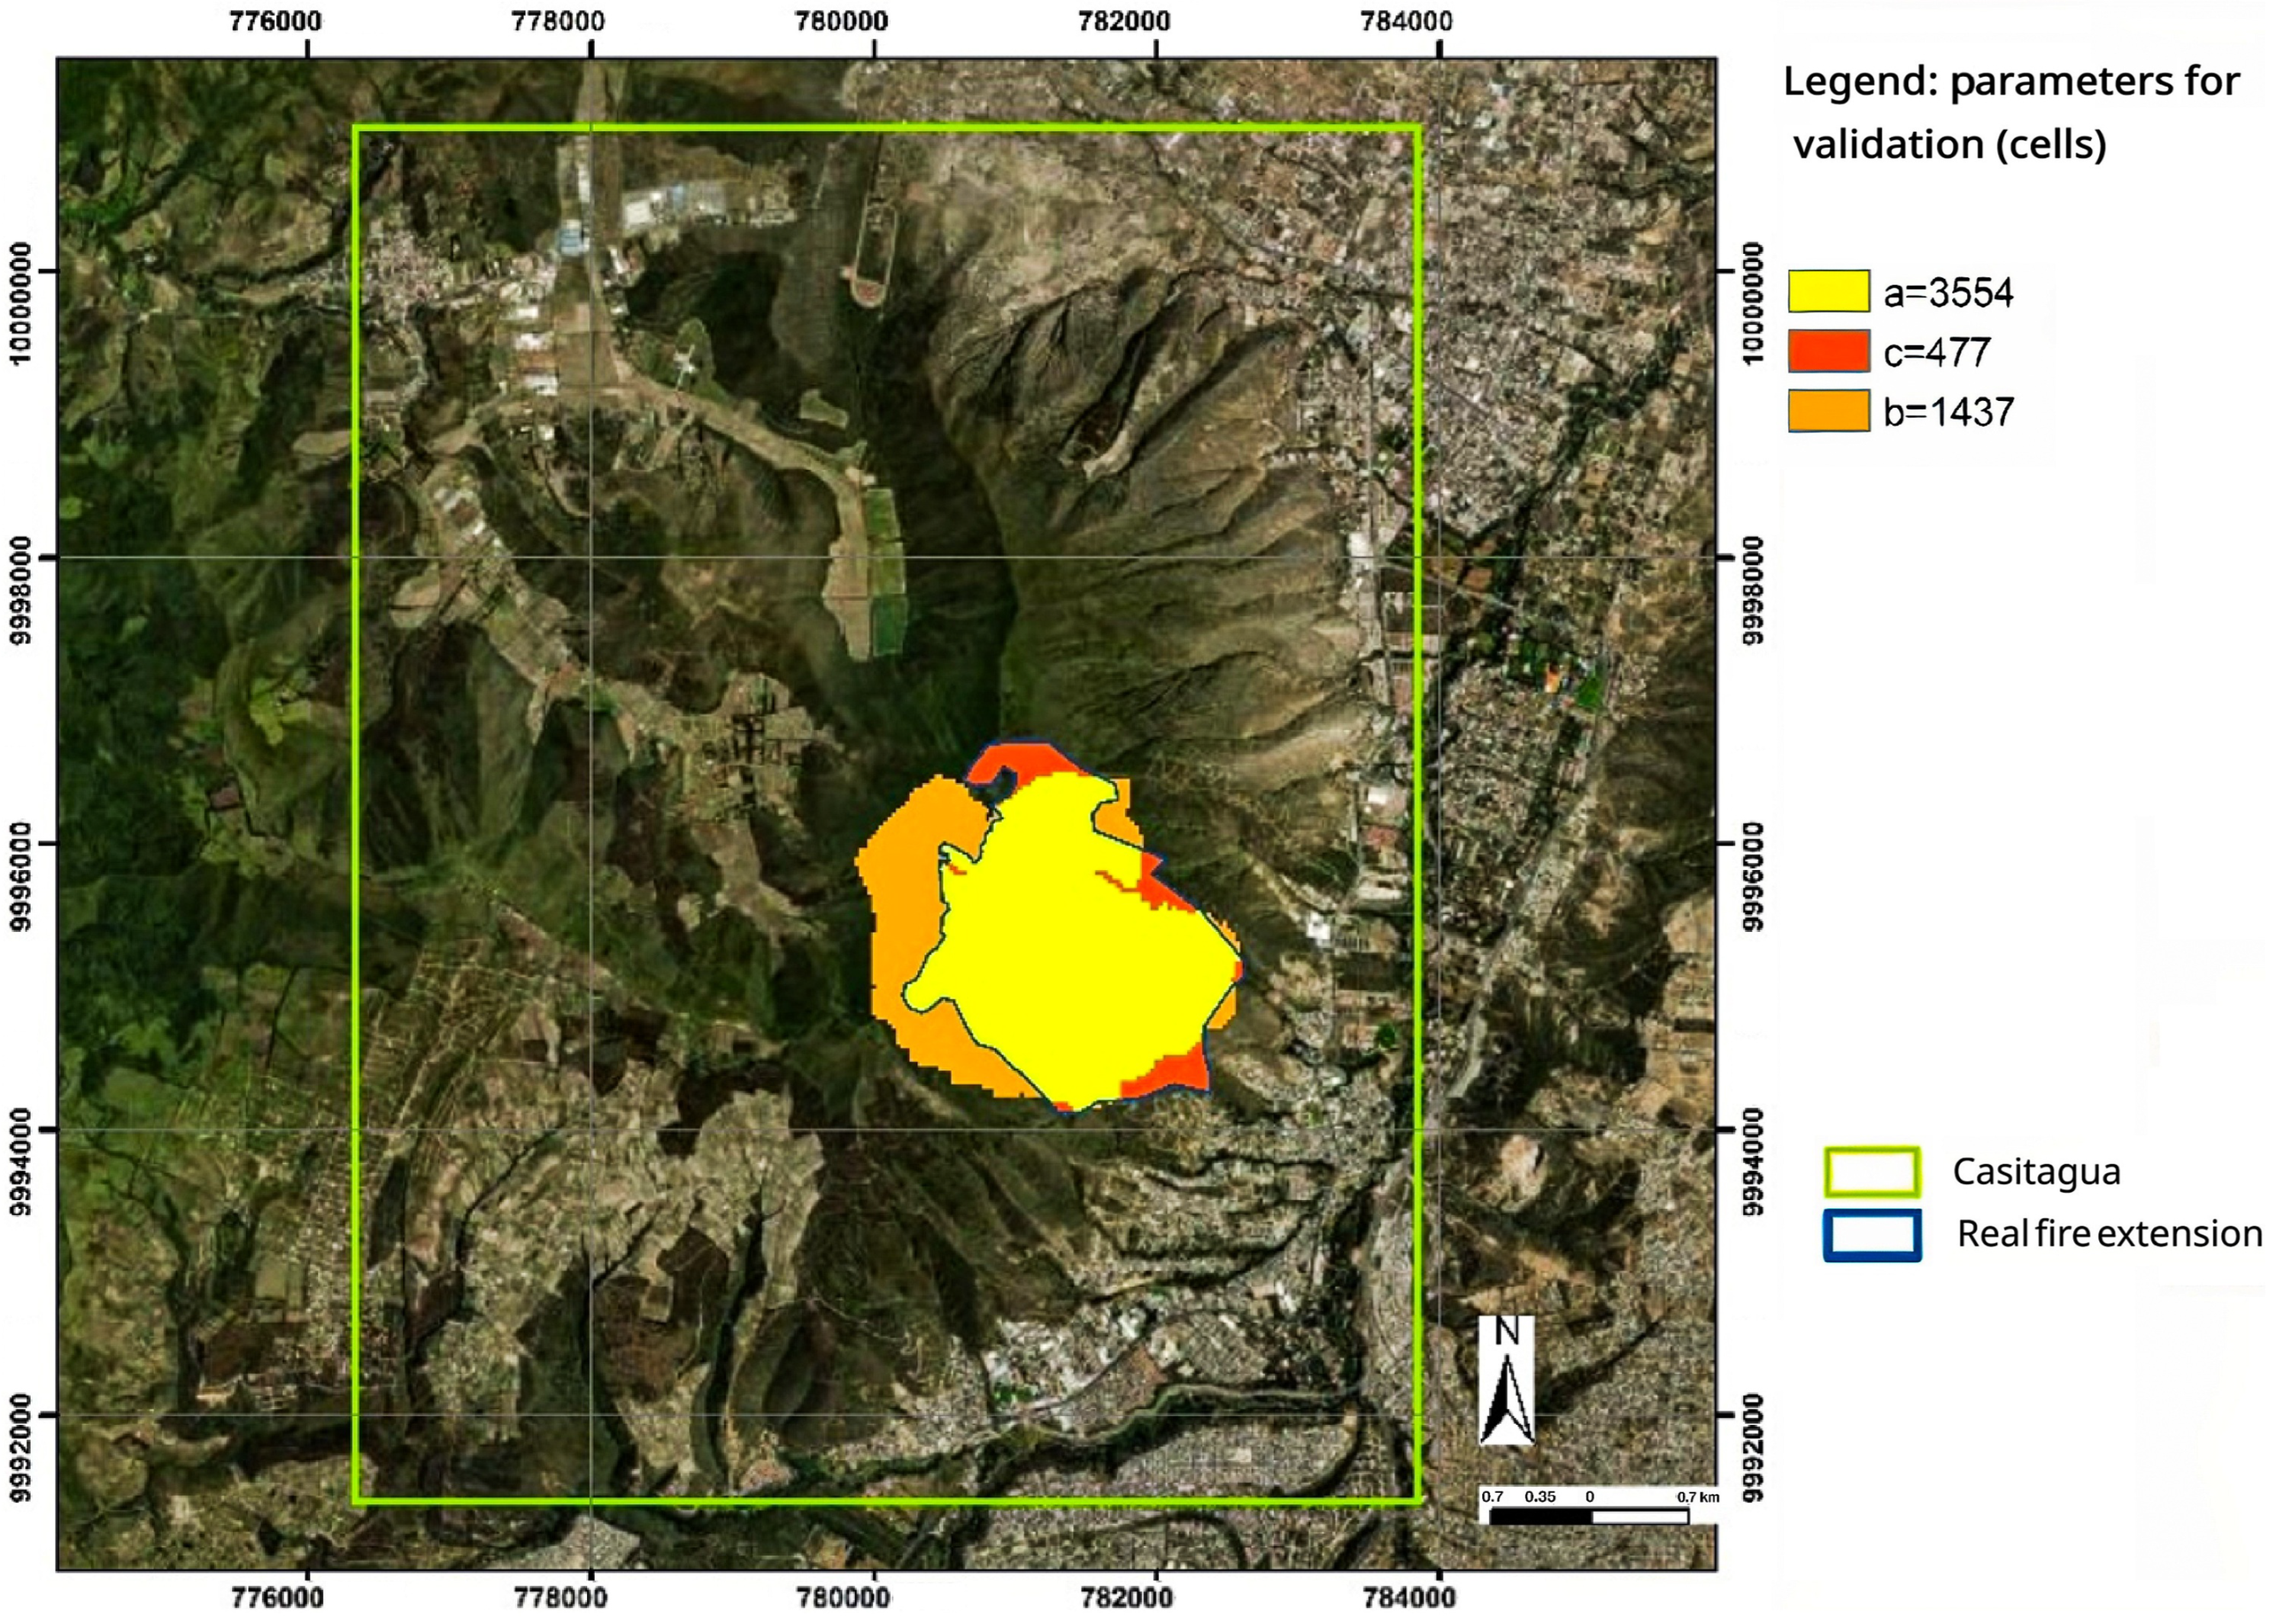
2.3.2. Sorensen and Kappa Coefficients Validation

Previous studies conducted in the Metropolitan District of Quito (DMQ) have validated FlamMap simulations using the same input data sources, reporting moderate-to-acceptable levels of agreement with the actual extent of wildfires based on both the Sorensen and Cohen’s kappa coefficients. Additionally, the model validation was carried out for a wildfire event that occurred within one of the study areas considered in this research: the Casitagua wildfire, which took place in January 2020. The wildfire extent was determined based on a free Sentinel-2 satellite image from 2 February 2020, almost 17 days after the wildfire was contained. The ignition point was identified near an easily accessible road, close to an urban area, as authorities determined that the fire was caused by human activity.
The Sorensen coefficient and Cohen’s kappa coefficient are commonly used statistical tools for evaluating the accuracy of spatial classification models. These metrics have been widely used for validating predictive models [28,29]. The Sorensen coefficient measures the similarity between the simulated and observed burned areas by comparing pixel-level matches, emphasizing the spatial overlap between both datasets. It is defined as
S = 2 a 2 a + b + c
where
  • a is the number of pixels correctly classified as burned in both datasets;
  • b is the number of pixels classified as burned only in the simulation;
  • c is the number of pixels classified as burned only in the reference data.
The Cohen’s kappa coefficient ( κ ) quantifies the level of agreement between two categorical classifications, adjusting for agreement that could occur by chance. It is calculated using
κ = p o p e 1 p e
where
  • p o is the observed agreement (i.e., the proportion of correctly classified pixels);
  • p e is the expected agreement by chance.

3. Results

The MTT simulation results for the scenario without firebreaks are shown in Figure 8. The simulations were carried out over a 40-hour period. The results indicate that in the absence of firebreaks, the primary factors that limited the fire spread were changes in the land cover (fuel models). For instance, the Puellaro simulation showed a limited wildfire extent, mainly constrained by the presence of agricultural land (fuel model 93); a similar pattern was observed in the Ilaló simulation. In the San Antonio simulation, the fire spread was restricted by urban areas (fuel model 91). In contrast, the Sincholagua and Atahualpa simulations revealed a slower fire spread due to the presence of humid vegetation (fuel models 103 and 105). In the cases of Casitagua and Pasochoa, the wildfire extent was primarily limited and slowed by a transition to vegetation types with low fuel loads (fuel models 121 and 162).
For simulations assessing the effect of firebreaks, OpenStreetMap features representing roads, paths, tracks, water bodies, bare rock, and scree were combined into a single shapefile (see Figure 9). In these simulations, it was assumed that all these elements functioned effectively as firebreaks; however, to do so, they needed to be properly adapted by ensuring an adequate width and the removal of surrounding fuel loads. The results show a notable reduction in burned areas across all study sites, except for Puéllaro and Casitagua, with an average reduction of 42.6% in the burned area. Additionally, some firebreaks were extended to intercept major fire paths and connect with other barriers by following the terrain contours (see Figure 10). In this scenario, a greater reduction of 70.2% in the burned area was achieved (see Table 3).
To validate the model, the Casitagua wildfire that occurred in January 2020 was taken into account, and an MTT simulation was conducted using the weather conditions recorded at that time and an ignition point located near an accessible road. This particular wildfire was selected for validation because a cloud-free Sentinel-2 satellite image from 2 February 2020 was available that clearly showed the final extent of the burned area. The results are presented in Figure 11. As shown, the fire extension differed significantly compared with the simulation in Figure 8, highlighting the strong influence of the weather conditions. In particular, January 2020 experienced notably dry conditions, which likely contributed to a faster and more extensive fire spread.
Figure 12 shows the areas corresponding to the parameters required to calculate the Sorensen and Cohen kappa coefficients, while Table 4 presents the corresponding error matrix. The Sorensen coefficient value was 0.79 and the Cohen kappa value was 0.77, indicating substantial agreement between the simulations and observed data.

4. Discussion

The effectiveness of firebreaks in nine high-susceptibility areas of the DMQ was assessed by estimating the percentage of mitigated area through the comparison of scenarios with adapted potential firebreaks and new strategically located firebreaks. The results highlight the importance of investing in preventive measures, which aligns with previous studies that analyzed fuel modification and trail implementation as effective wildfire mitigation strategies.
Improving wildfire management through simulation-based software requires appropriate data. A key limitation in applying FlamMap version 6.1 in the DMQ is the lack of fuel models representing local vegetation, including paramos, volcanic landscapes, wetlands, and other characteristic Andean ecosystems, which limits the precision of fire behavior predictions. Although approximations based on existing land-cover data yielded moderate-to-excellent model validations, developing localized fuel models specifically tailored to the diversity and structure of Andean vegetation would significantly enhance the simulation accuracy. Remote sensing technologies combined with field samples have been successfully applied in other regions, offering an opportunity to generate fuel model maps in these local environments, reducing current data gaps, and improving the reliability of wildfire risk assessments in the DMQ [30].
The simulations indicated that existing roads and trails could substantially contribute to reducing wildfire spread when assuming they function as firebreaks with 100% effectiveness. Their absence from the modeled landscape resulted in a notable increase in fire propagation. However, the real effectiveness of firebreaks depends on multiple variables, including the wind speed, humidity, temperature, topographic location, fuel continuity, maintenance levels, and suppression response [31]. Under adverse weather conditions, particularly strong winds, even wide and well-maintained firebreaks may fail, as high wind speeds can cause spotting and promote crown fires driven by an increased fireline intensity. Additionally, the type and continuity of surrounding fuels significantly influence the firebreak performance; the probability of a breach increases with the presence of tall trees and high load shrubs [32], requiring careful planning of the width, placement, and maintenance to match the site-specific conditions [33]. Despite these limitations, firebreaks remain a key strategy for wildfire mitigation, especially when designed not only to act as barriers but also to improve access and support rapid suppression efforts [33]. Further research is needed to refine firebreak design criteria in the DMQ, considering dynamic fire behavior and meteorological variability.
Moreover, the width and placement of firebreaks are critical factors. Wider firebreaks offer greater protection, particularly in areas with the presence of dense, tall, and highly flammable vegetation, while narrower barriers may be sufficient in zones with lower fuel loads and short vegetation, such as grasslands [34]. However, achieving the necessary width can sometimes result in significant ecological impacts by removing native vegetation and altering local habitats. Alternative strategies, such as green firebreaks, using native vegetation could represent a promising option to reduce wildfire spread while maintaining the ecosystem integrity [35]. Nonetheless, their implementation requires technical studies to identify suitable plant species with an adequate growth rate, pathogen resistance, economic value, and low flammability [36]. Another important challenge in firebreak implementation is land tenure, as the optimal location for firebreaks may lie within private properties, complicating their establishment. This issue is particularly relevant in sectors like the Puellaro and Atahualpa Parishes and the Ilaló Volcano, where agricultural activities and private land ownership limit the feasibility of implementing large-scale firebreaks.
The success of firebreaks as a mitigation strategy also depends on institutional and operational frameworks. Issues such as environmental impacts, high implementation and maintenance costs, land tenure conflicts, and varying levels of political commitment present significant obstacles. To address these challenges, future research and management efforts should adopt a multi-stakeholder approach, engaging universities, local governments, non-governmental organizations, and community members to design wildfire mitigation strategies that are technically sound, environmentally sustainable, and institutionally supported [37].

5. Conclusions

This study assessed the wildfire behavior and potential impact of firebreaks in highly susceptible areas of the Metropolitan District of Quito through FlamMap simulations. Based on the analysis, the following conclusions were reached:
1.
The simulation results show that adapting existing barriers (e.g., roads and trails) and creating additional strategically located firebreaks could reduce burned areas by up to 70%. However, firebreak effectiveness depends on multiple factors, particularly meteorological conditions, such as wind speed and humidity, emphasizing the need to incorporate environmental variability in mitigation planning.
2.
The use of publicly available geospatial and meteorological data, combined with free simulation software, such as FlamMap version 6.1, enables preliminary wildfire behavior modeling in regions with limited resources. This approach offers a cost-effective tool for initial risk assessment and mitigation planning.
3.
Although the national land-cover maps used were not specifically designed for fire behavior analysis, the approximation of MAGAP classes to Scott and Burgan fuel models achieved an acceptable simulation accuracy, with a Sorensen coefficient of 0.79 and a Cohen’s kappa of 0.77, demonstrating the potential of adapting the available data for wildfire simulations.
4.
While the adapted data proved useful, developing localized fuel models remains essential to improve the simulation results. Future efforts could combine remote sensing with field sampling to better characterize the fuel properties in Andean ecosystems. This characterization could also support the identification of low-flammability native vegetation, enabling the exploration of alternative approaches, such as green firebreaks, which can help reduce the fire spread while reducing ecological impacts.
5.
Beyond technical factors, the feasibility of establishing and maintaining firebreak infrastructure includes institutional, financial, and land management challenges. Multi-stakeholder collaboration, including local governments, technical agencies, communities, and academia, is essential for designing and implementing wildfire mitigation strategies that are both technically effective and socially viable.
In summary, further research should focus on refining local data inputs; developing localized fuel models; evaluating low ecological impact strategies, such as green firebreaks; validating firebreak designs under varying environmental conditions; and fostering multi-stakeholder collaboration to strengthen wildfire preparedness and response in high-risk areas of the Metropolitan District of Quito and across Ecuador.

Author Contributions

Conceptualization, J.G.M.-L.; methodology, J.G.M.-L., K.J.O.-P. and B.G.C.-L.; software, B.G.C.-L.; validation, J.G.M.-L. and B.G.C.-L.; formal analysis, B.G.C.-L. and K.J.O.-P.; investigation, J.G.M.-L., K.J.O.-P. and B.G.C.-L.; resources, K.J.O.-P.; data curation, J.G.M.-L. and K.J.O.-P.; writing—original draft preparation, J.G.M.-L. and K.J.O.-P.; writing—review and editing, J.G.M.-L.; visualization, B.G.C.-L.; supervision, J.G.M.-L.; project administration, J.G.M.-L. All authors have read and agreed to the published version of this manuscript.

Funding

This research received no external funding.

Institutional Review Board Statement

Not applicable.

Informed Consent Statement

Not applicable.

Data Availability Statement

The original contributions found in this study are included in this paper; further inquiries can be directed to the corresponding author.

Conflicts of Interest

The authors declare no conflicts of interest.

Abbreviations

The following abbreviations are used in this manuscript:
CAWFECoupled Atmosphere–Wildland Fire Environment
DEMDigital Elevation Model
DMQMetropolitan District of Quito
ESAEuropean Space Agency
FIRMSFire Information for Resource Management System
IGMMilitary Geographic Institute of Ecuador
MAGAPMinistry of Agriculture and Livestock of Ecuador
MTTMinimum Time to Travel
REMMAQMetropolitan Atmospheric Monitoring Network of Quito

References

  1. Weber, K.T.; Yadav, R. Spatiotemporal Trends in Wildfires across the Western United States (1950–2019). Remote Sens. 2020, 12, 2959. [Google Scholar] [CrossRef]
  2. Povak, N.A.; Hessburg, P.F.; Salter, R.B. Evidence for scale-dependent topographic controls on wildfire spread. Ecosphere 2018, 9, e02443. [Google Scholar] [CrossRef]
  3. Benson, R.P.; Roads, J.O.; Weise, D.R. Chapter 2 Climatic and Weather Factors Affecting Fire Occurrence and Behavior. Dev. Environ. Sci. 2008, 8, 37–59. [Google Scholar] [CrossRef]
  4. Balik, J.A.; Coop, J.D.; Krawchuk, M.A.; Naficy, C.E.; Parisien, M.A.; Parks, S.A.; Stevens-Rumann, C.S.; Whitman, E. Biogeographic patterns of daily wildfire spread and extremes across North America. Front. For. Glob. Change 2024, 7, 1355361. [Google Scholar] [CrossRef]
  5. Pourmohamad, Y.; Abatzoglou, J.T.; Fleishman, E.; Short, K.C.; Shuman, J.; AghaKouchak, A.; Williamson, M.; Seydi, S.T.; Sadegh, M. Inference of Wildfire Causes From Their Physical, Biological, Social and Management Attributes. Earth’s Future 2025, 13, e2024EF005187. [Google Scholar] [CrossRef]
  6. Coen, J.L.; Patton, E.G. Modeling wildland fires: A description of the Coupled Atmosphere-Wildland Fire Environment (CAWFE) model. Ncar Tech. Note 2010, 511, 3–38. [Google Scholar] [CrossRef]
  7. Mandel, J.; Beezley, J.D.; Kochanski, A.K. Coupled atmosphere-wildland fire modeling with WRF-Fire. Geosci. Model Dev. 2011, 4, 591–610. [Google Scholar] [CrossRef]
  8. Burge, J.; Bonanni, M.R.; Hu, R.L.; Ihme, M. Recurrent Convolutional Deep Neural Networks for Modeling Time-Resolved Wildfire Spread Behavior. arXiv 2022, arXiv:2210.16411. [Google Scholar] [CrossRef]
  9. Mitra, K.; Peng, Q.; Reisch, C. Studying wildfire fronts using advection–diffusion–reaction models. arXiv 2024, arXiv:2401.17468. [Google Scholar] [CrossRef]
  10. Finney, M.A. FARSITE: Fire Area Simulator—Model Development and Evaluation. USDA Forest Service; Rocky Mountain Research Station: Fort Collins, CO, USA, 1998. [Google Scholar] [CrossRef]
  11. Finney, M.A. An Overview of FlamMap Fire Modeling Capabilities. In Fuels Management—How to Measure Success; Rocky Mountain Research Station: Fort Collins, CO, USA, 2006; pp. 213–220. [Google Scholar]
  12. Kudlackova, L.; de Podebradska, M.; Blahova, M.; Cienciala, E.; Beranova, J.; McHugh, C.; Finney, M.; Novotny, J.; Zahradnicek, P.; Stepanek, P.; et al. Using Flammap to Assess Wildfire Behavior in Bohemian Switzerland National Park. Nat. Hazards 2024, 120, 3943–3977. [Google Scholar] [CrossRef]
  13. Khalaf, M.W.A.; Shataee, S.; Jahdi, R. Performance Analysis of ConvLSTM, FlamMap, and CA Algorithms to Predict Wildfire Spread in Golestan National Park, NE Iran. Environ. Model. Assess. 2024, 29, 489–502. [Google Scholar] [CrossRef]
  14. Yavuz, M.; Sağlam, B.; Kucuk, O.; Tufekcioglu, A. Assessing forest fire behavior simulation using FlamMap software and remote sensing techniques in Western Black Sea Region, Turkey. J. For. Fac. Kastamonu Univ. 2018, 18, 171–188. [Google Scholar] [CrossRef]
  15. Lovreglio, R.; Lovreglio, J.; Satta, G.G.A.; Mura, M.; Pulina, A. Assessing the Role of Forest Grazing in Reducing Fire Severity: A Mitigation Strategy. Fire 2024, 7, 409. [Google Scholar] [CrossRef]
  16. Lara, J.G.M.; Mendoza, C.I.A.; Coronel, L.J.J. Assessment of fuel related data in the metropolitan district of quito for modeling and simulation of wildfires, case study: Atacazo hill wildfire; [EvaluaciÓn de informaciÓn relacionada con combustibles en el distrito metropolitano de quito para el modelado y simulaciÓn de incendios forestales, caso de estudio: Incendio del cerro atacazo]. Granja 2021, 34, 43–59. [Google Scholar] [CrossRef]
  17. Mollocana Lara, J.G.; Paredes Obando, J.B. Assessment and Selection of Fuel Models in Areas with High Susceptibility to Wildfires in the Metropolitan District of Quito. In Innovation and Research—Smart Technologies & Systems; Vizuete, M.Z., Botto-Tobar, M., Casillas, S., Gonzalez, C., Sánchez, C., Gomes, G., Durakovic, B., Eds.; Springer: Cham, Switzerland, 2024; pp. 54–68. [Google Scholar] [CrossRef]
  18. Arias-Muñoz, P.; Cabrera-García, S.; Jácome-Aguirre, G. A Multicriteria Geographic Information System Analysis of Wildfire Susceptibility in the Andean Region: A Case Study in Ibarra, Ecuador. Fire 2024, 7, 81. [Google Scholar] [CrossRef]
  19. Security Secretariat of the Metropolitan District of Quito. Natural Hazards Atlas of the Metropolitan District of Quito; Municipality of the Metropolitan District of Quito: Quito, Ecuador, 2020. [Google Scholar]
  20. Ministry of Agriculture and Livestock of Ecuador (MAGAP). Vegetation Cover and Land Use Maps of Ecuador. MAGAP, National Geographic Information System. 2024. Available online: http://www.sigtierras.gob.ec/geoportal/ (accessed on 30 July 2023).
  21. Military Geographic Institute of Ecuador (IGM). Cartographic Base of Ecuador: Contour Lines and Topographic Data. Scale 1:50,000. Quito, Ecuador. 2024. Available online: https://www.geoportaligm.gob.ec/portal/index.php/cartografia-de-libre-acceso-escala-50k/ (accessed on 30 July 2023).
  22. NASA FIRMS. Fire Information for Resource Management System (FIRMS). NASA Earth Science, EOSDIS, MODIS and VIIRS Active Fire Data. 2024. Available online: https://firms.modaps.eosdis.nasa.gov/ (accessed on 30 July 2023).
  23. Metropolitan Atmospheric Monitoring Network of Quito (REMMAQ). Atmospheric Records of the Metropolitan District of Quito. Meteorological Data Obtained From Urban Monitoring Stations in Quito. 2024. Available online: https://datosambiente.quito.gob.ec/ (accessed on 30 July 2023).
  24. ESA. Sentinel-2 Data from Sentinel Hub Copernicus Browser. 2024. Available online: https://sentinel-hub.com (accessed on 30 July 2023).
  25. OpenStreetMap Contributors. OpenStreetMap: Geospatial Data for Global Mapping. Open Data Licensed Under the Open Database License (ODbL). 2024. Available online: https://www.openstreetmap.org/ (accessed on 30 July 2023).
  26. Scott, J.H.; Burgan, R.E. Standard Fire Behavior Fuel Models: A Comprehensive Set for Use with Rothermel’s Surface Fire Spread Model; Technical Report RMRS-GTR-153; U.S. Department of Agriculture, Forest Service, Rocky Mountain Research Station: Fort Collins, CO, USA, 2005. [Google Scholar]
  27. Jahdi, R.; Salis, M.; Darvishsefat, A.A.; Alcasena, F.; Mostafavi, M.A.; Etemad, V.; Lozano, O.M.; Spano, D. Evaluating fire modelling systems in recent wildfires of the Golestan National Park, Iran. Forestry 2015, 89, 136–149. [Google Scholar] [CrossRef]
  28. Ning, J.; LiU, H.; Yu, W.; Deng, J.; Sun, L.; Yang, G.; Wang, M.; Yu, H. Comparison of Different Models to Simulate Forest Fire Spread: A Case Study. Forest 2024, 15, 563. [Google Scholar] [CrossRef]
  29. Gharakhanlou, N.M.; Hooshangi, N. Validation of a GIS-based cellular automata model for wildfire spread using Kappa coefficient analysis. Int. J. Wildland Fire 2021, 30, 456–468. [Google Scholar] [CrossRef]
  30. Elia, M.; Lafortezza, R.; Lovreglio, R.; Sanesi, G. Developing Custom Fire Behavior Fuel Models for Mediterranean Wildland–Urban Interfaces in Southern Italy. Environ. Manag. 2015, 56, 754–764. [Google Scholar] [CrossRef]
  31. Carrasco, J.; Mahaluf, R.; Lisón, F.; Pais, C.; Miranda, A.; de la Barra, F.; Palacios, D.; Weintraub, A. A firebreak placement model for optimizing biodiversity protection at landscape scale. J. Environ. Manag. 2023, 342, 118087. [Google Scholar] [CrossRef]
  32. Cheney, N.P.; Sullivan, A.L. Width of firebreak that is necessary to stop grass fires: Some field experiments in Northern Australia. Can. J. For. Res. 1988, 18, 653–658. [Google Scholar] [CrossRef]
  33. Ortega, M.; Silva, F.R.; Molina, J.R. Modeling Fuel Break Effectiveness in Southern Spain Wildfires. Fire Ecol. 2024, 20, 40. [Google Scholar] [CrossRef]
  34. Zong, X.; Tian, X.; Wang, X. An optimal firebreak design for the boreal forest of China. Sci. Total Environ. 2021, 781, 146822. [Google Scholar] [CrossRef]
  35. Marshall, E.; Holyland, B.; Parkins, K.; Raulings, E.; Good, M.K.; Swan, M.; Bennett, L.T.; Penman, T.D. Can green firebreaks help balance biodiversity, carbon storage and wildfire risk? J. Environ. Manag. 2024, 369, 122183. [Google Scholar] [CrossRef] [PubMed]
  36. Cui, X.; Alam, M.A.; Perry, G.L.; Paterson, A.M.; Wyse, S.V.; Curran, T.J. Green firebreaks as a management tool for wildfires: Lessons from China. J. Environ. Manag. 2019, 233, 329–336. [Google Scholar] [CrossRef]
  37. Kirschner, J.A.; Clark, J.; Boustras, G. Governing Wildfires: Toward a Systematic Analytical Framework. Ecol. Soc. 2023, 28, 6. [Google Scholar] [CrossRef]
Figure 1. Methodology diagram.
Fire 08 00189 g001
Figure 2. Location map of the selected study areas within the Metropolitan District of Quito (DMQ).
Fire 08 00189 g002
Figure 3. Elevation rasters in the study areas of the Metropolitan District of Quito (DMQ).
Fire 08 00189 g003
Figure 4. Slope rasters in the study areas of the Metropolitan District of Quito (DMQ).
Fire 08 00189 g004
Figure 5. Aspect rasters in the study areas of the Metropolitan District of Quito (DMQ).
Fire 08 00189 g005
Figure 6. Fuel model rasters in the study areas of the Metropolitan District of Quito (DMQ).
Fire 08 00189 g006
Figure 7. Vegetation cover rasters in the study areas of the Metropolitan District of Quito (DMQ).
Fire 08 00189 g007
Figure 8. Major paths and arrival time simulations without firebreaks in the study areas of the Metropolitan District of Quito (DMQ).
Fire 08 00189 g008
Figure 9. Major paths and arrival time simulations with potential firebreaks in the study areas of the Metropolitan District of Quito (DMQ).
Fire 08 00189 g009
Figure 10. Major paths and arrival time simulations with additional strategically placed firebreaks in the study areas of the Metropolitan District of Quito (DMQ).
Fire 08 00189 g010
Figure 11. Major paths and arrival time simulation for the January 2020 Casitagua Wildfire compared with the observed final burned area.
Fire 08 00189 g011
Figure 12. Parameters for validation of the January 2020 Casitagua Wildfire simulation.
Fire 08 00189 g012
Table 1. Sources of data used in this simulation study.
DataSource
Wildfire susceptibility areasNatural Hazards Atlas of the Metropolitan District of Quito [19]
Land-cover mapsMinistry of Agriculture and Livestock of Ecuador (MAGAP) [20]
Topographic contour linesMilitary Geographic Institute of Ecuador (IGM) [21]
Wildfire records and possible ignition pointsFire Information for Resource Management System (FIRMS-NASA) [22]
Meteorological dataMetropolitan Atmospheric Monitoring Network (REMMAQ) [23]
Past wildfires extensionEuropean Space Agency (ESA) Sentinel-2 Satellite Imagery [24]
Potential firebreaksOpenStreetMap (OSM) [25]
Table 2. Assignment of MAGAP land-cover classes to Scott and Burgan fuel models.
MAGAP ClassFuel Model (Code)Fuel Model Description
Urban and built-up classes (populated centers, military, industrial, recreational, educational facilities, etc.)NB1 (91)Urban or suburban areas with insufficient wildland fuel to support fire spread.
GlacierNB2 (92)Areas permanently covered by snow or ice.
Agricultural classes (various crops, greenhouses, pastures, farms, etc.)NB3 (93)Agricultural land maintained in a nonburnable condition.
Water bodies classes (lakes, lagoons, rivers, reservoirs, etc.)NB8 (98)Open water, such as lakes, rivers, and oceans.
Bare ground classes (eroded land, bare ground, mines, rock formations, etc.)NB9 (99)Bare ground with insufficient fuel to carry fire, such as sand, gravel, or rock.
Highly altered dry herbaceous vegetationGR1 (101)Short, sparse dry climate grass.
Moderately altered dry herbaceous vegetationGR2 (102)Low-load, dry climate grass with more continuity than GR1.
Highly altered herbaceous paramoGR3 (103)Very coarse, humid climate grass with a low load.
Slightly altered dry herbaceous vegetationGR4 (104)Moderate-load, dry climate grass.
Moderately altered herbaceous paramoGR5 (105)Low-load, humid climate grass; greater than GR3.
Herbaceous vegetationGR7 (107)High-load, dry climate grass.
ParamoGR8 (108)High-load, very coarse, humid climate grass.
Moderately altered dry scrublandGS1 (121)Low-load, dry climate grass–shrub.
Highly altered dry scrubland and slightly altered dry scrublandGS2 (122)Moderate-load, dry climate grass–shrub.
Highly altered paramo shrubland, moderately altered paramo shrubland, and highly altered humid scrubGS3 (123)Moderate-load, humid climate grass–shrub.
Slightly altered paramo shrubland, slightly altered humid scrub, and moderately altered humid scrubGS4 (124)High-load, humid climate grass–shrub.
Highly altered humid forestSH4 (144)Low-load, humid climate timber–shrub.
Highly altered dry forestTU1 (161)Low-load, dry climate timber–grass–shrub.
Moderately altered humid forestTU2 (162)Moderate-load, humid climate timber–shrub.
Slightly altered humid forestTU3 (163)Moderate-load, humid climate timber–grass–shrub.
Pine forestTU4 (164)Dwarf conifer with understory.
Native forestTU5 (165)Very high load, dry climate timber–shrub.
Table 3. Simulated fire extension under different firebreak scenarios.
Study AreaWithout Firebreaks (m²)With Firebreaks (m²)With Additional Firebreaks (m²)Mitigation with Firebreaks (%)Mitigation with Additional Firebreaks (%)
Atahualpa221,52047,73033,81078.584.7
Atacazo1,134,600402,21054,96064.695.2
Casitagua39,78039,39014,3401.064.0
Guagua Pichincha2,058,780705,120275,82065.886.6
Ilaló78,90021,810747072.490.5
Sincholagua1,036,860566,460380,28045.463.3
Pasochoa1,123,860849,270278,82024.475.2
Puéllaro30,69030,69024,1800.021.2
San Antonio824,250567,300405,81031.250.8
Table 4. Error matrix for the January 2020 Casitagua wildfire simulation. The value a represents cells burned in both the simulation and the real wildfire; b are cells burned only in the simulation; c are cells burned only in the real wildfire; and d are cells not burned in either case.
Simulated BurnedSimulated Not BurnedTotal
Real burned3554 (a)1437 (b)4991
Real not burned477 (c)75,103 (d)75,580
Total403776,54080,571
Disclaimer/Publisher’s Note: The statements, opinions and data contained in all publications are solely those of the individual author(s) and contributor(s) and not of MDPI and/or the editor(s). MDPI and/or the editor(s) disclaim responsibility for any injury to people or property resulting from any ideas, methods, instructions or products referred to in the content.

