1. Introduction
When a mine fire occurs, fatalities and property losses are incurred, and the formulation of appropriate disaster-relief and disaster-avoidance strategies is of considerable practical significance for the protection of underground personnel and the coordination of rescue teams. With the advancement of mine automation and unmanned operations, numerous novel theories and technologies have been applied to mine disaster relief and personnel sheltering. From an algorithmic perspective, current mine-disaster mitigation efforts have been centred on graph-theoretic algorithms, intelligent optimisation algorithms and heuristic search algorithms, with corresponding avoidance strategies devised and escape routes planned for underground miners. However, in practice, during a fire outbreak, certain areas may experience insufficient oxygen supply and severe fire conditions, rendering standard sheltering procedures impracticable. Consequently, mine rescue teams are required to be deployed to assist in extricating trapped miners. In 2018, an underground conveyor-belt fire at the Palabora copper mine in South Africa resulted in five miners being killed and one reported missing. In 2021, a methane explosion at the Kuzbass coal mine in Russia triggered a fire that caused at least 52 fatalities and 57 injuries. In 2023, the spontaneous combustion of fragmented media at the Gengcun coal mine in China led to a fire causing five deaths. In 2024, a fire at a coal mine in Nagaland, north-eastern India, was responsible for at least six deaths and four injuries. Such mine-fire incidents have had an indelible impact on the development of the mining industry and have inflicted irreversible losses on the families of the victims. To date, mine rescue strategies have been primarily focused on the planning of personnel escape routes, with limited research addressing the coordinated deployment of multiple rescue teams for underground rescue operations. In situations where miner escape-route planning is rendered ineffective, disaster-relief algorithms requiring reduced response times and enhanced rescue efficiency must be developed, and rescue-team deployment strategies must be formulated to ensure safe evacuation and the protection of personnel.
Strategies for mine-personnel disaster avoidance and evacuation have been primarily concentrated on algorithmic research and the optimisation of emergency-rescue systems. Algorithmic studies have chiefly involved the refinement of graph-theoretic algorithms, intelligent-optimisation algorithms and heuristic-search algorithms, and the construction of methods for calculating tunnel equivalent lengths and for shortest-path searches tailored to mine topologies, ultimately enabling personnel disaster-avoidance and evacuation.
A dynamic-programming model for optimal mine emergency-rescue routing based on a Dijkstra-ACO hybrid algorithm was proposed by Lu Guoju and Shi Wenfang [
1], in which the Dijkstra algorithm was utilised to identify an initial optimal path and subsequently optimised by the ACO algorithm to determine the final optimal route. A multiobjective real-time search method founded on dynamic programming was introduced by Lin Bi, Yulong Liu et al. [
2], employing Pareto-optimal solution sets to rank identified evacuation paths and thus realise an evacuation model for complex mine networks that satisfies practical escape-route planning requirements. An interactive “human–environment–computer” system was constructed by Wei Li, Yongming Wang et al. [
3] through the integration of the A*-3D Time algorithm with mixed-reality (MR) technology; mine spatial geometry and escape-time data were adopted, and Comsol was employed to simulate mine water-inrush scenarios, thereby implementing an assisted-escape system for miners. An evacuation-route planning method based on an improved A* algorithm was put forward by Yulun Zhu, Gui Zhang et al. [
4], in which FAHP-CRITIC combined weighting analysis was applied to assess evacuation factors, five fire-ground zones were delineated, and dynamic fire-spread trends were incorporated to support personnel disaster-avoidance. A multiscenario, cross-scale smoke-control strategy for mine fires was advanced by Haiqing Hao, Shuguang Jiang et al. [
5], on the basis of which an optimal-escape-route planning method was devised to provide guidance for mine-fire prevention, smoke extraction, and emergency rescue. A numerical-simulation-based evacuation-route planning method under a full-scale mine-fire scenario was designed by Menghui Xiao, Cuifeng Du et al. [
6], predicated on smoke-diffusion characteristics and fire-induced pressure variations; it was demonstrated that CO concentration diminishes at tunnel corners and that both CO concentration and temperature decrease with depth, indicating that miners should evacuate along curved structures. A research framework combining mine-fire simulation with the Ford-Fulkerson algorithm was presented by Simo Lotero, Vasilis Androulakis et al. [
7], in which fire-induced hazards were quantified according to MSHA safety standards to enable the planning and evaluation of safe evacuation routes. An underground escape-route planning system based on the MSPFA was developed by Zhenguo Yan, Zhixin Qin et al. [
8], utilising DXF technology to visualise evacuation paths and to facilitate dynamic adjustment of routes and optimisation of emergency-avoidance strategies during a fire. An improved Dijkstra algorithm, combined with simulation-model techniques for the analysis of personnel disaster-avoidance strategies under mine-disaster conditions and for one-time determination of the optimal path, was proposed by Guoju Lu, Guofei Zhao et al. [
9]. A TRTV obstacle-avoidance planning method was applied by Xin Zhang, Chunyu Yang et al. [
10], and, through the design of the RGPSO algorithm, an improved obstacle-avoidance planning algorithm was advanced; four representative map benchmarks were employed to demonstrate TRTV’s capacity for narrow-passage navigation and dead-zone avoidance in complex environments. Finally, an underground-mine vehicle path-planning method based on an improved A* algorithm and a fuzzy-control dynamic window was proposed by Chuanwei Zhang, Xinyue Yang et al. [
11], and its effectiveness and feasibility were experimentally validated in order to meet the requirements of underground-vehicle route planning. In the field of deep learning and multi-agent collaborative rescue strategies, an improved multi-agent reinforcement learning method was proposed by Qingqing Wang, Hong Liu and others [
12]. By integrating it with an improved social force model, the problem of mutual influence among agents in crowd simulation was effectively addressed, and excellent results were obtained in crowd evacuation. A review of multi-robot systems for Search and Rescue (SAR) operations was carried out by Jorge Peña Queralta, Jussi Taipalmaa and others [
13]. This review provided certain new technical ideas for robot collaborative operations under factors such as active perception, shared autonomy, and awareness of the victim’s situation. A multi-agent discrete search and rescue path-planning problem based on mixed-integer linear programming was put forward by Jean Berger and Nassirou Lo [
14]. Network modelling and CPLEX technology were successfully utilised, and the calculation results verified its value and effectiveness.
Optimisation of the emergency-rescue system has been primarily achieved through the application of evaluation methodologies and simulation-software analyses, and by the development of corresponding mathematical evaluation models to facilitate the allocation of mine emergency-rescue resources and the feasibility analysis of existing disaster-relief strategies, thereby refining current personnel-rescue procedures. A mine-fire emergency-rescue resource-allocation model was designed using Ventsim software by Nie Rongshan and Wang Zhen [
15], in which factors influencing the allocation process were analysed, the relationship between resource-allocation volumes and underground resource availability was examined, and the linkage between mine incidents and command decisions was established. An emergency–rescue–capability evaluation model for mine water-inrush accidents, based on an improved combination-weighting method and an MPA-optimised BPNN algorithm, was proposed by Wei Wang, Xinchao Cui et al. [
16] and applied in a Shanxi coal mine in China, thereby achieving accurate and effective evaluation of water-inrush rescue capabilities. Feedback on the usefulness of 21 proposed evacuation–intervention measures was collected by Eugene A. Gyawu, Danise A. Baker et al. [
17], and the relationships between these measures and specific miner demographic parameters were assessed; the results indicated that SCSRs and RAs were the most beneficial interventions, and self-evacuation measures were improved via human–system integration. Multiple data-collection methods were employed by Moshood Onifade [
18] to gather information on safety practices, mine rescue and safety management, and subsequent analyses demonstrated that self-rescue preparedness is among the most critical factors for an organised and timely response to mine emergencies. A digital-twin system for on-site mine-rescue environments was introduced by Hu Wen, Shengkai Liu et al. [
19], in which the overall architecture, functional features and essential system–construction technologies were presented; the system was then applied to emergency rescue in a mine, resulting in enhanced rescue success rates. An assessment model based on grey system theory and a grey evaluation model was developed by Kejiang Lei, Dandan Qiu et al. [
20] and deployed at the Lugou coal mine, culminating in the establishment of a mine-fire emergency-rescue indicator-system risk-assessment framework. Principal risk indicators—namely firefighting equipment, command decision-making, emergency education and training, and fire-alarm systems—were identified, and corresponding control measures were devised across four domains (rescue-organisation support, personnel support, material support and information support), thereby enhancing the fire-emergency rescue capability of the Lugou coal mine.
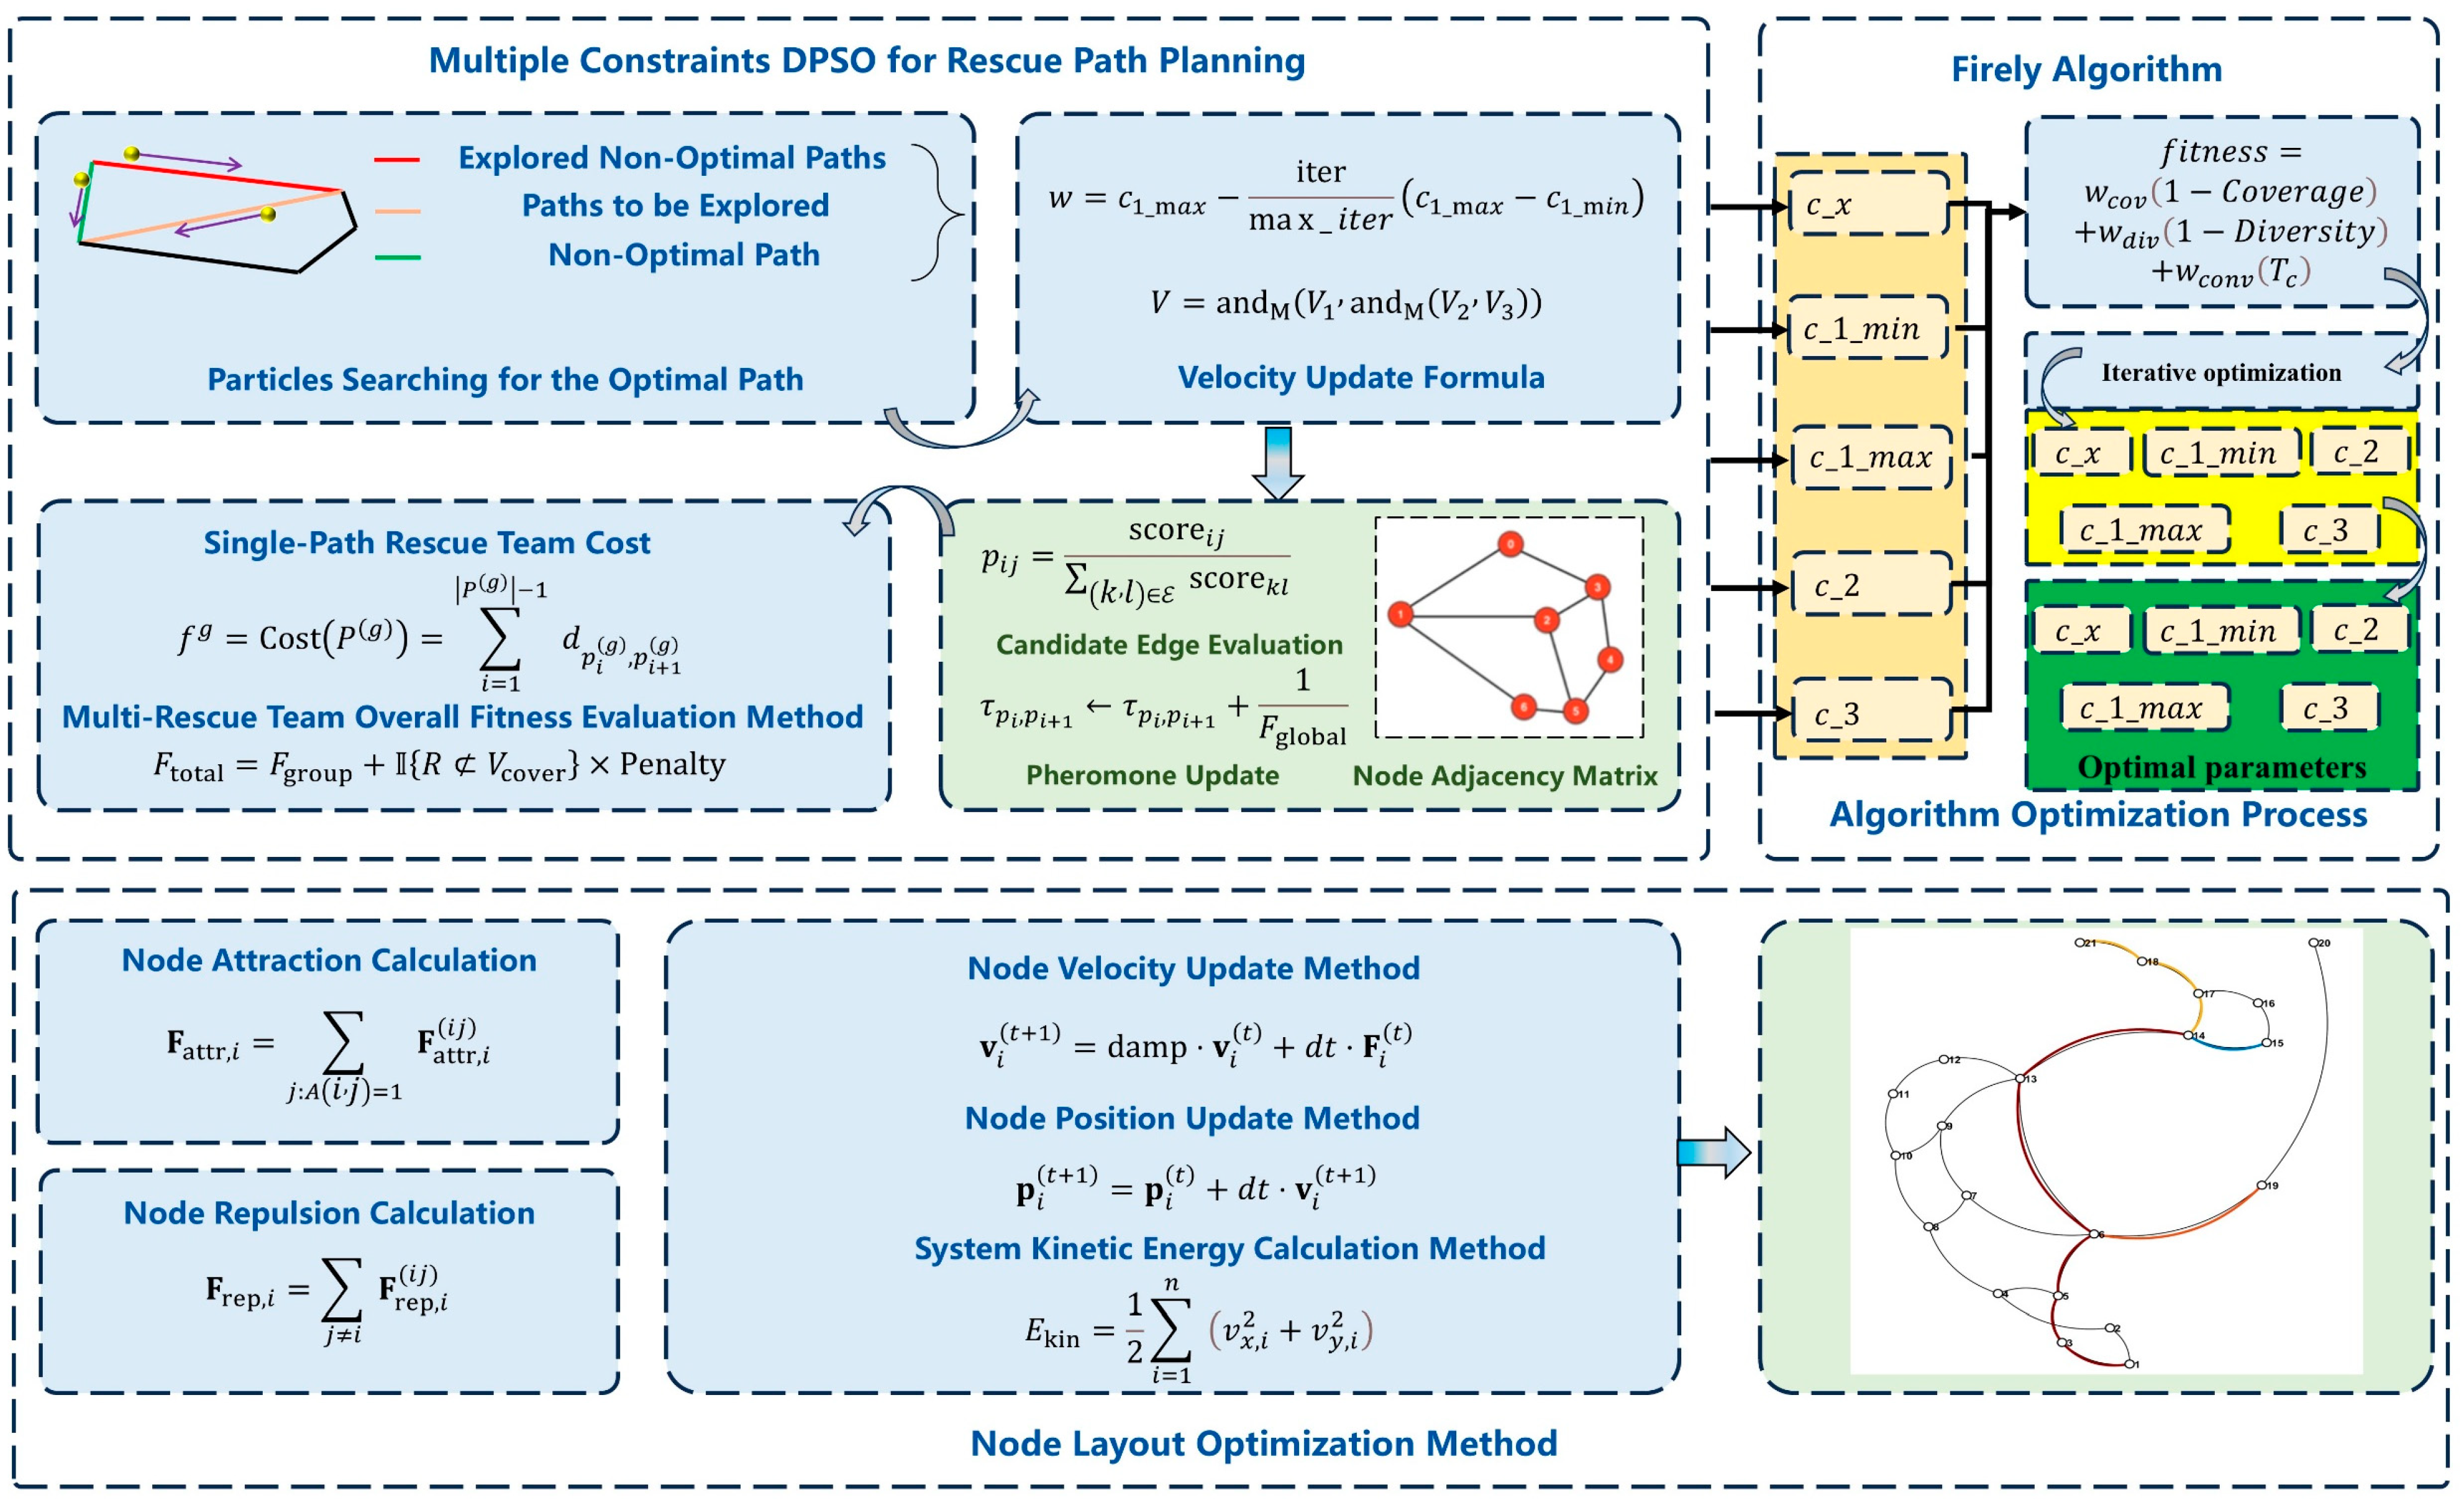
Currently, efforts in mine-personnel disaster-avoidance and relief are mainly concentrated on the planning of underground miners’ evacuation routes. However, research on the coordinated rescue of multiple teams at designated locations is relatively limited. Moreover, existing mine emergency-rescue algorithms have neglected the requirement for multi-route sharing at critical nodes, and the network visualisation they provide is limited. Consequently, a study has been undertaken to address the selection of rescue-team size and the efficient deployment of multiple teams to rescue numerous entrapped individuals underground, and an FA-MDPSO (Firefly Algorithm-Multiple Constraints Discrete Particle Swarm Optimisation) algorithm has been proposed for rapid multi-team rescue operations. In order to enhance the balance between fitness computation, node-search coverage, population diversity and weighted convergence time within the MDPSO (Multiple Constraints Discrete Particle Swarm Optimisation) framework, a fitness function that comprehensively incorporates these criteria has been designed and subsequently optimised via the FA (Firefly Algorithm) to improve MDPSO efficacy. To further refine rescue protocols, a node-importance analysis method has been introduced to facilitate the optimisation of mine emergency-rescue strategies. Moreover, to accommodate the constraints of mine-site environments, a graph-structure optimisation approach combining a force-directed layout with breadth-first search has been proposed to assist in on-site emergency-rescue command and control. Ultimately, the proposed methods are intended to provide technical support for the realisation of intelligent mine emergency-rescue operations.
3. Results
In order to more effectively verify the effectiveness of the model, performance tests were conducted on large-scale networks as a supplement to verify the scalability of the algorithm in complex scenarios. In this section, multiple datasets from the DIMACS graph-theoretic benchmark suite, namely Dsjc250.5, Dsjc500.1, flat300_28_0, r250.5, and r1000.5 were selected for model performance evaluation. Among them, Dsjc250.5, Dsjc500.1, flat300_28_0, r250.5, and r1000.5 have 250, 500, 300, 250, and 1000 nodes, respectively. Finally, a simplified mine model derived from an actual Shaanxi mine was employed as test data to validate the optimality of both the node-layout optimisation and the multi-team rescue-route planning results.
3.1. Analysis of the Improved DPSO Algorithm’s Path-Planning Capability
To abstract the mine galleries, the prevailing approach of converting mine-excavation engineering plans into ventilation-system diagrams was adopted, thereby yielding a mine-ventilation network graph that maps the physical tunnels onto a network topology. Given that the number of internal tunnel nodes does not exceed 1000, the DIMACS instances Dsjc250.5, Dsjc500.1, flat300_28_0, r250.5, and le450_25c were assembled to formulate shortest-path problems spanning from the smallest to the largest numbered nodes. Path planning was then performed under both persistent-pheromone and reset-pheromone conditions, with analyses conducted to assess the impact of varying edge-weight perturbation and particle counts on planning performance. Optimal model parameters were subsequently chosen to enhance the accuracy of multi-team rescue-route planning within the mine.
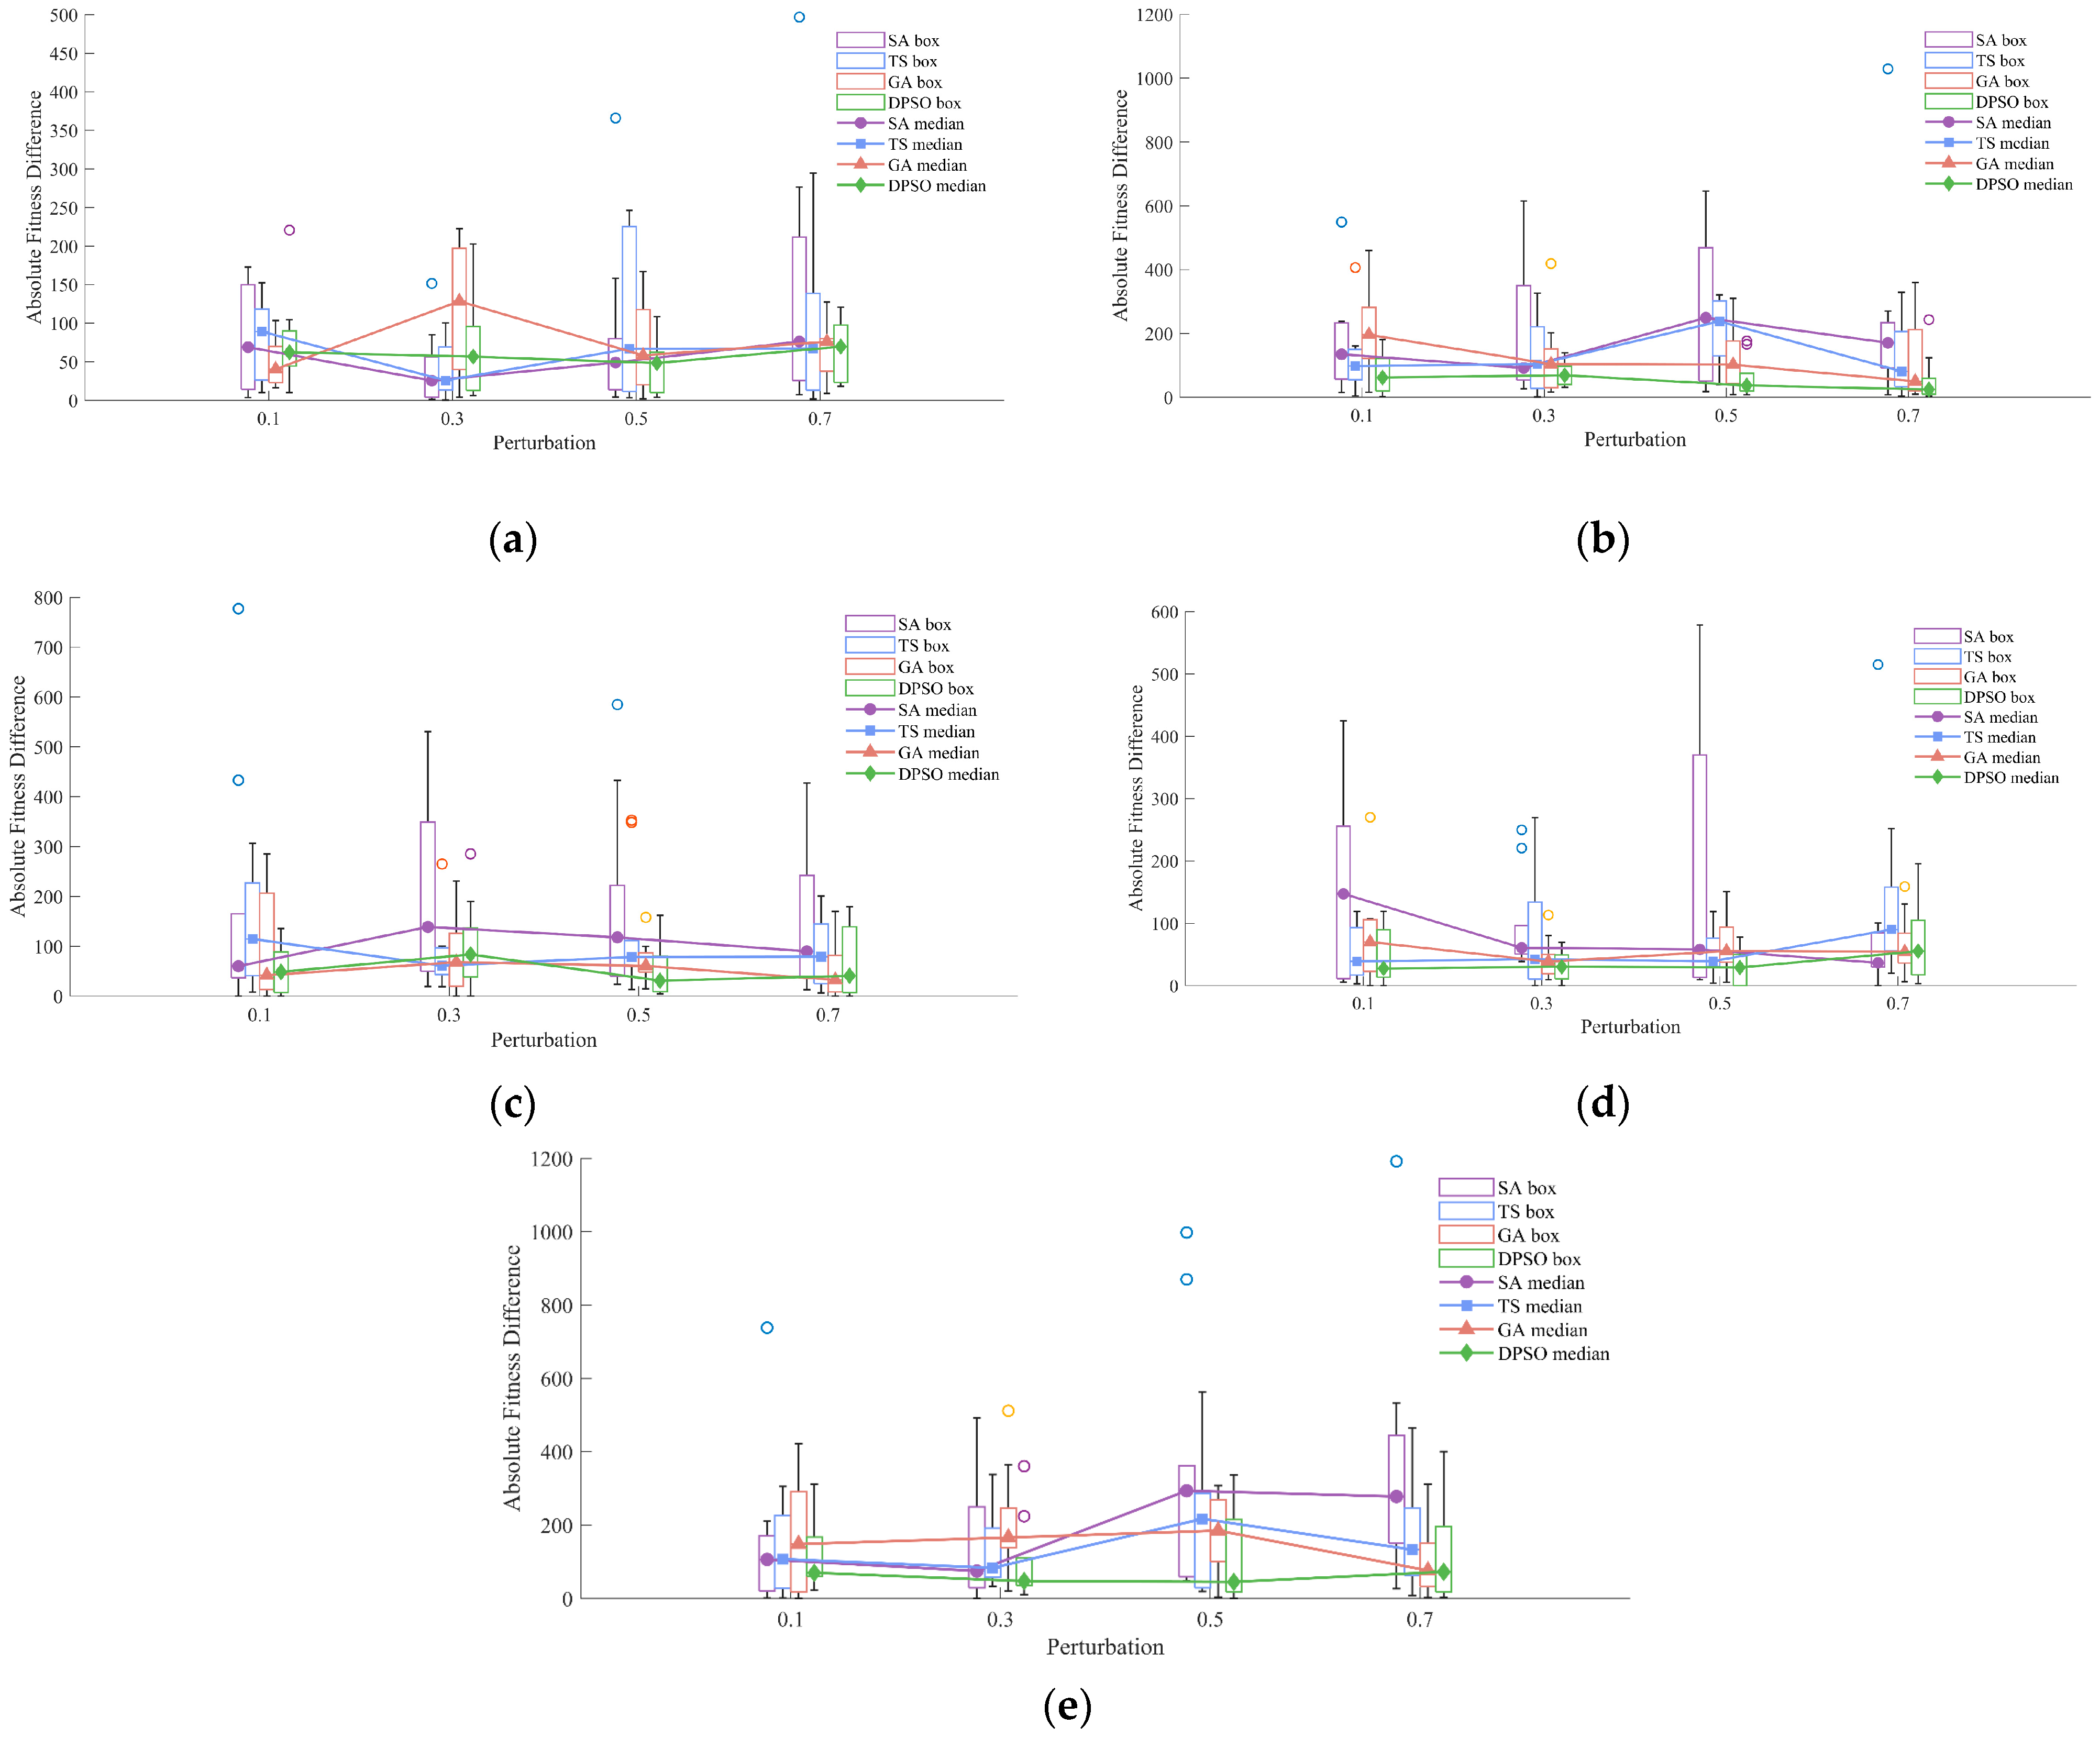
Four algorithms—the improved DPSO, GA (Genetic Algorithm), TS (Tabu Search) and SA (Simulated Annealing)—were compared across the five case studies (Dsjc250.5, Dsjc500.1, flat300_28_0, r250.5 and le450_25c). Each case was subjected to ten perturbation events, with edge-weight disturbances set at 10%, 30%, 50%, and 70%. Performance under persistent- and reset-pheromone scenarios was contrasted by means of absolute error, and the resulting error distributions were visualised via boxplots and heatmaps [
25,
26,
27,
28].
In
Figure 2, SA results are depicted in purple, TS in blue, GA in orange and DPSO in green. Across all disturbance levels (0.1, 0.3, 0.5, and 0.7), the median marker for DPSO (solid green) remains consistently lower than those of SA, TS, and GA, indicating that DPSO typically yields solutions with smaller deviations. The DPSO box (green outline) exhibits the smallest IQR (interquartile range) and shortest whiskers, demonstrating minimal fitness variability and strong robustness. Furthermore, DPSO produces the fewest outliers (circles beyond the whiskers) at each disturbance level, signifying a reduced sensitivity to edge-weight fluctuations and resilience against single, large-scale perturbations.
In the heatmap presented in
Figure 3, colour intensity (dark blue → yellow) corresponds to median magnitude. The DPSO row is predominantly dark blue (lowest range), whereas GA, SA, and TS display lighter blues and occasional yellow cells (higher ranges). Across all four disturbance-level columns, DPSO’s cells remain at similarly low colour grades, evidencing that its performance degrades only marginally with increasing perturbation strength.
It is reasoned that, in dynamic scenarios, DPSO maintains and continually reinforces pheromone information along the global best path, enabling rapid recovery to near-optimal regions following each disturbance. By combining the global search capability of particle swarms with local refinement mechanisms, DPSO circumvents entrapment in local optima while preserving convergence speed. In contrast to GA’s recombination/mutation, TS’s tabu-neighbourhood strategy and SA’s stochastic jumps, DPSO’s velocity-and-position update scheme is shown to sustain superior stability and faster adaptive response under dynamic conditions.
3.2. Node-Layout Optimisation
In order to perform effective node-layout optimisation, a Force-Directed + BFS graph-structure optimisation theory was applied. A method for transforming the original mine-network diagram into an elliptical-layout network was developed, thereby rendering the mine diagram more visually appealing and conducive to command-and-control decisions during rescue operations. Furthermore, this transformation methodology may provide algorithmic support for the layout optimisation of large-scale network-diagram datasets.
To conduct a more effective analysis, a simplified model of a real mine system was selected, based on the fire escape routes in mine planning, so that the path-finding process inside the mine roadway can be presented more clearly and meticulously. For the verification of large-scale roadways, the roadway topological structure of DIMACS was analysed.
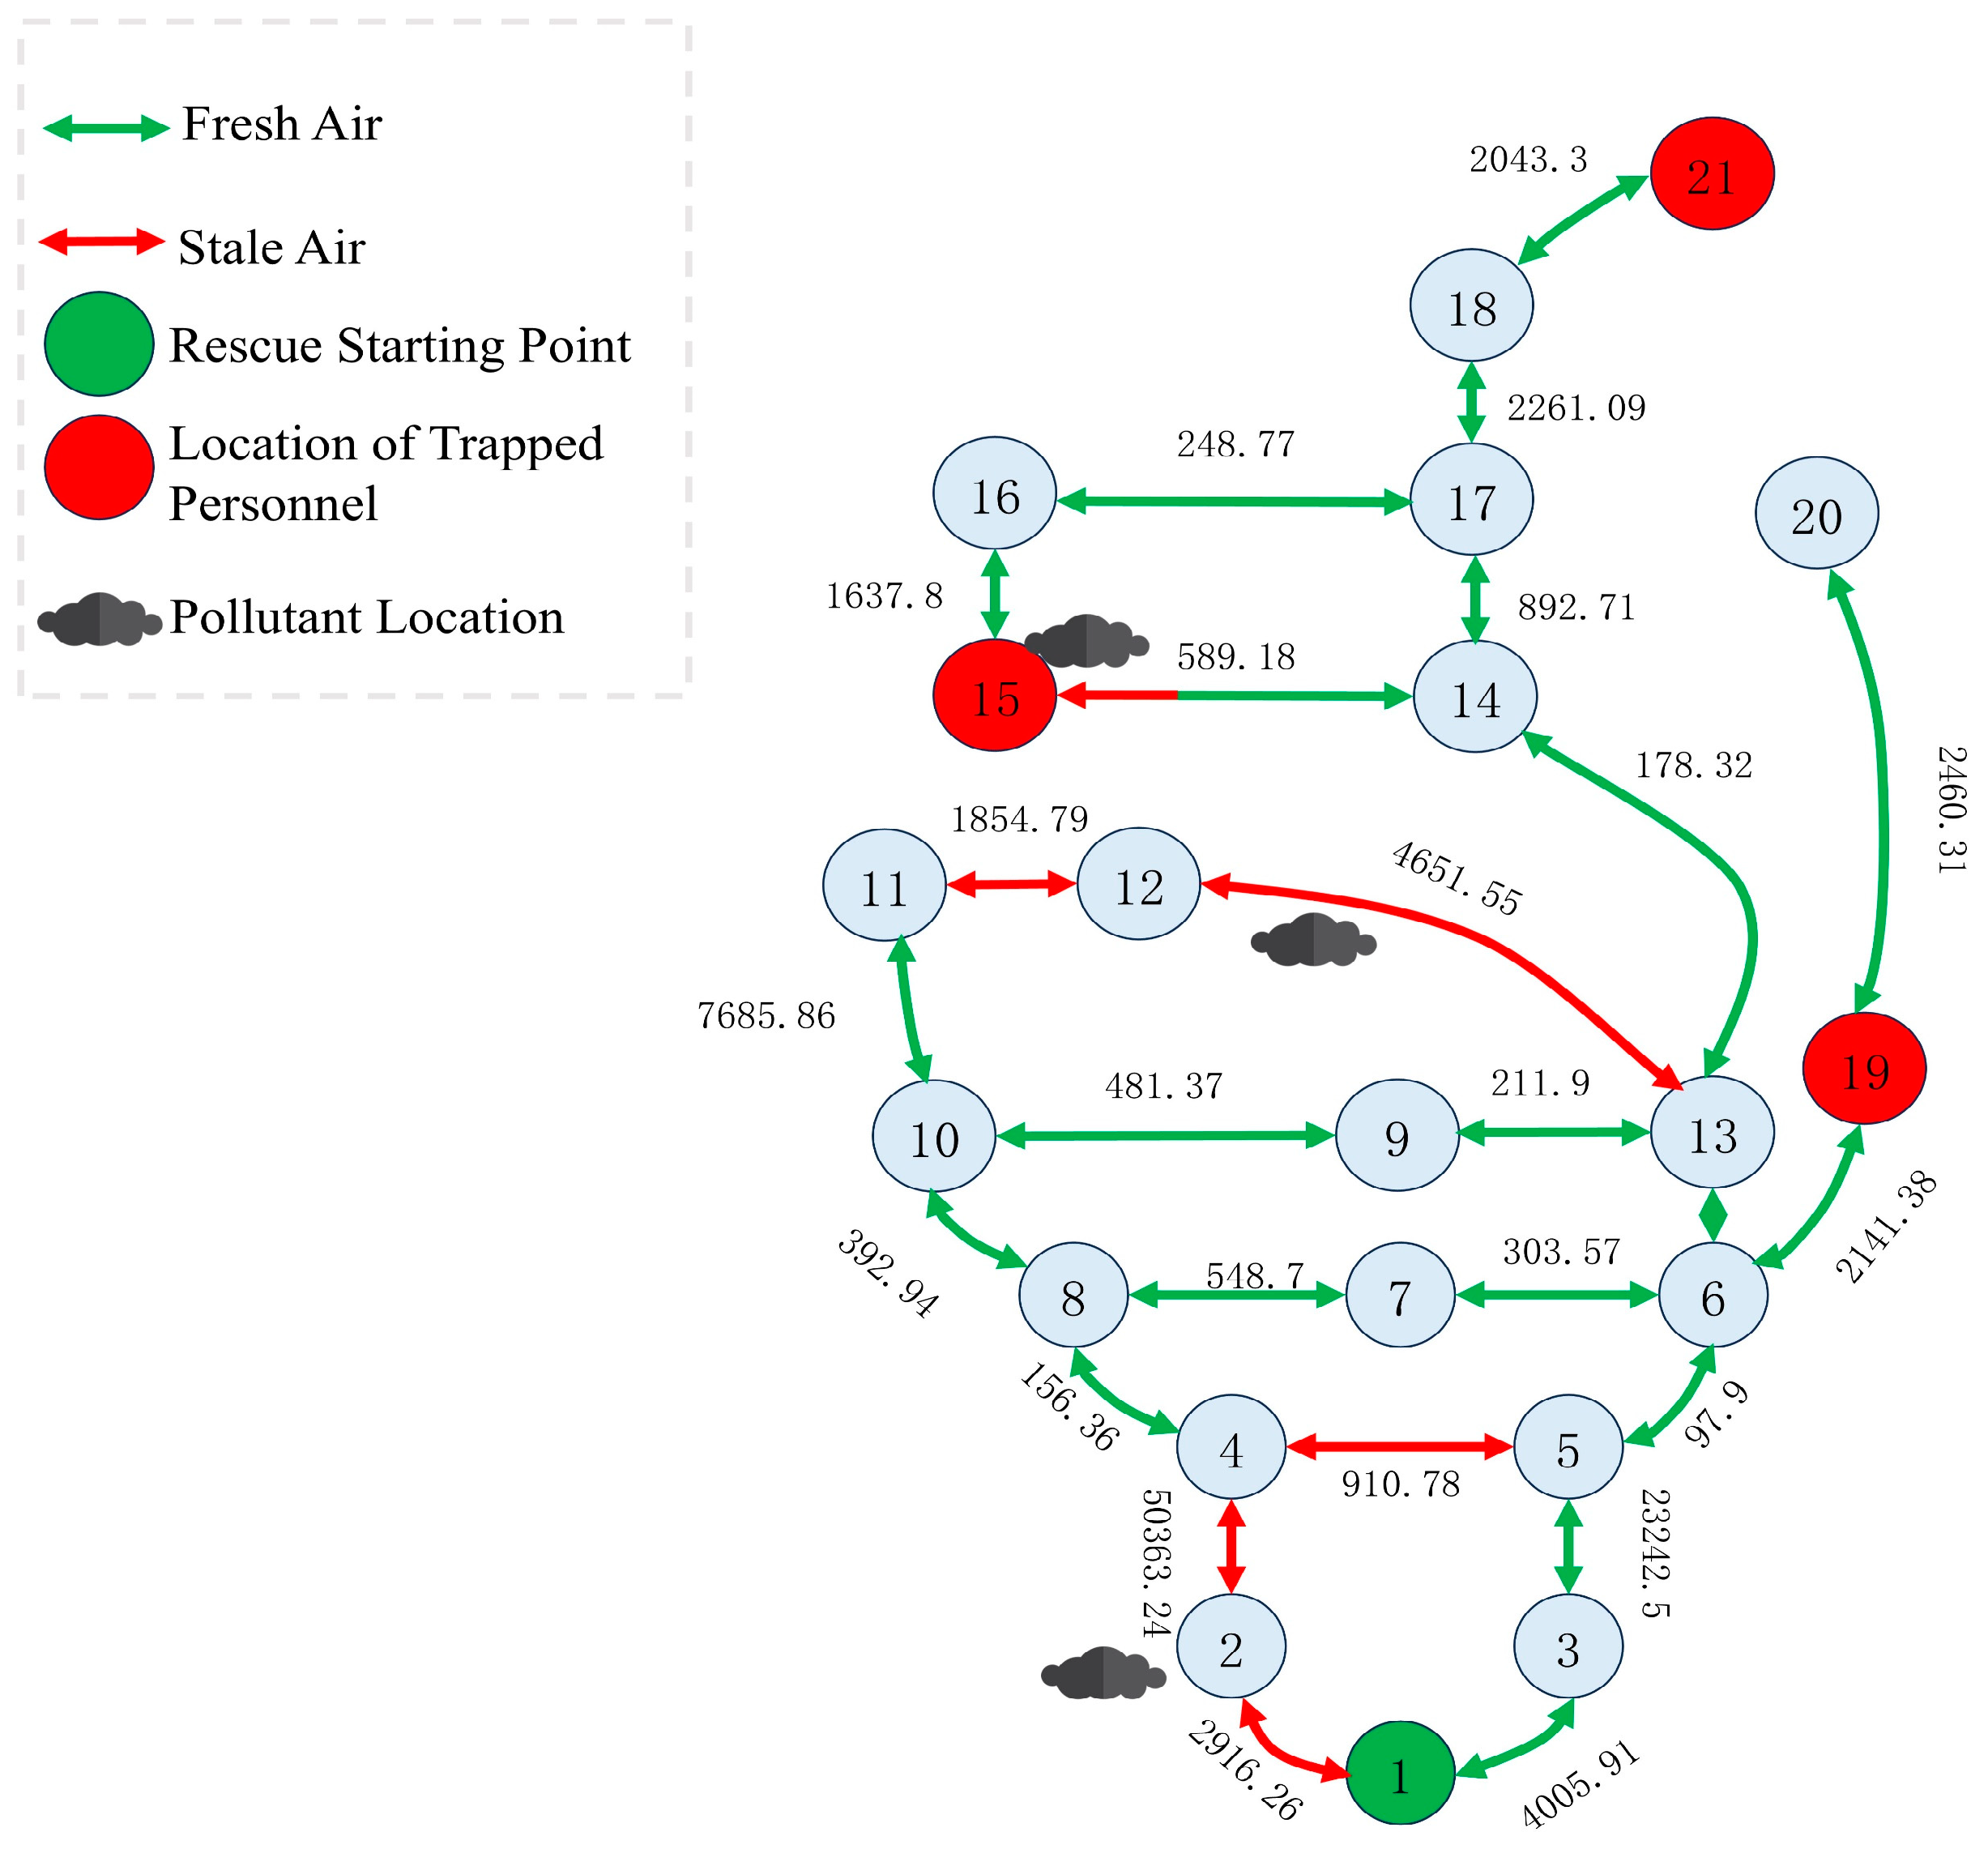
Figure 4 shows the composite topology of airflow and rescue routes within the coal mine tunnel network, which is presented under the state of fire–smoke propagation. All nodes are depicted as grey circles; the rescue-start node is highlighted by a green circle (node 1), and the locations of trapped personnel are indicated by red circles (nodes 15, 19 and 21). Arrow directions denote airflow: green arrows signify fresh air being pumped in from the entrance towards each node, whereas red arrows indicate the backflow of contaminated air along the routes. The numerical labels on each edge correspond to the equivalent length of that tunnel segment. The network is laid out from top to bottom and left to right in accordance with the hierarchical order of the rescue path, making the fresh-air channels from the start node to each trapped node immediately apparent. Along the main trunk path (1→3→5→6→13→14→17→18→21), contiguous green arrows ensure adequate fresh-air supply; on the branches (e.g., 6→19 and 13→12→11→10→8→4→2→…), red arrows reveal the routes of contaminated-air recirculation [
29]. The locations of the pollutant location are situated in the middle of node 2, node 12 and node 13, as well as at the location of node 15. Therefore, the airflow in this area is considered to be stale air.
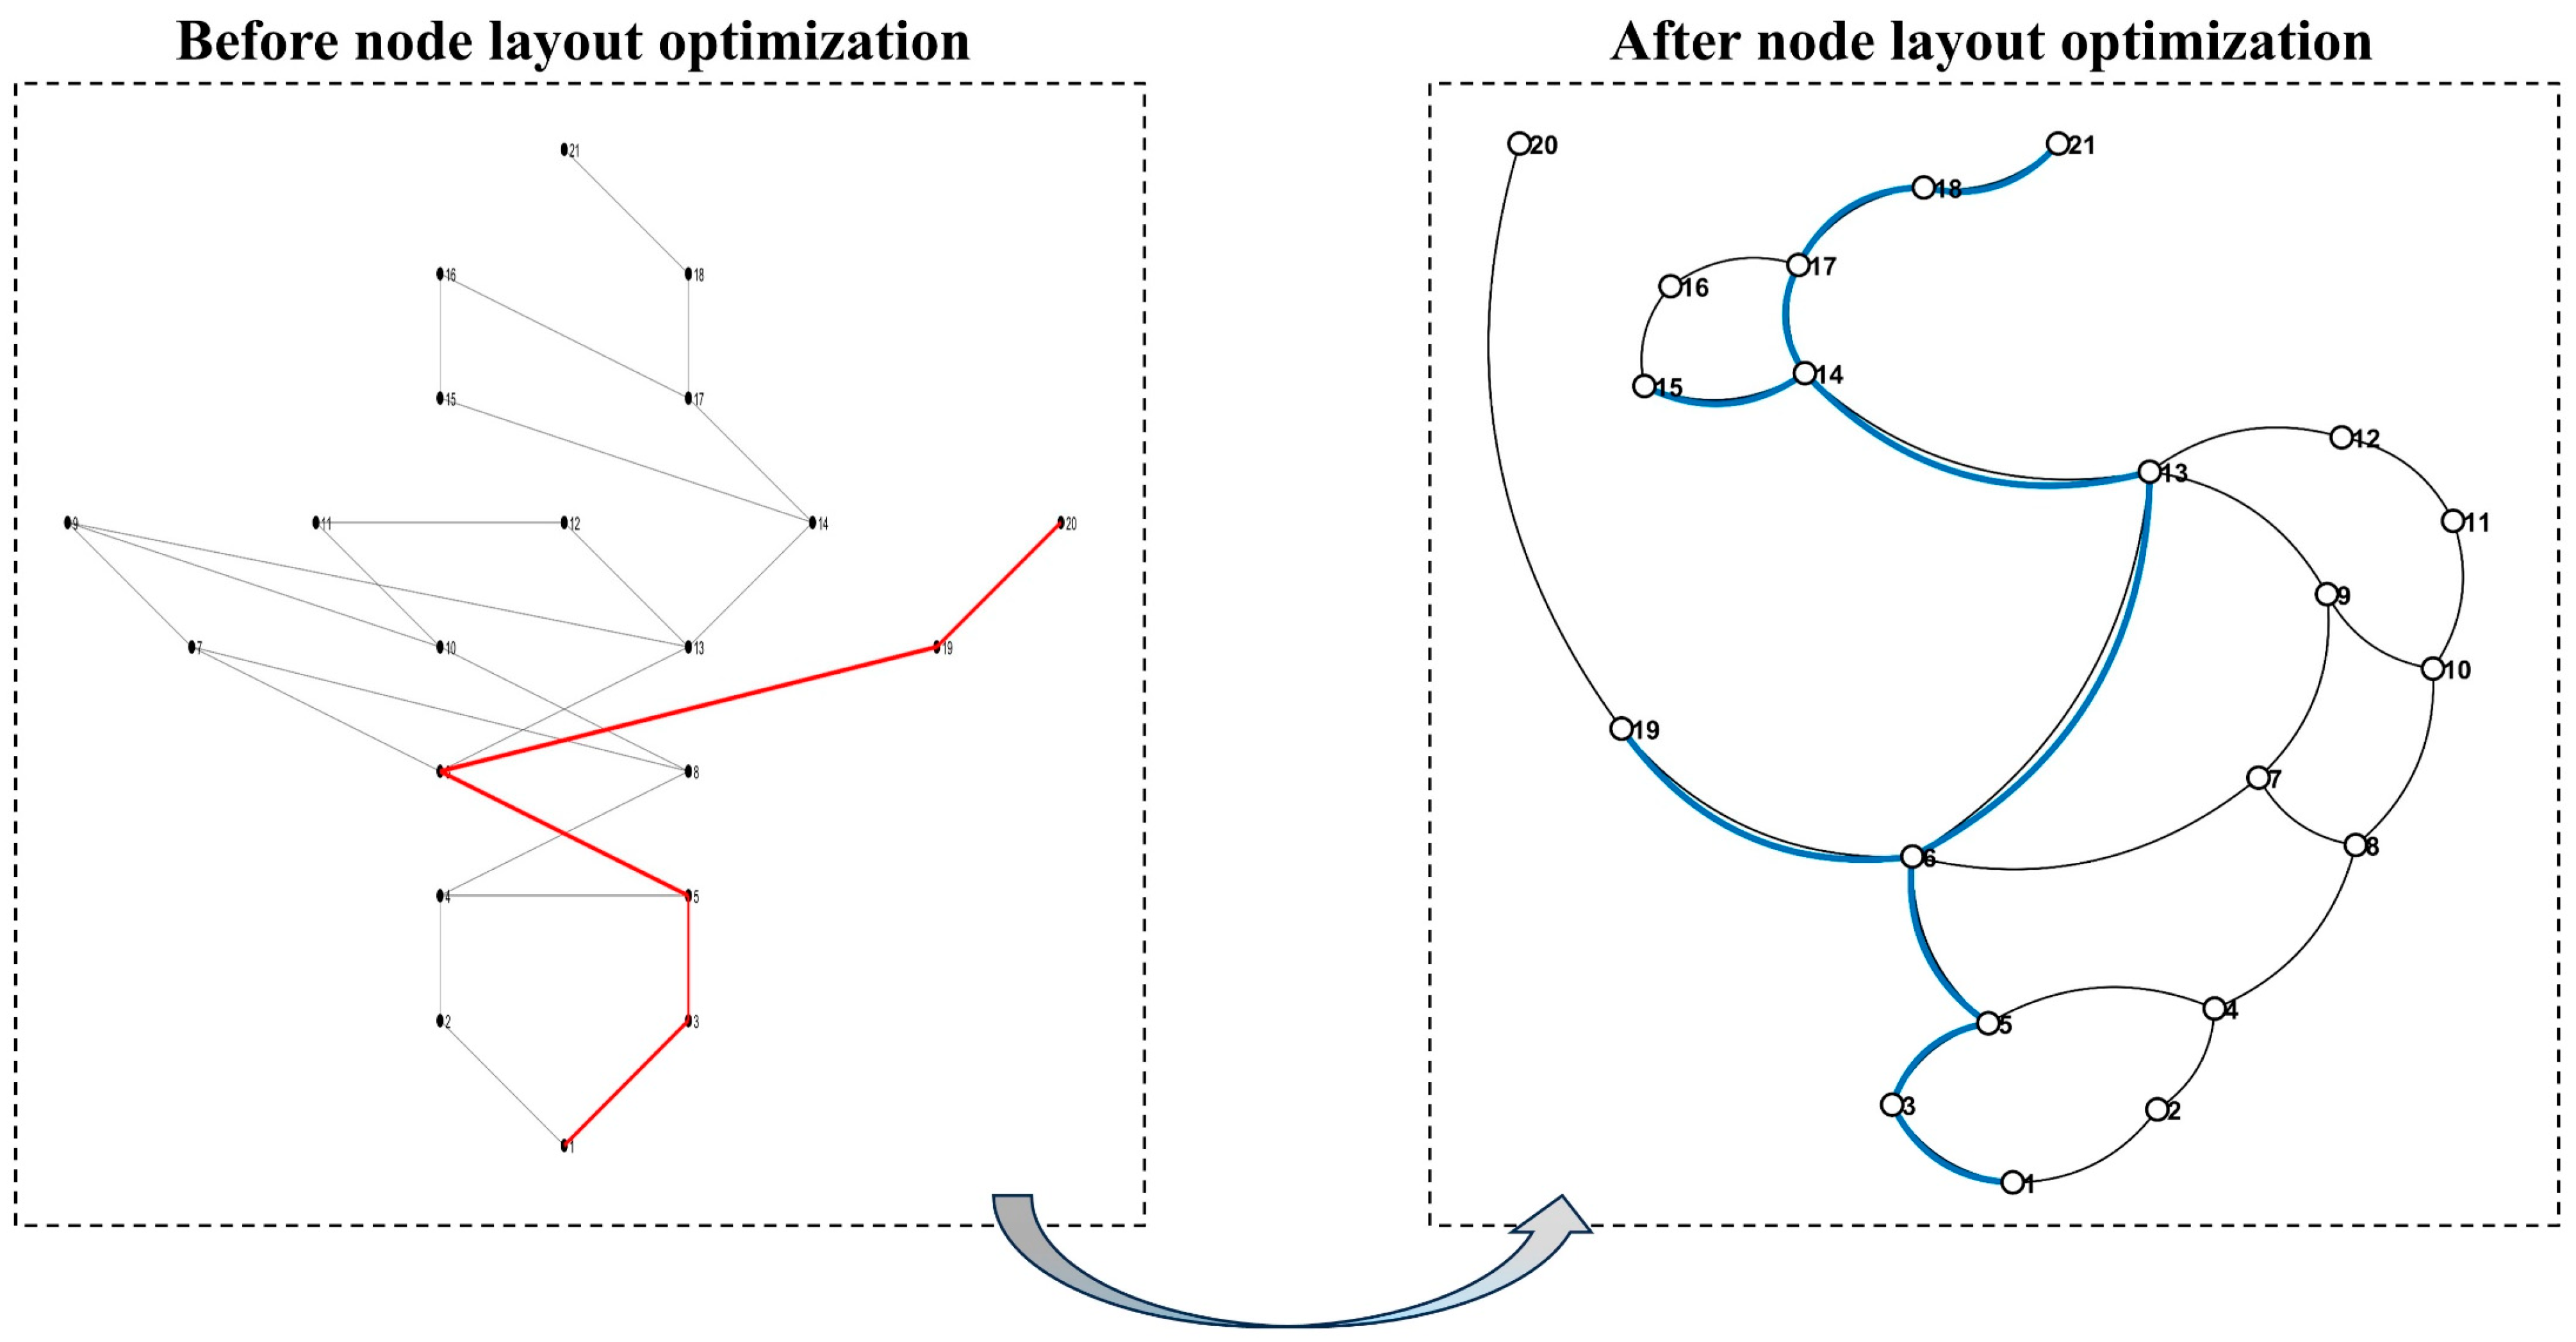
In the node-layout optimisation process, the efficacy of the force-directed layout was demonstrated by comparison with a conventional top-down layered layout. The parameters used for the force-directed optimisation are listed in the accompanying table. In the left panel of
Figure 5, the top-down layered layout exhibits numerous node crossings, which are generally avoided to improve graphical clarity. In contrast, the right panel shows the force-directed, ellipse-style arrangement: nodes 20 and 21 are positioned accurately at the top of the diagram, node 1 at the bottom, and all nodes follow an elliptical distribution. The rescue route is drawn in red in the left panel and in blue in the right panel. Overall, the force-directed layout yields a visually appealing and unambiguous node arrangement, thereby supporting effective on-site rescue command.
In
Table 1, the parameters
,
and
are defined as follows:
is taken as the semi-major axis length of the ellipse used for layout;
is taken as the semi-minor axis length; and
denotes the scaling exponent applied during the secondary positional adjustment within the ellipse. The force-directed algorithm parameters comprise k_rep, k_attr, damp, dt, and k_rep. The constant k_rep governs the magnitude of the repulsive force between any two nodes, while k_attr governs the magnitude of the attractive force for each actual edge in the graph. The damping coefficient damp is applied to node-velocity updates to simulate frictional or resistive forces and to inhibit excessive oscillations. The time step dt is employed for the integration of velocity and position updates. The maximum iteration count, maxIter, specifies the maximum number of adjustment cycles permitted, and the minimum kinetic-energy threshold, minEnergy, provides an early-termination criterion for the layout process: if
convergence is assumed and iterations cease. Moreover, node 1 was assigned to the lowest BFS layer and nodes 20 and 21 to the highest BFS layer, thereby ensuring that nodes are arranged in accordance with their connectivity and designated importance.
To optimise the node layout position more effectively, the grid search algorithm is employed. Three key parameters, namely k_rep, k_attr, and damp, are utilised to optimise the node layout position. Three parameters, namely the optimal distribution distance, the node deviation value, and the average node deviation value, are adopted as the parameters for node layout optimisation. The optimal distribution distance
, where
represents the area of the ellipse and
is the number of nodes. The node deviation value
, in which
and
are the coordinates of the
th node in the
and
directions, respectively, and
is the optimal distribution distance calculated above [
30]. The average node deviation value
, where
is the deviation value between all adjacent nodes, and then it is divided by the number of nodes minus 1. During the grid search process, after calculating the average node deviation value
for each set of parameters (k_rep, k_attr, damp), it is compared with the currently recorded minimum node deviation value
. If the current
is less than
,
is updated, and the corresponding parameters k_rep, k_attr and damp are recorded. The selection range of the parameter k_rep is [1000, 5000], the selection range of the parameter k_attr is [0.01, 0.1], and the selection range of the parameter damp is [0.8, 0.9]. The final parameter selection results are
,
,
, and the average node deviation value
.
3.3. Comparative Analysis of Optimisation Algorithms
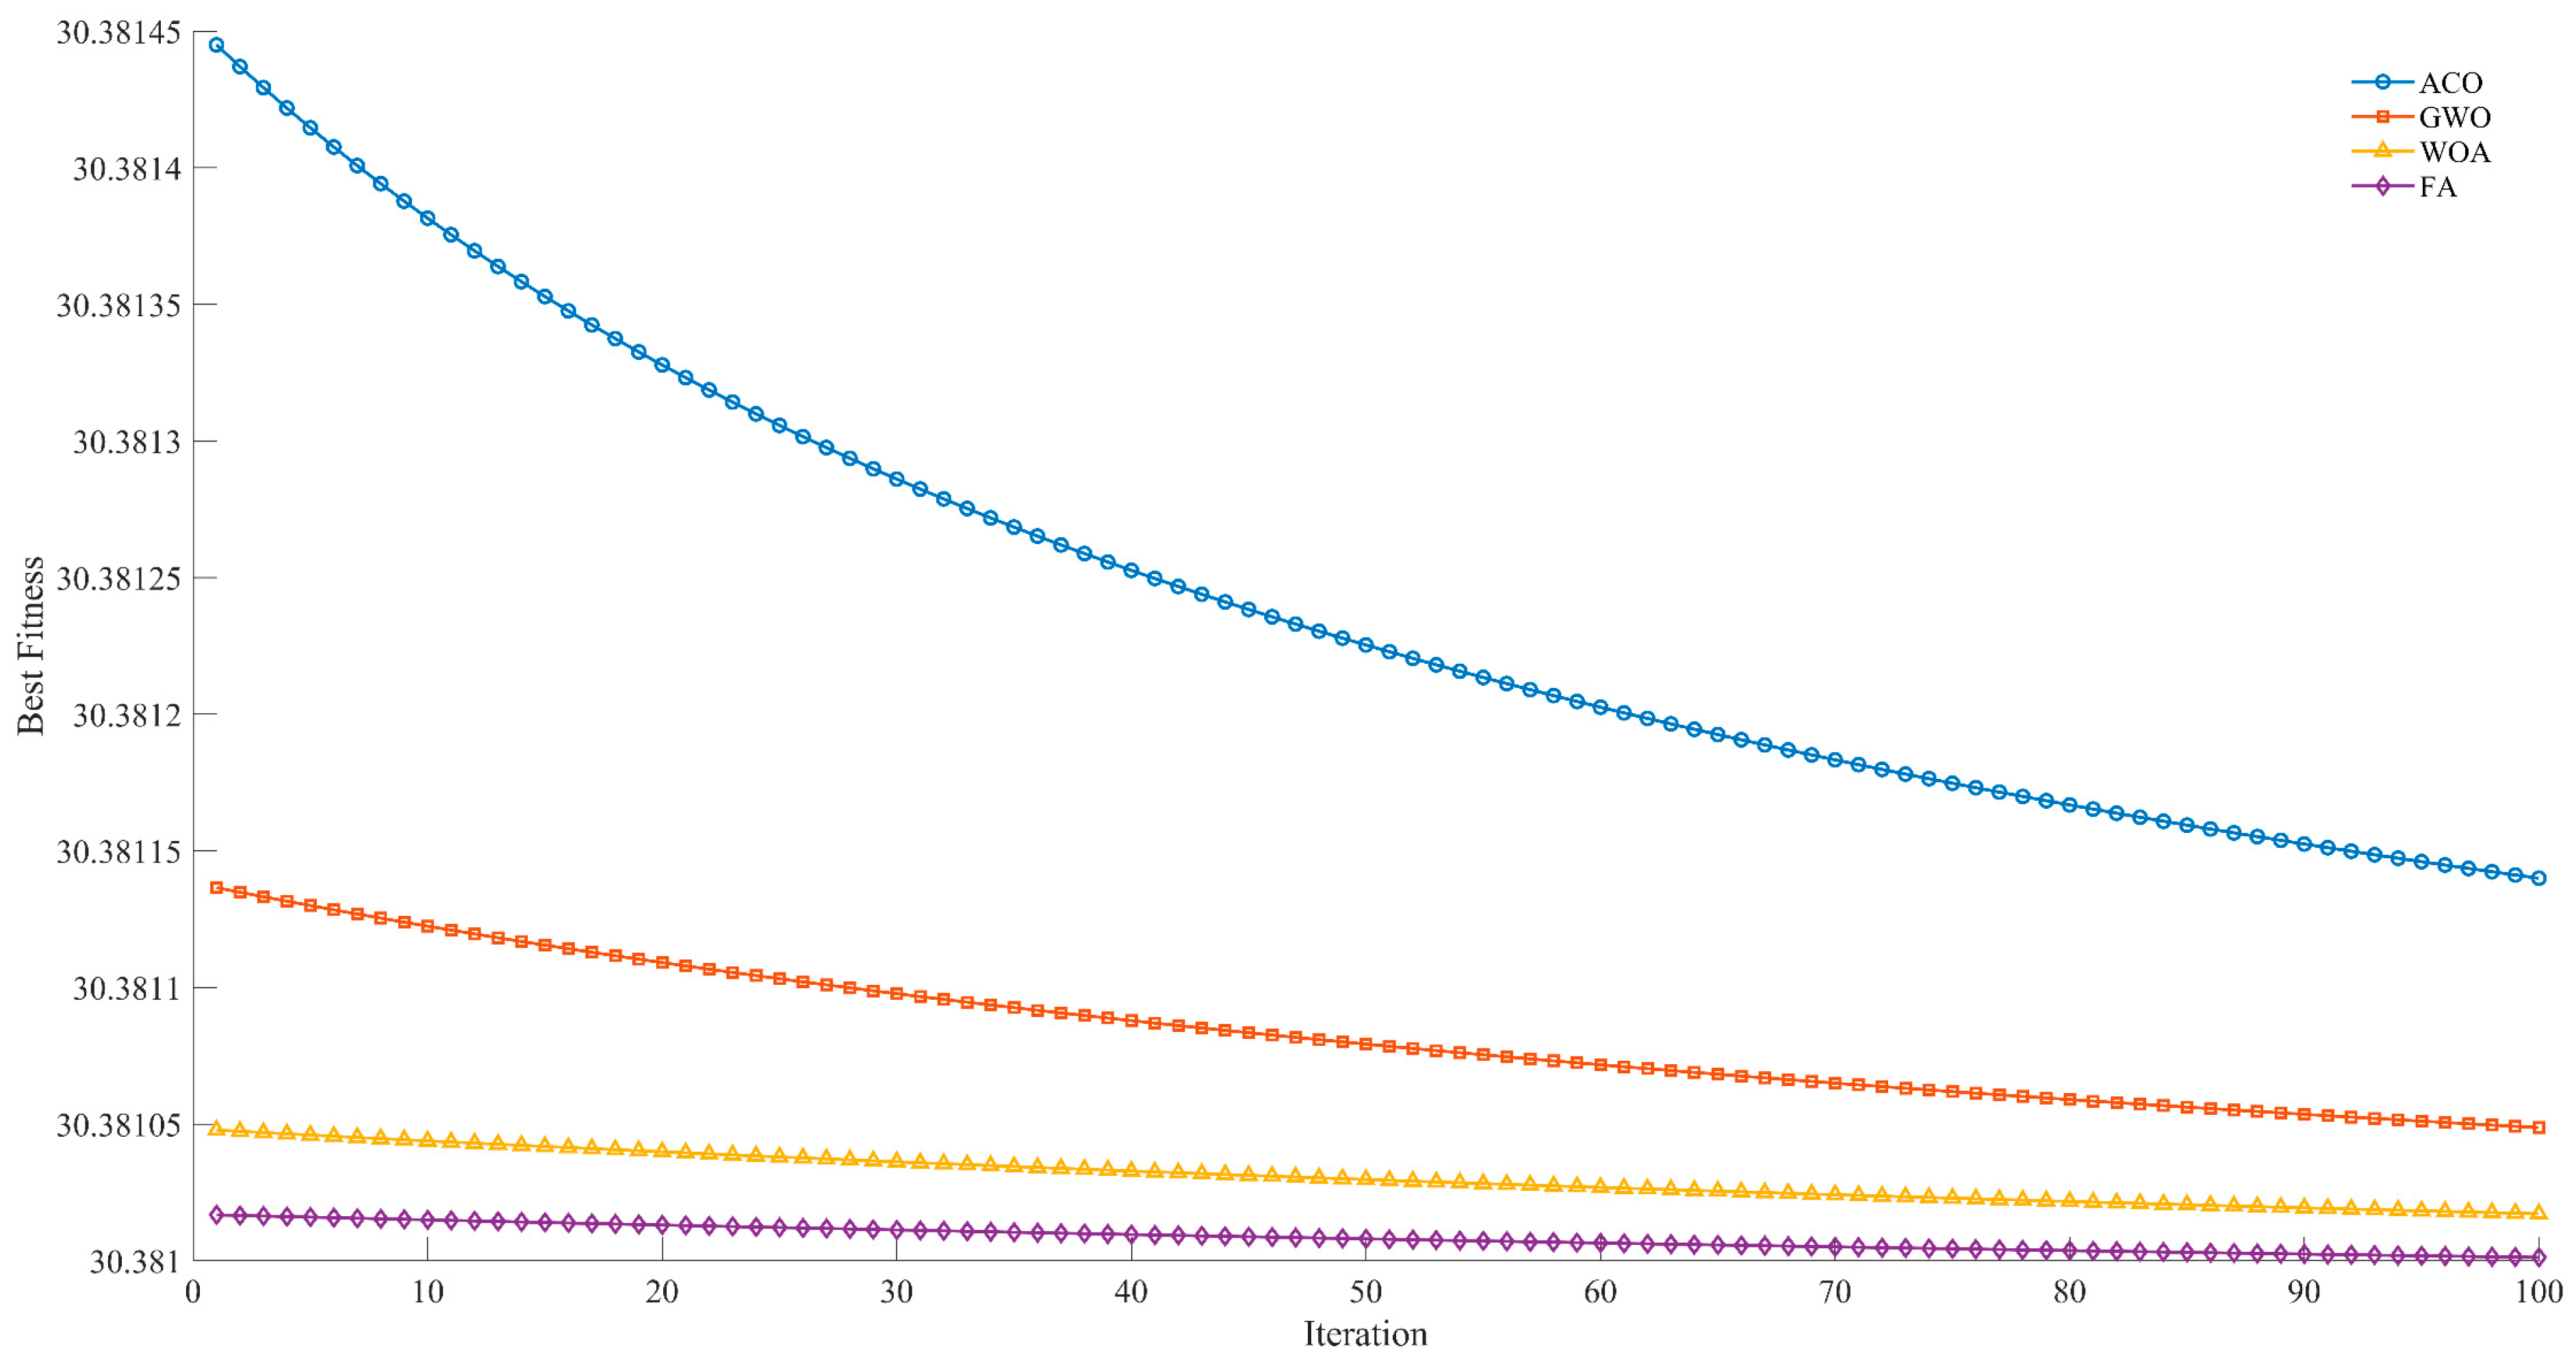
To facilitate a more effective optimisation of algorithmic performance, the fitness function
was employed, and four widely used heuristic optimisers—ACO (Ant Colony Optimization), FA (Firefly Algorithm), GWO (Grey Wolf Optimizer) and WOA (Whale Optimization Algorithm)—were contrasted. The respective parameter configurations are detailed in
Table 2.
In
Table 2, the number of iterations (numIterations) was unified at 100 for all algorithms. For ACO, the number of ants (numAnts) determines the count of solutions constructed in parallel during each iteration, and the greediness threshold q0 controls whether, when a random number is less than or equal to q0, the ant selects the edge with maximum pheromone or otherwise resorts to roulette-wheel selection. In FA, the quantity of fireflies (numFireflies) governs the number of solutions updated; the base attractiveness constant beta0 dictates the strength of inter-firefly attraction; the light-absorption coefficient gamma modulates the decay of attractiveness with distance; and the random-perturbation factor alpha0 preserves population diversity. In GWO, the size of the wolf pack (numWolves) sets the number of solutions updated, and the parameter a_max determines the balance between exploration and exploitation, analogous to a probabilistic selection mechanism. In WOA, the number of whales (numWhales) specifies the solution-set size; a_max controls the step length of the search; and the parameter b defines the spiral-shaped movement characteristic exhibited by whales when encircling prey. In the FA, beta0 is set to 1. An excessively large value of beta0 can lead to the algorithm becoming trapped in a local optimal solution, while an excessively small value of beta0 can cause the convergence to be too slow. Gamma is set to 1; a too large value of gamma will result in a smaller interaction range of fireflies, which is more conducive to local search, whereas a too small value of gamma will lead to an overly large interaction range of fireflies, making it more suitable for global search. Alpha is set to 0.2; an excessively small value of alpha can cause the algorithm to be trapped in a local optimum, and an excessively large value of alpha will make it difficult for the algorithm to converge. Through multiple comparisons, it has been found that such parameter settings can better balance the local optimum and the global optimum [
31].
For effective optimisation, the MDPSO hyperparameters c_x, c_1_min, c_1_max, c_2, c_3 were subjected to tuning using the constructed fitness function. The optimisation outcomes are illustrated in
Figure 6: the ACO algorithm is represented by the blue curve; the GWO algorithm by the orange curve; the WOA algorithm by the yellow curve; and the FA by the purple curve. Among these, the ACO algorithm did not fully converge, whereas GWO and WOA achieved slightly higher fitness values yet still outperformed ACO. The FA was found to be optimal, exhibiting a comparatively low fitness level from the initial iteration.
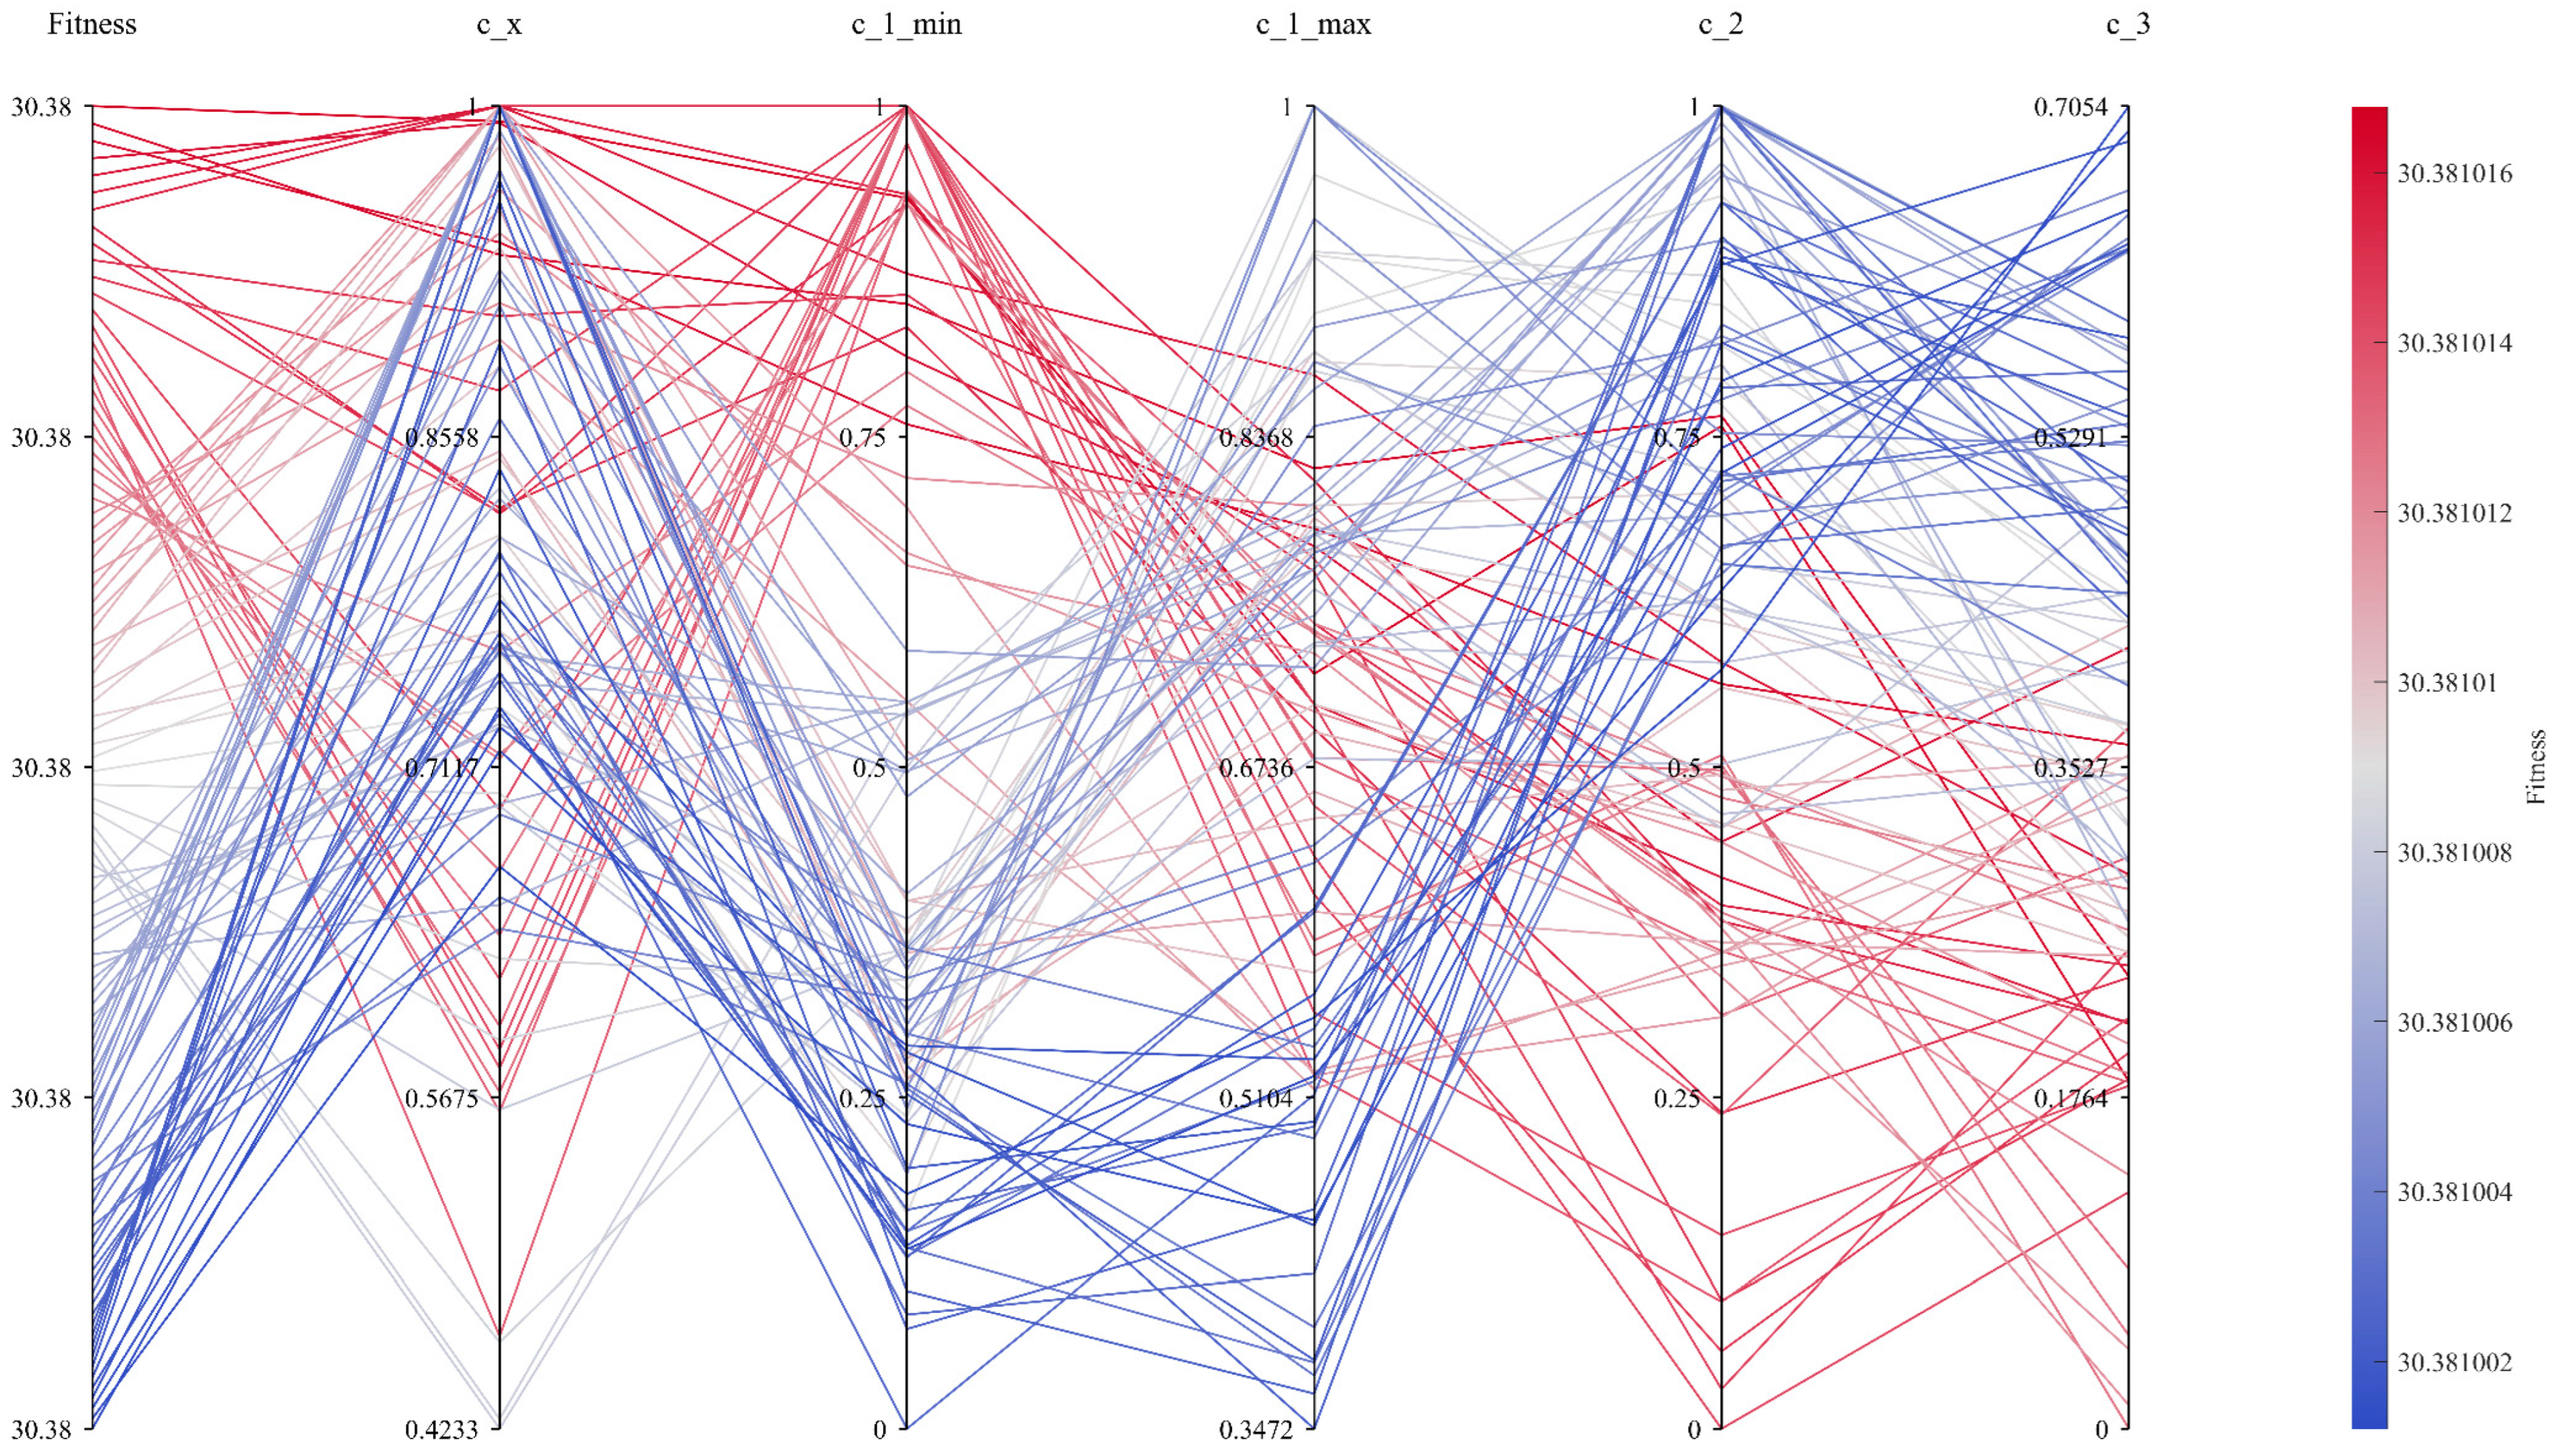
Figure 7 presents a line-heatmap of the FA-driven parameter-optimisation process for MDPSO. The colormap on the right indicates the mapping between fitness values and colours, with red denoting larger fitness values and blue denoting smaller ones. During the FA optimisation, the optimal parameter trajectory is depicted as a deep-blue line. The first axis corresponds to fitness values; the second to c_x; the third to c_1_min; the fourth to c_2; and the fifth to c_3. The optimal parameter set was determined to be:
,
,
,
,
.
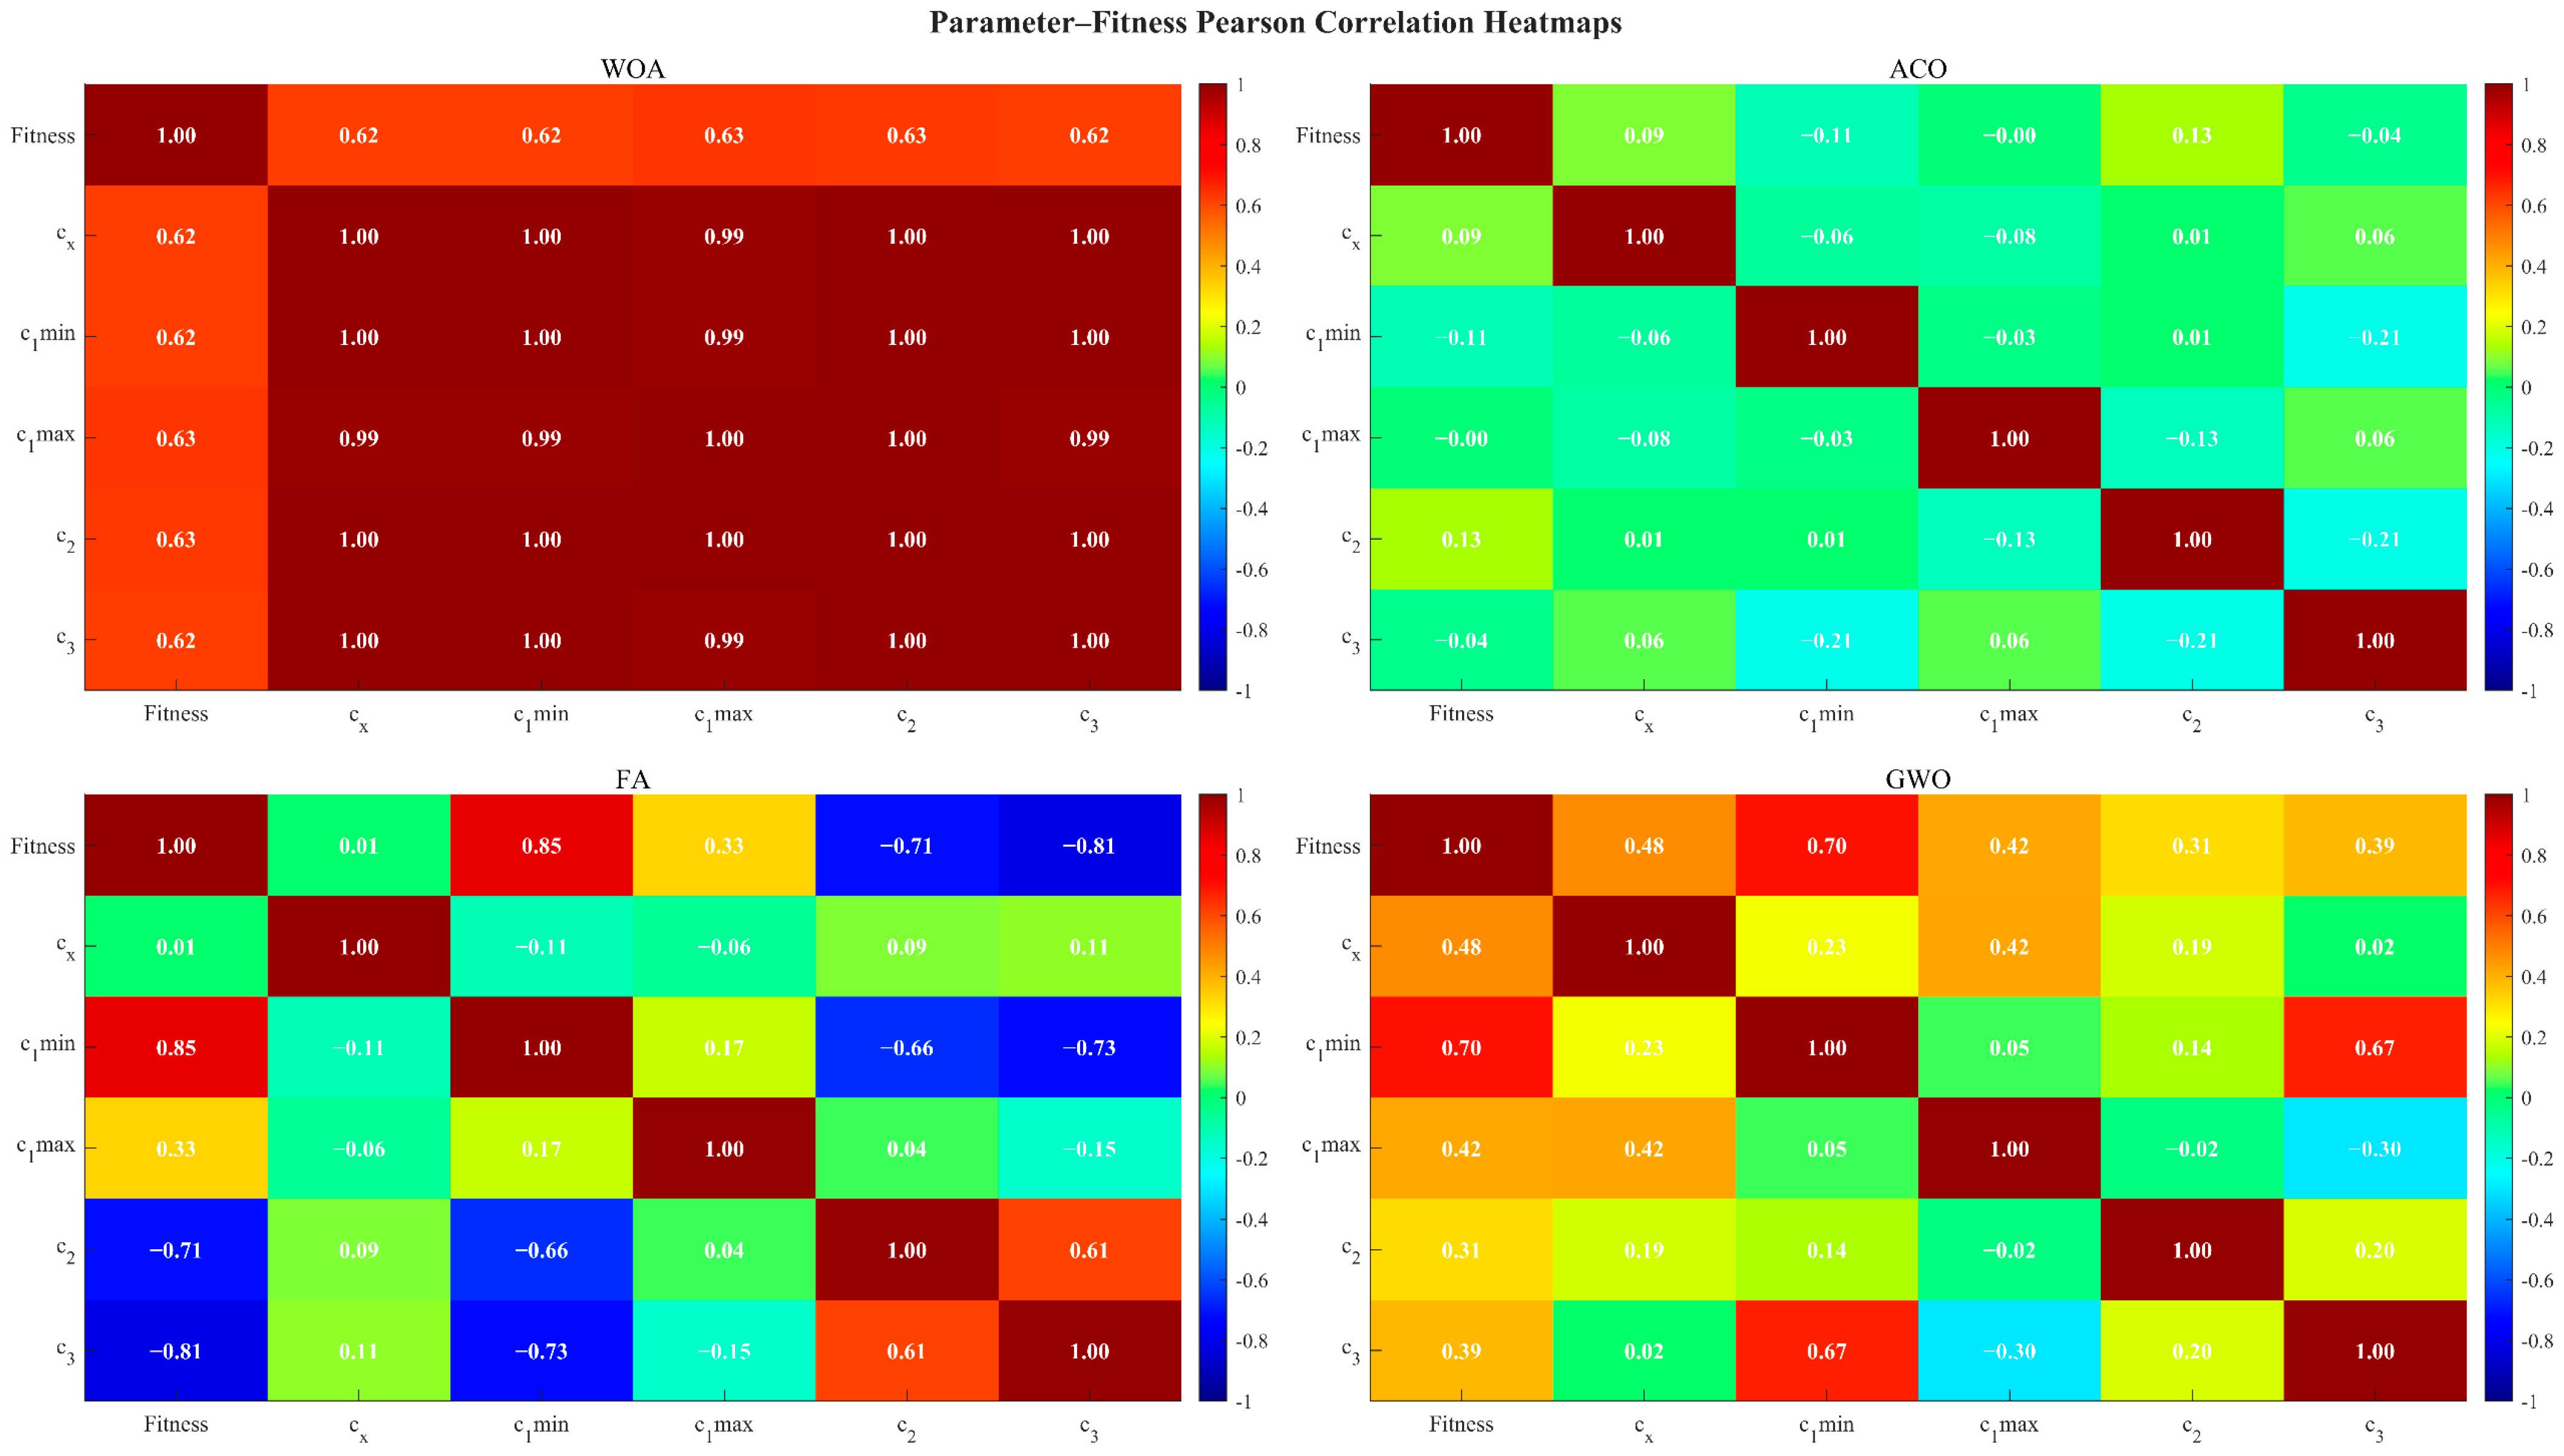
In
Figure 8, The FA is characterised by the clearest parameter-fitness relationships: the Pearson correlation coefficient between c_1_min and fitness reaches +0.85, whereas those between c_2 and fitness and between c_3 and fitness are approximately −0.71 and −0.81, respectively. It may thus be inferred that an increase in c_1_min together with reductions in c_2 and c_3 results in a marked improvement in final fitness—a unidirectional, strongly linear relationship that greatly eases parameter tuning. By contrast, within the WOA algorithm, near-unity collinearity among parameters renders their individual effects indistinguishable, thereby inhibiting targeted adjustment; under ACO, parameter-fitness correlations are negligible (coefficients near zero), indicating that modifications to any single parameter produce only marginal performance changes; and although GWO exhibits moderate correlations (circa ± 0.3–0.7), it lacks the simultaneous presence of strong positive and strong negative sensitivities that would enable a focused optimisation strategy. In FA, however, the distribution of parameter sensitivities is balanced—some parameters exert strong positive influence, others strong negative, and some remain neutral—thereby establishing a “push-pull” dynamic in which raising certain parameters “pulls” performance upwards while suppressing others “pushes” inferior solutions away, leading to an efficient and stable route to performance enhancement.
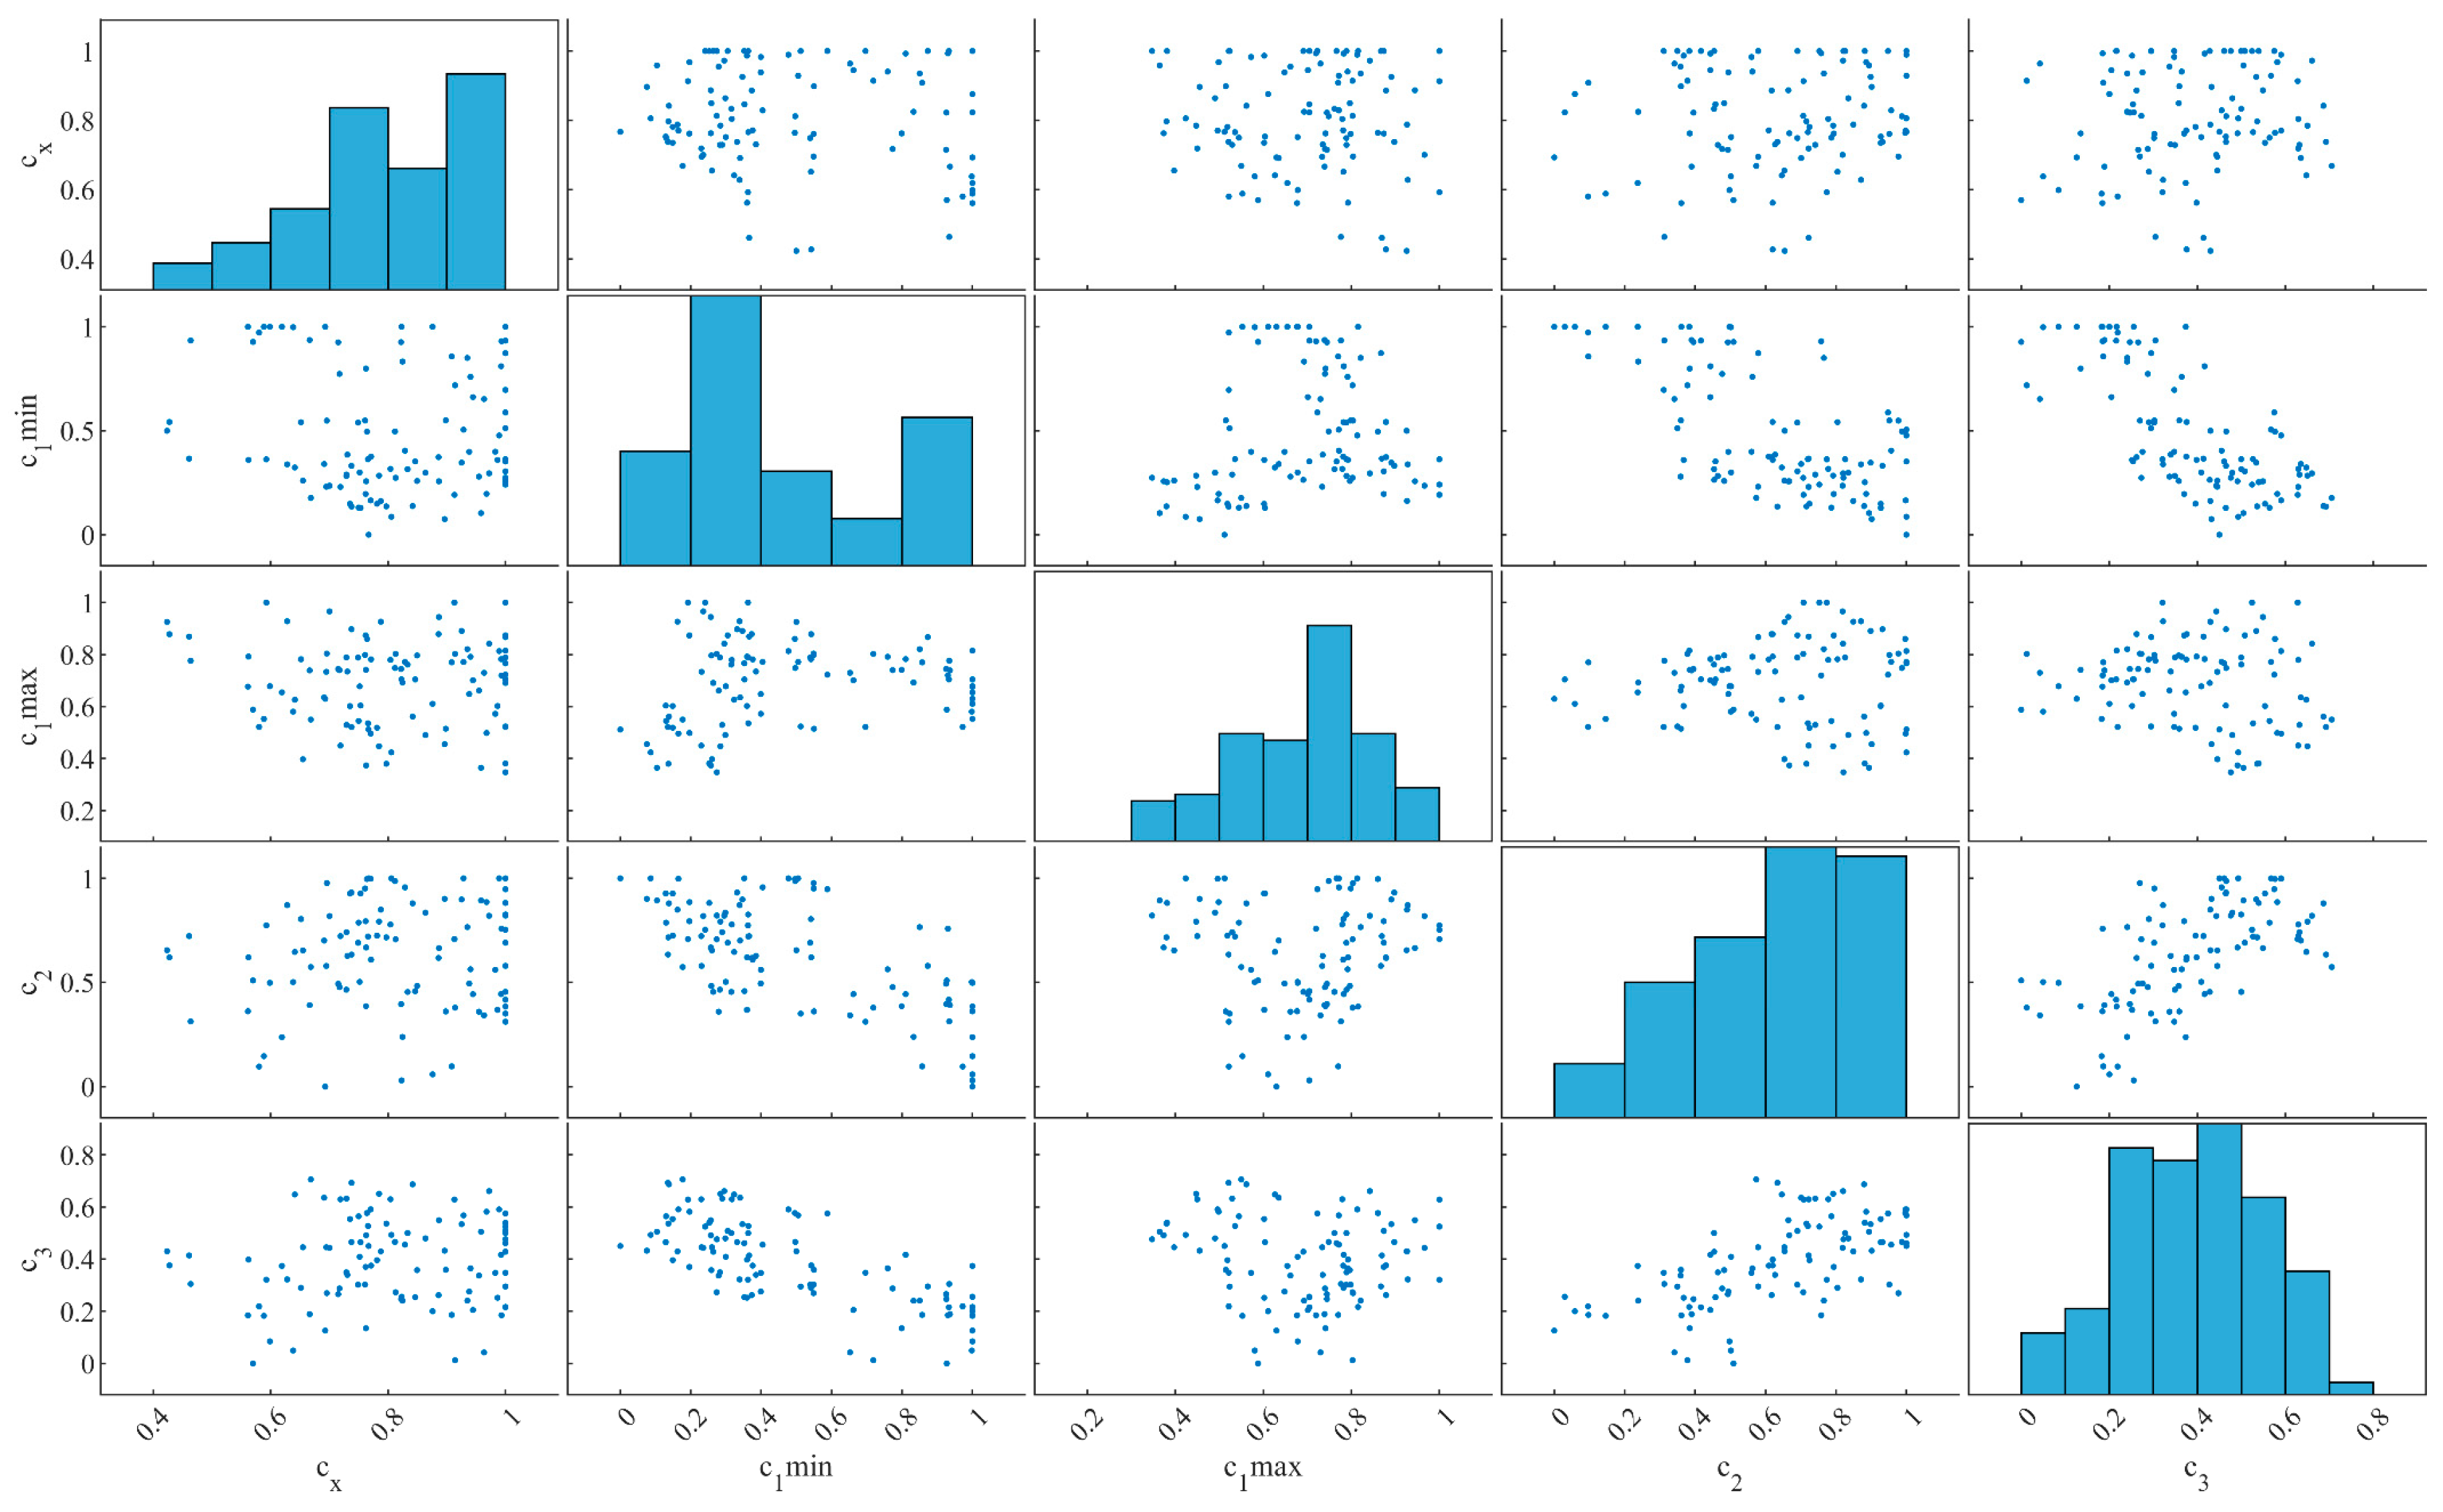
In
Figure 9, from the FA scatter matrix, it can be observed that, in the five-dimensional space defined by c_1_min, c_x, c_1_max, c_2, and c_3, the samples maintain a relatively uniform coverage while exhibiting weak to moderate pairwise linear correlations. The histograms on the diagonal indicate that c_1_min and c_2 tend to cluster in the mid-to-high value ranges, whereas the distribution of c_3 is slightly skewed towards mid-to-low values; such a distribution is conducive to preserving sufficient exploration during the global search phase. The off-diagonal scatter plots reveal, for instance, a mild negative correlation between c_1_min and c_3, and a weak positive correlation between c_x and c_2. These relationships suggest that the cognitive-learning and social-learning components of the FA algorithm can be tuned relatively independently, thereby mitigating the risk of premature convergence arising from strong inter-parameter coupling.
Based on this, the t-test method and p-value test were adopted to analyse the comparison results of the four algorithms from a statistical perspective. The predicted fitness values of different algorithms were used as the inspection criteria, and relevant analyses were carried out to verify the correlations among the four algorithms. The results show that when comparing WOA with ACO, the t-statistic is −25.33 and the p-value is 0.00050. When comparing WOA with FA, the t-statistic is 22.32 and the p-value is 0.00059. When comparing WOA with GWO, the t-statistic is −19.86 and the p-value is 0.00052. When comparing ACO with FA, the t-statistic is 28.07 and the p-value is 0.00061. When comparing ACO with GWO, the t-statistic is 18.41 and the p-value is 0.00090. When comparing FA with GWO, the t-statistic is −29.48 and the p-value is 0.00024. Through comprehensive comparison, it is found that the t-value of FA is the smallest, and the p-values of the four algorithms are all less than 0.05, which meets the requirements of the hypothesis test and verifies the high efficiency of the FA.
3.4. Rescue-Route Planning Results
An experiment was conducted to plan the underground rescue routes for multiple teams, with nodes 19, 15, and 21 selected as the trapped-person locations. The number of rescue teams was varied from one to three, and the FA-optimised parameters , , , , were employed.
Using the MDPSO algorithm, the rescue routes for each grouping were computed, and the results are summarised in
Table 3. In
Table 3, the longest path length for each configuration is reported. For the single-team scenario, the route length of 72,242.02 corresponds to the only team visiting nodes 15, 19 and 21 in sequence. In the two-team configuration, the maximum route length was 66,294.86: the first team traversed nodes 15 and 19, while the second team covered node 21. In the three-team case, the longest route remained 66,294.86, with each team assigned to a single node (team 1 to node 15, team 2 to node 19 and team 3 to node 21). Although two teams or three teams both yielded feasible routes, the three-team deployment achieved the shortest equivalent path of 56,357.02 and was therefore selected as the optimal configuration.
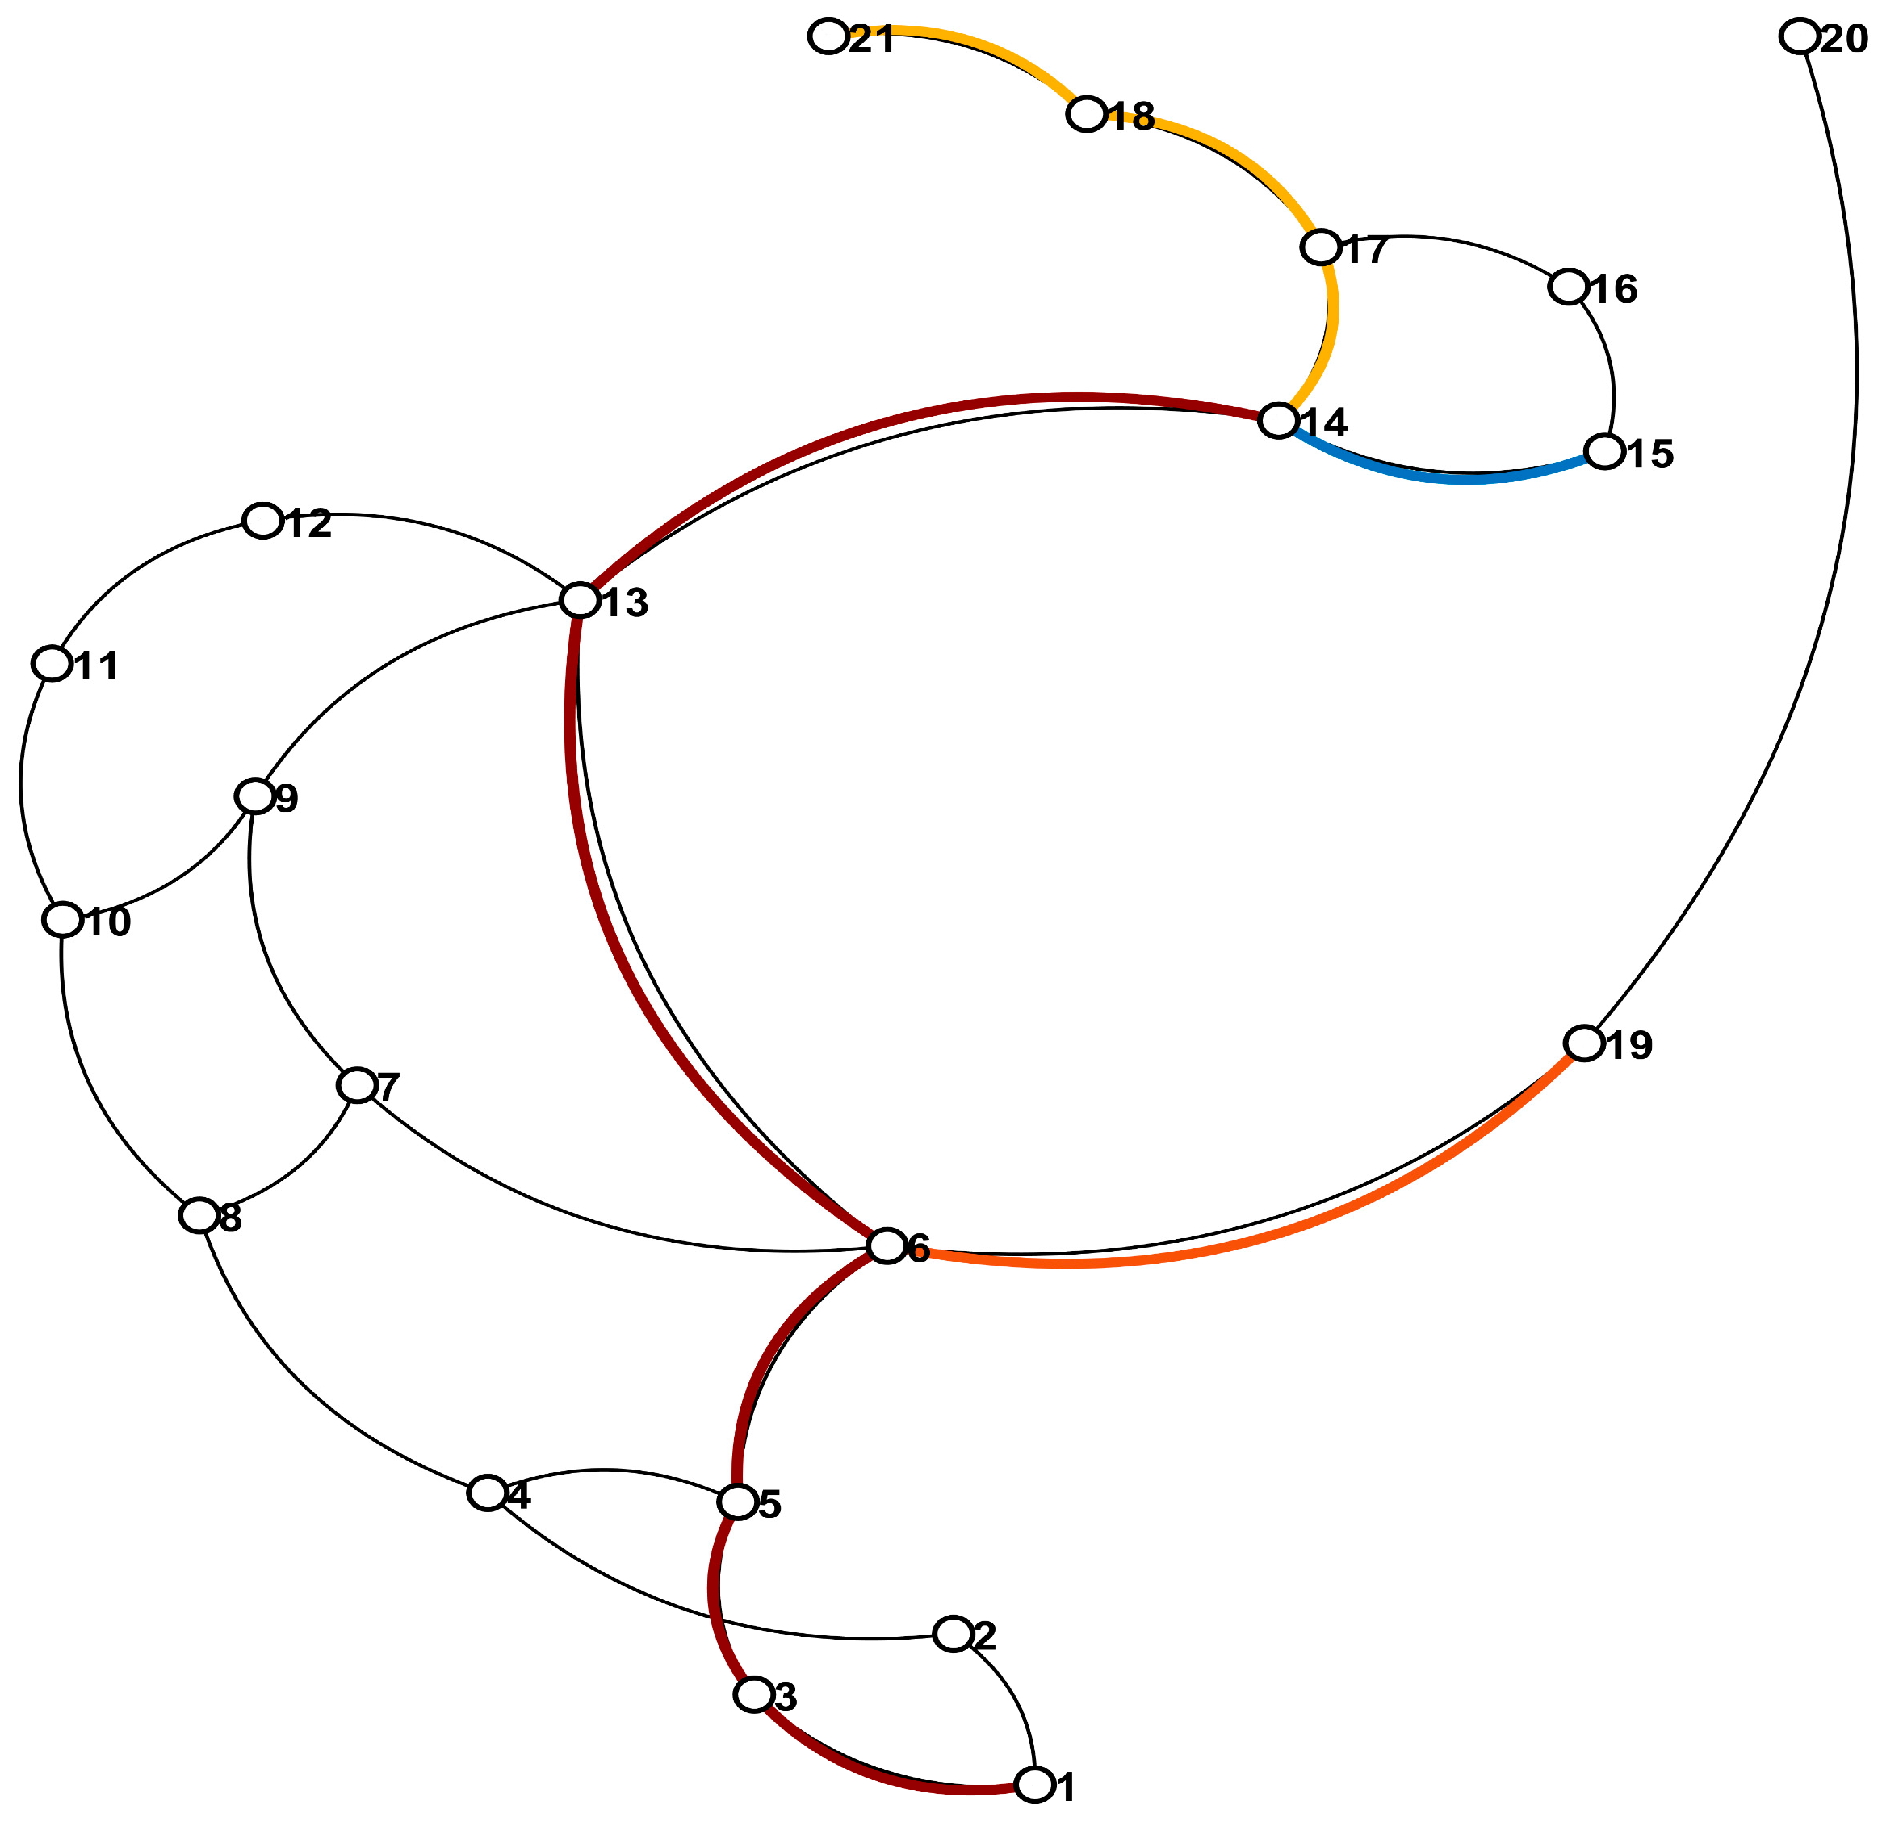
Figure 10 is presented as the outcome of the multi-team rescue-route planning. The network is arranged using a hybrid Force-Directed + BFS layout: all 21 nodes are shown as white circles with black borders, and the underlying topology is depicted with thin black arcs. Four high-contrast colours are employed to distinguish each rescue team’s route allocation: The deep-red trunk path (nodes 1→3→5→6→13) is rendered as the shared backbone route for all teams. The blue essential segment (nodes 14→15) is highlighted as the mandatory route for the first team. The orange branch arc (nodes 6→19) marks the route assigned to the second team. The yellow extension segment (nodes 14→17→18→21) indicates the third team’s path along the northern branch.
3.5. Node Importance Analysis
In
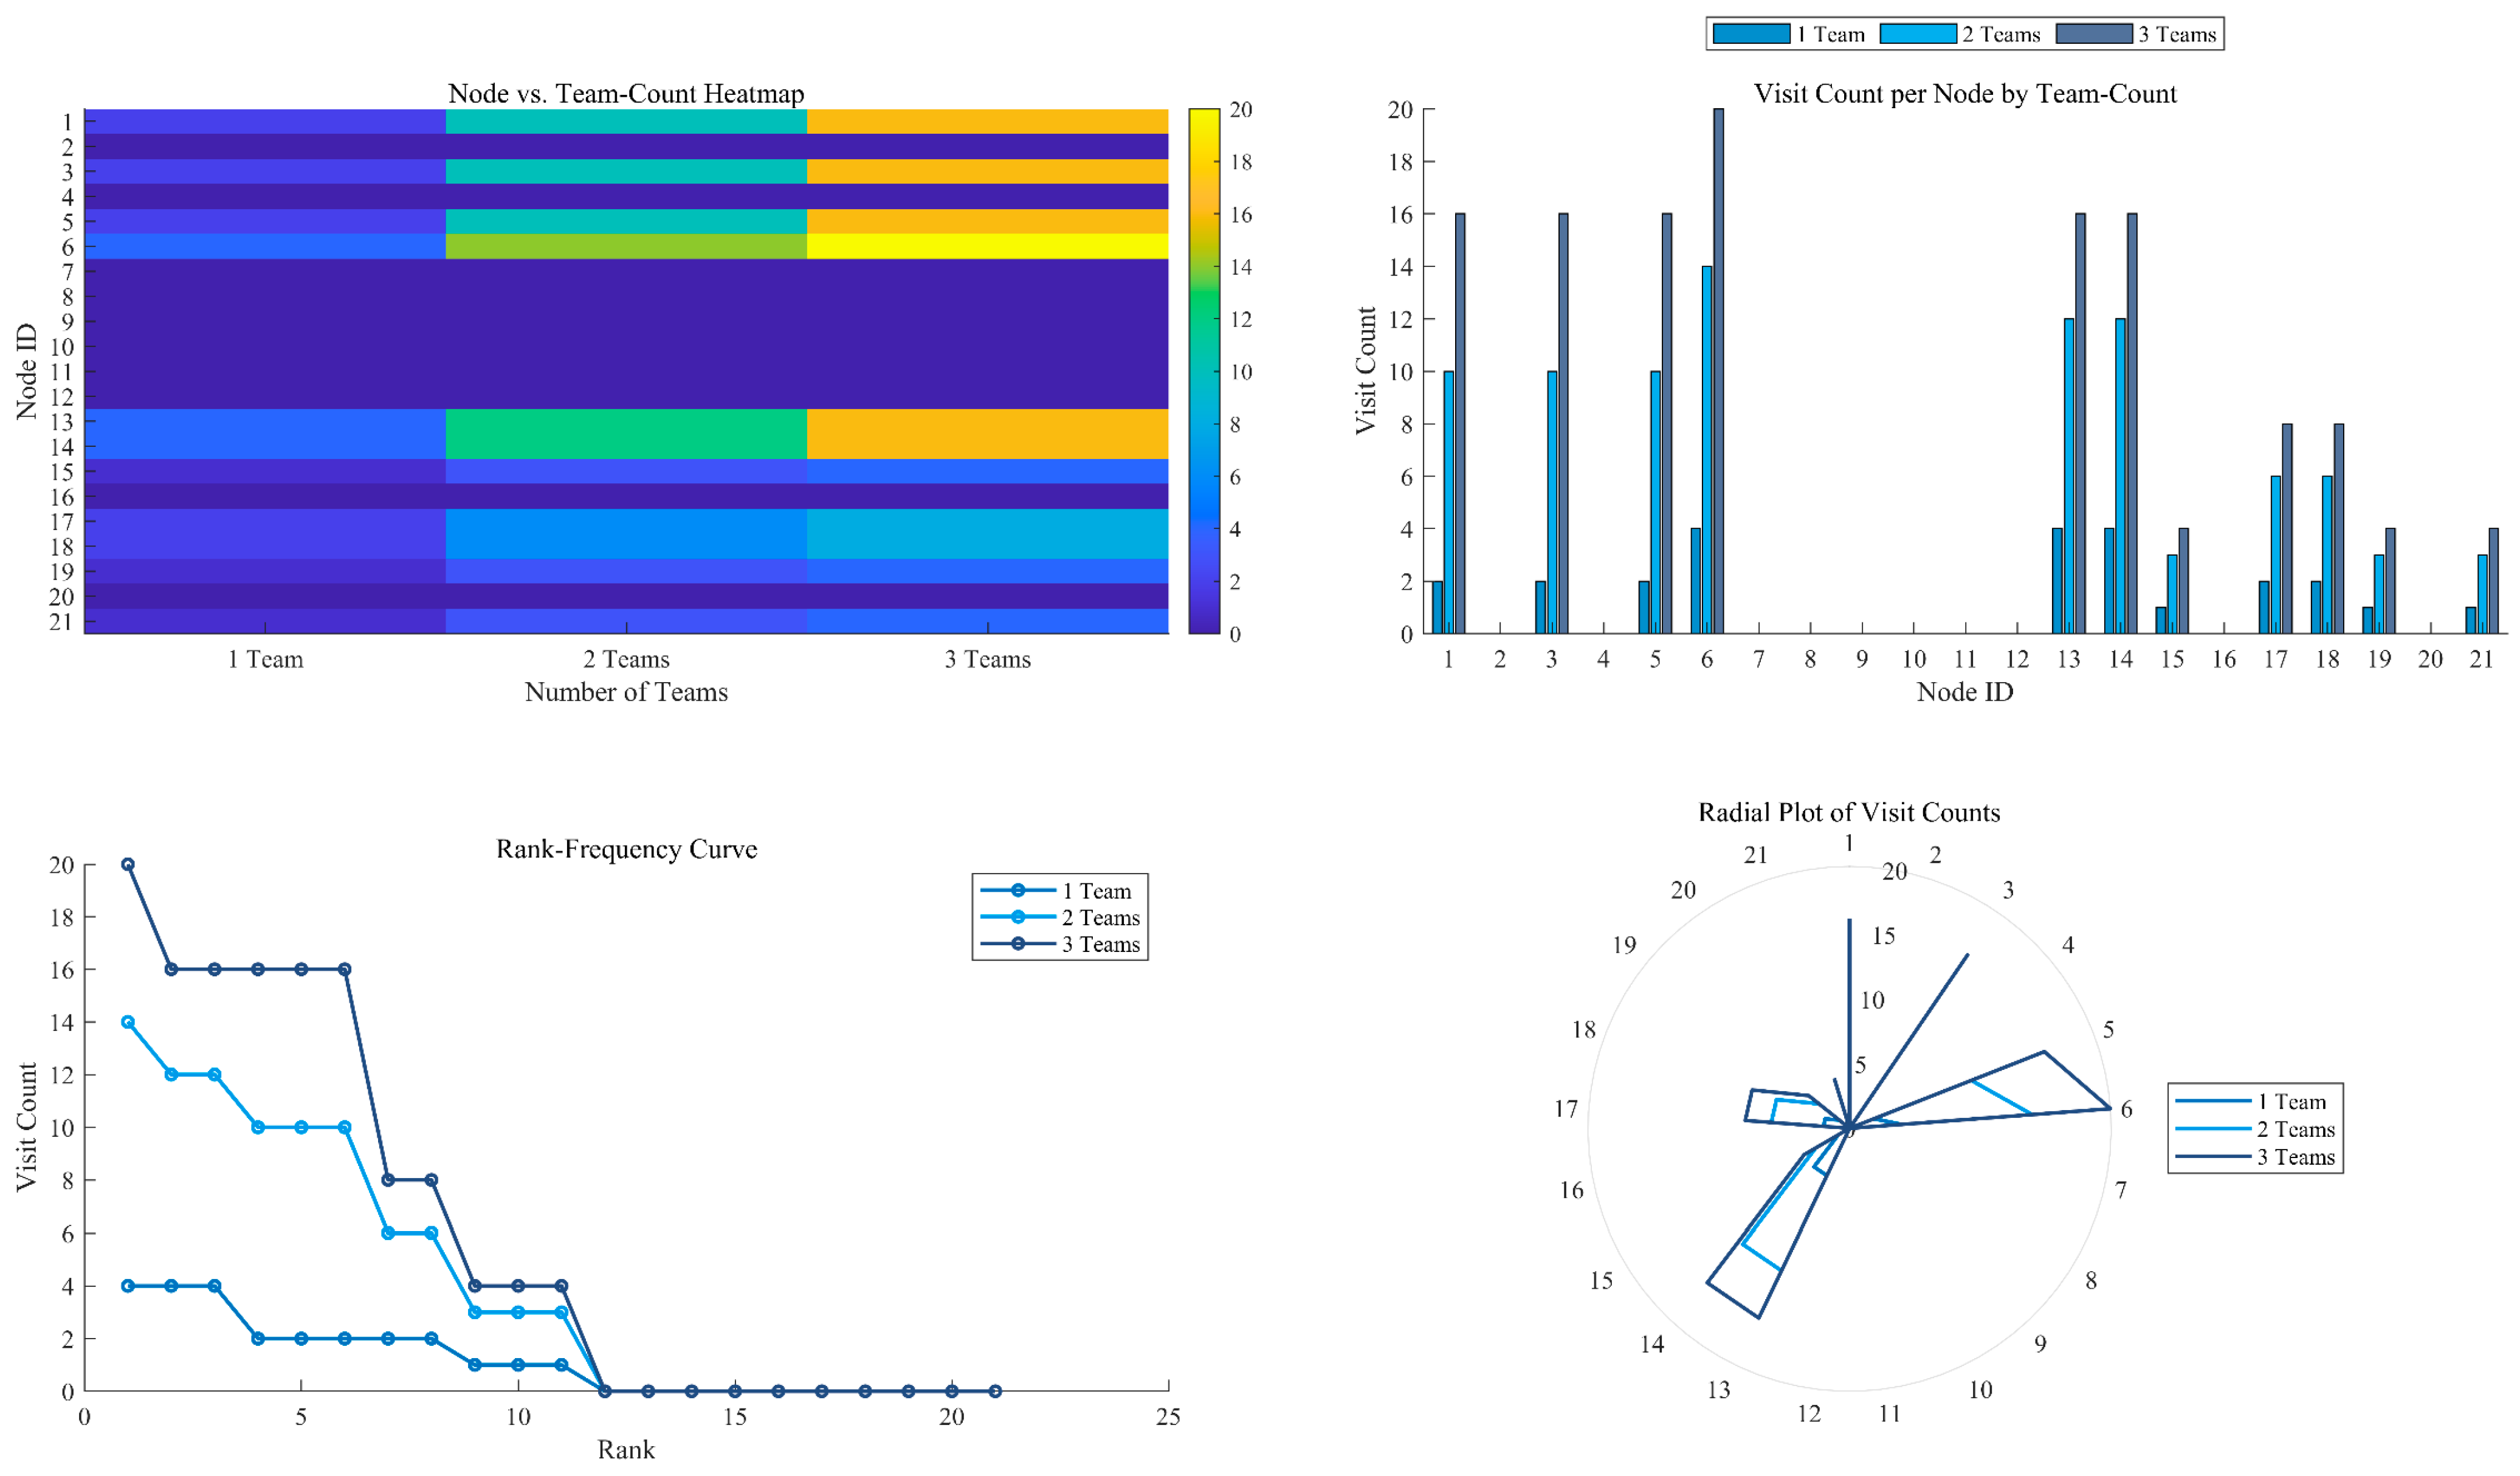
Figure 11, the “Node vs. Team-Count Heatmap” (top-left), a colour gradient from deep indigo (lowest visit frequency) through pale green (moderate) to bright yellow (highest) is employed. When only one rescue team is deployed (first column), the vast majority of nodes appear in deep indigo or indigo, indicating very low visit counts. With two teams (second column), certain hub nodes transition to green hues, reflecting a marked increase in visit frequency. Under three-team deployment (third column), a number of critical nodes (e.g., \ nodes 1, 3, 6, and 12) are rendered bright yellow, signifying highly concentrated visitation. This visualisation intuitively demonstrates that, as team count increases, both the overall visit frequency and its concentration on a small set of key nodes rise.
In the “Grouped Bar Chart” (top-right), three shades of blue distinguish the deployment scenarios: dark blue for “1 Team”, teal blue for “2 Teams”, and steel blue for “3 Teams”. For each node, the three adjacent bars form a stepped increase from dark blue through steel blue: peripheral nodes exhibit near-zero dark-blue bars, slight teal-blue increments, and prominent steel-blue bars at principal hubs (nodes 1, 3, 6 and 12). This chart quantitatively confirms that increased team numbers shift visitation towards core nodes, thereby intensifying visit concentration.
The “Rank-Frequency Curve” (bottom-left) depicts descending order visit counts under the three scenarios, again using dark blue, teal blue, and steel blue. All three curves display long-tail distributions; however, the steel-blue curve lies highest overall, followed by the teal-blue curve, and finally the dark-blue curve, indicating that three teams achieve the broadest coverage, two teams the next, and one team the least. Beyond validating the rise in total visits with team number, this plot also reveals the “long-tail” nature of node importance, wherein a few nodes account for the majority of visits.
The “Radial Plot of Visit Counts” (bottom-right) arranges nodes uniformly around a polar coordinate system, with dark blue, teal blue, and steel blue radial lines representing the visit counts for one, two, and three teams, respectively. Pronounced peaks appear on the steel-blue curve at nodes 6, 12, and 3, with diminishing peak magnitudes on the teal-blue and dark-blue curves. This polar visualisation enables immediate comparison of node importance and distribution patterns across deployment scenarios, further illustrating the trend of visit focus consolidating on the same core nodes as team number increases.


