Technical Note

Comparative Study of Temperature Distribution Characteristics of Ceiling Jets at Center and Edge Regions in Corridors

1
Department of Fire Safety Research, Korea Institute of Civil Engineering and Building Technology (KICT), Hwaseong-si 18544, Republic of Korea
2
Department of Fire and Disaster Protection Engineering, Hoseo University, Asan-si 31499, Republic of Korea
*
Author to whom correspondence should be addressed.
Fire 2025, 8(5), 181; https://doi.org/10.3390/fire8050181
Submission received: 18 February 2025 / Revised: 27 April 2025 / Accepted: 28 April 2025 / Published: 30 April 2025
(This article belongs to the Section Fire Science Models, Remote Sensing, and Data)

Abstract

:
This study analyzed the temperature characteristics of ceiling jets in corridor spaces by conducting experiments with varying heat release rates and ceiling heights and comparing the results with predictive equations based on the energy conservation equation. The smoke layer formed at a lower height than in open spaces, and the ceiling jet temperature near the wall was higher than that along the central axis. Predictions were generally accurate at a ceiling height of 3.0 m but were overestimated at 1.5 m and underestimated at 4.5 m. The temperature attenuation trend aligned with Oka’s equations, though the temperature near the wall remained higher.

1. Introduction

Predicting smoke behavior in building fires is a critical factor in developing evacuation measures and designing fire detection systems. During a fire, the plume generated from the fire source rises, impinges on the ceiling, and subsequently spreads horizontally along the ceiling, forming what is known as a ceiling jet. Predicting ceiling jet behavior is crucial in fire safety design, and thus, extensive research has been conducted on this topic over the years.
Alpert proposed an analytical prediction method for the characteristics of ceiling jets, including temperature distribution, flow velocity, and thickness. Additionally, based on comparisons with experimental data, a simplified predictive equation for temperature and velocity was developed for regions extending beyond five times the ceiling height [1,2].
More recently, Suzuki expanded the Alpert’s model by incorporating ceiling temperature variations, formulating a prediction model for abnormal conditions. The validity of this model was assessed by comparing it with a steady-state prediction equation and experimental data obtained in a large office space with walls [3]. However, a key limitation of these studies is that they do not account for the behavior of ceiling jets upon impacting walls during their horizontal spread. In real building environments—particularly in spaces with an aspect ratio of 4 or greater—smoke is likely to interact with walls before fully spreading throughout the room, influencing the characteristics of the horizontally propagating smoke layer [4].
However, in structures with specific spatial characteristics, such as corridors and tunnels, ceiling jets are influenced by sidewalls. Therefore, their behavior is fundamentally different from that of an infinite ceiling, as studied in previous research. In such elongated spaces with a high aspect ratio, most studies have focused on the temperature attenuation of ceiling jets flowing along the central axis [5].
Li et al. conducted numerical simulations in a rectangular cross-section tunnel with natural ventilation to analyze the relationship between ceiling jet temperature attenuation and aspect ratio [6]. Hu et al. performed several tunnel fire experiments and presented temperature attenuation characteristics depending on the presence or absence of longitudinal ventilation [7,8,9,10]. Additionally, Li et al. proposed a correlation to predict the temperature distribution of ceiling jets flowing along tunnel or corridor ceilings, taking into account both the maximum temperature rise and its location [11].
In particular, Delichatsios and Li et al. proposed a correlation that divides the flow into regions to predict the transition point where an axisymmetric plume generated from a fire source reaches the ceiling and transitions from a turbulent to a laminar region [11,12]. The classification of each region was based on the assumed location of the density jump. Recently, Oka further developed this theory and proposed theoretical equations to predict the attenuation characteristics of ceiling jet temperature and velocity in tunnels, comparing the results with full-scale experiments [5].
In addition, ongoing studies have examined ceiling jet temperatures in naturally ventilated tunnels with curved ceilings [13], the temperature distribution of ceiling jets formed under strong fire plumes [14], and the flow and temperature characteristics of ceiling jets in urban tunnels [15]. From past to present, continuous efforts have been made to understand the behavior of ceiling jets under various geometric configurations and fire conditions, highlighting the importance of this topic in the field of fire safety.
In corridors, the presence of sidewalls on both sides can trap hot airflow along the ceiling for an extended period, leading to increased temperatures. As a result, the propagation characteristics of ceiling jets differ from those in open ceilings, potentially affecting the calculation of activation times for heat detectors. In practice, sprinkler heads or detectors are sometimes recommended for installation near corridors or walls where combustibles are stored, especially in large parking garages, retail facilities, and warehouse spaces. However, existing studies have primarily focused on the characteristics of ceiling jets flowing along the central axis, with limited discussion on other regions.
Therefore, this study conducted experiments in a corridor space enclosed by sidewalls and measured the temperature distribution across the entire ceiling surface. The experimental variables were the heat release rate and ceiling height. Additionally, the study examined whether the measured temperature data could be predicted using equations derived from the energy conservation equation. By comparing the results with existing predictive equations, the temperature characteristics of the ceiling surface in the corridor space were analyzed based on location.

2. Experimental Overview

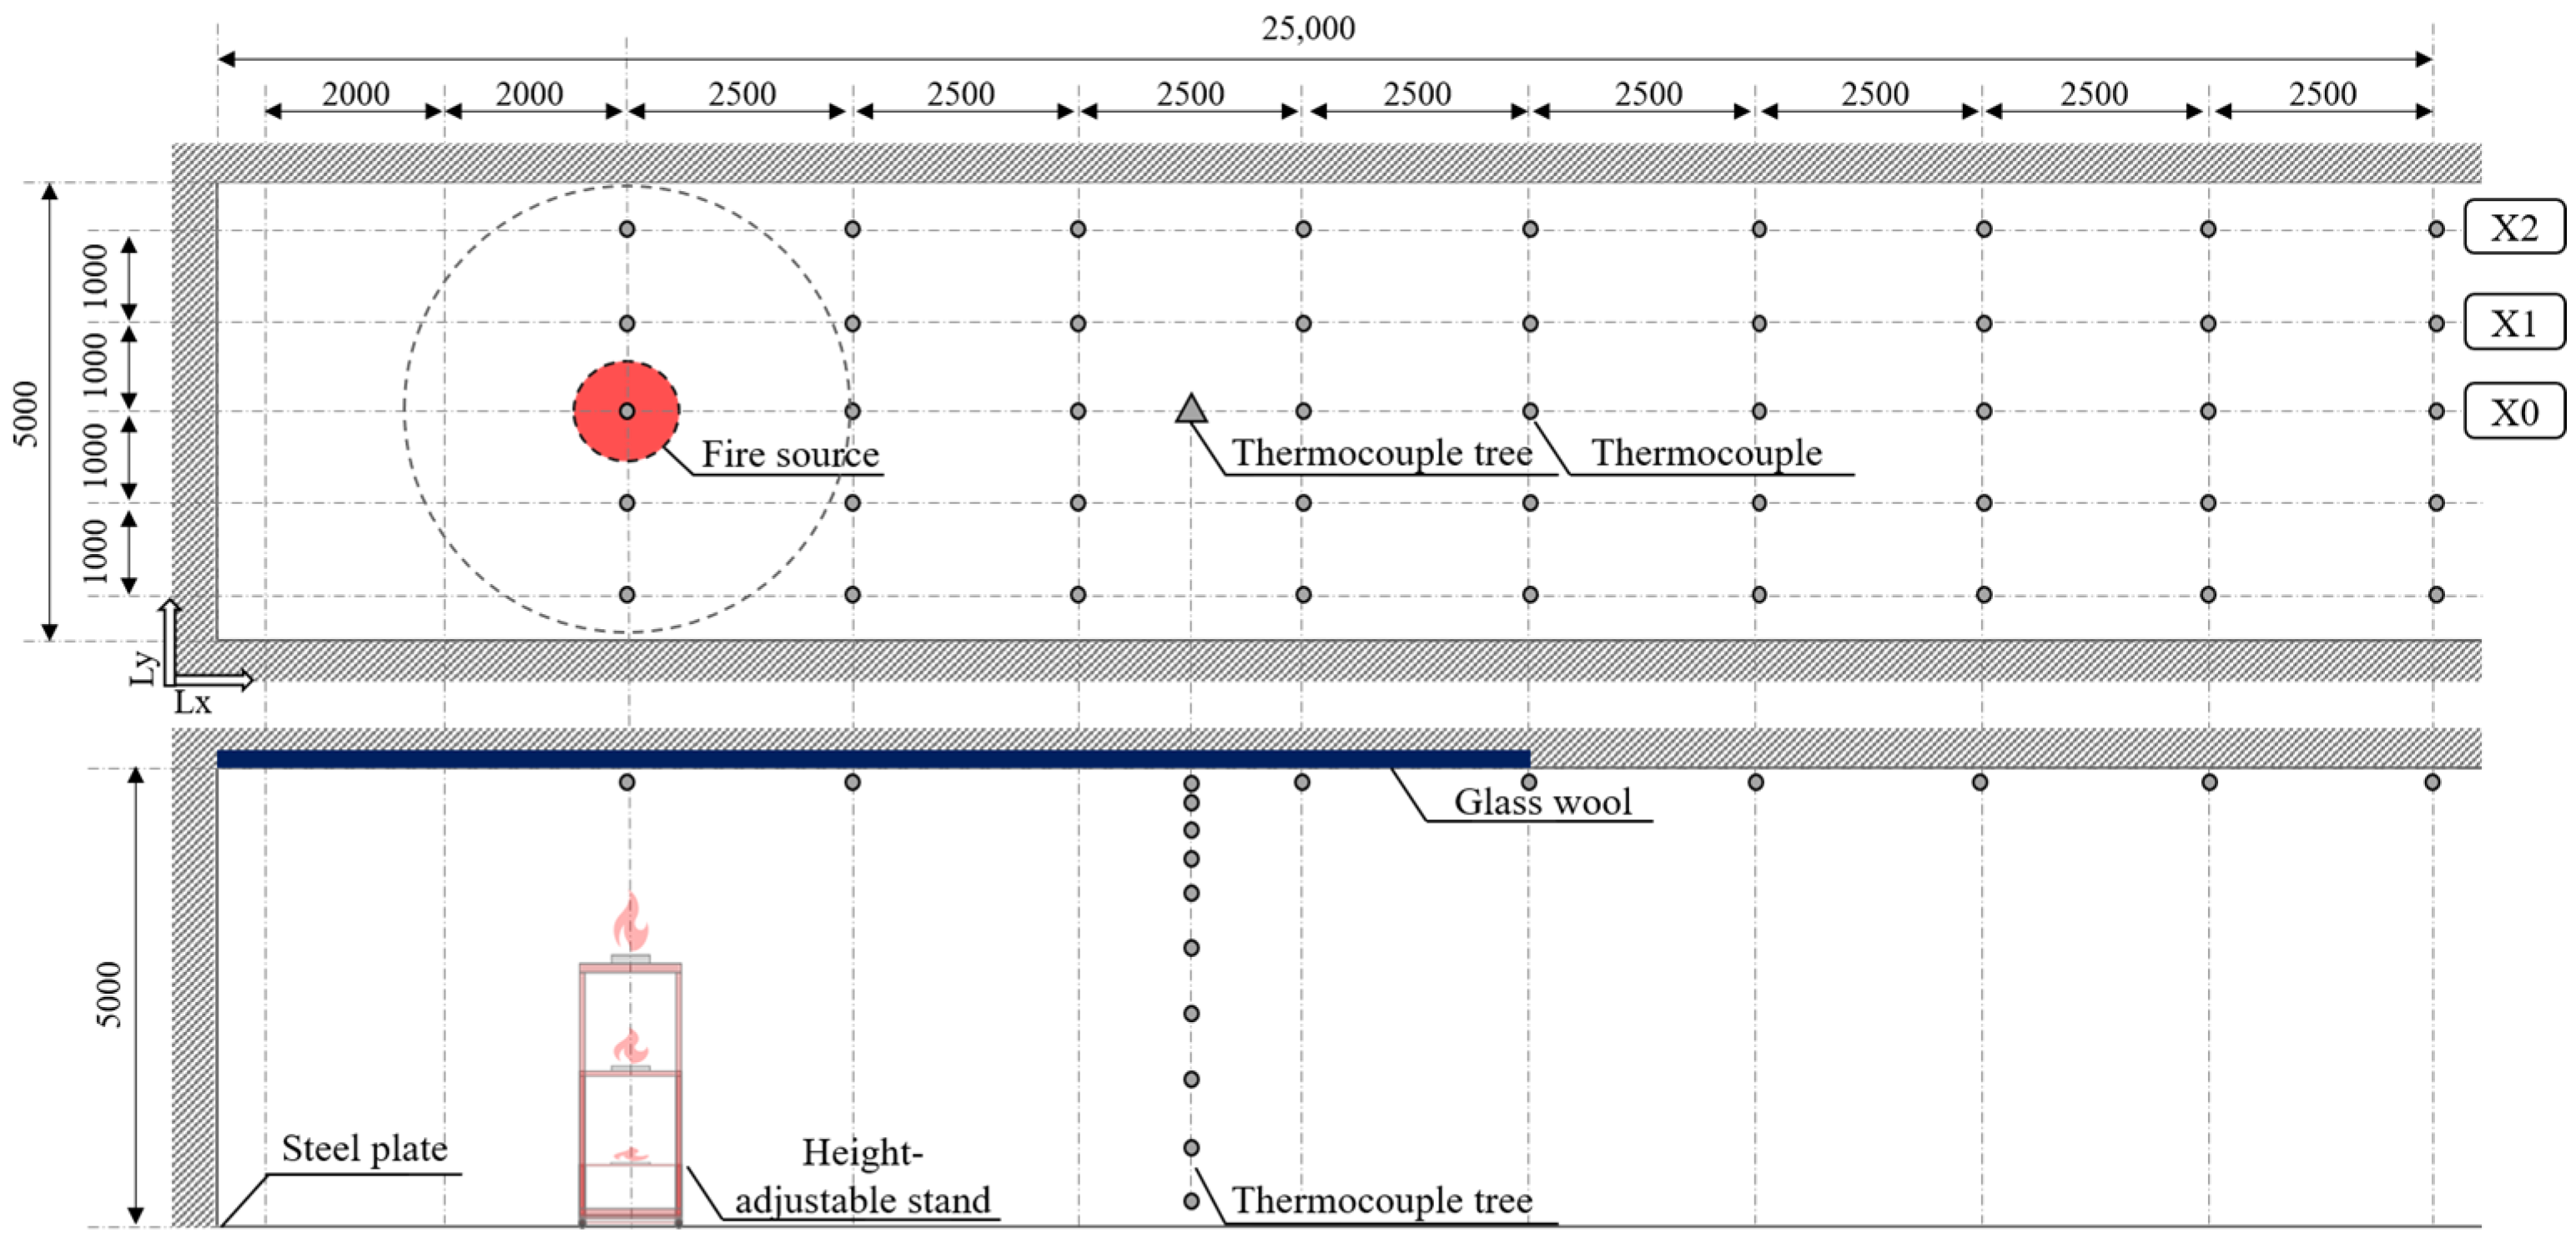
2.1. Experimental Setup

As shown in Figure 1, the space used in the experiment measured 5 m (Ly) × 25 m (Lx) in width and length to determine the temperature reduction characteristics based on the horizontal distance of the ceiling jet. The height from the floor to the ceiling was a 5 m steel plate. However, the front of the space, where the fire source was located, was reinforced with glass fiber to prevent the fire source from compromising the structure. The experimental setup consisted of a corridor space with walls installed on the left end side and along both sides of the y-axis. Additionally, ethanol was used as the fire source.

2.2. Measurement Items

In this experiment, the weight loss rate was measured to predict the heat release rate (HRR) of the fuel. This rate was assessed by placing a fuel bowl filled with fuel on an electronic scale (A&D Korea, Seoul, Republic of Korea, GF-20K) and recording the weight loss at 1 s intervals. To prevent measurement errors caused by heat in the fuel bowl, a 10 T fire-resistant gypsum board was positioned between the fuel bowl and the electronic scale. Furthermore, temperature prediction requires data from the area beneath the ceiling and the vertical temperature distribution. Thus, the temperature below the ceiling was measured using thermocouples installed at 2.5 m intervals, 50 mm below the ceiling, extending in the x direction from the direct overhead position of the fire source (x/z = 0). To obtain the vertical temperature distribution, a TC tree was placed 6.25 m from the fire source, with a thermocouple tree installed at 0.8 m intervals from the floor to 4.5 m and at intervals of 0.2, 0.1, 0.1, 0.05, and 0.05 m above that.

2.3. Experimental Conditions

The experimental conditions consisted of nine cases in which the ceiling height and heat release rate were varied. The ceiling height was adjusted by moving the fire source up and down using a height-adjustable stand. The heat release rate was modified using a steel bowl with areas of A = 0.1 m 2 , 0.2 m 2 , and 0.4 m 2 . Additionally, 2 L of fuel was injected per 0.1 m 2 of area, and the experimental duration for each condition was approximately 10 min. The details of the experimental conditions are presented in Table 1.

3. Experimental Results

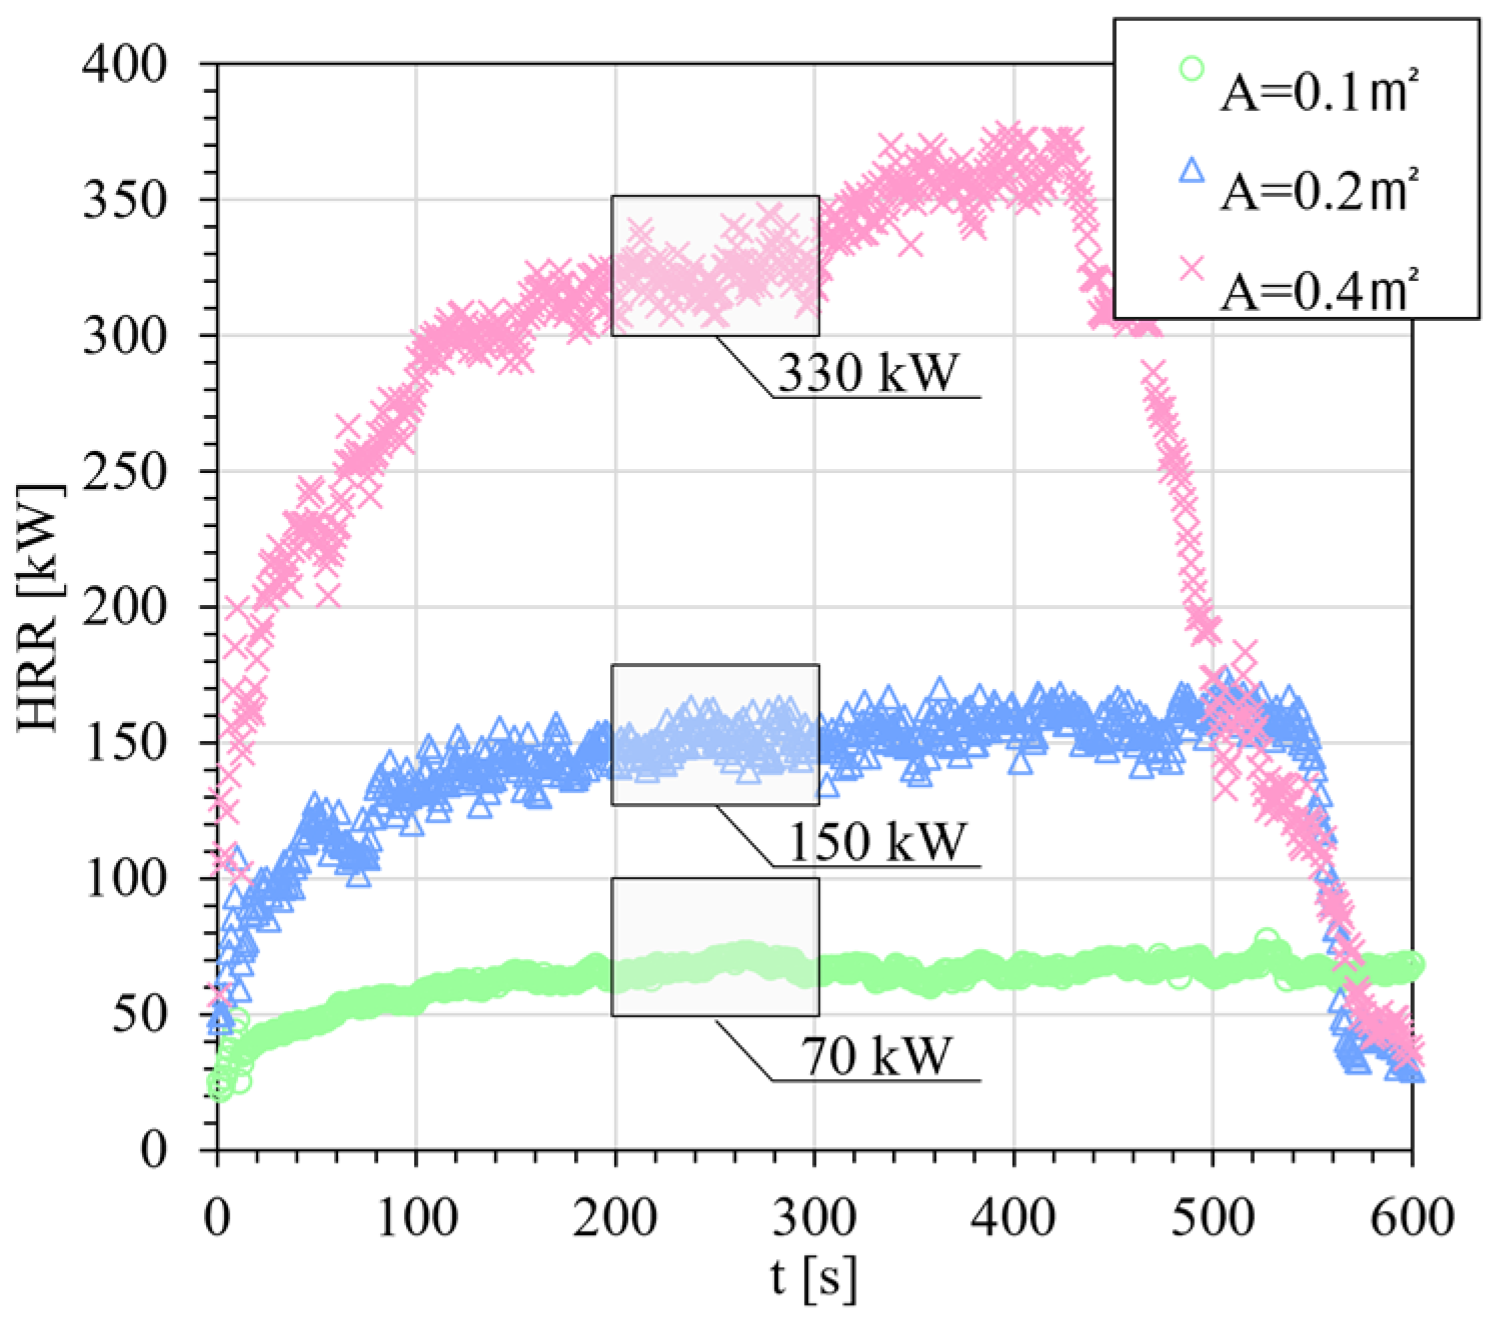
3.1. Heat Release Rate
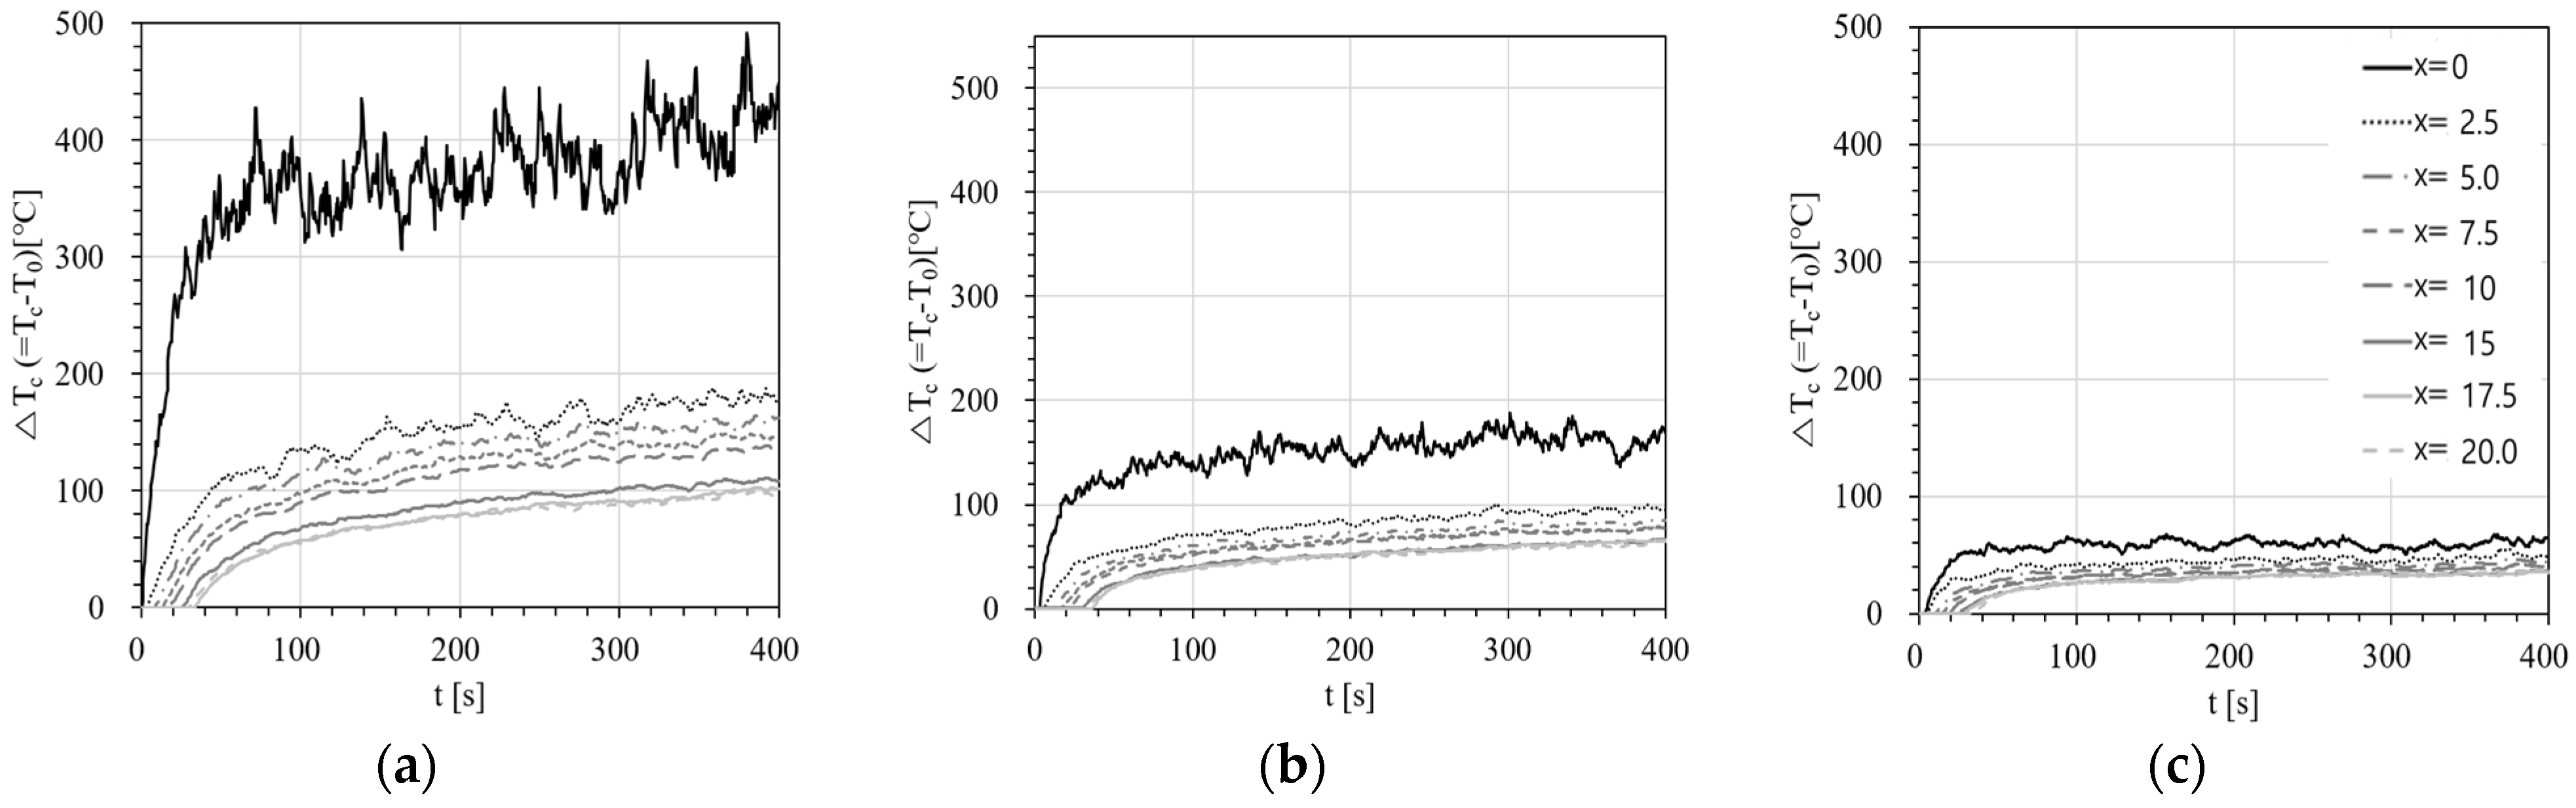
Heat release rate Q f [ k W ] was calculated by multiplying the weight loss rate m ˙ [ g / s ] from the weight measured by the electronic scale as shown in Equation (1) and heat of combustion amount Δ H c (ethanol: 24.6 [ k J / g ]) [16].
Q f = m ˙ Δ H c
According to the experimental results, heat release rate Q f calculated by the weight loss rate m ˙ [ g / s ] was found to be affected by the size of the fire source. Typically, fire growth is described by the relationship Q = α t n , where α is a growth rate factor (given in k W / s 2 ) and n is an exponent. When n = 2 , the fire is considered to be growing. In contrast, when n = 0 , it indicates that the fire size remains constant over time. In other words, the closer n is to 0 , the closer the fire is to a steady-state condition [17]. In this study, the average heat release rate between 200 s and 300 s, shown in Figure 2, was used. The calculated values of n were 0.15, 0.09, and 0.05 for A = 0.1   m 2 , 0.2   m 2 , and 0.4   m 2 respectively. Although the fire size was not completely constant, it was reasonably close to a quasi-steady state. Therefore, the heat release rates were set to 70 k W , 150 k W , and 330 k W for A = 0.1 m 2 , 0.2 m 2 , and 0.4 m 2 , respectively.

3.2. Variation in Temperature Rise T c over Time

Figure 3 shows the history of temperature change over time when the ceiling height was adjusted to H = 1.5   m ,   3.0   m ,   and   4.5   m under the condition of the fire source area A = 0.4   m 2 . Here, the temperature data of thermocouples installed at 2.5   m intervals in the x direction from the top of the fire source is shown, with x = 0 . In the initial 0 50   s section, it was confirmed that the temperature rapidly increased due to the growth of the fire source and then exhibited a more gradual slope. In addition, it was confirmed that the temperature reaching the ceiling increased as the ceiling height decreased. It is considered to be because, with the lower ceiling height, the distance the fire plume from the fire source travels to the ceiling is shorter. In addition, since T c directly above the fire source at a ceiling height of H = 1.5   m is over 400 °C, it is possible that the flame directly touched the ceiling. Therefore, in this study, regions not directly affected by the flame were used as analytical data.

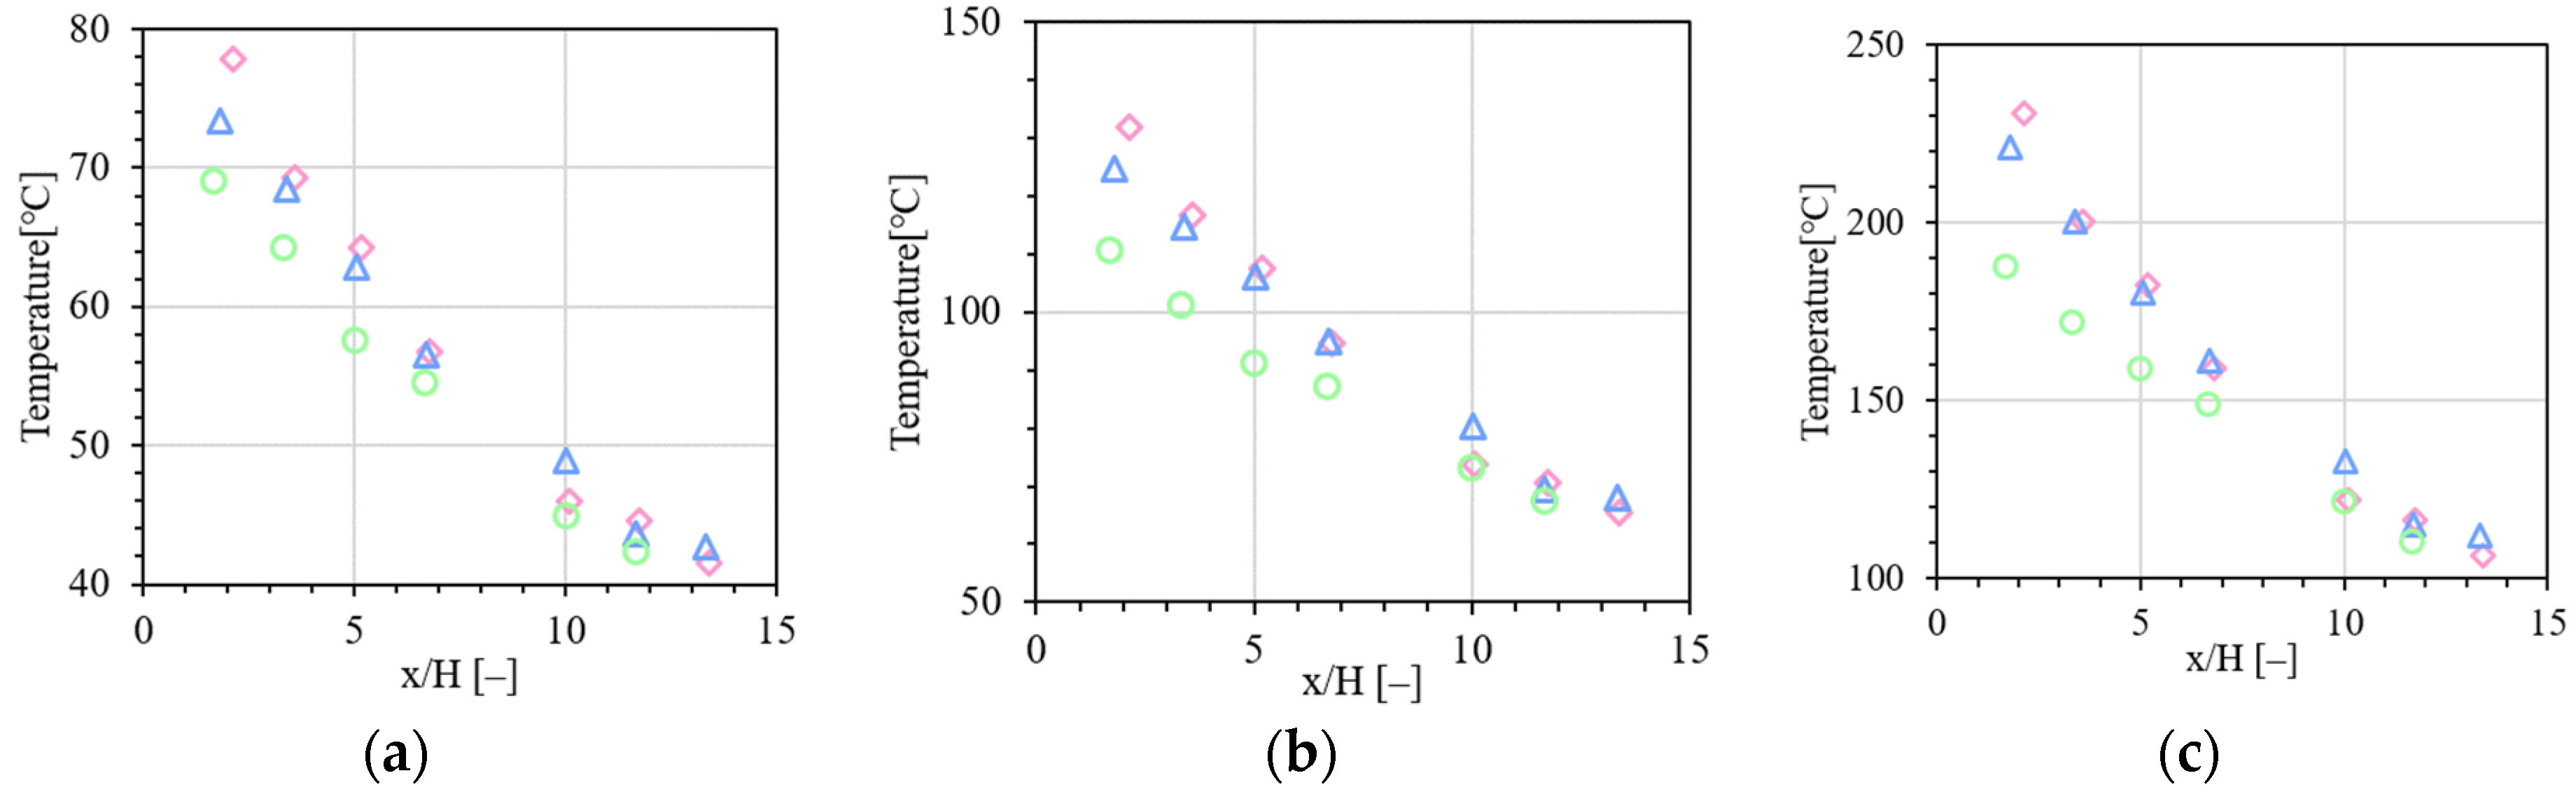
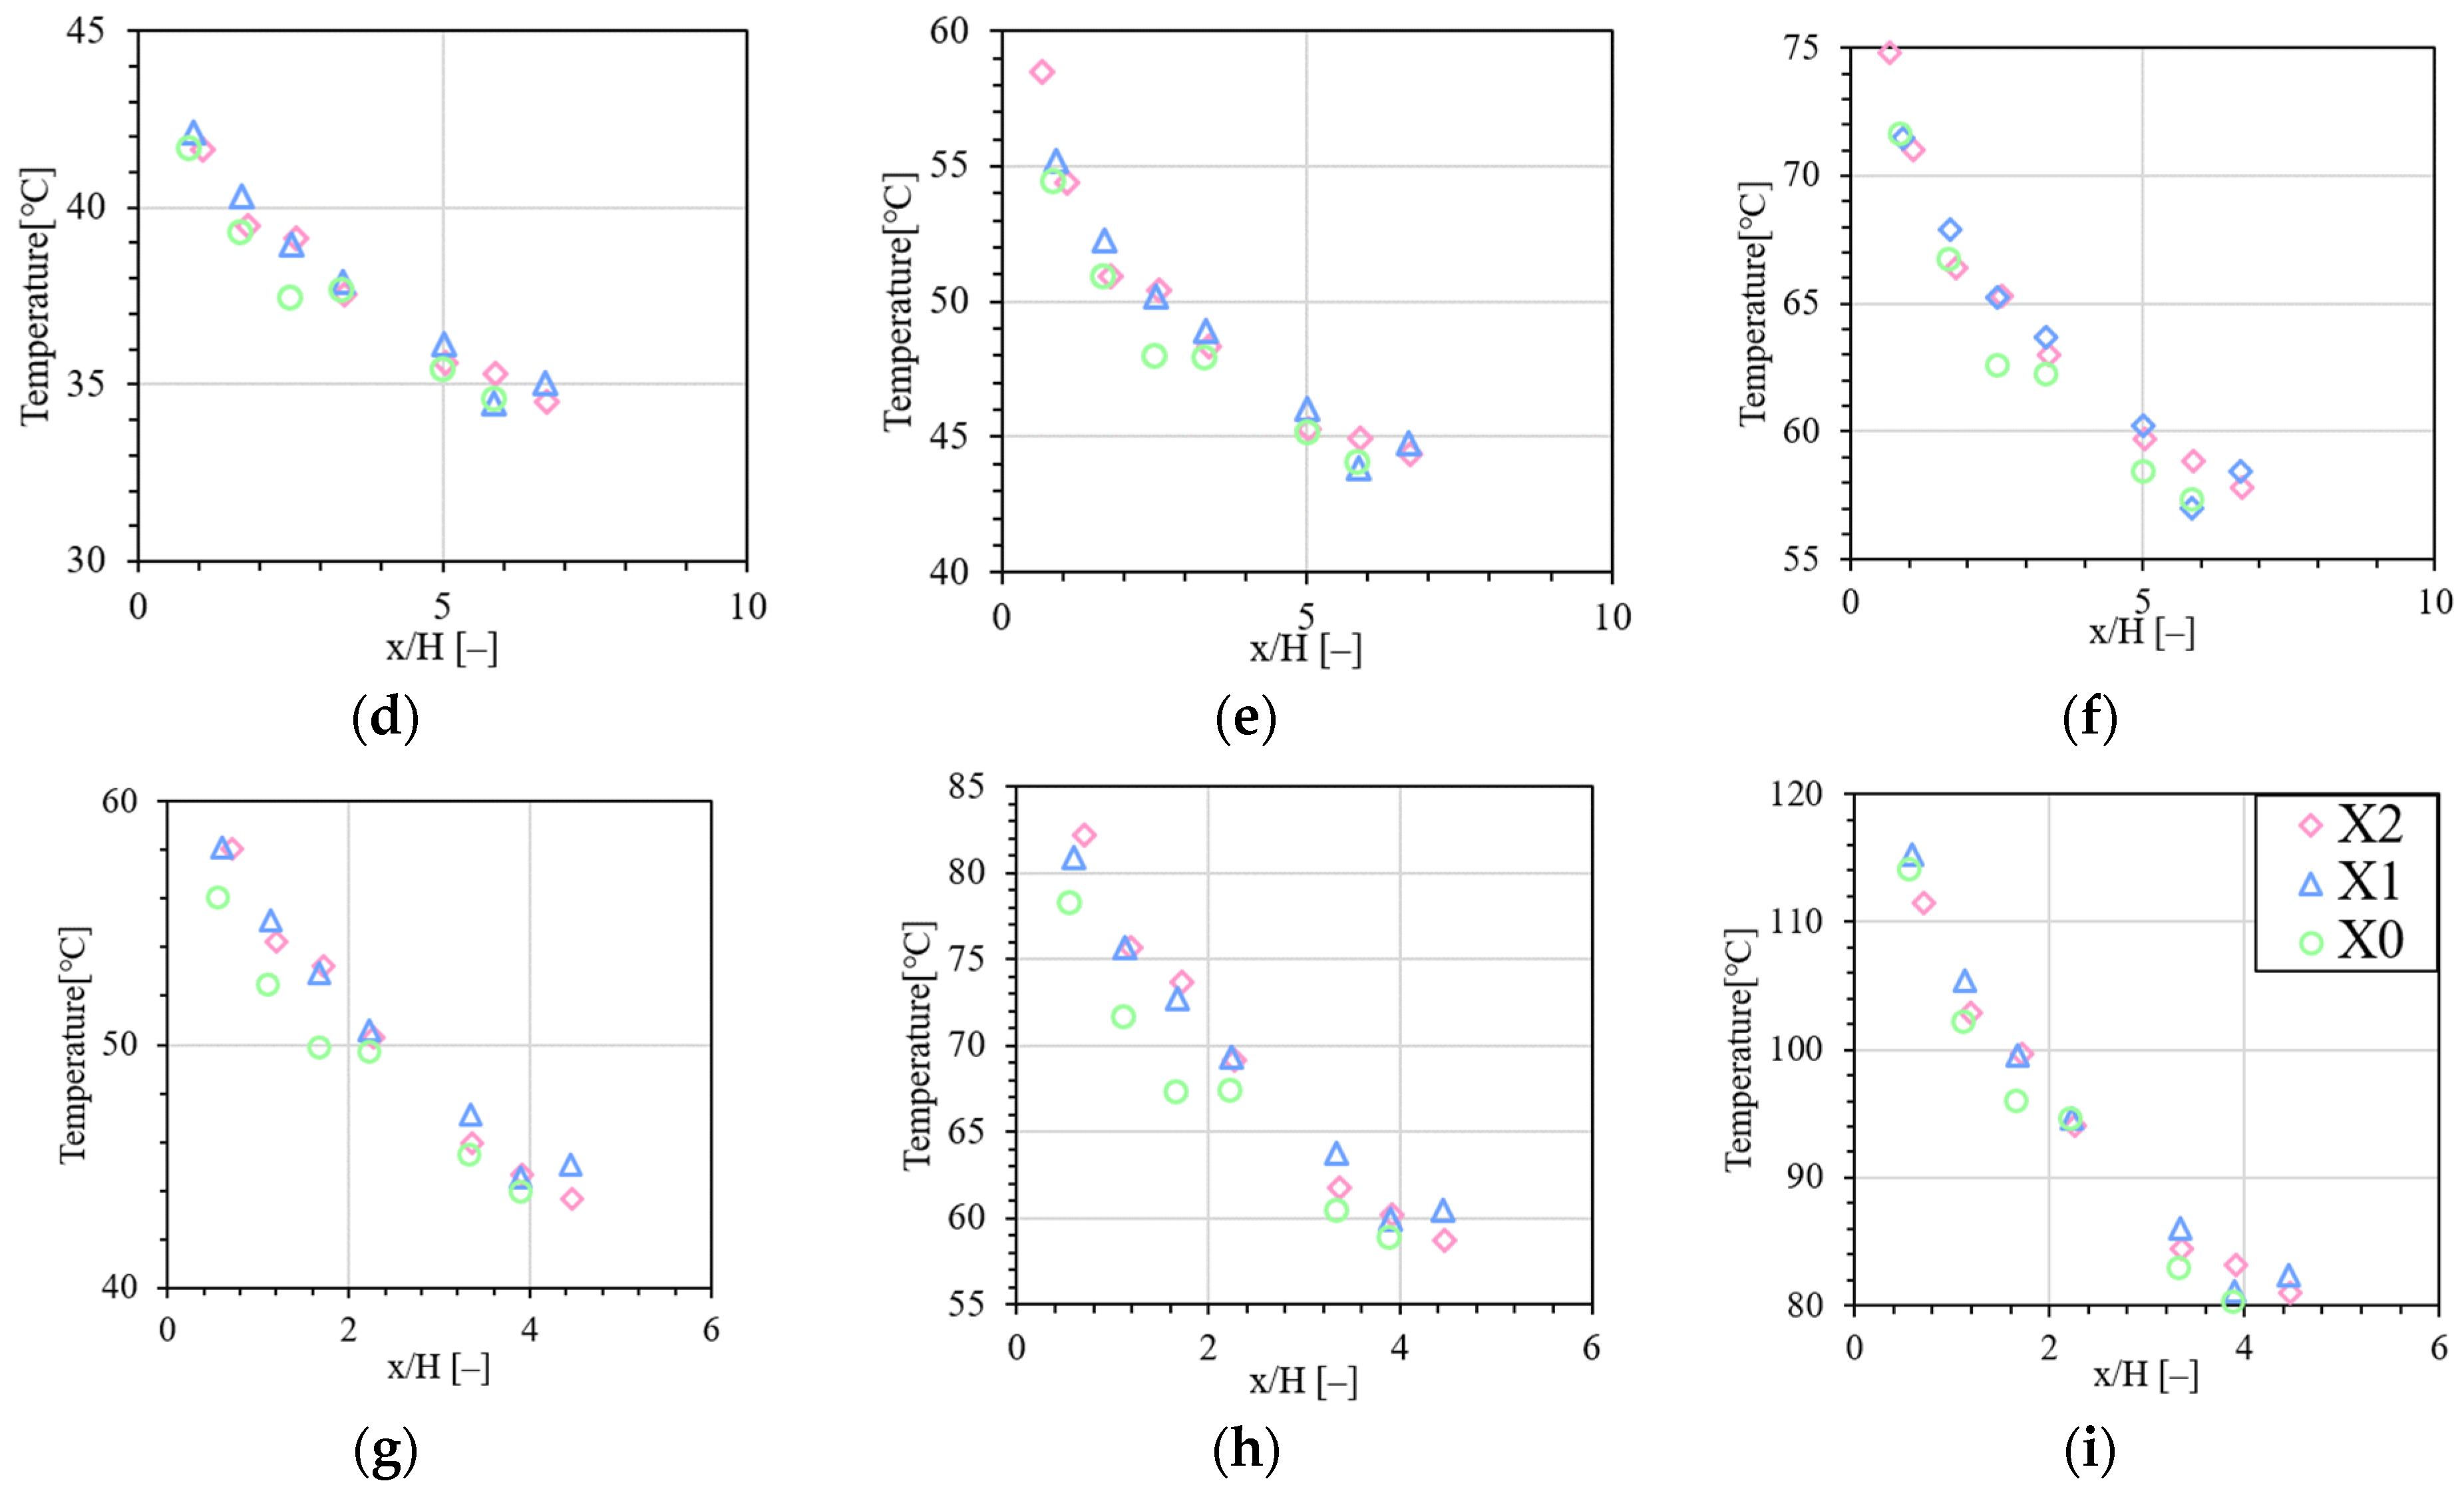
3.3. Horizontal Temperature Distribution

Figure 4 shows the temperature characteristics when a 0.4 m 2 fire source is burned at each height. In the trend for each experimental condition, it was confirmed that the lower the ceiling height and the larger the fire source area, the greater the temperature rise.
In addition, at a ceiling height of 1.5 m, the horizontal temperature initially measured approximately 400 °C and then rapidly decreased up to a nondimensional distance of about x/H ≈ 2.0, after which it showed a gradual decline. This observation suggests that when the ceiling height is low, the ceiling jet is directly influenced by the flame up to x/H ≈ 2.0, while beyond this point, the temperature can be considered to represent the ceiling jet itself rather than the direct influence of the flame. Therefore, as described in Section 3.2, this study focused on analyzing regions not directly affected by the flame generated from the fire source. Here, H   [ m ] represents the ceiling height, and x   [ m ] represents the horizontal distance.
Figure 5 shows the x-axis temperature of the ceiling jet flowing in the middle and on both sides of the corridor when the height and heat release rate of the ceiling change. Here, the x-axis means the length (L) direction. According to the experimental results, the ceiling jet temperature along both corners of the corridor was found to be slightly higher than that along the centerline. This is considered to be due to the ceiling jet lingering near the wall areas.

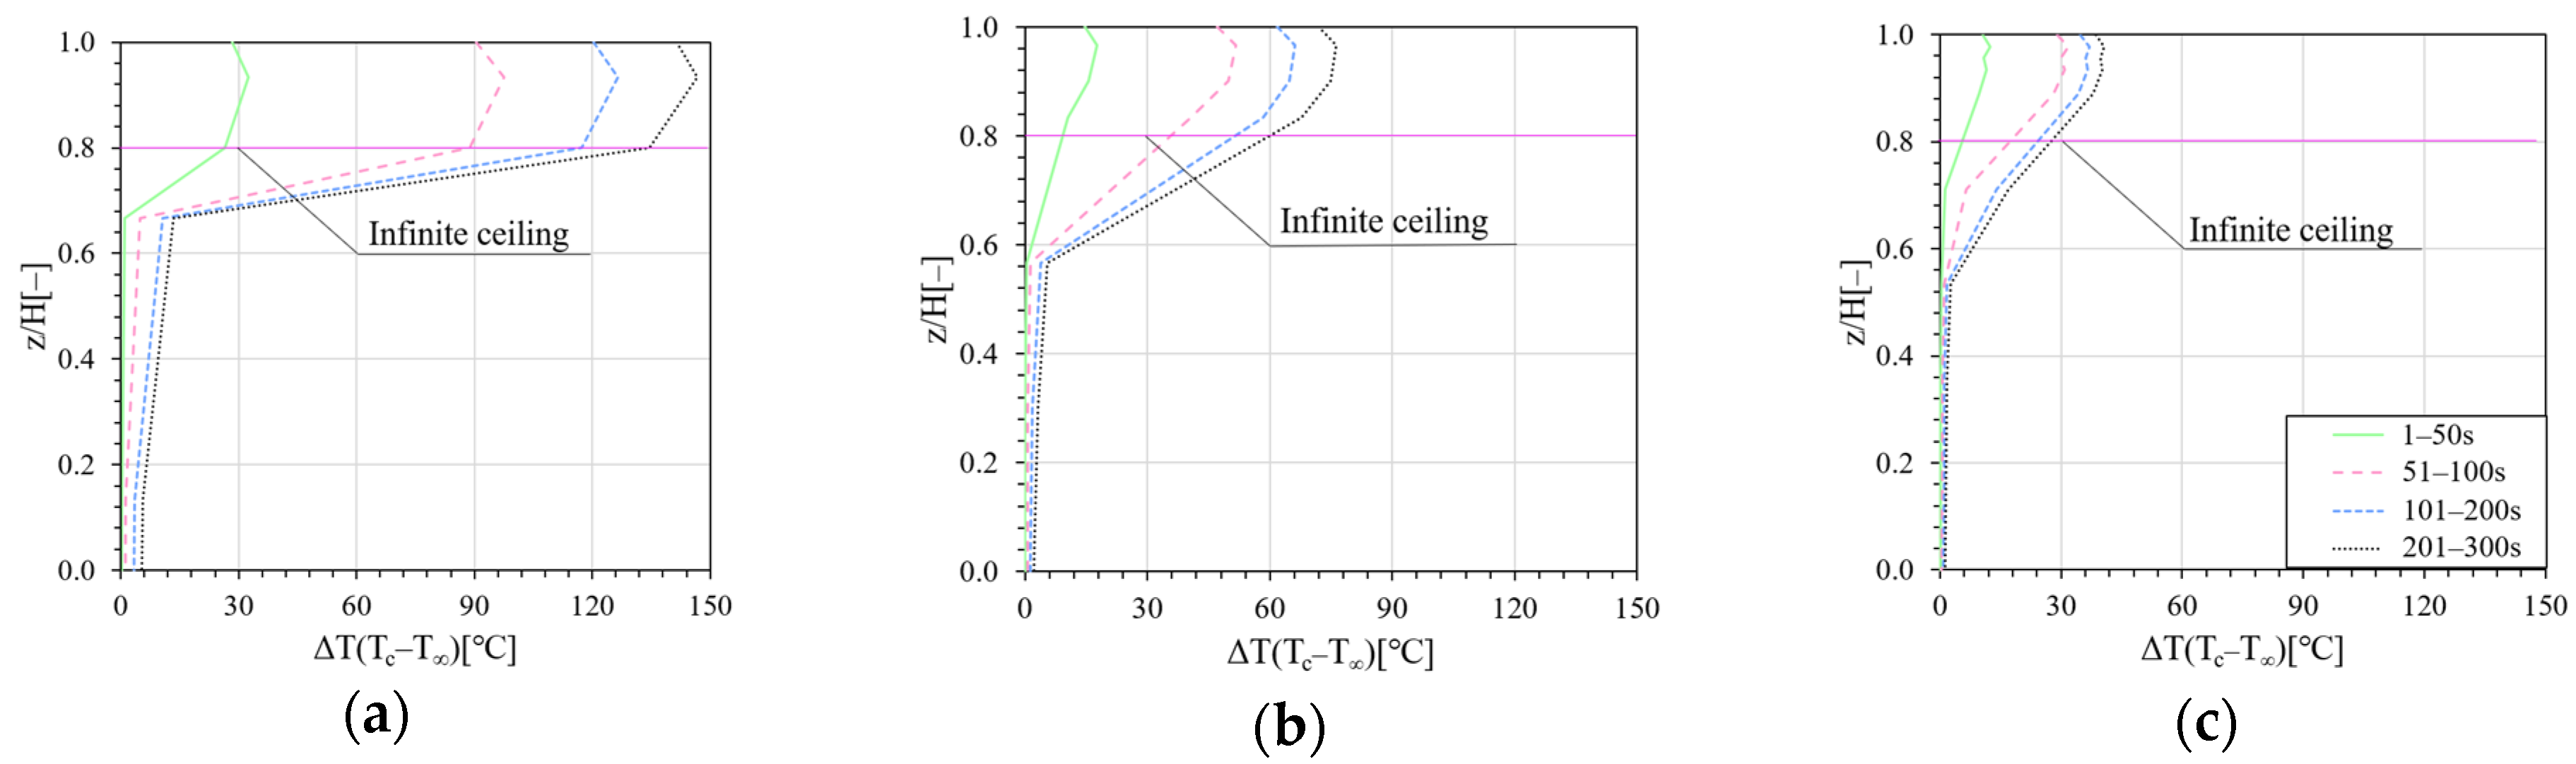
3.4. Vertical Temperature Distribution

Figure 6 shows the vertical temperature distribution as a function of dimensionless height ( z / H ) for a fire source area of A = 0.4 m 2 . It can be seen that as the ceiling height increases, the temperature rise near the ceiling becomes less significant. Additionally, the temperature begins to increase from approximately z / H = 0.6. Typically, the thickness of the ceiling jet during its diffusion process is reported to range from 10% to 30% of the total ceiling height [18]. However, in a corridor space with walls, the height of the temperature-rise region appears to be lower. This phenomenon is attributed to the fire plume continuously impinging on the adjacent walls and subsequently remaining beneath the ceiling jet, leading to an accumulation of hot gases. Consequently, in corridor spaces, the thickness of the smoke layer is approximately 10–20% greater than in open spaces. Here, z   [ m ] is the vertical distance from the floor to the measurement point.

4. Discussion

4.1. Temperature Prediction of Ceilling Flow During Smoke Inflow to the Lower Part

According to the energy conservation equation, the temperature of the ceiling flow can be calculated through Equation (2) derived through the following process. Equation (2) was derived based on the concept illustrated in Figure 7. It is based on the idea that, beneath the ceiling jet, there exists not only an air layer but also a gas layer that includes both the ceiling jet and the surrounding air. Where Q w   [ k W ] is the amount of heat dissipation lost through the ceiling. However, we will ignore it here [19,20].
x Q f Q w + C p m c + m f T = C p m c + m f T c
Q w = Q c T s T w A s
C p m c + m f T c T = 1 x Q f
T c T = 1 x Q f c p ( m c + m f )
It is thought that the temperature of the smoke layer below the ceiling flow will be affected. Therefore, if the lower gas layer flows in and is affected by the smoke temperature T s [ ° C ] , and assuming that this is the average temperature, the ceiling jet temperature T c [ ° C ] is the fire source heat release rate Q f [ k W ] and the ceiling flow rate m c   [ k g / s ] , it can be calculated through the relational Equation (3):
T c ( T s T ) = Q f c p ( m c + m f )
Here, if ( T s T ) [ ° C ] is calculated as the smoke layer average temperature T s ¯   [ ° C ] , according to the mass conservation equation, the heat release rate Q f   [ k W ] and plume mass rate m p [ k g / s ] can be calculated using the relational Equation (4). Here, χ is the heat loss factor, and c p [J/(kg·K)] is the specific heat of the plume.
T s ¯ = ( 1 χ ) Q f ( c p m p )
Here, ceiling jet mass rate m c k g / s can be expressed by Equation (5), and the plume mass rate m p k g / s is expressed by Equation (6) [21,22] as follows:
m c = 1 + 1.66 r H 0.65 m p
m p = 0.08 Q 1 / 3 H 5 / 3
Figure 8 compares the values derived from the predictive Equation (3), which was obtained from the energy conservation equation, with the experimental results. Figure 8a–c correspond to ceiling heights of 1.5 m , 3.0 m, and 4.5 m , respectively. The results indicate that for a ceiling height of 1.5 m , the predicted values were higher than the experimental results, whereas for 4.5 m , the predicted values were lower. In the case of a 3.0 m ceiling height, the predicted and experimental values were nearly identical. These findings suggest that to accurately estimate the temperature distribution of the ceiling jet in corridor-like spaces, the height parameter must be precisely defined.

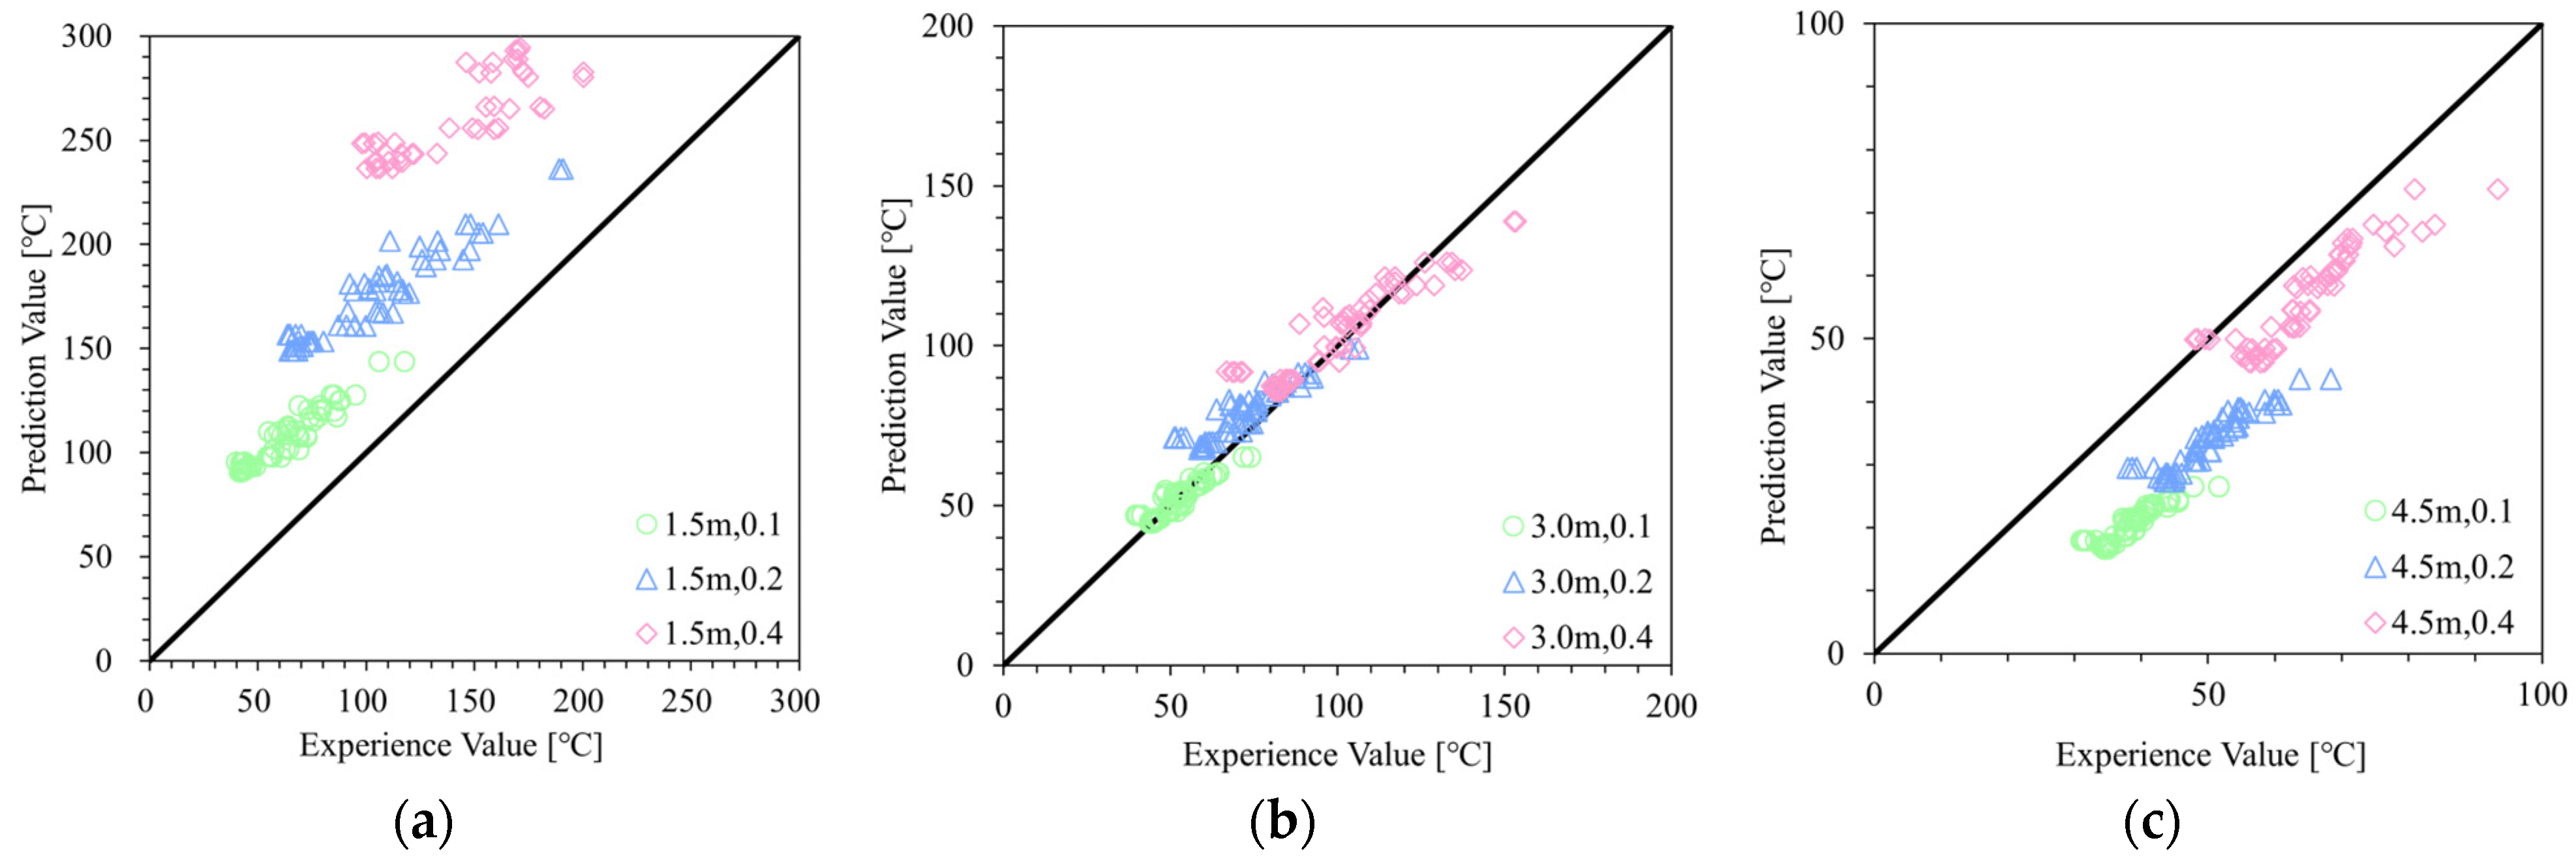
4.2. Review of Prediction Equation Through Conparison with Experimental Values

Oka’s extensively discussed the temperature prediction of ceiling jets along the ceiling axis of a corridor; however, his study focused solely on predicting the temperature along the central ceiling axis, without addressing the temperature distribution near the walls. In this study, we did not propose a theoretical model for predicting ceiling surface temperatures. Instead, we evaluated the predictability of ceiling jet temperatures adjacent to the wall by comparing them with existing predictive formulas. To analyze the temperature distribution characteristics based on dimensionless distance, we examined experimental data under varying heat release rates and ceiling heights using Oka’s equations for regions 2 and 3 [5].
  • Region 2:
T m a x / T Q c * 2 / 3 = 3.462 l b H 1 / 3 1 + 0.6765 l b H 1 / 3 x H l b H 1 / 2
Region 2:
( T m a x ) / T Q c * 2 3 = 3.074 l b H 1 / 3 e x p 3.220 · S t x H l b H 1 / 3
However, the definition of T c * and Q c * is as follows [23,24]:
T c * = T c T / Q * 2 / 3
Q * = Q c p ρ T g H 5 / 2
Here, T m a x   [ K ] is the maximum temperature; T   [ K ] is the ambient temperature; l b   [ m ] is the half-width of the tunnel; H   [ m ] is the height; x   [ m ] is the horizontal distance; Q c   [ k W ] is the convective heat release rate; S t   [ ] is the Stanton number; and R i   [ ] is the Richardson number.
Figure 9 shows the dimensionless temperature distribution as a function of dimensionless distance under varying heat release rates and ceiling heights. This study compares the experimental results with the equations proposed by Oka [5].
However, Oka’s experiments were conducted in a tunnel space where Regions 2 and 3 could be clearly distinguished. In contrast, due to the relatively short length of the space used in this study, it was difficult to distinctly separate these regions. Specifically, as the primary aim of this research was to analyze temperature distributions in corner areas, clearly defining the regions was not significantly important. Thus, Oka’s temperature prediction equations for Regions 2 and 3 were extended to infinity for comparison. Here, Region 2 refers to the turbulent diffusion region, where the fire plume impinges on the ceiling and begins to spread, while Region 3 refers to the laminar region, where the ceiling jet spreads calmly along the ceiling. In Figure 9a, the temperature attenuation trend closely aligns with the predictions from Equation (8), exhibiting characteristics of Region 3, which corresponds to a calm laminar flow region. In Figure 9c, the temperature decay trend is similar to that predicted by Equation (7) for x/H < 5, while in Figure 8b, it follows Equation (7) for x/H > 5. Although Figure 9b,c do not perfectly match Oka’s equation, they show a similar attenuation trend in higher regions [5].
Notably, the position of the density jump appears to be influenced by the height of the space or the fire source, as indicated by variations in the predictive equations with changes in ceiling height. Additionally, in all experimental conditions, the dimensionless temperature at X2 is consistently higher than at X0, suggesting that the temperature of the ceiling jet near the wall is higher than that along the central ceiling axis in a corridor space. This finding highlights the need to consider the spatial distribution of temperature when designing sprinkler heads or fire detectors in corridor environments, ensuring optimal placement based on localized temperature characteristics.
However, it should be noted that this study employed an iron plate with low thermal insulation performance. Further investigations are required to assess the impact of insulation in future studies.

5. Conclusions

To analyze the temperature characteristics of ceiling jets distributed across the entire ceiling of a corridor, experiments were conducted with heat release rate and ceiling height as variables. In addition, the predictive equation derived from the energy conservation law was compared with the experimental results and existing equations proposed in previous studies.
The predictive equation based on the energy conservation law showed an exact match with the experimental data when the ceiling height was 3.0 m. However, it tended to overestimate the temperature by an average of 168% when the ceiling height was 1.5 m and underestimate it by an average of 70% when the height was 4.5 m.
The prediction method proposed in this study showed significant variations in accuracy depending on geometric factors such as the corridor ceiling height. Therefore, future research should focus on developing a reliable method for predicting ceiling jet temperatures in corridors with diverse geometries.
The temperature gradually decreased along the ceiling axis of the corridor, showing a similar attenuation trend to previous studies. However, at the edges of the corridor, the dimensionless temperature was up to 71% higher than at the center. This phenomenon is likely due to the continuous entrainment of the hot smoke layer into the ceiling jet near the walls and ceiling, resulting in less mixing with ambient air at the edges compared to the center, and thus higher temperatures. Therefore, this factor should be considered when designing fire protection systems or sprinkler heads installed near the edges of corridors and tunnels. However, since the temperature difference is relatively moderate, further experimental validation is recommended.

Author Contributions

Conceptualization, O.K. and Y.K. (Youngjin Kwon); methodology, Y.K. (Yunseong Kim); investigation, H.K.; writing—review and editing, Y.K. (Yunseong Kim); visualization, Y.K. (Yunseong Kim); supervision, O.K.; project administration, O.K. All authors have read and agreed to the published version of the manuscript.

Funding

This work was supported by the Korea Agency for Infrastructure Technology Advancement (KAIA) grant funded by the Ministry of Land, Infrastructure and Transport (Grant RS-2022-00156237).

Informed Consent Statement

Not applicable.

Data Availability Statement

The data used to support the findings of this study are available from the corresponding author upon request.

Conflicts of Interest

The authors declare no conflicts of interest.

References

  1. Alpert, R.L. Turbulent Ceiling-Jet Induced by Large-Scale Fires. Combust. Sci. Technol. 1975, 11, 197–213. [Google Scholar] [CrossRef]
  2. Alpert, R.L. Calculation of Response Time of Ceiling-Mounted Fire Detectors. Fire Technol. 1972, 8, 181–195. [Google Scholar] [CrossRef]
  3. Suzuki, K. Extending of Ceiling Jet Model to Unsteady Cases in Large Spaces. J. Environ. Eng. 2012, 77, 223–230. [Google Scholar] [CrossRef]
  4. Quintiere, J.G.; Rinkinen, W.J.; Jones, W.W. The Effect of Room Openings on Fire Plume Entrainment. Combust. Sci. Technol. 1981, 26, 193–201. [Google Scholar] [CrossRef]
  5. Oka, Y.; Oka, H. Velocity and temperature attenuation of a ceiling-jet along a horizontal tunnel with a flat ceiling and natural ventilation. Tunn. Undergr. Space Technol. 2016, 56, 79–89. [Google Scholar] [CrossRef]
  6. Li, L.; Cheng, X.; Wang, X.; Zhang, H. Temperature distribution of fire-induced flow along tunnels under natural ventilation. J. Fire Sci. 2012, 30, 122–137. [Google Scholar] [CrossRef]
  7. Hu, L.H.; Huo, R.; Li, Y.Z.; Wang, H.B.; Chow, W.K. Full-scale burning tests on studying smoke temperature and velocity along a corridor. Tunn. Undergr. Space Technol. 2005, 20, 223–229. [Google Scholar] [CrossRef]
  8. Hu, L.H.; Huo, R.; Wang, H.B.; Li, Y.Z.; Yang, R.X.; He, W.H. Full scale experiments on studying smoke spread in a road tunnel. In Proceedings of the 8th International Symposium. International Association for Fire Safety Science, Beijing, China, 18–23 September 2005; pp. 1437–1447. [Google Scholar]
  9. Hu, L.H.; Huo, R.; Wang, H.B.; Li, Y.Z.; Yang, R.X. Experimental studies on fire- induced buoyant smoke temperature distribution along tunnel ceiling. Build. Environ. 2007, 42, 3905–3915. [Google Scholar] [CrossRef]
  10. Hu, L.H.; Chen, L.F.; Wu, L.; Li, Y.Z.; Zhand, J.Y.; Meng, N. An experimental investigation and correlation on buoyant gas temperature below ceiling in a slopping tunnel fire. Appl. Therm. Eng. 2013, 51, 246–254. [Google Scholar] [CrossRef]
  11. Li, S.; Zong, R.; Zhao, W.; Yan, Z.; Liao, G. Theoretical and experimental analysis of ceiling-jet flow in corridor fires. Tunneling Undergr. Space Technol. 2011, 26, 651–658. [Google Scholar] [CrossRef]
  12. Delichatsios, M.A. The flow of fire gases under a beamed ceiling. Combust. Flame 1981, 43, 1–10. [Google Scholar] [CrossRef]
  13. Haowen, T.; Zhisheng, X.; Dongmei, Z. Investigation of the Temperature Beneath Curved Tunnel Ceilings Induced by Fires with Natural Ventilation. Fire 2022, 5, 90. [Google Scholar] [CrossRef]
  14. Shenghao, Z.; Na, M. A Study on the Maximum Temperature of a Ceiling Jet of Asymmetric Dual Strong Plumes in a Naturally Ventilated Tunnel. Fire 2024, 7, 110. [Google Scholar] [CrossRef]
  15. Biteng, C.; Hong, L.; Rui, F.; Xiaoyu, J.; Lizhong, Y. Experimental and Theoretical Investigation of Longitudinal Temperature Attenuation and Smoke Movement in Urban Utility Tunnel Fires. Fire 2024, 7, 113. [Google Scholar] [CrossRef]
  16. Pittam, D.A.; Picher, G. Measurements of Heats of Combustion by Flame Calorimetry. Part 8.-Methane, Ethane, Propane, n-Butane and 2-Methylpropane. J. Chem. Soc. 1972, 68, 2224–2229. [Google Scholar] [CrossRef]
  17. Karlsson, B.; Quintiere, J.G. Enclosure Fire Dynamics; CRC Press: Boca Raton, FL, USA, 2000. [Google Scholar]
  18. Yamaguchi, J.; Muraoka, K. Method to Predict Smoke Diffusion Behavior in the Early Stage of a Fire. Rep. Obayashi Corp. Tech. Res. Inst. 2009, 73, 71–80. [Google Scholar]
  19. Tanaka, T. A Model Multiroom Fire Spread. Fire Sci. Technol. 1983, 3, 105–121. [Google Scholar] [CrossRef]
  20. Andoh, S.; Yamaguchi, J.; Muraoka, K.; Oka, Y. Experimental study on temperature property of ceiling jet Flowing Through the accumulated Thin Smoke Layer. J. Environ. Eng. AIJ 2013, 78, 307–315. [Google Scholar] [CrossRef]
  21. Muraoka, H.; Yamaguchi, J.; Oka, Y. Proceedings of JAFSE Annual Symposium. 2011. Available online: https://www.jafse.org/proceedings (accessed on 13 July 2024).
  22. Zukoski, E.E. Mass Flux In Fire Plumes. Fire Saf. Sci. 1994, 4, 137–147. [Google Scholar] [CrossRef]
  23. Heskestad, G.; Delichatsios, M.A. The Initial Convective Flow in Fire. Proc. Combust. Inst. 1979, 17, 1113–1123. [Google Scholar] [CrossRef]
  24. Zukoski, E.E.; Kubota, T.; Categen, B. Entrainment in fire plumes. Fire Saf. J. 1981, 3, 107–121. [Google Scholar] [CrossRef]
Figure 1. Experimental setup overview [unit: mm].
Fire 08 00181 g001
Figure 2. Heat release rate calculation results.
Fire 08 00181 g002
Figure 3. The temperature variation over time is shown for a fire source area of 0.4 m 2 . Panel (a) corresponds to H = 1.5 m , (b) to H = 3.0 m , and (c) to H = 4.5 m .
Fire 08 00181 g003
Figure 4. This figure illustrates the horizontal temperature distribution according to dimensionless distance for a fire source area of 0.4 m 2 . Panel (a) corresponds to H = 1.5 m , (b) to H = 3.0 m , and (c) to H = 4.5 m .
Fire 08 00181 g004
Figure 5. This figure represents the temperature distribution in each region according to dimensionless distance. Here, X0 denotes the temperature distribution of the ceiling jet along the central axis, while X2 represents the temperature distribution of the ceiling jet along the sidewall. X1 lies between X0 and X2. (a) H = 1.5 m /Af = 0.1 m2; (b) H = 1.5 m/Af = 0.2 m2; (c) H = 1.5 m/Af = 0.4 m2; (d) H = 3.0 m/Af = 0.1 m2; (e) H = 3.0 m/Af = 0.2 m2; (f) H = 3.0 m/Af = 0.4 m2; (g) H = 4.5 m/Af = 0.1 m2; (h) H = 4.5 m/Af = 0.2 m2; (i) H = 4.5 m/Af = 0.4 m2.
Fire 08 00181 g005aFire 08 00181 g005b
Figure 6. This figure illustrates the vertical temperature distribution according to dimensionless height for a fire source area of 0.4 m2. Panel (a) corresponds to H=1.5 m, (b) =3.0 m, and (c) to H = 4.5 m.
Fire 08 00181 g006
Figure 7. Schematic illustrating the entrainment of smoke from the air and gas layers into the ceiling jet and its effect on the ceiling jet temperature, based on the conservation of energy. Here, Q w   [ k W ] is the energy loss to the ceiling; Q f   [ k W ] is the heat release rate of the fire source; m f   [ k g / s ] is the mass flow rate from the fire source; m c   [ k g / s ] is the mass flow rate of the ceiling jet; T   [ K ] is the ambient temperature; T s   [ K ] is the gas layer temperature; T c   [ K ] is the ceiling jet temperature; and x   [ m ] is the horizontal distance from the fire centerline.
Fire 08 00181 g007
Figure 8. The figure shows the comparison between the predicted value and the experimental value. Panel (a) is the ceiling height of 1.5 m, (b) is the ceiling height of 3.0 m, and (c) is the ceiling height of 4.5 m.
Fire 08 00181 g008
Figure 9. The figure shows the temperature distribution result according to dimensionless distance. Panel (a) is the experimental result value when H = 1.5 m; panel (b) is H = 3.0 m; and panel (c) is H = 4.5 m.
Fire 08 00181 g009
Table 1. Conditions of the experiment.
Ceiling Height H [ m ] Fire Source Area A [ m 2 ]
1.50.1/0.2/0.4
3.00.1/0.2/0.4
4.50.1/0.2/0.4
Disclaimer/Publisher’s Note: The statements, opinions and data contained in all publications are solely those of the individual author(s) and contributor(s) and not of MDPI and/or the editor(s). MDPI and/or the editor(s) disclaim responsibility for any injury to people or property resulting from any ideas, methods, instructions or products referred to in the content.

