Article

Study on the Influence of Expansion Ratio on the Effectiveness of Foam in Suppressing Forest Surface Fires

School of Emergency Management and Safety Engineering, China University of Mining and Technology, Beijing 100083, China
*
Author to whom correspondence should be addressed.
Fire 2025, 8(5), 171; https://doi.org/10.3390/fire8050171
Submission received: 28 March 2025 / Revised: 20 April 2025 / Accepted: 23 April 2025 / Published: 28 April 2025
(This article belongs to the Special Issue Firefighting Approaches and Extreme Wildfires)

Abstract

:
Firefighting foam is widely recognized for its excellent fire suppression performance. However, research on the effect of foam expansion ratio on the suppression efficiency of forest surface fires remains limited. In this study, the expansion ratio was adjusted by varying the air-to-liquid ratio in a compressed air foam system, and laboratory-scale foam suppression experiments were conducted. Key performance indicators, including extinguishing coverage time, internal cooling rate, and resistance to reignition, were systematically measured. The effects of expansion ratio on the diffusion and penetration behavior of foam on the fuel bed surface were then investigated to understand how these characteristics influence suppression performance. The results indicate that both excessively low and high expansion ratios can weaken fire suppression effectiveness. Low-expansion foam, characterized by low viscosity and high water content, exhibits strong local penetration and cooling capabilities. However, it struggles to rapidly cover the fuel bed surface and isolate oxygen, thereby reducing the overall suppression efficiency. In contrast, high-expansion foam has greater viscosity, allowing it to spread across the fuel bed surface under pressure gradient forces and form a stable coverage layer, effectively limiting the oxygen supply required for combustion. However, its limited depth penetration and lower water content reduce internal cooling efficiency, increasing the risk of reignition. The optimal expansion ratio was determined to be 15.1. Additionally, increasing the liquid supply flow rate significantly improved suppression performance; however, this improvement plateaued when the flow rate exceeded 10 L/min.

1. Introduction

Forests, as a vital component of the Earth’s ecosystem, play an essential role in maintaining ecological balance, protecting biodiversity, and supporting human life [1,2,3]. However, frequent and abnormal forest surface fires not only severely damage the ecological environment, but also pose a significant threat to the safety of firefighters [4,5,6]. Therefore, efficiently suppressing forest surface fires has become a critical issue that needs to be addressed. The firefighting foam has received widespread attention in recent years due to its excellent firefighting performance [7,8,9,10]. However, there is currently a lack of systematic evaluation of the application of firefighting foam in forest surface fires, particularly regarding the impact of foam expansion ratio on suppression effectiveness. Therefore, studying the influence of foam expansion ratio on the suppression performance of forest surface fires is of significant importance for precise forest fire suppression and alleviating the safety and environmental issues caused by fires.
The application of firefighting foam in forest fires primarily relies on its efficient utilization of limited water resources. Previous studies have demonstrated the superior performance of foam in firefighting, whereas relying solely on water has proven relatively less effective in similar fire scenarios [9,11,12,13]. In particular, compressed air foam has shown remarkable effectiveness in suppressing wood-based fires. The compressed air foam is generated by injecting compressed air into the foam solution [14,15,16]. The device used to produce firefighting foam is referred to as a compressed air foam system (CAFS). CAFS offers several significant advantages in fire suppression, such as: ① the ability to adjust the foam expansion ratio, providing high operational flexibility. ② Reduced water consumption, which is particularly critical in remote or arid regions. ③ Production of foam with uniform bubble size and excellent stability. However, it is important to acknowledge that CAFS also has certain limitations, including the following: ① greater system complexity compared to traditional setups, requiring skilled operation and regular maintenance to ensure optimal performance. ② Inaccessibility in rugged or mountainous terrains where transportation is difficult, potentially limiting the deployment of CAFS equipment. Tim et al. [17] compared the extinguishing performance of water, water with foam agent, nozzle-aspirated foam, and compressed air foam using 5A wood cribs and a small firefighting system with a flow rate of 1.4 L/min. Their results indicated that compressed air foam exhibited the highest extinguishing efficiency. Similarly, Huang et al. [18] found that both compressed air foam and water gel extinguishing agents effectively suppressed 2A wood crib fires, with increased driving pressure further enhancing cooling capacity. Dai et al. [19] also highlighted the superior extinguishing performance of compressed air foam and water gel in wood crib fire experiments. These studies have validated the significant advantages of foam in suppressing wood-based fires. However, research on the application of foam to suppress forest surface fires caused by fallen leaves remains relatively limited. Forest fires are typically categorized into underground fires, surface fires, and crown fires, with surface fires being the most common. Current studies often simulate surface fires using fuel beds made from dead pine needles [20,21,22,23,24], providing valuable references for exploring the effect of foam expansion ratios on suppressing forest surface fires. These pine needle fuel beds exhibit typical porous medium characteristics, effectively reflecting the stacking state of forest surface fuel layers. When foam is applied to the fuel bed, its viscosity and flowability vary with the expansion ratio, which in turn influences its surface spreading and internal penetration performance on the porous fuel bed. The surface spreading performance of foam determines whether it can rapidly cover the fuel bed surface and effectively limit oxygen supply, while its internal penetration capacity determines whether the foam can infiltrate deeper into the fuel bed, suppress internal combustion, and achieve cooling. Thus, the extinguishing effects of foam with different expansion ratios may vary significantly. Accordingly, it is necessary to further investigate the influence of expansion ratios on the effectiveness of foam in suppressing forest surface fires.
The foam expansion ratio is largely controlled by the air-to-liquid ratio, which can be adjusted by varying the gas flow and liquid supply rates. Foams with different expansion ratios exhibit varying spreading and cooling capacities during the suppression of oil pool fires, which ultimately determine their extinguishing effectiveness [25,26,27]. For instance, Zhou et al. [28] reported that the air-to-liquid ratio significantly influenced the extinguishing speed of CAFS on oil fires, with higher efficiency observed at an air-to-liquid ratio of 9:1. Chen et al. [29] studied the impact of foam expansion ratios and liquid flow rates on gasoline fire suppression efficiency, showing that foam with an expansion ratio of 10 provided optimal performance, while a liquid flow rate of 3.48 L/(min·m2) achieved the most economical consumption of extinguishing agents. Xu et al. [30] identified an optimal air-to-liquid ratio of 16 for diesel pool fires. Ding et al. [31] investigated the performance of compressed air protein foam with different air-to-liquid ratios on diesel pool fires, finding that higher air-to-liquid ratios increased drainage time and expansion ratios. At an air-to-liquid ratio of 20, the foam achieved an optimal balance between flowability and stability, resulting in the highest suppression efficiency. These studies have provided valuable insights into the effects of foam expansion ratios on oil pool fire suppression. However, systematic research on the influence of foam expansion ratios on the suppression of forest surface fires remains lacking.
To address these issues, this study simulated forest surface fires using a pine needle fuel bed and conducted laboratory-scale foam firefighting experiments by adjusting the air-to-liquid ratio in a CAFS to vary the foam expansion ratio. Key fire suppression performance indicators, including extinguishing coverage time, internal cooling rate, and re-ignition resistance, were measured and analyzed for foams with different expansion ratios. Subsequently, foam spreading and penetration models were developed based on the rheological properties of foam and the porous structure characteristics of the fuel bed. These models were used to investigate how expansion ratio influences foam spreading and penetration behaviors, as well as their impacts on firefighting effectiveness. Finally, the optimal foam expansion ratio for suppressing surface fires was identified using a multi-criteria evaluation approach. Additionally, the critical liquid supply flow rate required to enhance firefighting efficiency was also explored. These findings contribute to the optimization of CAFS application strategies and provide valuable insights for the effective control of forest surface fires.

2. Materials and Methods

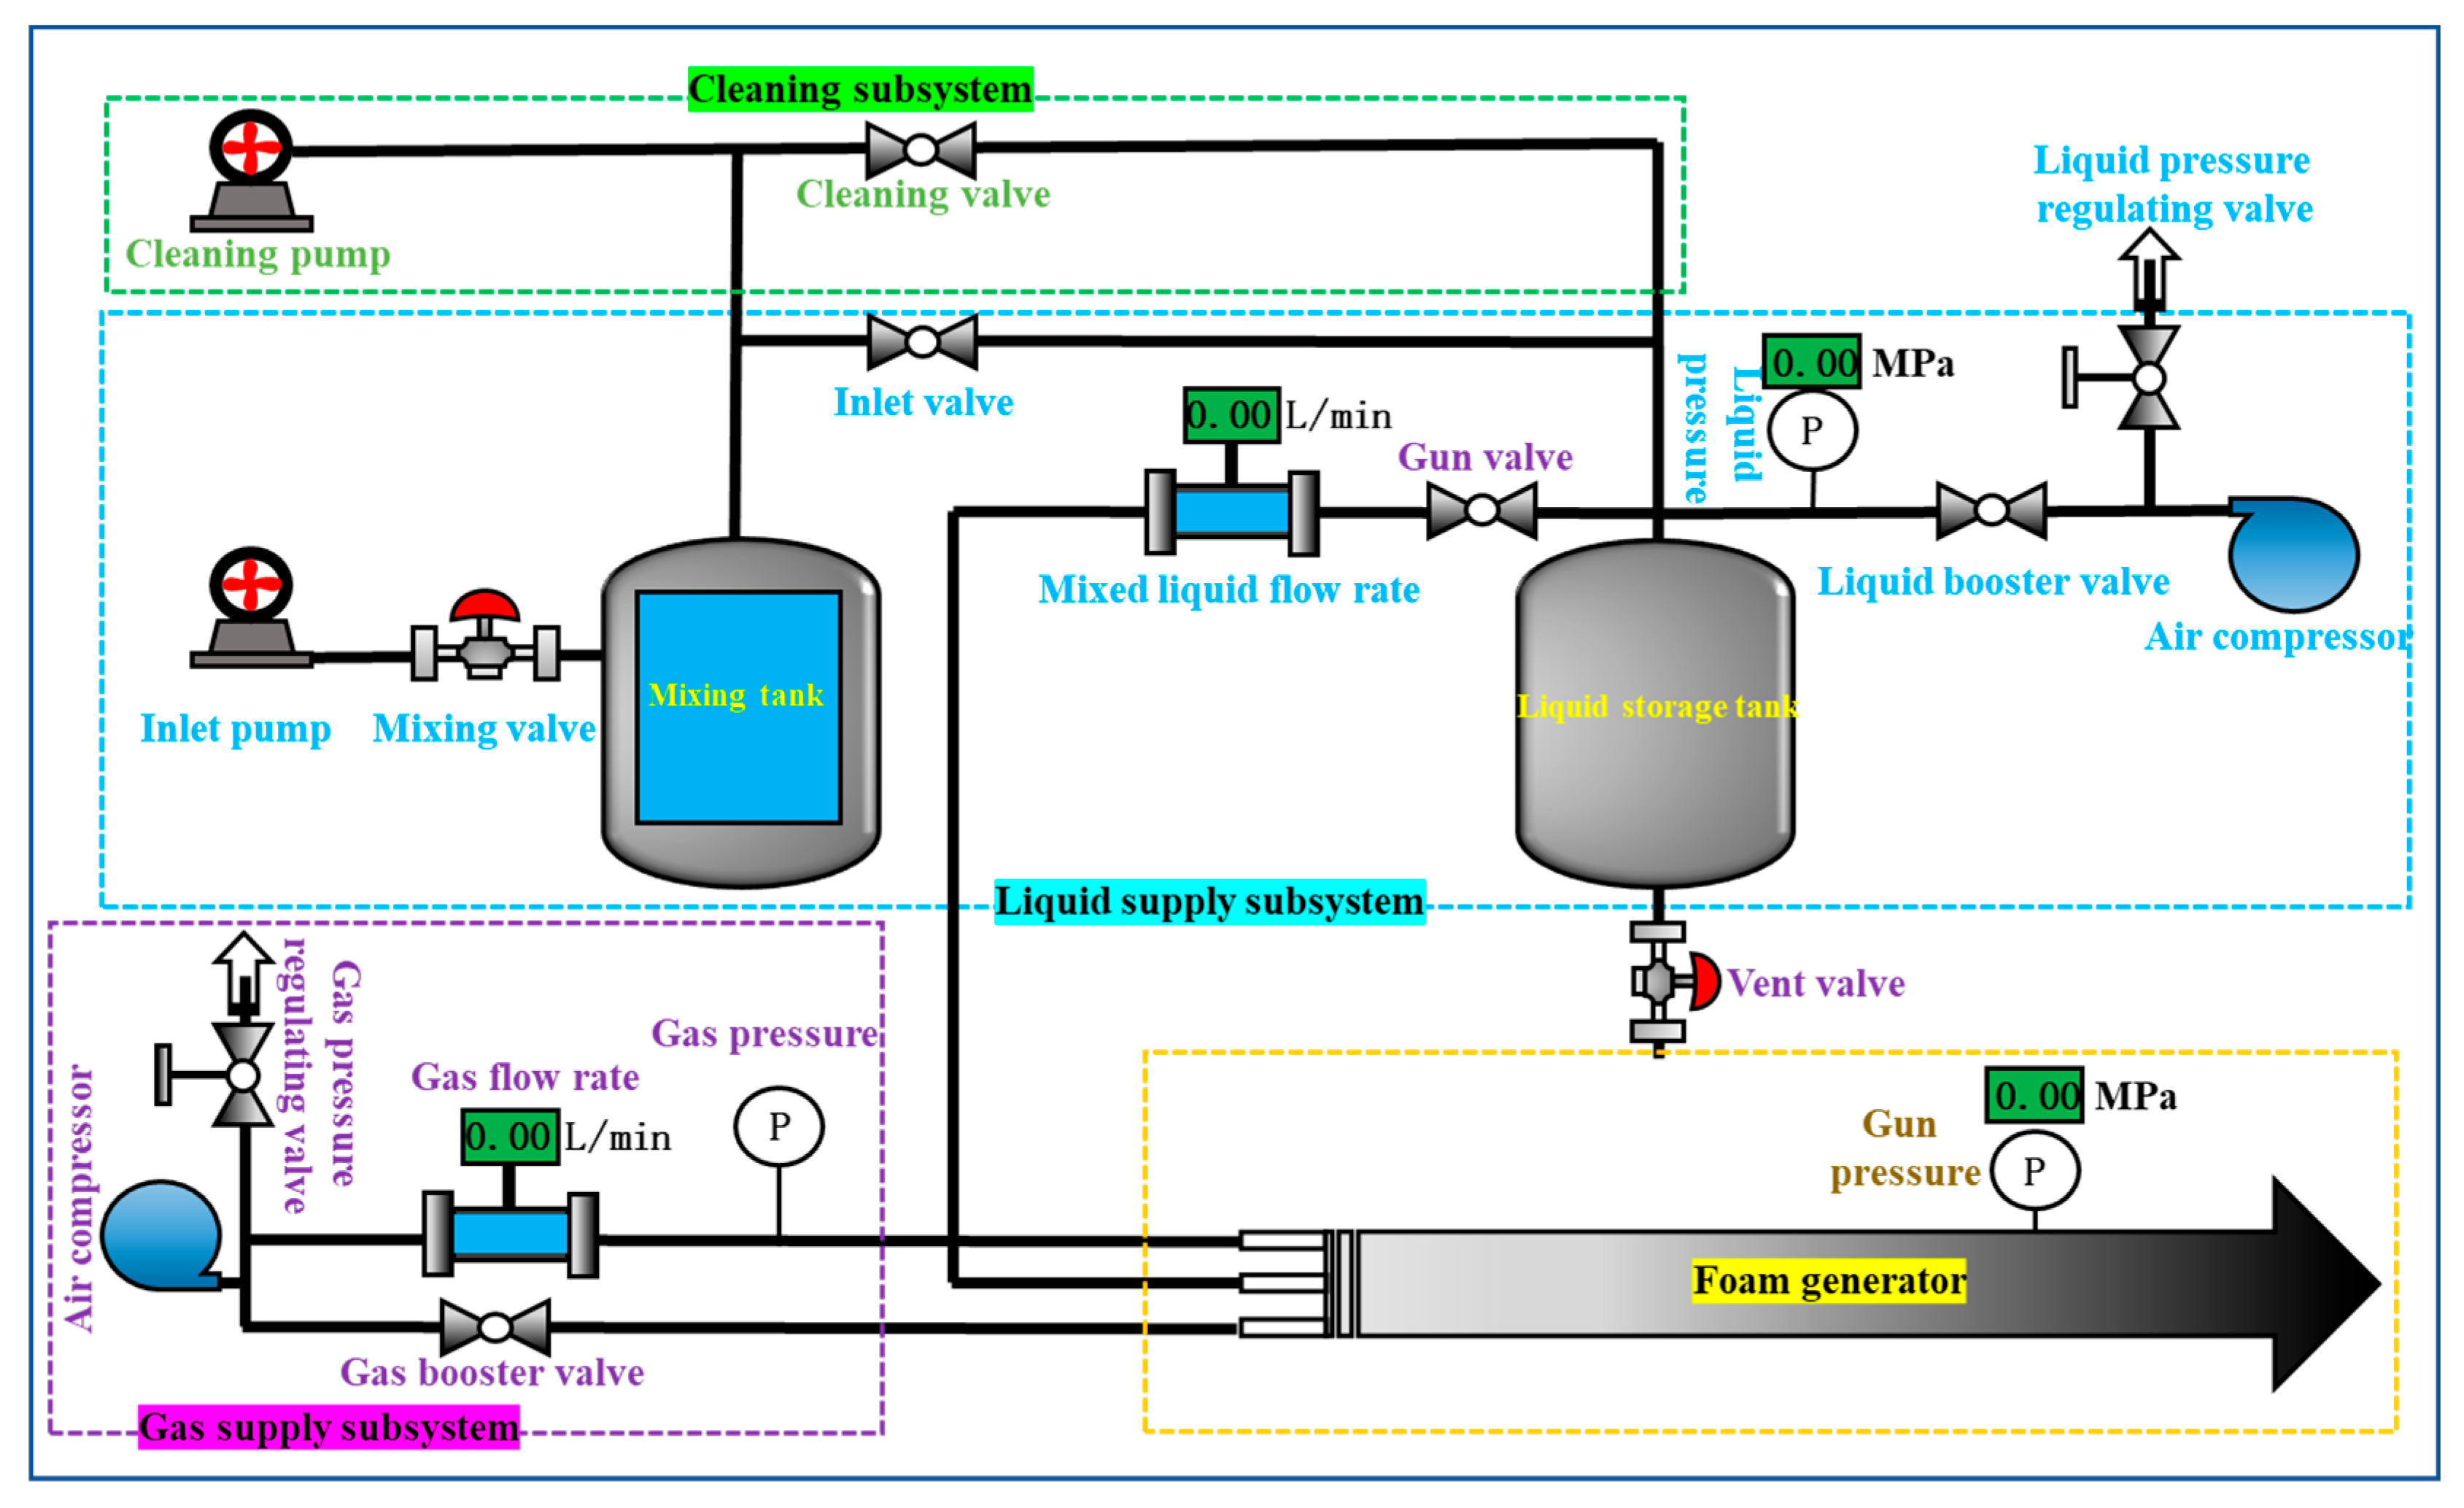
2.1. Foam Generation System

The foam generation system used in this experiment is a CAFS, which generates foam with different expansion ratios by adjusting the air-to-liquid ratio. The system mainly consists of the air supply subsystem, the liquid supply subsystem, the foam generator, and the cleaning subsystem, with the structural diagram shown in Figure 1. The air supply subsystem and the liquid supply subsystem provide compressed air and foam solutions to the foam generator, respectively. The foam generator thoroughly mixes the air and foam solutions to produce foam. The cleaning subsystem is used for cleaning the equipment after use. The specific steps for foam generation are as follows:
(1) Mixing stage: pour the foam solution into the mixing tank. After powering on the device, open the mixing valve and start the mixing pump to thoroughly mix the foam concentrate and water until uniform.
(2) Delivery stage: after mixing, close the mixing valve, open the liquid inlet valve and the liquid pump, and transfer the mixed solution to the storage tank. Then, close the liquid inlet valve and the liquid pump, and start the two air compressors to provide the necessary power for the liquid and air supply.
(3) Foaming stage: by adjusting the ratio of gas flow to liquid flow, foam with different expansion ratios can be obtained. This involves adjusting the liquid pressure valve and the liquid flow regulator to control the liquid flow, while adjusting the gas flow with the gas pressure valve and the gas flow regulator. The liquid and gas flow rates are displayed in real-time on the liquid and gas flow meters on the control panel. After entering the foam generator, the gas and solution mix to generate foam, which is then discharged through a hose.
(4) Cleaning stage: after the experiment is completed, the cleaning subsystem is activated to thoroughly clean the CAFS. The operation includes sequentially starting the cleaning pump, cleaning valve, liquid inlet valve, and drain valve to flush out the residual foam solution and foam, preventing long-term retention that could damage the equipment.

2.2. Experimental Methods

2.2.1. Foam Expansion Ratio

After the foam solution is foamed, it expands into a certain volume of air foam. The foam expansion ratio (N) is defined as the ratio of the foam volume to the volume of the foam solution used. The more gas is provided by the system, the higher the foam expansion ratio. Since the performance of foam varies significantly with different expansion ratios, studying the foam expansion ratio based on surface fire suppression requirements is of great importance. The specific measurement steps are as follows:
(1) Density measurement of foam solution: a certain amount of foam solution is poured into a graduated cylinder, and the volume of the solution is recorded. The weight of the cylinder (including the liquid) is then measured. After subtracting the mass of the empty cylinder, the density ( ρ ) of the foam solution is calculated.
(2) Container volume measurement: after cleaning and drying the foam collection container, it is weighed on an electronic scale (record the mass as m1). The container is then filled with water, and its mass is measured again. The mass of the water is calculated by subtracting the empty container mass. Since the density of water is 1.0 kg/L, the mass of the water is equal to the container’s volume (V).
(3) Foam volume measurement: once the foam output at the nozzle stabilizes, the foam is collected using a clean and dried foam collection container. Any foam above the container’s rim is scraped off with a spatula. The foam volume inside the container is equal to the container’s volume (V).
(4) Foam mass measurement: after cleaning the residual foam from the container’s outer surface, the container is weighed again (record the mass as m2).
(5) Result reproducibility verification: the test is repeated twice to reduce measurement errors, and the foam expansion ratio (N) is calculated using the following formula:
N = F o a m   v o l u m e M i x t u r e   v o l u m e = V ( m 2 m 1 ) / ρ

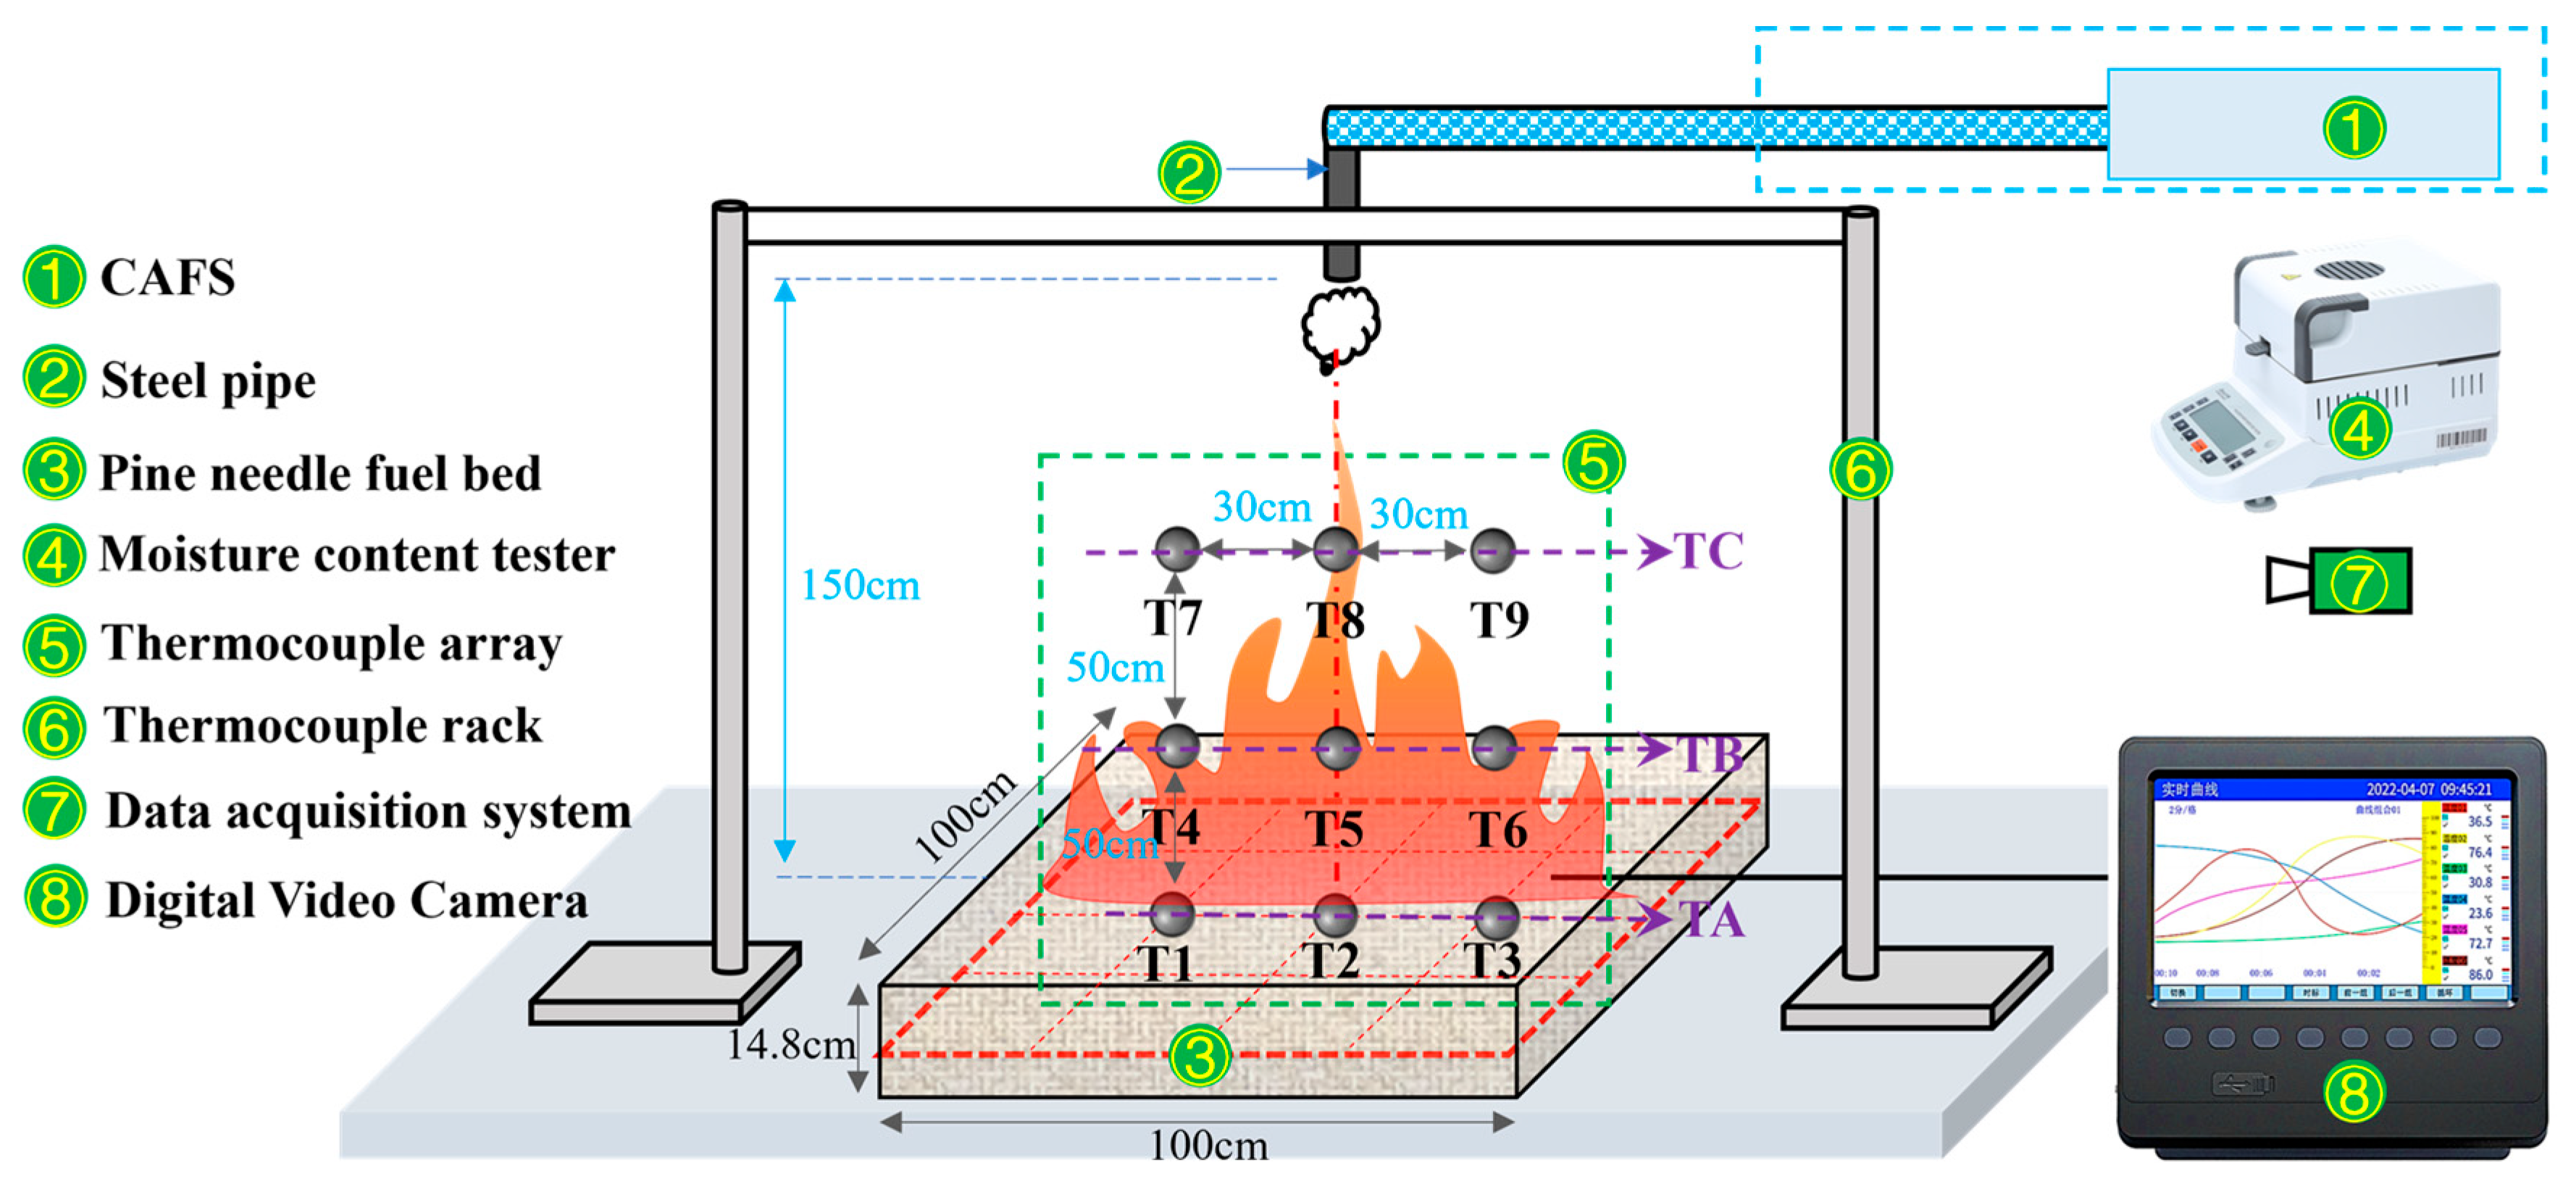
2.2.2. Fire Extinguishing Experiment

The foam firefighting experimental setup consisted of a CAFS, a 1 m long steel pipe, a 1-square-meter pine needle fuel bed, a moisture content tester (LHS-125A, Yixin Scientific Instrument Co., Ltd., Shanghai, China), a thermocouple stand, a thermocouple array (Dongtai Fengteng Automation Instrument Co., Ltd., Yancheng, China), a data logger (Hongrun Precision Instrument Co., Ltd., Shunchang, Fujian, China), and a DV camera (FDR-AX60, Sony China Co., Ltd., Beijing, China), as shown in Figure 2. The CAFS is responsible for generating the foam, which is delivered through a PVC hose. To prevent the flame from damaging the hose, the hose is connected to a steel pipe, with the outlet at the other end of the pipe aimed directly at the center of the pine needle fuel bed. The foam is then sprayed onto the surface of the fuel bed through the steel pipe outlet. The pine needle fuel bed is used to simulate the forest floor combustible layer, and its basic parameters are listed in Table 1. The fuel used in this experiment was dead Pinus massoniana pine needles.
The moisture content tester is used to measure the moisture content of the pine needles, and the moisture content is controlled to remain consistent through drying, in order to eliminate the influence of moisture on the experimental results. Nine K-type thermocouples, each 1.5 m in length, are suspended and fixed on a thermocouple rack to monitor temperature changes during the fire suppression process. The K-type thermocouples used in this study had a probe diameter of 2 mm, a length of 50 cm, a measurement range of 0~1300 °C, and a response time of approximately 1 s in air. The measurement data are transmitted to the data logger via data cables. The sampling frequency of the data logger was 10 Hz. These thermocouples are divided into three groups (TA, TB, and TC), with each group consisting of three thermocouples, positioned at the same horizontal level. The TA group (T1, T2, T3) is located inside the fuel bed, and the average temperature reading from these thermocouples is used to represent the temperature changes inside the fuel bed. The TB group (T4, T5, T6) is placed 50 cm above the fuel bed, with the average value reflecting the temperature changes at this height. The TC group (T7, T8, T9) is positioned 100 cm above the fuel bed, and its average value is used to characterize the temperature changes at this height. Additionally, a DV camera mounted on the side of the experimental setup is used to record the dynamic changes in the flame shape under the influence of CAF during the fire suppression process.
The main objectives of this experiment are as follows: ① under the condition of a constant liquid flow rate of 11.4 L/min, quantitatively inject CAF with different foam expansion ratios (5, 10, 15, 20, 25) onto a burning 1 m2 fuel bed. The continuous injection time is 60 s. The objective is to assess its suppression effect on surface fires and determine the optimal foam expansion ratio for suppressing surface fires. ② Under the condition of a constant foam expansion ratio of 5, gradually increase the liquid flow rate (4 L/min, 6 L/min, 8 L/min, 10 L/min, 11.4 L/min) and inject continuously until the foam completely covers the fuel bed. The aim is to test its suppression effect on surface fires and determine the minimum liquid flow rate required to extinguish the surface fire per unit area. The experimental ambient temperature is controlled at 28 ± 2 °C, and the experiment is repeated under each condition to improve data reliability. The specific experimental procedure is as follows:
(1) Fuel preparation: the collected dead pine needles are placed under the sun to air-dry, and the moisture content is measured regularly using a moisture content tester. The experiment is conducted when the moisture content of the pine needles reaches 10 ± 1%.
(2) Fuel layout: weigh 3 kg of pine needles and evenly distribute them on a 1 m2 fuel bed. To ensure uniform distribution, divide the fuel bed into 10 equal areas, with each area receiving 10% of the total fuel weight.
(3) Equipment calibration: calibrate the thermocouple’s accuracy using boiling water. If any damage is found, replace the thermocouple immediately.
(4) Data collection preparation: start the data logger and DV camera, ensuring that the equipment is functioning properly.
(5) Ignition: using a spray bottle, evenly apply 10 mm of n-heptane on the surface of the fuel bed, and immediately ignite the fuel bed with a 1 m long ignition stick. The use of n-heptane ensures the rapid ignition of the fuel bed surface.
(6) Pre-burn time measurement: plot the temperature-time curve and use the video footage from the DV camera to determine the time required for the fuel bed to reach maximum combustion intensity. This time is defined as the pre-burn time of the fuel bed.
(7) Foam injection setup: connect the foam delivery hose to a 1 m long steel pipe with a 35 mm inner diameter, and fix the steel pipe vertically above the fuel bed on the thermocouple rack. The outlet of the steel pipe is placed 150 cm above the fuel bed, directly over its center. Fixing the steel pipe prevents experimental errors caused by manual foam injection and avoids damage to the hose from flame contact.
(8) Foam preparation: mix the foam extinguishing agent concentrate with water according to the required ratio, and use the foam generation system to produce foam with the required expansion ratio. Adjust the foam mixture flow rate to meet the experimental conditions.
(9) Extinguishing experiment: repeat steps 2 through 5. When the fuel bed reaches its pre-burn time, immediately inject foam onto the fuel bed through the steel pipe.
(10) Observation phase: after extinguishment, observe the fuel bed for 10 min to check for any rekindling.

3. Experimental Results and Analysis

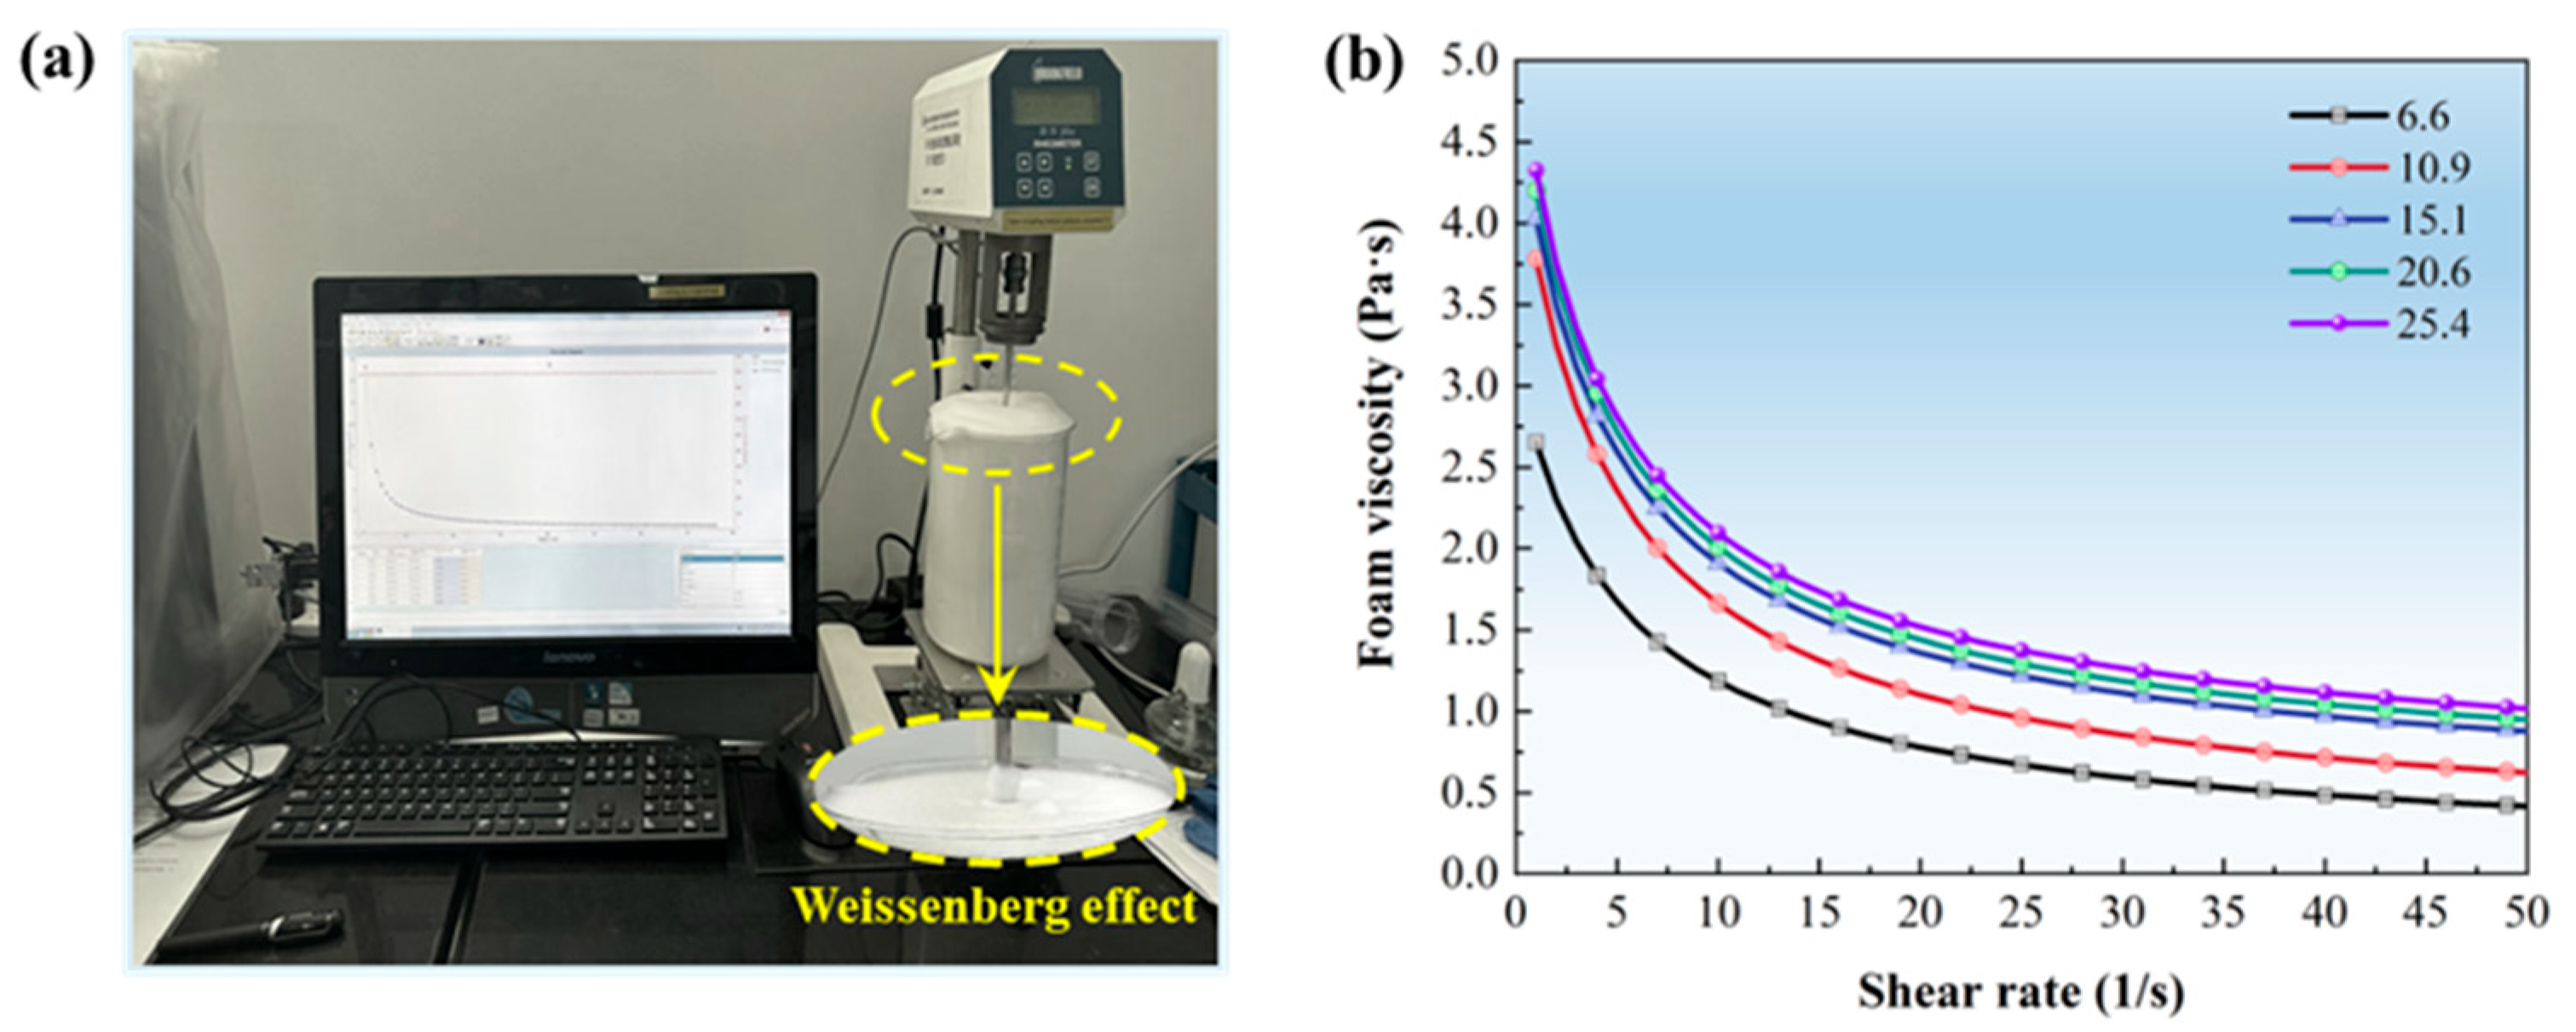
3.1. Basic Properties of Foam

The foam concentrate used in this experiment was a Class A foam fire extinguishing agent. The Class A foam concentrate used in this study was purchased from Suolong Fire Technology Co., Ltd. (Jiangsu, China). According to the manufacturer, the concentrate contains a proprietary blend of fluorocarbon-based compound surfactants formulated in-house. Its basic performance indicators are shown in Table 2. According to the data in Table 2, the optimal mixing ratio for fire extinguishing is 0.5%, which was selected as the basis for the subsequent experiments. When foam is applied to the fuel bed, foams with different expansion ratios exhibit varying viscosities, which in turn affect their surface diffusion and internal penetration within the fuel bed. Moreover, under the influence of gravity, the bubbles within these foams with different expansion ratios gradually rupture and coalesce, exhibiting distinct drainage characteristics as well [32,33,34,35]. This impacts the foam’s ability to cover and extinguish the fire, as well as its cooling effect. Therefore, viscosity plays a crucial role in the application of foam for suppressing forest surface fires [36]. The R/S rheometer (Figure 3a) can be used to determine the viscosity of foam. Its working principle involves applying rotational shear stress to the sample and measuring its corresponding shear strain or shear rate, from which the viscosity of the material is derived. Figure 3b shows the trend of foam viscosity with shear rate under different foam expansion ratios.
As shown in Figure 3a, during the foam viscosity measurement, the foam was observed to climb along the rotor (Weissenberg effect), which is a characteristic of non-Newtonian fluids [37]. Figure 3b demonstrates that under different foam expansion ratios, the foam viscosity decreases with increasing shear rate, indicating that the foam exhibits shear-thinning behavior. These two phenomena confirm the rheological properties of the foam. Accordingly, the relationship between foam viscosity and shear rate was fitted using the power–law rheological model, as described in Equation (1) [38]. Table 3 presents the fitting parameters under various expansion ratio conditions.
μ = K γ n 1 o r , τ = K γ n
where μ represents the foam viscosity; K is the consistency coefficient, and n is the flow behavior index.
As shown in Table 3, the fitting correlation coefficients under different foam expansion ratios are all greater than 0.95, indicating that the power–law rheological model effectively describes the rheological properties of the foam. Under various expansion ratio conditions, the rheological index n ranges between 0 and 1, suggesting that as the shear rate increases, the foam viscosity gradually decreases. This phenomenon occurs because the foam structure breaks under shear forces during flow, leading to reduced viscosity.
Additionally, both n and the consistency index K increase with higher expansion ratios. The rheological index n determines the foam’s shear behavior. For n < 1 (shear-thinning foam), an increase in n reduces the foam viscosity’s sensitivity to shear rate, meaning that the viscosity decreases more slowly. Specifically, at high shear rates, the reduction in viscosity slows down, slightly weakening the foam’s fluidity, and the foam exhibits relatively higher thickness. The consistency index K, representing the foam viscosity at low shear rates (or the internal friction strength of the foam), increases as K grows. This indicates that the foam viscosity increases at the same shear rate, making the foam more viscous and reducing its flowability, requiring greater driving forces to propel its movement. Consequently, as the foam expansion ratio increases, foam viscosity gradually increases, exhibiting stronger flow resistance.

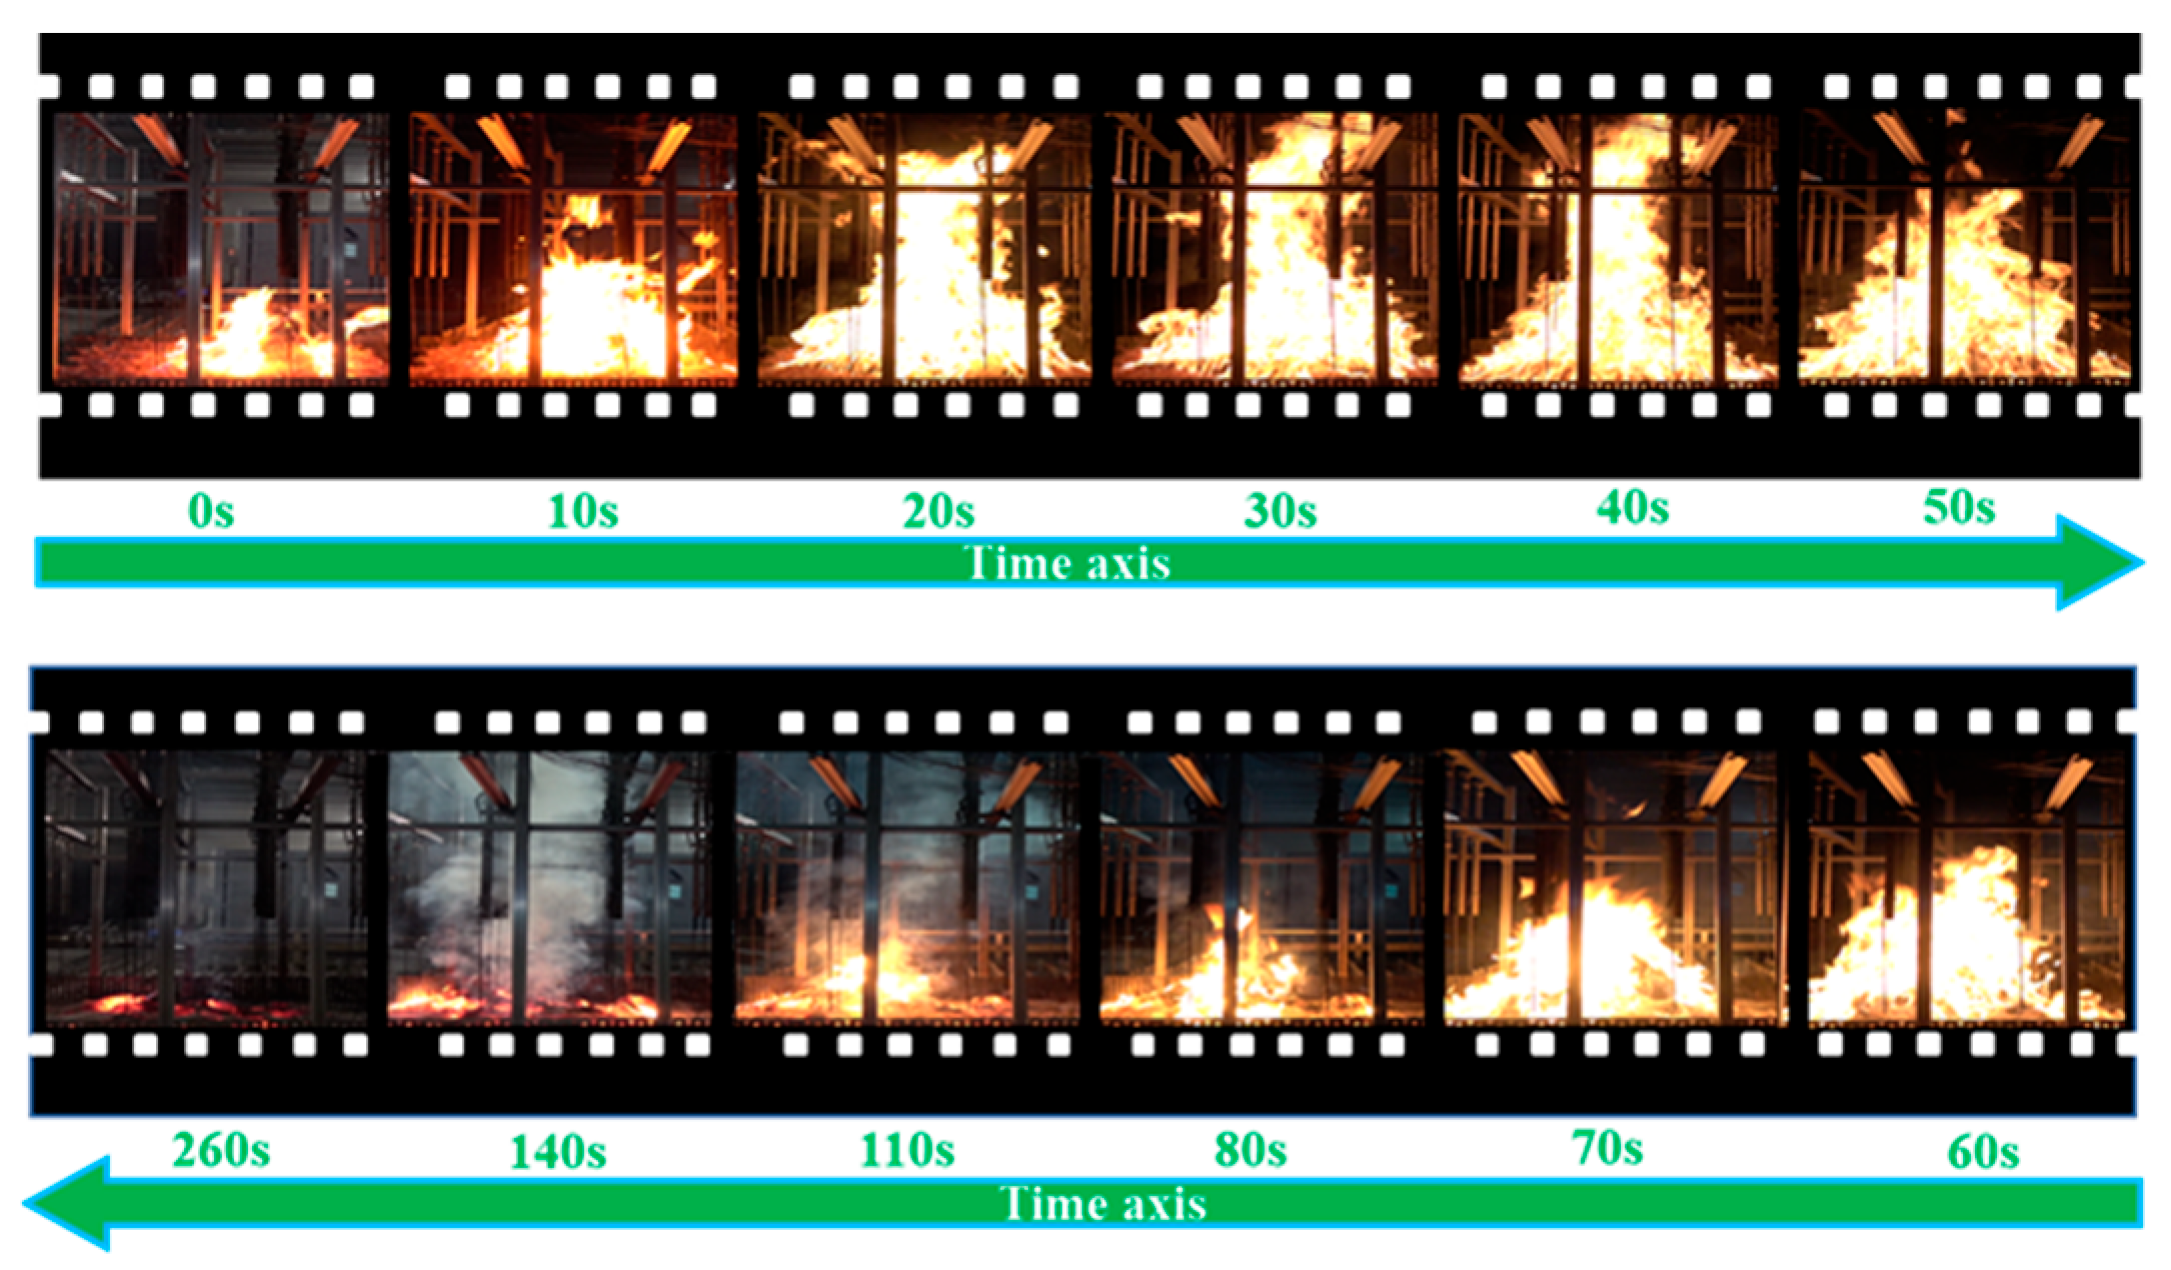
3.2. Combustion Characteristics of the Fuel Bed

Before conducting the foam fire suppression experiments, two free burning tests were performed on the pine needle fuel bed, and typical flame shapes were recorded (Figure 4). Figure 5 shows the temperature variation trends of the pine needle fuel bed during the two free burning processes. Based on the experimental data, the combustion process can be divided into five stages: ignition stage (0~10 s), combustion enhancement stage (10~30 s), steady stage (30~40 s), decay stage (40~260 s), and residual combustion stage (≥260 s).
In the ignition stage, due to the spraying of n-heptane onto the surface of the fuel bed, the fuel bed rapidly heats up by absorbing the heat released from the combustion of n-heptane, evaporating moisture until reaching the ignition point. After entering the combustion enhancement stage, the fuel bed begins pyrolysis, releasing combustible gases and forming a continuously growing flame. In the steady stage, the fuel bed continues pyrolysis, and the flame height stabilizes. Then, in the decay stage, most of the volatile substances in the fuel are released, and the remaining solid charcoal slowly burns, causing the flame to gradually shrink, the combustion rate to decrease, and the temperature to drop. Finally, in the residual combustion stage, the charcoal continues to react with oxygen until it is completely burned, causing the temperature to further decrease and the fuel to be fully consumed.
As shown in Figure 5, the temperature variation trends of the two free burning tests are essentially the same, indicating that the experimental model has good repeatability. By analyzing the flame shape and temperature curves during the combustion process, it was found that the maximum combustion intensity of the fuel bed occurred between 30 and 40 s. Therefore, in the foam fire suppression experiment, the pre-burn time was set to 35 s, and foam application was started at that point. Furthermore, considering the deep smoldering of forest surface fuels, the temperature change within the fuel bed should be used as the main evaluation criterion for the effectiveness of foam fire suppression.

3.3. Effect of Foam Expansion Ratio

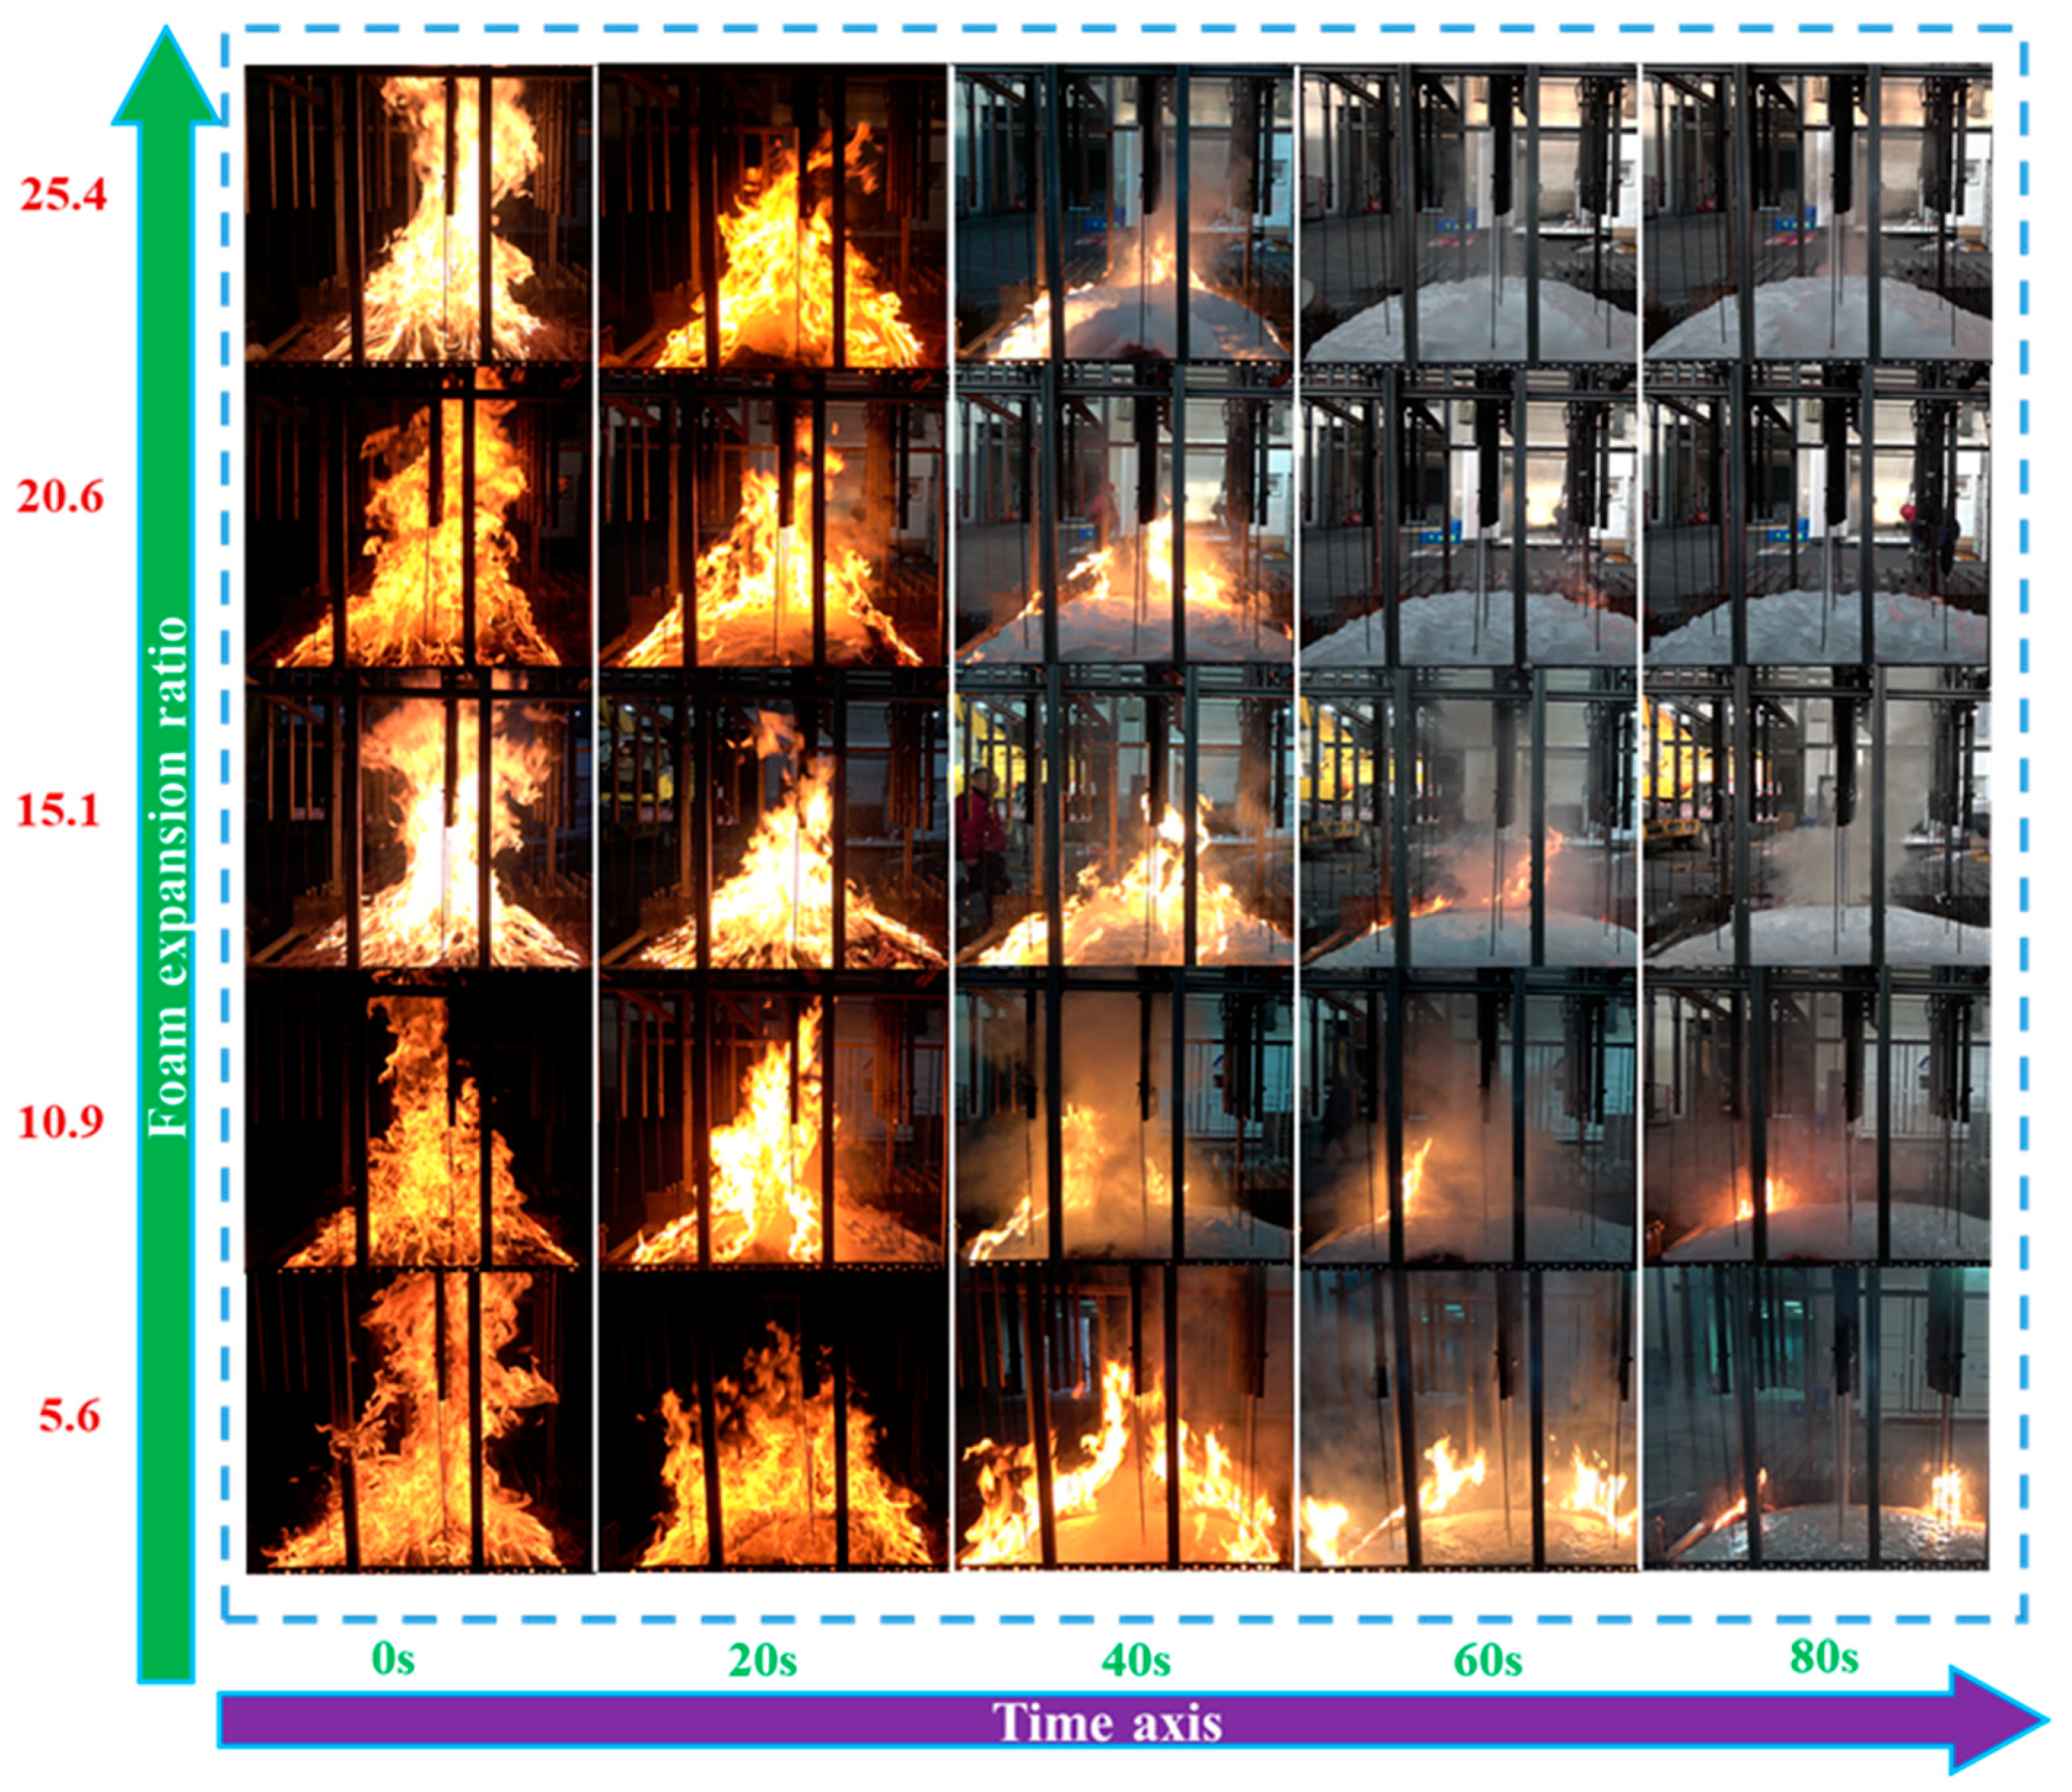
3.3.1. Coverage Fire Suppression Capability

Figure 6 shows images of the foam fire suppression process under different expansion ratios. The entire process can be divided into two stages: flame suppression and foam coverage fire suppression. In the flame suppression stage, as foam is applied, the flame height and volume gradually decrease. In the foam coverage fire suppression stage, the foam spreads and covers the fuel bed surface, causing the burning area to shrink. When the foam completely covers the fuel bed surface, the open flame is completely extinguished. It is noteworthy that the time required for the foam to fully cover the fuel bed differs significantly under different foam expansion ratios. For example, at expansion ratios of 5.6 and 10.9, the foam has not fully covered the fuel bed, even after 80 s of application. However, at expansion ratios of 15.1, 20.6, and 25.4, the foam has already fully covered the fuel bed at the same time point. This indicates that foams with higher expansion ratios spread more quickly across the surface of the fuel bed, allowing them to cover the fuel bed faster and achieve better coverage extinguishment effects. The foam coverage suppression time (X) is defined as the duration from the moment the foam initially contacts the ignited fuel bed to the complete extinguishment of surface flames. Specifically:
Start point: the moment when foam first makes contact with the flaming surface.
End point: when all visible flames are fully extinguished and no reignition is observed within a 5 s window.
This parameter was determined through high-definition video recordings, supplemented by stopwatch-based time analysis. This indicator is used to characterize the foam’s coverage fire suppression capability. The foam coverage extinguishment times under different expansion ratios are shown in Table 4. As the expansion ratio increases, the foam coverage extinguishment time gradually decreases. This indicates that the higher the expansion ratio, the better the foam’s coverage extinguishment effect.

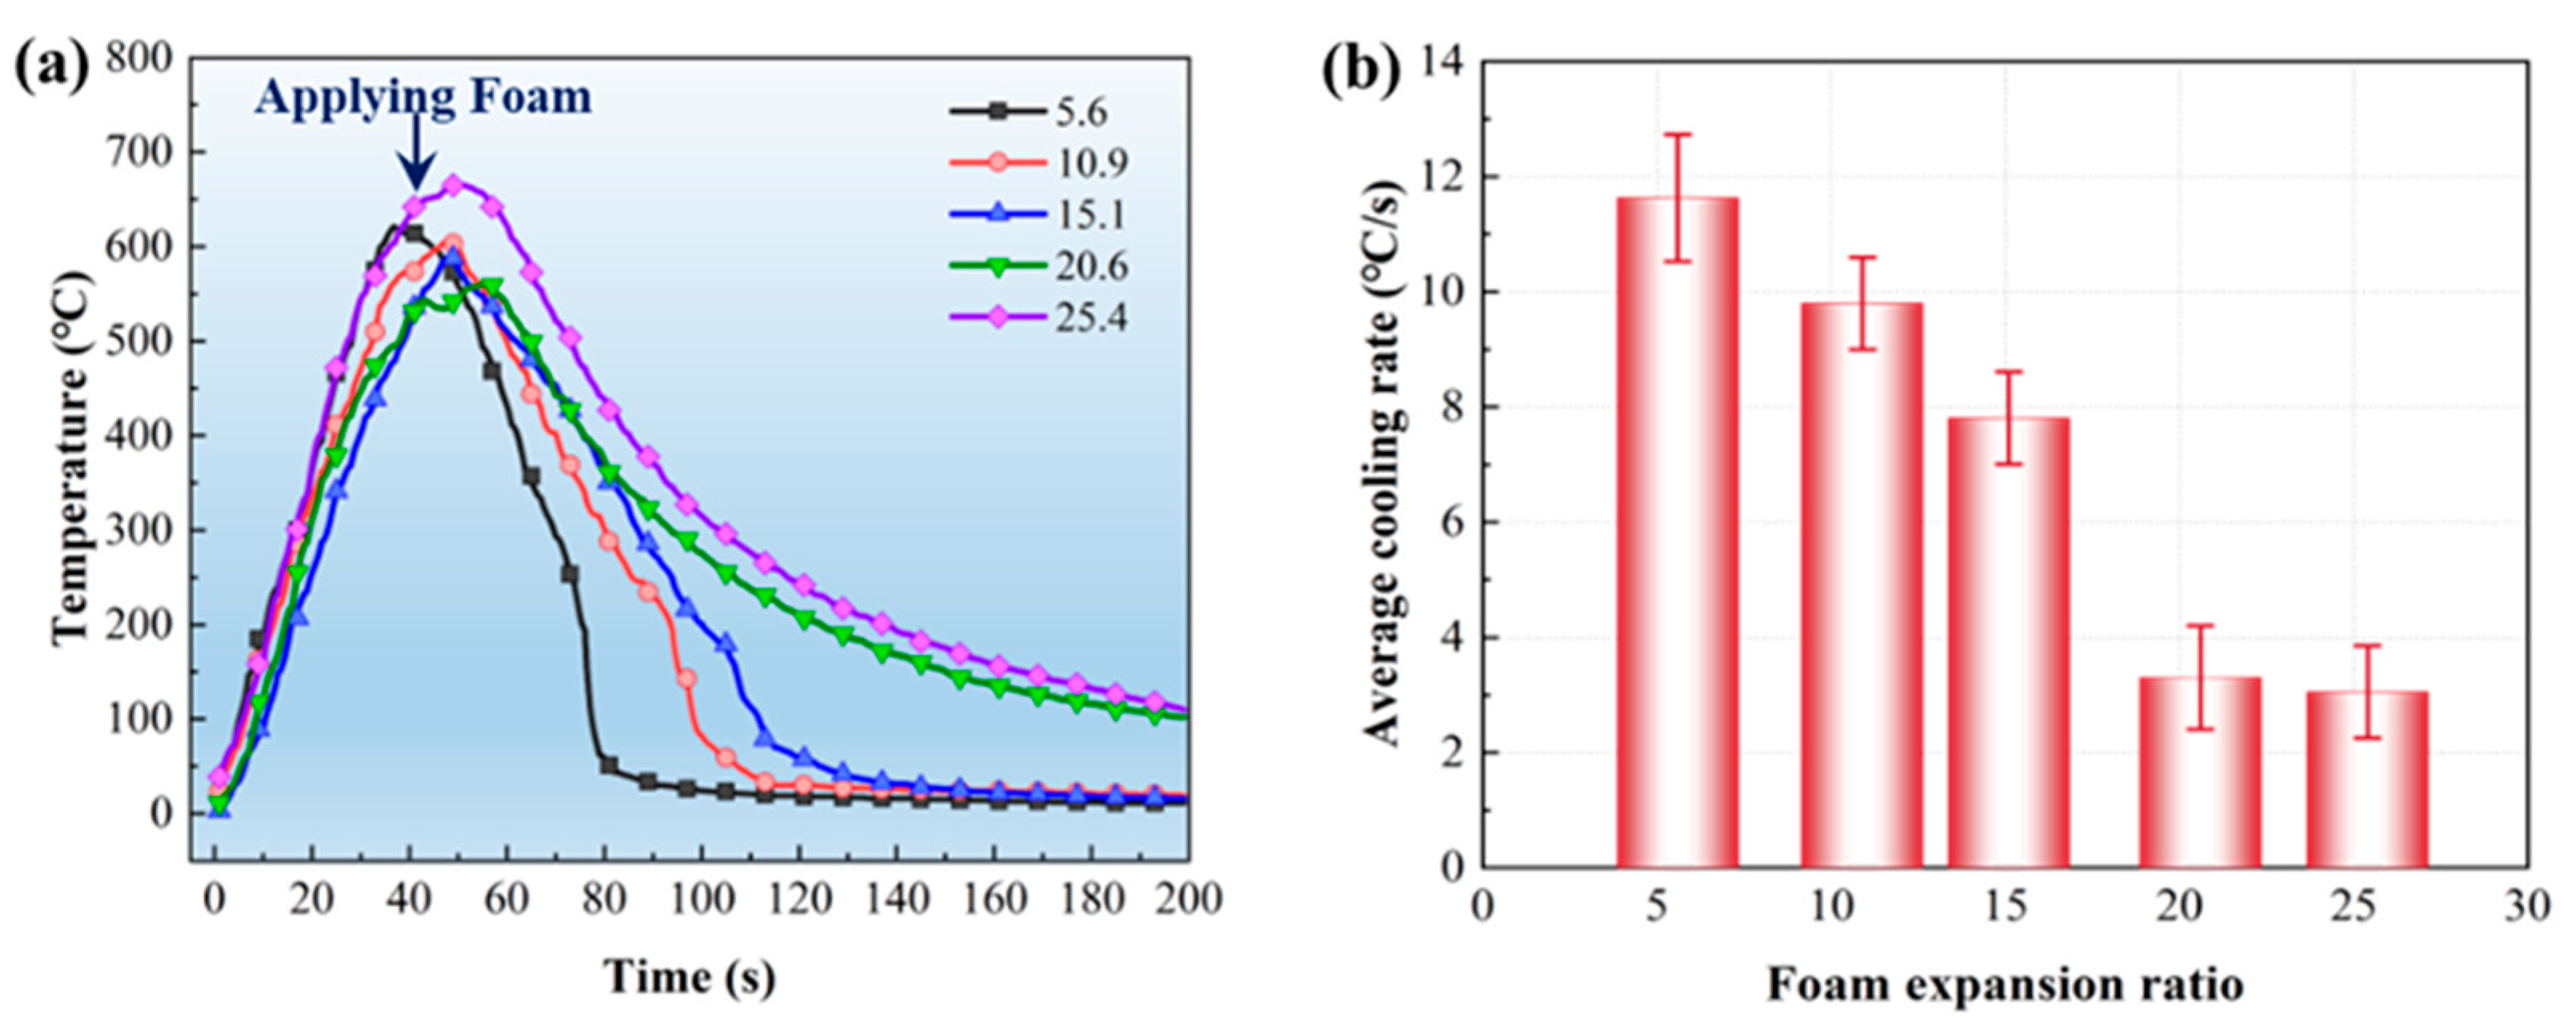
3.3.2. Cooling Capability

The thermocouples in group TA (T1–T3) were embedded within the fuel bed to monitor the internal temperature variations over time. The average temperature profiles recorded by the TA group were used to evaluate the internal penetration and cooling performance of the foam. Figure 7a presents the temperature variation curves within the fuel bed under different foam expansion ratios. Over time, foam containing moisture is continuously applied to the burning fuel bed. A portion of these foams penetrates into the deeper layers of the fuel bed, where their water content is evaporated by high temperatures, thereby removing heat and achieving effective cooling. The remaining foam stays on the surface of the fuel bed, forming a foam cover that continuously releases water, which then infiltrates into the fuel bed. Both mechanisms contribute to the internal cooling of the fuel bed. However, most of the water released by the foam layer is likely absorbed by the dry pine needles on the surface of the fuel bed, leaving only a minimal amount that actually penetrates into deeper layers for cooling. Therefore, to achieve better cooling effects, the foam must possess a certain level of penetration capability. The average cooling rate (Y) is used to characterize the cooling ability of foam under different expansion ratios. As the expansion ratio increases, the average cooling rate (Y) of the fuel bed gradually decreases. This means that the higher the expansion ratio, the worse the cooling effect of the foam. This is because the main component responsible for cooling in the foam is water. As the foam expansion ratio increases, the foam contains less water, which results in a reduced cooling effect. Moreover, foams with higher expansion ratios may have poorer penetration capabilities, mostly remaining on the surface of the fuel bed to form a covering layer, which prevents them from penetrating into the interior of the fuel bed for cooling. As a result, the internal cooling effect of foams with higher expansion ratios is relatively limited.

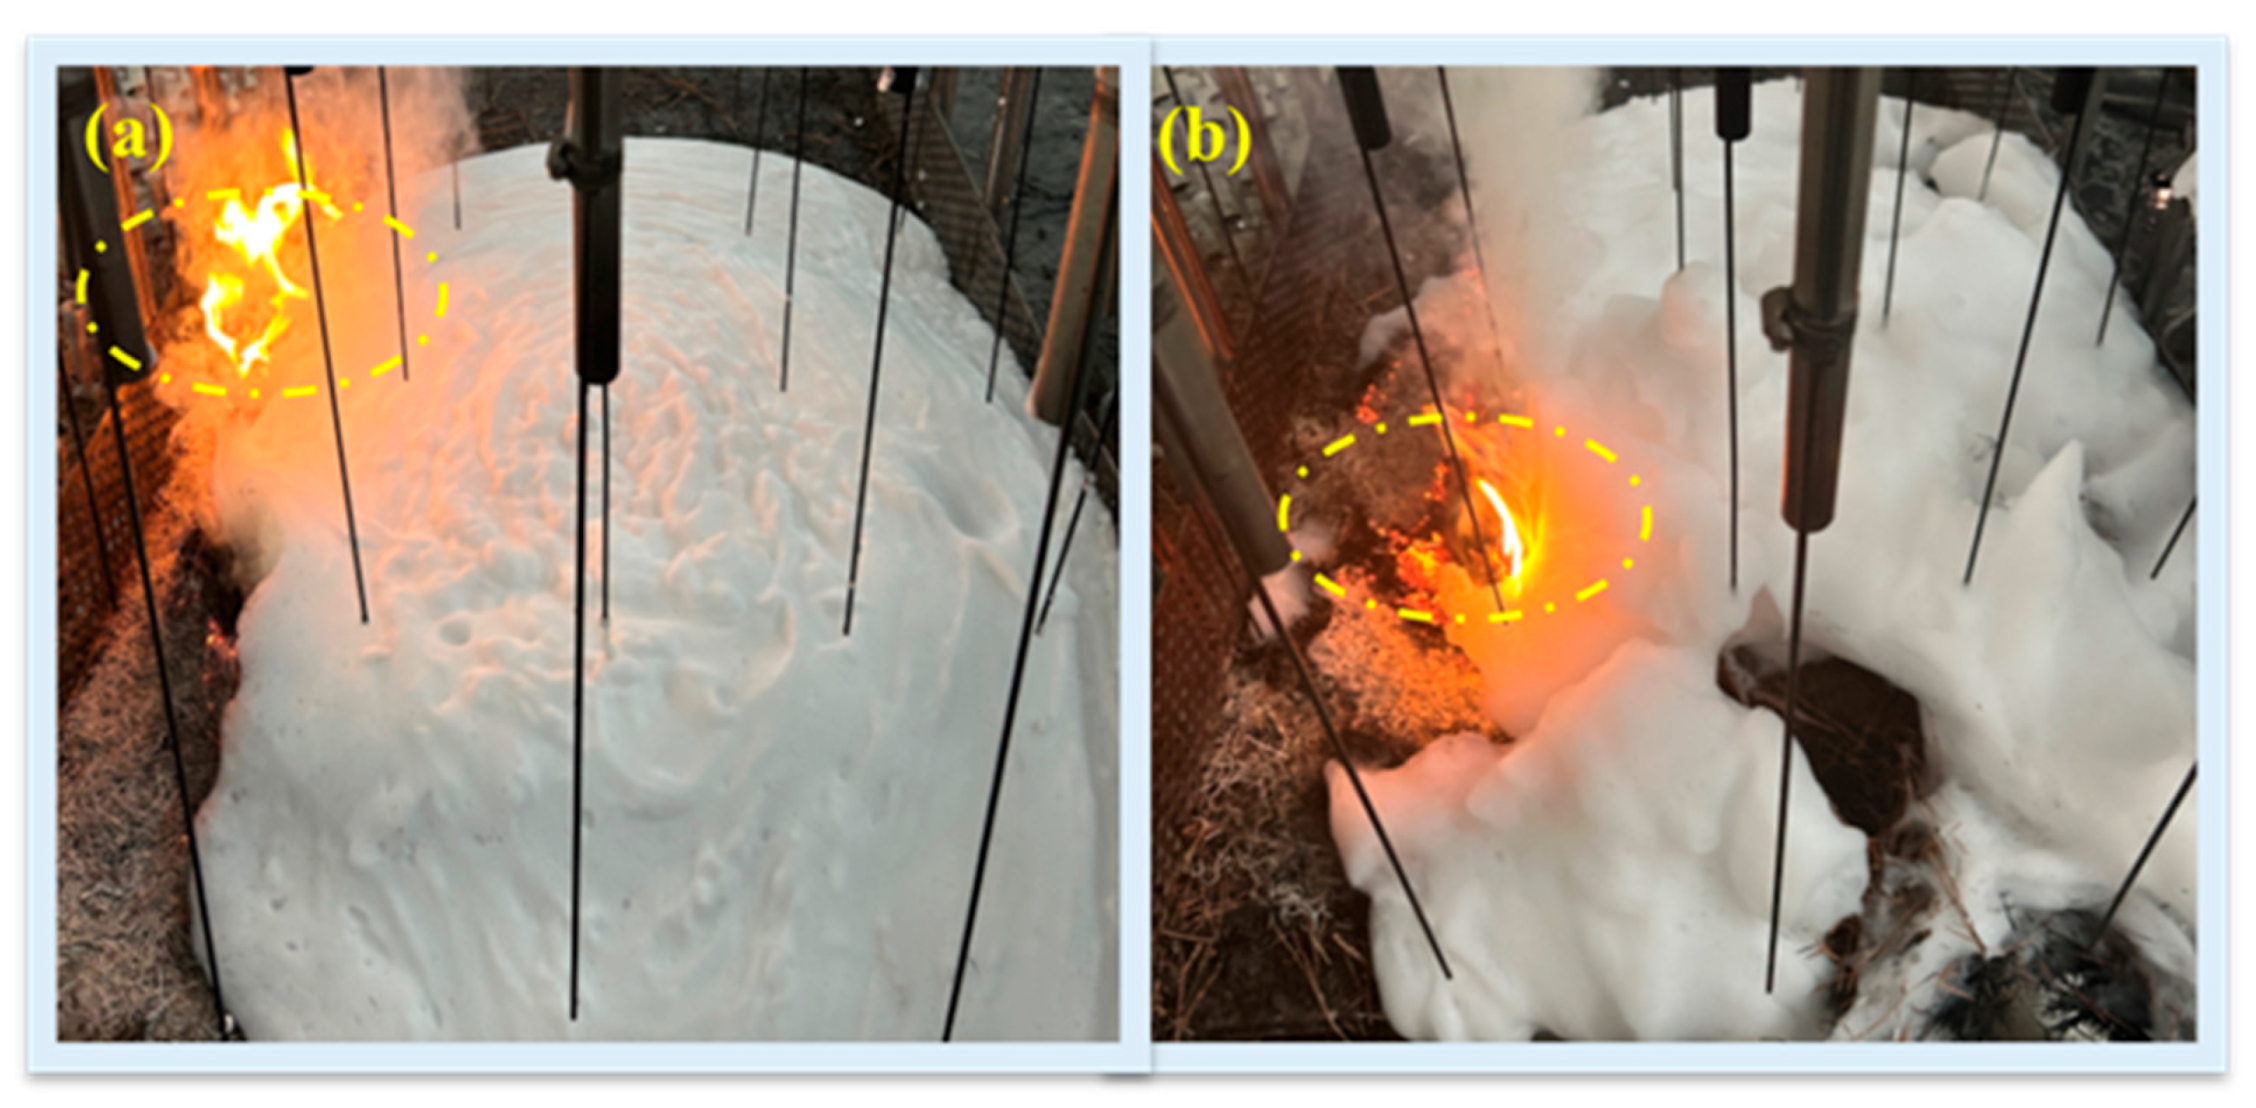
3.3.3. Re-Ignition Resistance Capability

After the visible flame on the fuel bed is completely covered and extinguished, the re-ignition phenomenon on the fuel bed is observed within 10 min. As shown in Figure 8, re-ignition was observed in the experiments with foam expansion ratios of 20.6 and 25.4. The length of time from when the foam completely covers and extinguishes the open flame until the fuel bed experiences re-ignition or intermittent flames is recorded. This time is defined as the re-ignition resistance time (Z), and is used to characterize the foam’s ability to resist re-ignition.
Table 5 shows the re-ignition resistance times (Z) for foam under different expansion ratios. No re-ignition phenomenon occurred at foam expansion ratios of 5.6, 10.9, and 15.1, while the re-ignition resistance times for foam at expansion ratios of 20.6 and 25.4 were 154 s and 126 s, respectively. This indicates that under higher foam expansion ratios, even though a thick foam layer is formed on the surface of the fuel bed, it does not fully suppress combustion. This is because, although the visible flame is extinguished, the high temperatures inside the fuel bed gradually melt the foam layer, which contains less moisture, leading to re-ignition. This is also a consequence of the difficulty foams with higher expansion ratios face in penetrating into the interior of the fuel bed to achieve effective cooling.

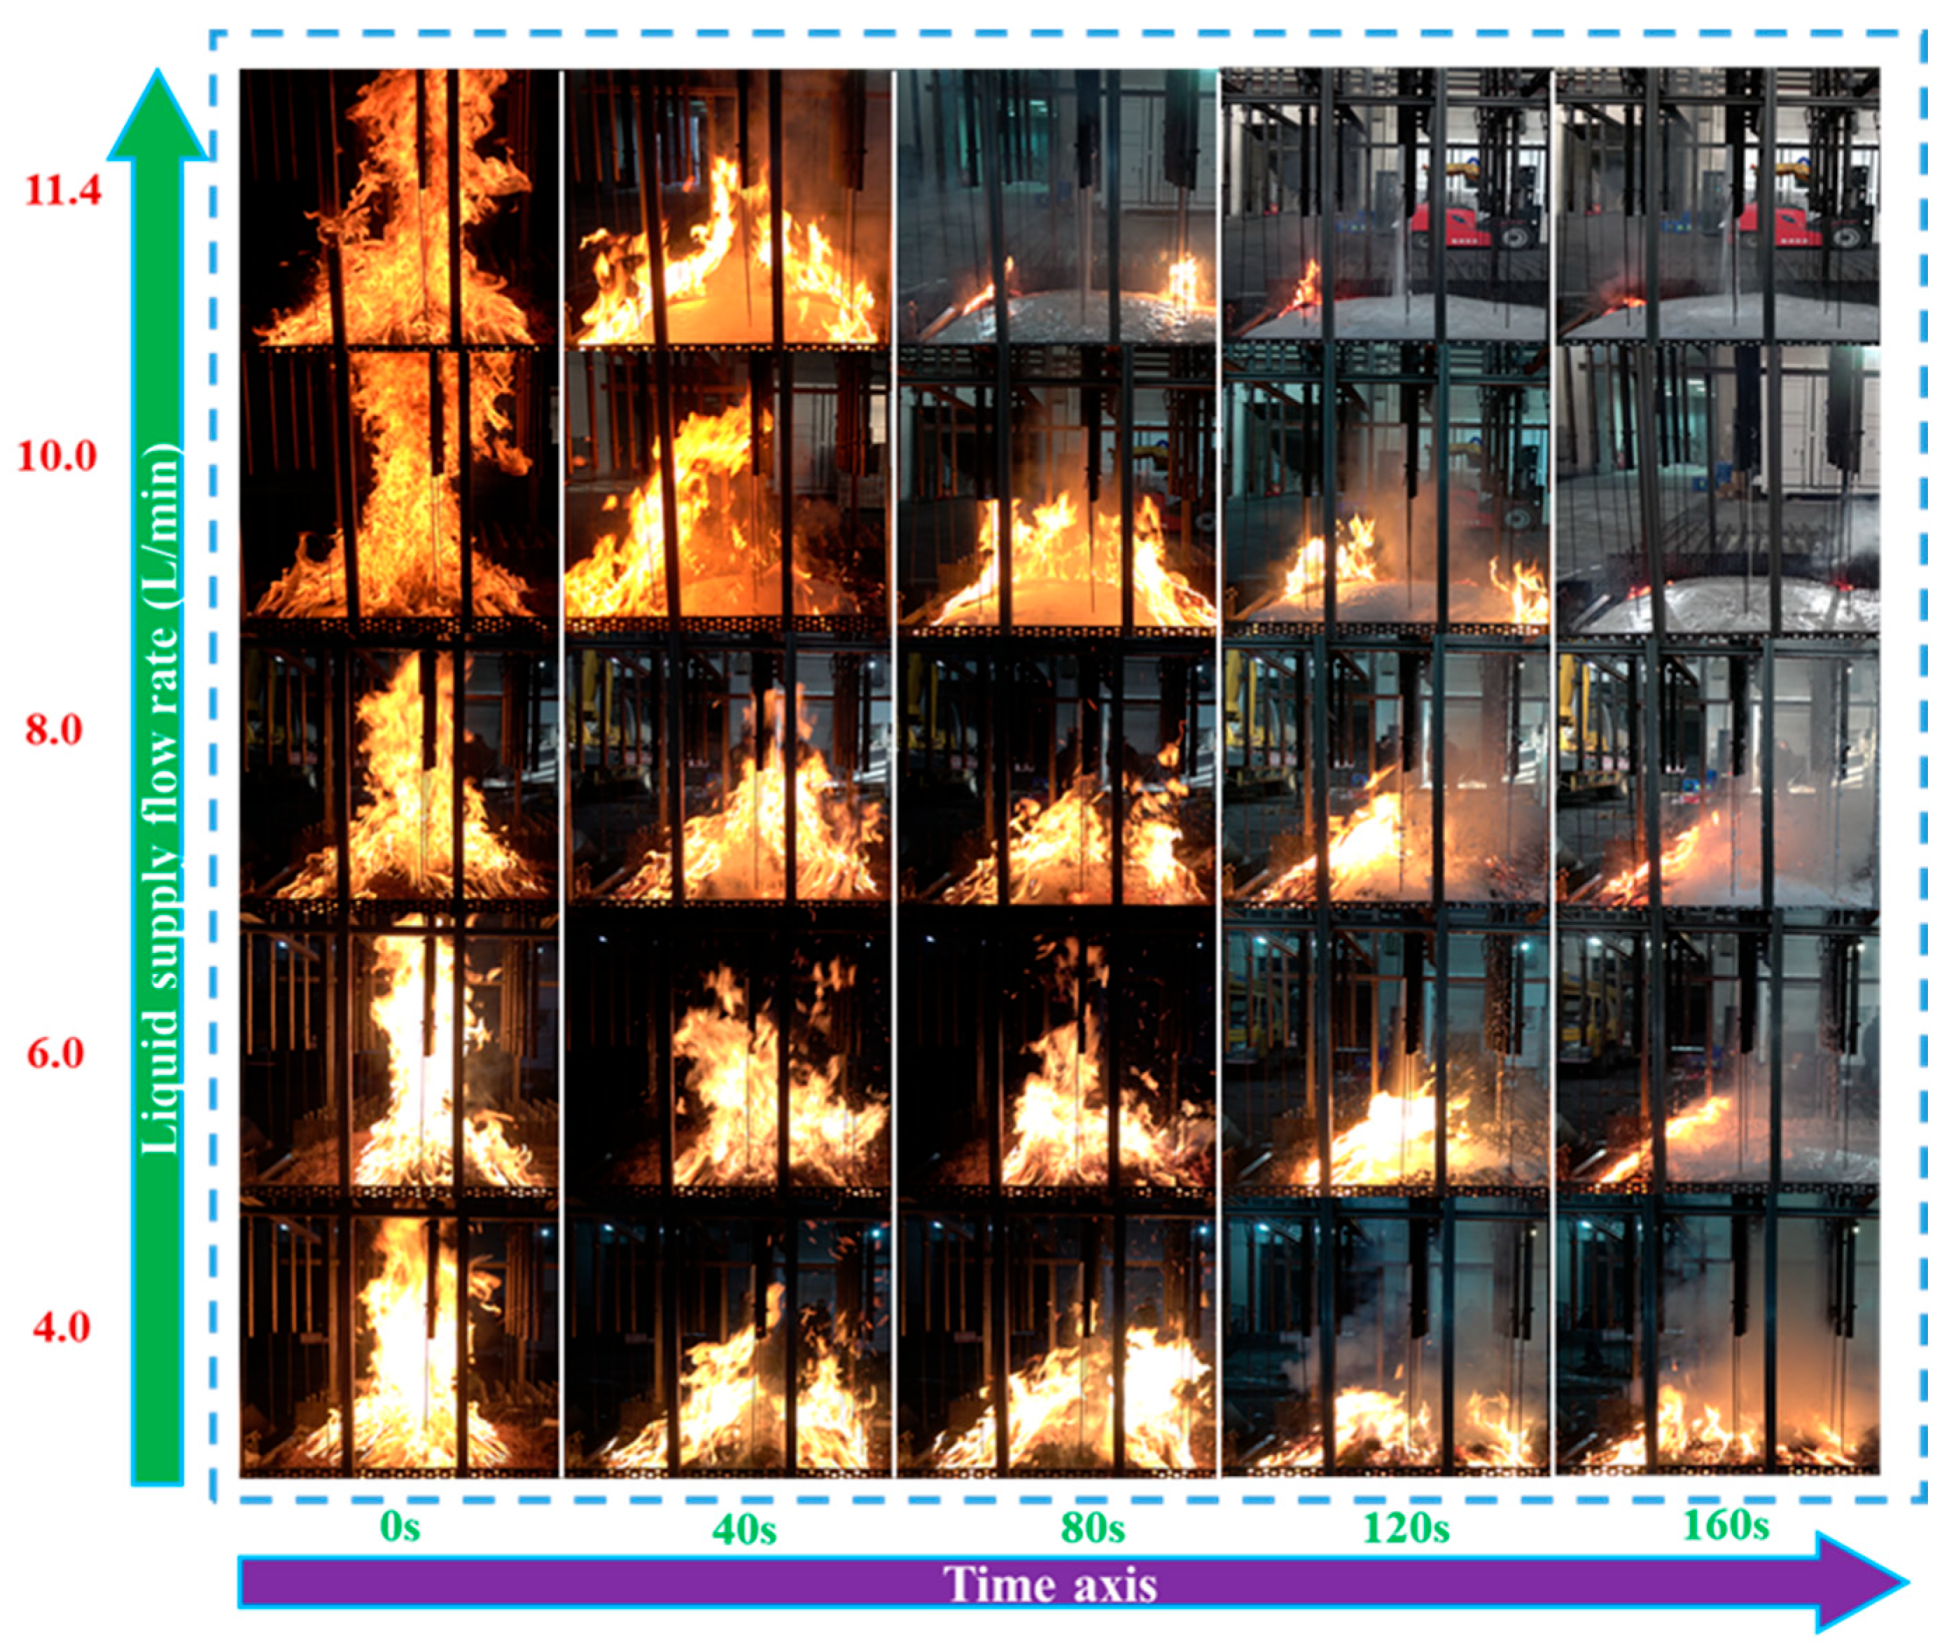
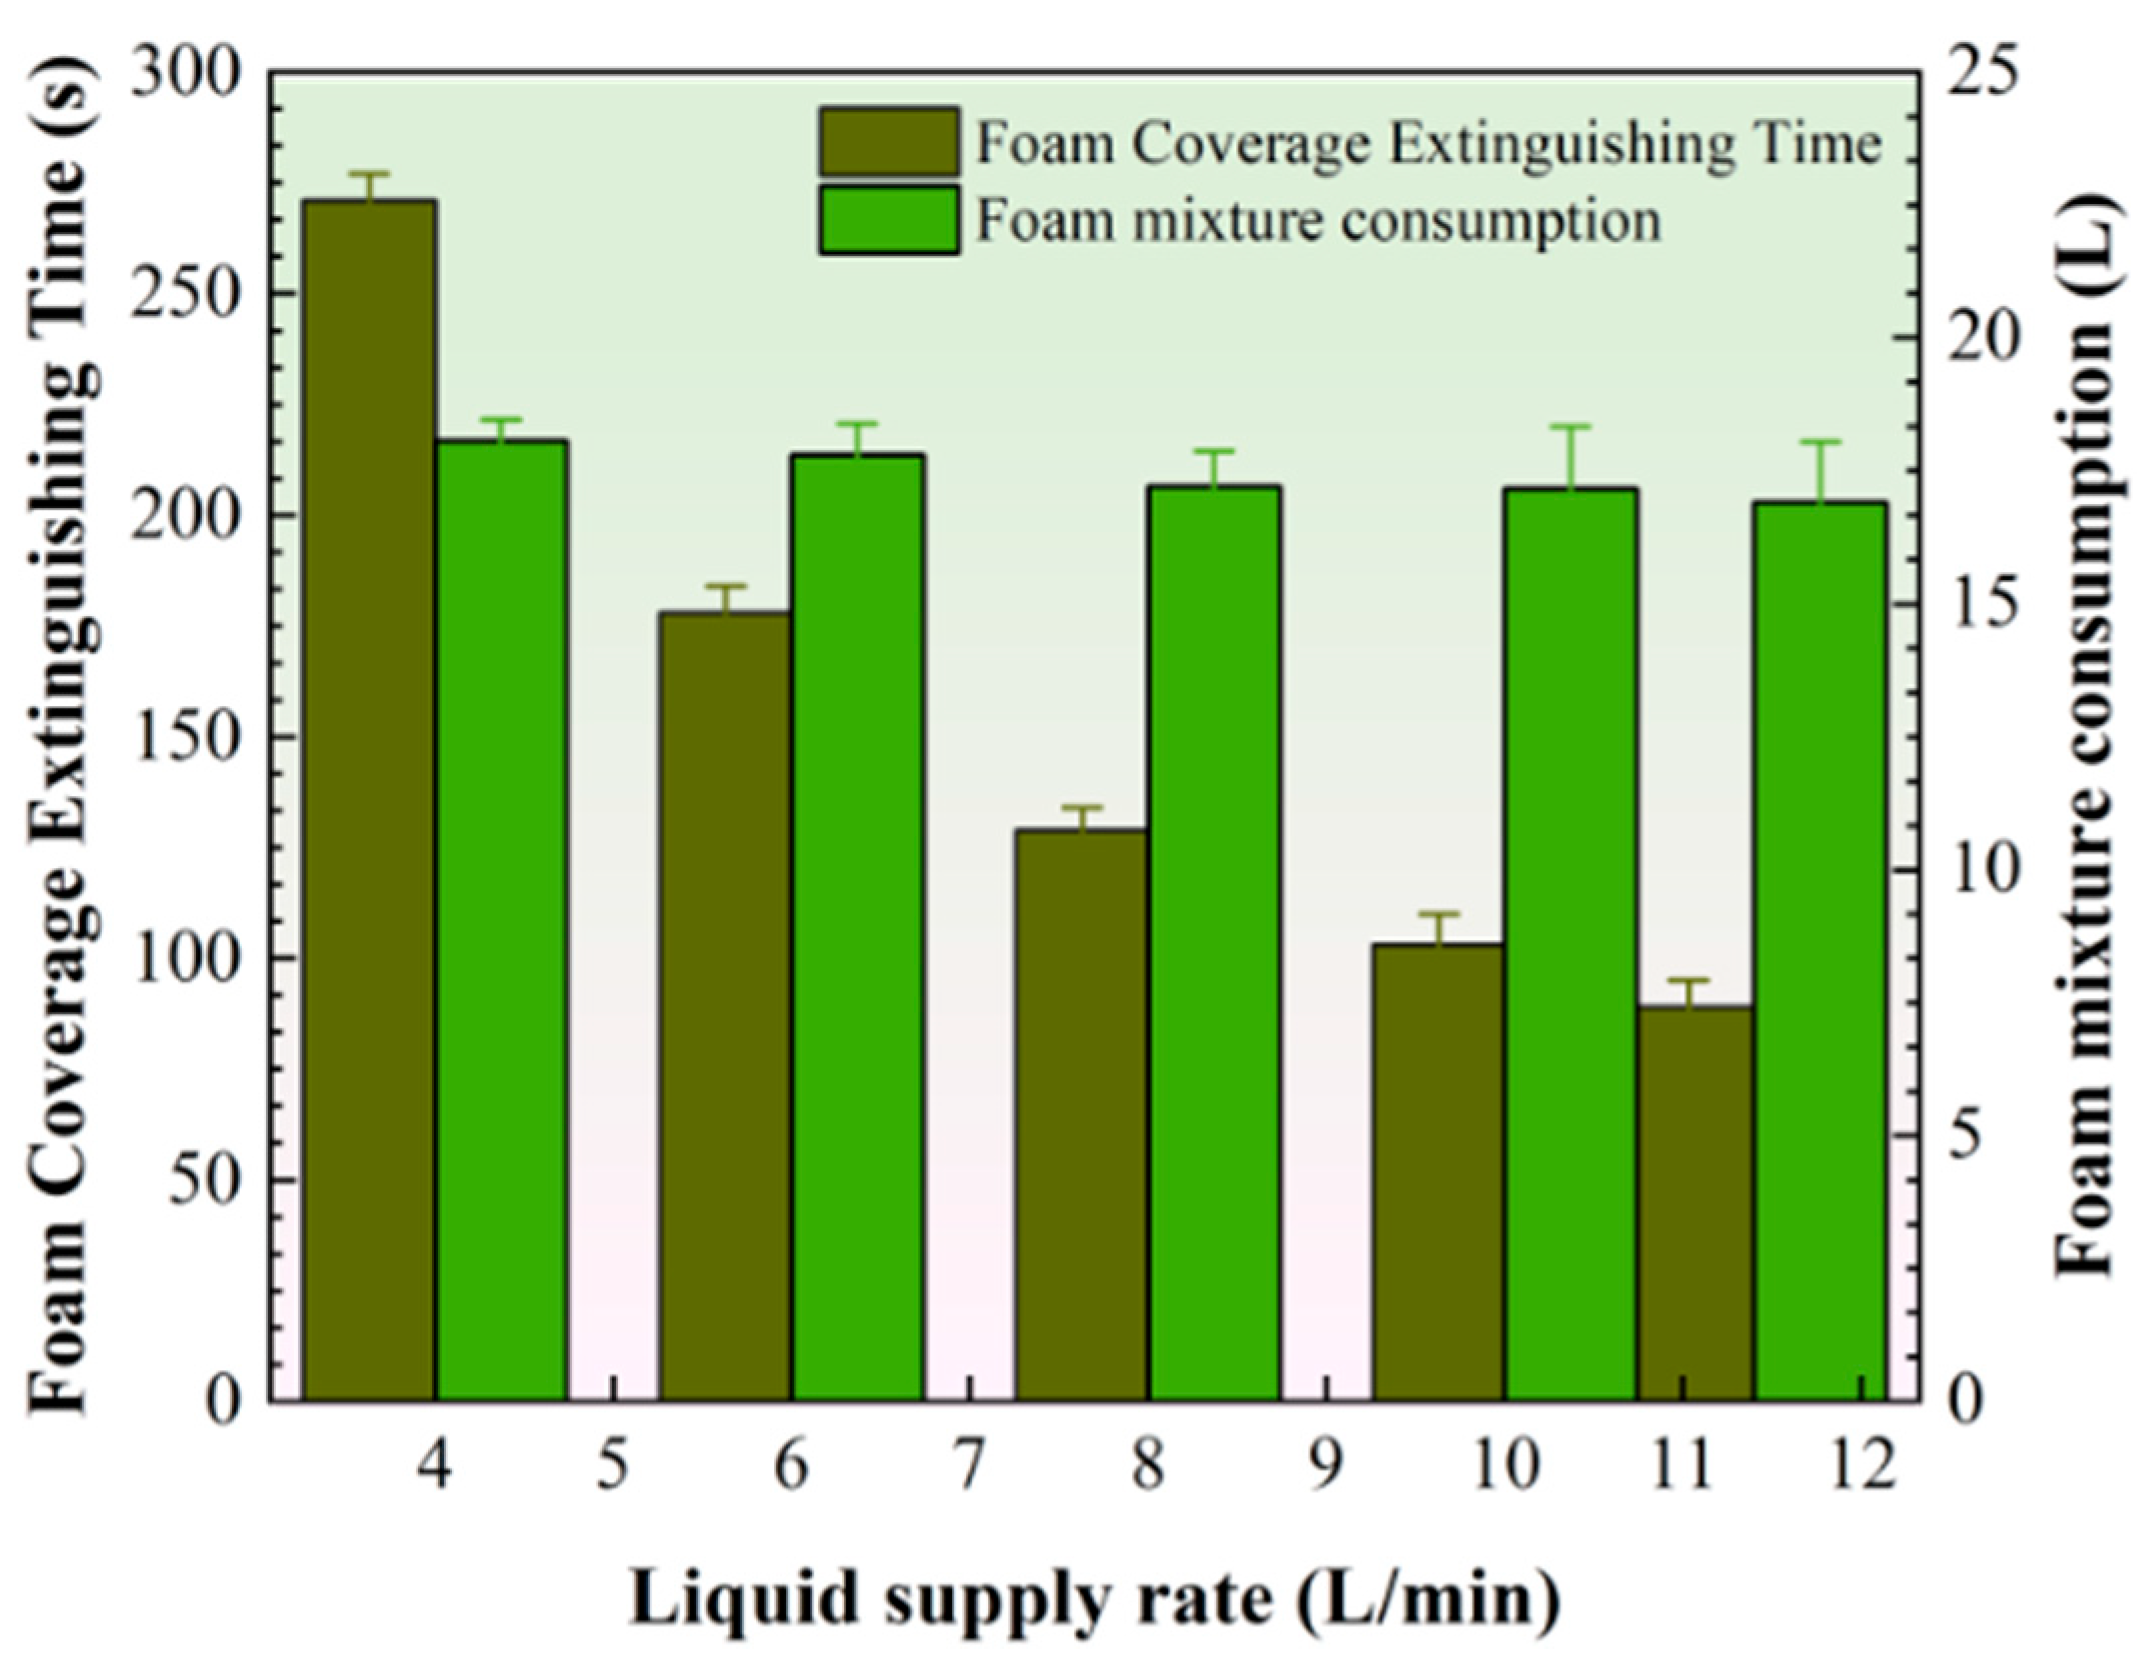
3.4. Influence of Liquid Flow Rate

Figure 9 shows the flame images during the foam fire suppression process under different liquid flow rates (with the foam expansion ratio fixed at 5.6). After the foam completely covered and extinguished the open flame, the fuel bed was continuously observed for 10 min, with no re-ignition observed. This further validates the better re-ignition resistance of foam with a lower expansion ratio. Additionally, this suggests that under lower expansion ratios, foam provides better cooling and temperature reduction effects within the fuel bed. To compare the fire suppression effects of foam under different liquid flow rates, the foam coverage extinction time was recorded. The foam mixture volume required to achieve fire suppression under different liquid flow rates was then calculated, with the results shown in Figure 10. The calculation formula is as follows:
Q = q × t c 60
where Q represents the amount of foam mixture required to achieve full coverage and fire suppression, L; q is the liquid flow rate, L/min; and tc is the foam coverage suppression time, s.
As shown in Figure 10, when the supply flow rate is 4 L/min, the foam coverage extinguishing time is 271 s. As the supply flow rate increases to 10 L/min, the extinguishing time quickly decreases to 103 s. This is because a higher supply flow rate allows for faster coverage of the fire source, significantly reducing the time required for fire suppression. However, when the supply flow rate exceeds 10 L/min, the rate of reduction in extinguishing time slows down and becomes less significant. The core mechanism of foam fire suppression lies in isolating the fuel from oxygen through coverage and reducing the fuel temperature through cooling [39]. Once the cooling and isolation effects of the foam are sufficient to extinguish the flames, additional supply flow rates contribute minimally to enhancing these effects. Furthermore, both processes require a certain amount of time to complete, and increasing the supply flow rate further does not significantly accelerate these physical and chemical processes. Therefore, the fire suppression efficiency tends to stabilize.
From this, it is evident that during forest fire suppression, there is a critical value for the supply flow rate. When the supply flow rate exceeds this critical value, the improvement in suppression efficiency becomes marginal. In this experimental model, the critical value for the supply flow rate is 10 L/min. Additionally, the amount of foam mixture consumed during fire suppression slightly decreases as the supply flow rate increases. This is because, under low supply flow rate conditions, foam coverage expands more slowly, and some foam may evaporate or decompose before reaching the fuel bed, leading to a higher consumption of foam mixture.

4. Discussion

Based on the results of the extinguishment experiments, the critical supply flow rate for foam extinguishment was determined to be 10 L/min. When the supply flow rate exceeds this threshold, further improvements in extinguishing performance become less significant. Meanwhile, foams with different expansion ratios exhibit various strengths and weaknesses across three key extinguishing evaluation metrics: coverage extinguishing effect, internal cooling capability, and resistance to reignition. The surface spreading speed of foam significantly influences the coverage extinguishing effect. A faster spreading speed allows the foam to cover the fuel bed more quickly, thereby limiting the oxygen supply needed for combustion and extinguishing visible flames. Furthermore, the internal cooling effect for fuel beds with a certain thickness is crucial. If the foam fails to penetrate into the interior of the fuel bed and effectively cool it, the high temperature within the fuel bed may breach the foam layer and reignite the fire, even if the visible flames have been extinguished by the foam cover.
This indicates that the effectiveness of foam in suppressing forest surface fires is closely related to its spreading and penetration capabilities. Accordingly, this section first establishes a surface spreading model and an internal penetration model for foam based on its rheological characteristics and the properties of porous fuel beds. Then, the surface spreading and internal penetration behaviors of foams with different expansion ratios are analyzed from the perspective of fluid dynamics, exploring their relationships with the extinguishing evaluation metrics. Finally, by integrating the three evaluation metrics, the extinguishing performance of foams under different expansion ratios is assessed, and the optimal expansion ratio for suppressing forest surface fires is determined.

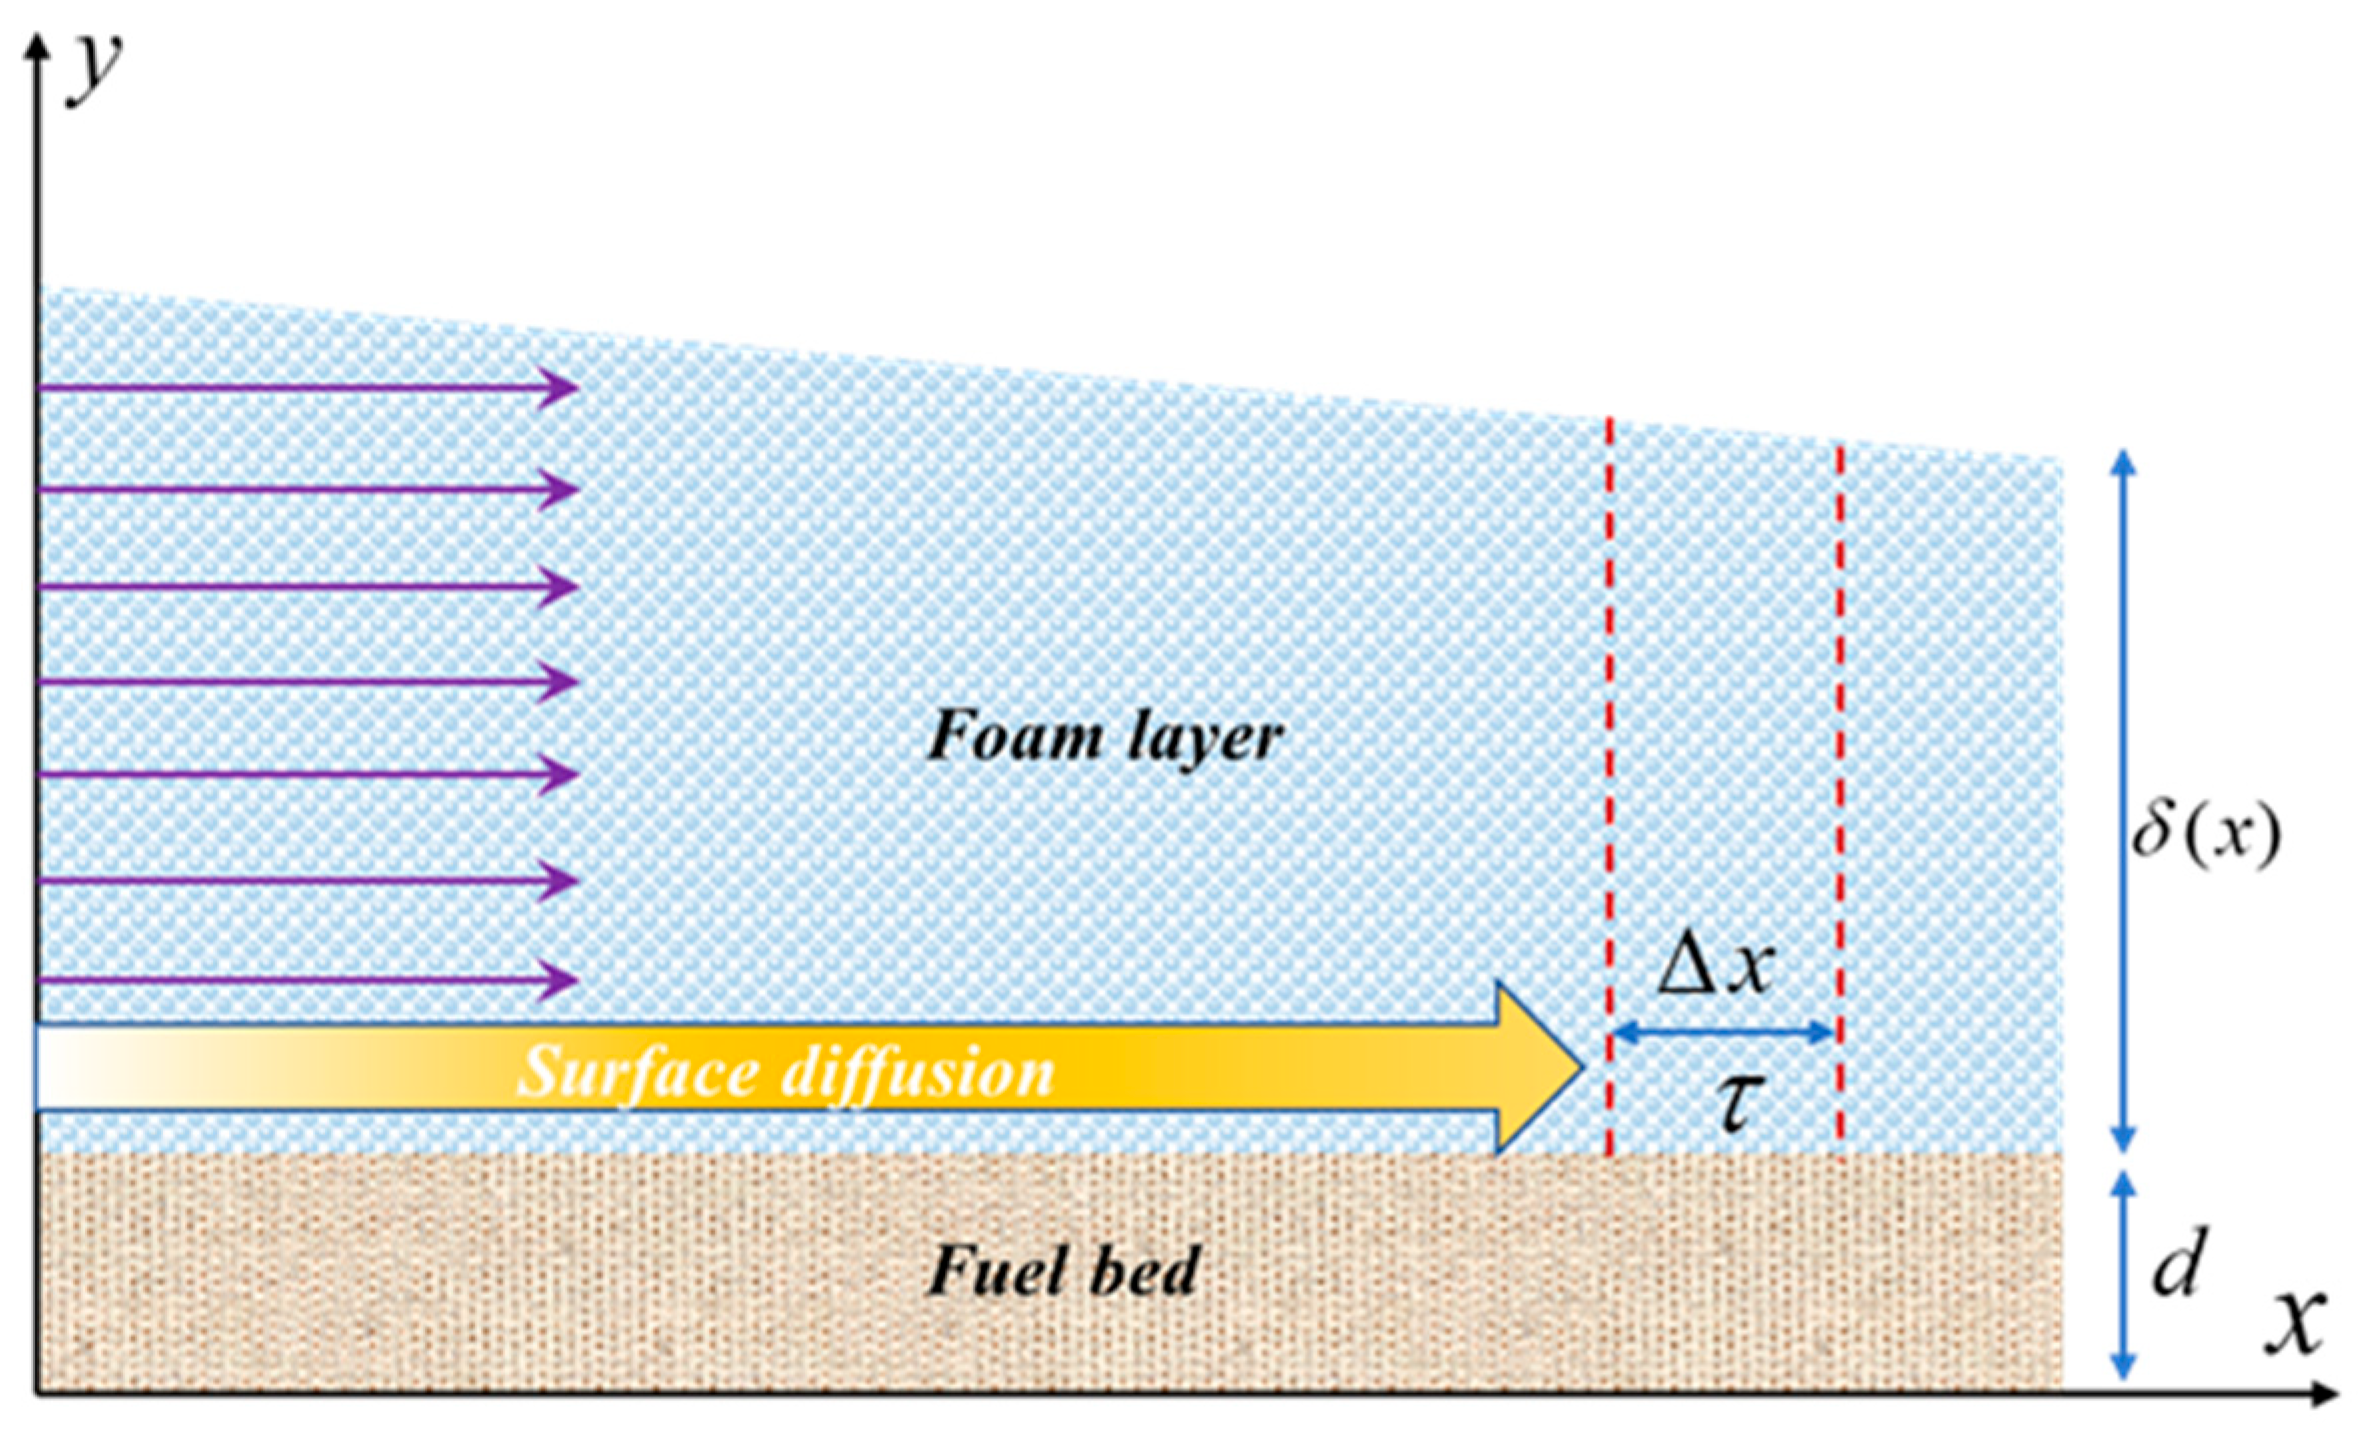
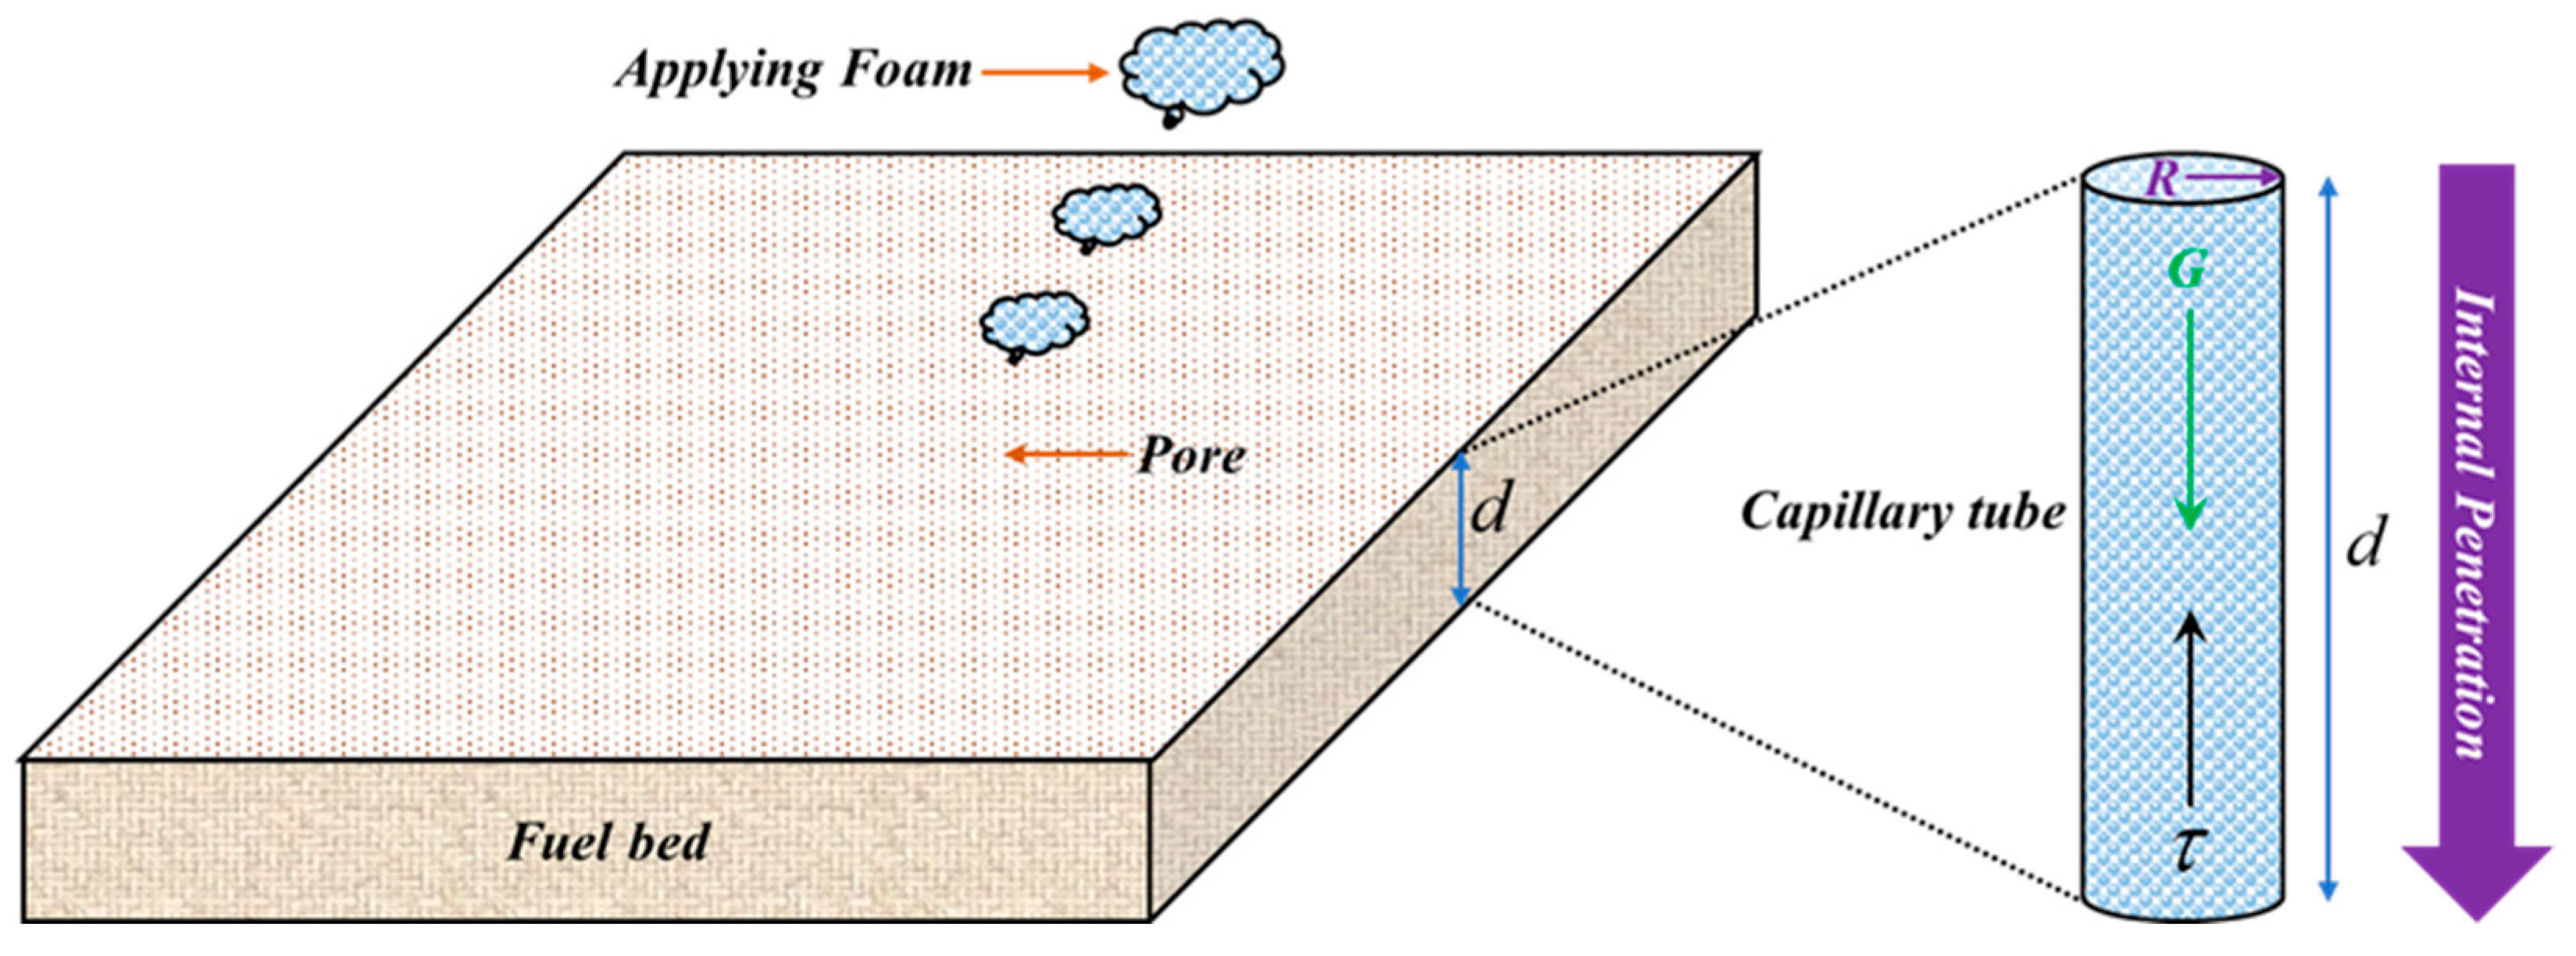
4.1. Diffusion and Penetration of Foam

The spreading of foam on the surface of the fuel bed is primarily driven by the hydrostatic pressure gradient caused by its own gravity and surface tension, as shown in Figure 11. The hydrostatic pressure gradient acts on regions of different thickness within the foam layer, driving the foam to flow from thicker areas to thinner ones. Surface tension, on the other hand, acts at the leading edge of the foam layer, generating an extending force. Generally, when the foam layer is relatively thick, the effect of surface tension can be neglected [40]. This is because, in a thicker foam layer, the driving force from the hydrostatic pressure gradient is significantly greater than that from surface tension [40,41]. Therefore, the total driving force for foam spreading can be expressed as:
d P d x = ρ F g d δ d x F γ = γ f d δ d x F 1 = 0 δ ( x + Δ x ) ( d P d x + F γ ) d y 0 δ ( x ) ( d P d x + F γ ) d y = ( ρ F g d δ d x + γ f d δ d x ) Δ x ρ F g d δ d x Δ x
where d P d x is the hydrostatic pressure gradient; ρ F is the foam density; g is the gravitational acceleration; δ is the foam layer thickness; and d δ d x is the spatial gradient of the foam layer thickness. F γ is the surface tension; γ f is the interfacial tension between the foam fluid and the fuel surface; and F 1 is the total driving force.
During the foam spreading process, due to the viscous properties of the foam fluid, a velocity difference exists within the foam layers. Specifically, the foam near the surface of the fuel bed moves more slowly, while the foam at the top of the layer spreads at a faster rate. This velocity difference generates a vertical velocity gradient, which in turn creates shear stress in the horizontal direction. This shear stress acts in the opposite direction to the foam flow. According to the power–law rheological model, the shear stress of the foam fluid can be expressed as:
γ = d u d y v δ ( x ) τ = K γ n F 2 = Δ x 0 δ ( x ) τ d y = K v n δ ( x ) 1 n
where K is the consistency coefficient, n is the flow behavior index, and γ represents the shear rate or the velocity gradient within the foam layer. To simplify the calculation, it is assumed that the flow velocity of the foam layer varies linearly from the bottom (in contact with the surface of the fuel bed) to the top (in contact with the air). Based on this assumption and under quasi-steady-state conditions, where the driving force and resistance are balanced, the spreading velocity can be obtained as:
F 1 = F 2 = ρ F g d δ d x Δ x = K v n δ ( x ) 1 n Δ x v = ρ F g d δ d x K δ ( x ) 1 n 1 / n = ρ F g d δ d x 1 / n K 1 n δ ( x ) 1 1 n
Since foam is a non-Newtonian fluid with shear-thinning properties, the flow behavior index satisfies 0 < n < 1. Consequently, 0 < 1/n, −1/n < 0 and 1 − 1/n < 0. According to Equation (5), the foam spreading velocity is related to the consistency coefficient, foam density, thickness gradient, and thickness. Under constant conditions for other parameters, the foam spreading velocity is negatively correlated with the consistency coefficient and thickness. This is because a larger consistency coefficient indicates higher foam viscosity, which increases flow resistance and reduces the spreading velocity. Additionally, as the foam layer thickness increases, the relative velocity differences between different layers become more pronounced, leading to stronger shear forces that further slow down the foam’s spreading velocity. On the other hand, the foam spreading velocity is positively correlated with foam density and thickness gradient. This is because a higher foam density and thickness gradient indicate a larger foam layer mass and a stronger hydrostatic pressure gradient, resulting in a greater driving force that accelerates foam spreading.
The above analysis determines the surface spreading velocity of foam on the fuel bed. However, due to the porous medium characteristics of the fuel bed, the foam may also continuously penetrate into its interior. Here, the fuel bed is regarded as a bundle of capillaries, with its internal pore channels simplified as capillaries of uniform radius, as shown in Figure 12. When foam is applied to the fuel bed, some of it flows downward through these capillaries from the upper surface to the bottom of the fuel bed. In this process, the pressure induced by the foam’s own weight serves as the primary driving force for penetration. The driving force acting on the foam within the cross-section of a capillary can be expressed as:
F 3 = ρ F g δ π R 2
where F 3 represents the pressure on the upper surface of the fuel bed; ρ F is the foam density; g is the gravitational acceleration; δ is the foam layer thickness; R is the radius of the capillary.
Assuming that the foam flow velocity at a distance r from the center of the capillary cross-section is u, the flow rate through the capillary cross-section can be expressed as:
Q = 0 R 2 π r u d r = v π R 2
where Q is the flow rate at the cross-section of the capillary tube; u is the foam flow velocity at a distance r from the center of the cross-section; v is the average flow velocity at the cross-section; and R is the radius of the capillary tube.
After performing integration by parts on Equation (7) and simplifying, the following expression is obtained:
v R = 1 R 3 0 R r 2 ( d u d r ) d r
Then, the relationship between the shear stress at a distance r from the center of the capillary cross-section ( τ ) and the wall shear stress ( τ c ) can be established as follows:
r τ = R τ c , d r = R τ c d τ , d u d r = τ
Substituting Equation (8) into Equation (9), the relationship between the average flow velocity, shear stress, and shear rate across the cross-section of the capillary can be expressed as:
v R = 1 τ b 3 0 τ c τ 2 γ ( τ ) d τ
Since foam is a non-Newtonian fluid with shear-thinning characteristics, its flow behavior during penetration exhibits nonlinear properties. Based on the viscosity measurement and fitting results in Section 3.1, the power–law rheological model effectively describes the rheological characteristics of foam under different expansion ratios. Substituting this model into Equation (10) and rearranging, the relationship between shear stress at the capillary wall and the average flow velocity can be obtained as:
τ = K γ n , γ = ( τ K ) 1 n v R = 1 τ c 3 0 τ c τ 2 ( τ K ) 1 n d τ τ c = ( v R ) n K ( 3 n + 1 n ) n
Assuming that the flow of foam within the fuel bed is in a steady state, the penetration driving force generated by the foam’s own gravity equals the resistance caused by the shear stress across the entire cross-section of the capillary tube, i.e.,:
F 3 = ρ F g δ π R 2 = τ c 2 π R d = ( v R ) n K ( 3 n + 1 n ) n 2 π R d
Reorganizing Equation (12), the penetration velocity of the foam within the fuel bed can be expressed as:
v = ( 3 n + 1 n ) n ( ρ F g δ R n + 1 2 d K ) 1 n
Equation (13) describes the relationship between the foam’s penetration velocity within the fuel bed and factors such as foam density, foam layer thickness, capillary pore radius in the capillary model, fuel bed depth, and consistency coefficient. Based on the foam’s rheological characteristics, the flow behavior index satisfies 0 < n < 1. Therefore, under constant conditions for other parameters, the foam’s penetration velocity is negatively correlated with the fuel bed depth and foam consistency coefficient. On the other hand, the foam’s penetration velocity is positively correlated with foam density, foam layer thickness, and the capillary radius of the fuel bed. For a given fuel bed, parameters such as the capillary radius and fuel bed depth are already determined. Therefore, the foam’s penetration rate mainly depends on the foam fluid’s consistency coefficient, foam density, and foam layer thickness.

4.2. Control and Extinction Fire Characteristic Indicators

The fitting results of foam viscosity indicate that as the foam expansion ratio increases, the consistency coefficient of the foam gradually increases. Additionally, foams with higher expansion ratios have a higher gas content, which leads to a decrease in their density. Furthermore, according to the developed foam penetration model, the penetration speed of the foam is negatively correlated with the consistency coefficient and positively correlated with foam density. As a result, foams with larger expansion ratios have lower penetration speeds and are more likely to accumulate on the surface of the fuel bed, forming a foam layer of a certain thickness. Although the penetration speed is positively correlated with the foam layer thickness, the effect of thickness on increasing penetration speed is relatively limited. In contrast, foams with smaller expansion ratios, due to their lower viscosity and higher moisture content, can penetrate more effectively into the fuel bed, improving internal cooling. Specifically, for foams with expansion ratios of 5.6 and 10.9, their low viscosity and good flowability enable them to penetrate effectively into the deeper layers of the fuel bed, helping to suppress internal combustion. However, these foams have weak coverage ability and struggle to expand rapidly and fully cover the surface of the fuel bed. Due to their thin consistency, they cannot form an effective coverage layer on the surface of the fuel bed, and some foam may even infiltrate underground and dissipate, weakening the overall firefighting effectiveness. Thus, the viscosity and water content of foam are key factors affecting its penetration and internal cooling performance. Foams with higher viscosity (typically associated with higher expansion ratios) exhibit greater resistance to flow, which limits their ability to infiltrate the porous structure of the fuel bed, thus reducing penetration efficiency. In contrast, lower-viscosity foams (i.e., with lower expansion ratios and higher water content) can more easily penetrate into the fuel bed, enhancing internal cooling by delivering water deeper into the combustion zone.
According to the established foam surface diffusion model, as the foam expansion ratio increases, the penetration speed decreases, and the foam accumulates on the surface of the fuel bed, forming a thickness gradient. The driving force generated by this gradient promotes the expansion of foam in all directions. For a given fuel bed, the foam diffusion speed is negatively correlated with the consistency coefficient and thickness, but positively correlated with foam density and the thickness gradient. Under higher expansion ratios, although the larger consistency coefficient and thickness and the smaller density are not conducive to increasing the diffusion speed, the driving force generated by the thickness gradient significantly enhances the foam’s diffusion ability. Therefore, within the expansion ratio range of this experiment, as the foam expansion ratio increases, the foam can spread and cover the fuel bed more quickly, achieving better coverage and firefighting effectiveness. For example, foams with expansion ratios of 20.6 and 25.4 have higher viscosity and better stacking performance. The smaller, lighter foam bubbles with a looser structure enable them to diffuse more quickly on the surface of the fuel bed and form thicker layers, effectively suppressing surface flame combustion. However, these foams have poor penetration, making it difficult for them to reach the deeper layers of the fuel bed, thus limiting their ability to suppress internal combustion.
Based on the above analysis, it is evident that both the spreading and penetration capabilities of foam are crucial in suppressing forest surface fires, especially in scenarios involving fuels with greater depth. As the expansion ratio increases, the penetration capability of the foam gradually decreases, while its spreading capability improves. Low-expansion foam, with stronger penetration capabilities, demonstrates superior internal cooling performance but has weaker coverage ability. High-expansion foam, with stronger spreading capabilities, exhibits better surface coverage and fire extinguishing performance but has poorer internal cooling ability, making reignition more likely. This implies that relying on a single criterion is insufficient to determine the optimal foam expansion ratio for suppressing forest surface fires. This is because foams with different expansion ratios exhibit conflicting performances in key characteristics such as coverage extinguishing effectiveness (X), internal cooling capacity (Y), and resistance to reignition (Z) (for example, coverage effectiveness may conflict with resistance to reignition). In this study, the next section employs a multi-criteria evaluation method to balance and weigh each indicator, ultimately determining the optimal foam expansion ratio.

4.3. Multi-Criteria Comprehensive Evaluation

To ensure that the contribution of different indicators to the evaluation result depends only on their relative performance and weights, and not on their units, dimensions, or value ranges, the three indicators—extinguishment time (X), average cooling rate (Y), and anti-reignition ability (Z)—were normalized. Among them, anti-reignition ability is a qualitative indicator, which was quantified by assigning the following values: ‘no reignition’ was assigned a value of 1, and ‘reignition’ was assigned a value of 0. The specific formula for normalization is as follows:
(1) Coverage extinguishment time (inverse indicator)
X = X max X X max X min
(2) Average cooling rate (positive indicator)
Y = Y Y min Y max Y min
(3) Anti-reignition ability (positive indicator)
Z = Z
The normalization results are shown in Table 6. For forest surface fires, the three indicators are equally important, so their weights are all 0.33. The comprehensive score for foam control and extinguishment effectiveness under different foaming multiples is then calculated, and the results are presented in Table 7. The calculation formula is as follows:
S = 0 . 33 X + 0 . 33 Y + 0 . 33 Z
According to Table 7, foam with a foam expansion ratio of 15.1 demonstrates the best overall performance in terms of coverage, cooling ability, and re-ignition resistance, making it the recommended optimal choice. If greater emphasis is placed on cooling ability, foam with expansion ratios of 5.6 or 10.9 can be selected. Although foams with expansion ratios of 20.6 and 25.4 exhibit stronger fire suppression coverage, they have poorer re-ignition resistance and slower cooling rates, and should therefore be used with caution.

5. Conclusions

This study simulated forest surface fuel layers using pine needle fuel beds and conducted simulated forest surface fire suppression experiments by adjusting the air-to-liquid ratio of CAFS to produce foams with different expansion ratios. The experiments measured and analyzed the fire suppression coverage capability, internal cooling performance, and reignition resistance of foams with varying expansion ratios. Subsequently, the study explored the effects of foam expansion ratios on surface spreading and internal penetration behaviors and how these factors influenced fire suppression performance. Finally, through a comprehensive evaluation of fire suppression coverage, internal cooling capability, and reignition resistance, the optimal foam expansion ratio was determined, and the liquid supply rate for enhancing fire suppression performance was investigated. The main conclusions are as follows:
(1) The rheological properties of foam can be effectively described using the power–law rheological model, where the rheological index ranges between 0 and 1, indicating shear-thinning behavior. As the expansion ratio increases, both the consistency coefficient and the flow behavior index rise. This suggests that with higher foam expansion ratios, the viscosity of the foam gradually increases, resulting in greater resistance to flow.
(2) As the foam expansion ratio increases, the rising consistency coefficient leads to greater penetration resistance, while the reduced foam density decreases the gravity-induced penetration driving force. Consequently, foams with higher expansion ratios exhibit lower penetration velocities and are more likely to accumulate on the surface of the fuel bed, forming a foam layer of considerable thickness. Although the larger consistency coefficient slightly reduces the spreading velocity of these high-expansion foam layers due to flow resistance, the thickness gradient generates a stronger driving force. Thus, foams with higher expansion ratios tend to spread more effectively across the surface of the fuel bed.
(3) Foams with different expansion ratios exhibit varying strengths and weaknesses across firefighting evaluation metrics. High-expansion foams demonstrate superior surface spreading ability, enabling them to rapidly cover the fuel bed and extinguish visible flames. However, their limited penetration capacity reduces their effectiveness in suppressing subsurface combustion, thereby increasing the likelihood of re-ignition. In contrast, low-expansion foams exhibit stronger localized penetration, allowing them to infiltrate deeper into the fuel bed and deliver excellent internal cooling performance. Nevertheless, their inability to rapidly cover the fuel bed results in weaker surface extinguishment performance. By balancing these metrics, including coverage effectiveness, internal cooling capacity, and resistance to re-ignition, the optimal foam expansion ratio was determined to be 15.1.
(4) Increasing the liquid supply rate enhances firefighting effectiveness. However, when the supply rate exceeds a critical value (10 L/min), the efficiency improvement plateaus. This is because, once the foam’s cooling and air-isolating effects are sufficient to extinguish the flames, further increases in supply rate contribute minimally to these effects. Additionally, the amount of foam mixture consumed during firefighting slightly decreases as the supply rate increases. This occurs because, under low supply rate conditions, the slower foam spreading speed results in some foam evaporating or decomposing before reaching the fuel bed, leading to higher foam mixture consumption.
In summary, CAFS offers the flexibility to tailor foam properties by adjusting the air-to-liquid ratio and expansion ratio. Increasing the expansion ratio promotes the formation of a continuous and uniform foam layer for rapid surface flame suppression, while decreasing the expansion ratio enhances the foam’s ability to penetrate the fuel bed and suppress smoldering combustion. These findings highlight the significant potential of optimized CAFS to improve the effectiveness of forest surface fire suppression.

Author Contributions

Conceptualization, H.W. and J.Z.; methodology, J.Z.; formal analysis, H.W.; investigation, J.Z.; writing—original draft preparation, J.Z.; writing—review and editing, J.Z.; visualization, H.Z.; supervision, L.C.; project administration, H.W.; funding acquisition, H.W. All authors have read and agreed to the published version of the manuscript.

Funding

This research was funded by the National Key Research and Development Program of China, grant number: 2022YFC300490503.

Institutional Review Board Statement

Not applicable.

Informed Consent Statement

Not applicable.

Data Availability Statement

The original contributions presented in this study are included in the article. Further inquiries can be directed to the corresponding author(s).

Conflicts of Interest

The authors declare no conflicts of interest.

References

  1. Prăvălie, R. Major perturbations in the Earth’s forest ecosystems. Possible implications for global warming. Earth Sci. Rev. 2018, 185, 544–571. [Google Scholar] [CrossRef]
  2. Anthwal, A.; Gupta, N.; Sharma, A.; Anthwal, S.; Kim, K.-H. Conserving biodiversity through traditional beliefs in sacred groves in Uttarakhand Himalaya, India. Resour. Conserv. Recycl. 2010, 54, 962–971. [Google Scholar] [CrossRef]
  3. Ekins, P.; Simon, S.; Deutsch, L.; Folke, C.; De Groot, R. A framework for the practical application of the concepts of critical natural capital and strong sustainability. Ecol. Econ. 2003, 44, 165–185. [Google Scholar] [CrossRef]
  4. Rihan, M.; Bindajam, A.A.; Talukdar, S.; Shahfahad; Naikoo, M.W.; Mallick, J.; Rahman, A. Forest fire susceptibility mapping with sensitivity and uncertainty analysis using machine learning and deep learning algorithms. Adv. Space Res. 2023, 72, 426–443. [Google Scholar] [CrossRef]
  5. Gajendiran, K.; Kandasamy, S.; Narayanan, M. Influences of wildfire on the forest ecosystem and climate change: A comprehensive study. Environ. Res. 2024, 240, 117537. [Google Scholar] [CrossRef]
  6. Tan, C.; Feng, Z. Mapping forest fire risk zones using machine learning algorithms in Hunan province, China. Sustainability 2023, 15, 6292. [Google Scholar] [CrossRef]
  7. Benfer, M.; Williams, E. Assessing the impact of fire extinguisher agents on cultural resource materials. Fire Technol. 2018, 54, 289–311. [Google Scholar] [CrossRef]
  8. Stern, J.; Routley, J.G. Class A foam for structural firefighting. In Federal Emergency Management Agency; US Fire Administration: Emmitsburg, MD, USA, 1997. [Google Scholar]
  9. Dahlbom, S.; Mallin, T.; Bobert, M. Fire test performance of eleven PFAS-free class B firefighting foams varying fuels, admixture, water types and foam generation techniques. Fire Technol. 2022, 58, 1639–1665. [Google Scholar] [CrossRef]
  10. Jahura, F.T.; Setiawan, H.; Yildiz, D.; Yu, J.; Turek, E.; Liyanaarachchi, S.; Yu, B.; Peiris, T.; Wijayawardena, H.; Sarker, F. Exploring the Prospects and Challenges of Fluorine-Free Firefighting Foams (F3) as Alternatives to Aqueous Film-Forming Foams (AFFF): A Review. ACS Omega 2024, 9, 37430–37444. [Google Scholar] [CrossRef]
  11. Kim, A.K.; Crampton, G.P. Evaluation of the fire suppression effectiveness of manually applied compressed-air-foam (CAF) system. Fire Technol. 2012, 48, 549–564. [Google Scholar] [CrossRef]
  12. Chen, Y.; Chen, F.; Cheng, X.; Chen, T.; Gou, H.; Tao, J.; Lu, Z.; He, K. Multi-scale experimental study on properties of compressed air foam and pressure drop in the long-distance vertical pipe. J. Build. Eng. 2024, 96, 110397. [Google Scholar] [CrossRef]
  13. Dong, S.; Lu, X.; Wang, D.; Wang, H.; Zheng, K.; Shi, Q.; Chen, M. Experimental investigation of the fire-fighting characteristics of aqueous foam in underground goaf. Process Saf. Environ. Prot. 2017, 106, 239–245. [Google Scholar] [CrossRef]
  14. Wang, K.; Fang, J.; Shah, H.R.; Mu, S.; Lang, X.; Wang, J.; Zhang, Y. A theoretical and experimental study of extinguishing compressed air foam on an n-heptane storage tank fire with variable fuel thickness. Process Saf. Environ. Prot. 2020, 138, 117–129. [Google Scholar] [CrossRef]
  15. Wu, C.; Zhou, T.; Chen, B.; Liu, Y.; Liang, P. Experimental study on burning characteristics of the large-scale transformer oil pool fire with different extinguishing methods. Fire Technol. 2021, 57, 461–481. [Google Scholar] [CrossRef]
  16. Zhang, J.; Shang, F.; Zhang, S.; Wang, L.; Ke, Y.; Huang, J.; Su, W.; Liu, R.; Sheng, Y. Research on Key Parameters and Fire Extinguishing Effectiveness of Compressed Air Foam System Used for UHV Substation. Fire Technol. 2024. [Google Scholar] [CrossRef]
  17. Rappsilber, T.; Below, P.; Krüger, S. Wood crib fire tests to evaluate the influence of extinguishing media and jet type on extinguishing performance at close range. Fire Saf. J. 2019, 106, 136–145. [Google Scholar] [CrossRef]
  18. Huang, C.; Dai, Z.; Jiang, Z.; Chen, Y.; Zhong, M. Wood stack fire tests to evaluate the influence of extinguishing medium and driving pressure on fire extinguishing efficacy of forest trees. Therm. Sci. Eng. Prog. 2024, 49, 102464. [Google Scholar] [CrossRef]
  19. Dai, Z.; Huang, C.; Chen, Y.; Zhong, M.; He, W. Experimental study on fire extinguishing efficiency of polymer hydrogel fire extinguishing agent in pine-fire mixed coniferous forest fires. Case Stud. Therm. Eng. 2024, 64, 105413. [Google Scholar] [CrossRef]
  20. Qiao, Y.; Zhang, H.; Yang, J.; Chen, H.; Liu, N.; Xu, M.; Zhang, L. Transition from smouldering to flaming combustion of pine needle fuel beds under natural convection. Proc. Combust. Inst. 2024, 40, 105343. [Google Scholar] [CrossRef]
  21. Guo, H.; Xiang, D.; Kong, L.; Gao, Y.; Zhang, Y. Upslope fire spread and heat transfer mechanism over a pine needle fuel bed with different slopes and winds. Appl. Therm. Eng. 2023, 229, 120605. [Google Scholar] [CrossRef]
  22. Sullivan, A.L.; Surawski, N.; Crawford, D.; Hurley, R.; Volkova, L.; Weston, C.; Meyer, C. Effect of woody debris on the rate of spread of surface fires in forest fuels in a combustion wind tunnel. For. Ecol. Manag. 2018, 424, 236–245. [Google Scholar] [CrossRef]
  23. Mueller, E.V.; Gallagher, M.R.; Skowronski, N.; Hadden, R.M. Convective heat transfer in pine forest litter beds. Int. J. Heat Mass Transf. 2022, 195, 123057. [Google Scholar] [CrossRef]
  24. Morvan, D.; Dupuy, J.-L. Modeling of fire spread through a forest fuel bed using a multiphase formulation. Combust. Flame 2001, 127, 1981–1994. [Google Scholar] [CrossRef]
  25. Tian, F.; Fang, J.; Tao, S.; Wang, K.; Shah, H.R.; Lang, X.; Tian, Z.; Tang, F. Flame spreading and burning of high-and low-flash point fuels under compressed air foam suppression. Case Stud. Therm. Eng. 2024, 64, 105527. [Google Scholar] [CrossRef]
  26. Tian, F.; Fang, J.; Fang, L.; Shah, H.R.; Lang, X.; Tian, Z.; Tang, F. Experimental study on mass loss mechanism and cooling effect of compressed air foam on fuel surface at different temperatures. Case Stud. Therm. Eng. 2023, 52, 103747. [Google Scholar] [CrossRef]
  27. Zhang, J.; Shang, F.; Wang, L.; Su, W.; Kong, D.; Wang, D.; Guo, Y. Effect of the foam flow rate on extinguishing process for low-expansion foam AFFF, FP, and S based on CAF system. Therm. Sci. Eng. Prog. 2024, 53, 102737. [Google Scholar] [CrossRef]
  28. Zhou, B.; Yang, W.; Yoshioka, H.; Chen, T.; Wang, K.; Hao, D.; Jiang, C.; Cui, K. Research on suppression effectiveness of compressed air foam for oil-immersed transformer hot oil fire. Case Stud. Therm. Eng. 2023, 49, 103272. [Google Scholar] [CrossRef]
  29. Chen, T.; Fu, X.-C.; Bao, Z.-M.; Xia, J.-J.; Wang, R.-J. Experimental study on the extinguishing efficiency of compressed air foam sprinkler system on oil pool fire. Procedia Eng. 2018, 211, 94–103. [Google Scholar] [CrossRef]
  30. Xu, Z.; Guo, X.; Yan, L.; Kang, W. Fire-extinguishing performance and mechanism of aqueous film-forming foam in diesel pool fire. Case Stud. Therm. Eng. 2019, 17, 100578. [Google Scholar] [CrossRef]
  31. Ding, F.; Kang, W.; Yan, L.; Xu, Z.; Guo, X. Influence of gas–liquid ratio on the fire-extinguishing efficiency of compressed gas protein foam in diesel pool fire. J. Therm. Anal. Calorim. 2021, 146, 1465–1472. [Google Scholar] [CrossRef]
  32. Carrier, V.; Destouesse, S.; Colin, A. Foam drainage: A film contribution? Phys. Rev. E 2002, 65, 061404. [Google Scholar] [CrossRef] [PubMed]
  33. Kruglyakov, P.M.; Karakashev, S.I.; Nguyen, A.V.; Vilkova, N.G. Foam drainage. Curr. Opin. Colloid Interface Sci. 2008, 13, 163–170. [Google Scholar] [CrossRef]
  34. Wang, J.; Nguyen, A.V.; Farrokhpay, S. A critical review of the growth, drainage and collapse of foams. Adv. Colloid Interface Sci. 2016, 228, 55–70. [Google Scholar] [CrossRef] [PubMed]
  35. Zhao, L.; Zhang, Q. A significant review of froth stability in mineral flotation. Chem. Eng. Sci. 2024, 302 Pt A, 120738. [Google Scholar] [CrossRef]
  36. Gu, M.; Mohanty, K.K. Rheology of polymer-free foam fracturing fluids. J. Pet. Sci. Eng. 2015, 134, 87–96. [Google Scholar] [CrossRef]
  37. Bashir, A.; Haddad, A.S.; Rafati, R. An experimental investigation of dynamic viscosity of foam at different temperatures. Chem. Eng. Sci. 2022, 248, 117262. [Google Scholar] [CrossRef]
  38. Faroughi, S.A.; Pruvot, A.J.-C.J.; McAndrew, J. The rheological behavior of energized fluids and foams with application to hydraulic fracturing. J. Pet. Sci. Eng. 2018, 163, 243–263. [Google Scholar] [CrossRef]
  39. Conroy, M.W.; Ananth, R. Fuel surface cooling by aqueous foam: A pool fire suppression mechanism. Fire Technol. 2015, 51, 667–689. [Google Scholar] [CrossRef]
  40. Tian, F.; Fang, J.; Shah, H.R.; Lang, X.; Tian, Z.; Tang, F. Experimental Study on Foam Spreading on Fuel Layers with Different Thicknesses. Fire Technol. 2024. [Google Scholar] [CrossRef]
  41. Fay, J.A. Physical processes in the spread of oil on a water surface. In Proceedings of the International Oil Spill Conference, Online, 10–14 May 2021; Volume 1971, pp. 463–467. [Google Scholar]
Figure 1. Structural schematic of CAFS.
Fire 08 00171 g001
Figure 2. The foam firefighting experimental model.
Fire 08 00171 g002
Figure 3. Foam viscosity testing: (a) R/S rheometer; (b) variation in viscosity with shear rate under different expansion ratios.
Fire 08 00171 g003
Figure 4. Typical flame shapes during free burning of the pine needle fuel bed.
Fire 08 00171 g004
Figure 5. Temperature variation trends during two free burning experiments: (a) first free burning experiment; (b) second free burning experiment.
Fire 08 00171 g005
Figure 6. Typical flame shapes during the foam fire suppression process under different expansion ratios.
Fire 08 00171 g006
Figure 7. Temperature curves and average cooling rates inside the fuel bed under different foam expansion ratios: (a) average temperature variation curves of the fuel bed under different foam expansion ratios; (b) average cooling rates of the fuel bed under different foam expansion ratios (including repeated experiments).
Fire 08 00171 g007
Figure 8. Re-ignition phenomenon: (a) re-ignition phenomenon under the foam expansion ratio of 20; (b) re-ignition phenomenon under the foam expansion ratio of 25.
Fire 08 00171 g008
Figure 9. Typical flame shapes during the foam fire suppression process under different liquid flow rates.
Fire 08 00171 g009
Figure 10. Foam coverage suppression time and the amount of foam mixture required for fire suppression under different liquid flow rates (average value of repeated experiments).
Fire 08 00171 g010
Figure 11. Schematic diagram of foam layer spreading on the fuel bed.
Fire 08 00171 g011
Figure 12. Penetration of foam layer into the porous fuel bed.
Fire 08 00171 g012
Table 1. Basic parameters of fuel bed.
Fuel Load (kg/m2)Fuel Depth (cm)Bulk Density (g/cm3)
3.014.80.203
Table 2. Basic performance indicators of Class A foam concentrate.
Storage Temperature (°C)Fire-Extinguishing Mixture Ratio (%)Thermal Insulation Mixture Ratio (%)
−5~500.51
Table 3. Fitting parameters of the rheological model under different foam expansion ratio conditions.
Foam Expansion RatioFitting Parameters
KnR2
5.13.060.540.95
10.94.310.550.96
15.14.490.600.98
20.64.680.610.98
25.44.780.620.98
Table 4. Foam coverage extinguishment time under different foam expansion ratios (average of repeated experiments, with SD representing standard deviation).
Foam expansion ratio5.610.915.120.625.4
Foam coverage extinguishing time [s] (SD)128(10)114(7)68(12)56(15)45(9)
Table 5. Foam re-ignition resistance time under different foam expansion ratios (average of repeated experiments, with SD representing standard deviation; “-” indicates no re-ignition).
Foam Expansion Ratio5.610.915.120.625.4
Reignition resistance time [s] (SD)---154(9)126(7)
Table 6. Normalized data of each indicator under different foam expansion ratios.
Foam
Expansion Ratio
Foam Coverage and
Extinguishing Capability (Normalization)
Cooling
Capability
(Normalization)
Re-Ignition Resistance Capability
(Normalization)
5.6011
10.90.16130.83981
15.10.70970.55421
20.60.77420.02860
25.4100
Table 7. Comprehensive score of foam fire suppression performance under different foam expansion ratios.
Foam expansion ratio5.610.915.120.625.4
S0.60.66040.74710.26490.33
Disclaimer/Publisher’s Note: The statements, opinions and data contained in all publications are solely those of the individual author(s) and contributor(s) and not of MDPI and/or the editor(s). MDPI and/or the editor(s) disclaim responsibility for any injury to people or property resulting from any ideas, methods, instructions or products referred to in the content.

