Abstract
Polylactic acid (PLA) is a biodegradable polymer served as thermal management material, and the heat transfer performance is closely related to its pore structure theoretically, but it is unclear how the structure affects its heat transfer. Therefore, a novel approach is proposed to address this issue by numerical simulations at low complexity and cost; three series of porous PLA are investigated with various structures in pore shape, size, and interval by fire dynamic simulation (FDS) and theoretical modeling, respectively. Meanwhile, the relationship between the hole structure and heat release rate (HRR) is developed by defining a new characteristic shape factor (Sc). It demonstrates that adjusting the pore structure of PLA significantly alters its heat transfer, evidenced by significant variations in HRR and smoke density. Additively, the approach for evaluating heat transfer is elucidated, encompassing the hole closure, vortex heat dissipation effect, and narrow variable speed effect. It provides some theoretical basis for designing porous thermal management materials.
1. Introduction
Polylactic acid (PLA) is a biodegradable and flammable polymer, which limits its widespread applications as thermal management material during high-temperature service conditions, including in medicine, textiles, packaging, electronics, and automobile production. Therefore, dynamic vulcanization [1] and doping bamboo-char biocomposites [2] or graphene nanocomposites [3] have been employed to improve its thermal stability. Specifically, the pore structure predominates its heat transfer for the porous PLA, which provides approaches to adjust its heat transfer performance for applications.
Because the heat transfer performance of PLA is closely related to its pore structure [4] as well as its mechanical properties [5], Feng et al. [6] found that the microporous-micronucleus composite structure endowed heterogenous polyamide 6 with fire retardancy. Because of the as-formed low thermal conductivity in the porous structure [7], the thermal conductivity varies from the various shapes within the polymer matrix [8]. However, it is unclear how the pore structure quantitatively affects the heat transfer of the porous PLA, because the various configurations of porous PLA generate different real-time heat transfer properties in theory.
From the literature review, it was realized that limited work has been reported on understanding the pore structure–heat transfer relationships associated with various porous PLA. To address this shortcoming, the reported literature inspires us to explore the effect of pore structure on the heat transfer performance of PLA; our efforts have demonstrated that the combustion performance varies from the porous structure of PLA by static experiment previously [9], but the dynamic fire loading scenarios are more important for its applications [10]. Especially for the emerging porous PLA, the pore structure is crucial for its heat transfer performance during fire.
Consequently, this study comparatively investigates the heat transfer performance on the three series of samples with varying pore shapes, diameters, and intervals, respectively. The novelty of the paper lies in evaluating the heat transfer properties of porous PLA with various configurations, through numerical simulation and theoretical analysis. The main purpose and value of this work is to explore the effect of various pore structures on the heat transfer of porous PLA, providing some theoretical basis for designing high-performance, low-carbon, and energy-efficient thermal management materials, promoting the research and development of energy-saving materials.
2. Methodology
2.1. Fire Dynamics Simulation FDS
The fire dynamics simulation software (FDS 6.0.0) has been widely employed for numerical simulations on fires [11,12]; the sample parameter is set according to Table 1 [9], and the hole interval means the distance between the adjacent holes. It is based on computational fluid dynamics and is suitable for simulating low-velocity and thermally driven fire scenarios. Meanwhile, the hydrodynamic model, the thermal radiation model, and the combustion model are the three primary control equations in FDS [13].

Table 1.
Parameters for three sets of PLA samples including Ⅰ, Ⅱ, and Ⅲ.
2.2. Parameter Settings
The software (FDS 6.0.0) is used to simulate the exothermic fire of different hole structures in a specific fire scenario. The following parameters were chosen for the FDS model through a large number of experiments based on trial method.
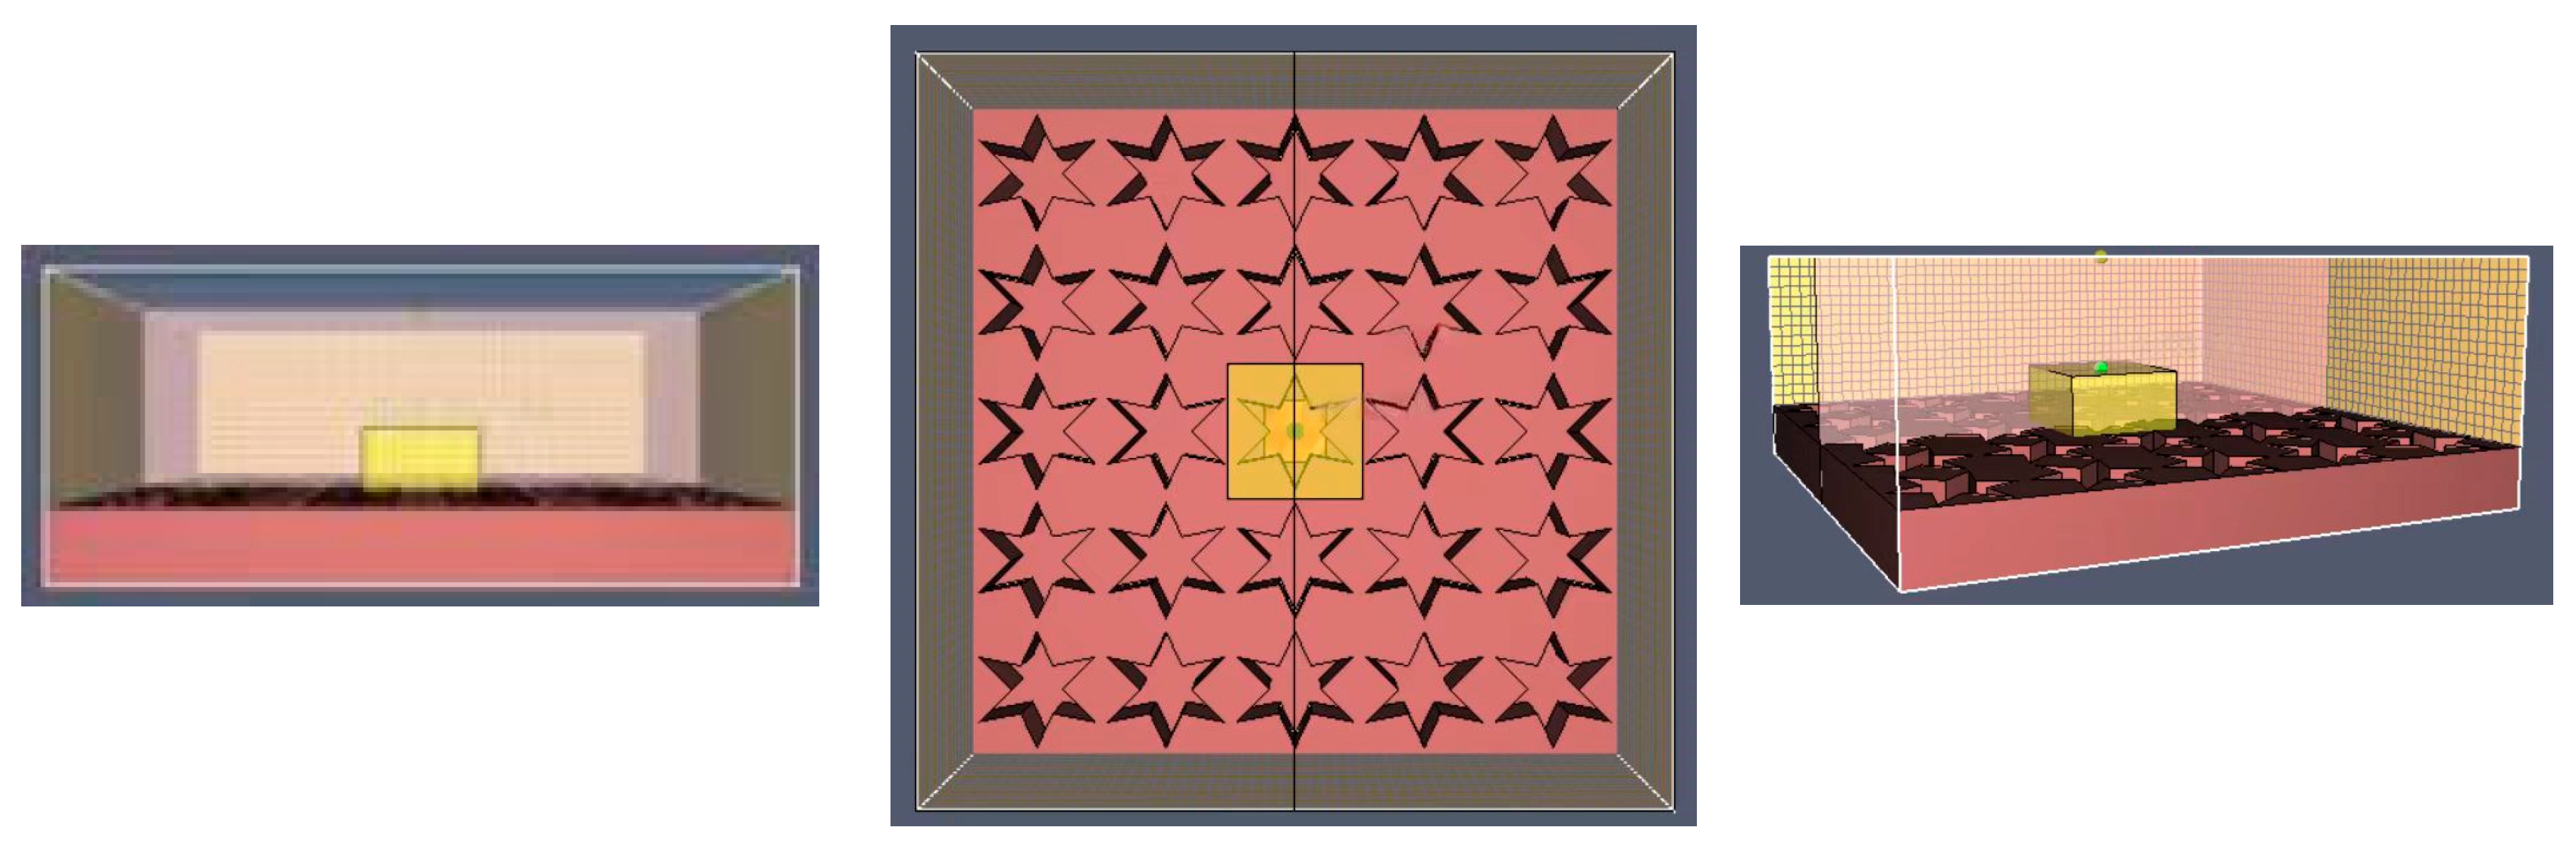
(1) The meshing method affects the accuracy of the numerical simulation results [14]. Considering that the model calculation area is 0.1 × 0.1 × 0.1 m with a grid size of 0.01 × 0.01 × 0.01 m eventually.
(2) The ventilation surface was set directly above the upper surface of the model, without adding an air supply system or fan.
(3) A fire source was set directly below the lower surface of the model, with the combustion method set to propane combustion.
(4) Thermocouples were set at 0.2 m and 0.4 m directly above the model, and a cut plane was set at X = 0.05 m. In addition, the HRR and smoke density elements were enabled to monitor the combustion process of the system. The simulation scenario is illustrated in Figure 1, with the thermocouple positions indicated by the green points, and the cut plane indicated by the pink area.
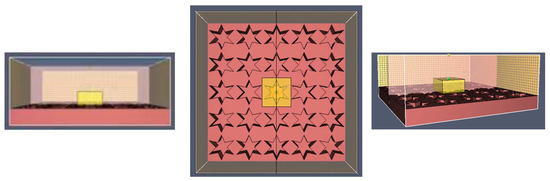
Figure 1.
FDS simulation scenario.
(5) The simulation duration was set as 600 s, because the PLA burns out during 600 s under the external radiant heat flow of 35 kW/m2; the digital simulation and thermal parameter acquisition are set at 600 s.
3. Results and Discussion
3.1. Fire Dynamics Simulation
3.1.1. Heat Release Rate
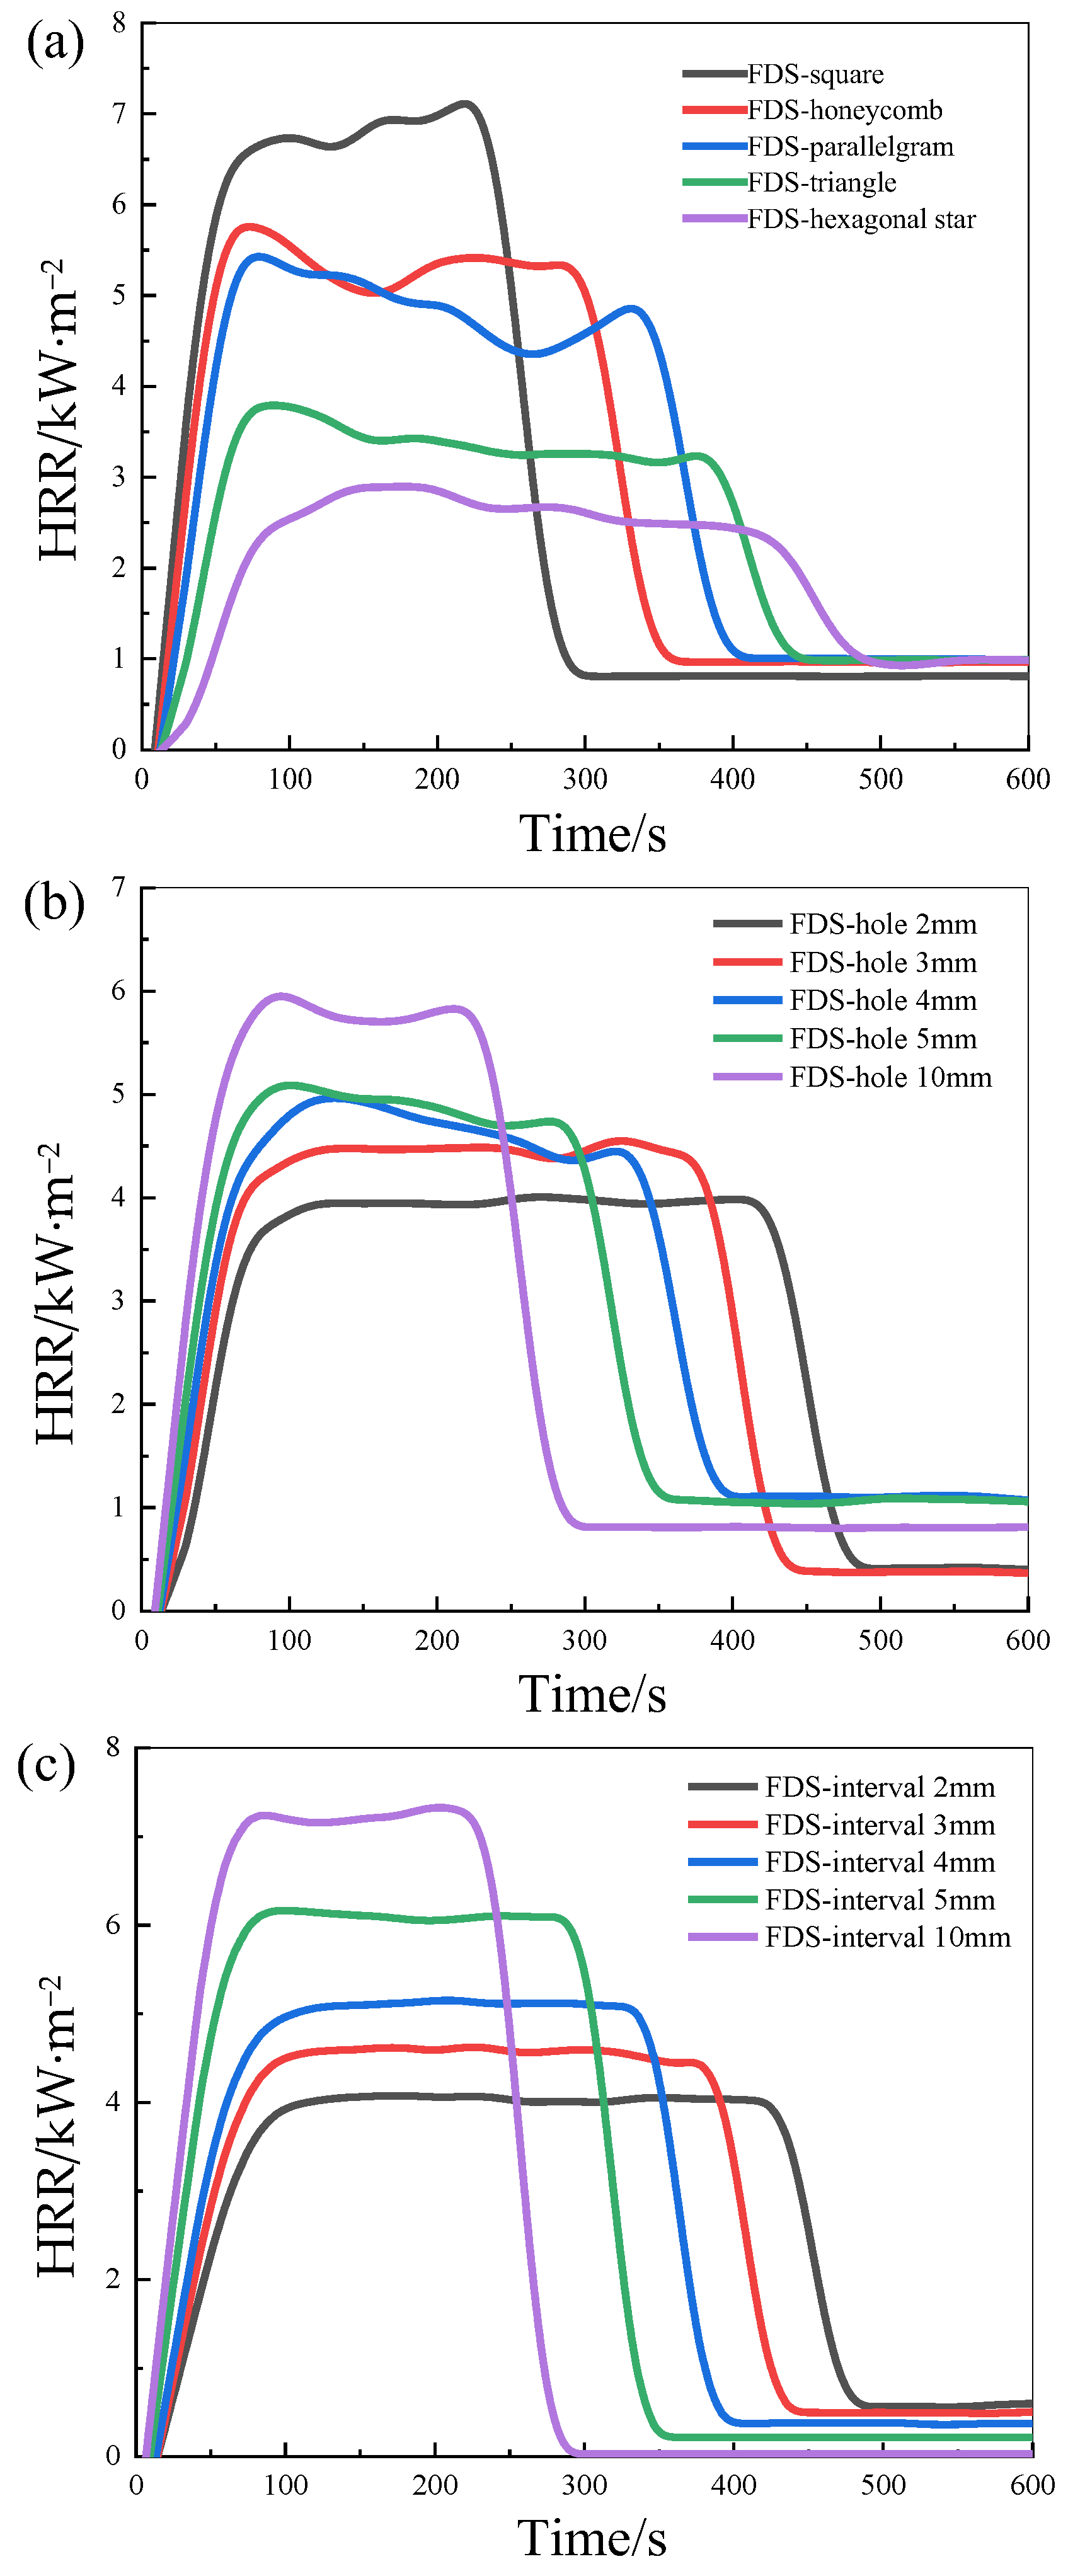
As observed in Figure 2a, the simulated HRR for the square form PLA is substantially higher than for the other hole shapes. The higher the HRR, the faster the heat transfer, because the experiment compares the heat release performance of unit mass PLA under the same thermal radiation condition, thus the improved HRR corresponds to enhanced heat transfer performance. The HRR curves for triangular and hexagonal follow a similar pattern with only small deviations from each other, and the hexagonal holes have the lowest HRR values. The HRR profiles for different pore sizes are illustrated in Figure 2b. For the 10 mm holes, the curve peaks at roughly 6 kW·m−2, which is 57.89% higher than for the FDS-hole 2 mm curve. Meanwhile, the FDS simulation results vary with the hole interval of the model, Figure 2c shows the p-HRR gradually “moving up” and to the left, as the pore interval increases. In addition, the plateau period for combustion stabilization is progressively shorter, corresponding to enhanced heat transfer.
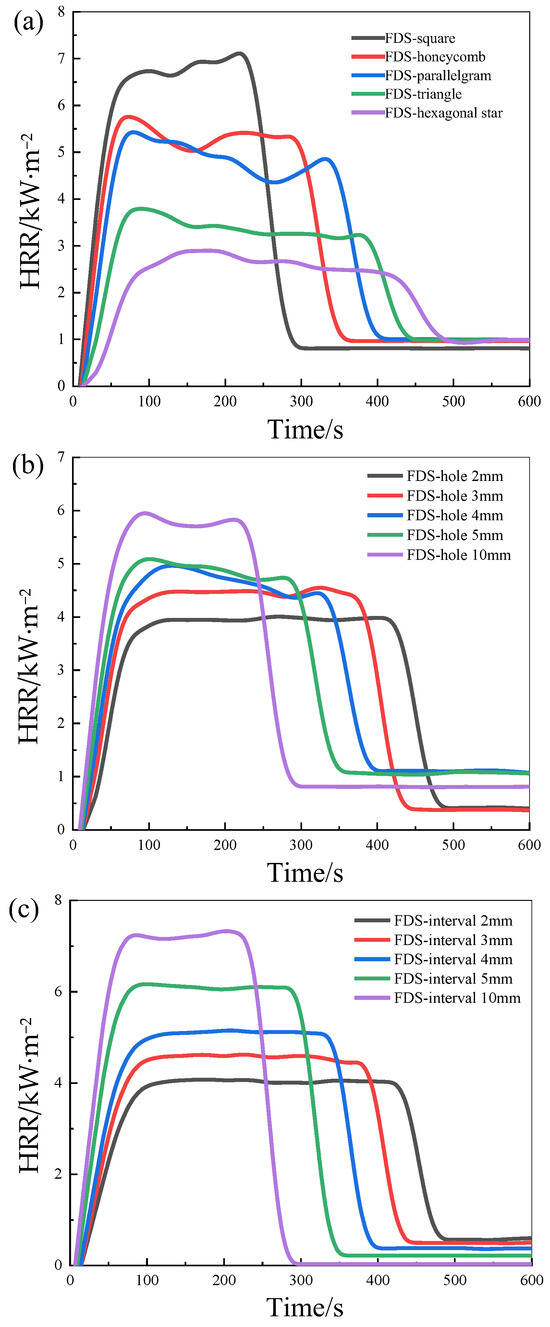
Figure 2.
HRR curves of different hole structures including (a) hole shape, (b) hole size, and (c) hole interval, respectively.
3.1.2. Smoke Density
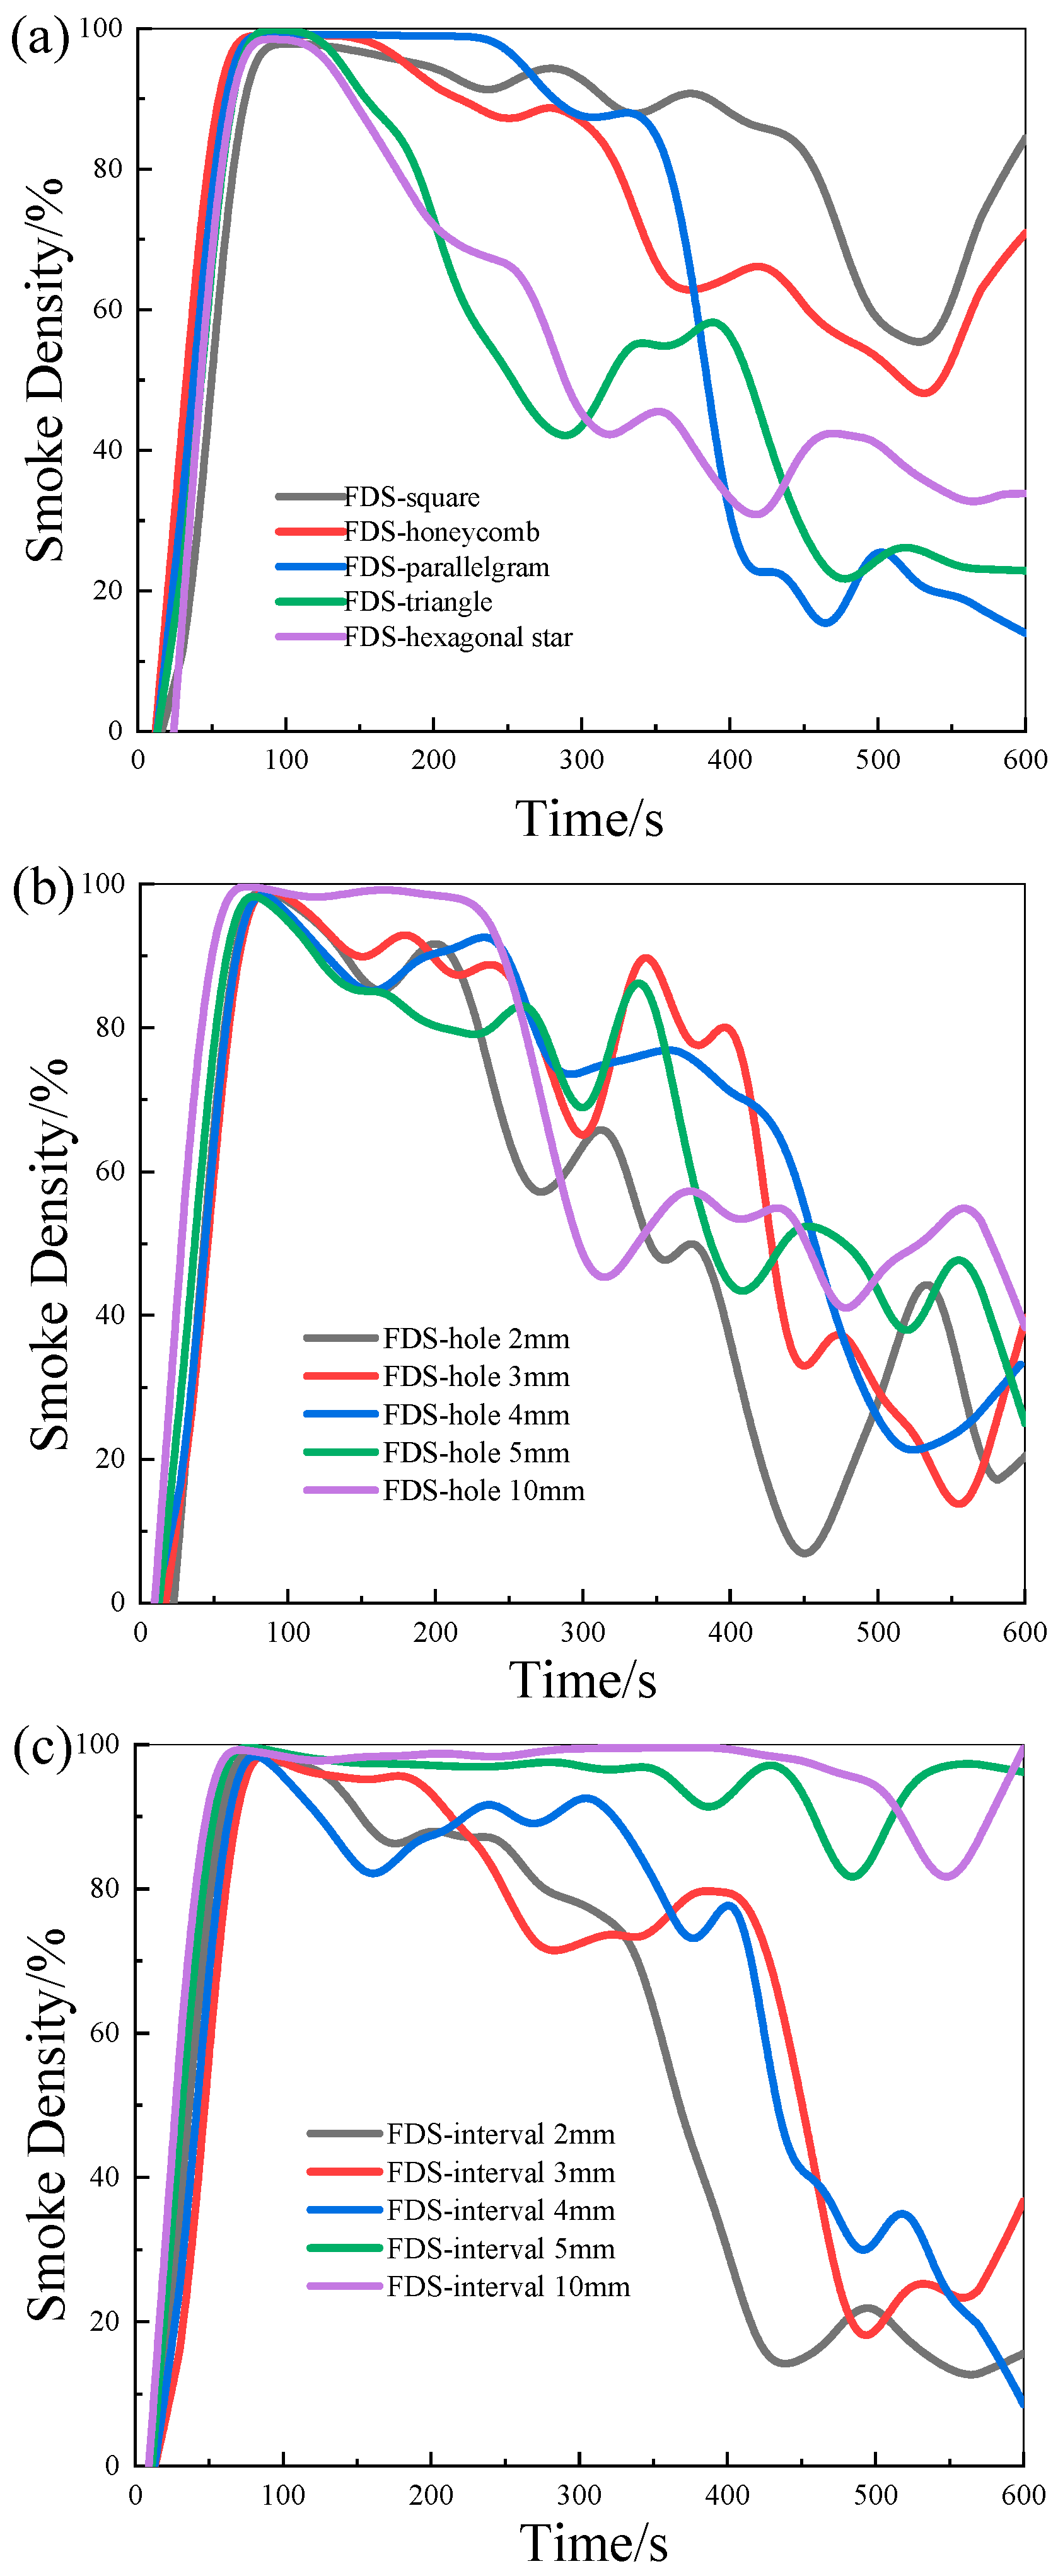
The smoke density and average smoke density are calculated to indicate the change in total smoke density throughout the combustion process and are shown in Figure 3 and Table 2, according to the Formulas (1) and (2). The FDS-hexagonal, FDS-hole 2 mm, and FDS-interval 2 mm have the lowest average smoke density area among all the samples. This demonstrates that selecting the appropriate hole structures reduces the quantity of smoke produced during a fire and allows for easier rescue and escape.
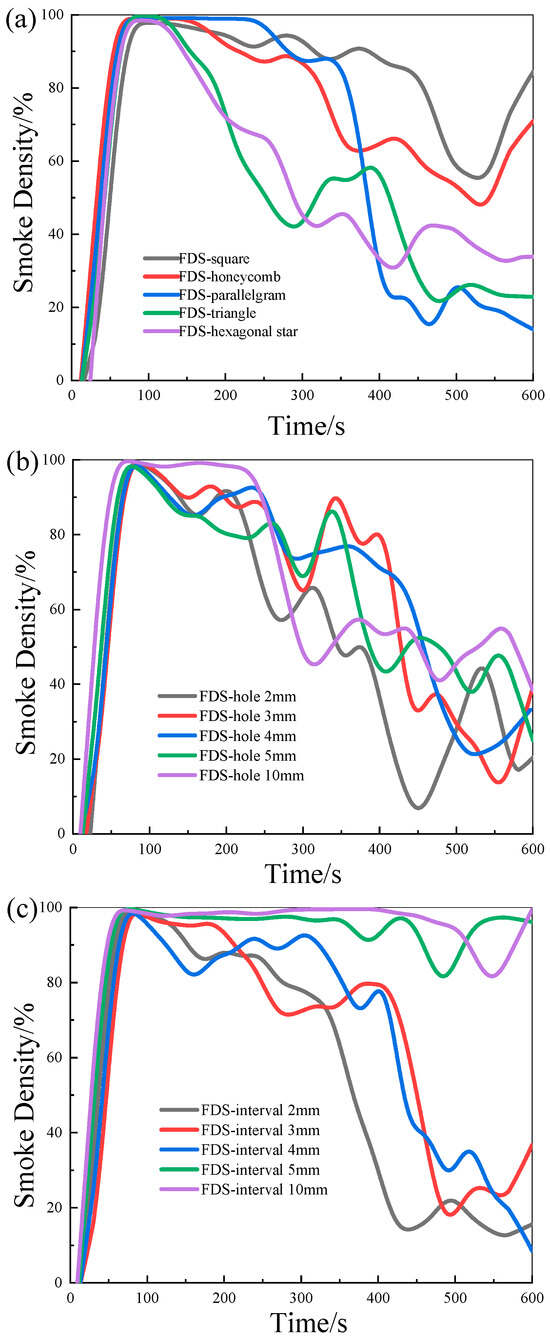
Figure 3.
Simulation smoke density curves for different hole structures including (a) hole shape, (b) hole size, and (c) hole interval, respectively.
Table 2.
Simulation of smoke density areas for different hole structures.
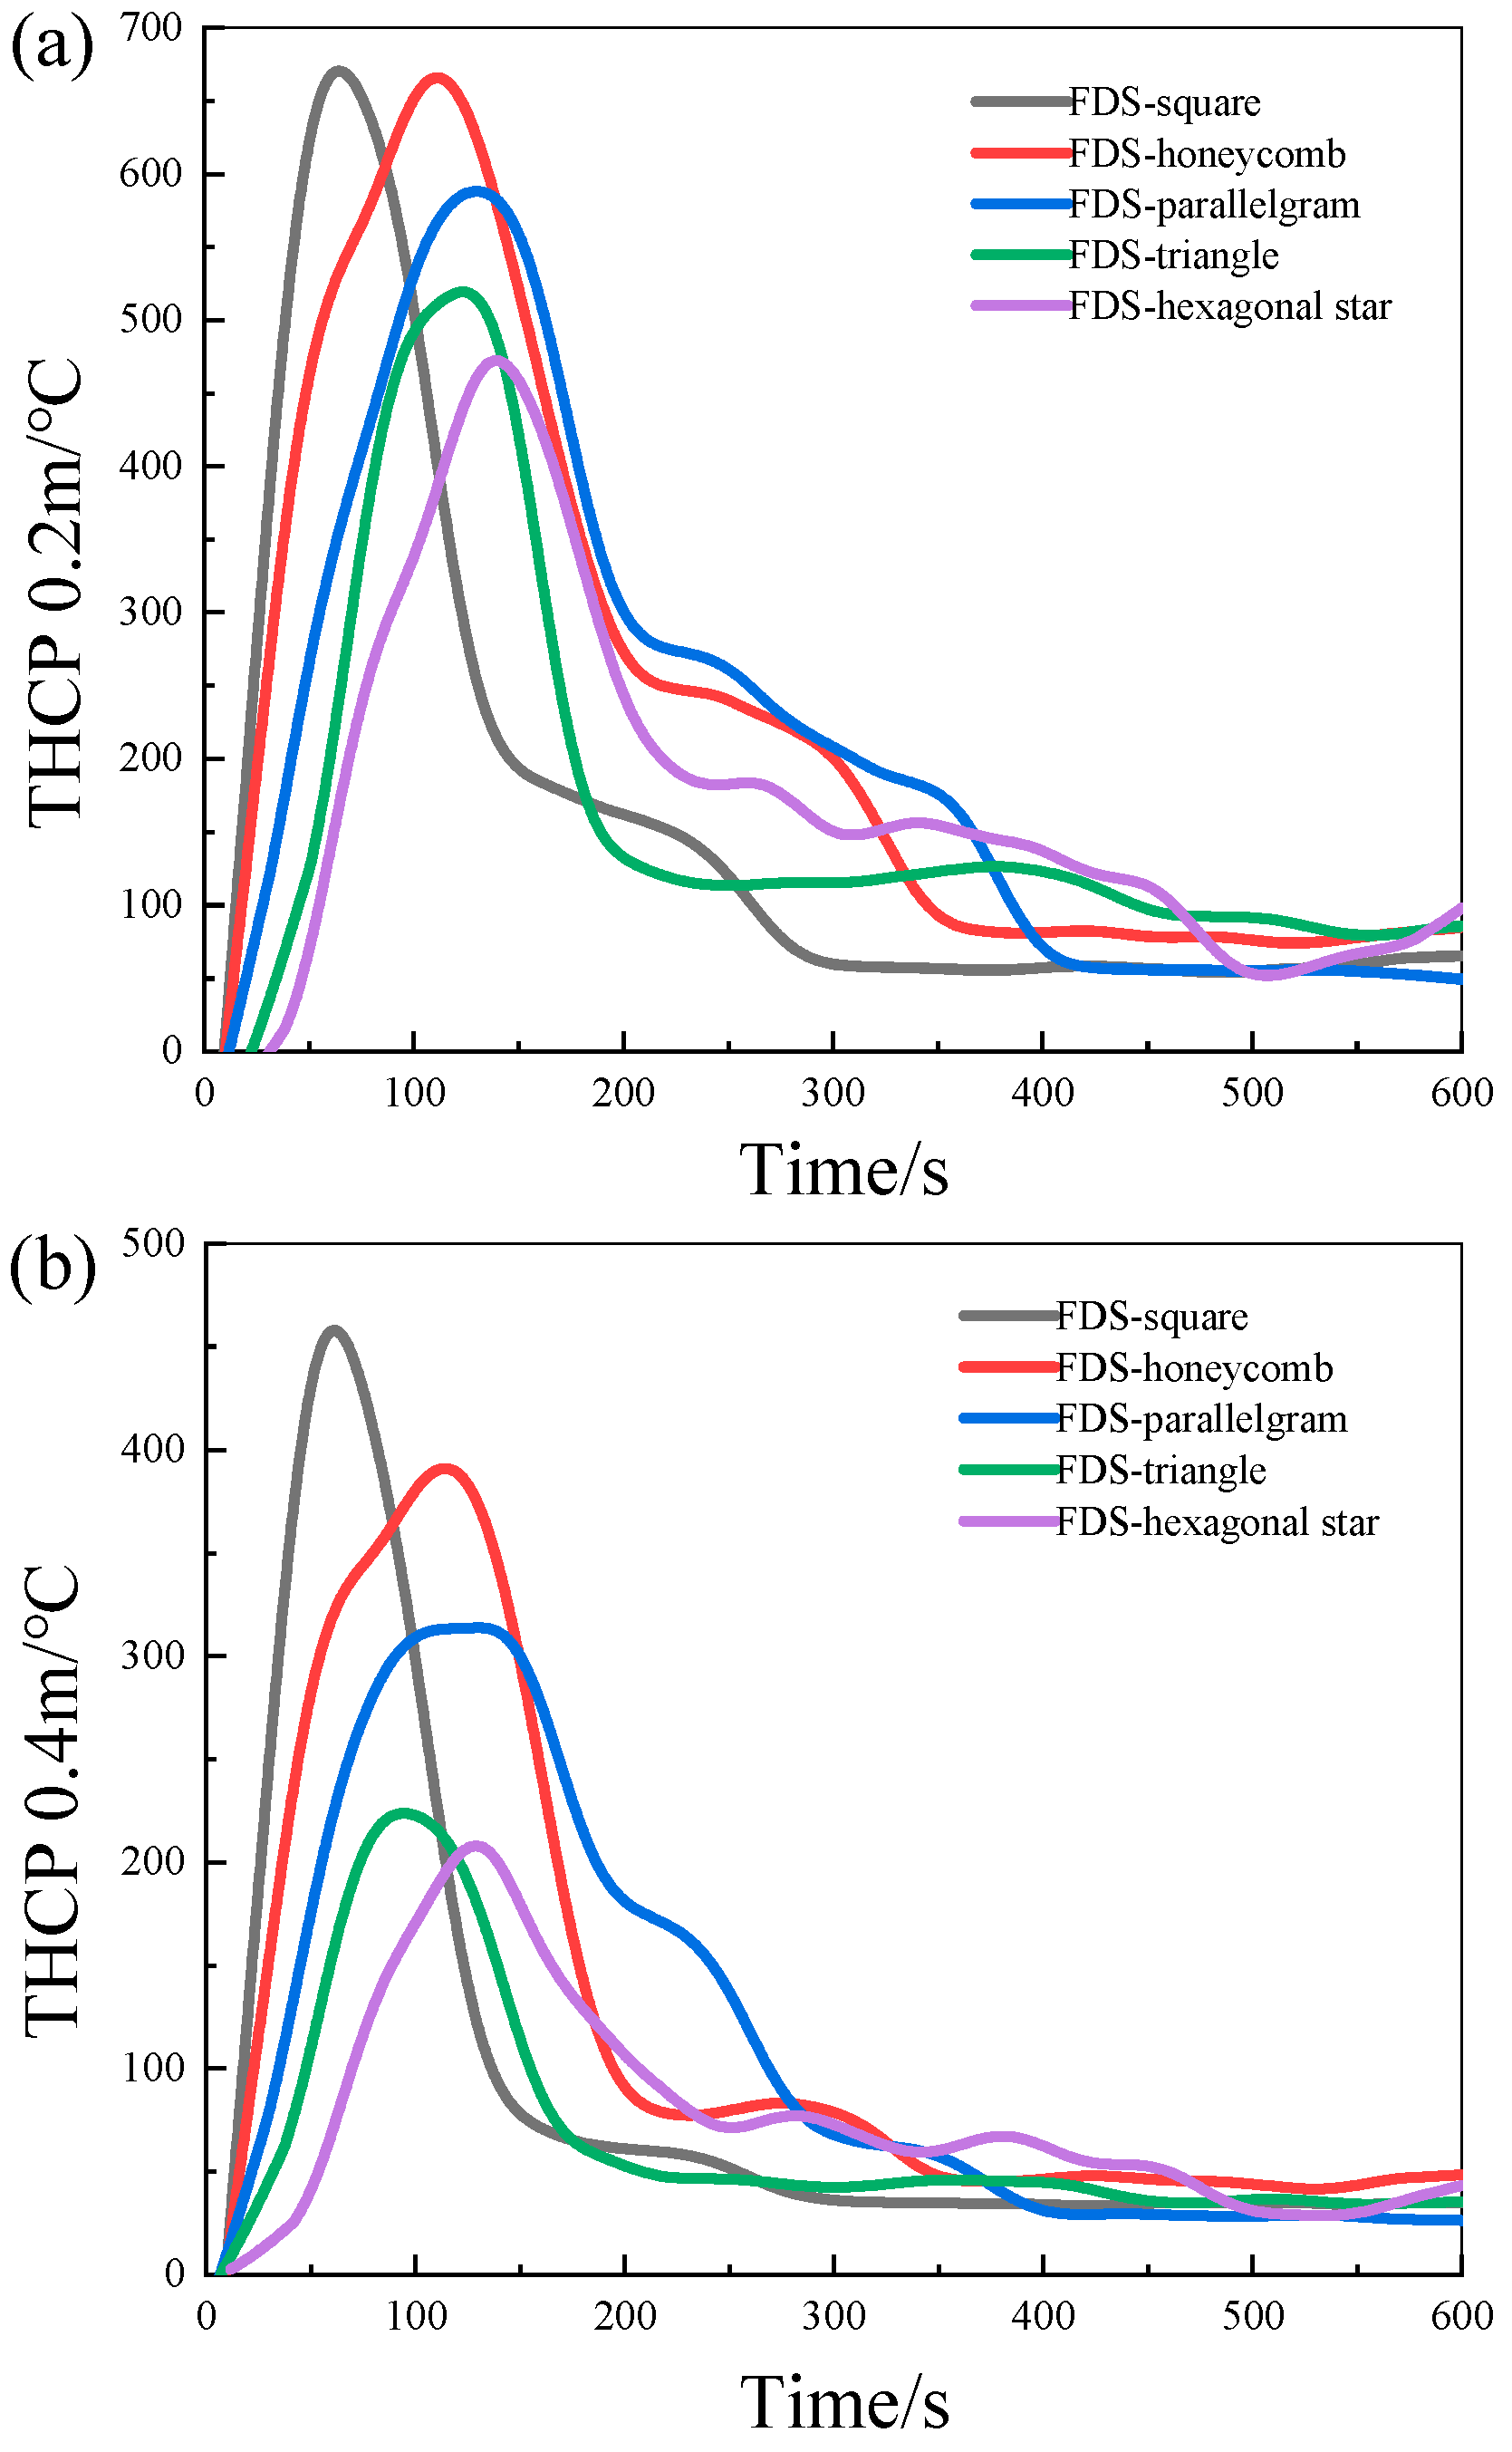
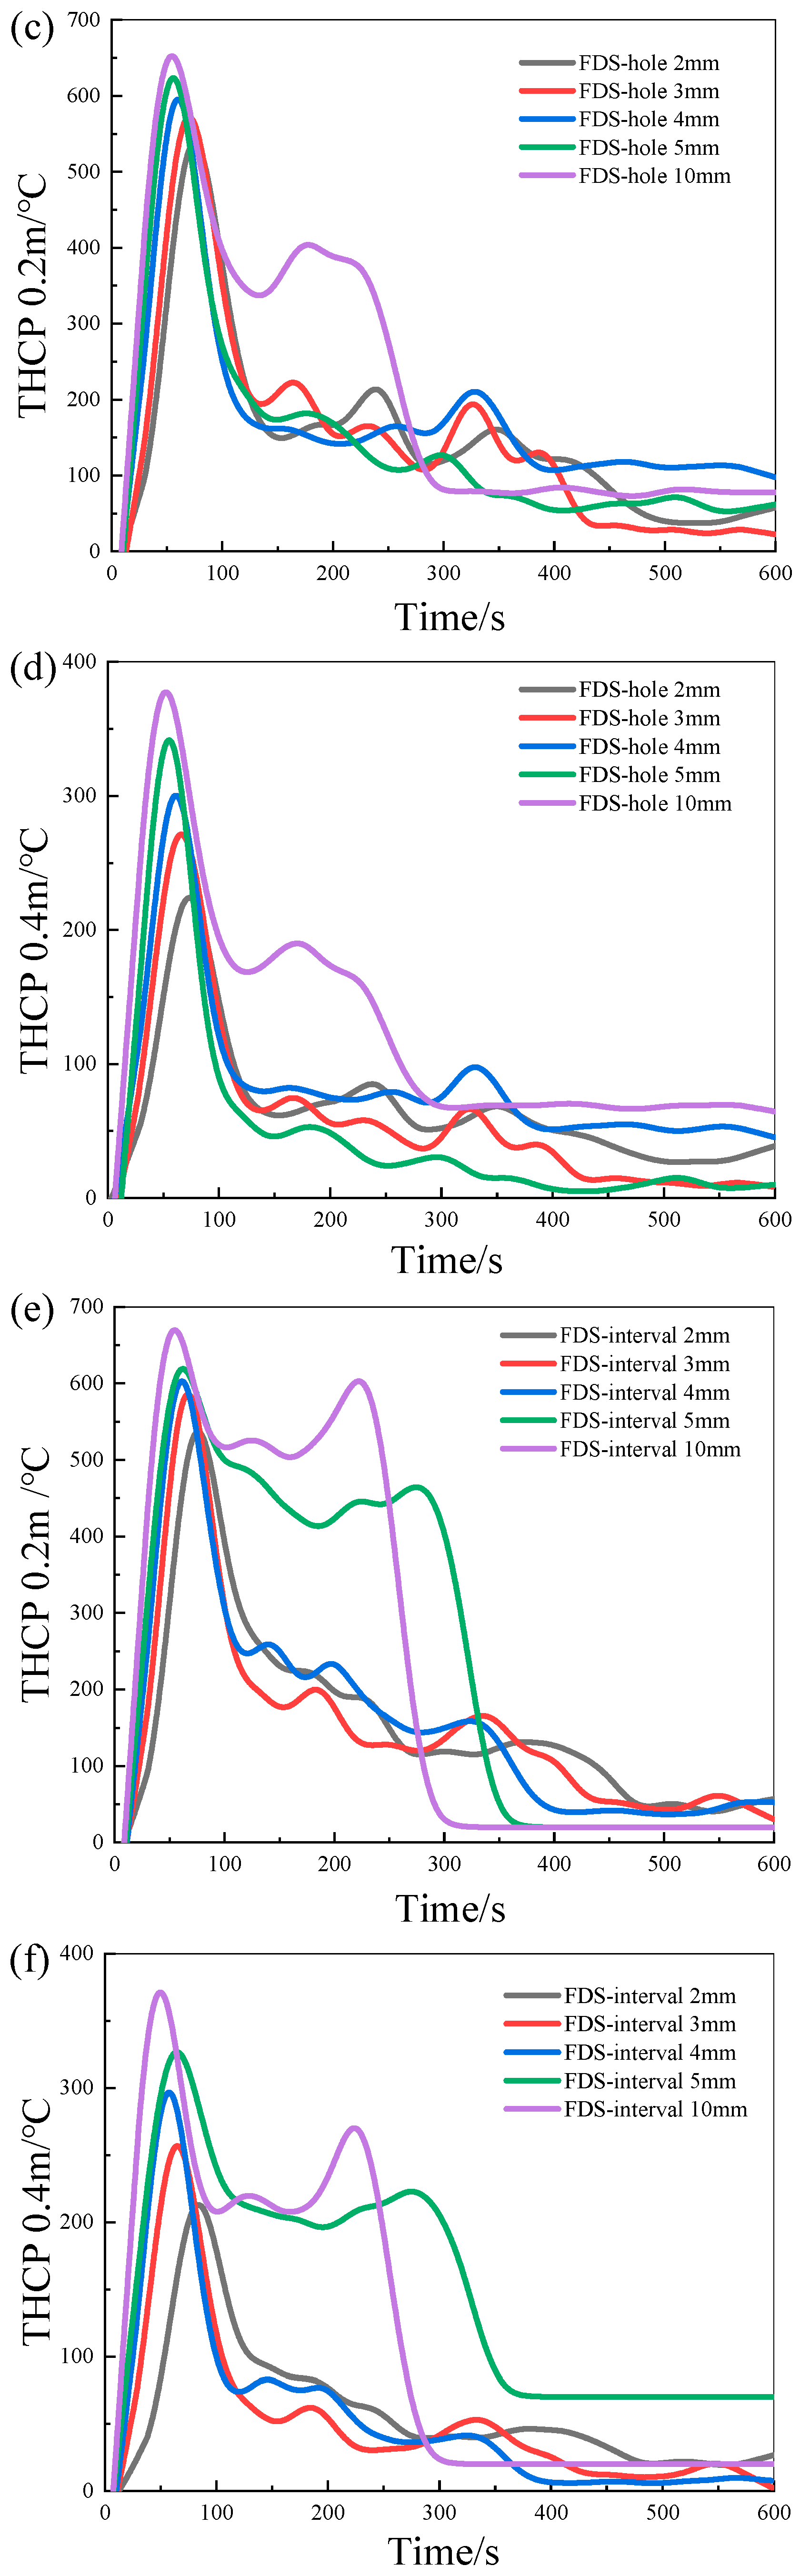
3.1.3. Temperature Fluctuations
Additionally, the temperature fluctuations at 0.2 m and 0.4 m heights for the various cavity structures are illustrated in Figure 4. The square and honeycomb cavity forms exhibit the highest temperature curves at heights of 0.2 m and 0.4 m. The hexagonal hole structure has the lowest curve, with a maximum temperature and a longer time to achieve the maximum temperature in Figure 4a,b. Furthermore, the temperatures for the FDS-hole 10 mm at 0.2 m and 0.4 m are substantially higher than those for the other four sizes in Figure 4c,d. The differential temperature is significantly higher at 0.4 m, with the 10 mm hole reaching about 400 °C and the smallest model reaching only about 200 °C. In addition, the FDS-interval of 10 mm has the greatest peak temperature at the both two heights, and the FDS- interval of 2 mm has the lowest peak corresponding to the diminished heat transfer, as shown in Figure 4e,f.
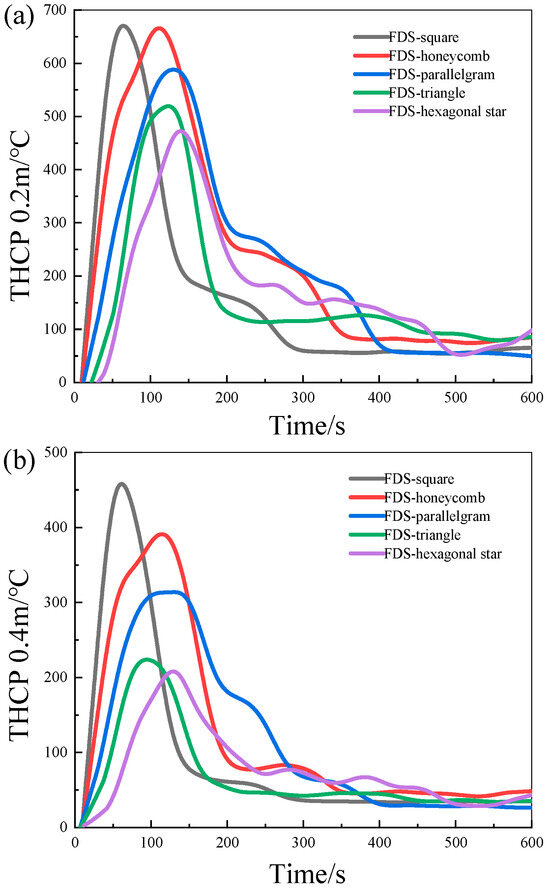
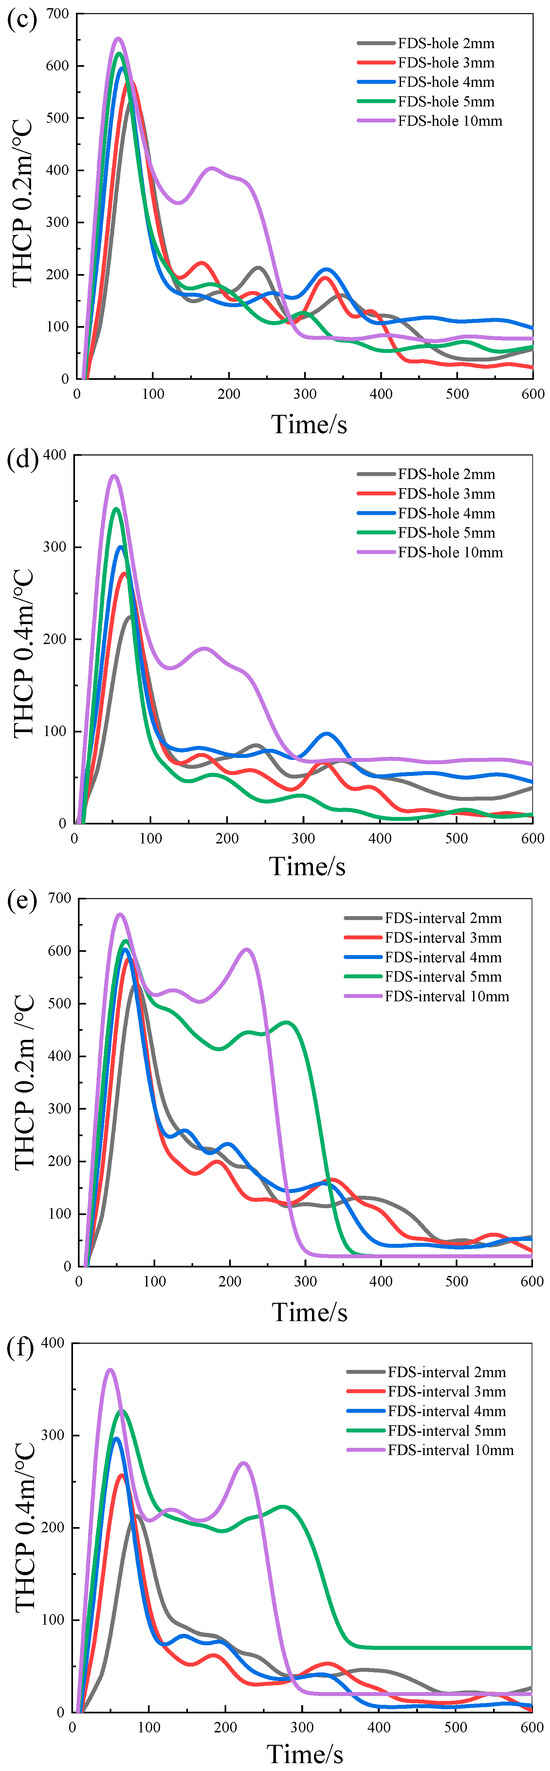
Figure 4.
Simulation THCP 0.2 m and 0.4 m curves for different hole structures including (a) hole shapes 0.2 m, (b) hole shapes 0.4 m, (c) hole sizes 0.2 m, (d) hole sizes 0.4 m, (e) hole intervals 0.2 m, and (f) hole intervals 0.4 m, respectively.
3.2. Theoretical Analysis
3.2.1. Modified Characteristic Shape Factor (Sc)
Many studies in recent years have found that the geometry of the pore has a significant impact on fluid flow in natural convection [15,16,17,18]. Generally, the characteristic length is the key scale affecting the heat convection of flow field patterns in cavities of different shapes. Especially, the dynamics of the flow field need to be scaled with a meaningful length scale associated with the available channels of the fluid [19]. When analyzing a fluid flow, it is important to identify a characteristic length scale Lc, which is used to reflect its unique properties.
The shape of the cavity is an important parameter affecting the natural convection of the cavity [20]. On one hand, it is required to specify a suitable Lc to combine experimental results with practical applications. On the other hand, the precise determination of the geometrical scale is also necessary for the subsequent analysis of Ra values [21]. However, the original formula fails to account for variations in geometric properties [22]. Ac is the cross-sectional area of the pore and P denotes the circumference of the hole, as shown in Formula (3).
It has been demonstrated that the capacity of the internal high-viscosity object for heat transfer and exchange relates to the angle of the cavity form (θ) and the size of the internal rotation circle (r) [23,24]. As a result, the newly established formulations for the characteristic shape factor include θ and r. In addition, heat transfer performance is significantly influenced by size and alignment [25,26]. One dependent variable and four independent variables make up the correlation equation for the characteristic shape factor, as illustrated in Formulas (4)–(6). These factors that correlate to the characteristic length scale can have a significant impact on practice [27].
ε denotes porosity, q is the sample weight, θ represents the inner angle size, s indicates the pore size, and i is for the pore interval. h is the depth of the pore, L is the side length of the model, and V represents the total volume. In this study, h, L, and V are deterministic values, h = 4, L = 100, and V = 50,000, respectively.
3.2.2. Relationship Between Sc and HRR
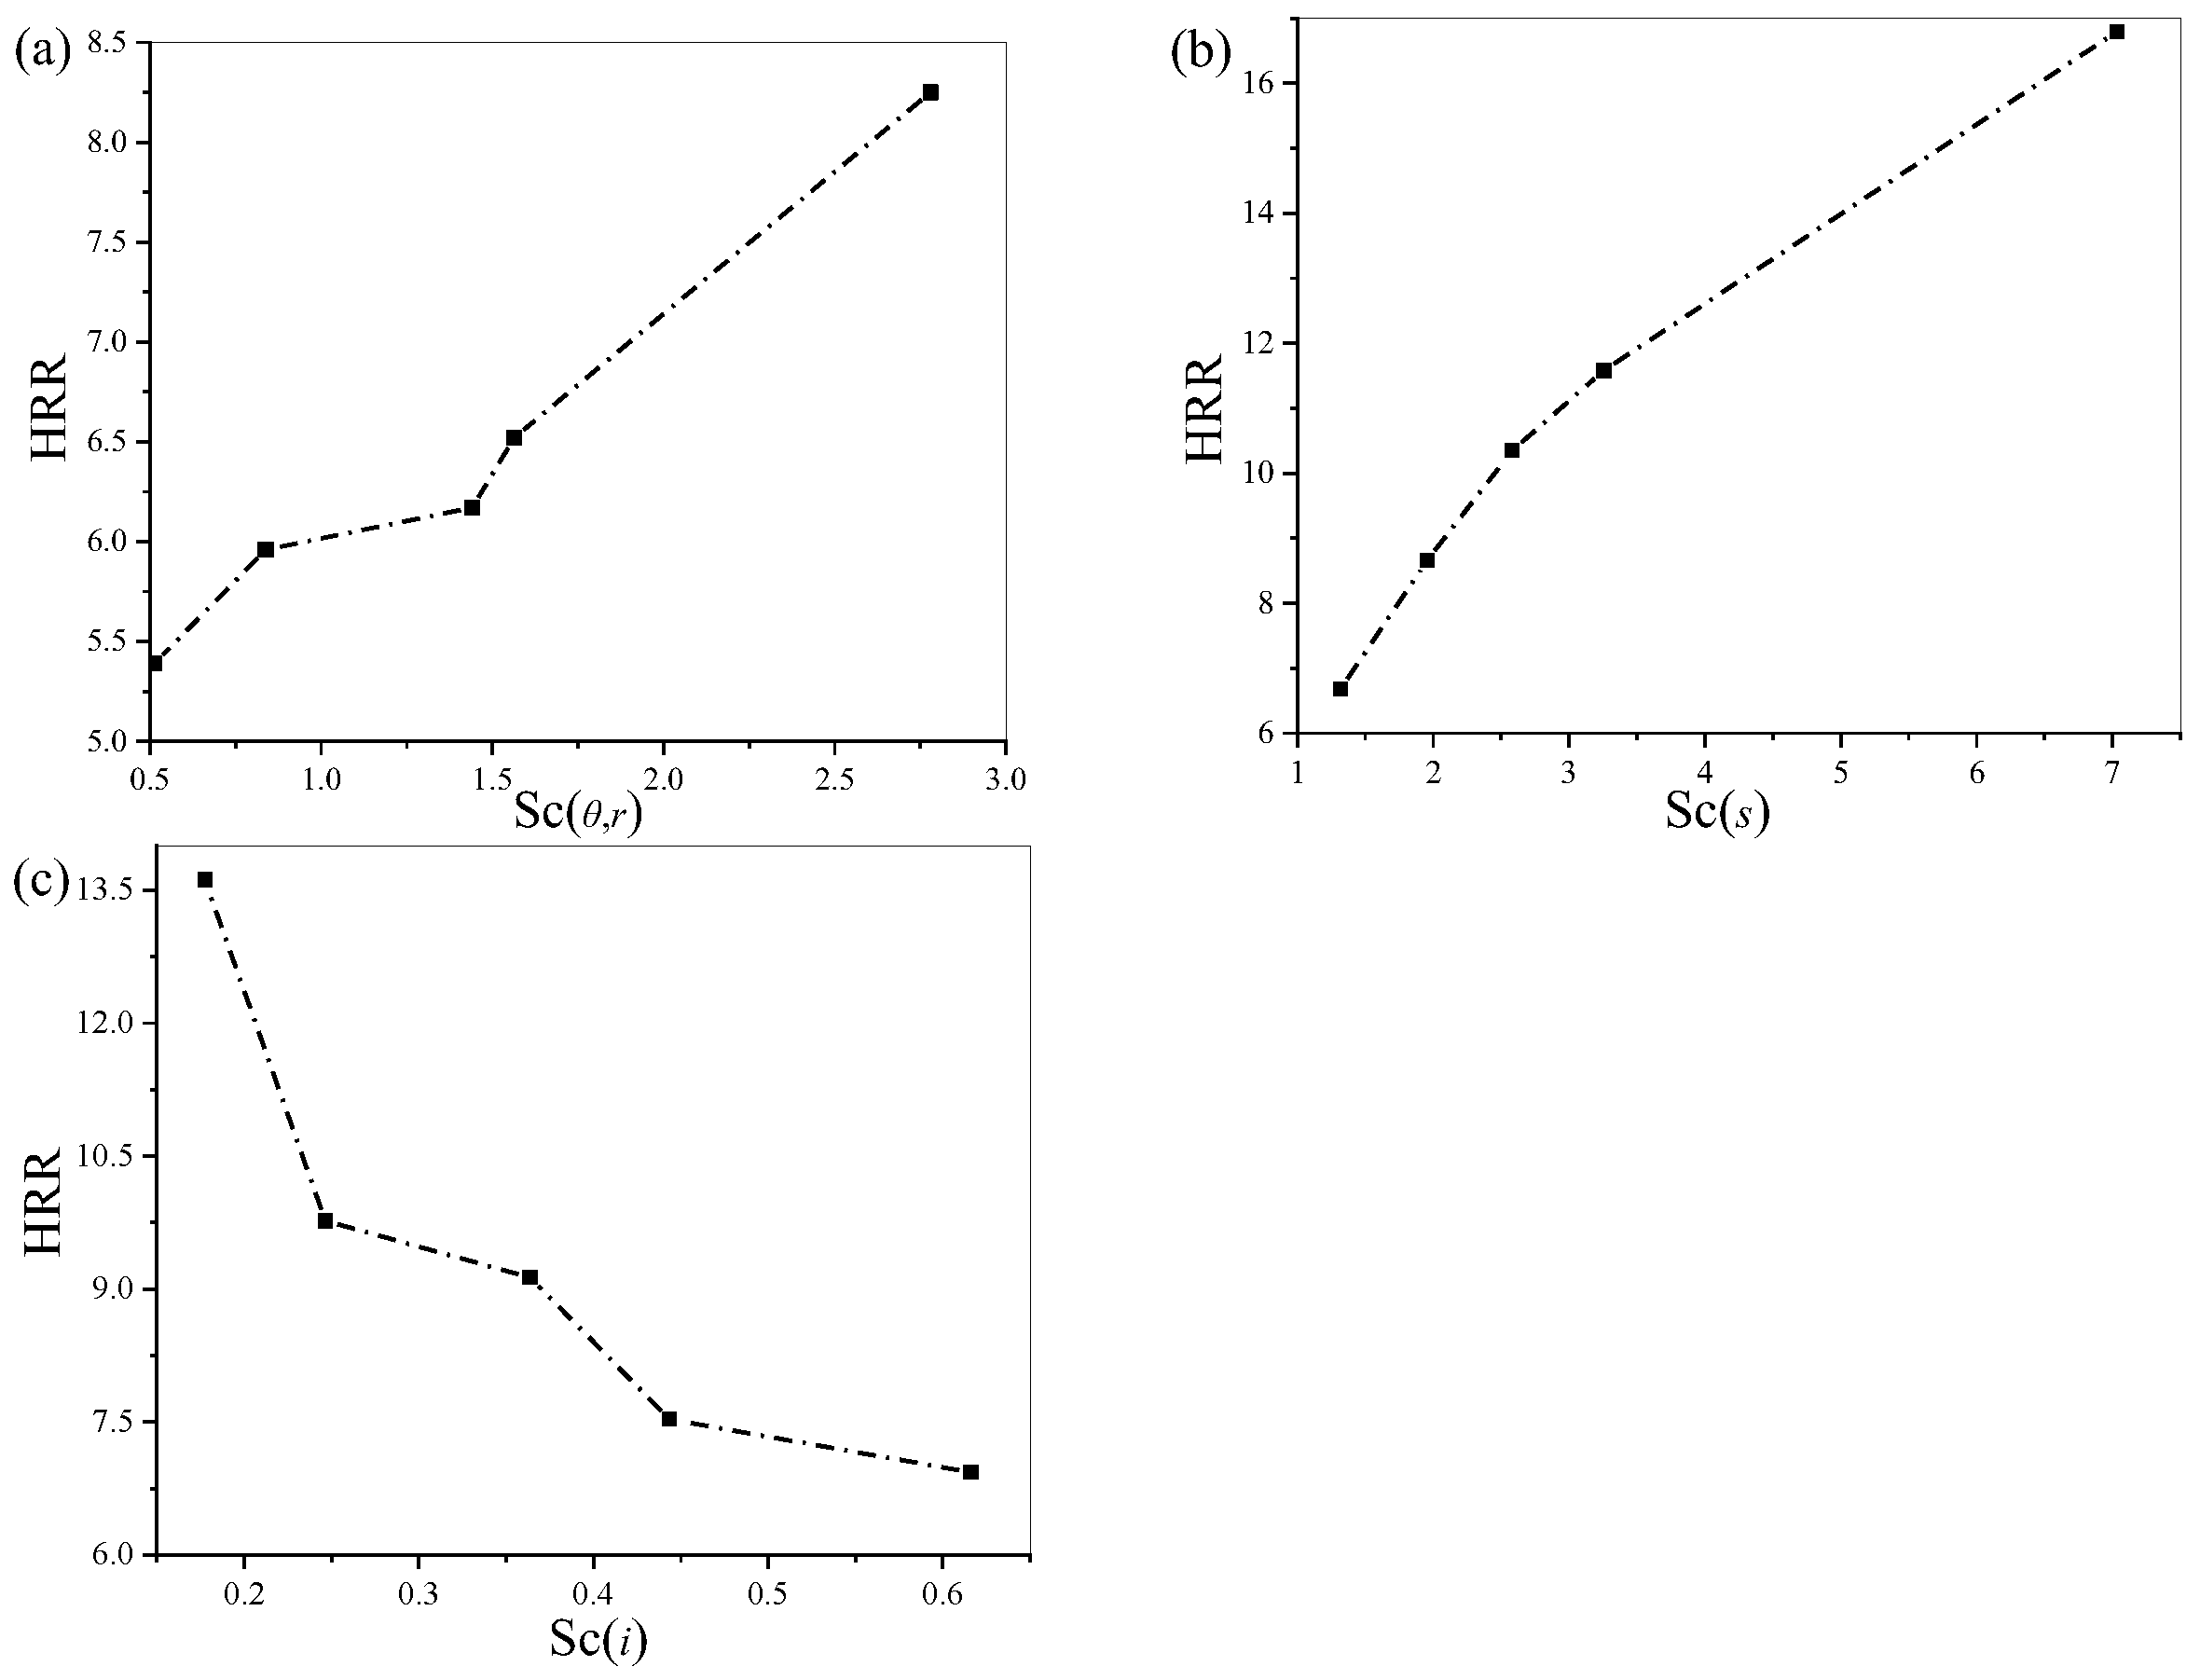
The analysis in Section 3.1 and Section 3.2.1 demonstrates that pore shape, size, and interval have a significant impact on the HRR. Many studies have demonstrated how pore structure affects convective heat transfer [28,29], but few researchers have explored how pore structure and HRR are related. Thus, the distinctive shape factor Sc is created by combining these variables for study, and an effort is made to investigate the relationship between the Sc and HRR. Regarding the HRR results of samples, there is an obvious phenomenon that the HRR is correlated positively with the inner angle size θ and the pore size s, but is correlated negatively with the pore interval i, respectively, as shown in Figure 5. Therefore, it confirms that the Sc is an effective and efficient parameter to evaluate the heat transfer property.
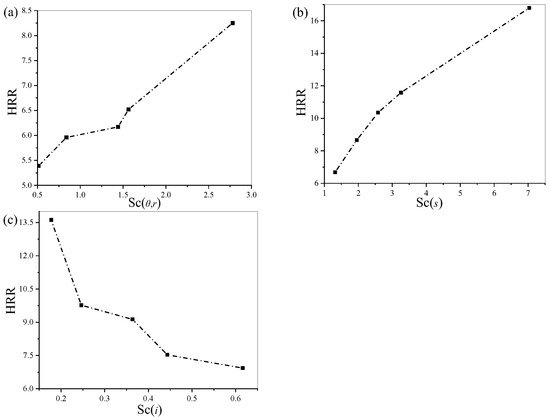
Figure 5.
Effect of Sc on HRR for different hole structures including (a) when the θ and r are variables, (b) when the s is the variable, and (c) when the i is the variable, respectively.
Consequently, as the characteristic shape factor changes, the HRR value also changes. Figure 5 shows the trend of Sc versus HRR when changing θ and r, pore size, and interval for three cases, respectively. From the distribution of the values in the three plots, it is roughly known that the changes in their curves follow the trend of exponential function [30] or power function curves [31]. Meanwhile, the temperature fluctuation and smoke density also provide some evidence for the relationship, because the enhanced heat transfer causes the improved temperature fluctuations and average smoke density area in Figure 3 and Figure 4. The FDS interval of 2 mm has the lowest peak and average smoke density area corresponding to the diminished heat transfer.
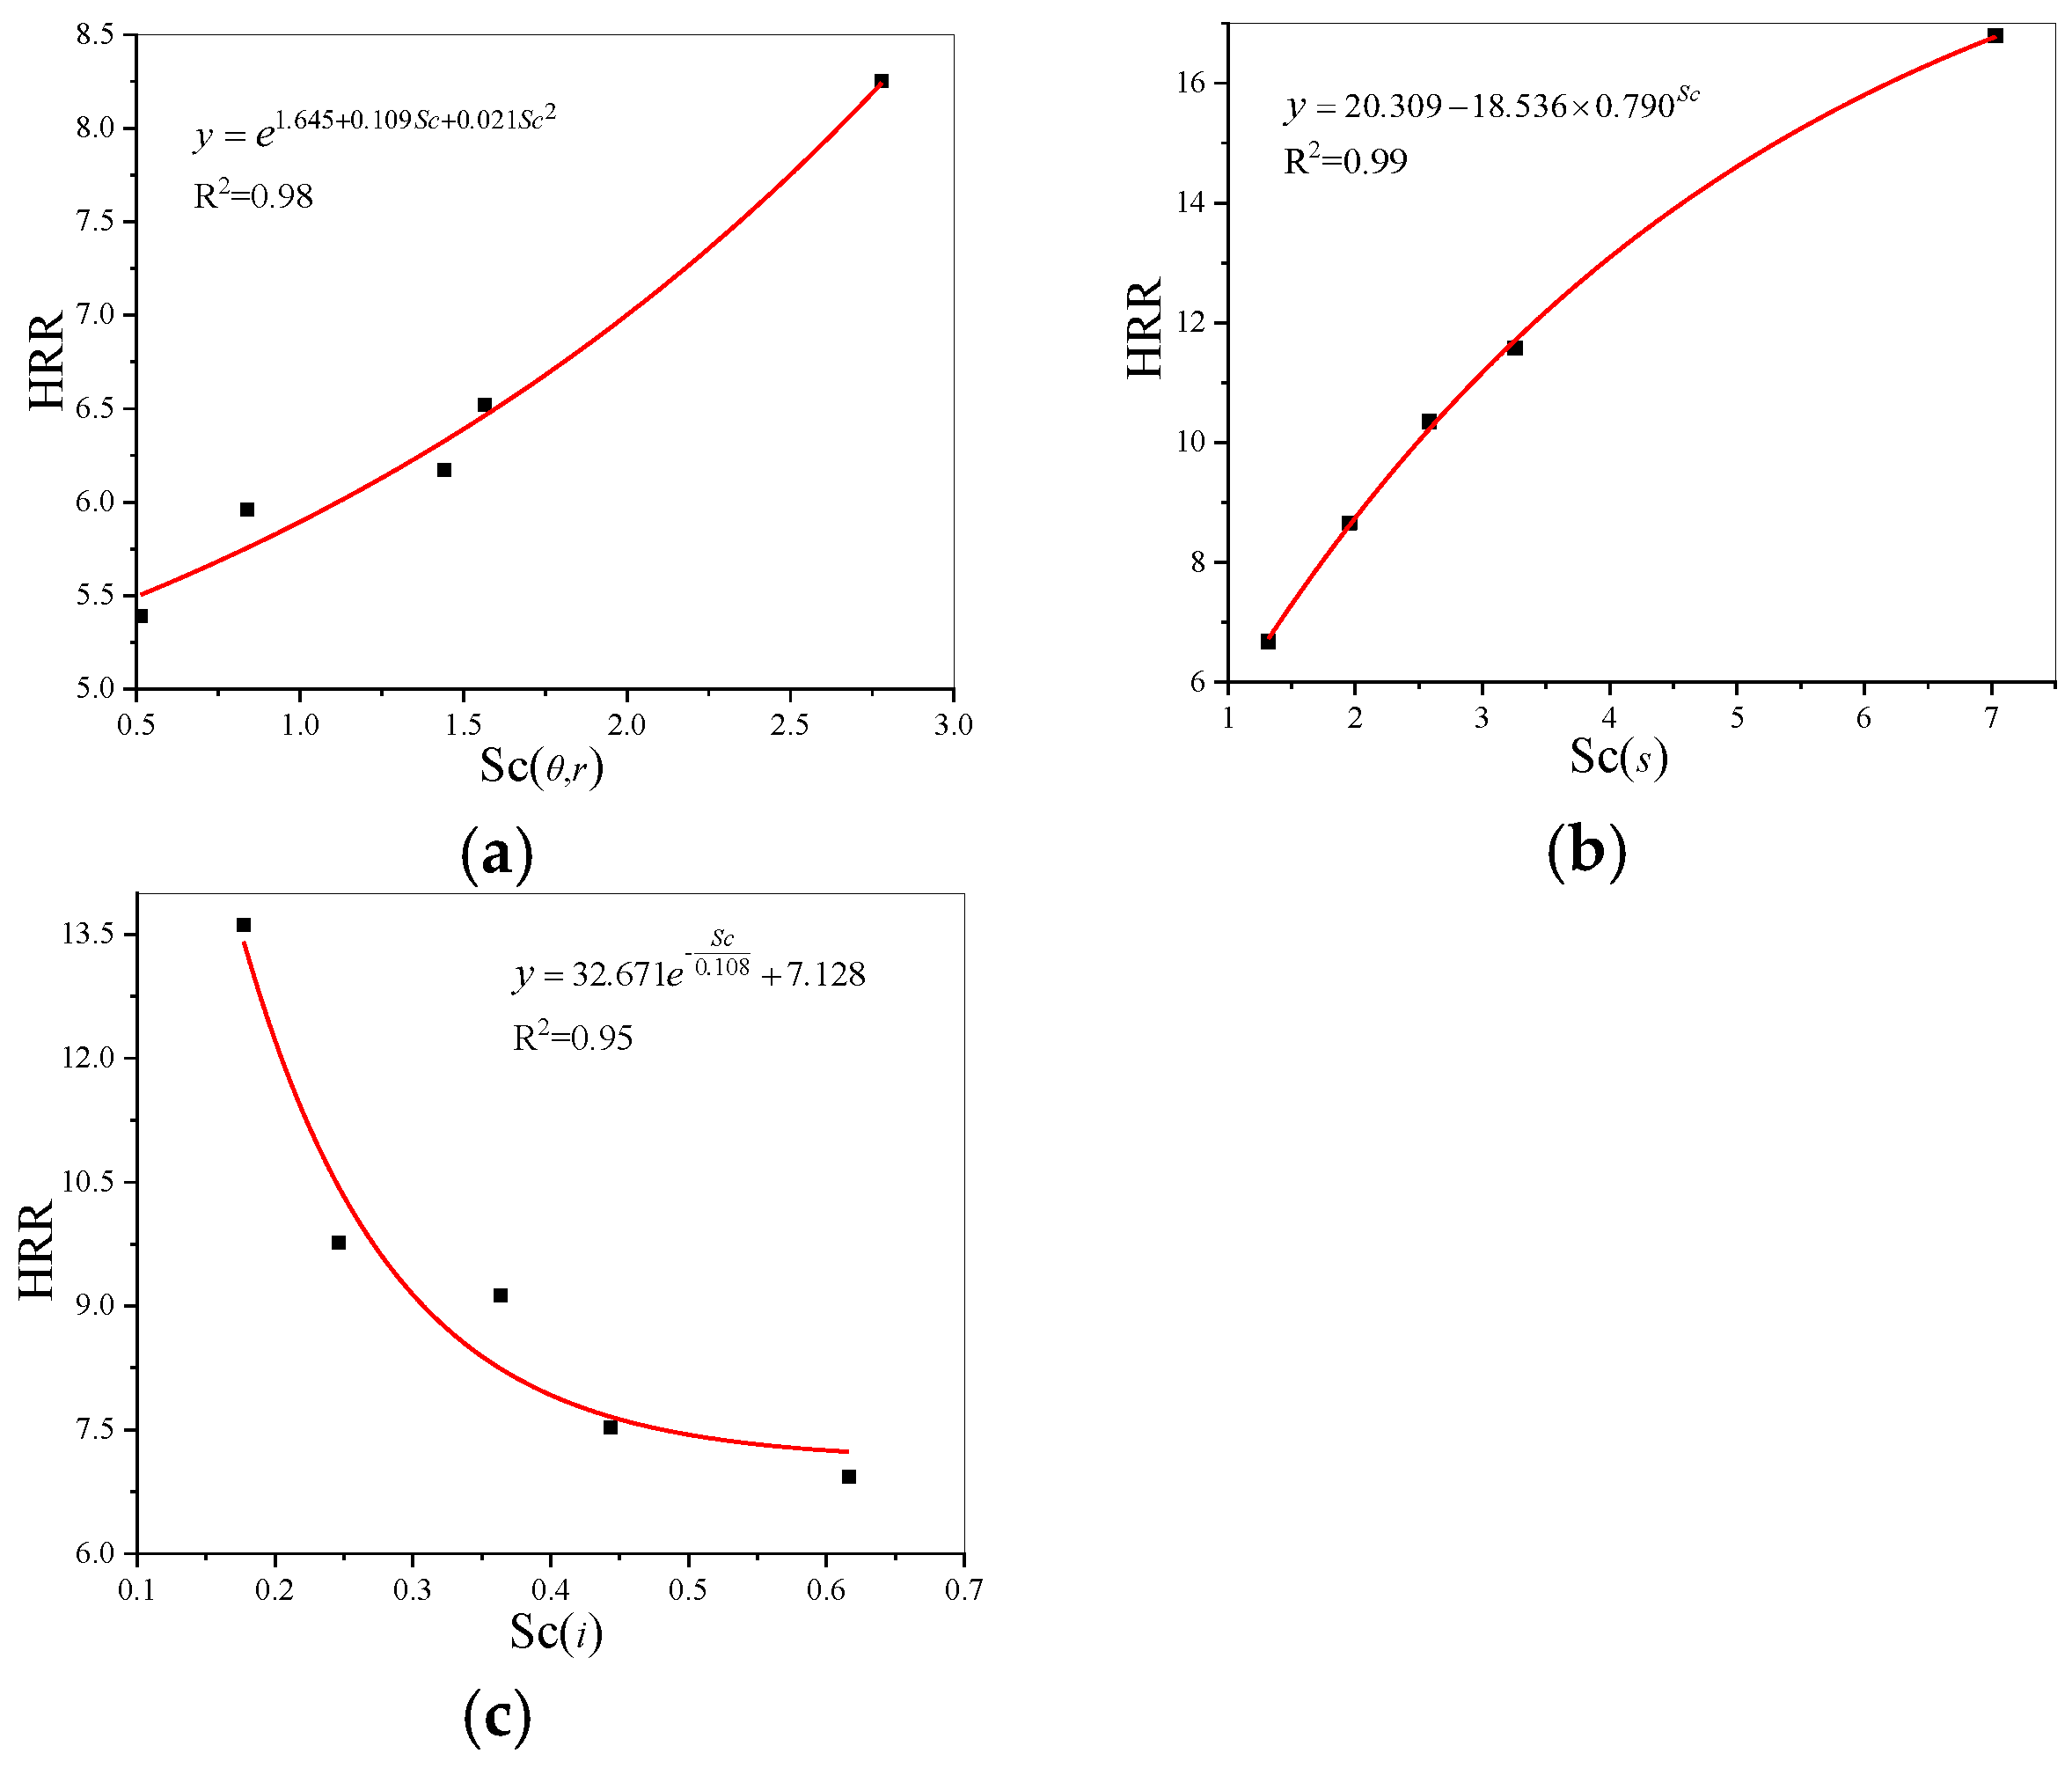
The nonlinear curve fits are performed separately for the three sets of data to obtain the equations for the HRR in three cases with different shapes, pore diameters, and intervals, respectively. The fitted curves and expressions for each of the three variables are shown in Figure 6.
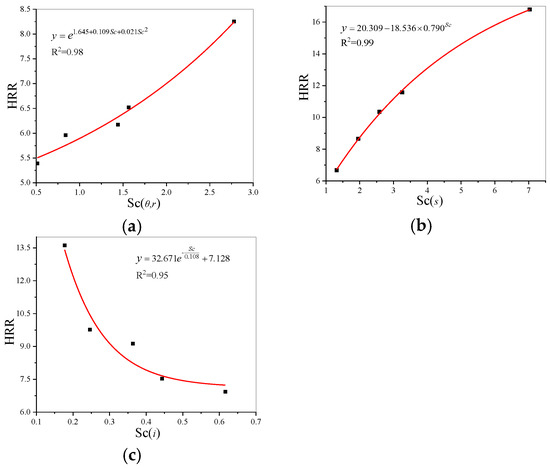
Figure 6.
Fitting curve plot of the effect of Sc on HRR for different hole structures including (a) when the θ and r are variables, (b) when the s is the variable, and (c) when the i is the variable, respectively.
The correlation Equations (7)–(9) between the Sc and HRR are determined as follows because the variance of the three curve fits is not less than 0.95, indicating a satisfactory match between the calculated and real values, which gives the quantitative relationships between the Sc and HRR with the different variables including the θ and r, s, and i, respectively.
3.3. Reason Analysis
3.3.1. Impact of Hole Closure
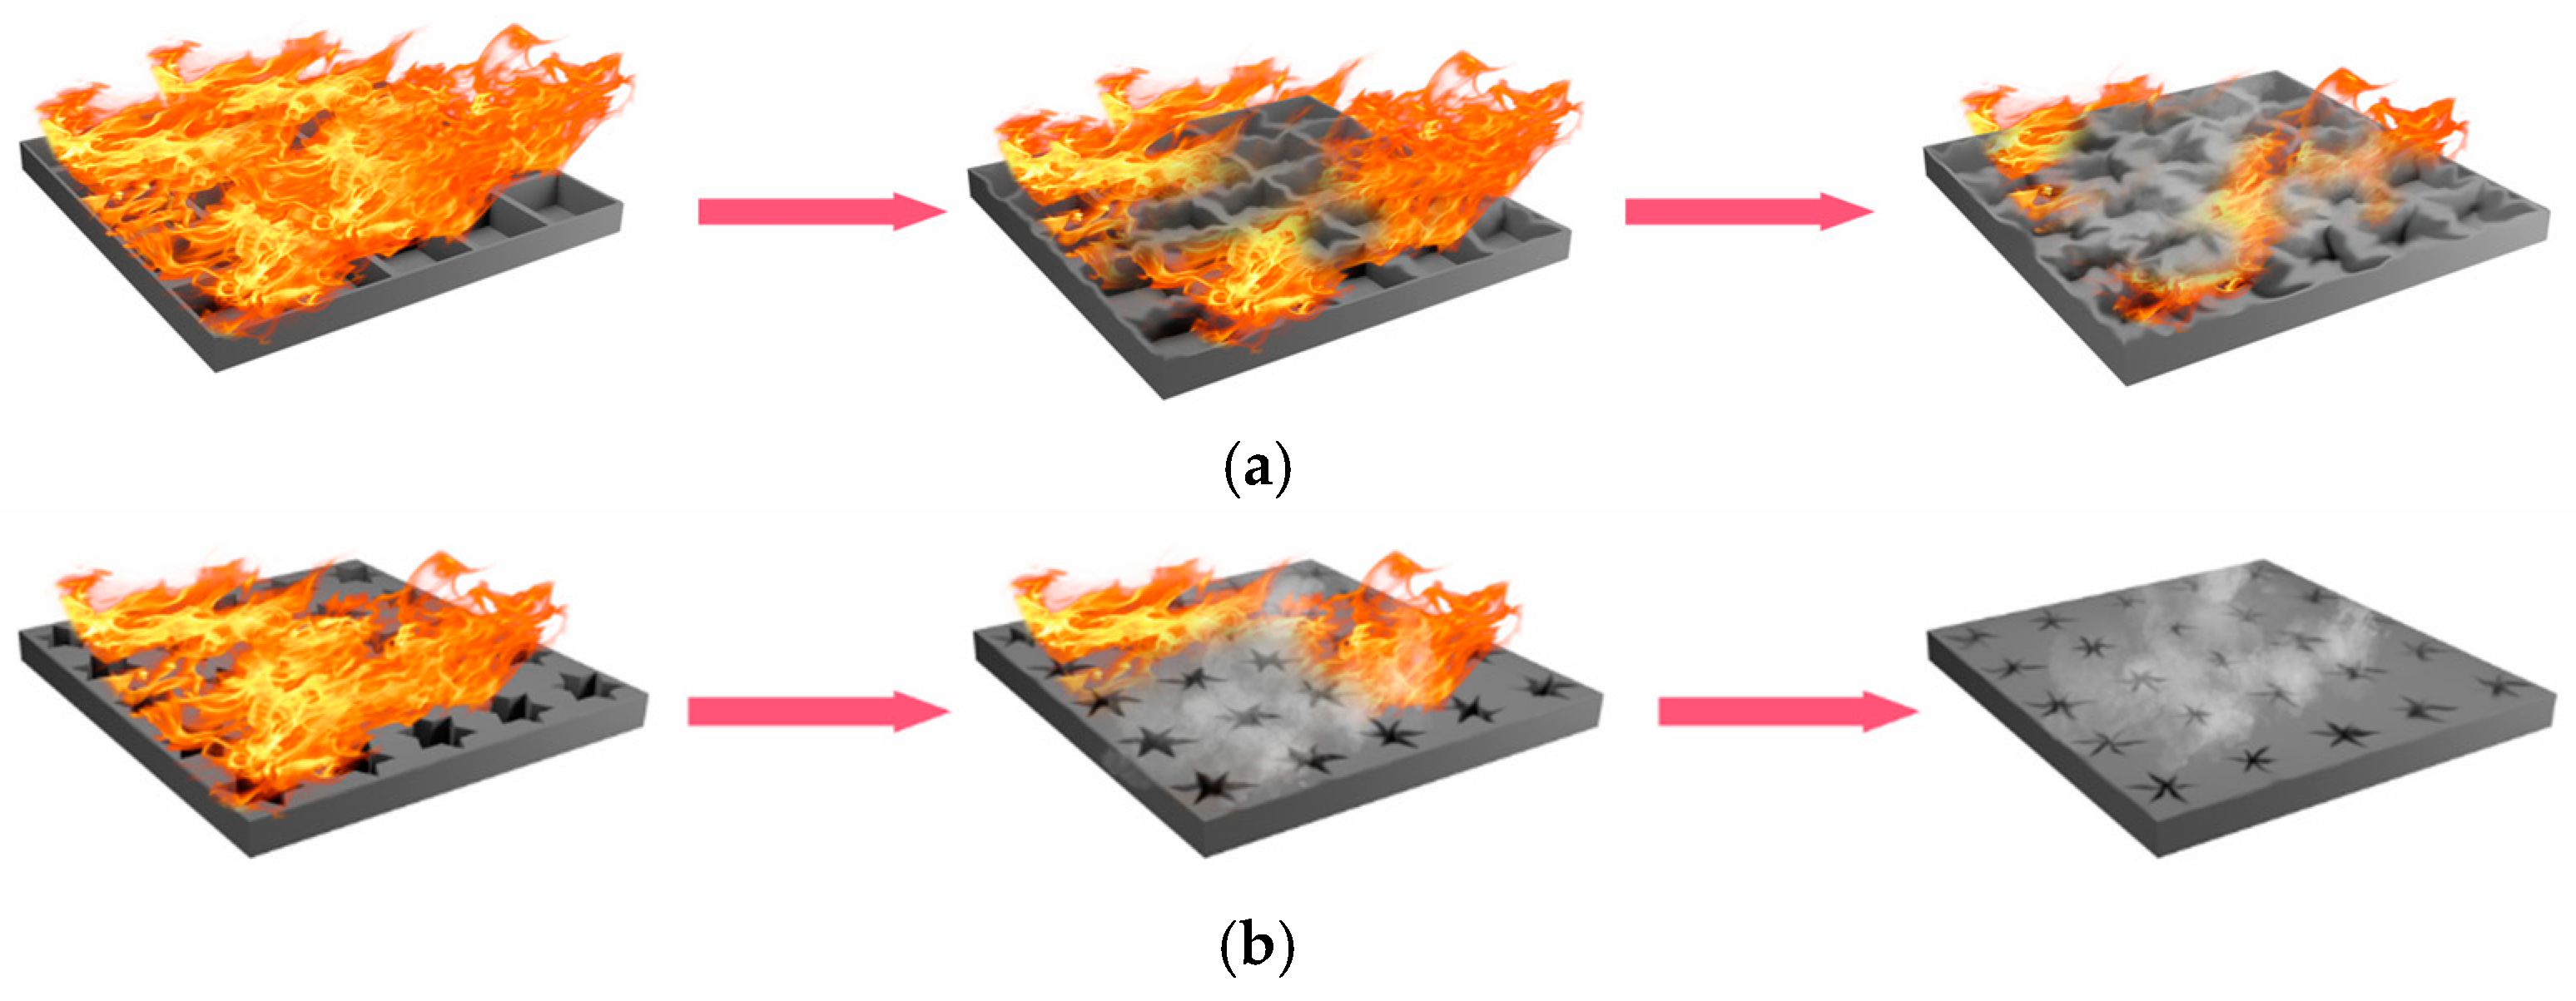
As expected, the heat transfer varies between hole-shape structural designs due to the variation in the effective contact area perpendicular to the flow direction. Taking square and hexagonal shapes as examples, when the holes are too large, the molten material cannot fill them, resulting in unrestricted mass transfer and an increased HRR. The orifice closure situation is, thus, better achieved when the area of the orifice in contact with the heat flow is small. The strongest orifice closure effect prevents the heat transfer and mass, thus reducing heat transfer. This is why Ac is introduced in the expression of Sc and HRR. The orifice closure is illustrated in Figure 7 for the square and hexagonal holes.

Figure 7.
Diagram of the “orifice closure effect” including (a) square and (b) hexagonal.
3.3.2. Effect of Vortex Heat Dissipation
During fire or combustion, PLA undergoes a phase transition and melts, producing a highly viscous fluid. Natural convection begins to occur as melting begins [32]; the discrepancies in the flow fields of the hole arise mostly from the cavity structure and the radial pressure gradient [33]. The air within the cavity is driven to create rotating circles of different sizes from the cavity interior under the action of the flow field, resulting in vortices and small swirls at the corners of holes.
The peak temperature inside a cavity rises as the radius of the rotating circle grows [23]. This causes a significant temperature gradient between the inside and outside of the cavity, which increases the convection velocity and the heat transfer area and continues to raise the heat dissipation efficiency from the inside of the cavity to the environment. It has been demonstrated that the attachment force begins to dominate as thermal energy dissipation increases strongly, which also means that the convection rate further accelerates [34]. According to the analysis above, the magnitude of r likewise influences the values of HRR and r positively, as reflected in the expression.
3.3.3. Effect of Corner Variable Speed
Thirdly, the size of a corner θ also affects the magnitude of the temperature gradient as a result of the increased flow disruption near a sharp corner [24]. After passing through the narrow angle, the flow velocity decreases continuously as the distance between the inner rotating ring and the cavity wall increases. In addition, it is possible that the weakening of the corner flow in the cavity cross-section is connected to the ability of the vortex to release internal heat energy once it is powerful enough to provide a significant temperature difference near the corner [35]. Furthermore, the corner and main vortex interact with each other as they rotate in opposite directions [36], thus causing the fluid velocity to slow down and reducing the heat transfer.
Therefore, this effect interaction with the vortex heat dissipation reduces the fluid temperature and the heat boosting the heat transfer of the porous structure. Section 3.3.2 and Section 3.3.3 focus on the analysis of the causes of r and θ and Figure 8 illustrates the schematic diagram of the interactions of the two effects within the different hole shapes.
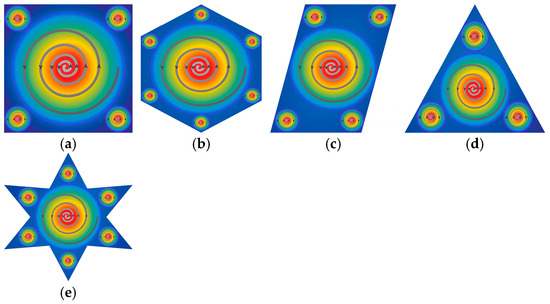
Figure 8.
Vortex diagrams for cavities of different shapes including (a) square, (b) honeycomb, (c) parallelogram, (d) triangle, and (e) hexagonal, respectively.
3.3.4. Other Reasons
Simultaneously, the dynamic viscosity of the fluid rises as the air temperature increases, making the flow more stable, which inhibits heat transfer to a certain extent. This is because viscous forces obstruct fluid flow, resulting in a decreased heat transfer rate [37]. In Figure 9, we choose the hexagonal structure as an example to summarize the reasons why the hole structures affect the HRR value. Various causes of heat transfer are shown in the mechanism diagram, including hole closure, vortex heat dissipation, narrow variable speed, and fuel load, as well as other reasons, which correspond to Ac, r, θ, and q in the HRR expressions, respectively. Combining this theoretical understanding with the computational simulations, it demonstrates that changes in structural design could result in significant changes to the heat transfer of PLA without modifying the formulation.
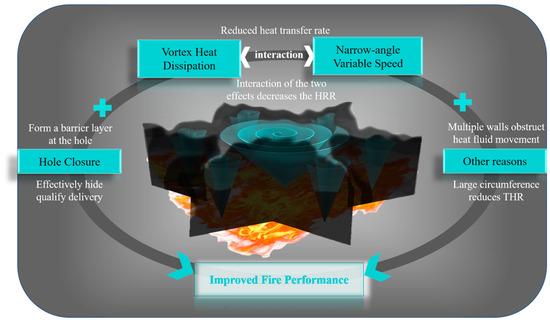
Figure 9.
Heat transfer performance mechanism.
In summary, it is suggested that continuously promoting the lightweight and efficient development of porous thermal management material through structural innovation is necessary. The various pore structure of PLA affects its heat transfer, and the relationship between the pore-type parameters and heat release performance is preliminarily discussed in this paper, which gives some design guidelines for the porous structure, as well as some theoretical basis for the heat transfer.
4. Conclusions
The heat transfer property of PLA has been adopted by adjusting its structural design, expanding its range of potential applications, which is verified by computer simulations and theoretical analysis, respectively. The key conclusions from this paper are as follows.
(1) FDS and theory analysis closely agree on the adjustable heat transfer of different cavity structures, which provide evidences that the heat transfer of PLA can be adjusted by changing the physical pore structure, and the reduced p-HRR of samples corresponds to the diminished heat transfer.
(2) A new formula for the non-circular characteristic shape factor has been proposed; the theoretical connection between them and the HRR is derived and the relationship equation between Sc and HRR is obtained for three cases, respectively.
(3) The hole closure, vortex heat dissipation, and narrow-angle variable speed are proposed to elucidate the various heat transfer performance of the porous PLA.
Our next challenge is to investigate the coupling effect among pore shape, size, and interval, quantitatively exploring the influence on the heat transfer of porous PLA, as well as the porous PLA with non-equal sections or other complex structures.
Author Contributions
Conceptualization, G.D. and Y.W.; methodology, M.Z. and Y.W.; software, M.Z. and Y.Z.; validation, M.Z., Y.W. and Y.Z.; formal analysis, Y.W.; investigation, G.D. and Y.W.; resources, G.D. and J.Z.; data curation, G.D. and Y.W.; writing—original draft preparation, G.D. and M.Z.; writing—review and editing, Y.W. and J.Z.; visualization, Y.W. and X.W.; supervision, Y.W. and X.W.; project administration, G.D. and J.Z. All authors have read and agreed to the published version of the manuscript.
Funding
This research received no external funding.
Institutional Review Board Statement
Not applicable.
Informed Consent Statement
Not applicable.
Data Availability Statement
The original contributions presented in this study are included in the article. Further inquiries can be directed to the corresponding author.
Conflicts of Interest
The authors declare no conflict of interest.
References
- Li, D.-F.; Zhao, X.; Jia, Y.-W.; He, L.; Wang, X.-L.; Wang, Y.-Z. Dual effect of dynamic vulcanization of biobased unsaturated polyester: Simultaneously enhance the toughness and fire safety of Poly(lactic acid). Compos. Part B 2019, 175, 107069. [Google Scholar] [CrossRef]
- Qian, S.; Kong, Y.; Cheng, H.; Tu, S.; Zhai, C. Interfacial interaction improvement of polylactic acid/bamboo-char biocomposites for high toughness, good strength, and excellent thermal stability. Surf. Interfaces 2023, 42, 103315. [Google Scholar] [CrossRef]
- Shi, S.; Dai, M.; Tao, X.; Wu, F.; Sun, J.; Chen, Y. 3D printed polylactic acid/graphene nanocomposites with tailored multifunctionality towards superior thermal management and high-efficient electromagnetic interference shielding. Chem. Eng. J. 2022, 450, 138248. [Google Scholar] [CrossRef]
- Baobaid, N.; Ali, M.I.; Khan, K.A.; Abu Al-Rub, R.K. Fluid flow and heat transfer of porous TPMS architected heat sinks in free convection environment. Case Stud. Therm. Eng. 2022, 33, 101944. [Google Scholar] [CrossRef]
- Hedayati, R.; Alavi, M.; Sadighi, M. Effect of Degradation of Polylactic Acid (PLA) on Dynamic Mechanical Response of 3D Printed Lattice Structures. Materials 2024, 17, 3674. [Google Scholar] [CrossRef] [PubMed]
- Feng, H.; Lu, H.; Geng, Z.; Li, D.; Yang, R. Microporous-micronucleus composite structure endowing heterogenous polyamide 6 with low-temperature toughness, low dielectric constant, fire retardancy and antibacterial activity. Compos. Part B 2023, 261, 110808. [Google Scholar] [CrossRef]
- Malik, R.; Kim, Y.W.; Song, I.H. High interfacial thermal resistance induced low thermal conductivity in porous SiC-SiO2 composites with hierarchical porosity. J. Eur. Ceram. Soc. 2020, 40, 594–602. [Google Scholar] [CrossRef]
- Fleet, C.T.; Straatman, A.G. A model for the conduction shape factor in spherical void phase porous material. Int. J. Heat Mass Transf. 2021, 164, 120583. [Google Scholar] [CrossRef]
- Yuan, C.; Wang, Y. Combustion Performance of Various Polylactic Acid Plastics with Different Porous Structures Constructed by 3D Printing. Fire 2023, 6, 425. [Google Scholar] [CrossRef]
- Ao, X.; Vázquez-López, A.; Mocerino, D.; González, C.; Wang, D.-Y. Flame retardancy and fire mechanical properties for natural fiber/polymer composite: A review. Compos. Part B 2024, 268, 111069. [Google Scholar] [CrossRef]
- Novozhilov, V. Computational fluid dynamics modeling of compartment fires. Prog. Energy Combust. Sci. 2001, 27, 611–666. [Google Scholar] [CrossRef]
- Jujuly, M.M.; Rahman, A.; Ahmed, S. LNG pool fire simulation for domino effect analysis. Reliab. Eng. Syst. Saf. 2015, 143, 19–29. [Google Scholar] [CrossRef]
- Yin, C. On gas and particle radiation in pulverized fuel combustion furnaces. Appl. Energy 2015, 157, 554–561. [Google Scholar] [CrossRef]
- Xiao, M.; Zhou, X.; Pan, X.; Wang, Y.; Wang, J.; Li, X.; Sun, Y.; Wang, Y. Simulation of emergency evacuation from construction site of prefabricated buildings. Sci. Rep. 2022, 12, 2732. [Google Scholar] [CrossRef] [PubMed]
- Gu, X.; Wen, J.; Zhang, X.; Wang, C.; Wang, S. Effect of tube shape on the condensation patterns of R1234ze(E) in horizontal mini-channels. Int. J. Heat Mass Transf. 2019, 131, 121–139. [Google Scholar] [CrossRef]
- Debayan, D.; Monisha, R.; Tanmay, B. Studies on natural convection within enclosures of various (non-square) shapes—A review. Int. J. Heat Mass Transf. 2017, 106, 356–406. [Google Scholar]
- Lukose, L.; Basak, T. Numerical heat flow visualization analysis on enhanced thermal processing for various shapes of containers during thermal convection. Int. J. Numer. Methods Heat Fluid Flow 2019, 30, 3535–3583. [Google Scholar] [CrossRef]
- Shih, Y.C.; Cheng, Y.J. The effect of viscous dissipation on heat transfer in cavities of varying shape due to an inner rotating circular cylinder. Numer. Heat Transf. Part A Appl. 2015, 68, 150–173. [Google Scholar] [CrossRef]
- Déjardin, P. Determination of the functioning parameters in asymmetrical flow field-flow fractionation with an exponential channel. J. Chromatogr. A 2013, 1305, 213–220. [Google Scholar] [CrossRef]
- Abdelraheem, A.; Amal, A.H.; Zehba, R. The magnetic power on natural convection of NEPCM suspended in a porous annulus between a hexagonal-shaped cavity and dual curves. Case Stud. Therm. Eng. 2021, 28, 101354. [Google Scholar]
- Lu, L.; Wang, J.; Li, M.; Ryu, S. Experimental and numerical analysis on vortex cavitation morphological characteristics in u-shape notch spool valve and the vortex cavitation coupled choked flow conditions. Int. J. Heat Mass Transf. 2022, 189, 122707. [Google Scholar] [CrossRef]
- Djinović, Z.; Tomić, M.; Kocsis, A. Optofluidic micromachined platform for refractive index measurement. Chemosensors 2022, 10, 197. [Google Scholar] [CrossRef]
- Shih, Y.C.; Khodadadi, J.M.; Weng, K.H.; Ahmed, A. Periodic fluid flow and heat transfer in a square cavity due to an insulated or isothermal rotating cylinder. J. Heat Transf. Trans. Asme 2009, 131, 1314–1316. [Google Scholar] [CrossRef]
- Sharad, V.P.; Shripad, P.M. Effects of density and thermal conductivity variations on entropy generation in gas micro-flows. Int. J. Heat Mass Transf. 2014, 79, 472–485. [Google Scholar]
- Xu, Y.; Zhai, M.; Jin, S.; Zou, X.; Liu, S.; Dong, P. Numerical simulation of high-temperature fusion combustion characteristics for a single biomass particle. Fuel Process. Technol. 2019, 183, 27–34. [Google Scholar] [CrossRef]
- Ciria, D.; Orihuela, M.; Moreno-Naranjo, P.; Chacartegui, R.; Ramírez-Rico, J.; Becerra, J. Flame confinement in biomass combustion systems for particles abatement. Energy Convers. Manag. 2022, 264, 115706. [Google Scholar] [CrossRef]
- Wang, W.; Mallouk, T.E. A Practical Guide to Analyzing and Reporting the Movement of Nanoscale Swimmers. ACS Nano 2021, 15, 15446–15460. [Google Scholar] [CrossRef]
- Moukalled, F.; Darwish, M. Double diffusive natural convection in a porous rhombic annulus. Numer. Heat Transf. Part A Appl. 2013, 64, 378–399. [Google Scholar] [CrossRef]
- Oztop, H.F.; Al-Salem, K.; Varol, Y.; Pop, I. Natural convection heat transfer in a partially opened cavity filled with porous media. Int. J. Heat Mass Transf. 2011, 54, 2253–2261. [Google Scholar] [CrossRef]
- Fakheri, A. Efficiency analysis of heat exchangers and heat exchanger networks. Int. J. Heat Mass Transf. 2014, 76, 99–104. [Google Scholar] [CrossRef]
- Ge, Y.L.; Chen, L.G.; Qin, X.Y. Effect of specific heat variations on irreversible Otto cycle performance. Int. J. Heat Mass Transf. 2018, 122, 403–409. [Google Scholar] [CrossRef]
- Mohammad, A.; Dominic, G.; Adam, D. Natural convection onset during melting of phase change materials: Part II—Effects of Fourier, Grashof, and Rayleigh numbers. Int. J. Therm. Sci. 2021, 170, 107062. [Google Scholar]
- Farthing, P.R.; Long, C.A.; Owen, J.M.; Pincombe, J.R. Rotating cavity with axial throughflow of cooling air: Flow structure. J. Turbomach. 1992, 114, 237–246. [Google Scholar] [CrossRef]
- Sun, X.; Meng, H. Large eddy simulations and analyses of hydrocarbon fuel heat transfer in vertical upward flows at supercritical pressures. Int. J. Heat Mass Transf. 2021, 170, 120988. [Google Scholar] [CrossRef]
- Fattahi, A. The effect of cross-section geometry on the performance of a solar nanofluid heater in a parabolic solar receiver: A comparison study. J. Taiwan Inst. Chem. Eng. 2021, 124, 17–28. [Google Scholar] [CrossRef]
- Chen, X.; Wang, D.P.; Xi, H.D. Reduced flow reversals in turbulent convection in the absence of corner vortices. J. Fluid Mech. 2020, 891, R5. [Google Scholar] [CrossRef]
- Mojumder, S.; Saha, S.; Rahman, M.R. Numerical study on mixed convection heat transfer in a porous L-shaped cavity. Eng. Sci. Technol. 2017, 20, 272–282. [Google Scholar] [CrossRef]


Disclaimer/Publisher’s Note: The statements, opinions and data contained in all publications are solely those of the individual author(s) and contributor(s) and not of MDPI and/or the editor(s). MDPI and/or the editor(s) disclaim responsibility for any injury to people or property resulting from any ideas, methods, instructions or products referred to in the content. |
© 2025 by the authors. Licensee MDPI, Basel, Switzerland. This article is an open access article distributed under the terms and conditions of the Creative Commons Attribution (CC BY) license (https://creativecommons.org/licenses/by/4.0/).