Article

Groundwater Vulnerability in the Aftermath of Wildfires at the El Sutó Spring Area: Model-Based Insights and the Proposal of a Post-Fire Vulnerability Index for Dry Tropical Forests

by
Mónica Guzmán-Rojo
1,2,*,
Luiza Silva de Freitas
3,
Enrrique Coritza Taquichiri
2,3 and
Marijke Huysmans
2,3
1
Centro de Investigación Para el Desarrollo Sostenible del Oriente Boliviano, Universidad Católica Boliviana San Pablo, Carretera al Norte Km. 9, Av. Milton Parra., Santa Cruz de la Sierra, Bolivia
2
Department of Water and Climate, Vrije Universiteit Brussel, Pleinlaan 2, 1050 Brussels, Belgium
3
Division of Geology, Department of Earth and Environmental Sciences, KU Leuven, Celestijnenlaan 200E, Box 2410, 3001 Leuven, Belgium
*
Author to whom correspondence should be addressed.
Submission received: 7 January 2025 / Revised: 16 February 2025 / Accepted: 18 February 2025 / Published: 21 February 2025
(This article belongs to the Special Issue Advances in the Assessment of Fire Impacts on Hydrology, 2nd Edition)

Abstract

:
In response to the escalating frequency and severity of wildfires, this study carried out a preliminary assessment of their impact on groundwater systems by simulating post-fire effects on groundwater recharge. The study focuses on the El Sutó spring area in Santa Cruz, Bolivia, a region that is susceptible to water scarcity and frequent wildfires. The United States Geological Survey (USGS) Soil-Water-Balance model version 2.0 was utilized, adjusting soil texture and infiltration capacity parameters to reflect the changes induced by wildfire events. The findings indicated a significant decrease in groundwater recharge following a hypothetical high-severity wildfire, with an average reduction of approximately 39.5% in the first year post-fire. A partial recovery was modeled thereafter, resulting in an estimated long-term average reduction of 10%. Based on these results, the El Sutó spring was provisionally classified as having high vulnerability shortly after a wildfire and moderate vulnerability in the extended period. Building on these model-based impacts, a preliminary Fire-Related Forest Recharge Impact Score (FRIS) was proposed. This index is grounded in soil properties and recharge dynamics and is designed to assess hydrological vulnerability after wildfires in dry tropical forests. Although these findings remain exploratory, they offer a predictive framework intended to guide future studies and inform strategies for managing wildfire impacts on groundwater resources.

1. Introduction

The interaction between wildfires and water scarcity is becoming increasingly critical in the sustainable management of water resources [1,2,3,4,5]. Wildfires can profoundly affect groundwater systems [6] vital for many global communities [7,8]. The recent escalation in wildfires’ number, intensity, and geographical extent highlights significant issues linked to land use changes and ecosystem dynamics [9,10,11,12,13,14,15]. While the immediate surface impacts of wildfires are readily observable, their effects on groundwater systems are typically less evident, manifesting gradually over time [16,17]. This delayed response complicates proactive management strategies, as the immediate impacts on groundwater quality and availability are often unclear [6,18]. Incorporating wildfire concerns into water management plans is crucial, especially in areas facing water scarcity and high fire risks.
Wildfires cause immediate and long-term hydrological changes that significantly impact groundwater recharge and the overall water balance [6]. Immediately after wildfires, alterations in land cover and soil properties lead to increased surface runoff and decreased infiltration due to the formation of hydrophobic soil layers [19,20,21,22]. Over the long term, wildfires lead to persistent changes in soil hydraulic properties, affecting water percolation into deeper soil layers and influencing groundwater recharge rates [23,24]. Recent insights, including those from Guzman-Rojo et al. [6], highlight the substantial and long-lasting changes to hydrological processes post-fire, underscoring the need to re-evaluate groundwater vulnerability. Recognizing this wildfire–groundwater link is crucial for developing comprehensive measures that integrate water and fire management, making post-fire assessments of groundwater vulnerability a critical step for effective resource planning.
Assessing groundwater vulnerability to external factors like wildfires has been an effective approach for protecting groundwater sources [25]. Various methods have been developed for this purpose, including hydrogeological zoning, statistical approaches, and process-based quantitative methods [26]. Hydrogeological zoning methods, such as DRASTIC [27] and GOD [28], utilize GIS technology to create regional vulnerability maps based on hydrological and geomorphological features. Statistical methods employ mathematical models to quantitatively link groundwater quality data with hydrogeological, soil, and land use parameters, often using techniques like logistic regression [29,30]. Process-based quantitative methods use detailed simulation modeling to deeply examine natural processes within hydrogeologic settings, providing a thorough understanding of aquifer vulnerabilities [31,32]. Recent approaches, such as RAIFAS, have incorporated both environmental and economic factors to rank aquifers affected by wildfires, with a focus on the impacts on post-fire water quality [33]. Such vulnerability assessments are increasingly vital in wildfire-prone areas, as they inform decisions on post-contamination cleanup and restoration while guiding fire and water management strategies.
Over the past two decades, Bolivia has experienced extensive and severe wildfires, affecting more than 23.3 million hectares [34]. From 2016 to 2022, the San José de Chiquitos municipality in Bolivia’s Chiquitania, an ecoregion in Santa Cruz, recorded annual burned areas ranging from 15,000 ha to 227,300 ha [35]. The leading cause of fire ignition in the region is human-made, primarily due to local slash-and-burn practices that can easily grow out of control and start large fires. [36,37,38]. These events severely damage forest ecosystems and worsen water scarcity [39]. According to Devisscher [39], policies have evolved from predominantly top-down management, driven by limited data and focused essentially on biodiversity, to more integrative strategies that incorporate responsible local fire practices, particularly following the 2010 wildfire crisis. One of the most recent examples of this shift is the Departmental Policy for Integrated Fire Management [40] developed in response to the 2024 wildfires. The policy emphasizes joint efforts to tackle the underlying causes of wildfires, yet it provides limited guidance on protecting water resources. Currently, prescribed burns are primarily conducted in conservation areas [40], yet hydrological considerations, such as drought resilience, remain inadequately integrated.
Despite ranking among the top ten countries with the highest anticipated annual risk of burned forest area [41], Bolivia still lacks sufficient research on the impacts of wildfires on water security. Existing strategies sometimes address biodiversity and social concerns but rarely integrate groundwater recharge, which is critical for the Chiquitania during the dry season [42]. Fernández et al. [43] mark a critical turning point by emphasizing how integrating groundwater information into watershed priorities can reshape post-fire restoration. A more comprehensive fire management approach that integrates ecological and hydrogeological goals can enhance wildfire response, safeguard groundwater resources, and increase resilience in fire-prone areas.
This study aims to forecast the potential effects of wildfires on groundwater recharge in the El Sutó spring area in Chiquitania of Santa Cruz, Bolivia. A process-based quantitative method was applied, simulating a hypothetical wildfire to evaluate its impact on recharge dynamics. The magnitude of recharge reduction was quantified by adjusting key soil parameters to reflect post-fire conditions, and its spatial and temporal variations were mapped. Additionally, the study introduces the Fire-Related Forest Recharge Impact Score (FRIS), a preliminary vulnerability index based on simulated differences in post-fire recharge. This index is an innovative tool designed to assess hydrological vulnerability after wildfires, focusing on soil and recharge dynamics as part of a predictive framework for guiding future studies and wildfire impact management on groundwater in the Chiquitania region.

2. Materials and Methods
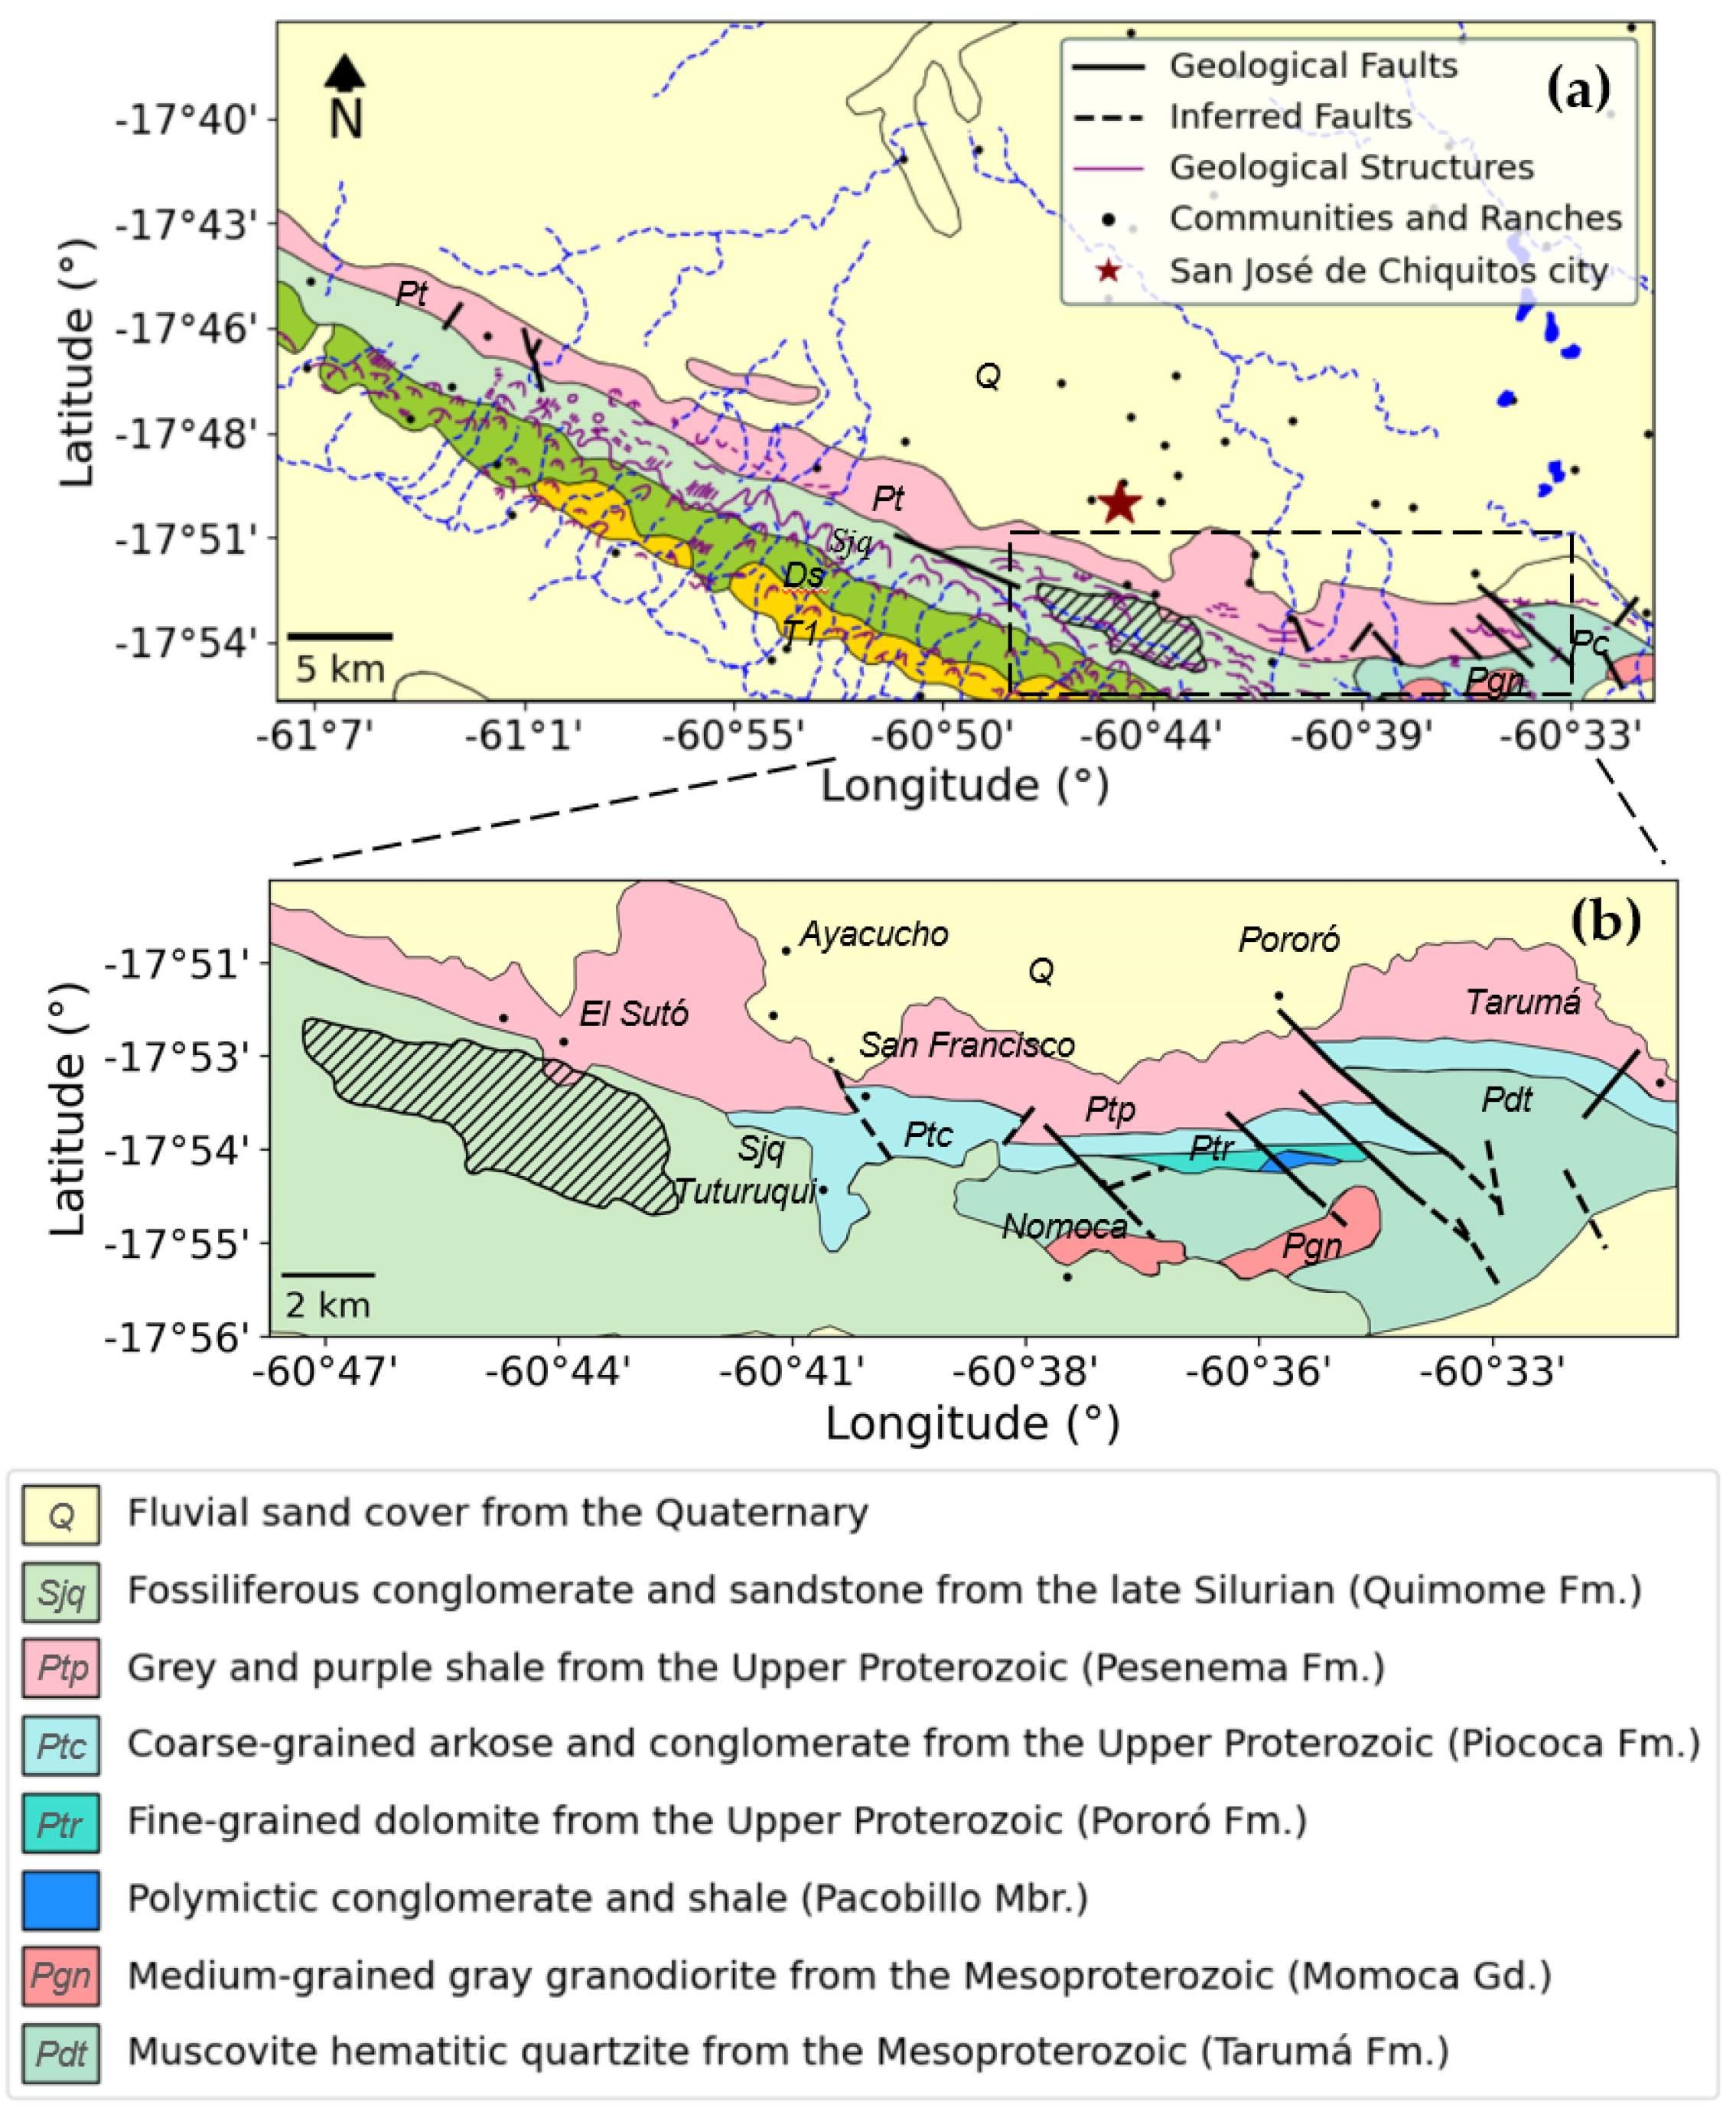
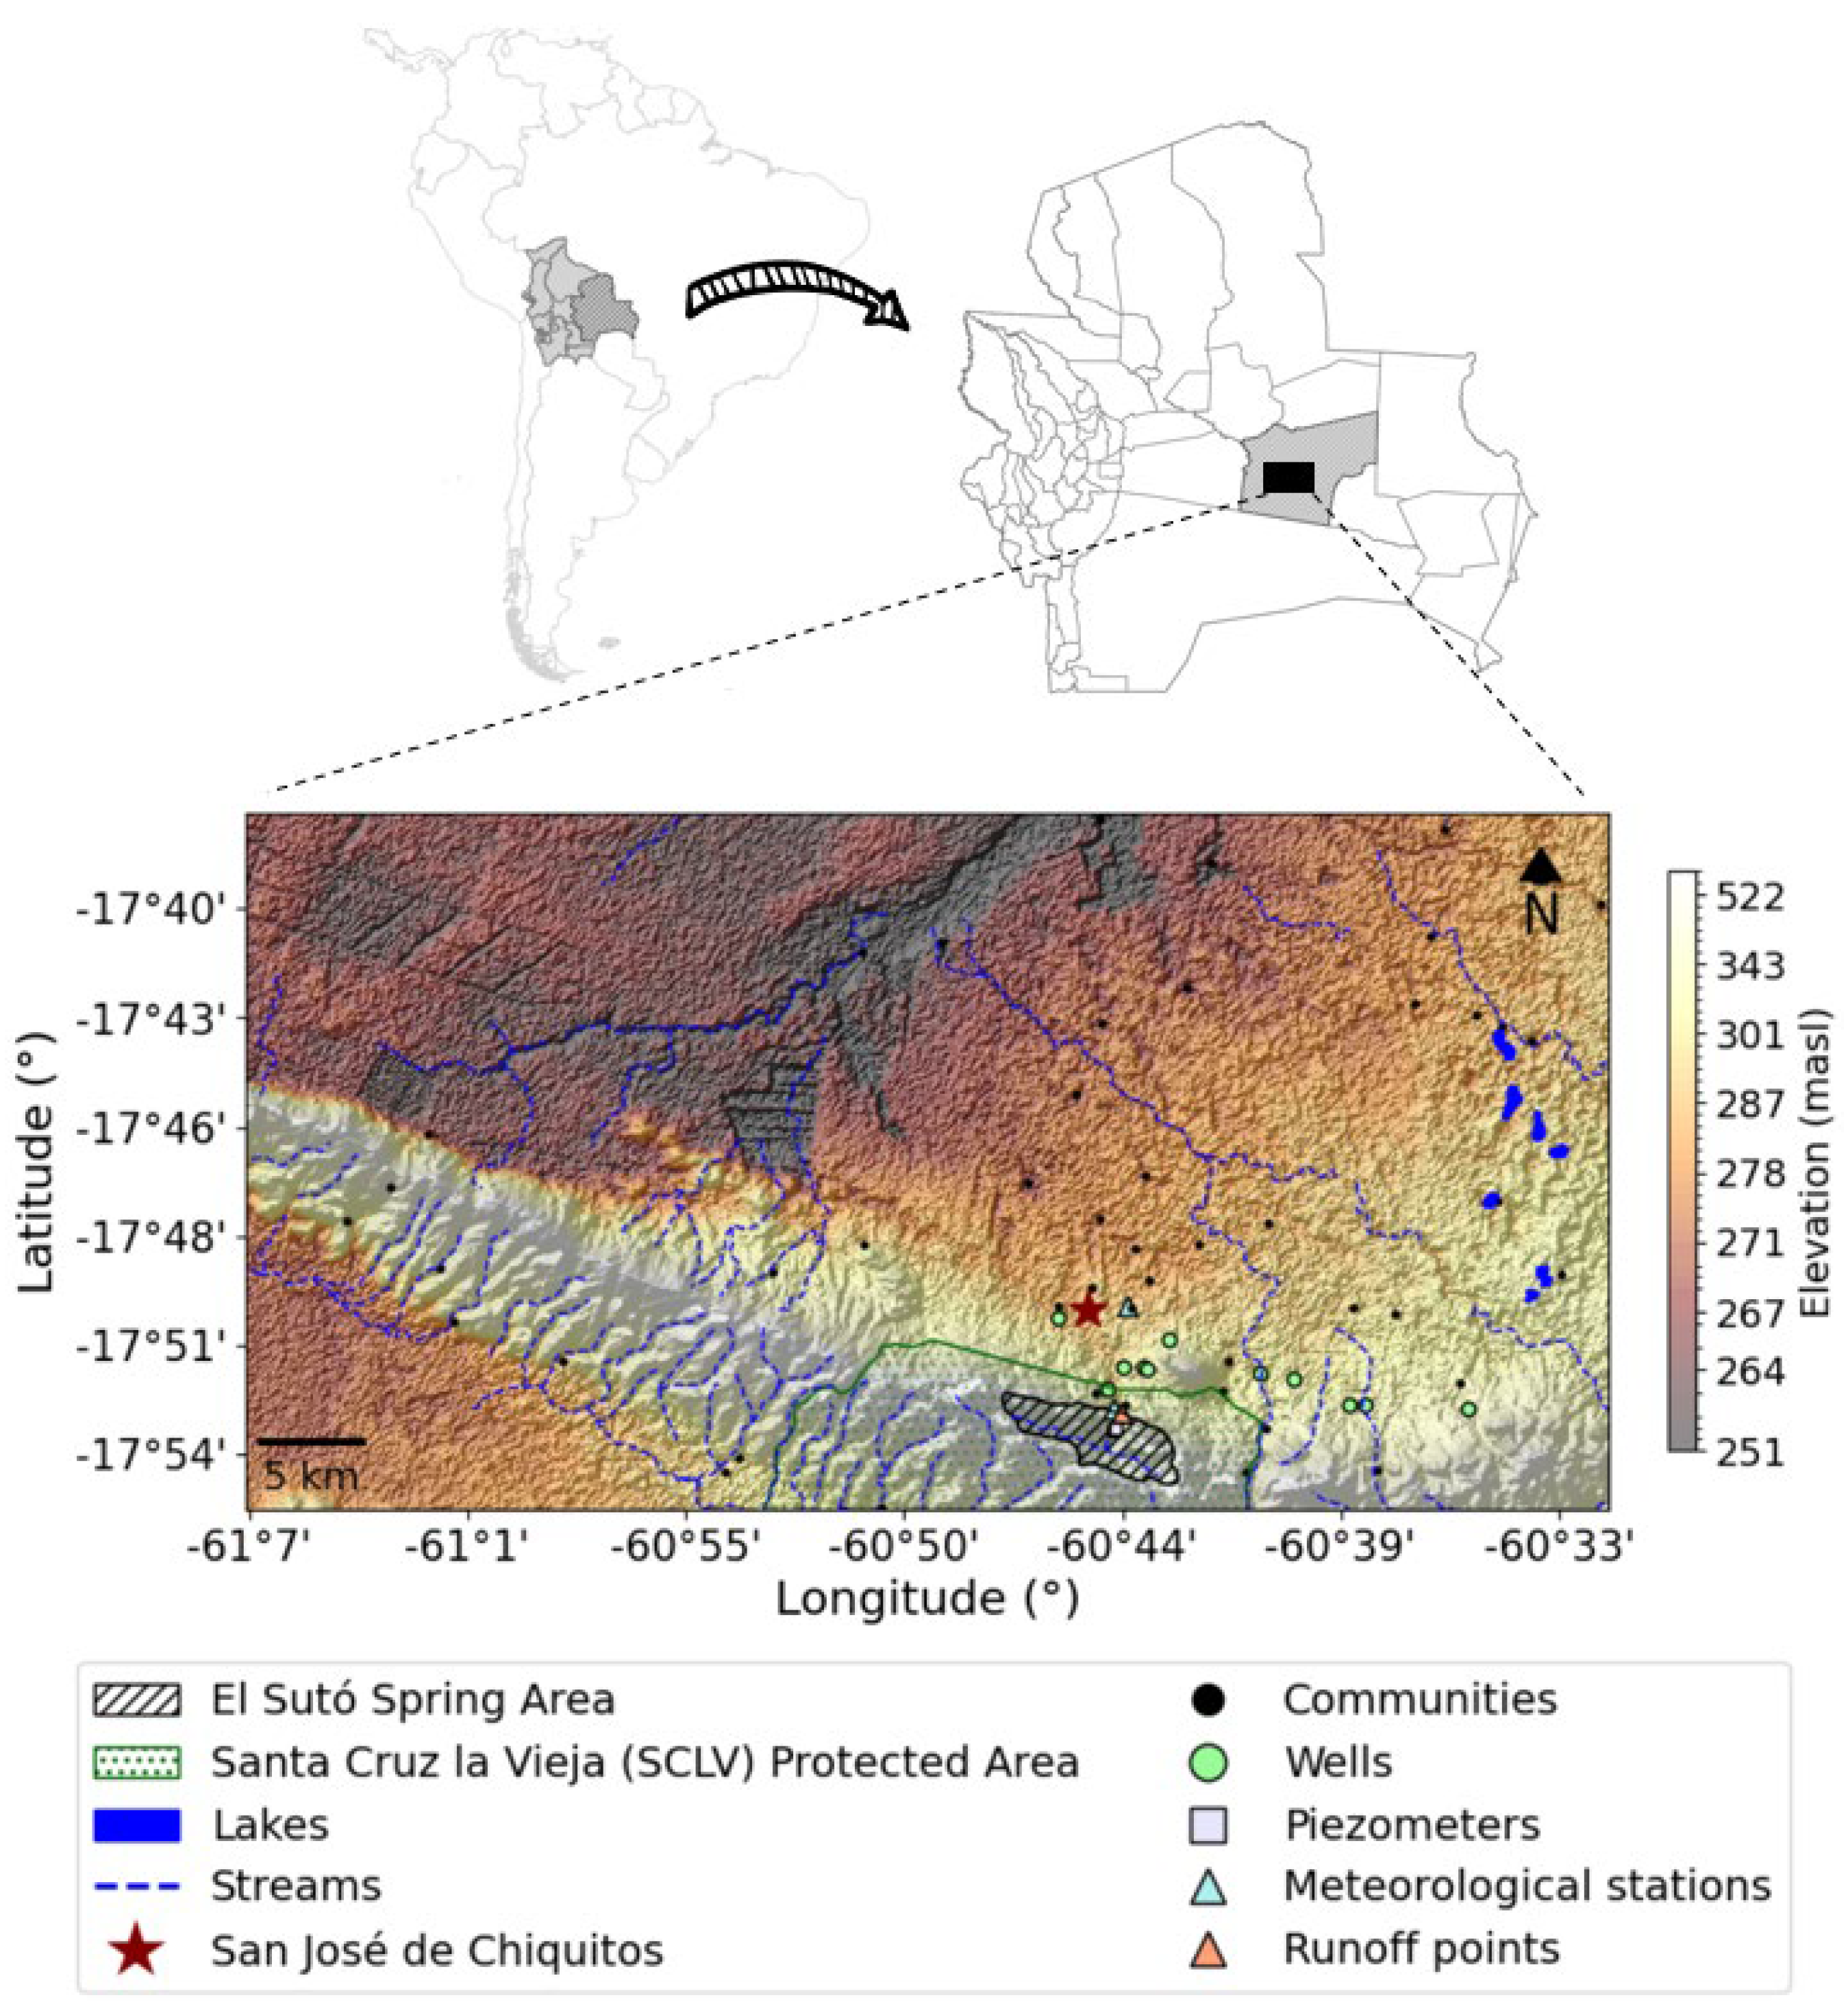
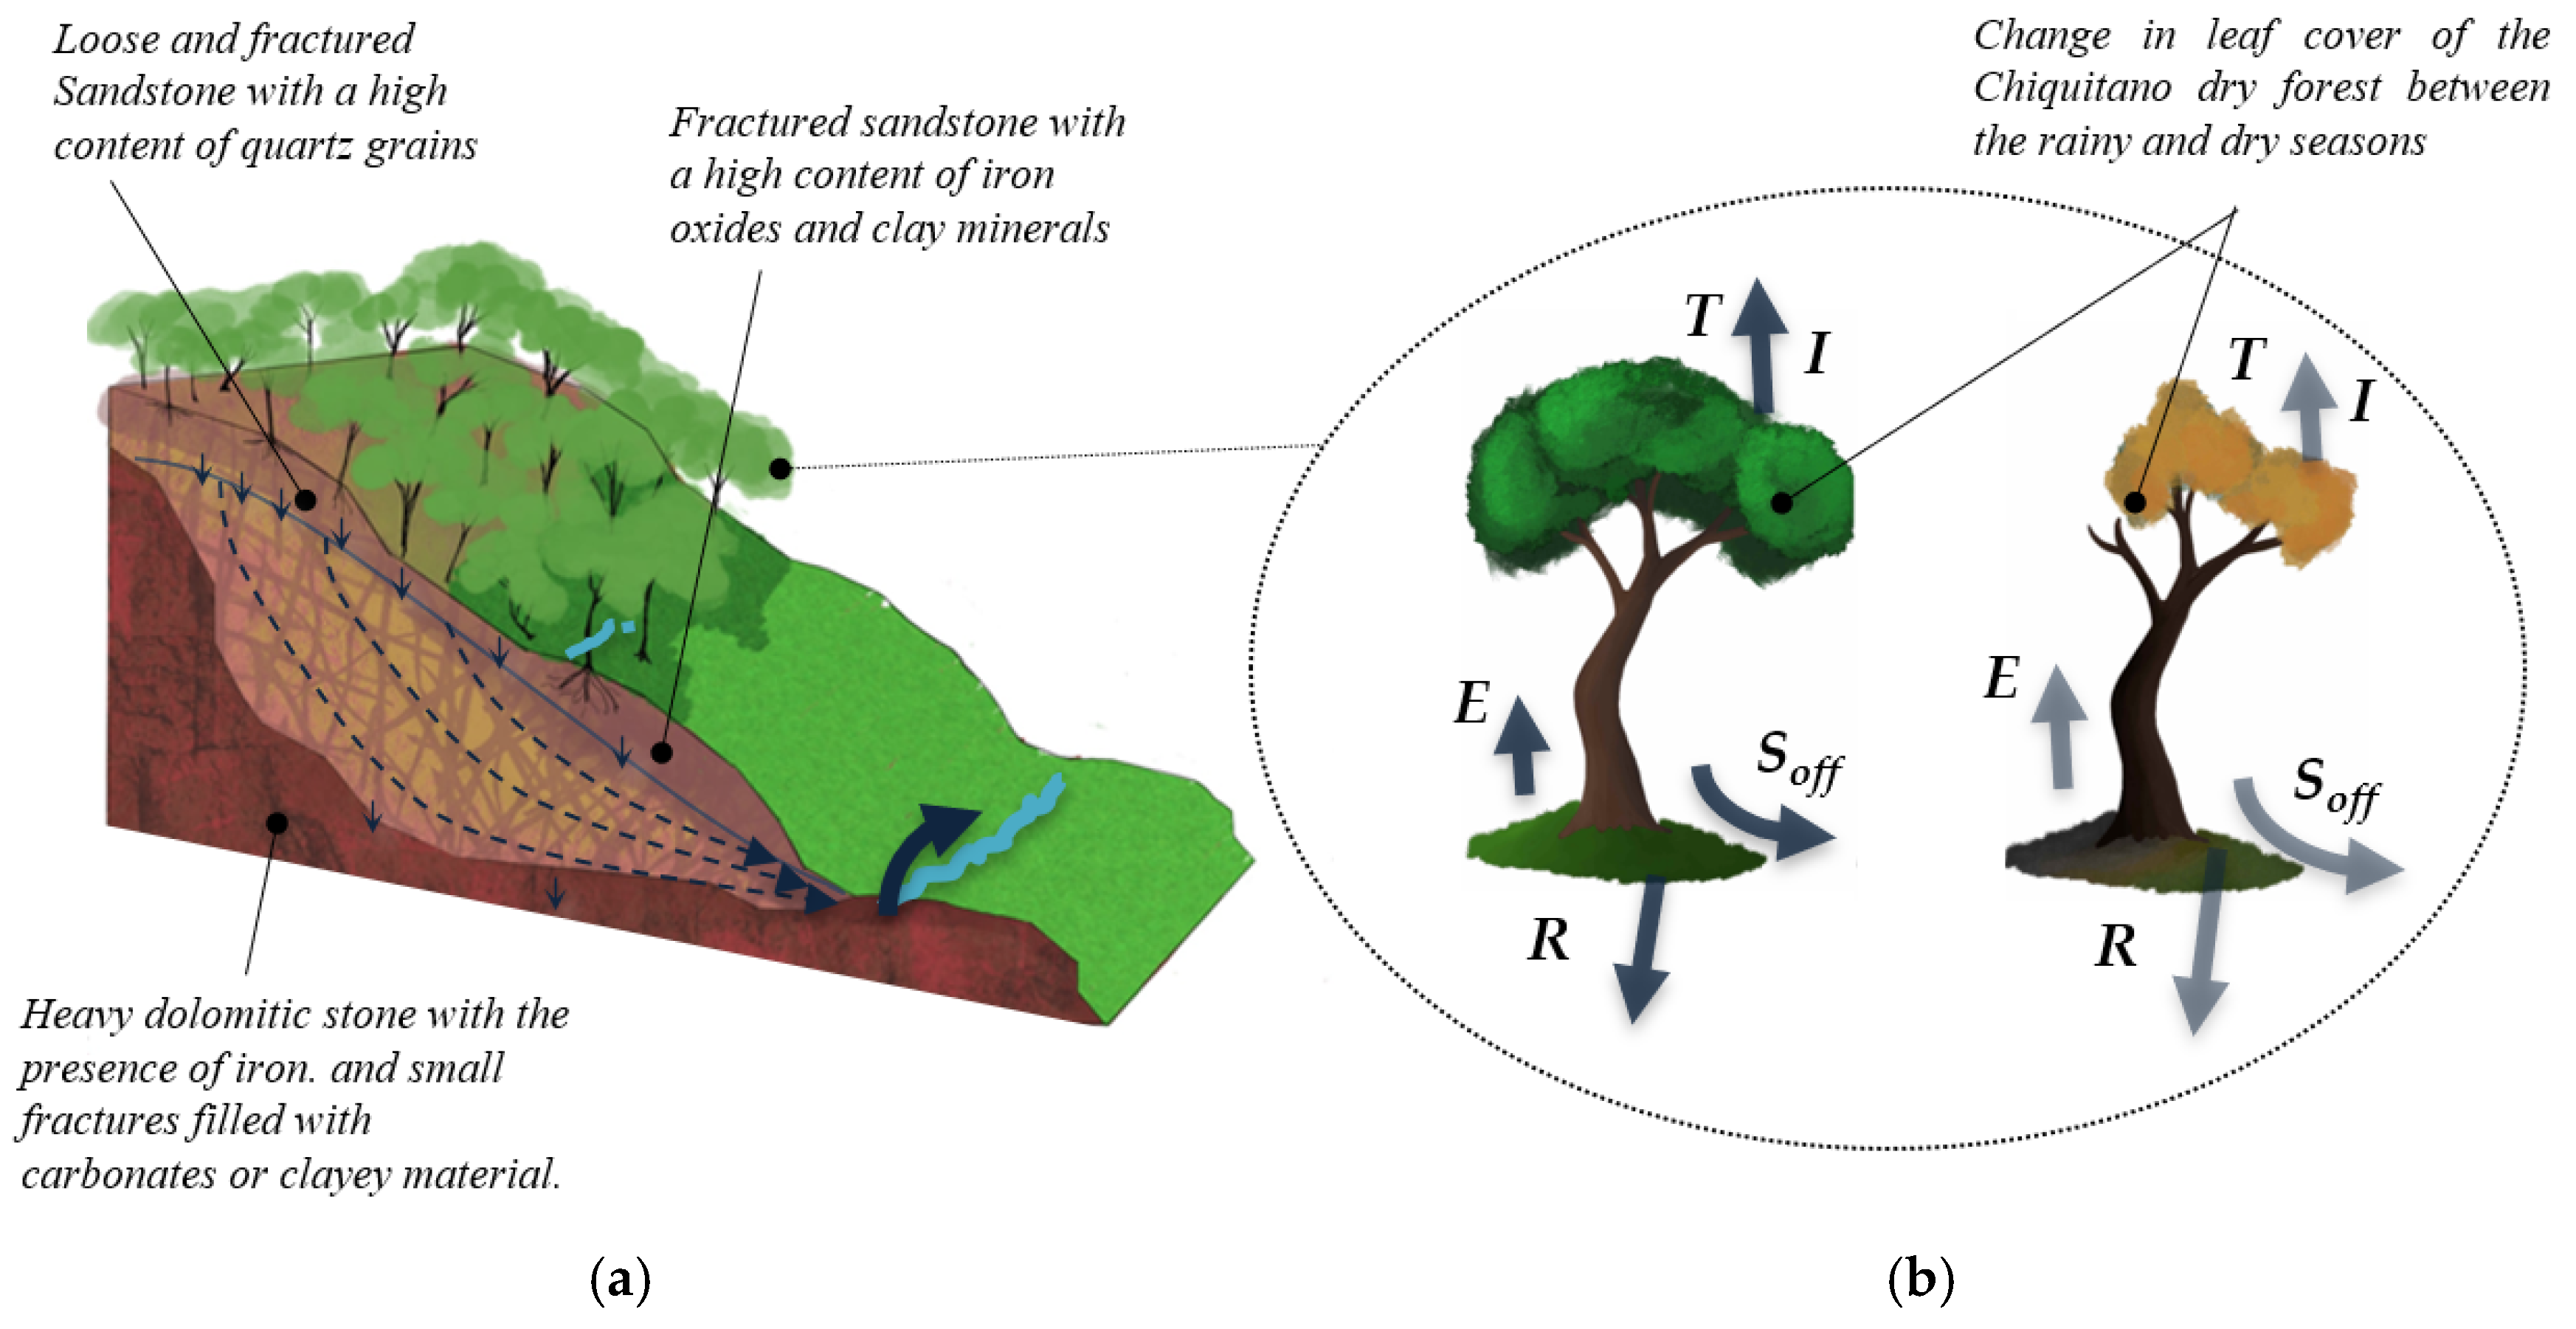
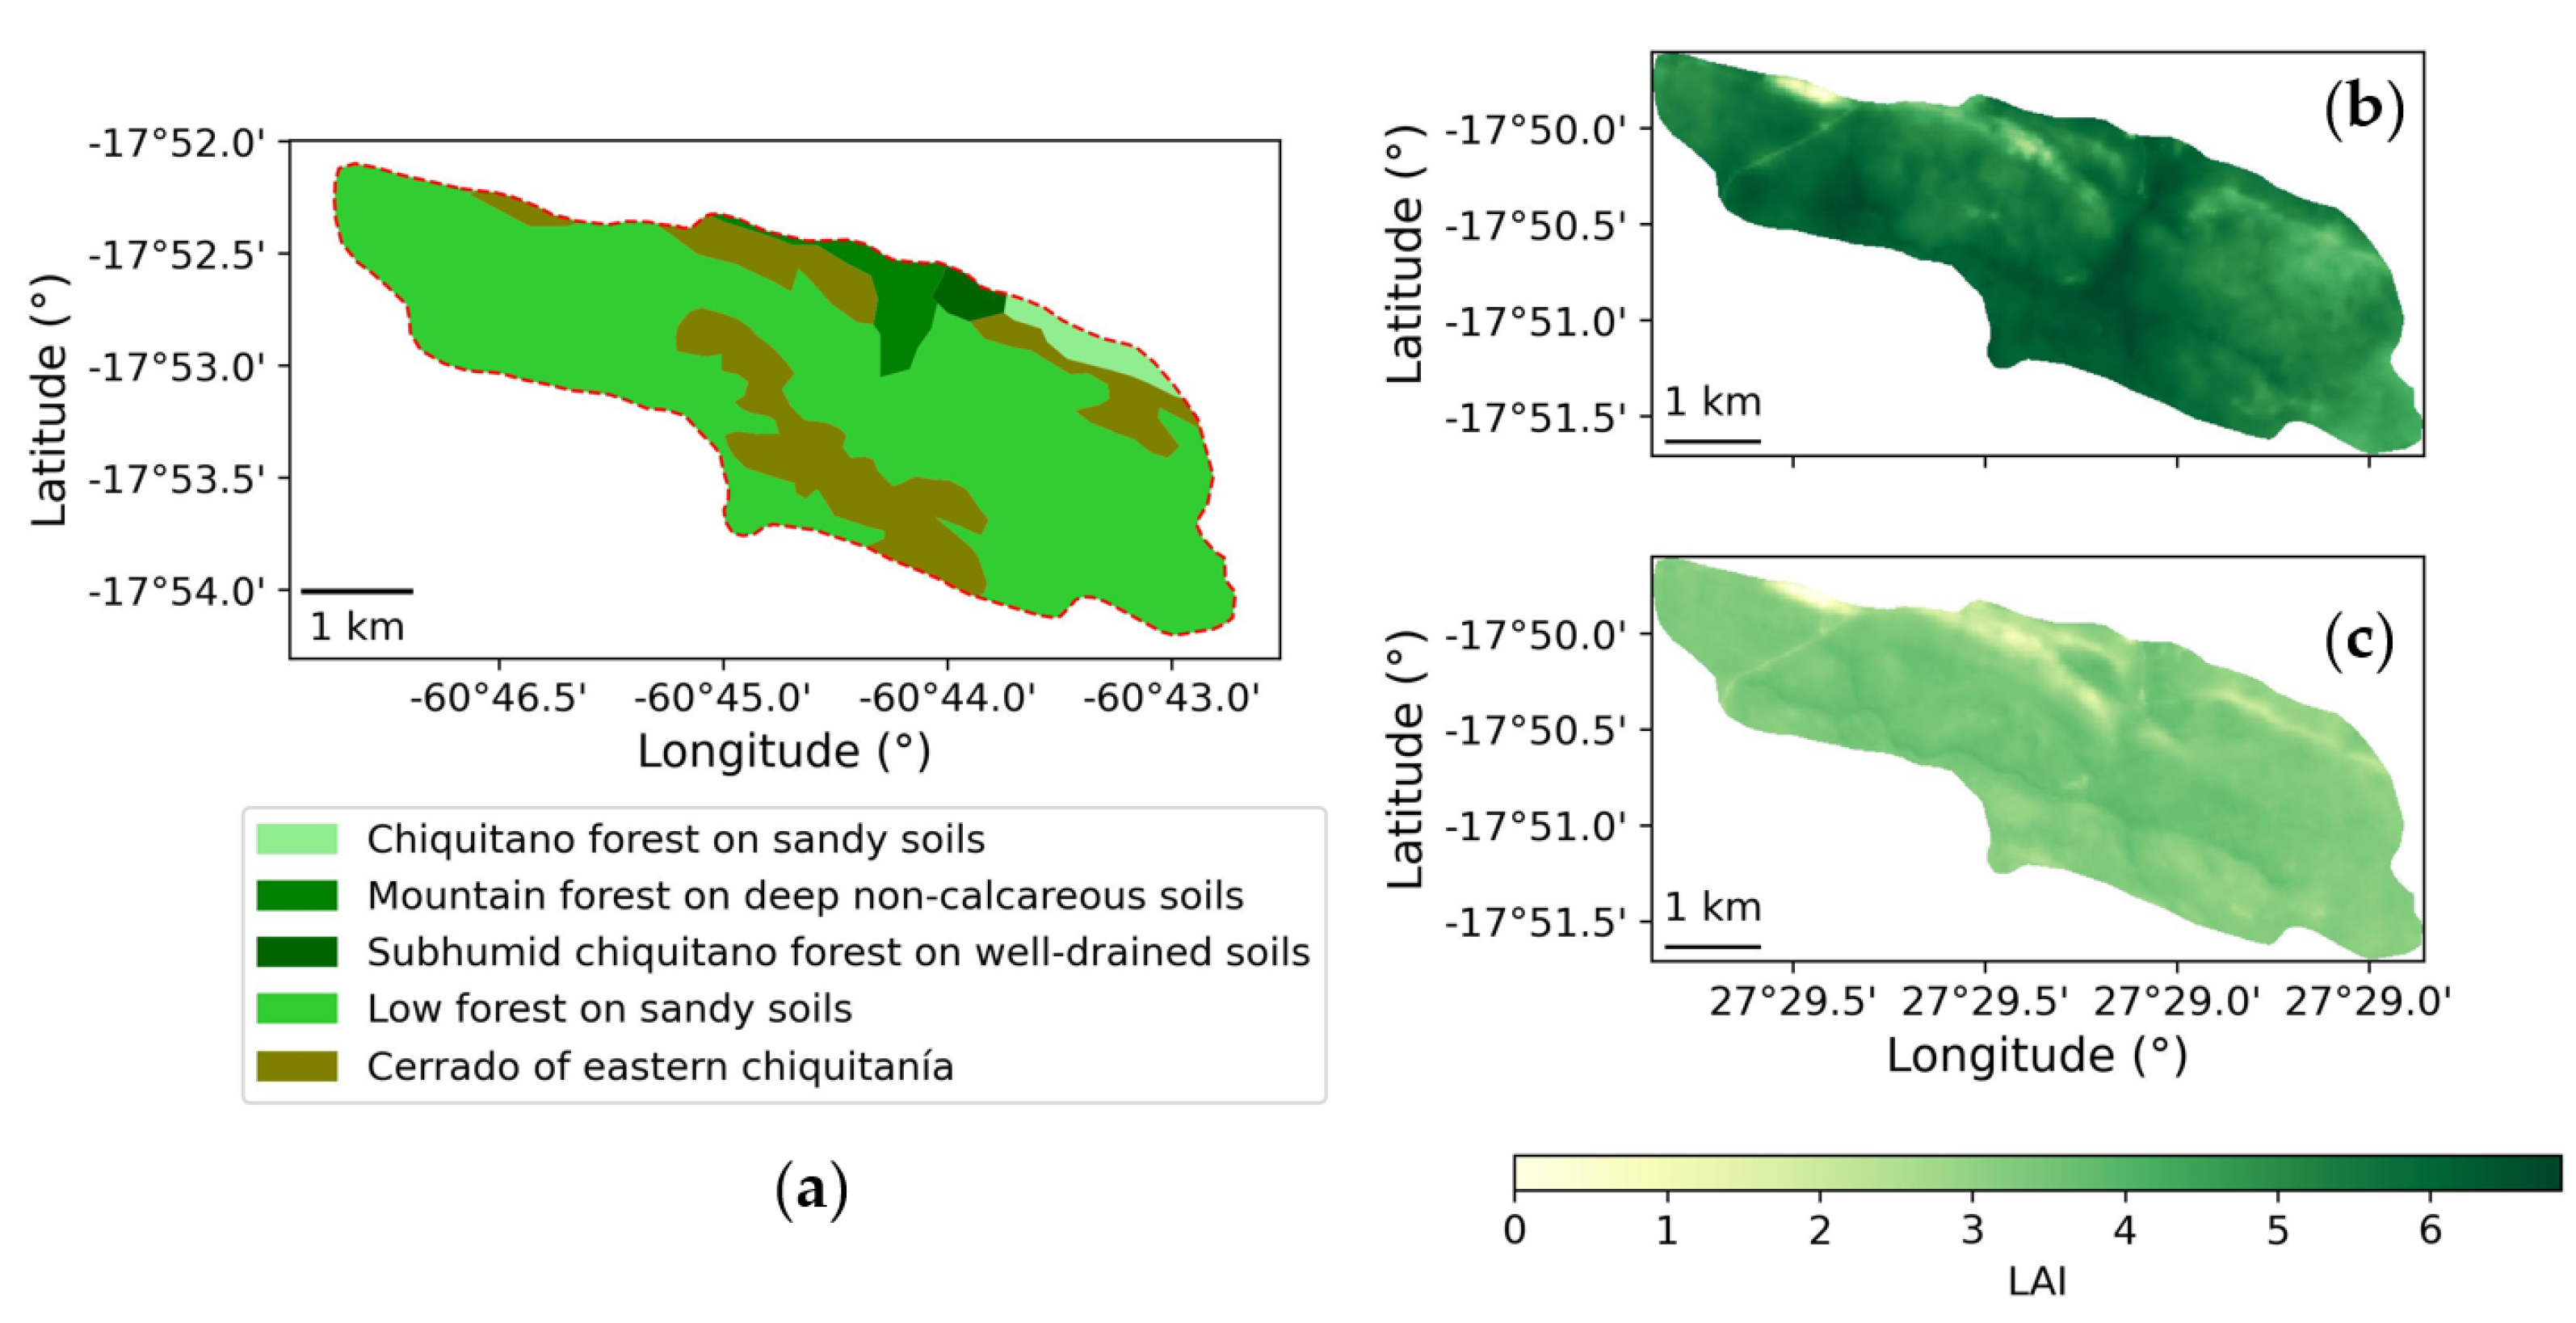
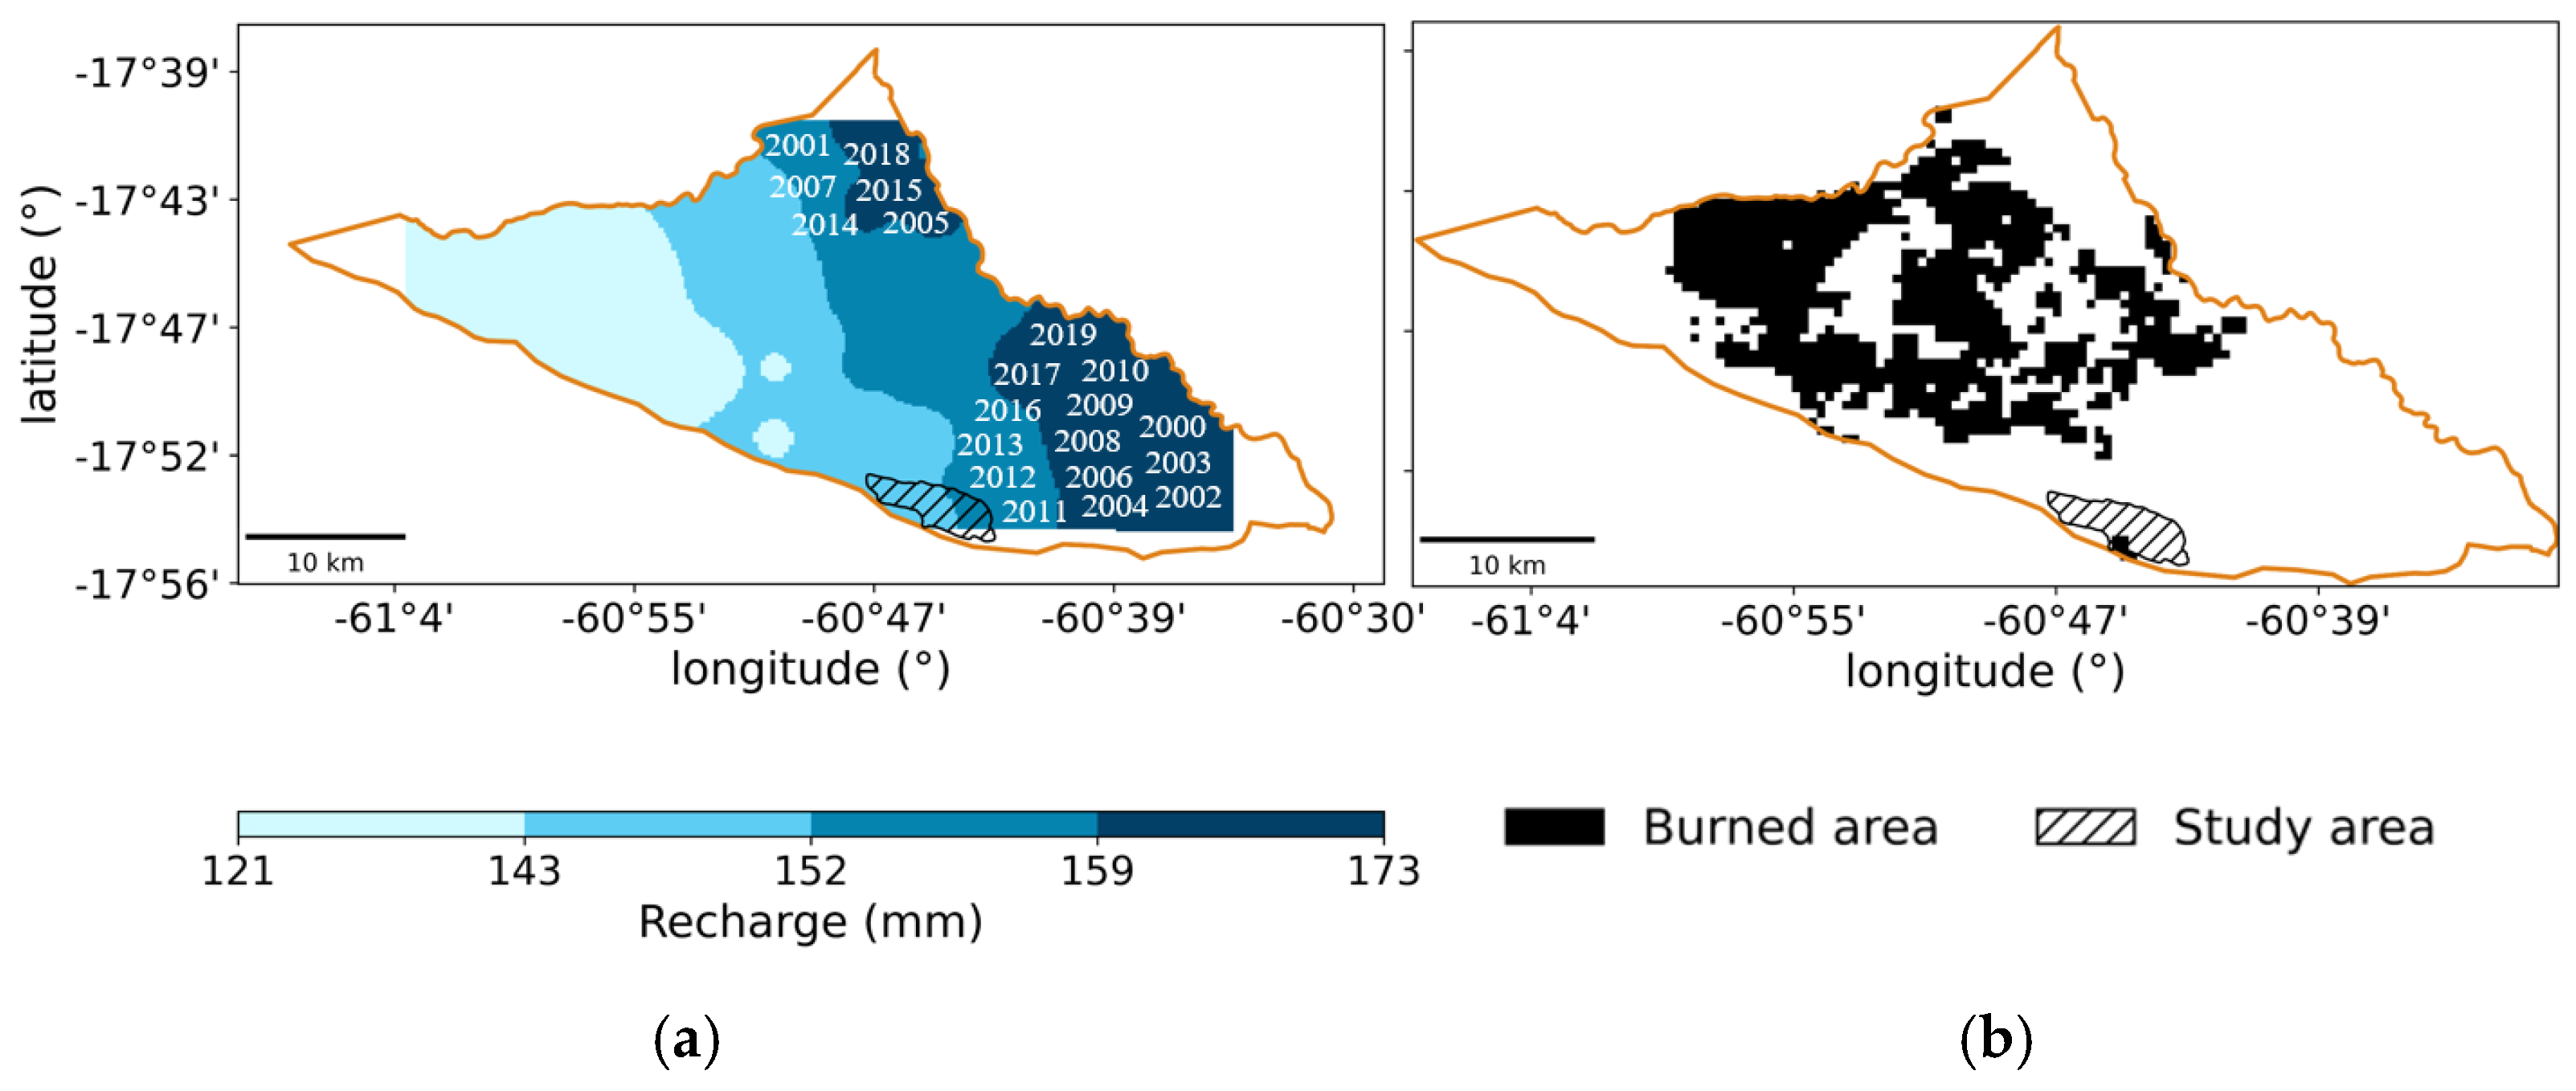
2.1. Study Site

The study analyzes the El Sutó spring (Figure 1), an important water source for San José de Chiquitos city (SJC) in the Chiquitania ecoregion from Bolivia. This spring lies within the north face of the San José mountain range and the Chiquitano dry forest, a critically important tropical dry forest supporting both biodiversity and local communities [44]. The city of SJC, the biggest urban center of the SJC municipality, relies primarily on groundwater from wells and the El Sutó spring to meet its water needs. The municipality, with about 40,961 inhabitants, engages in a mix of traditional and modern economic activities, such as agriculture, livestock rearing, and tourism [45].
Geologically, the San José mountain range forms part of the Chiquitano Massif on the Brazilian Shield, predominantly composed of Proterozoic rocks [46]. These rocks include schists, quartzites, calcsilicates, quartz–feldspar gneisses, and amphibolites from the Tarumá Formation, which have been intruded by the Nomoca granodiorite [47] (Figure 2). Overlying these older units is the Upper Silurian Quimome Formation, mainly consisting of fractured arkosic sandstones interbedded with minor shales [48]. This permeable formation is crucial for groundwater flow. In contrast, the overlying Pororó dolomite exhibits lower permeability, fostering the development of a perched aquifer (Figure 3a) where the El Sutó spring emerges, characterized by low mineral content indicative of short residence times [49].
Figure 2. The geological formations of the San Jose mountain range and an approach to the study site. Map (a) is derived from the official geological map of Bolivia, while map (b) is adapted from the “Geochemical Prospecting for Base Metals in the San José de Chiquitos Area” project [47]. The second map focuses particularly on the El Sutó area, highlighting critical geological formations. Both maps incorporate inferences drawn from their respective sources to provide a detailed representation of the region’s geological features.
Fire 08 00086 g002
Within Parque Nacional Histórico Santa Cruz La Vieja (SCLV), the study area presents elements from the Chiquitano forests and transitional Cerrado [50] (Figure 4a). Higher elevations feature semi-deciduous low forests (10–16 m in canopy height) on sandy soils, while lower-lying terrains exhibit typical Cerrado formations with open shrublands and savanna-like vegetation. According to thematic maps in the Territorial Development Plan for Good Living [51], which compile Food and Agriculture Organization (FAO) datasets [52] and regional vegetation maps [53] supplemented by field validation, notable distinctions in land use, soil type, and vegetation emerge. When reinterpreted for hydrological analysis, these maps indicate that Cerrado generally exhibits a higher leaf area index (LAI) [54], likely due to dense, shrubby growth on seasonally water-collecting substrates (Figure 3b and Figure 4b,c). In contrast, upper-slope dry forests tend toward a moderate or lower LAI, shedding leaves in dry periods to reduce water loss, a strategy that helps facilitate groundwater recharge when rains return [44].
The region’s climate is characterized as a dry tropical savanna with distinctly pronounced wet and dry seasons [44]. A long-term precipitation record (Figure 5) shows significant interannual variability, ranging from approximately 667 mm/year to 1779 mm/year, with an overall total average near 1094 mm/year. To substantiate this variability, Student’s t-test comparing annual precipitation from “dry” years (<800 mm) and “wet” years (>1200 mm) over the period of 1977–2022 (September–August) was performed. Although marked seasonal differences exist, recent data show that annual totals have frequently fallen below the long-term average, indicating a shift toward drier conditions. In the past five years, rainfall totals have predominantly fallen below this average, indicating a shift toward drier conditions. According to the Bolivian Meteorology and Hydrology Service (SENAMHI), a gauge located about 5 km north of the El Sutó spring recorded an average annual temperature of 26 °C and annual rainfall between 836 and 991 mm during the same period [55]. The wet season (November–March) accounts for the bulk of precipitation, as rainfall in the wettest month can be about 15 times greater than in the driest month. High reference evapotranspiration rates (about 157 mm/month) combined with marked rainfall variability frequently lead to water shortages. Overall, approximately 16.4% of annual precipitation recharges the aquifer, with most recharge occurring during the rainy season [56].

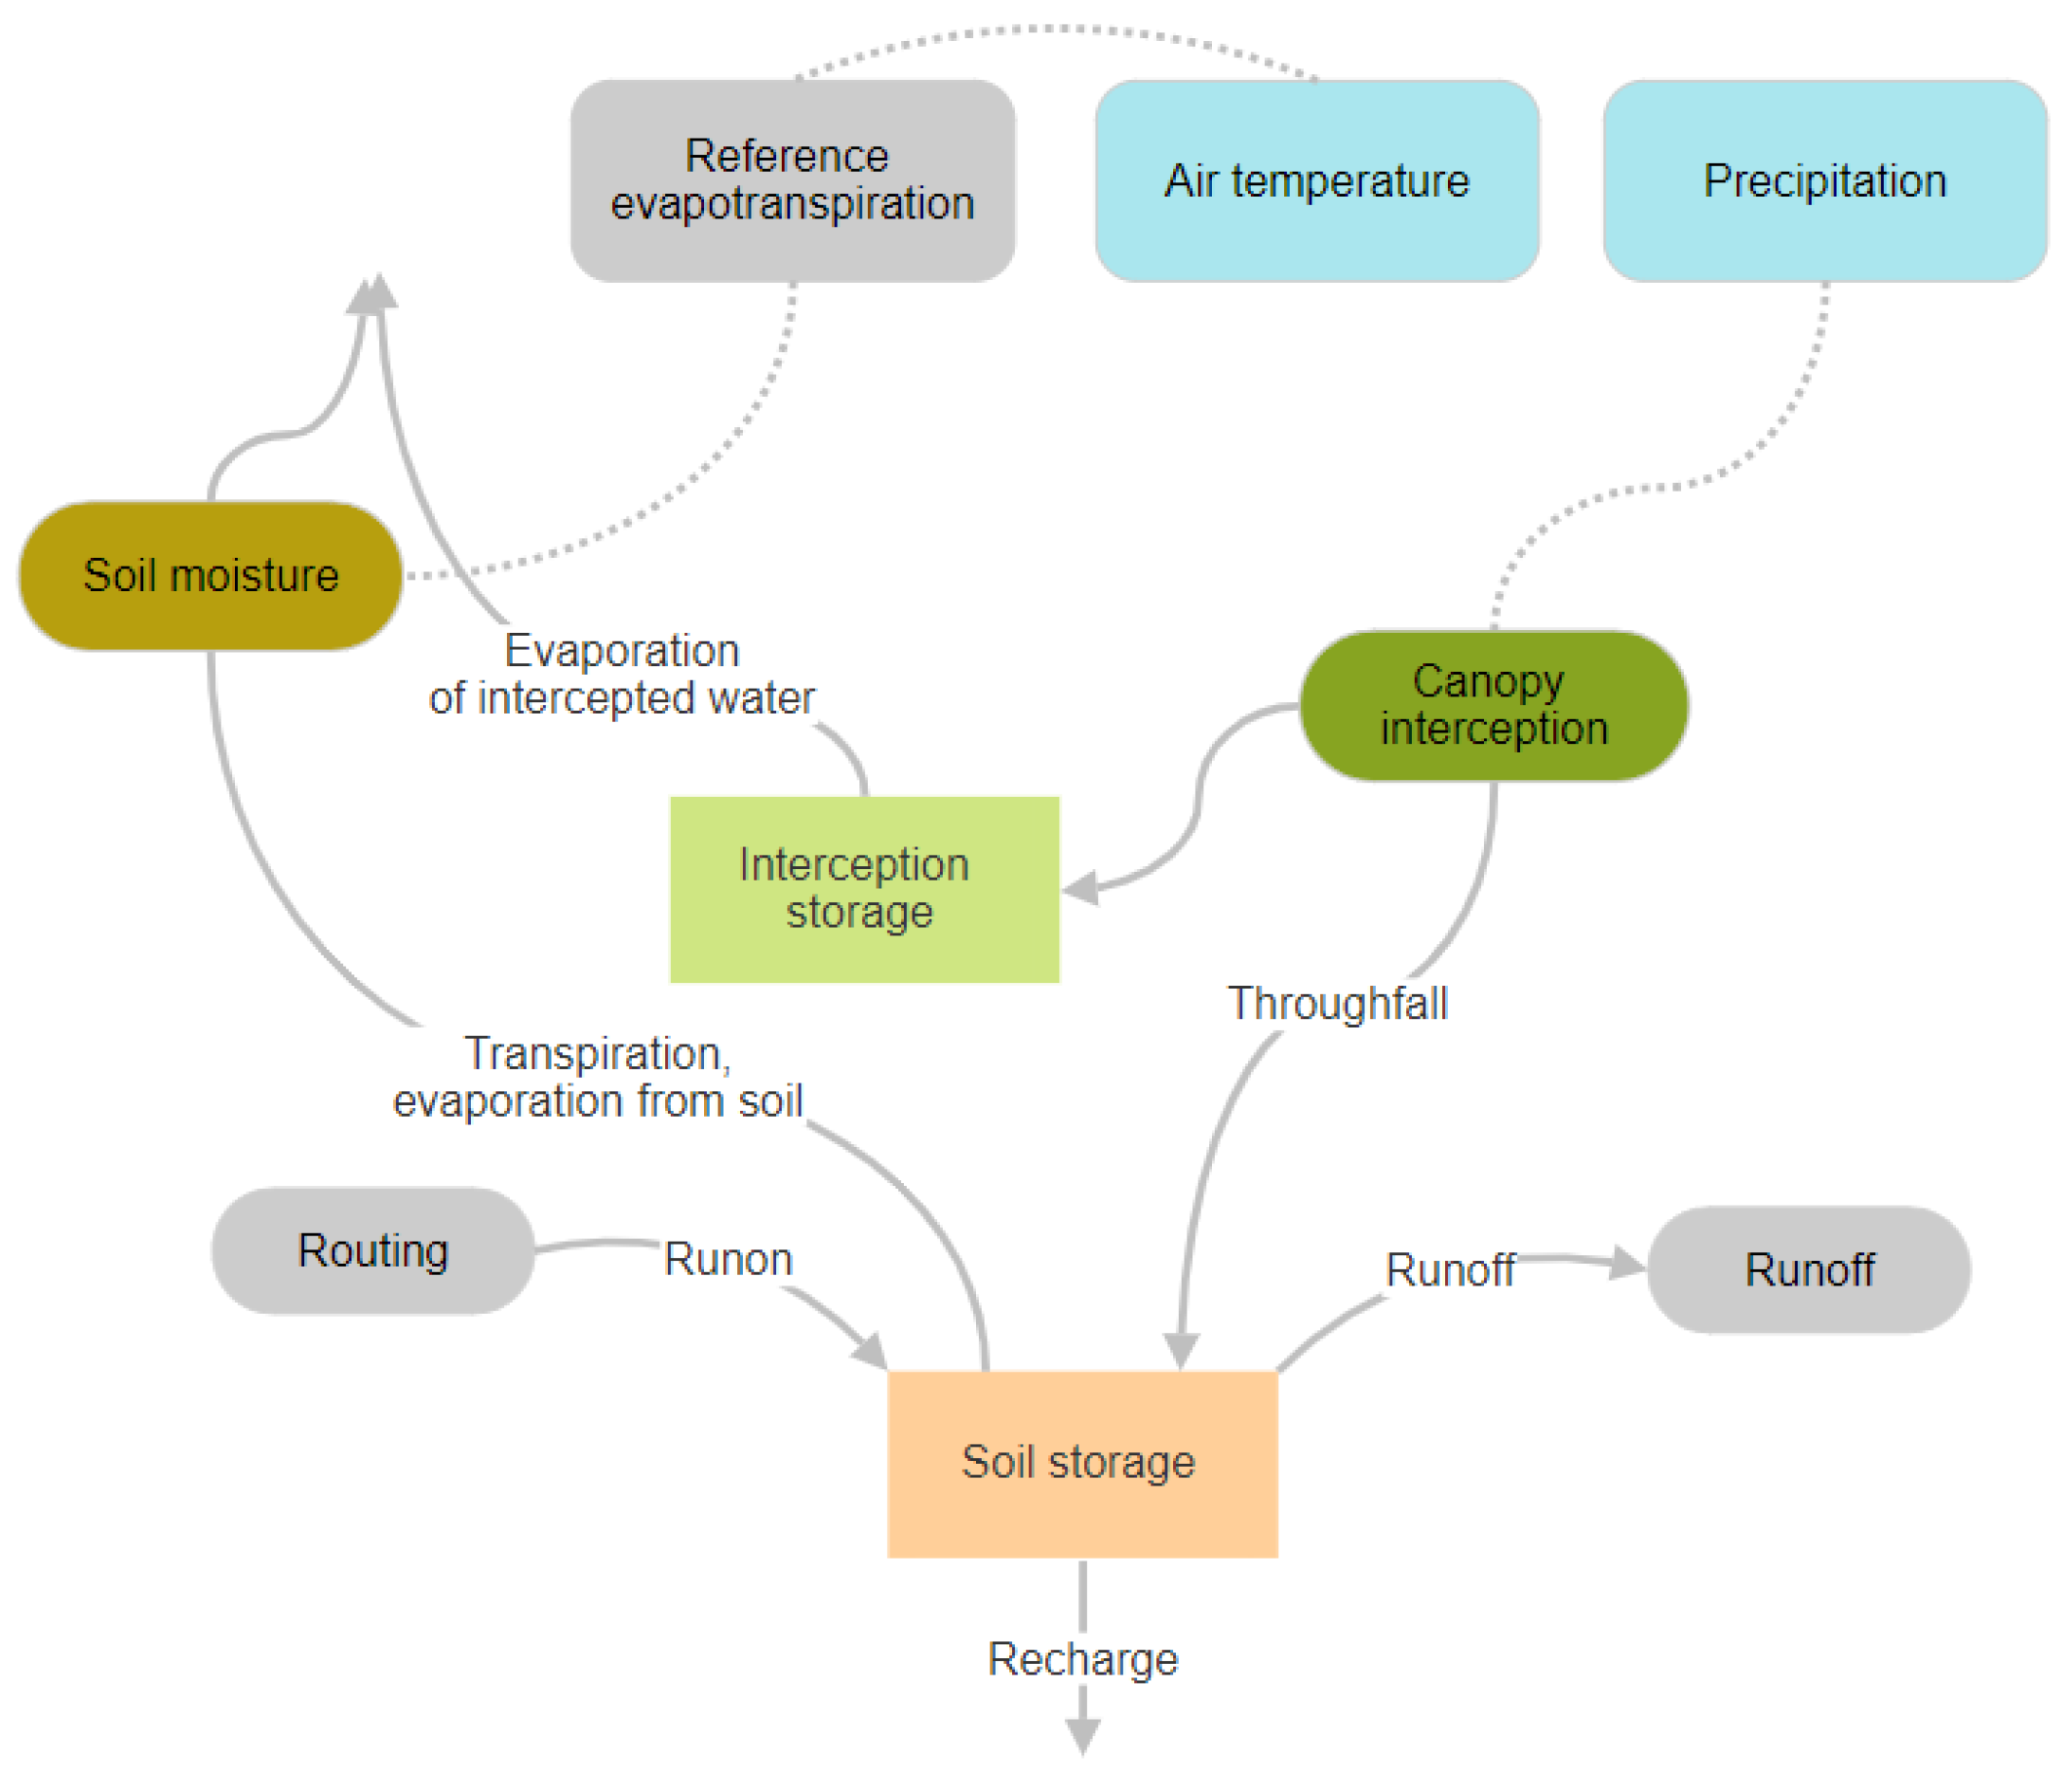
2.2. Hydrological Modeling and Recharge Estimation

Hydrological modeling, statistical analysis, and vulnerability assessment were integrated to assess the impact of wildfires on groundwater recharge in the El Sutó spring area. This integrated approach (i) simulated recharge under two post-fire scenarios using the SWB-USGS model, (ii) adjusted key soil parameters based on documented fire effects (Table 1), and (iii) developed a new vulnerability index inspired by established methodologies like GOD [27].
Table 1. Summary of the relationships between hydrological parameters and wildfire-induced alterations across increasing burn severity, as quantified by the difference between pre-fire and post-fire conditions (∆NBR). As ∆NBR increases from unburned to high severity, soil physical changes (e.g., ash deposits and hydrophobic layers) become more pronounced, reducing infiltration and increasing runoff. Adapted and updated from Guzmán-Rojo et al. [6].
ParameterWildfire Severity Scenario
(ΔNBR Increases →)
Guidelines/References
Curve Number (CN II)CN II = 77 (A), 86 (B), 91 (C), 94 (D)Ash-patch increments proposed by Batellis and Nalbantis [57], with potential additional rises noted by Soulis [58]. Reflects a post-fire adaptation of the daily SCS-CN method.
Saturated Hydraulic Conductivity (KST) K S T = constant = unburned value K S T = 2360 × e x p ( 0.0056 × Δ N B R )  a
K S T = 390 × e x p ( 0.0056 × Δ N B R )  b
a Estimated for sandy loams (KST = 0.147 m/h) for 420 < ΔNBR < 886 [24].
b Adjusted for less permeable sandy loams (KST = 0.0325 m/h) [59].

2.2.1. Model Setup and Baseline Validation

Recharge was modeled using the Soil-Water-Balance (SWB) model version 2.0 developed by the United States Geological Survey (USGS) [60]. This model operates on a daily timestep (Figure 6) and utilizes an adapted Thornthwaite–Mather soil moisture accounting approach to calculate recharge for each grid cell [61,62]. Using a daily timestep helps capture intermittent rainfall pulses that strongly influence infiltration in semi-deciduous forests [63]. SWB also allows the user to select sub-methods for interception, evapotranspiration, and runoff, among others, making it possible to adapt to local data availability or particular modeling objectives. A vital component of this approach is articulated in Equation (1):
θt = θt−1 + P + Son − I − Soff − ET
In Equation (1), θt represents the soil moisture for the current simulation day and θt−1 denotes the soil moisture from the previous day’s simulation. These terms, along with precipitation (P), surface water inflow (Son), losses due to interception (I), surface water outflow (Soff), and actual evapotranspiration (ET), are involved in accurately simulating daily soil water interactions through the SWB-USGS.
Figure 6. Schematic representation of the SWB-USGS V2.0 model, based on the Thornthwaite–Mather daily soil moisture accounting approach [60]. Arrows depict each computational cell’s primary inflows, outflows, and storage components.
Fire 08 00086 g006
Canopy storage and evaporation were modeled using the Gash method. This method divides rainfall events into storage by leaves, trunks, stems, and throughfall that reaches the soil. Higher canopy cover can store more water, which evaporates later [64]. The SWB model interprets the remaining precipitation as infiltrating or contributing to runoff [60]. Runoff estimation within the SWB model was conducted using the Curve Number (CN) method [65], a dimensionless index combining soil retention, land use, and antecedent moisture. This approach sets a conceptual threshold that must be exceeded before effective runoff begins. Distinct CN values were assigned to soil and vegetation combinations.
Reference evapotranspiration was estimated using the Hargreaves method [66]. This approach uses minimum and maximum daily temperatures to approximate radiative energy [67]. It often performs well with limited climate data. SWB then modifies reference evapotranspiration through a crop coefficient curve so that the seasonally changing canopy structure can be represented [62]. Daily soil moisture is updated each timestep, incorporating infiltration, runoff, and water loss to plants [60].
The baseline parameters for the El Sutó spring area were derived from a previously validated, multi-model assessment under unburned conditions [56]. This assessment examined daily and seasonal recharge using multiple water balance models, validated with local hydrogeological surveys and further cross-validated through analyses of intermediate processes, employing detailed meteorological, soil, vegetation, and other environmental data to capture the characteristics of Cerrado and dry forest ecosystems. The integrated analyses found that approximately 15–17% of annual precipitation infiltrates the fractured sandstone aquifer. In that study, a simplified MODFLOW 6 application (via ModelMuse version 5.1.1.0, USGS, Reston, VA, USA) compared daily recharge estimates with observed water level changes in a small piezometer network. This indirectly verified infiltration thresholds in this data-scarce environment. These validated soil properties, vegetation parameters, and initial infiltration rates serve as the baseline for incorporating subsequent wildfire-driven adjustments.

2.2.2. Post-Fire Soil Parameter Adjustments

Following the recommendations of Guzmán et al. [6], post-fire soil parameter adjustments were implemented, mainly focusing on saturated hydraulic conductivity (KST) and the Curve Number (CN). The study incorporated key findings from Batelis and Nalbantis [57], which systematize CN increments drawn from various earlier references, and the exponential decreases in KST proposed by Moody et al. [24]. In addition, the field-based approach of Soulis [58] was considered, as it demonstrated that CN increments for well-drained soils can be considerably higher under severe burn conditions. Two hypotheses were simulated; the first represents the immediate post-fire conditions, in which both the CN and KST are adjusted to account for decreased infiltration capacity and increased runoff resulting from ash deposition, soil crusting, and reduced porosity; the second represents conditions approximately two years after the fire, when the ash has been largely removed, and only KST remains altered due to lasting changes in soil structure.
In the conceptual and subsequent numerical model, the study area was subdivided into two principal hydrological zones based on interpreted information of soil and vegetation from sources like FAO soil maps and regional vegetation data, herein classified as Type B (lower zone) and Type C (upper zone), as shown in Table 2. Informed by previous studies on the hydrological effects of forest fires [57], the CN values were adjusted to reflect post-fire conditions in each zone. The literature suggests that an increase in the CN is unique for each hydrological group (A-D), reflecting the formation of hydrophobic layers and loss of structure in the surface layer. The CN represents an aggregated parameter that integrates the hydrological response over an entire pixel (including areas with and without ash or crusts) and is not directly measured in situ. Nonetheless, Soulis [58] indicates that in highly permeable terrains, the post-fire CN shift can be as large as 25–36 units, underscoring the potential range in burned watersheds. Given the sandy loam nature of our lower zone and the limited in situ post-fire data, the moderate increments adopted here remain plausible for initial modeling while acknowledging that site-specific conditions may warrant larger CN differentials in some instances.
Saturated hydraulic conductivity (KST) directly reflects soil structure and porosity, making it a key parameter for modeling post-fire infiltration. In this study, KST was reduced by 70% to represent the pronounced soil permeability loss that can occur during high-intensity fires, when heating and organic matter depletion are extensive [24,59]. For longer-term scenarios (beyond two years post-fire), only KST remained altered, consistent with evidence that soil structure recovery can lag behind the dissipation of hydrophobic coatings [68]. Recent field measurements in the Chiquitano dry forests [69] report KST decreases of about 39% under moderate-to-high burn severity and only 10–15% under low-severity conditions. However, the unpredictable nature and danger of high-severity fires often preclude direct in situ measurements at peak intensity, particularly in remote areas of Bolivia, making data from these extreme conditions scarce. Therefore, the 70% reduction adopted here, while higher than observed in moderate burns, reflects a hypothetical severe-fire scenario and recognizes the exponential response of actual soil [24]. This approach aims to capture the potential upper bound of soil permeability loss and highlight the sensitivity of groundwater recharge processes under extreme fire conditions.

2.2.3. Large-Scale Validation Proxy and Sensitivity Analysis

To determine whether the hypothesized post-fire impacts on groundwater recharge are reflected in broader municipal-scale datasets, a preliminary validation was conducted at San José de Chiquitos and the surrounding areas. First, satellite-derived datasets from FLDAS [70,71] (~10 km resolution) and TerraClimate [72] (~4 km resolution) were used to establish external climate and hydrological baselines (monthly data) spanning approximately two decades. To assess their reliability, we compared these estimates against SENAMHI ground observations, applying standard correlation and error metrics such as the coefficient of determination (R2), root mean square error (RMSE), and mean absolute error (MAE). Both FLDAS and TerraClimate apply advanced correction algorithms and combine multiple input data sources, as documented by McNally et al. [70] and Abatzoglou et al. [72], to improve the accuracy of precipitation, evapotranspiration, and soil moisture estimates in data-scarce regions. Following the simplified water balance approach of Magnoni et al. [73], these larger-scale records provided a coarse but instructive view of groundwater recharge trajectories. Although spatial resolution constraints limited precision, these external datasets offered an initial context for interpreting localized SWB (Soil-Water-Balance) results at El Sutó.
Historical Landsat 5 TM data were also incorporated to capture key fire occurrences and land cover changes around 2008, a pivotal year based on the Moderate Resolution Imaging Spectroradiometer (MODIS) MCD64A1 [74] records and municipal archives. Since Landsat 8 and 9 were not operational then, Landsat 5 TM represented the best option for extended historical comparisons. All Landsat images were obtained from the U.S. Geological Survey (USGS) Earth Explorer (Sioux Falls, SD, USA) platform, using Level-2 products that include equations and rescaling factors for the transformation of Raw Digital Numbers (DNs) to absolute units of at-sensor spectral radiance, top-of-atmosphere (TOA) reflectance, and at-sensor brightness temperature. Moreover, Level-2 products refer to the calibration of atmospheric contamination, where the image data have been geometrically and radiometrically processed to surface reflectance having a radiometric consistency. The Thematic Mapper (TM) sensor has an onboard calibration system called IC. It was improved in 2003 based on radiometric calibration curves derived from different responses to IC, measurements, and cross-calibrations with the Enhanced Thematic Mapper plus (ETM+) sensor, where the radiometric scaling coefficient was changed, and gain values were as much as 15% [75]. Meanwhile, Sentinel-2 imagery from the European Space Agency (ESA, Paris, France) provides a range of datasets to support the mapping of land cover, classification and change maps, and the accurate assessment of geophysical parameters. It helped refine recent land cover classifications (post-2015) using Level-2A products (corrected for atmospheric, adjacency, and slope effects) with a 10–20 m resolution to discern subtle vegetation recovery. Although we harmonized reflectance values across Landsat and Sentinel-2 (masking clouds/shadows), differences in spatial and sensor characteristics remain a caveat. As a complementary step, the MCD64A1.006 (500 m) burned area product was accessed through National Aeronautics and Space Administration (NASA) EarthData and Google Earth Engine (GEE, Google, Mountain View, CA, USA) for identifying burn dates, uncertainties, and quality flags.
In parallel, we compared estimated recharge trajectories in nearby areas that had experienced less pronounced fire histories before 2019. Additional details on satellite-based methods, data harmonization, and validations, including data-processing scripts, at these sites are documented [76,77]. While not fully representative, these additional site-based comparisons suggested that landscapes with fewer wildfires exhibit more stable recharge trends, thus providing a limited external check on the El Sutó model outputs. While spatial resolution constraints and data assumptions prevented a precise or fully representative assessment, these complementary site-based comparisons served as an initial indicative exploration. In doing so, they provided early insights into how varying fire histories might manifest at broader scales, informing the refinement of future modeling efforts and vulnerability assessments.
After establishing this validation context, a sensitivity analysis was conducted to evaluate how key soil parameters influence groundwater recharge estimation in the SWB model. A range of Curve Number (CN), maximum infiltration capacity (Imax), and root-zone depth (Rzn) values were generated and integrated into the model’s land use lookup tables. Specifically, 1000 random combinations were generated with CN values ranging from 55 to 100, Imax values varying from 5 to 60 mm, and Rzn values ranging from 5 to 300 mm. These parameter variations were analyzed using Spearman’s rank correlation and principal component analysis (PCA) [78], ensuring that monotonic relationships were detected without imposing linearity and that the dataset could be reduced to a manageable set of dominant controlling factors. These insights informed the development of the Fire-Related Forest Recharge Impact Score (FRIS) by defining parameter boundaries relevant to post-fire conditions.

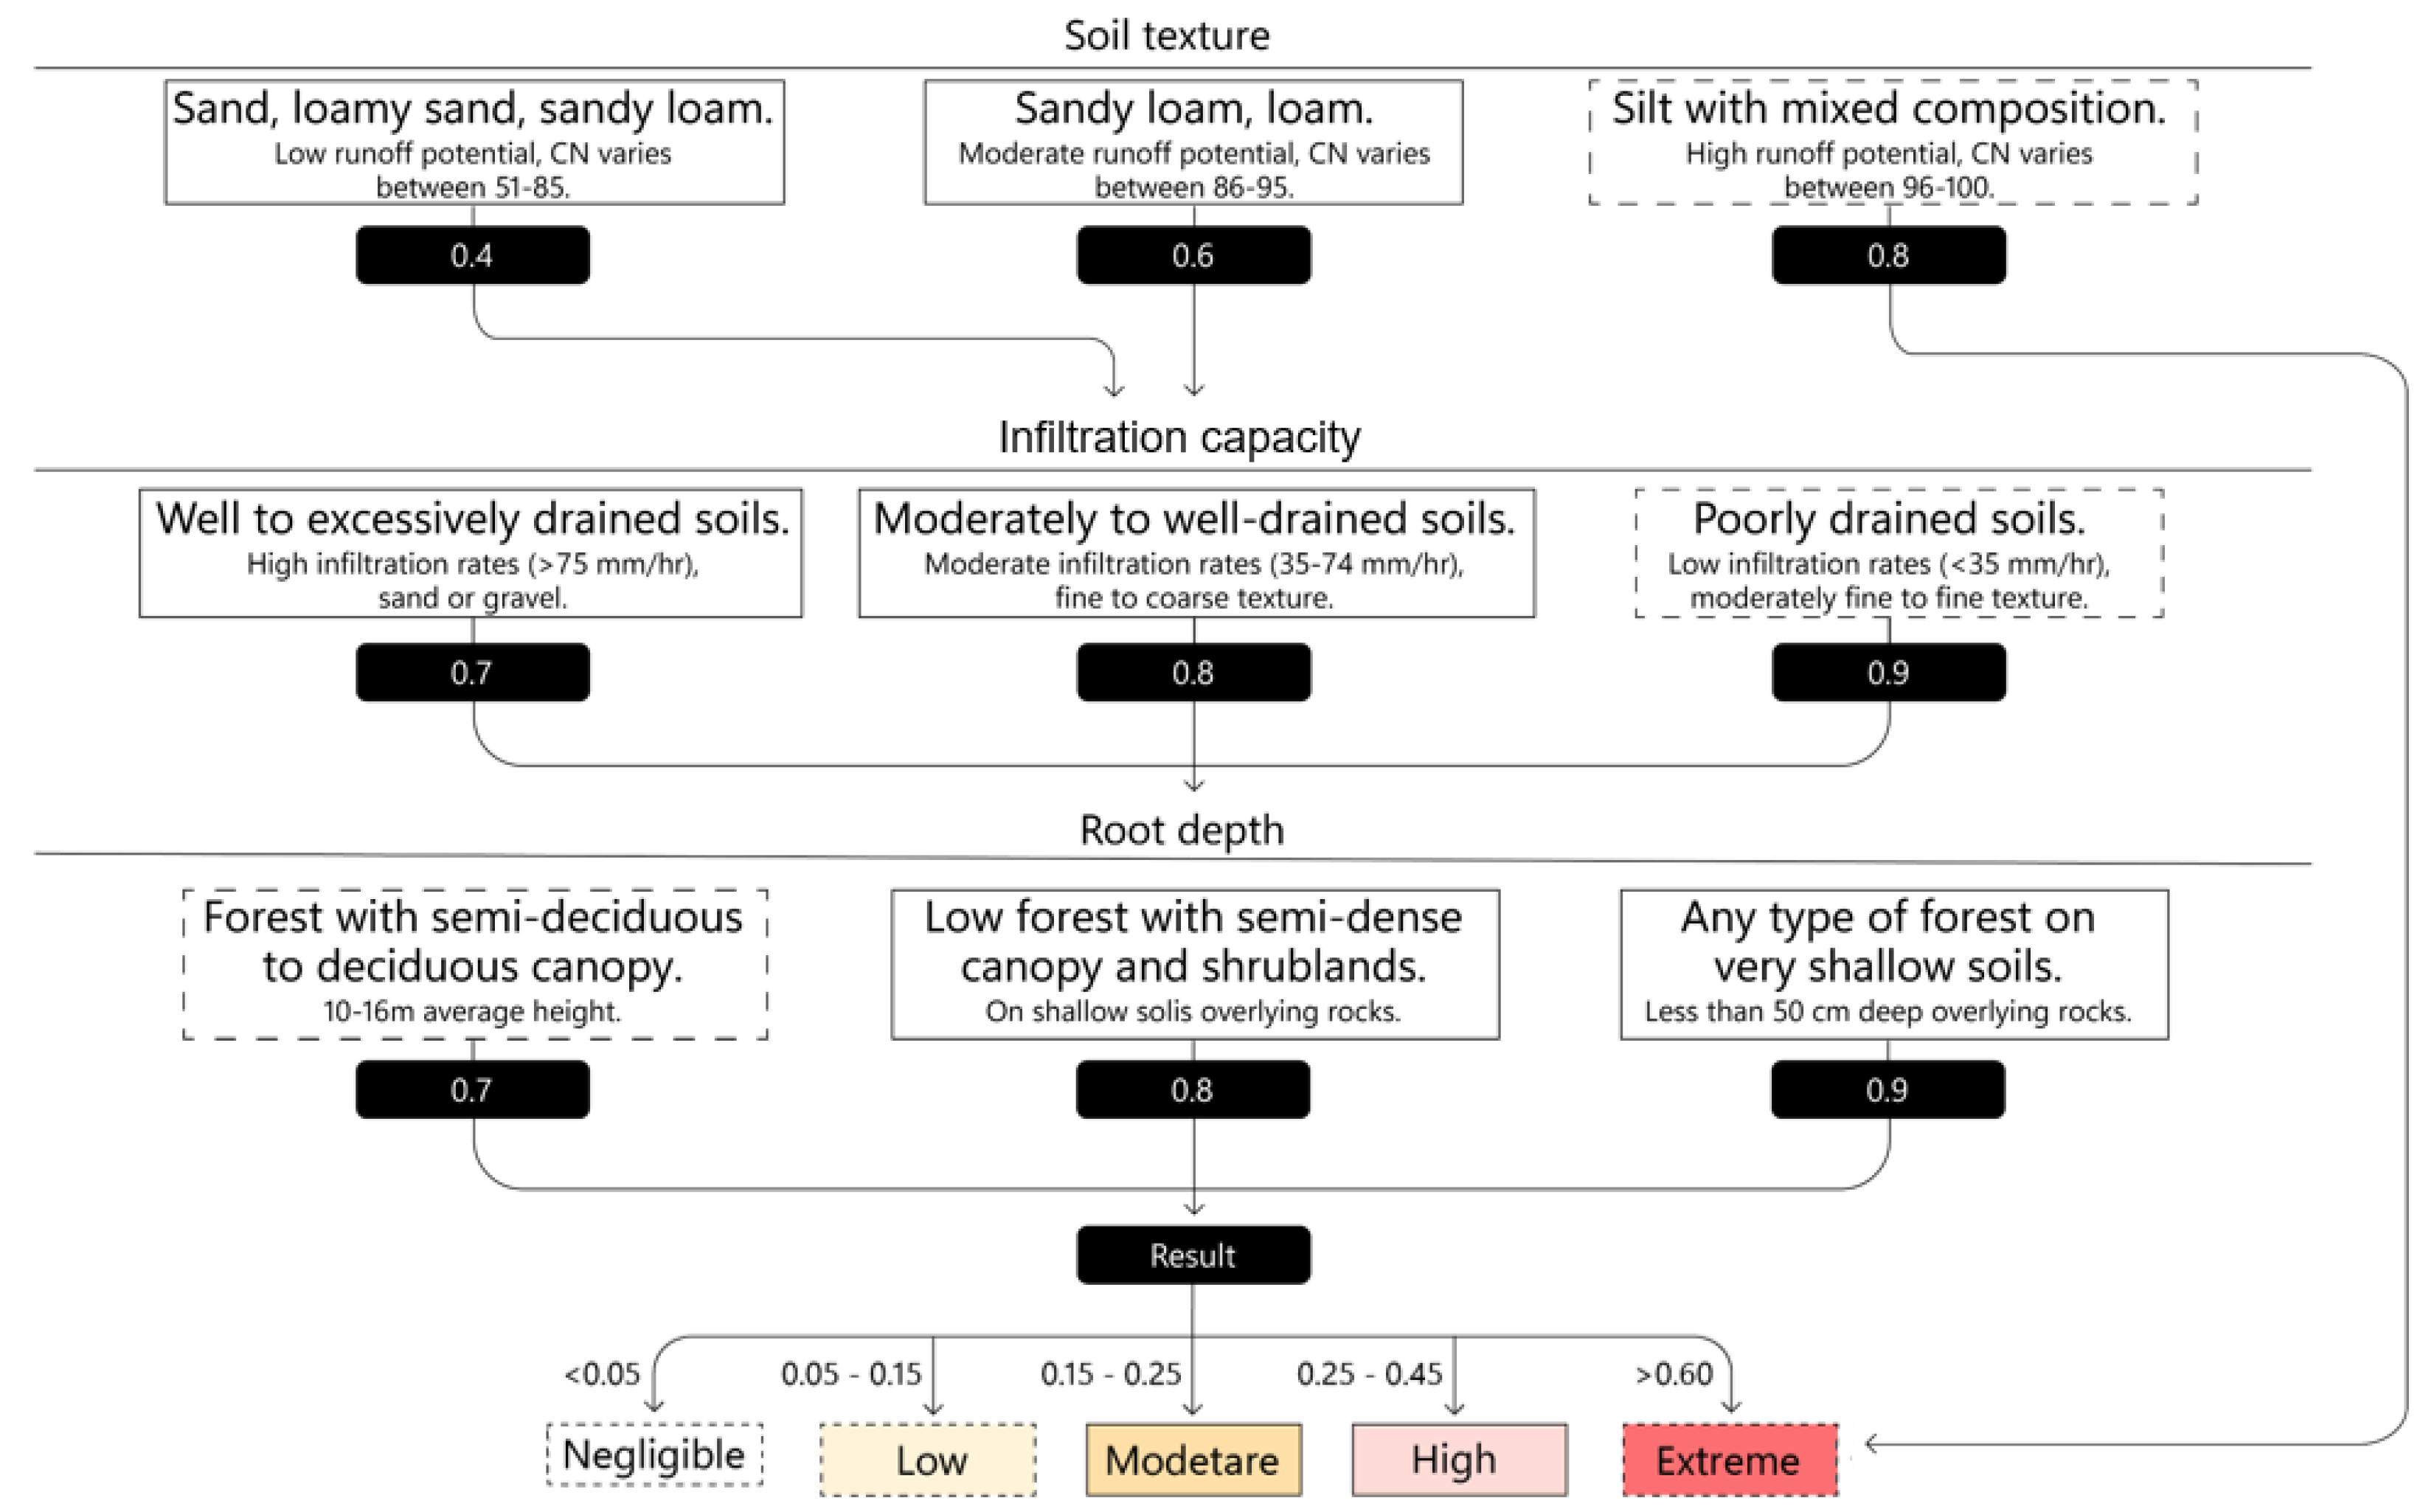
2.3. Development of the Fire-Related Forest Recharge Impact Score (FRIS)

The Fire-Related Forest Recharge Impact Score (FRIS) was developed as a dimensionless indicator of groundwater recharge vulnerability following wildfires, building on indexing principles established by the GOD method [27]. Inspired by this conceptual framework, the FRIS integrates parameters known to shift in response to fires, including soil texture, maximum infiltration capacity, and root depth. These factors jointly shape post-fire moisture retention and runoff, thereby influencing long-term groundwater recharge.
Parameter selection and weighting were informed by both the sensitivity analysis and the observed outcomes of post-fire simulations conducted for one year and beyond two years in the El Sutó spring area. By examining how recharge percentages changed under varying soil conditions over different timeframes, it was possible to identify which parameters most strongly controlled post-fire recharge dynamics. The resulting scoring system translates deviations from baseline conditions into distinct vulnerability categories, using dimensionless ranges to facilitate broad application. In this way, the FRIS provides a practical tool for comparing post-fire recharge vulnerabilities. The goal was to provide local stakeholders with a practical tool for approximating groundwater vulnerability using readily available soil and vegetation data, plus local knowledge of species composition and drainage patterns. Overall, this vulnerability framework supports land use planning, water resource management, and wildfire recovery efforts in the Chiquitania region.

3. Results

This section presents the findings on how soil parameters influence hydrological balance components, particularly groundwater recharge, in the El Sutó spring area following wildfires. Through statistical assessments and simulations using the SWB-USGS model, the interplay between soil characteristics and water balance elements was analyzed. Model predictions were then validated using external datasets and regional trends over the past two decades. Finally, a new index was developed to create vulnerability maps based on selected parameters, enhancing the understanding of groundwater recharge dynamics in post-fire scenarios.

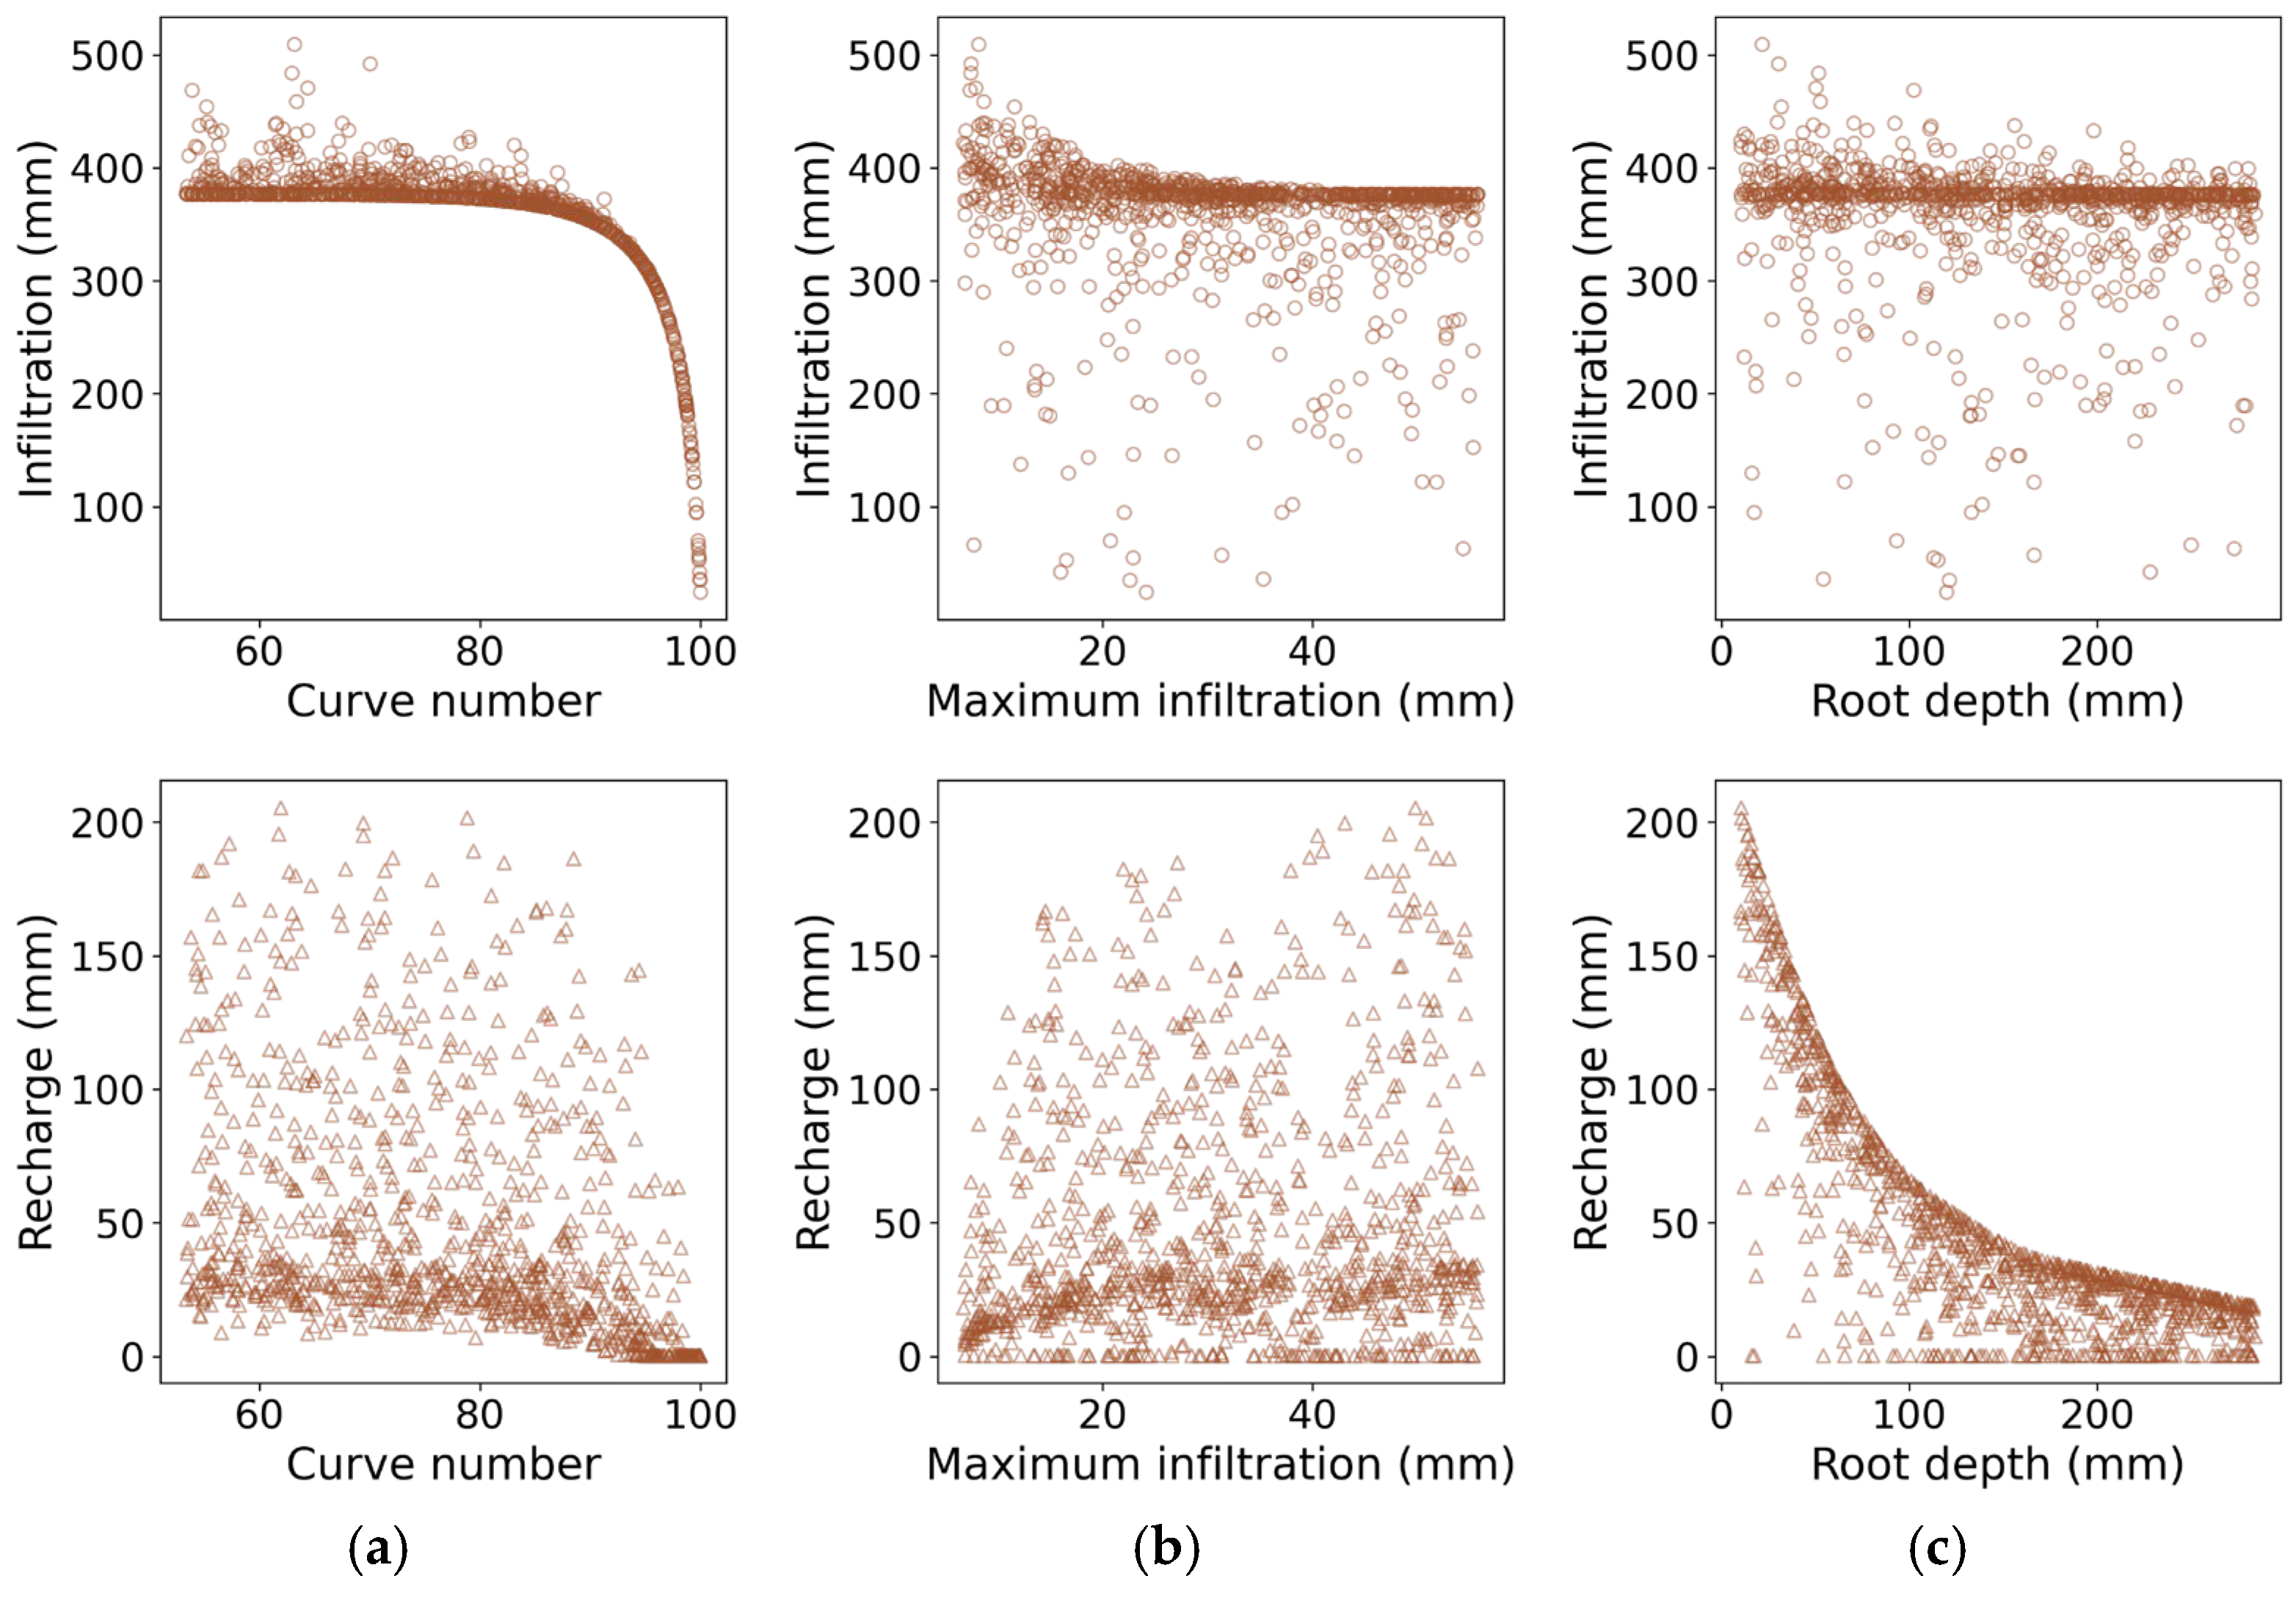
3.1. Interplay of Soil Parameters in Groundwater Recharge

To better understand the impacts of wildfire-induced soil changes on groundwater recharge, the relationships between key soil parameters and hydrological processes were analyzed. Spearman’s rank correlations and PCA jointly illustrated how these parameters influenced recharge dynamics. As anticipated, the Curve Number (CN) exhibited a strong positive correlation with runoff (ρ = 0.93) and a pronounced negative correlation with infiltration (ρ = −0.81), indicating that higher CN values shifted water away from infiltration. The maximum infiltration capacity (Imax) correlated negatively with runoff (ρ = −0.59) and mildly positively with recharge (ρ = 0.13), suggesting that even modest enhancements in infiltration capacity can facilitate groundwater recharge. Root zone depth (Rzn) correlated positively with evapotranspiration (ρ = 0.86) and negatively with recharge (ρ = −0.78), underscoring that deeper roots increase water uptake at the expense of groundwater recharge. PCA confirmed these patterns, grouping runoff with the CN and distinguishing infiltration and recharge as separate factors influenced by soil structure and vegetation. Overall, the combined results highlighted how wildfires impact soil, especially infiltration and root depth, and can notably change the potential for groundwater recharge.
By testing the relationships between these parameters and hydrological responses through the SWB model (Figure 7), thresholds and trends were observed. Model simulations showed that infiltration remains consistently around 380 mm at lower Curve Number (CN) values (up to 85), then drops sharply toward zero once the CN exceeds 95–100. Recharge similarly decreases from about 25 mm at a CN of 80 to near zero beyond a CN of 95. For the maximum infiltration capacity (Imax), values between 20 and 60 mm sustain stable infiltration (~380 mm) and recharge (~25 mm), whereas Imax < 20 mm introduces high variability. Root zone depth (Rzn) exerts a similarly strong influence on recharge, declining from ~200 mm at Rzn = 20 mm to around 20 mm at Rzn = 300 mm. These thresholds and discontinuities are summarized in Table 3, underscoring how shifts in the CN, Imax, and Rzn can markedly alter groundwater recharge processes.

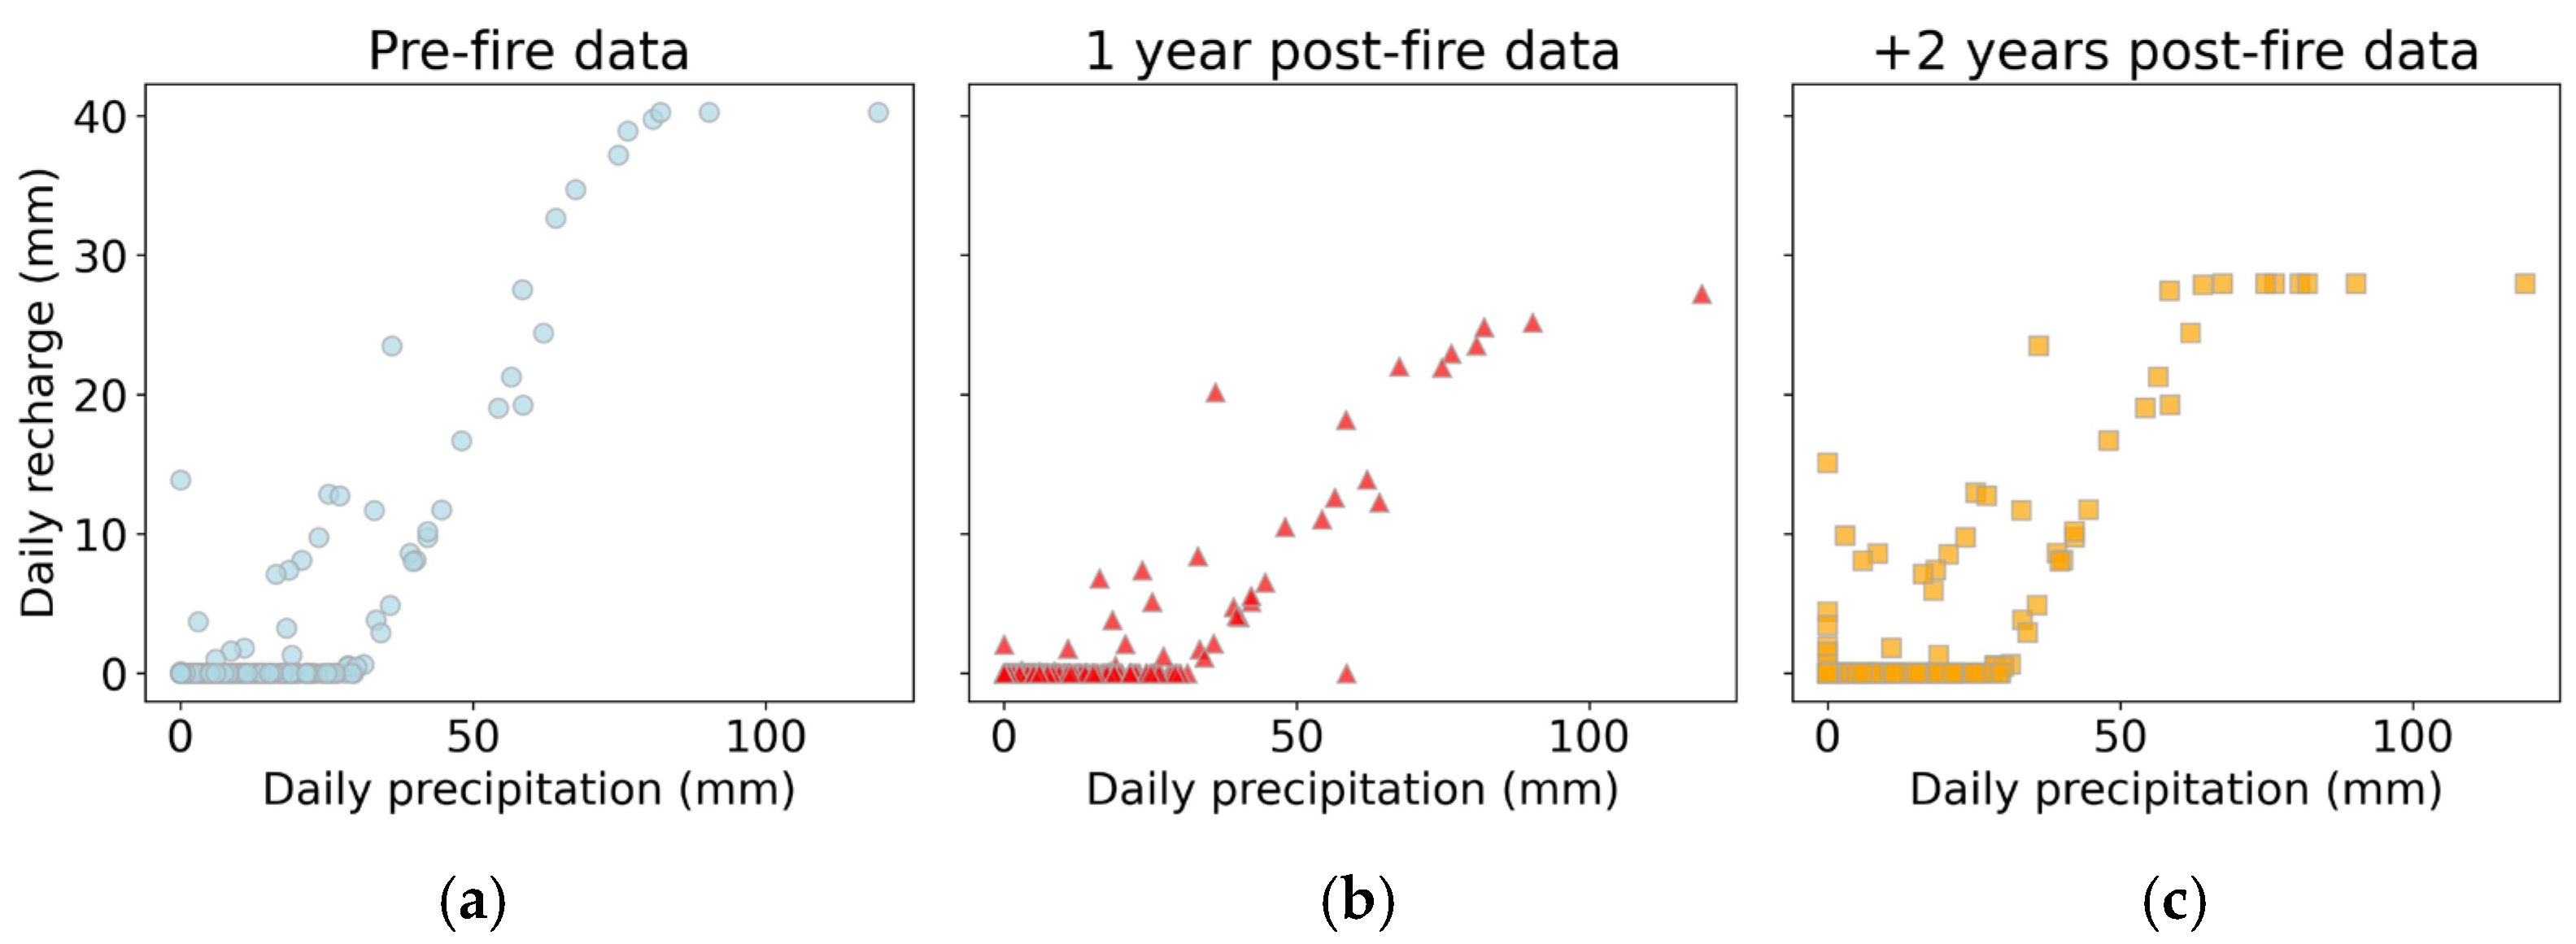
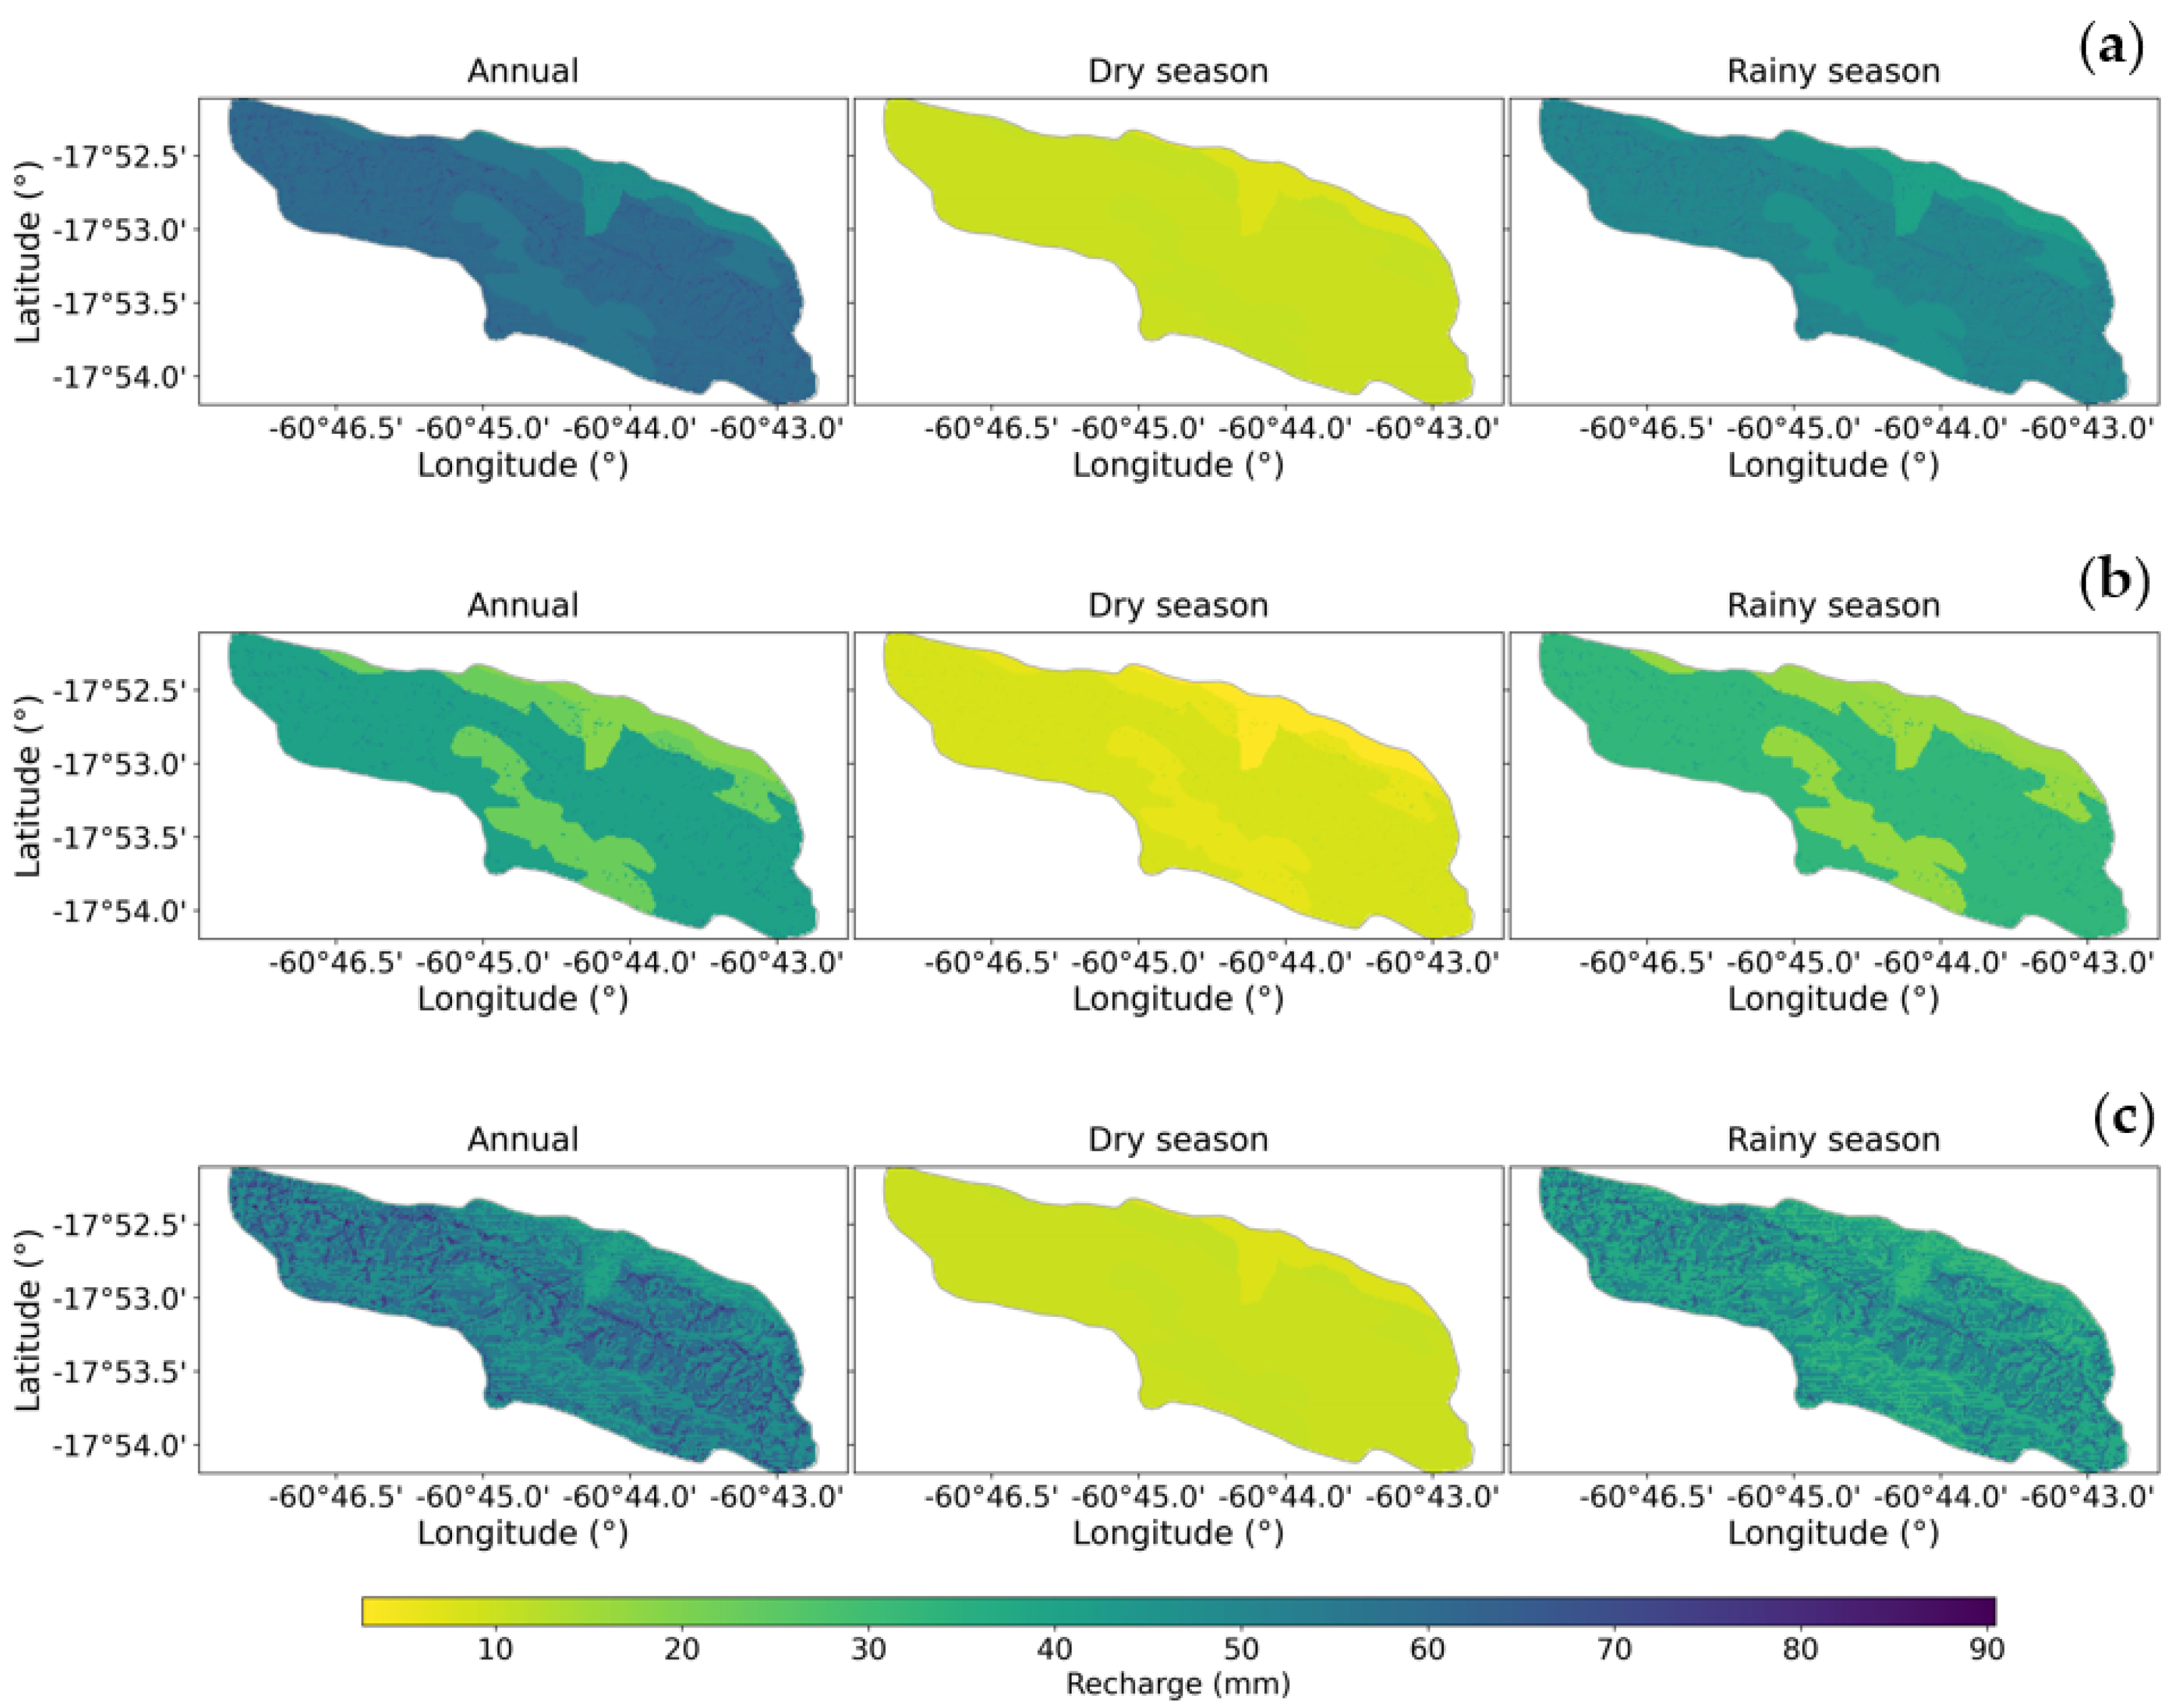
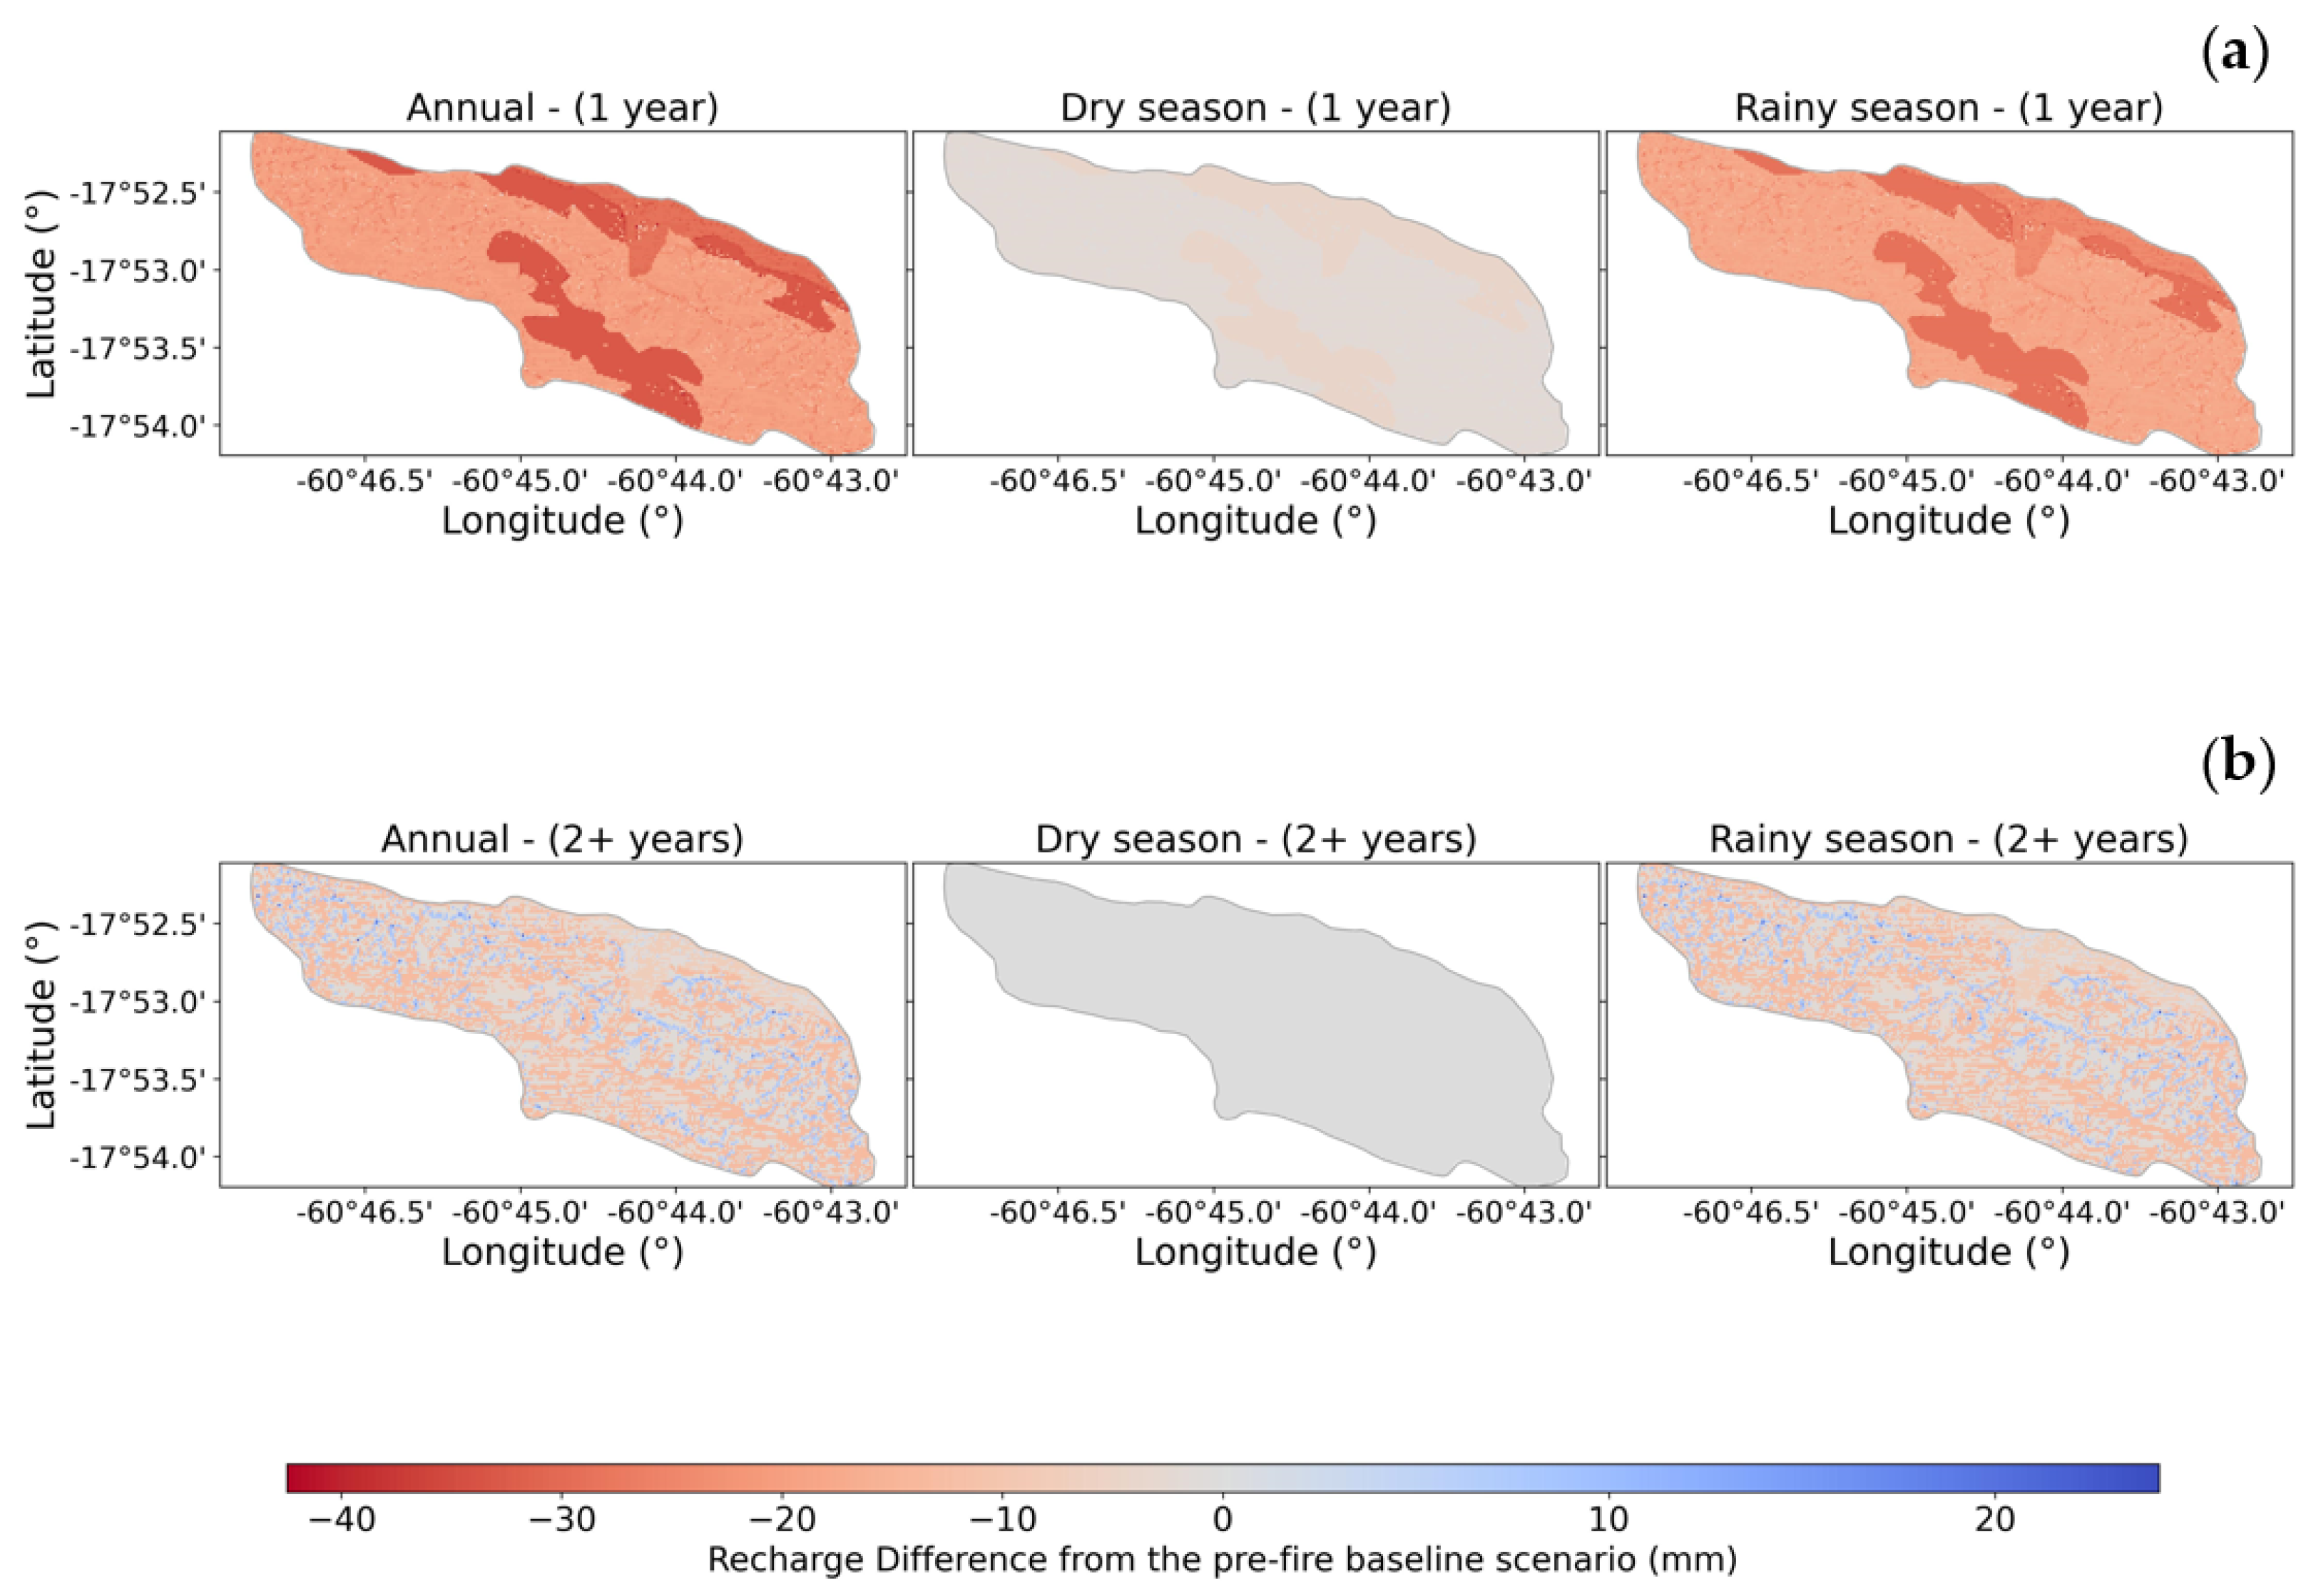
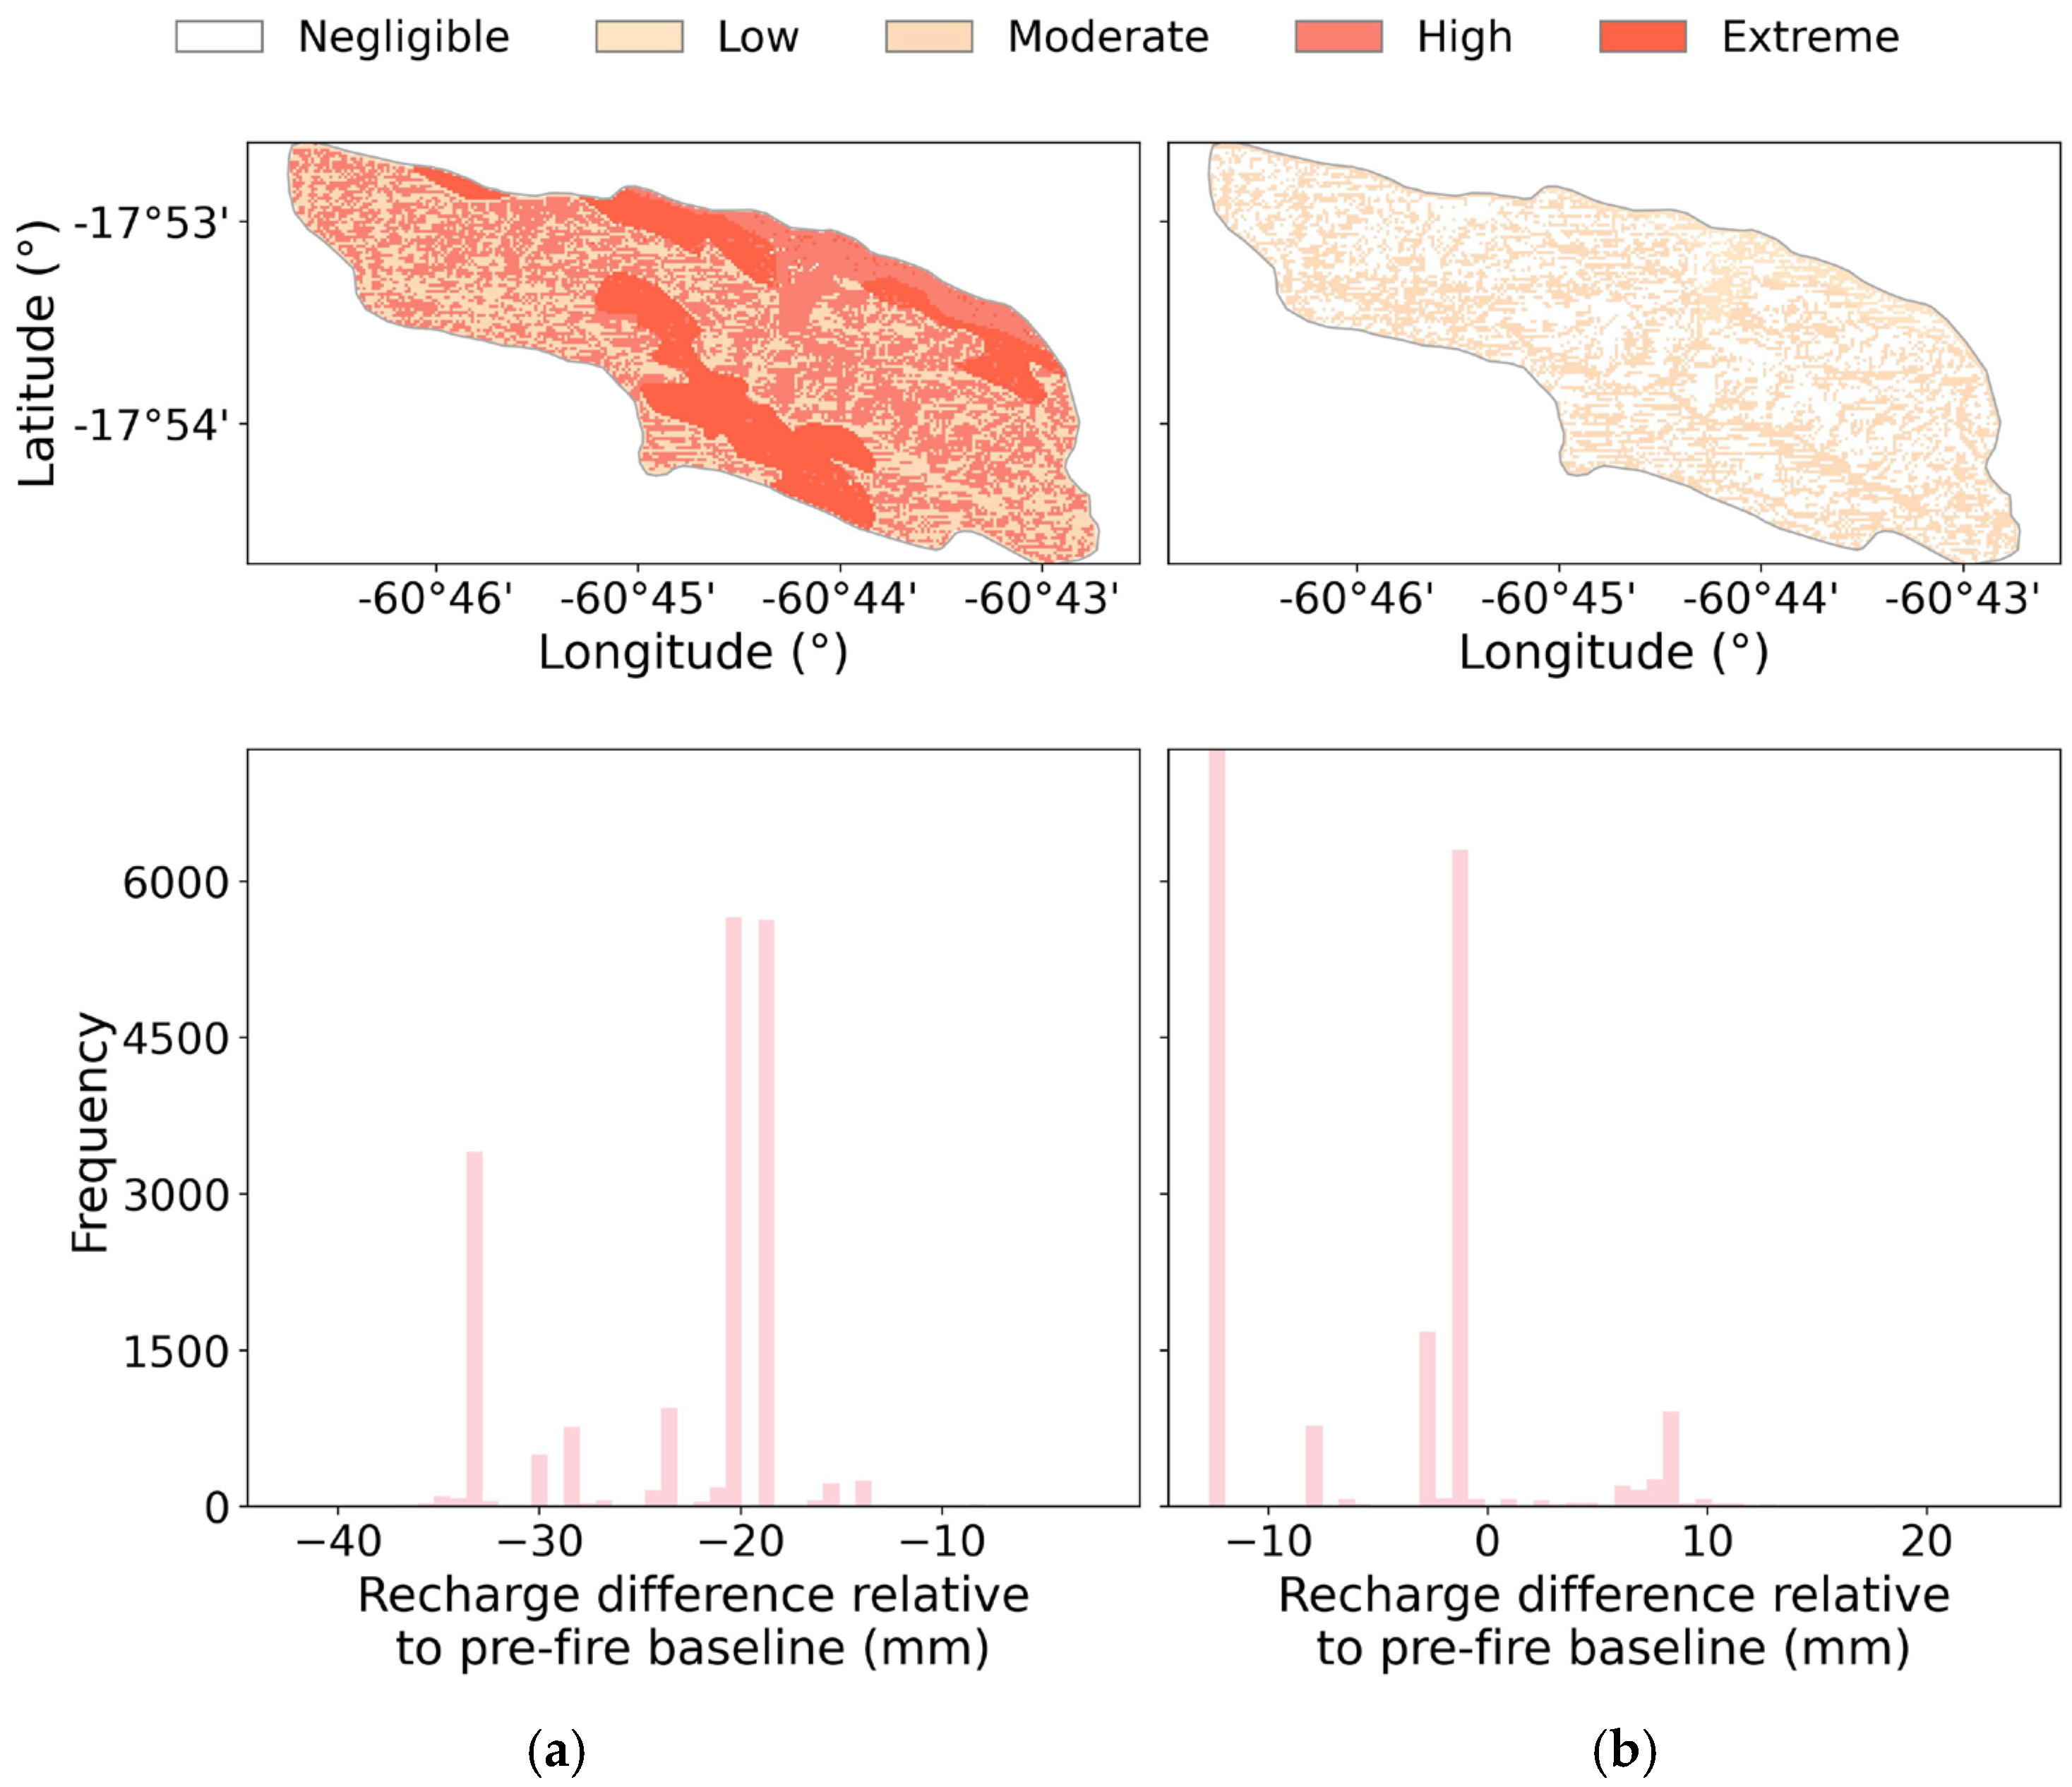
3.2. Post-Fire Scenario Simulations and Recharge Dynamics

A five-year dataset from September 2016 to August 2021 was examined to evaluate how wildfires influence groundwater recharge. The analysis used daily precipitation records and simulated recharge rates to explore post-fire soil disturbances’ immediate and longer-term effects. Two scenarios guided this assessment. The first scenario introduced a hypothetical fire at the beginning of each hydrological year. Soil parameters were then adjusted to represent conditions observed directly after burning, including reductions in hydraulic conductivity. This setup isolated the impact of annual fires on recharge during the same year. The second scenario considered a single fire event occurring just before September 2016. The Curve Number was allowed to recover, but hydraulic conductivity remained in a post-fire state to capture an incomplete return to baseline conditions. This arrangement highlighted residual impacts on infiltration that extended beyond two years after the initial disturbance.
As illustrated in Figure 8, under undisturbed conditions, groundwater recharge demonstrated a linear increase in response to precipitation levels ranging from 30 mm to 80 mm, stabilizing around 40 mm for higher rainfall amounts. In the immediate aftermath of a wildfire, groundwater recharge rates experienced a notable decline, with the maximum achievable recharge reduced to approximately 27 mm. The linear increase with rainfall persisted up to about 75 mm but at a reduced rate compared to normal conditions. Beyond two years post-fire, recharge patterns began to resemble pre-fire conditions up to the 30 mm rainfall threshold; however, the maximum recharge remained lower, indicating lasting changes in soil structure that affected recharge capacity.
Spatial analysis for the last hydrological year (Figure 9) provides a broader view of how different parameterization decisions influenced groundwater recharge. Under undisturbed conditions, annual recharge reached about 59 mm/year with low variability, indicated by a standard deviation of 4 mm. Adjusting parameters to represent short-term post-fire conditions reduced recharge to approximately 36 mm/year and more than doubled its variability. Revising the parameterization again to reflect conditions beyond two years increased recharge to about 54 mm/year, indicating partial recovery but no full return to normal. Although dry season recharge patterns resembled pre-fire conditions, more pronounced impacts emerged during the rainy season. A direct comparison with undisturbed simulations (Figure 10) shows that in the first year after the event, recharge decreased by about 39.5%, most noticeably in lower-elevation areas covered by dense, shrubby Cerrado vegetation. After two years, recharge levels remained about 10% lower than normal with a more uniform spatial distribution.
Two hypothetical scenarios were proposed based on the specialized literature to clarify how the disturbed (post-fire) condition and its temporal variations were represented. In the short-term scenario, infiltration decreases abruptly due to the immediate effects of ash deposition and the development of surface hydrophobicity following a fire. In the medium-term scenario, which considers conditions several months after the event, soils remain disturbed but hydrophobicity gradually diminishes, so the impact on infiltration, while still significant, is somewhat reduced. Due to the unpredictability of fires and the limited availability of in situ piezometric networks, this dual-scenario approach serves as a method for parametrizing recharge modeling. The magnitude of the estimated decline in recharge (approximately 40% in the first year) also makes sense in light of measurements from a recently burned site (Taperas) near the study area, where moderate-to-high fire severity led to a similar (~39%) reduction in infiltration [69].

3.3. Development and Guidelines for the Fire-Related Forest Recharge Impact Score (FRIS)

The simulated post-fire recharge reductions were a reference point for proposing a vulnerability categorization of groundwater recharge responses. As indicated in Table 4, this categorization defines thresholds from negligible to extreme vulnerability, where reductions exceeding 40% represent substantial hydrological disruptions. These thresholds were derived from the modeled outcomes at the El Sutó spring area, where the first year after the wildfire showed an approximate 39.5% drop in recharge and remained ~10% lower after two years. By grounding these categories in simulation results, the scheme reflects empirically modeled conditions rather than theoretical assumptions.
Applying the FRIS-based categorization to the baseline simulation year (Figure 11) confirmed previously observed patterns, with high-to-extreme vulnerability in the lower-elevation Cerrado areas and moderate vulnerability in the higher semi-deciduous forests. Because the thresholds were derived from these same results, the new map closely matched the original one. Next, the categorization was tested on the wettest of the five hydrological years. In the first year following the fire, most of the study area was classified in the highest vulnerability categories, suggesting that significant recharge deficits can occur even with abundant precipitation. Such deficits underscore the potential for elevated runoff and erosion risks in heavily burned landscapes.
To address data limitations and enhance applicability, a flow-based approach, inspired by the conceptual logic of the GOD methodology, was developed, focusing on three key soil parameters of texture, infiltration capacity, and root depth. Both the selection of these parameters and their respective ranges were informed by insights from post-fire modeling and a sensitivity analysis of the chosen soil variables. As shown in Figure 12, this setup categorizes areas into the defined vulnerability classes without extensive datasets. Incorporated into the Fire-Related Forest Recharge Impact Score (FRIS), this method serves as an initial framework rather than a definitive tool. Its adaptability permits further refinement and field-based validation, providing a more accurate context-specific guide for decision-makers working to mitigate long-term wildfire impacts on groundwater resources.
However, the unpredictable nature of fires and the scarcity of piezometric monitoring frequently impede direct measurements of pre- and post-fire recharge. An interim validation strategy has been used to compare FRIS-based vulnerability with observed infiltration changes in localized soils after a fire. For instance, in Taperas (located about 28 km from El Sutó within the same Chiquitano dry forest), recent field measurements indicated an infiltration capacity decline of around 35–40% following a moderate–high burn severity [69]. Given the sandy loam texture and shallow root zone (<30 cm) at that site, this reduction aligns with the FRIS’s “high vulnerability” category. Although such correlations do not replace direct recharge measurements, they reinforce the FRIS’s rationale for elevating risk scores in burned sites. In the future, piezometers or continuous monitoring networks would permit a more definitive corroboration of post-fire recharge trajectories, thereby refining the index and its underlying assumptions.

3.4. Large-Scale Validation Proxy of Recharge Variations

Validating recharge trends on a broader scale after wildfires poses considerable challenges. As a first approximation, this study examined additional sites across the Chiquitania region, encompassing San José de Chiquitos (Figure 13a), where the study area is located, and more peripheral locations such as Roboré, Alta Vista, Laguna Marfil, and Copaibo. Long-term (20-year) recharge trends (Figure 14) were derived from simplified water balance models informed by TerraClimate [72] and FLDAS [70]. Comparisons between satellite-derived precipitation estimates and SENAMHI ground observations showed moderate-to-strong correlations (R2 values ~0.52–0.74), although RMSE (36–63 mm) and MAE variations indicated data uncertainties.
At San José de Chiquitos, where a significant 2008 wildfire affected about 25% of the area (Figure 13b), trend analyses revealed consistent declines in recharge, as shown in Figure 14. Slopes of –2.65 (TerraClimate) and –2.23 (FLDAS) indicate notable reductions. Burned area data from MODIS MCD64A1 Version 6 [74] and land use changes derived from Landsat 5 and Sentinel-2 (Copernicus/ESA) imagery show that natural vegetation cover decreased from 88% to 61% over the last decade, suggesting repeated fire disturbances and land use shifts that likely contribute to the observed recharge declines. FLDAS results identified lower recharge zones extending eastward, whereas TerraClimate data showed slightly lower recharge toward the west. Moreover, annual analyses suggest that the TerraClimate-derived low-recharge zone persists across multiple years and overlaps with the 2008 burn scar, highlighting the long-lasting effects of significant fires on local water balances.
To find contrasts, we examined sites that had not experienced substantial fires before 2019, such as Alta Vista, Laguna Marfil, and Copaibo, which show similar data trends but to a lesser degree than San José. Meanwhile, a notable divergence at Roboré (–3.4 mm/year in TerraClimate vs. +0.8 mm/year in FLDAS) underscores the need for more data to reconcile uncertainties. Sentinel-2 imagery from 2015 to 2020 reveals moderate forest or savanna declines in Copaibo and Roboré (~5% total reduction), whereas Alta Vista lost roughly eight percentage points over the same interval. This steady decrease in vegetation cover, coupled with recurring smaller wildfires, may gradually reduce soils’ resilience to infiltration losses. Overall, the timing and severity of fire events appear to dictate the clarity of their impact on recharge patterns, with the earlier disturbances at San José de Chiquitos showing more pronounced changes than in areas with fewer or more recent fires.

4. Discussion

4.1. Post-Fire Hydrological Responses and Implications for Groundwater Recharge

Results of this study suggest that severe wildfires can significantly alter groundwater recharge processes in dry tropical forest landscapes. Rather than relying on direct post-fire measurements, we used a process-based modeling approach, incorporating the literature-derived changes in soil parameters for the El Sutó spring area. These simulations indicate that a high-severity wildfire could reduce annual recharge by about 39.5% in the first year, followed by only partial recovery, with a persistent 10% reduction over the long term. Although this approach does not measure soil and water parameters after an actual fire, it aligns with mechanisms reported in both experimental and field-based research, such as persistent soil hydrophobicity, reduced porosity, and altered soil structure [19,20,79]. Hence, the predicted changes in infiltration capacity align with observations in other fire-prone regions where water levels and runoff were recorded [16,80,81].
Simulations suggest that fire-induced soil alterations, such as crust formation and reduced hydraulic conductivity, can substantially diminish infiltration during the rainy season (a period normally vital for recharge in the Chiquitano forest) by shifting more water toward surface runoff. Similar patterns have been documented in other post-fire studies [68,81,82], underscoring the potential severity of hydrological disruptions. Although the results suggest partial convergence toward pre-fire conditions after two years, the daily maximum recharge remains below baseline. These findings highlight the importance of incorporating lingering changes to infiltration capacity into long-term groundwater modeling [6]. At the same time, relying on the literature-based parameters underscores the need for expanded ground monitoring networks and improved remote sensing products for large-scale assessments of post-fire recharge variability. For instance, as Fallon et al. [83] note, remote sensing proxies for vegetation burn severity may not accurately represent soil burn severity, potentially leading to misinterpretations of post-fire infiltration. Ground-based data or advanced remote sensing techniques that distinguish between overstory and soil conditions would help address this gap and improve hydrological models.
Immediately following a simulated high-severity fire, our model shows a more pronounced decline in recharge in lower-lying Cerrado than in semi-deciduous forests upslope, likely due to differences in canopy structure and water use. However, we did not incorporate the short-term loss of foliage, interception, or transpiration reductions that often follow wildfires, factors that might partially offset this decline. Some studies indicate that recharge can peak under moderate canopy densities [84,85], whereas others posit that denser vegetation significantly lowers groundwater recharge via high evapotranspiration and interception [86,87]. Such divergent findings highlight the importance of accurately representing post-fire vegetation dynamics in simulations, especially in the first year. Better accounting for regrowth, canopy changes, and shifting water demands would refine our portrayal of post-fire recharge. Additionally, a sensitivity analysis shows that deeper root zone depths tend to prolong the return to pre-fire conditions and that the denser Cerrado vegetation uses more water (≈20 mm less annual recharge) than higher-elevation forests. This finding further illustrates how canopy interception and evapotranspiration can strongly modulate infiltration.
Although our infiltration parameters were guided by published post-fire studies, future field validation would strengthen these assumptions. In particular, measuring post-fire infiltration rates or monitoring soil moisture in the San José de Chiquitos area could verify how quickly soils recover from hydrophobic conditions. Such ground-based data would not only refine the recovery timelines presented here but also help reconcile any discrepancies between modeled recharge declines and actual field observations. In doing so, we would ensure that the model’s parameters reflect on-the-ground realities, enhancing the reliability of post-fire hydrological forecasts.

4.2. Fire-Related Forest Recharge Impact Score (FRIS) and Management Implications

Building on these findings, the development of the Fire-Related Forest Recharge Impact Score (FRIS) provides a preliminary framework to classify and map post-fire groundwater recharge vulnerability. By focusing on soil texture, infiltration capacity, and root depth, the FRIS can help water managers and policymakers prioritize areas for post-fire interventions. Local maps (soils, vegetation, and burn scars) can be layered with FRIS-derived values, allowing municipal authorities and conservation units to pinpoint especially vulnerable zones. Moreover, such overlays guide practical measures, like carefully selected reforestation or soil stabilization, ensuring that interventions meaningfully enhance infiltration and reduce post-fire erosion risks. The index follows the logic of existing groundwater vulnerability approaches [26,27] yet tailors its criteria to the specific disturbances caused by wildfires. Although additional field-based validation and refinement are needed, this concept offers a practical starting point for integrating fire risk considerations into groundwater management plans.
From a policy perspective, these findings and the FRIS tool underscore the importance of incorporating wildfire dynamics into groundwater protection strategies. As changing climate and land use patterns contribute to more frequent and intense wildfires [9,10], proactive measures, such as soil stabilization treatments, managed reforestation, and the strategic placement of firebreaks, can help mitigate long-term impacts on groundwater resources. Aligning fire management with groundwater protection could enhance resilience against prolonged water scarcity, particularly in regions like Chiquitania, where groundwater serves as a critical water supply.
In this study, the FRIS is proposed for sandy loam soils under a dry tropical climate, reflecting the moderate-to-high infiltration rates and distinctive vegetation assemblages of the Chiquitania region. Because our weighting factors and thresholds stem from these site-specific conditions, we recommend that users intending to apply the FRIS elsewhere first adjust the index to account for different soil textures (e.g., clayey soils with lower infiltration), climatic regimes (e.g., temperate or monsoonal), and dominant plant communities (e.g., coniferous vs. broadleaf forests). Where local conditions diverge substantially from the Chiquitano forest, such as in cooler climates with less intense dry seasons, parameter tuning or additional variables may be necessary. By clarifying these prerequisites, we underscore both the flexibility of this GOD-based approach and the need to customize it for varying ecological and climatic contexts.
In addition, integrating a better understanding of vegetation dynamics and post-fire regeneration processes would likely improve model predictions, as changes in interception, root depth, and evapotranspiration post-disturbance are known to influence hydrological flows [88,89,90]. Repeated fire events, varying intensities, and different forest management regimes also merit examination to understand their cumulative effects on groundwater recharge. Such expansions of the current modeling framework, coupled with long-term, high-quality datasets, will refine predictions and improve the utility of vulnerability indices like the FRIS.

5. Conclusions

Applying infiltration parameters derived from published fire impact studies suggests that annual groundwater recharge may experience a substantial decline of around 40% in the year immediately following a high-severity wildfire. In lower-lying areas dominated by Cerrado vegetation, simulations indicate a steeper decline in recharge than in higher-elevation Chiquitano semi-deciduous forests, with recovery remaining incomplete even after two years (~10% deficit from baseline). The findings show that wildfire-induced soil changes, as described in other studies, can reduce infiltration capacity and cause long-lasting changes in local water balances. The prolonged nature of these effects highlights the risk of cumulative impacts, particularly in fire-prone environments with limited water resources. This underscores the importance of incorporating post-fire soil dynamics in regional water management plans.
The Fire-Related Forest Recharge Impact Score (FRIS) is a preliminary process-based index that integrates soil texture, infiltration capacity, and root depth. Building on established frameworks like the GOD methodology, the FRIS classifies wildfire-related groundwater vulnerability in data-scarce regions. Its design allows for adaptation across other parts of the Amazon, serving as an early tool for identifying areas at high risk of post-fire recharge losses. This focus on process-driven parameters makes it especially valuable in settings that lack direct post-fire field data, since it offers a structured way to estimate aquifer impacts where on-site measurements are not yet available.
Refinements to the existing modeling framework would benefit from localized input parameters and lengthier simulations that capture soil infiltration changes over multiple post-fire seasons. Such enhancements would illuminate how hydrophobic layers evolve, how vegetation regrowth influences recharge, and how well FRIS predictions align with measured infiltration rates and soil moisture data. Remote sensing approaches, including burn severity mapping and vegetation assessments, would bolster the accuracy of both the modeling and the index, delivering timely updates on fire-impacted landscapes. These advances would help decision-makers better prioritize strategies to safeguard groundwater resources, which is in line with the Departmental Policy for Integrated Fire Management, which emphasizes ecological and hydrological integration in fire management.

Author Contributions

M.G.-R. led the conceptualization and methodology of this research, designing the SWB-based modeling approach and defining post-fire infiltration adjustments for Chiquitania. L.S.d.F. performed remote sensing analyses (Sentinel-2, Landsat 5) for the El Sutó spring area (San José de Chiquitos), integrating meteorological station data to validate recharge estimates. E.C.T. conducted comparable satellite-based assessments for additional sites in the region, ensuring consistent data curation and inter-site comparisons of FLDAS/TerraClimate outputs. M.H. supervised the overall project, provided critical revisions that bridged hydrological modeling with fire management strategies, and acquired the necessary funding. All authors have read and agreed to the published version of the manuscript.

Funding

This research has been funded by VLIR-UOS: Vlaamse Interuniversitaire Raad-Universitaire Ontwikkelingssamenwerking (grant number BO2017IUC034A105) and by the DGD: Directorate General for Development Cooperation and Humanitarian Aid.

Institutional Review Board Statement

Not applicable.

Data Availability Statement

The data presented in this study are available upon request from the corresponding author due to the data being part of an ongoing project. The data will be publicly released upon the completion of additional papers.

Acknowledgments

We are grateful to the editorial team and the three anonymous reviewers at Fire (MDPI) for their detailed constructive feedback, which substantially improved this manuscript. We also extend our sincere thanks to Marsha Regina López, whose design expertise greatly enhanced the resolution and esthetic quality of the conceptual flowchart (FRIS). In addition, we thank José Carlos Quinteros for providing thoughtful feedback on the geology map, thereby contributing to a clearer representation of the study area’s geological features.

Conflicts of Interest

The authors declare no conflicts of interest.

References

  1. Smith, H.G.; Sheridan, G.J.; Lane, P.N.J.; Nyman, P.; Haydon, S. Wildfire Effects on Water Quality in Forest Catchments: A Review with Implications for Water Supply. J. Hydrol. 2011, 396, 170–192. [Google Scholar] [CrossRef]
  2. Hallema, D.W.; Robinne, F.-N.; Bladon, K.D. Reframing the Challenge of Global Wildfire Threats to Water Supplies. Earth’s Future 2018, 6, 772–776. [Google Scholar] [CrossRef]
  3. Robinne, F.-N.; Bladon, K.D.; Miller, C.; Parisien, M.-A.; Mathieu, J.; Flannigan, M.D. A Spatial Evaluation of Global Wildfire-Water Risks to Human and Natural Systems. Sci. Total Environ. 2018, 610–611, 1193–1206. [Google Scholar] [CrossRef]
  4. Rodrigues, E.L.; Jacobi, C.M.; Figueira, J.E.C. Wildfires and Their Impact on the Water Supply of a Large Neotropical Metropolis: A Simulation Approach. Sci. Total Environ. 2019, 651, 1261–1271. [Google Scholar] [CrossRef]
  5. Duarte, E.; Rubilar, R.; Matus, F.; Garrido-Ruiz, C.; Merino, C.; Smith-Ramirez, C.; Aburto, F.; Rojas, C.; Stehr, A.; Dörner, J.; et al. Drought and Wildfire Trends in Native Forests of South-Central Chile in the 21st Century. Fire 2024, 7, 230. [Google Scholar] [CrossRef]
  6. Guzmán-Rojo, M.; Fernandez, J.; d’Abzac, P.; Huysmans, M. Impacts of Wildfires on Groundwater Recharge: A Comprehensive Analysis of Processes, Methodological Challenges, and Research Opportunities. Water 2024, 16, 2562. [Google Scholar] [CrossRef]
  7. Dudley, N.; Stolton, S. Running Pure The Importance of Forest Protected Areas to Drinking Water; World Bank/WWF Alliance for Forest Conservation and Sustainable Use: Washington, DC, USA, 2013; ISBN 978-2-88085-262-7. [Google Scholar]
  8. Fienen, M.N.; Arshad, M. The International Scale of the Groundwater Issue. In Integrated Groundwater Management: Concepts, Approaches and Challenges; Jakeman, A.J., Barreteau, O., Hunt, R.J., Rinaudo, J.-D., Ross, A., Eds.; Springer International Publishing: Cham, Switzerland, 2016; pp. 21–48. ISBN 978-3-319-23576-9. [Google Scholar]
  9. Kinoshita, A.M.; Chin, A.; Simon, G.L.; Briles, C.; Hogue, T.S.; O’Dowd, A.P.; Gerlak, A.K.; Albornoz, A.U. Wildfire, Water, and Society: Toward Integrative Research in the “Anthropocene”. Anthropocene 2016, 16, 16–27. [Google Scholar] [CrossRef]
  10. Abatzoglou, J.T.; Williams, A.P. Impact of Anthropogenic Climate Change on Wildfire across Western US Forests. Proc. Natl. Acad. Sci. USA 2016, 113, 11770–11775. [Google Scholar] [CrossRef]
  11. Lohse, K.A.; Billings, S.A.; DiBiase, R.A.; Kumar, P.; Berhe, A.A.; Kaye, J. Soil Signals Tell of Landscape Disturbances. Eos 2020, 101. [Google Scholar] [CrossRef]
  12. Tyukavina, A.; Potapov, P.; Hansen, M.C.; Pickens, A.H.; Stehman, S.V.; Turubanova, S.; Parker, D.; Zalles, V.; Lima, A.; Kommareddy, I.; et al. Global Trends of Forest Loss Due to Fire from 2001 to 2019. Front. Remote Sens. 2022, 3, 825190. [Google Scholar] [CrossRef]
  13. Cui, L.; Zhu, C.; Zou, Z.; Yao, C.; Zhang, C.; Li, Y. The Spatiotemporal Characteristics of Wildfires across Australia and Their Connections to Extreme Climate Based on a Combined Hydrological Drought Index. Fire 2023, 6, 42. [Google Scholar] [CrossRef]
  14. Toledo, N.; Moulatlet, G.; Gaona, G.; Valencia, B.; Hirata, R.; Conicelli, B. Dynamics of Meteorological and Hydrological Drought: The Impact of Groundwater and El Niño Events on Forest Fires in the Amazon. Sci. Total Environ. 2024, 954, 176612. [Google Scholar] [CrossRef] [PubMed]
  15. Ortega-Becerril, J.A.; Suarez, C.; Vázquez-Tarrío, D.; Garrote, J.; Gomez-Heras, M. Sediment Response after Wildfires in Mountain Streams and Their Effects on Cultural Heritage: The Case of the 2021 Navalacruz Wildfire (Avila, Spain). Fire 2024, 7, 52. [Google Scholar] [CrossRef]
  16. Pham, H.V.; Le, P.; Berli, M. A Data-Driven Approach to Quantifying the Correlation between Groundwater and Wildfire in the United States. AGU Fall Meeting Abstracts. 2020, p. H087-0025. Available online: https://ui.adsabs.harvard.edu/abs/2020AGUFMH087.0025P/abstract (accessed on 17 February 2025).
  17. Orlova, J.; Olefeldt, D.; Yasinski, J.H.; Anderson, A.E. Effects of Prescribed Burn on Nutrient and Dissolved Organic Matter Characteristics in Peatland Shallow Groundwater. Fire 2020, 3, 53. [Google Scholar] [CrossRef]
  18. Rhoades, C.C.; Nunes, J.P.; Silins, U.; Doerr, S.H. The Influence of Wildfire on Water Quality and Watershed Processes: New Insights and Remaining Challenges. Int. J. Wildland Fire 2019, 28, 721–725. [Google Scholar] [CrossRef]
  19. Robichaud, P.R. Fire Effects on Infiltration Rates after Prescribed Fire in Northern Rocky Mountain Forests, USA. J. Hydrol. 2000, 231–232, 220–229. [Google Scholar] [CrossRef]
  20. DeBano, L.F. The Role of Fire and Soil Heating on Water Repellency in Wildland Environments: A Review. J. Hydrol. 2000, 231–232, 195–206. [Google Scholar] [CrossRef]
  21. Farid, A.; Alam, M.K.; Goli, V.S.N.S.; Akin, I.D.; Akinleye, T.; Chen, X.; Cheng, Q.; Cleall, P.; Cuomo, S.; Foresta, V.; et al. A Review of the Occurrence and Causes for Wildfires and Their Impacts on the Geoenvironment. Fire 2024, 7, 295. [Google Scholar] [CrossRef]
  22. da Silva Junior, J.A.; Pacheco, A.d.P.; Ruiz-Armenteros, A.M.; Henriques, R.F.F. Comparative Analysis between Remote Sensing Burned Area Products in Brazil: A Case Study in an Environmentally Unstable Watershed. Fire 2024, 7, 238. [Google Scholar] [CrossRef]
  23. Ebel, B.A.; Moody, J.A. Rethinking Infiltration in Wildfire-Affected Soils. Hydrol. Process. 2013, 27, 1510–1514. [Google Scholar] [CrossRef]
  24. Moody, J.A.; Ebel, B.A.; Nyman, P.; Martin, D.A.; Stoof, C.; McKinley, R.; Moody, J.A.; Ebel, B.A.; Nyman, P.; Martin, D.A.; et al. Relations between Soil Hydraulic Properties and Burn Severity. Int. J. Wildland Fire 2015, 25, 279–293. [Google Scholar] [CrossRef]
  25. Stathatou, P.-Μ.; Kampragou, E.; Grigoropoulou, H.; Assimacopoulos, D.; Karavitis, C.; Porto, M.F.A.; Gironás, J.; Vanegas, M.; Reyna, S. Vulnerability of Water Systems: A Comprehensive Framework for Its Assessment and Identification of Adaptation Strategies. Desalination Water Treat. 2016, 57, 2243–2255. [Google Scholar] [CrossRef]
  26. Fannakh, A.; Farsang, A. DRASTIC, GOD, and SI Approaches for Assessing Groundwater Vulnerability to Pollution: A Review. Environ. Sci. Eur. 2022, 34, 77. [Google Scholar] [CrossRef]
  27. Foster, S. Fundamental concepts in aquifer vulnerability, pollution risk and protection strategy. In Proceedings of the Vulnerability of Soil and Groundwater to Polluants International Conference, Noordwijk aan Zee, The Netherlands, 30 March–3 April 1987; pp. 69–86. [Google Scholar]
  28. Bai, L.; Wang, Y.; Meng, F. Application of DRASTIC and Extension Theory in the Groundwater Vulnerability Evaluation. Water Environ. J. 2012, 26, 381–391. [Google Scholar] [CrossRef]
  29. Frans, L.M.; Rupert, M.G.; Hunt, C.D., Jr.; Skinner, K.D. Groundwater Quality in the Columbia Plateau, Snake River Plain, and Oahu Basaltic-Rock and Basin-Fill Aquifers in the Northwestern United States and Hawaii, 1992–2010; U.S. Geological Survey: Reston, VA, USA, 2012. [Google Scholar]
  30. Mair, A.; El-Kadi, A.I. Logistic Regression Modeling to Assess Groundwater Vulnerability to Contamination in Hawaii, USA. J. Contam. Hydrol. 2013, 153, 1–23. [Google Scholar] [CrossRef]
  31. Ravbar, N.; Goldscheider, N. Comparative Application of Four Methods of Groundwater Vulnerability Mapping in a Slovene Karst Catchment. Hydrogeol. J. 2009, 17, 725–733. [Google Scholar] [CrossRef]
  32. Jiang, G.; Guo, F.; Polk, J.S.; Kang, Z.; Wu, J. Delineating Vulnerability of Karst Aquifers Using Hydrochemical Tracers in Southwestern China. Environ. Earth Sci. 2015, 74, 1015–1027. [Google Scholar] [CrossRef]
  33. Morales García, R.; Ruiz Hernández, J.M.; Orden Gómez, J.A.d.l.; Gómez Gómez, J.d.D.; Moreno Merino, L.; Domínguez Sánchez, J.A.; García Bravo, N.; Durán Valsero, J.J. Incendios Forestales y Aguas Subterráneas: Un Análisis de los Efectos Ambientales y Económicos Sobre los Acuíferos; CSIC—Instituto Geológico y Minero de España (IGME): Madrid, Spain, 2020. [Google Scholar]
  34. Maillard, O.; Herzog, S.K.; Soria-Auza, R.W.; Vides-Almonacid, R. Impact of Fires on Key Biodiversity Areas (KBAs) and Priority Bird Species for Conservation in Bolivia. Fire 2022, 5, 4. [Google Scholar] [CrossRef]
  35. Instituto Cruceño de Estadística. Informe Estadístico de Incendios Forestales en Santa Cruz 2024: Incendios Forestales en Santa Cruz Gestión 2023; Gobierno Autónomo Departamental de Santa Cruz: Santa Cruz, Bolivia, 2024; 36p. Available online: https://ice.santacruz.gob.bo/ (accessed on 22 August 2024).
  36. Carmenta, R.; Parry, L.; Blackburn, A.; Vermeylen, S.; Barlow, J. Understanding Human-Fire Interactions in Tropical Forest Regions: A Case for Interdisciplinary Research across the Natural and Social Sciences. Ecol. Soc. 2011, 16, 53. [Google Scholar] [CrossRef]
  37. Devisscher, T.; Malhi, Y.; Boyd, E. Deliberation for Wildfire Risk Management: Addressing Conflicting Views in the Chiquitania, Bolivia. Geogr. J. 2019, 185, 38–54. [Google Scholar] [CrossRef]
  38. Bustillo Sánchez, M.; Tonini, M.; Mapelli, A.; Fiorucci, P. Spatial Assessment of Wildfires Susceptibility in Santa Cruz (Bolivia) Using Random Forest. Geosciences 2021, 11, 224. [Google Scholar] [CrossRef]
  39. Devisscher, T.; Boyd, E.; Malhi, Y. Anticipating Future Risk in Social-Ecological Systems Using Fuzzy Cognitive Mapping: The Case of Wildfire in the Chiquitania, Bolivia. Ecol. Soc. 2016, 21, 4. [Google Scholar] [CrossRef]
  40. Gobierno Autónomo Departamental de Santa Cruz. Política Departamental de Manejo Integral de Fuego a 25 Años; Gaceta Oficial del Departamento de Santa Cruz: Santa Cruz, Bolivia, 2024. [Google Scholar]
  41. Meng, Y.; Deng, Y.; Shi, P. Mapping Forest Wildfire Risk of the World. In World Atlas of Natural Disaster Risk; Shi, P., Kasperson, R., Eds.; Springer: Berlin, Heidelberg, 2015; pp. 261–275. ISBN 978-3-662-45430-5. [Google Scholar]
  42. Crespo, M. Bolivia’s Chiquitanía Running Out of Water. 10 October 2022. Available online: https://greenmarked.it/bolivias-chiquitania-running-out-of-water/ (accessed on 9 February 2024).
  43. Fernandez, J.; Maillard, O.; Uyuni, G.; Guzmán-Rojo, M.; Escobar, M. Multi-Criteria Prioritization of Watersheds for Post-Fire Restoration Using GIS Tools and Google Earth Engine: A Case Study from the Department of Santa Cruz, Bolivia. Water 2023, 15, 3545. [Google Scholar] [CrossRef]
  44. Killeen, T.J.; Jardim, A.; Mamani, F.; Rojas, N. Diversity, Composition and Structure of a Tropical Semideciduous Forest in the Chiquitanía Region of Santa Cruz, Bolivia. J. Trop. Ecol. 1998, 14, 803–827. [Google Scholar] [CrossRef]
  45. Instituto Nacional de Estadística. Available online: https://www.ine.gob.bo/ (accessed on 27 August 2023).
  46. Curro Vela, G. Reseña Histórica de La Investigación Geológica y Del Desarrollo Minero En El Precámbrico Boliviano. In Proceedings of the Memoria II Simposio Internacional Geologia y Metalogenia Del Precámbrico Boliviano, San Ramón, Bolivia, 3–4 September 2014; pp. 40–44. [Google Scholar]
  47. Appleton, J.D.; Llanos, A. Prospección Geoquímica por Metales Base en la Ínsula de San José de Chiquitos (Technical Report No. 16, Ae-PRE-0016e); Ministerio de Minería y Metalurgia, República de Bolivia; Overseas Development Administration (ODA), Foreign and Commonwealth Office, United Kingdom of Great Britain and Northern Ireland: Santa Cruz de la Sierra, Bolivia, 1982. [Google Scholar]
  48. Servicio Nacional de Geología y Minería; Yacimientos Petrolíferos Fiscales Bolivianos (Eds.) Mapa Geológico de Bolivia, Escala 1:1.000.000; SERGEOMIN|YPFB: La Paz, Bolivia, 2001. [Google Scholar]
  49. Drew Roca, N.A. Hidrogeoquímica Del Acuífero Del Centro Urbano de San José de Chiquitos, Santa Cruz (Bolivia). Bachelor’s Thesis, Universidad Católica Boliviana San Pablo, Cochabamba, Bolivia, 2021. [Google Scholar]
  50. Gobierno Autónomo Departamental de Santa Cruz. Plan de Manejo Del Area Protegida Santa Cruz La Vieja; Gobierno Autónomo Departamental de Santa Cruz: Santa Cruz, Bolivia, 2011. [Google Scholar]
  51. Gobierno Autónomo Departamental de Santa Cruz. Plan de Desarrollo Territorial Para El Buen Vivir de San José de Chiquitos; Gobierno Autónomo Departamental de Santa Cruz: Santa Cruz, Bolivia, 2016. [Google Scholar]
  52. Soil Maps and Databases|FAO SOILS PORTAL|Food and Agriculture Organization of the United Nations. Available online: https://www.fao.org/soils-portal/data-hub/soil-maps-and-databases/en/ (accessed on 19 June 2024).
  53. Navarro, G.; Ferreira, W. Mapa de Vegetación de Bolivia a Escala 1: 250,000; Edición CD-ROM; RUMBOL SRL: Santa Cruz de la Sierra, Bolivia, 2007. [Google Scholar]
  54. Quisnancela Cabay, E.L. Assessing Evapotranspiration with Remote Sensing Data of the Natural Vegetated Area around “El Suto” Water Spring—Bolivia. Master’s Thesis, Vrije Universiteit Brussel; Katholieke Universiteit Leuven, Brussels, Belgium, 2021. [Google Scholar]
  55. Servicio Nacional de Meteorología e Hidrología (SENAMHI) Official Website. Available online: https://senamhi.gob.bo/index.php/inicio (accessed on 27 August 2023).
  56. Guzmán-Rojo, M. Fire and Water: Assessing Vulnerability and Hydrological Alterations in Groundwater Recharge Post-Wildfire in the Chiquitano Dry Forest, Bolivia. Ph.D. Thesis, Vrije Universiteit Brussel, Brussels, Belgium, 2024. [Google Scholar]
  57. Batelis, S.-C.; Nalbantis, I. Potential Effects of Forest Fires on Streamflow in the Enipeas River Basin, Thessaly, Greece. Environ. Process. 2014, 1, 73–85. [Google Scholar] [CrossRef]
  58. Soulis, K.X. Estimation of SCS Curve Number Variation Following Forest Fires. Hydrol. Sci. J. 2018, 63, 1332–1346. [Google Scholar] [CrossRef]
  59. Atchley, A.L.; Kinoshita, A.M.; Lopez, S.R.; Trader, L.; Middleton, R. Simulating Surface and Subsurface Water Balance Changes Due to Burn Severity. Vadose Zone J. 2018, 17, 180099. [Google Scholar] [CrossRef]
  60. Westenbroek, S.M.; Engott, J.A.; Kelson, V.A.; Hunt, R.J. SWB Version 2.0—A Soil-Water-Balance Code for Estimating Net Infiltration and Other Water-Budget Components; Techniques and Methods; U.S. Geological Survey: Reston, VA, USA, 2018; Volume 6-A59. [Google Scholar]
  61. Thornthwaite, C.W.; Mather, J.R. The Water Balance. Publ. Climatol. 1955, 8, 185–311. [Google Scholar]
  62. Thornthwaite, C.W.; Mather, J.R. Instructions and Tables for Computing Potential Evapotranspiration and the Water Balance. Publ. Climatol. 1957, 10, 1–104. [Google Scholar]
  63. Dripps, W.R.; Bradbury, K.R. A Simple Daily Soil–Water Balance Model for Estimating the Spatial and Temporal Distribution of Groundwater Recharge in Temperate Humid Areas. Hydrogeol. J. 2007, 15, 433–444. [Google Scholar] [CrossRef]
  64. Gash, J.H.C. An Analytical Model of Rainfall Interception by Forests. Q. J. R. Meteorol. Soc. 1979, 105, 43–55. [Google Scholar] [CrossRef]
  65. Cronshey, R. Urban Hydrology for Small Watersheds, 2nd ed.; U.S. Department of Agriculture, Soil Conservation Service, Engineering Division: Washington, DC, USA, 1986. [Google Scholar]
  66. Hargreaves, S. Reference Crop Evapotranspiration from Temperature. Appl. Eng. Agric. 1985, 1, 96–99. [Google Scholar] [CrossRef]
  67. Allen, R.G.; Pereira, L.S.; Raes, D.; Smith, M. Crop Evapotranspiration-Guideline for Computing Crop Water Requirements; FAO Irrigation and Drainage Paper 56; Food and Agriculture Organization of the United Nations (FAO): Rome, Italy, 1998; p. 300. [Google Scholar]
  68. Moody, J.A.; Shakesby, R.A.; Robichaud, P.R.; Cannon, S.H.; Martin, D.A. Current Research Issues Related to Post-Wildfire Runoff and Erosion Processes. Earth-Sci. Rev. 2013, 122, 10–37. [Google Scholar] [CrossRef]
  69. Loza Cruz, J.J. El Efecto de Los Incendios Forestales En Los Parámetros Hidráulicos Del Suelo Que Influyen La Recarga de Acuíferos En San José de Chiquitos. Bachelor’s Thesis, Universidad Católica Boliviana San Pablo, La Paz, Bolivia, 2024. [Google Scholar]
  70. McNally, A.; Arsenault, K.; Kumar, S.; Shukla, S.; Peterson, P.; Wang, S.; Funk, C.; Peters-Lidard, C.D.; Verdin, J.P. A Land Data Assimilation System for Sub-Saharan Africa Food and Water Security Applications. Sci. Data 2017, 4, 170012. [Google Scholar] [CrossRef] [PubMed]
  71. GES DISC. Dataset: FLDAS Noah Land Surface Model L4 Global Monthly 0.1 × 0.1 Degree (MERRA-2 and CHIRPS) (FLDAS_NOAH01_C_GL_M 001). Available online: https://disc.gsfc.nasa.gov/datasets/FLDAS_NOAH01_C_GL_M_001/summary (accessed on 16 February 2025).
  72. Abatzoglou, J.T.; Dobrowski, S.Z.; Parks, S.A.; Hegewisch, K.C. TerraClimate, a High-Resolution Global Dataset of Monthly Climate and Climatic Water Balance from 1958–2015. Sci. Data 2018, 5, 170191. [Google Scholar] [CrossRef]
  73. Magnoni, P.H.J.; Silva, C.d.O.F.; Manzione, R.L. Groundwater Recharge and Water Table Levels Modelling Using Remotely Sensed Data and Cloud-Computing. Sustain. Water Resour. Manag. 2020, 6, 113. [Google Scholar] [CrossRef]
  74. Giglio, L.; Boschetti, L.; Roy, D.P.; Humber, M.L.; Justice, C.O. The Collection 6 MODIS Burned Area Mapping Algorithm and Product. Remote Sens. Environ. 2018, 217, 72–85. [Google Scholar] [CrossRef]
  75. Chander, G.; Markham, B.L.; Helder, D.L. Summary of Current Radiometric Calibration Coefficients for Landsat MSS, TM, ETM+, and EO-1 ALI Sensors. Remote Sens. Environ. 2009, 113, 893–903. [Google Scholar] [CrossRef]
  76. Silva de Freitas, L. Remotely-Sensed Estimate of Groundwater Recharge and Its Correlation with Deforestation and Fire in Eastern Bolivia. Master’s Thesis, Katholieke Universiteit Leuven, Ghent University, Brussels, Belgium, 2021. [Google Scholar]
  77. Coritza Taquichiri, E.F. Groundwater Recharge Estimation in Eastern Bolivia Using Remotely-Sensed Hydrometeorological Variables. Master’s Thesis, Vrije Universiteit Brussel; Katholieke Universiteit Leuven, Brussels, Brussels, 2023. [Google Scholar]
  78. Lazar, J.; Feng, J.H.; Hochheiser, H. (Eds.) Chapter 4—Statistical Analysis. In Research Methods in Human Computer Interaction, 2nd ed.; Morgan Kaufmann: Boston, MA, USA, 2017; pp. 71–104. ISBN 978-0-12-805390-4. [Google Scholar]
  79. Mills, A.J.; Fey, M.V. Frequent Fires Intensify Soil Crusting: Physicochemical Feedback in the Pedoderm of Long-Term Burn Experiments in South Africa. Geoderma 2004, 121, 45–64. [Google Scholar] [CrossRef]
  80. Keesstra, S.D.; Maroulis, J.; Argaman, E.; Voogt, A.; Wittenberg, L. Effects of Controlled Fire on Hydrology and Erosion under Simulated Rainfall. Cuad. De Investig. Geográfica 2014, 40, 269–294. [Google Scholar] [CrossRef]
  81. Stoof, C.R.; Ferreira, A.J.D.; Mol, W.; Van den Berg, J.; De Kort, A.; Drooger, S.; Slingerland, E.C.; Mansholt, A.U.; Ferreira, C.S.S.; Ritsema, C.J. Soil Surface Changes Increase Runoff and Erosion Risk after a Low–Moderate Severity Fire. Geoderma 2015, 239–240, 58–67. [Google Scholar] [CrossRef]
  82. Benavides-Solorio, J.; MacDonald, L.H. Post-Fire Runoff and Erosion from Simulated Rainfall on Small Plots, Colorado Front Range. Hydrol. Process. 2001, 15, 2931–2952. [Google Scholar] [CrossRef]
  83. Fallon, K.; Wheelock, S.J.; Sadegh, M.; Pierce, J.L.; McNamara, J.P.; Cattau, M.; Baker, V.R. Post-Fire Hydrologic Analysis: A Tale of Two Severities. Hydrol. Sci. J. 2024, 69, 139–148. [Google Scholar] [CrossRef]
  84. Ilstedt, U.; Bargués Tobella, A.; Bazié, H.R.; Bayala, J.; Verbeeten, E.; Nyberg, G.; Sanou, J.; Benegas, L.; Murdiyarso, D.; Laudon, H.; et al. Intermediate Tree Cover Can Maximize Groundwater Recharge in the Seasonally Dry Tropics. Sci. Rep. 2016, 6, 21930. [Google Scholar] [CrossRef]
  85. Ellison, D.; Morris, C.E.; Locatelli, B.; Sheil, D.; Cohen, J.; Murdiyarso, D.; Gutierrez, V.; van Noordwijk, M.; Creed, I.F.; Pokorny, J.; et al. Trees, Forests and Water: Cool Insights for a Hot World. Glob. Environ. Change 2017, 43, 51–61. [Google Scholar] [CrossRef]
  86. Oliveira, P.T.S.; Leite, M.B.; Mattos, T.; Nearing, M.A.; Scott, R.L.; de Oliveira Xavier, R.; da Silva Matos, D.M.; Wendland, E. Groundwater Recharge Decrease with Increased Vegetation Density in the Brazilian Cerrado. Ecohydrology 2017, 10, e1759. [Google Scholar] [CrossRef]
  87. Mohan, C.; Western, A.W.; Wei, Y.; Saft, M. Predicting Groundwater Recharge for Varying Land Cover and Climate Conditions—A Global Meta-Study. Hydrol. Earth Syst. Sci. 2018, 22, 2689–2703. [Google Scholar] [CrossRef]
  88. Zhang, X.; Lindström, G. Development of an Automatic Calibration Scheme for the HBV Hydrological Model. Hydrol. Process. 1997, 11, 1671–1682. [Google Scholar]
  89. Kundzewicz, Z.W. Climate Change Impacts on the Hydrological Cycle. Ecohydrol. Hydrobiol. 2008, 8, 195–203. [Google Scholar] [CrossRef]
  90. Barlow, J.; Peres, C.A. Fire-Mediated Dieback and Compositional Cascade in an Amazonian Forest. Philos. Trans. R. Soc. B Biol. Sci. 2008, 363, 1787–1794. [Google Scholar] [CrossRef]
Figure 1. Location of the El Sutó spring area, illustrating the intersection with the Santa Cruz la Vieja (SCLV) protected zone. Hydrogeological features (e.g., water wells, piezometers, and runoff stations), meteorological stations, the urban center of San José de Chiquitos, neighboring communities, and water bodies are also shown.
Fire 08 00086 g001
Figure 3. Conceptual representation of aquifer recharge in fractured sandstones generating the spring, where arrows indicate recharge and discharge processes (a) and the seasonality of the predominant vegetation as reflected in the components of the water balance (precipitation P, interception I, evaporation E, transpiration T, surface runoff Soff, and recharge R) influencing infiltration, with arrows showing water distribution in both seasons (b).
Fire 08 00086 g003
Figure 4. (a) Vegetation distribution around the El Sutó spring, derived from the Territorial Development Plan for Good Living for San José de Chiquitos (2016) and (b,c) comparative maps of the leaf area index (LAI) during the rainy season (February 2015) and the dry season (July 2015), respectively.
Fire 08 00086 g004
Figure 5. Annual rainfall deviations from the 40-year average in San José de Chiquitos, highlighting years with above- and below-average precipitation. The figure showcases the cyclical patterns of wet and dry phases, with visible clusters of rainy and dry years, especially during the last five years.
Fire 08 00086 g005
Figure 7. Soil–water interactions through three pairs of graphs. The first pair (a) examines the Curve Number (CN)’s impact on infiltration and recharge. The central graphs (b) explore the link between maximum infiltration capacity and its effects on infiltration and recharge rates. In contrast, the rightmost graphs (c) reveal the influence of root zone depth (Rzn) on these same variables. These parameter combinations were varied as part of a sensitivity analysis, where the three parameters were systematically assigned random values to test how they interact and to identify their relative influence on infiltration processes.
Fire 08 00086 g007
Figure 8. Relationship between daily precipitation and groundwater recharge under three distinct conditions. (a) Pre-fire (baseline) represents normal infiltration and recharge before any fire disturbance. (b) First year post-fire depicts reduced infiltration and hence lower recharge due to immediate fire effects (ash deposition, hydrophobic layers). (c) Beyond two years post-fire reflects a partial recovery of soil structure, with hydrophobicity diminishing over time and recharge increasing relative to the first year but not necessarily returning to pre-fire levels.
Fire 08 00086 g008
Figure 9. Spatial distribution of annual recharge for three scenarios, namely (a) normal (pre-fire) conditions, (b) the first year post-fire, and (c) beyond two years post-fire. Each scenario includes dry, rainy, and annual season outputs.
Fire 08 00086 g009
Figure 10. Reduction in recharge after a simulated wildfire from the pre-fire baseline scenario, shown for (a) the first year post-fire and (b) more than two years later. Each panel presents dry, rainy, and annual season variations in recharge losses.
Fire 08 00086 g010
Figure 11. Post-fire recharge vulnerability during a dry year. Panels compare (a) conditions in the first year following a simulated wildfire event with (b) the subsequent years, illustrating spatial patterns of recharge deficits.
Fire 08 00086 g011
Figure 12. Fire-Related Forest Recharge Impact Score (FRIS) for post-fire conditions, categorizing recharge vulnerability into five discrete levels according to soil texture, infiltration capacity, and root depth based on the GOD method.
Fire 08 00086 g012
Figure 13. (a) Comparison of recharge estimates in the San José de Chiquitos area using TerraClimate and (b) the extent of the 2008 burned region in the same vicinity [76]. Color variations reflect areas with differing recharge patterns and burn severity.
Fire 08 00086 g013
Figure 14. (a) Twenty-year recharge trends in San José de Chiquitos and (b,c) annual recharge trajectories at five Chiquitania sites derived from TerraClimate and FLDAS, respectively [76,77]. Negative slopes suggest declining recharge linked to regional disturbances.
Fire 08 00086 g014
Table 2. Classification of hydrological zones and assigned Curve Numbers (CNs) under baseline and post-fire conditions.
ZoneDescription (Soils and Vegetation)Pre-Fire CNPost-Fire CN
Type B (lower zone)Soils with extensive rocky outcrops, variable slopes, significant erosion, and excessive drainage. These soils exhibit light-to-medium textures, acidic pH, and low fertility (classified as Leptosol Lithic, Leptosol Aridic, and Cambisol Leptic). Vegetation is diverse, including components of the Cerrado unit and transitional chaparral formations.5586
Type C (upper zone)Shallow soils developed over inclined sandstone with occasional rock outcrops. These soils present textures ranging from moderately coarse to moderately fine, slightly excessive drainage, acidic pH, and low fertility (classified as Ferralsol Haplic, Cambisol Distric, Leptosol Lithic, and Acrisol Alumic). Semi-deciduous forests predominantly cover this area.7091
Table 3. Summary of thresholds and trends in infiltration and recharge responses.
ParameterObserved Range/ThresholdInfiltration ResponseRecharge ResponseAdditional Notes
Curve Number (CN)CN ≤ 85: behavior is relatively stable
CN > 85: sharp decline, approaching zero at CN = 100
Remains near ~380 mm for CN ≤ 85; declines sharply as CN increasesDecreases linearly; ~25 mm at CN = 80, dropping to near 0 beyond CN = 95Notable discontinuity in recharge when CN exceeds 96
Maximum infiltration (Imax)Imax between 20 and 60 mm: stable behavior
Imax < 20 mm: high variability in responses
Remains consistently ~380 mm for Imax between 20 and 60 mm; highly variable below 20 mmStable around ~25 mm for Imax between 20 and 60 mm; decreases linearly below 20 mmRecharge discontinuity is observed when Imax falls below 25 mm
Root zone depth (Rzn)Rzn from 20 to 300 mm
Marked decline in recharge up to ~100 mm, with less pronounced trend thereafter
Remains stable across the range of RznDecreases markedly—from ~200 mm at Rzn = 20 mm to ~20 mm at Rzn = 300 mm—with steep decline until ~100 mm, then more gradual declineRoot-zone depth exerts strong influence on recharge trends
Table 4. Proposed categorization of groundwater recharge vulnerability to wildfires; the FRIS is calibrated for dry tropical forests, but it can be adapted if local conditions differ.
Vulnerability CategoryAnnual Recharge Loss (mm)Approximate Depletion FractionCharacteristics
Negligible0 to −50.04Minor vulnerabilities are typically seen in areas with minimal recharge loss.
Low−5 to −100.13Indicates a low vulnerability level with slightly more noticeable recharge loss.
Moderate−10 to −200.25Indicates an intermediate level of vulnerability, where the impact of recharge loss becomes more noticeable.
High−20 to −300.42This shows a high level of vulnerability and substantial recharge loss that could significantly impact the area’s hydrology.
Extreme−30 to −400.59Represents severe vulnerability, indicating significant recharge loss and potential hydrological disruption.
Disclaimer/Publisher’s Note: The statements, opinions and data contained in all publications are solely those of the individual author(s) and contributor(s) and not of MDPI and/or the editor(s). MDPI and/or the editor(s) disclaim responsibility for any injury to people or property resulting from any ideas, methods, instructions or products referred to in the content.

