Abstract
Seasonally dry mature and old-growth (MOG) forests in the western USA face increasing threats from catastrophic wildfire and drought due to historical fire exclusion and climate change. The Emerald Point forest at Lake Tahoe in the Sierra Nevada of California, one of the last remaining old-growth stands at lake level, is at high risk due to elevated fuels and tree densities. The stand supports huge trees and the highest tree diversity in the Lake Tahoe Basin and protects important raptor habitat. In this study, we simulate forest response to vegetation management and wildfire to assess the impacts of four fuel-reduction scenarios on fire behavior and stand resilience at Emerald Point. Results: Our results demonstrate that restorative forest management can greatly improve an MOG forest’s resistance to catastrophic fire. Thinning to the natural range of variation for density, basal area, and fuel loads, followed by a prescribed burn, was most effective at reducing large-tree mortality, maintaining basal area, and retaining live tree carbon post-wildfire, while reducing secondary impacts. Conclusions: Our findings highlight the value of proactive management in protecting old-growth forests in seasonally dry regions from severe fire events, while also enhancing their ecological integrity and biodiversity.
1. Introduction
Mature and old-growth (MOG) forests have long been treasured for the important social, cultural, and ecological resources they provide to humans and other biota [1,2,3]. The ecosystem service roles played by MOG forests are becoming progressively more critical as global change accelerates, yet these forests are increasingly vulnerable to loss due to human and natural disturbances [4]. Generally, MOG conservation efforts focus on preserving old forests as they are (e.g., original Northwest and Sierra Nevada Forest Plans; [5,6]), but this strategy may be ineffective or counterproductive in seasonally dry forests adapted to frequent, low-severity disturbance, such as the yellow pine and mixed-conifer (“YPMC”) forests of western North America. Modern old growth is rare in these forest types, as extensive large-tree logging in the 19th and 20th centuries depleted the broad expanse of old forest that had greeted Euro-American settlers [3,7,8]. Today, the scattered, remaining MOG stands are of high ecological importance, yet they face increasing threats from fire and drought due to the compounding effects of fire exclusion policies on fuels and forest density, as well as climate change on fuel moisture and forest health [9,10,11]. Conserving old growth in these fire-adapted ecosystems is likely to require an approach that deviates from the standard “keep it from being disturbed and it will be fine” model that dominates conservation thinking worldwide.
Fire or fire surrogates (forest-management activities that mimic fire’s effects [12,13]) may be key to saving MOG in seasonally dry western North American forests like YPMC forests in the Sierra Nevada, California [14,15,16]. Fire in these fire-adapted systems was historically frequent and low in severity, with fire return limited mostly by fuel accumulation [17,18]. In such fuel-limited systems, fire occurrence and behavior are constrained principally by the accumulation of fuel between fire events, because weather and climate conditions are conducive to annual fire occurrence and ignition sources are not limiting [19,20]. High human and lightning ignition densities led to frequent fire before the late 1800s [17,21], but the displacement of Indigenous communities and active suppression of fires by Euro-Americans has since resulted in a major deficit of fire across these landscapes [22,23]. Today, after more than a century of fire exclusion, seasonally dry forests of the Sierra Nevada and other western regions face unprecedented levels of live and dead fuel accumulation and continuity due to a substantial increase in tree density and the buildup of surface and ladder fuels [11,24,25]. Under current and projected future climate trends, these forests, whether old growth or second growth, are at increasingly high risk of catastrophic, stand-replacing fire [26].
Seasonally dry MOG forests are important due to their unique structural characteristics and the multiple critical ecosystem services they provide, including maintaining biodiversity, ecosystem stability, and fire resilience [27]; sequestering carbon in their biomass and soils [28]; and playing a vital role in postfire ecosystem recovery, as the surviving large trees provide seeds for conifer regeneration and habitat for a variety of animals [29]. Because older trees support thicker bark and canopies that are further from the ground, MOG forest stands also tend to be more fire resilient than younger stands [17]. However, modern data show that severe wildfire is a major driver of old forest loss across seasonally dry forests of the western US, due in large part to infilling by smaller, fire-intolerant trees [4,9]. MOG conservation thus presents a conundrum for managers in semiarid and fire-prone landscapes, where the inevitability of fire means that some level of periodic fuel reduction is likely necessary to ensure old forest persistence and resilience [30,31,32,33].
The Lake Tahoe Basin (LTB) in the Sierra Nevada, California, is emblematic of the challenges facing old forest in the western US. Low and middle elevation LTB forests were largely clearcut in the late 19th century, with <2% remaining by the early 21st century [34]. Contemporary forests—dominated by younger trees, high stem densities, a decreased proportion of fire-tolerant species, and low structural complexity—are very different from the old, open forests that greeted the first Euro-American visitors in the early to mid-19th century [35,36,37]. Although forest conservation focus in the LTB is on restoring old forest characteristics that are more resilient to climate change, fire, and drought [38,39], high levels of MOG forest loss in recent wildfires in and near the LTB (Safford and Saberi, in prep; Safford, pers. obs.) underline the urgency of the work.
In the centuries before 1850, forest habitats in the Lake Tahoe Basin likely experienced 1000–1500 ha of burning in an average year (calculations based on forest areas in the LTB and fire rotations from [40]). The imposition of fire exclusion was remarkably effective at erasing fire as an ecological force in the LTB for more than a century [37]. However, the 21st century has brought a new reality, with five severe wildfires since 2002 burning in the southern LTB, not far from our study area. It is useful to remember that, in California, the question is not if a forest will burn, but rather when and under what conditions.
The Emerald Point stand in Emerald Bay State Park is what many consider to be the most important remaining patch of large, old trees in the LTB. The Emerald Point stand supports the largest remaining ponderosa pine (Pinus ponderosa Lawson & C. Lawson) specimens in the LTB, with some individuals exceeding 200 cm in diameter at breast height (dbh) and many individuals exceeding 150 cm dbh. Most of the ponderosa pine, which is only found in a ring around the Lake Tahoe shoreline, was logged in the 1800s. The Emerald Point stand also supports at least 13 tree species, making it the most tree-diverse stand of its size in the LTB. The Emerald Point stand has experienced >120 years of fire exclusion, and modern tree densities and fuel loadings are very high. The stand has experienced multiple mortality events from beetle outbreaks and drought over recent decades, and surface fuels include several cohorts of fallen trees and an enormous surface accumulation of litter and duff, which reduces herbaceous plant diversity to nearly zero and increases the risk of long-duration smoldering in the event of fire [41,42].
The high conservation value of the Emerald Point stand notwithstanding, to this point no fire- or drought-risk-mitigation activities have ever been undertaken in the stand, although such activities have been undertaken in nearby State Parks and in a campground a short distance to the southwest. Here, we take advantage of a long-term forest stand condition dataset to conduct a fire modeling study of the likely impact of a wildfire on the stand in the presence and absence of restorative, fire-risk-reduction activities. Our aim is to provide important information for and impetus to the development of a risk-management plan for this one-of-a-kind place, and to serve as a case study for assessing risk and planning management in seasonally dry, fire-prone MOG forests across the western US.
2. Materials and Methods
2.1. Study Site
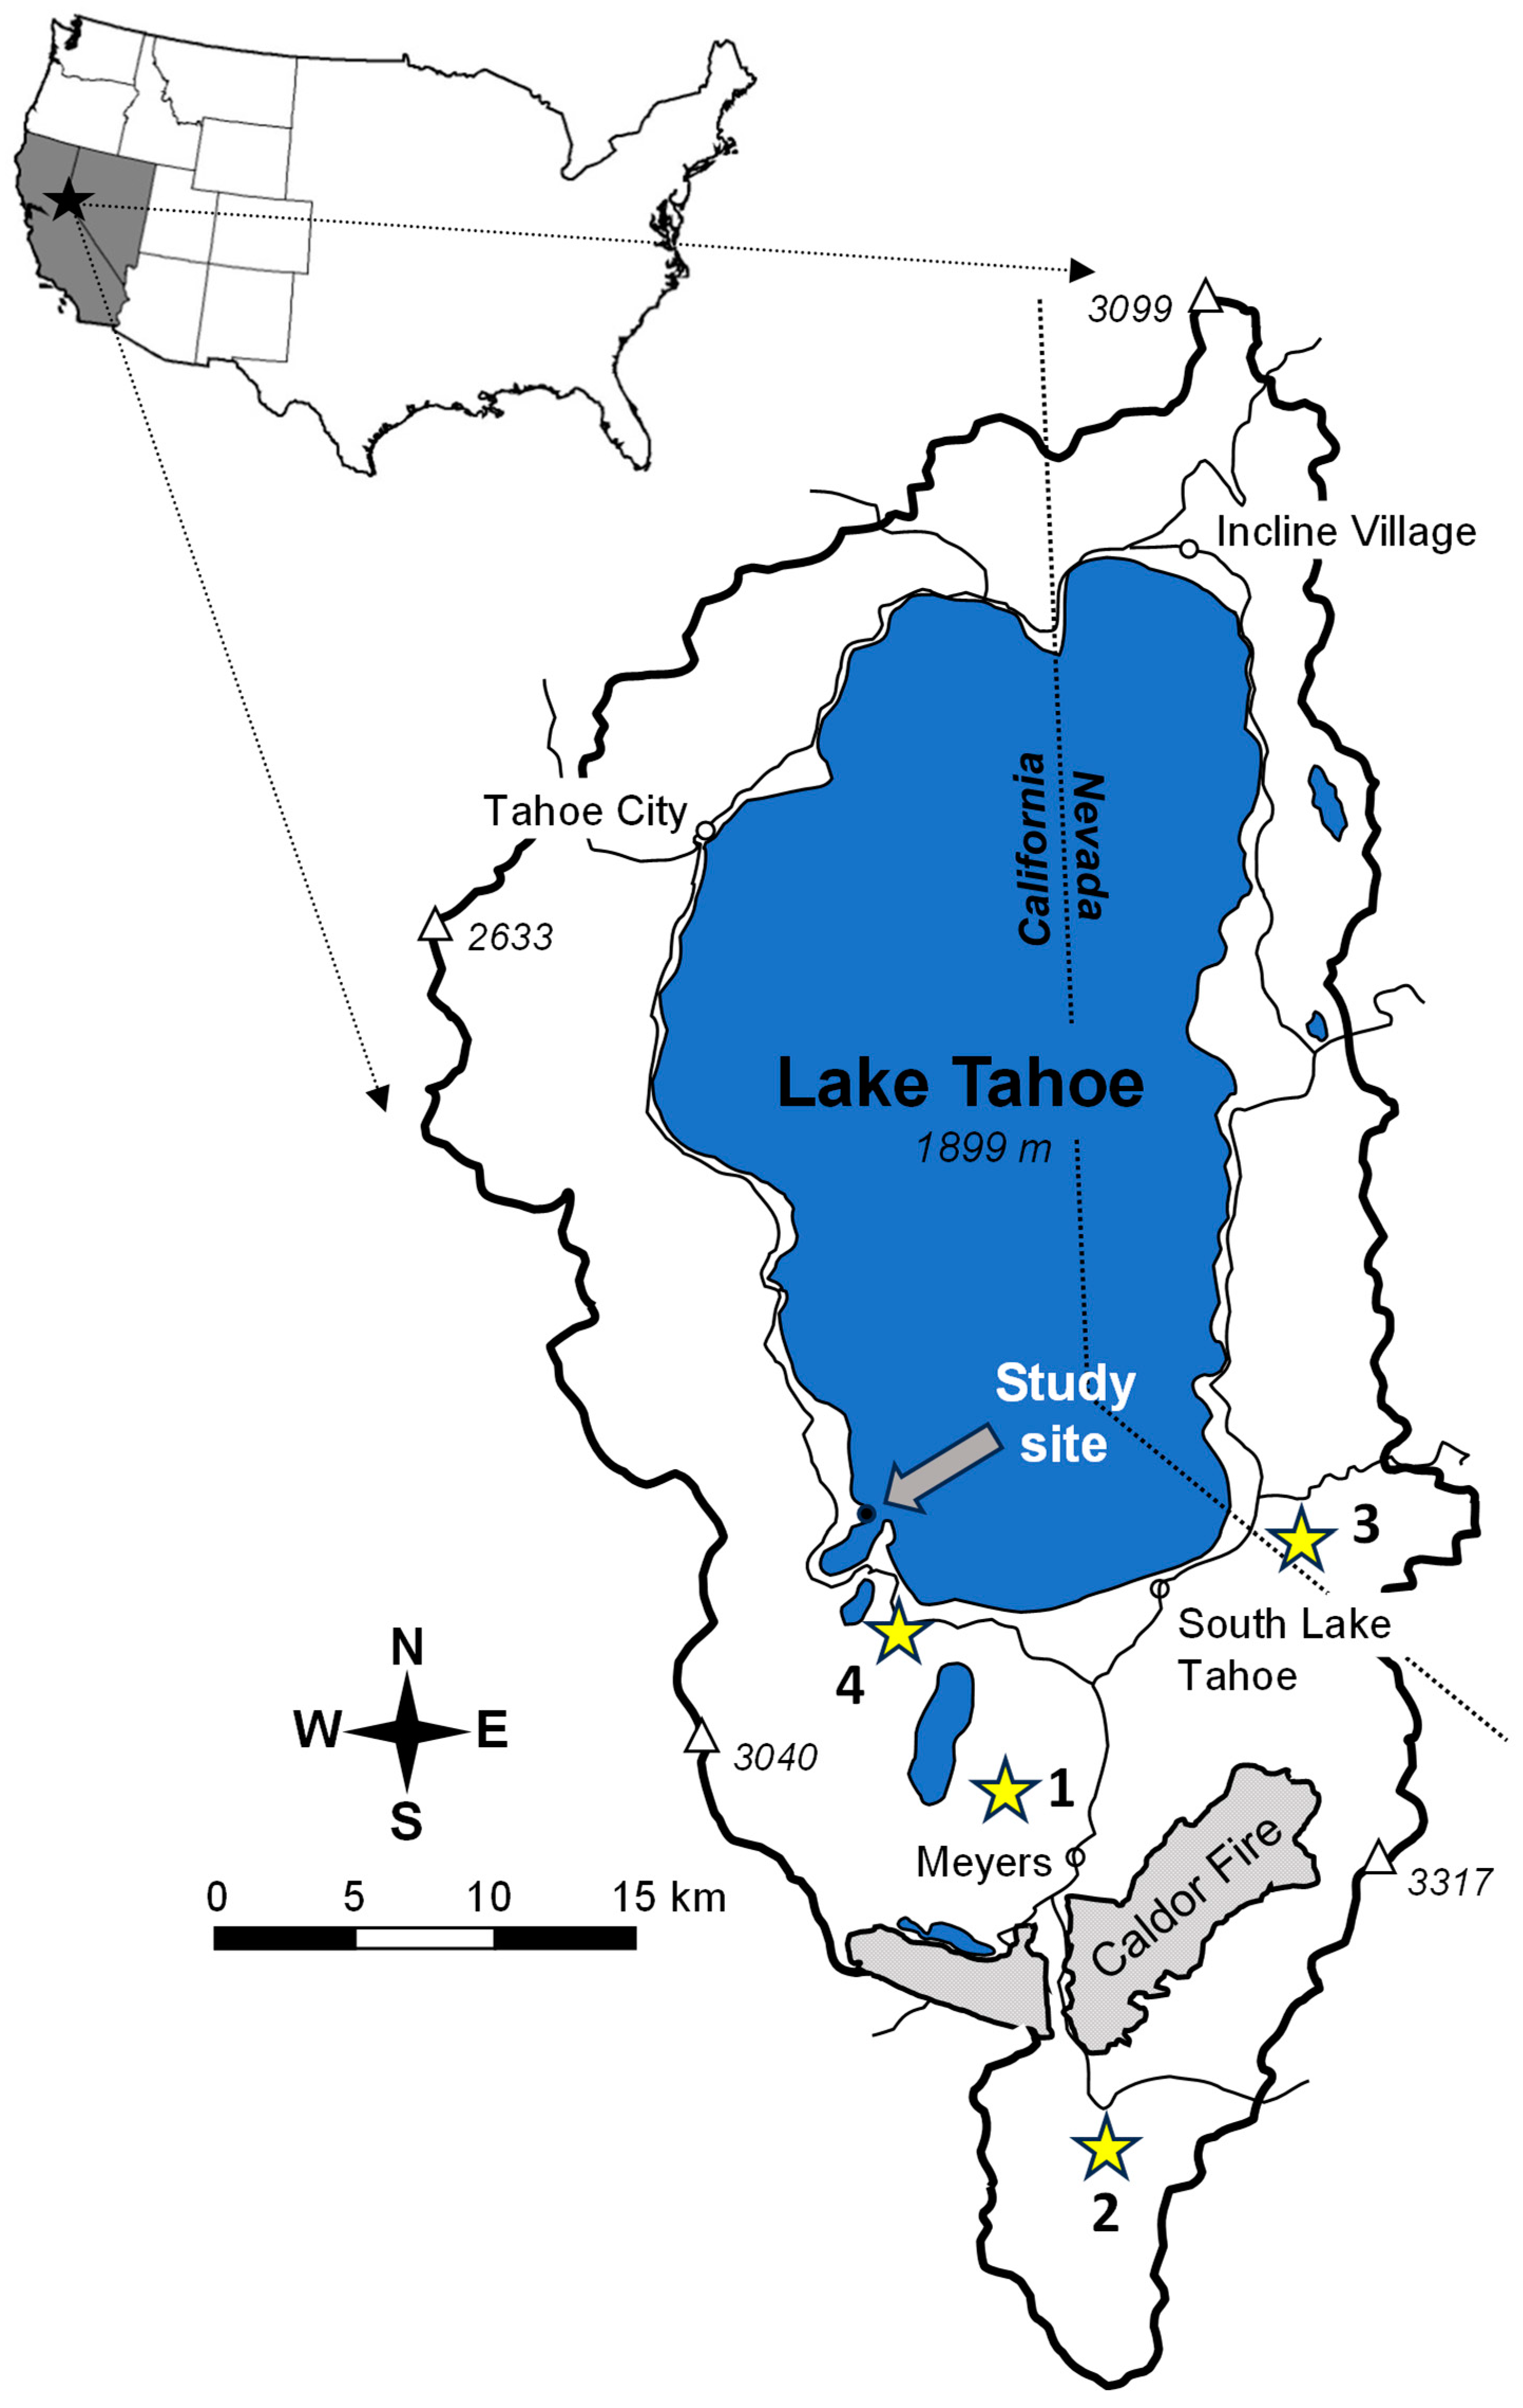
Our study site (Emerald Point—38°58′0″ N, 120°5′2″ W) is located within Emerald Bay State Park on the southwestern shore of Lake Tahoe (Figure 1). The study site is approximately 20 ha in area, with an average elevation of 1905 m; slopes are mostly gentle, ranging from 0% to 5%. The climate is Mediterranean-type with cold, wet winters and warm, dry summers. At the Lake Baron Remote Automated Weather station (1925 m elevation, 12.5 km SSE of the study site, record from 2012–2023), the January mean minimum temperature is −8.3 °C, the July mean maximum is 28.8 °C; extreme recorded temperatures are −28.3 and 35.8 °C. Precipitation averages 867 mm per year, with 82% of precipitation falling as snow between November and April [43]. The geologic substrate at Emerald Point is glacial till that consists primarily of granodiorite boulders in a sandy matrix [44]. The northern half of the site is underlain primarily by soils of the Meeks Series (inceptisols (aquic dystroxerepts); gravelly loamy coarse sand, extremely bouldery) and the southern half by the Marla Series (inceptisols (humic dystroxerepts); loamy coarse sand) [45].
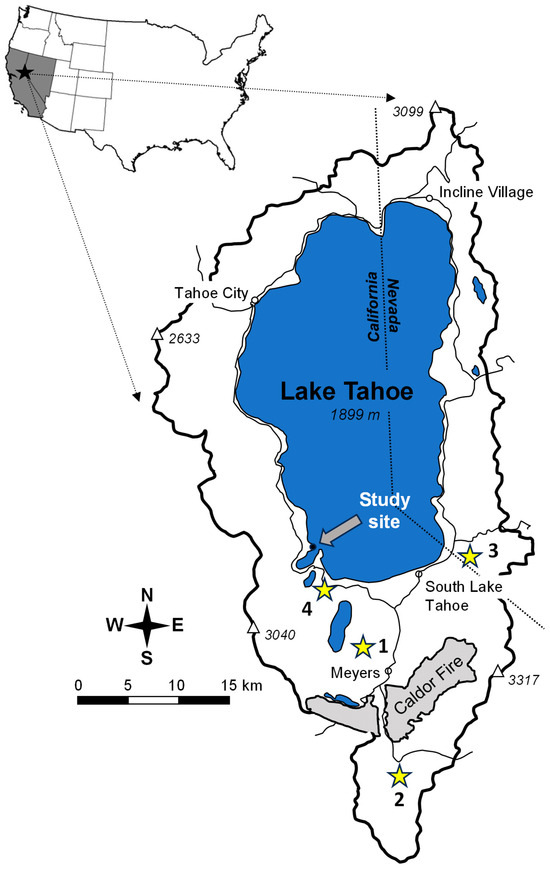
Figure 1.
Location of the Emerald Point study site in the Lake Tahoe Basin, California and Nevada, USA (black dot at end of the arrow). Outer polygon indicates the boundary of the USDA-Forest Service Lake Tahoe Basin (LTB) Management Unit. Stars numbered 1, 2, 3, and 4 represent the locations of the 2007 Angora Fire, 2002 Showers Fire, 2002 Gondola Fire, and 2018 Emerald Fire, respectively. 2021 Caldor Fire indicated by gray polygon.
Emerald Point is occupied by an old-growth yellow pine–mixed conifer (YPMC) forest stand dominated by very large individuals of P. ponderosa, P. jeffreyi and Calocedrus decurrens. The stand is widely considered the most iconic old-growth stand in the Lake Tahoe Basin. The site also supports the highest diversity of tree species for its area in the LTB, with 13 species recorded from the 20 ha area, including extreme rarities at lake level like Quercus chrysolepis and Tsuga mertensiana. Understory plant cover and diversity on the other hand are very low, due to heavy duff and litter loadings: on average, our 400 m2 plots support 3.8 herbaceous species, with a mean overall cover of 1.8% (Safford, in prep.). Bird diversity is also very low in the stand (Z. Steel, US Forest Service, pers. comm.). Fire exclusion has caused the stand to become infilled by small and medium-sized trees (mostly Abies concolor, C. decurrens, and P. jeffreyi) (Figure 2, Figure 3 and Figure 4). The Emerald Point stand is one of very few areas at lower elevations in LTB that was not logged in the 19th and early 20th century. A few individual trees (mostly large Pinus lambertiana) were cut incidentally for the construction of buildings along Emerald Bay, but no large-scale logging has ever occurred.
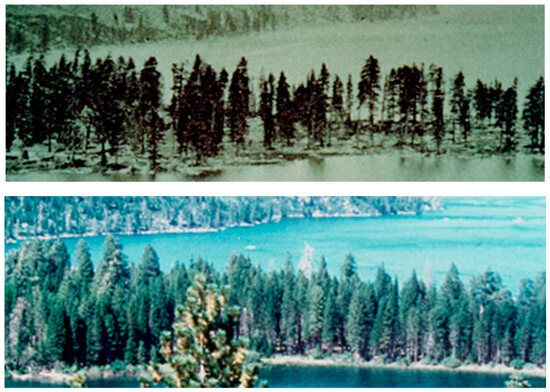
Figure 2.
Photo series showing increased tree density through time at study site. (Top photo) taken in 1883, (Bottom photo) taken in 2018. Photos courtesy of California State Parks.
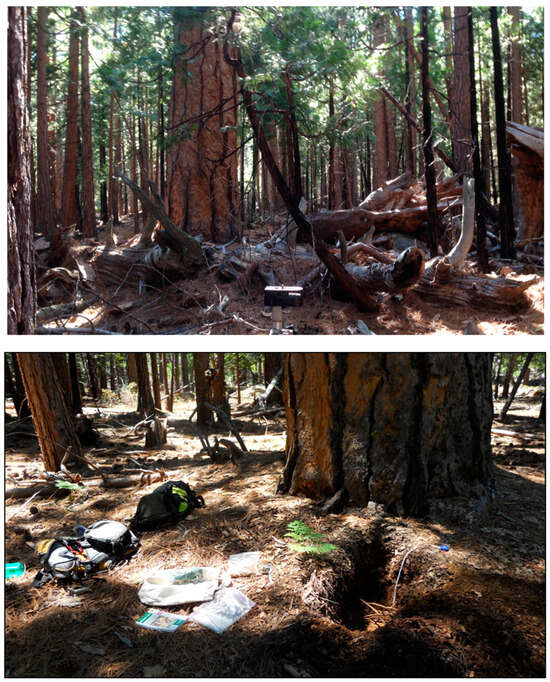
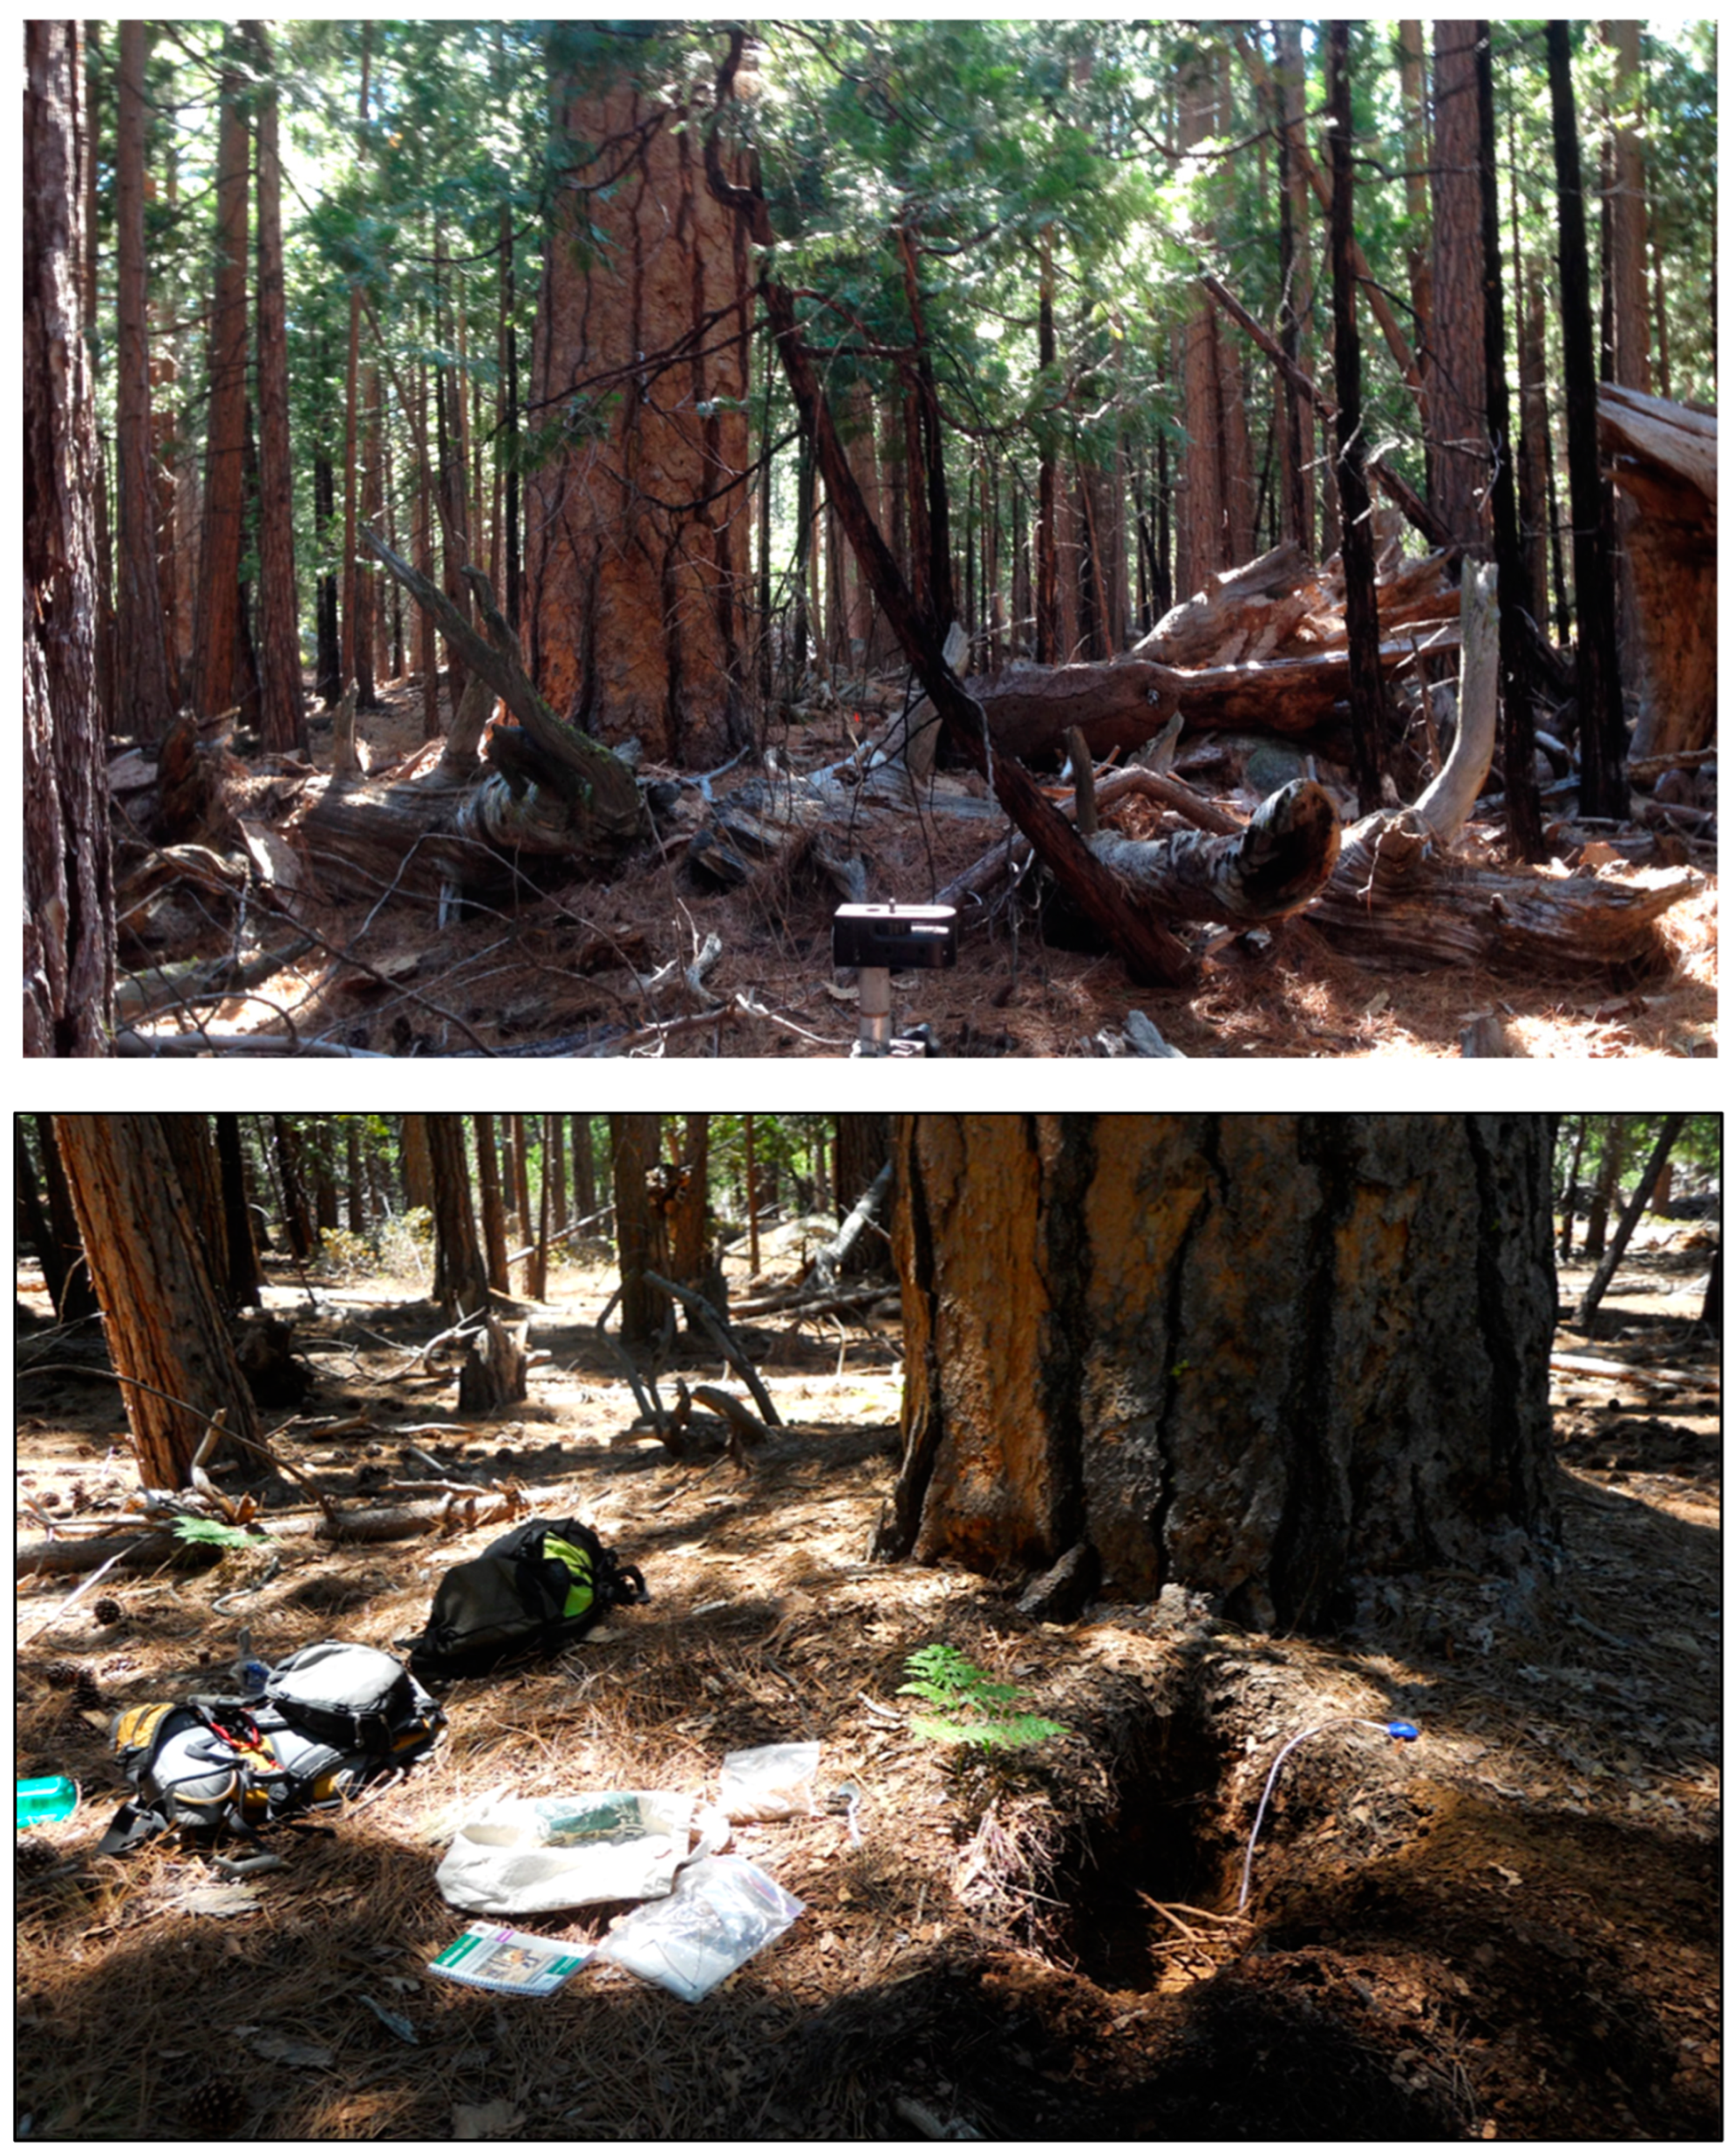
Figure 3.
Fuel loading at the study site. (Top photo) shows high levels of large diameter surface fuels. (Bottom photo) shows depth of litter and duff layers in the stand, which are particularly extreme near the bases of the large, mature trees. Depth to mineral soil was 0.75 m in the hole. The ponderosa pine in the bottom photo has a diameter at breast height of 190 cm. Photos by H. Safford.

Figure 4.
Current (from the 2017 inventory, before the simulated treatment) stand conditions at Emerald Point. Trees < 10 cm cbh were not measured. (Top)—tree density; (Bottom)—basal area. Diameter at breast height (dbh) was measured at 1.37 m above ground level. IC = incense cedar (Calocedrus decurrens), JP = Jeffrey pine (Pinus jeffreyi), LP = lodgepole pine (Pinus contorta), PP = ponderosa pine (Pinus ponderosa), RF = red fir (Abies magnifica), SP = sugar pine (Pinus lambertiana), WF = white fir (Abies concolor).
Before the imposition of formal fire exclusion in the LTB in the early 20th century, the combination of lightning and human ignitions led to very frequent fires in lakeside forests. Ref. [46] documented a mean fire return interval (FRI) of 11.7 years in mixed-conifer forests for the period 1616–1893 in Sugar Pine Point State Park, 10 km north of our study site. With the arrival of Euro-Americans, the local Indigenous Peoples of the Washoe Tribe were forcibly removed from much of their land in LTB, and their use of fire was made illegal; by the early 1900s, fires of all kinds were being actively suppressed in the LTB [37]. Today, the Emerald Point stand has not experienced a fire for at least 120 years, although there have been a few quickly suppressed ignitions. Observationally, the long-term lack of fire has led to major increases in stand density, surface fuels, litter and duff loadings, and tree death driven by density-dependent mortality factors like water stress and insect outbreaks. After more than a century without significant fire, a number of medium and large fires have severely burned forest in the southern LTB over the last two decades; the nearest was the 2018 Emerald Fire, only 2 km to the south of the study site (Figure 1).
2.2. Data Collection
A permanent network of 15 field plots was originally established in the Emerald Point stand in 2011 for stand inventory purposes, and to provide the ability to monitor forest change over time. Plots were located at the vertices of a 100 m grid that was overlaid in GIS on a map of the stand. We resampled the plots in 2017. In this study, we use the data from 2017. Sampling in both years was based on the USDA Forest Service Common Stand Exam (CSE) protocol [47], with detailed measurements of trees, fine fuels, coarse woody debris, ground cover, and regeneration (see [48,49] for more detail). Plots were circular and 400 m2 in area (~1/10 acre). All fuels data (duff and litter depth; fine fuel particle counts, where fine fuel is all woody fuels <7.62 cm in diameter; and length, mean diameter, and soundness [in two classes, rotten and sound] of all downed woody stems >7.62 diameter) were collected along 11.3 m transects in all four cardinal directions [50]. For all standing trees over 10 cm dbh, the following data were collected: species, height, dbh, height to live crown, and crown width for live trees; and height, dbh, and decay class for dead trees.
2.3. Treatment and Fire Simulations
To assess potential wildfire risk to the Emerald Point stand, we modeled potential fire behavior with our 2017 plot data using the Fire and Fuels Extension (FFE) to the Forest Vegetation Simulator version 2022 (FVS; [51]). We simulated four fuels management scenarios and then followed those scenarios with a simulated wildfire to test the relative efficacy of different strategies in reducing fire risk. FVS-FFE is an aspatial, deterministic model for simulating forest-management actions and their interactions with wildfire. It has been widely used and extensively validated (e.g., [52,53,54]), and it is continuously updated and improved.
As is common practice for project planning, we combined data from all our plots and ran FVS at the stand level. Because of this, and because FVS modeling is deterministic and not stochastic, the FVS model returns are single values for each timestep and management scenario. This lack of variance precludes statistical analyses. Although creating variance in FVS is possible via a pseudorandom number generator and multiple runs, we chose not to implement this strategy due to the applied nature of our study, the very limited size of our study site, and the unique nature of fuels at Emerald Point (see Results and Discussion). We used FVS keywords to design and implement our treatments and to visualize treatment effects on stand condition. We relied on FVS to help us understand comparisons between treatment types immediately post-treatment and post-wildfire. We created four management scenarios that represented the spectrum of realistic possible management in our area of interest, based on input from California State Parks forest-management staff. We utilized the Western Sierra Nevada variant within FVS-FFE.
Our most conservative scenario was no management (“NM”), which included no thinning or fuel removal. Our most intensive management scenario (“TFRX”) was designed to restore stand-level basal area, stem density, and fuel loads to within the natural range of variation (NRV) for this forest type. NRV targets for post-treatment basal area (mean = 34 m2 ha−1, 25–75th percentiles = 23.2–40.6 m2 ha−1), tree density (mean = 160 trees ha−1, 25–75th percentiles = 73–223), and fuel loads including ≥1000 h fuels (mean = 27 Mg ha−1, 25–75th percentiles = 14.9–38.8 Mg ha−1) were derived from [24,55]. To meet these targets, we simulated a thin-from-below treatment that removed all trees between 20.3 and 81.3 cm (8–32 inches) dbh with the exception of P. lambertiana, which was left uncut as requested by State Parks managers. Based on the input of State Parks personnel, trees under 20.3 cm (8 inches) dbh were retained to maintain stand heterogeneity and to limit logistical complexity and costs of the real-world application of this treatment (the nearest truck-bearing road is 900 m to the west and 170 m above the study site, and it was assumed that small trees would be killed by the subsequent fall-prescribed fire; see below). This was followed by whole tree yarding and biomass removal, with biomass removal rates higher in dense areas and around big trees. Based on discussions with State Parks personnel, the fuel model was set to TL8 (Long-Needle Timber Litter [56]), and a fall broadcast burn was simulated with a temperature of 15 °C and no wind. See Table 1 for fuel moisture specifics.

Table 1.
Percent moisture across fuel categories for the simulated prescribed fires and wildfire. HTP not listed because FVS-FFE does not currently allow user-driven fuel moisture quantification for pile burning.
We also ran a scenario (“HTP”) with hand thinning followed by pile burning as our fuel-reduction method. All trees less than 30.5 cm dbh were cut and piled, with the exception of P. lambertiana, as above. A total of 80% of all surface fuel was piled and burned the following year.
Our final management scenario (“SRX”) was a spring prescribed fire unpaired with other fuel-reduction methods. In the Lake Tahoe Basin, California State Parks uses prescribed fire without antecedent thinning in the spring, but not the fall. Spring burns are less likely to escape or be impacted by the high winds that are common in the fall. We used fuel model TL8 and set the season to early spring, temperature to 15.5 °C, and no wind. See Table 1 for the fuel moistures we used in our simulations. Values under SRX and TFRX reflect the midpoints of typical spring and fall fuel moisture ranges for prescribed burns on California State Parks lands in the LTB (R. Adams, California State Parks, pers. comm.).
All four management scenarios were followed the year after treatment completion by a simulated wildfire, using fuel moisture and weather conditions characteristic of a severe problem-fire scenario on a summer afternoon in the LTB (R. Adams, California State Parks, and K. Jacobson, US Forest Service, pers. comms [57]). Fuel model was once again set to TL8. Fire weather and fuel moisture conditions were mostly derived from 97.5th percentile weather averages from the Homewood, Bliss, and Lake Baron RAWS meteorological stations on the Lake Tahoe west shore [43]. We pushed air temperature to 25 °C and 20 ft (6.1-m) wind speed to 45 km h−1 in order to better represent weather conditions that have characterized past destructive wildfires in the LTB (e.g., the daily high temperatures during the Angora, Caldor, Gondola, and Showers Fires averaged 25° [range 21–30°]; and the Angora, Emerald, Gondola, and Showers Fires experienced maximum wind speeds averaging 60 km h−1 [range 40–80 km h−1]). See Table 1 for fuel moisture specifics.
To compare forest stand characteristics across the four treatment scenarios, we calculated tree densities (tree ha−1) and basal areas (m2 ha−1) by species; fuel loads (Mg ha−1) for live and dead standing trees, litter and duff, the sum of 1–100 h fuels, and the sum of ≥1000 h fuels (aka coarse woody debris, or CWD); relative Stand Density Index (rSDI), which is presented as the percent of maximum SDI for “pine-mixed conifer” (902 trees ha−1) from [33], and where values between 25% and 35% represent the zone of competition, 35% to 60% represents “full site occupancy”, and values ≥60% indicate “imminent mortality” due to density-dependent competition; and quadratic mean diameter (QMD), which indicates the diameter of the tree of average basal area in a forest stand [58] and for which, given stands of equal overall basal area, values will be higher in stands containing more basal area in large trees.
3. Results
3.1. Current (Pre-Treatment) Tree Basal Area and Density
The Emerald Point stand currently supports a mean tree density of 516 trees ha−1 (only trees ≥10 cm dbh included), with the majority of that density coming from individuals of A. concolor and C. decurrens with dbhs ≤ 40 cm (Figure 4). The stand boasts numerous trees with diameters of considerable size (Figure 4), including several with dbhs > 200 cm. The basal area of the stand at the time of field data collection was 65.2 m2 ha−1. Although white fir dominated basal area in the smaller tree size-classes (<100 cm dbh), incense cedar, Jeffrey pine, and ponderosa pine were also well-represented; among larger trees (≥100 cm dbh), ponderosa pine and incense cedar were by far the dominant species (Figure 4).
3.2. Fuel Loadings Pre- and Post-Treatment
Pre-treatment fuel loads for the stand were extremely high, with 327 Mg ha−1 of standing fuel and 217 Mg ha−1 of surface fuel (Figure 5). Standing fuels were comprised mostly of live trees with standing dead trees and shrubs contributing minimally (Figure 5). Woody material ≥7.62 cm in diameter (1000 and 10,000 h fuels, aka coarse woody debris or “CWD”) was the largest contributor to surface fuels at 125 Mg ha−1, followed by litter + duff at 80 Mg ha−1 (Figure 5).
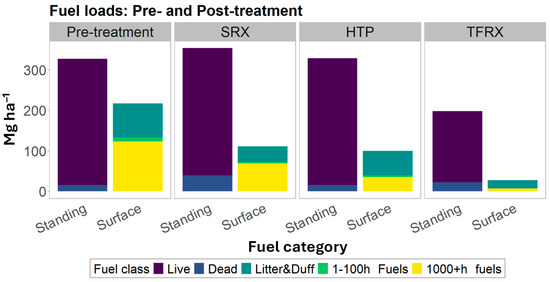
Figure 5.
Pre- and post-treatment fuel loads, before simulation of the wildfire. Standing fuels are divided into live and dead standing fuel, and surface fuels are divided into four categories: litter and duff combined; 1–100 h fuels; and ≥1000 h fuels (CWD).
The SRX scenario reduced fuels by the least of our three active management scenarios (Figure 5). Total standing fuel loads remained nearly identical to the pre-treatment levels, although fuel from dead standing trees more than doubled after the burn (Figure 5; standing fuels are actually a little higher than before treatment as 6 years of tree growth occurred between the original inventory in 2017 and the simulated prescribed fire in 2023). 1–100 h fuels, ≥1000 h fuels (CWD), and litter and duff were all reduced to 50–60% of pre-treatment loadings (Figure 5). The HTP treatment resulted in a negligible change in standing fuels, but reduced surface fuels notably with CWD decreased to about one third of the pre-treatment levels, 1–100 h fuels were reduced by 50%, and there was a 30% reduction in litter and duff (Figure 5). The TFRX treatment resulted in the greatest changes in fuel loadings, with a reduction of nearly 130 Mg ha−1 of standing fuels and 190 Mg ha−1 of surface fuels, including a >90% decrease in CWD (Figure 5).
3.3. Tree Basal Area and Density Before and After Wildfire
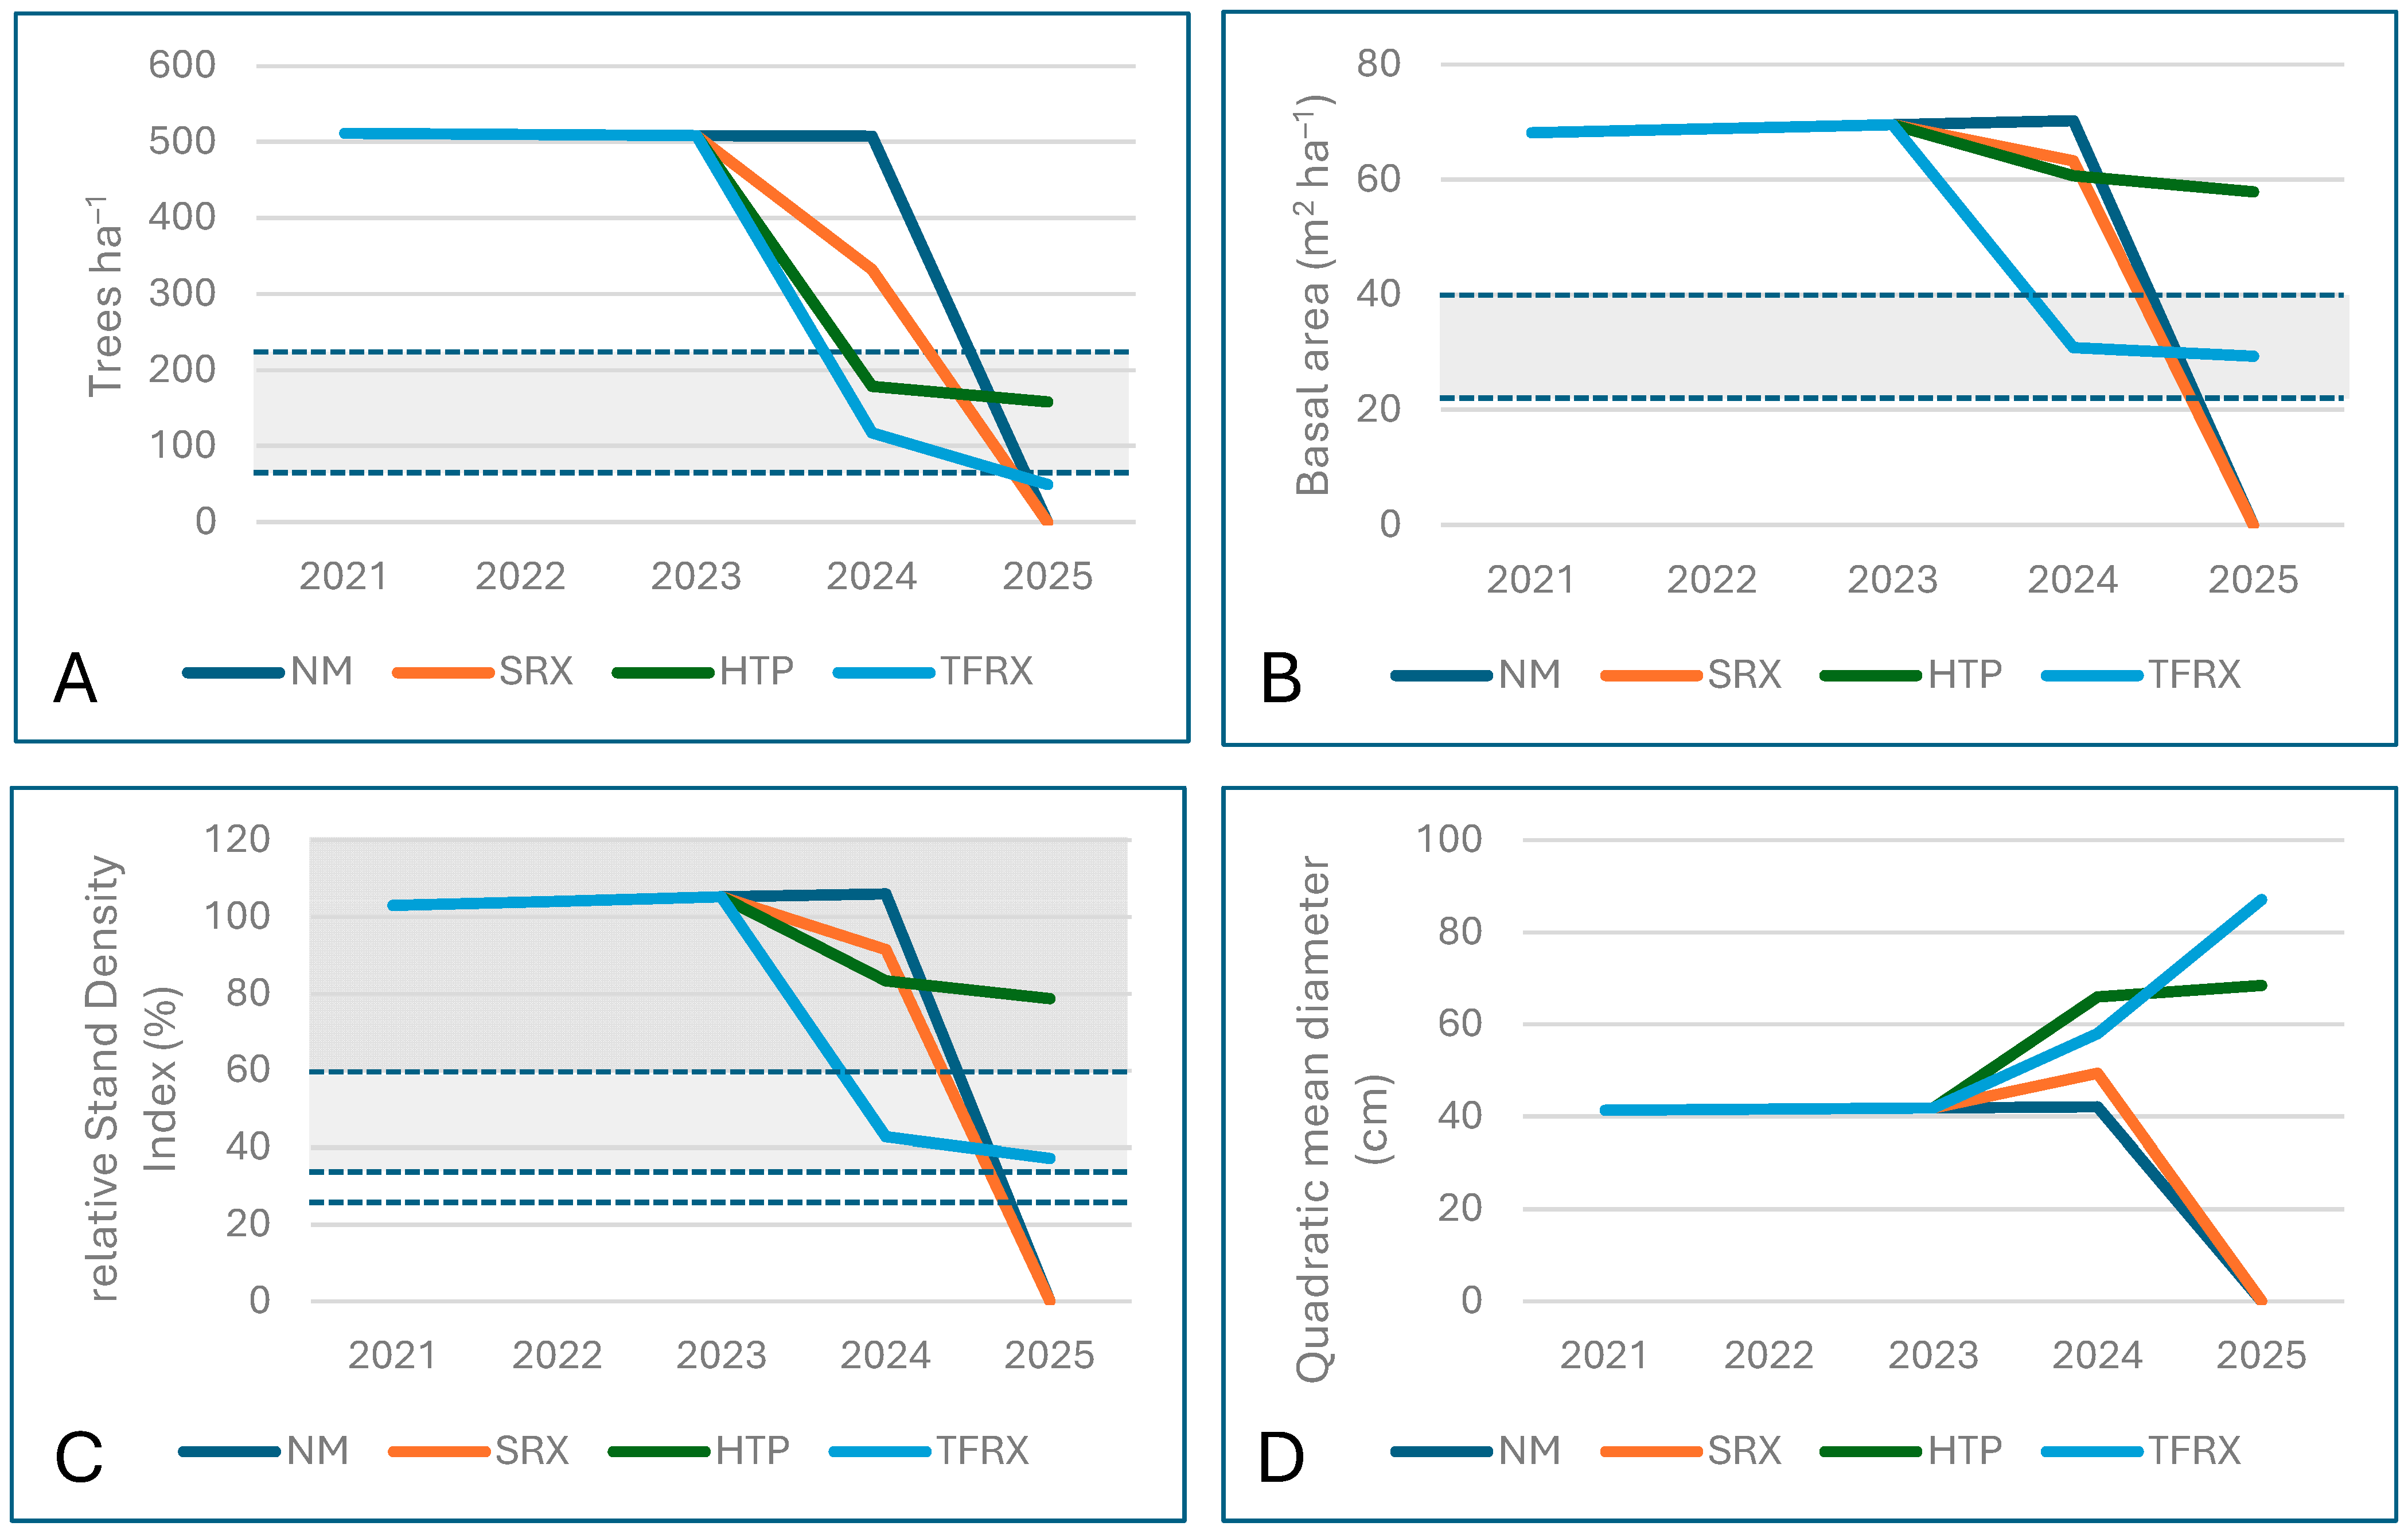
All three active management scenarios decreased pre-wildfire tree density (Figure 6A). Tree density (trees per hectare, “tph”) was reduced most by the TFRX scenario (77% reduction—508 tph to 117 tph), followed by HTP (65% reduction—508 tph to 178 tph), and then SRX (35% reduction—508 tph to 332 tph). Pre-wildfire densities were much higher than the NRV 75th percentile values for NM (2.3 times higher) and SRX (50% higher), while both HTP and TFRX reduced densities to within the NRV (Figure 6A). Simulated wildfire in the NM and SRX scenarios led to 100% tree mortality. The HTP scenario resulted in minimal fire-induced tree mortality, only experiencing a 12% reduction in tree density (178 tph to 158 tph). Tree density reduction was greater in the TFRX scenario (58%, or 117 tph to 49 tph) due to the wildfire-induced mortality of small trees remaining after the initial TFRX thin (see Methods; Figure 6A). Large-tree (≥100 cm dbh) survival was equal in HTP and TFRX, but relatively high densities of trees between 30.5 and 80 cm (>135 trees ha−1) remained in HTP after wildfire. Post-wildfire, HTP densities remained within the NRV, while TFRX fell slightly below the 25th percentile value.
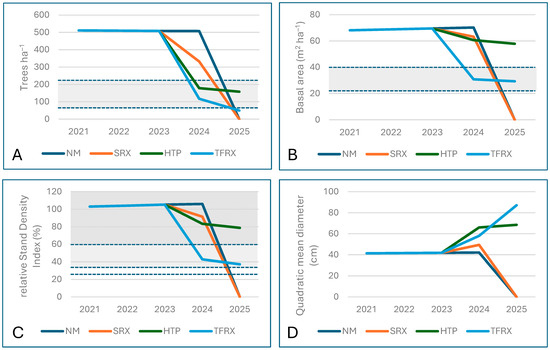
Figure 6.
FVS-FFE outputs from treatment and wildfire scenarios. Treatments carried out in 2023, wildfire occurred in 2024. Stand growth from 2017 to 2021 not portrayed; data only include trees ≥10 cm dbh. (A)—Tree density; (B)—Basal area; (C)—relative Stand Density Index; (D)—Quadratic mean diameter. Gray areas between dashed lines in (A,B) represent approximate range of NRV conditions (25th to 75th percentiles; see text). Dashed lines in (C) represent 25%, 35%, and 60% rSDI, lower boundaries of stand conditions characterized by competition, full site occupancy, and imminent mortality, respectively.
TFRX was the only active management scenario to notably decrease basal area (Figure 6B). TFRX reduced basal area by over 55%, from 69 m2 ha−1 to 31 m2 ha−1. The HTP and SRX scenarios that resulted in similar post-treatment basal area, starting at 69 m2 ha−1 and decreasing to 60 m2 ha−1 and 63 m2 ha−1, respectively (Figure 6B). Before the wildfire, the TFRX treatments brought basal area to the center of the NRV; none of the other scenarios were close to the NRV for basal area. After wildfire, simulated basal area loss was 100% in NM and SRX. The HTP and TFRX scenarios experienced only marginal decreases in live tree basal area following wildfire—from 61 to 58 m2 ha−1 (a loss of 5%) and 31 to 29 m2 ha−1 (a roughly 6% loss), respectively (Figure 6B). Surviving large-tree (>100 cm dbh) basal area was equal in HTP and TFRX after wildfire, but basal area in small trees contributed 54% (33/61 m2 ha−1) of postfire basal area in HTP and only 21% (6/29 m2 ha−1) in TFRX. After burning, TFRX continued to be the only scenario to approximate NRV values.
Due to complete stand mortality, rSDI and QMD both decreased to zero in the NM and SRX scenarios. In HTP, rSDI after treatment fell from 105% to 83%, but was still 78%, well into the zone of imminent mortality, after the wildfire (Figure 6C). The TFRX treatments reduced rSDI from 105% to 43%, and wildfire further reduced rSDI to 37%, near the boundary between the competition and full site occupancy zones. QMD was increased by all of the active treatment scenarios, especially by HTP and TFRX (Figure 6D). After wildfire, QMD in the TFRX scenario rose to about 20% higher than HTP because of the much higher proportion of basal area found in medium-sized trees in the latter.
3.4. Fire Behavior
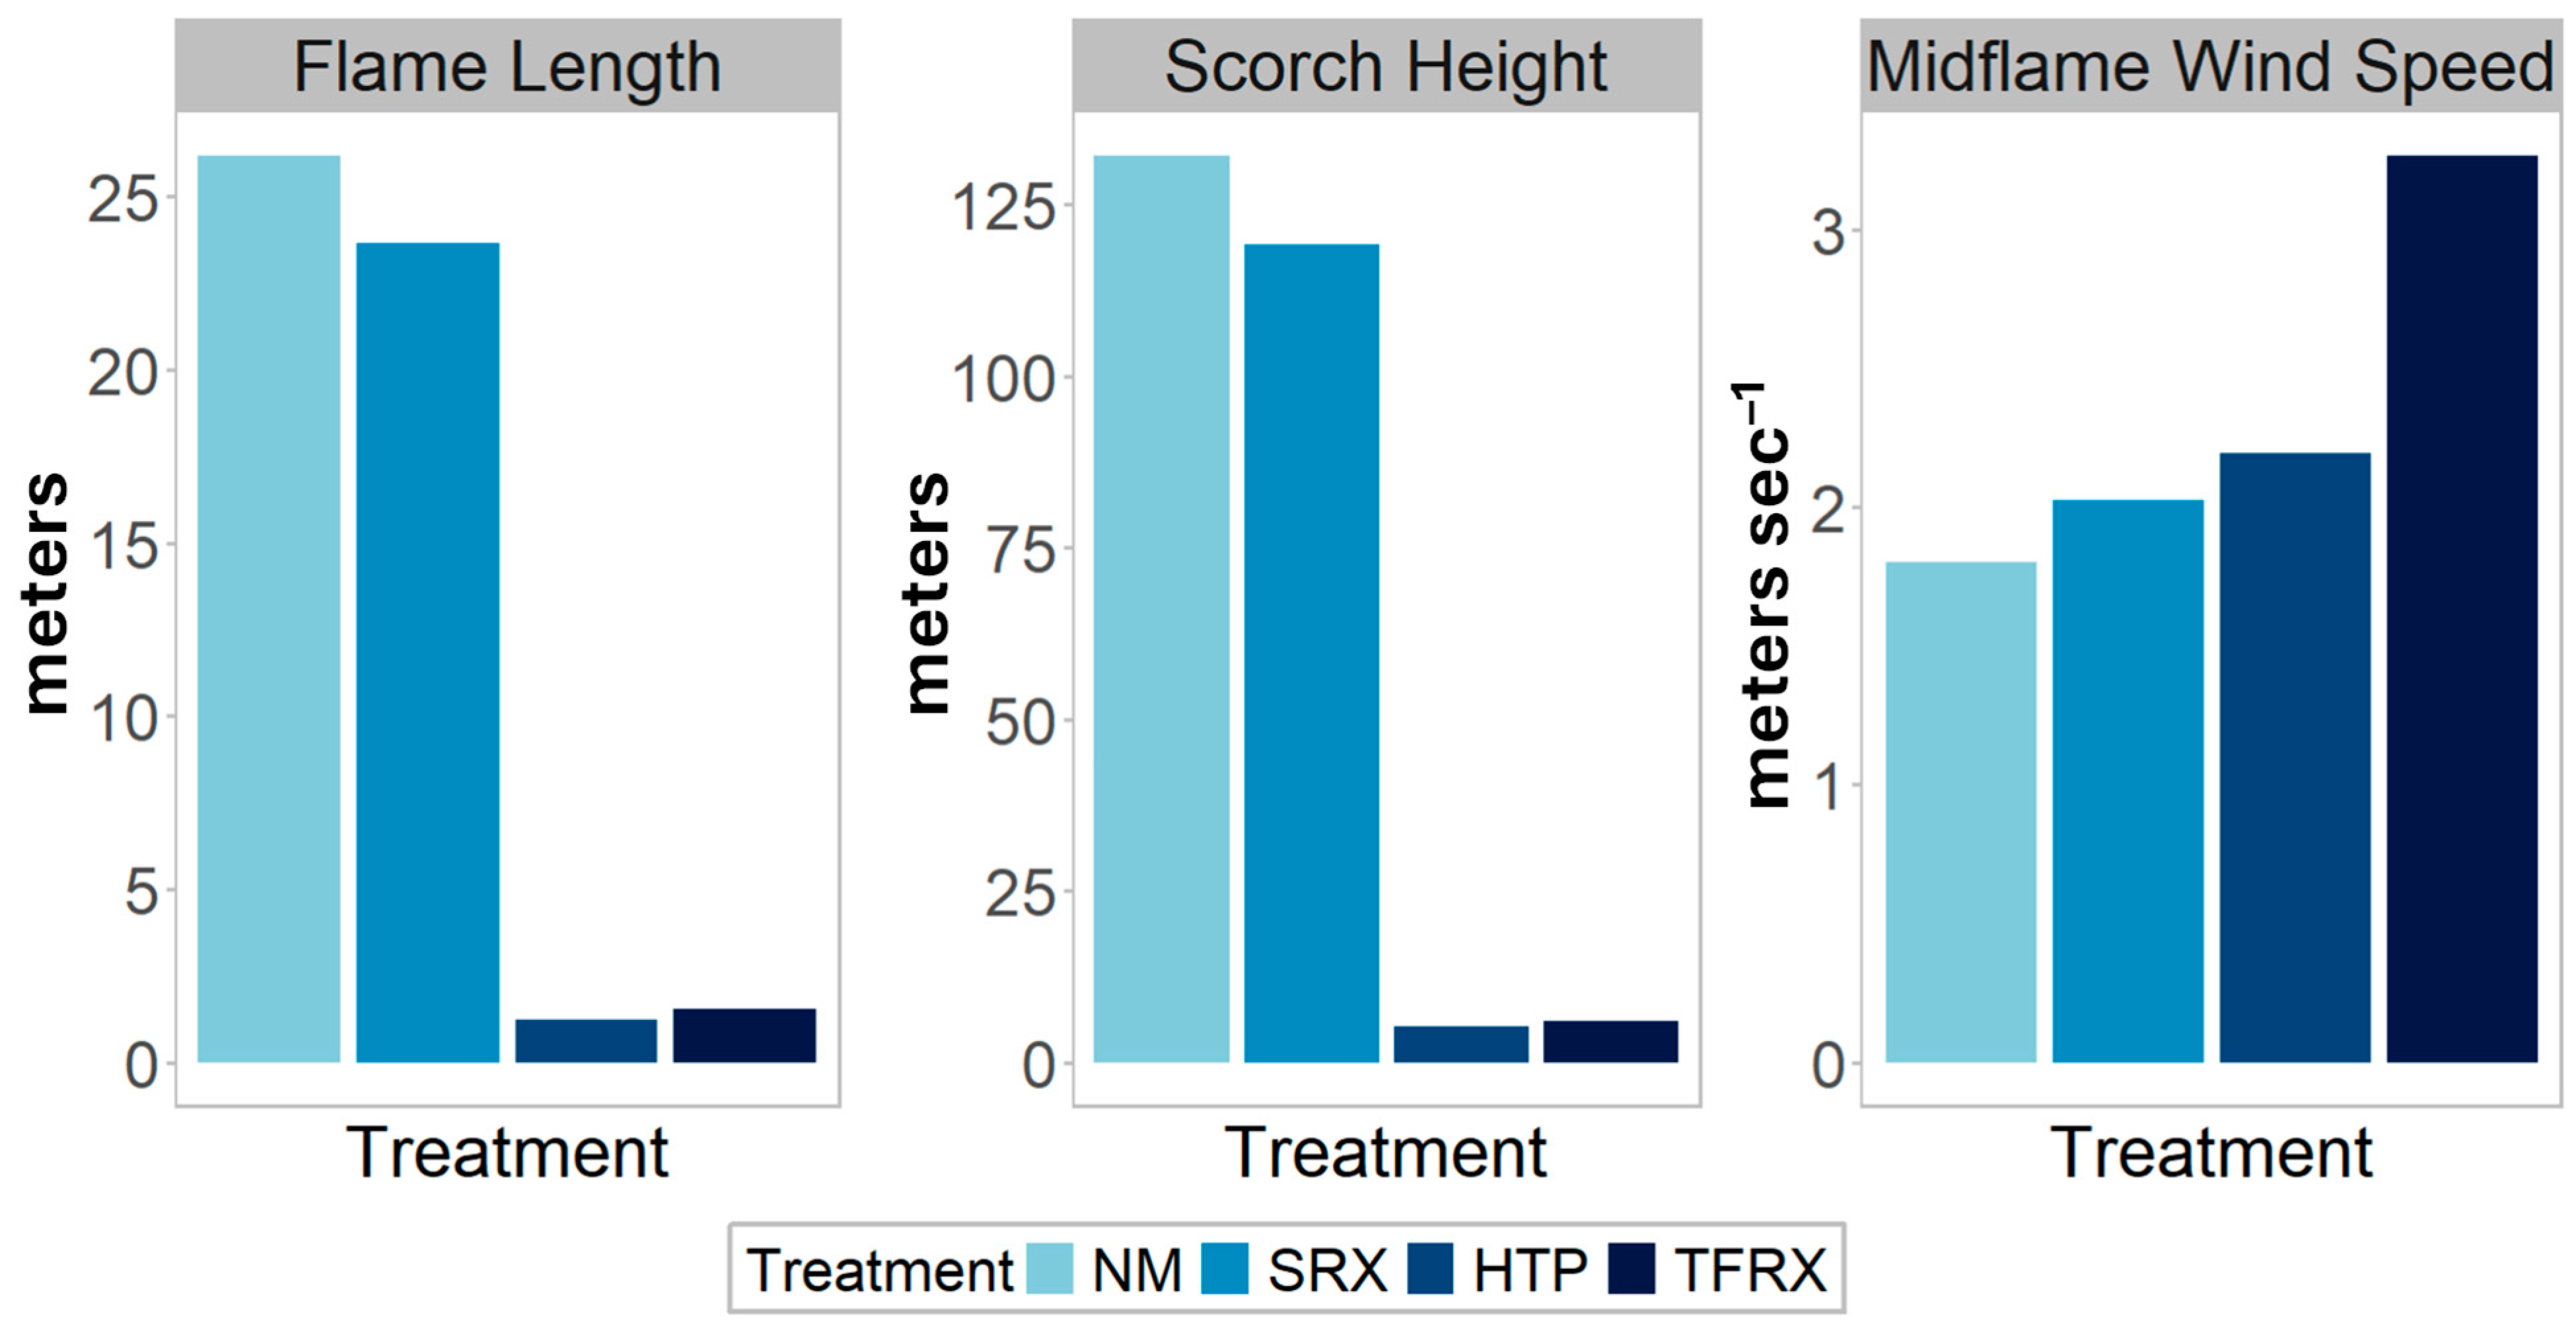
The broad fire types assigned by FVS to our simulated wildfire in each of our management scenarios were “conditional crown fire” in NM and SRX, and “surface fire” in HTP and TFRX. Modeled flame lengths were over 20 m in the two scenarios that resulted in conditional crown fires, while the scenarios that resulted in surface fires had flame lengths of less than 2 m (Figure 7). Scorch height followed a similar pattern, with predicted heights of 120–135 m for the scenarios that resulted in conditional crown fires but less than 6 m in the scenarios that resulted in surface fires (Figure 7). Predicted midflame wind speeds ranged from 3 m sec−1 in the TFRX scenario to 1.8 m sec−1 in the NM scenario (Figure 7).

Figure 7.
Comparison of simulated wildfire behavior characteristics in the four simulated treatment scenarios.
3.5. Carbon and PM2.5 Emissions from Prescribed Fires and Wildfire
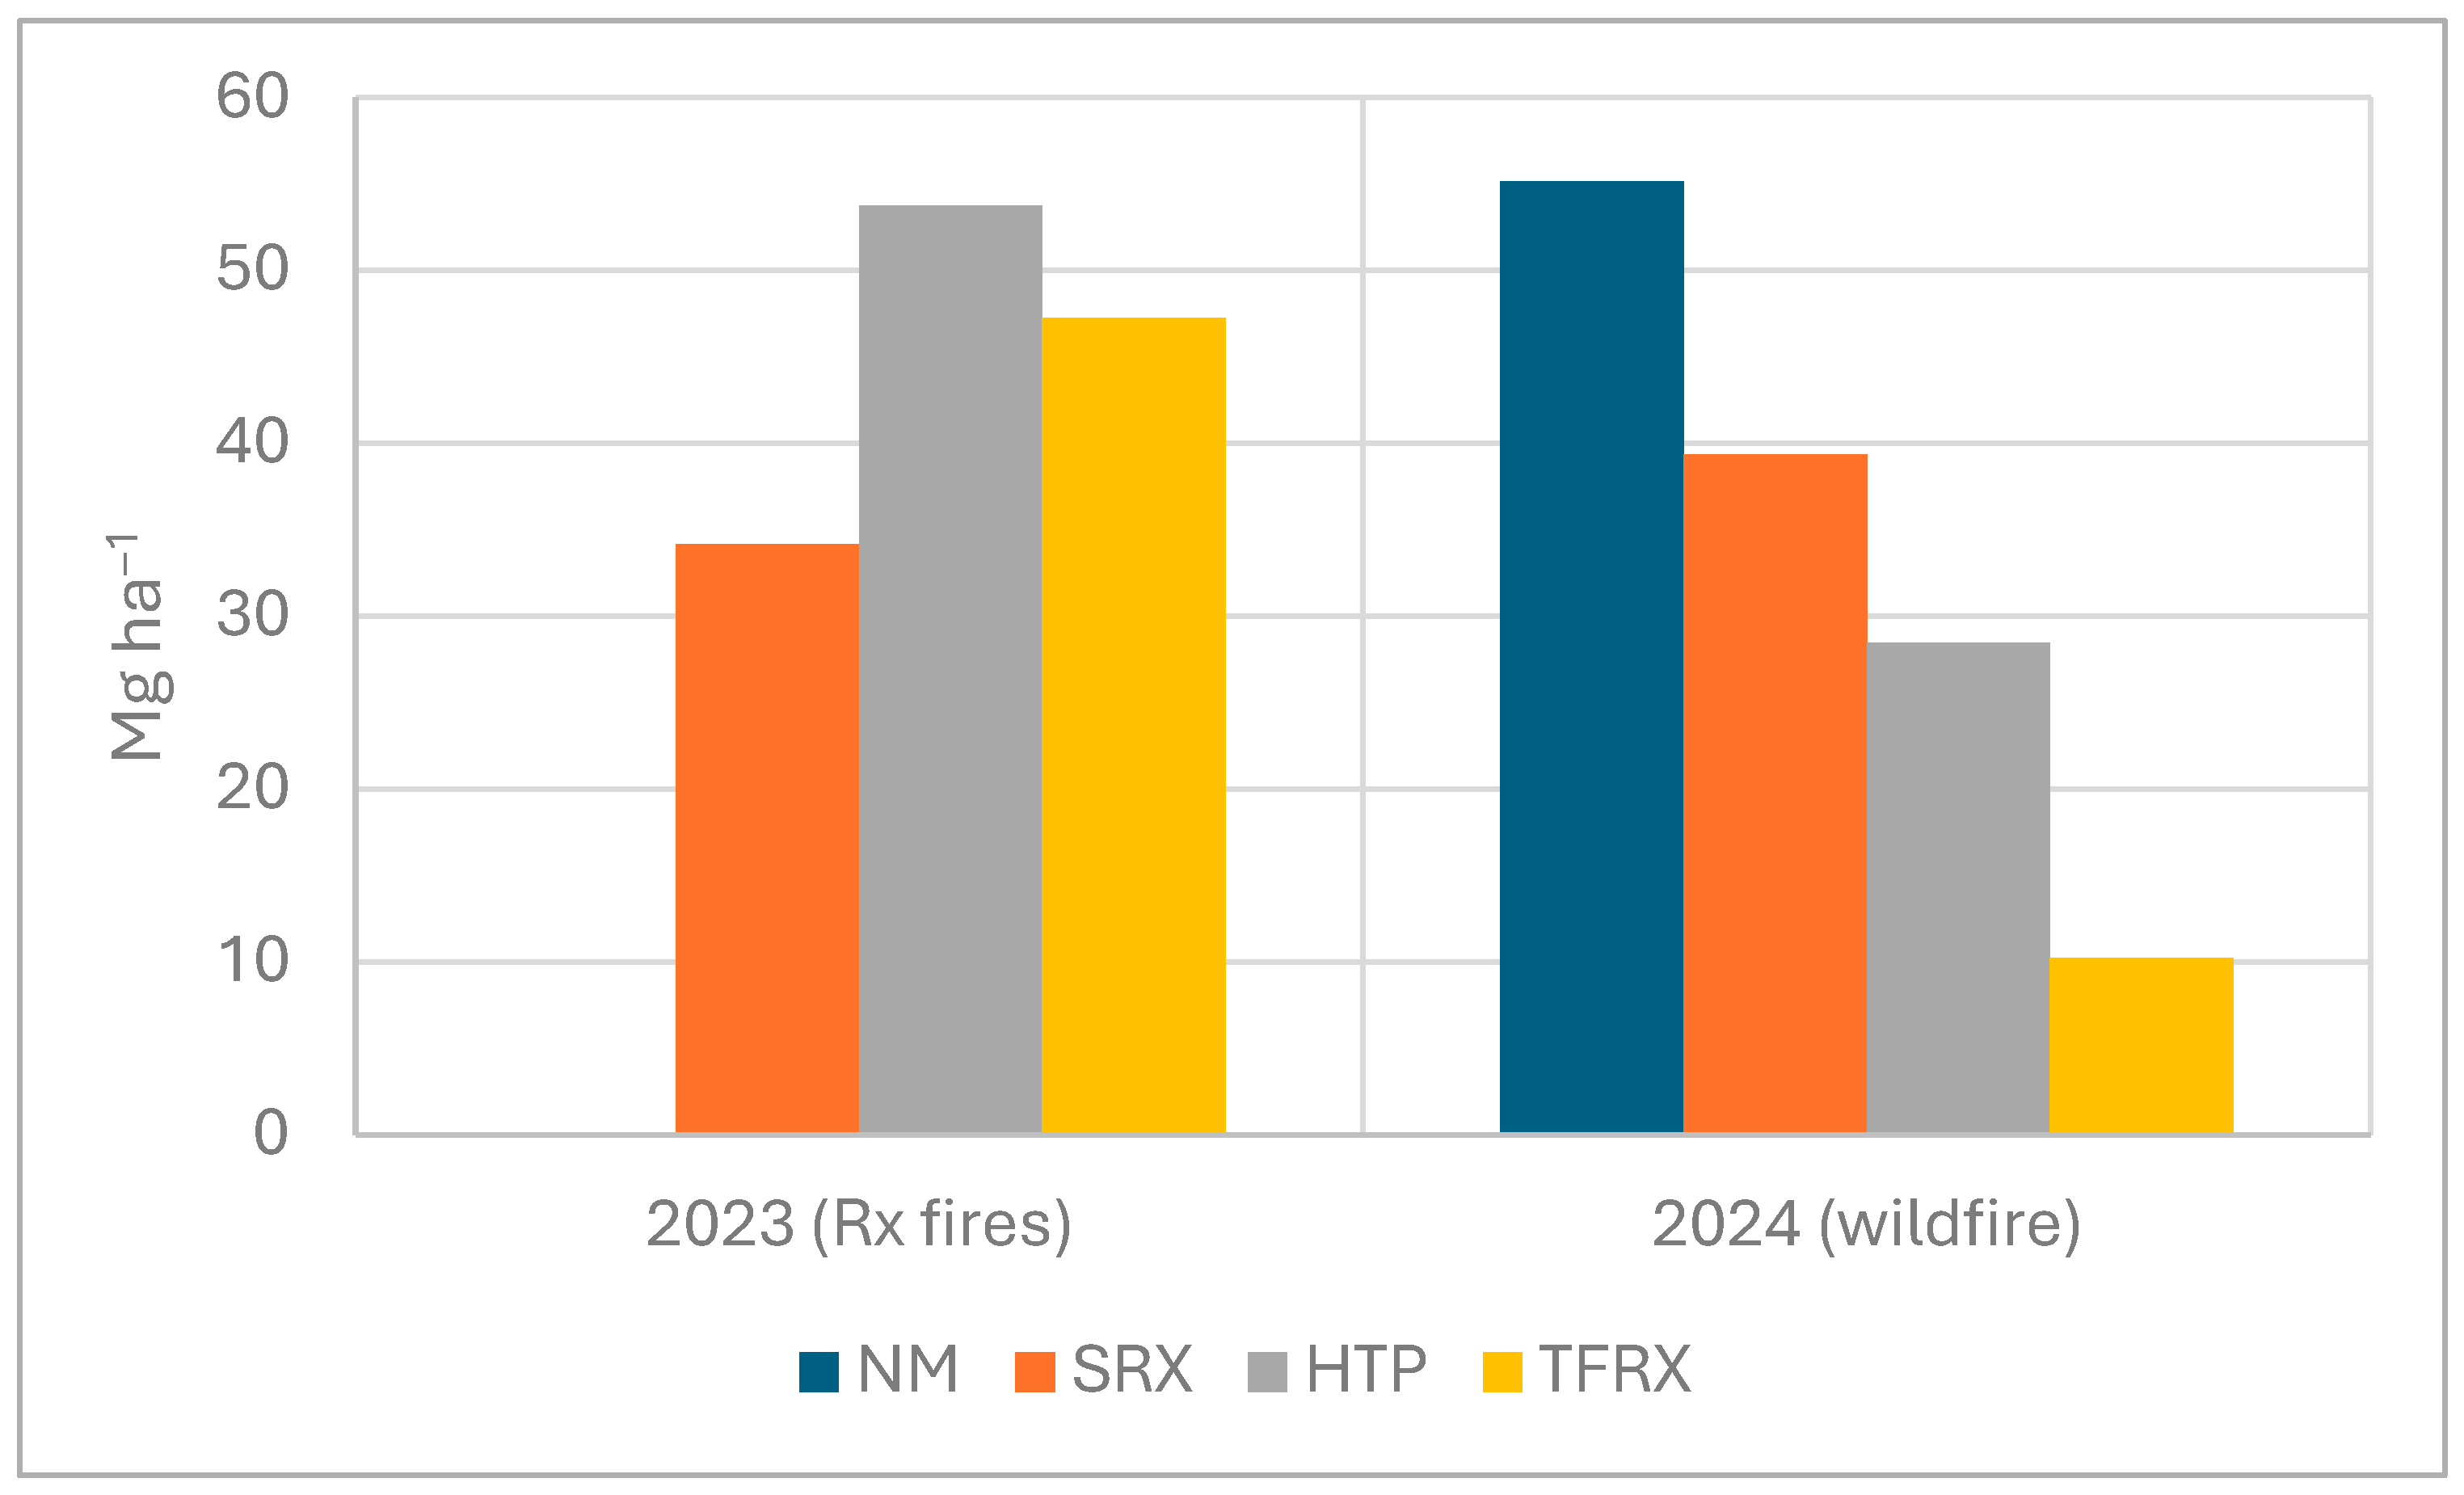
The simulated prescribed fire in the SRX treatment was estimated to release 34.1 Mg ha−1 C (Figure 8) and 0.7 Mg ha−1 PM2.5. The TFRX prescribed fire released 47.2 Mg ha−1 C and 0.9 Mg ha−1 PM2.5. The HTP prescribed fire released 53.7 Mg ha−1 C (Figure 8), but we do not have PM2.5 emissions for this treatment, as FVS only provides that metric for broadcast burns and wildfire. Assuming the same C/PM2.5 ratios as in the other treatments, a rough estimate would be about 1.1 Mg ha−1 of PM2.5 for HTP.
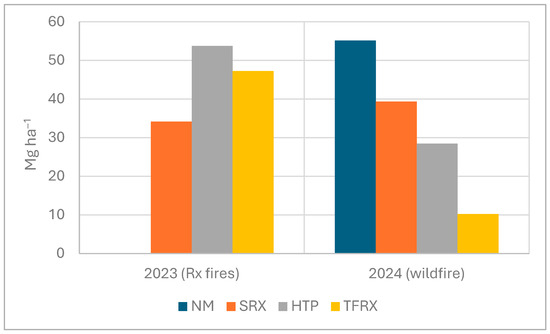
Figure 8.
Estimated carbon release from simulated prescribed fires and pile burning (in HTP) (left), and wildfire (right) in subsequent year.
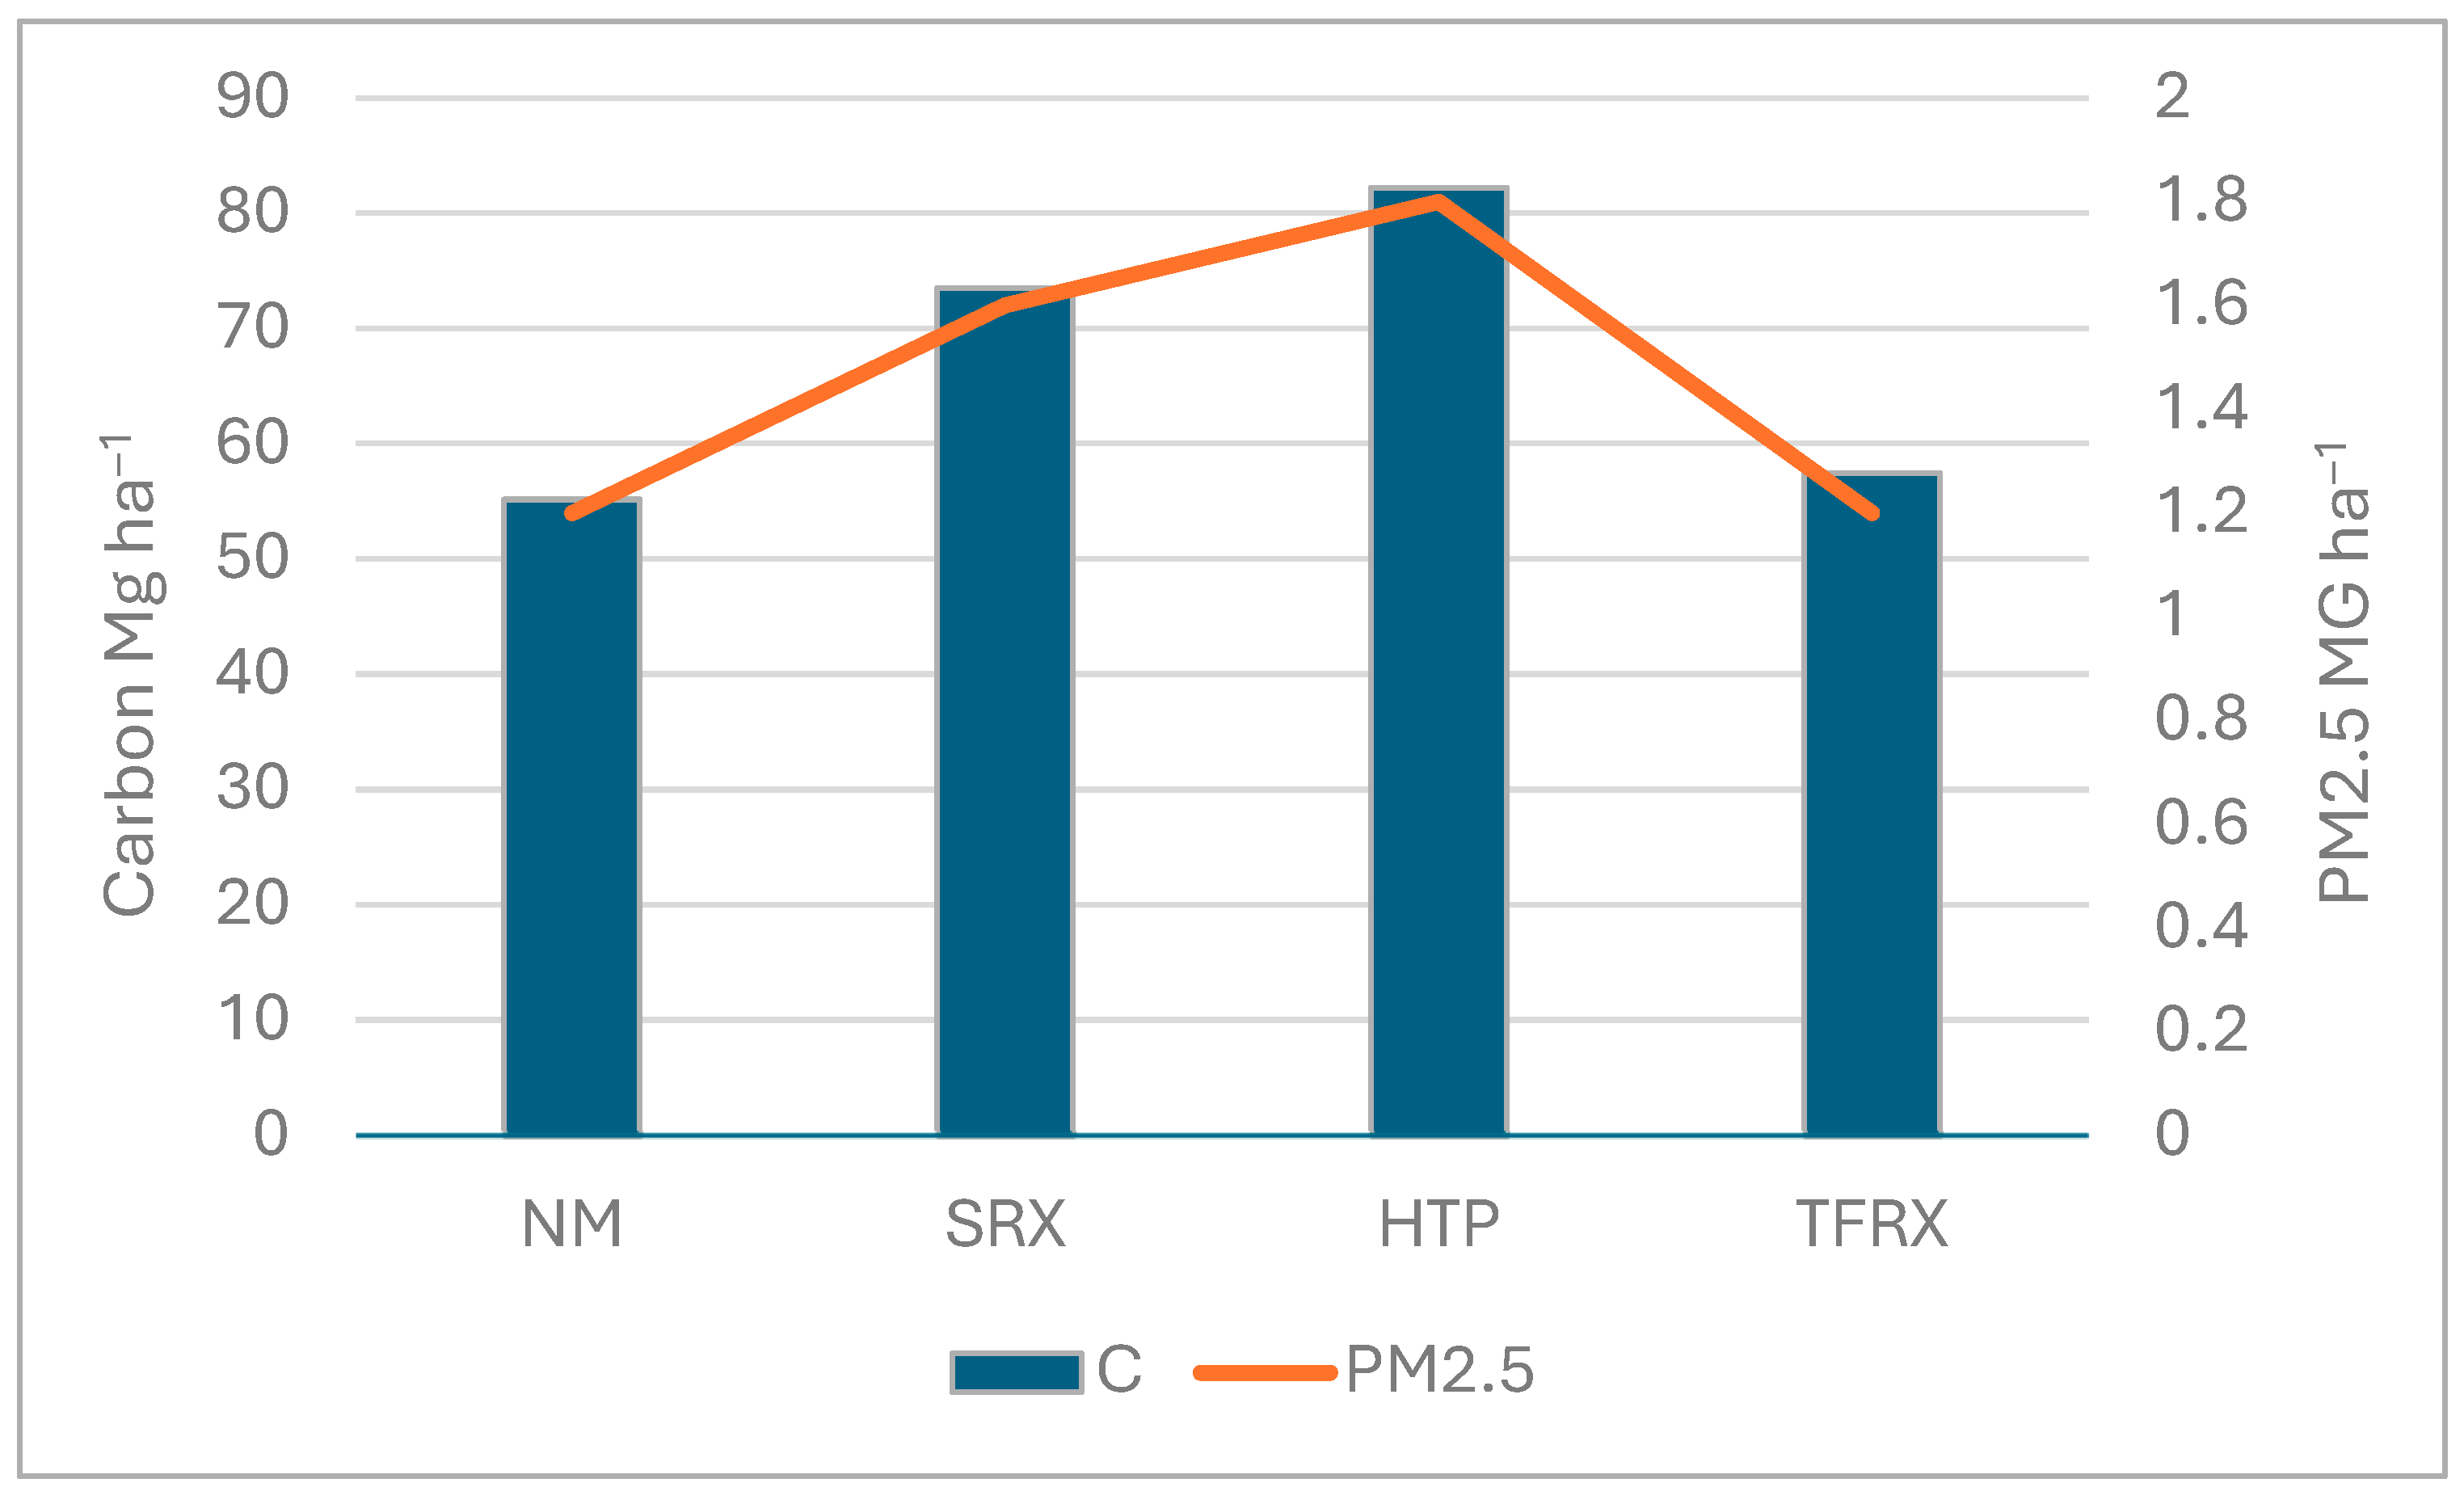
Estimated carbon emissions from the simulated wildfire were highest in the NM scenario at 55.2 Mg ha−1, followed by the SRX treatment at 39.3 Mg ha−1 (Figure 8). The HTP treatment resulted in 28.5 Mg ha−1 carbon released from wildfire, while the TFRX treatment was markedly lower at 10.2 Mg ha−1 (Figure 8). PM2.5 emissions followed a similar pattern with 1.2 Mg ha−1 being released from the wildfire in the NM scenario, 0.9 Mg ha−1 in the SRX scenario, 0.7 Mg ha−1 in the HTP, and 0.3 Mg ha−1 in the TFRX scenario.
Overall C and PM2.5 emissions estimates, combining prescribed fire and wildfire emissions, were lowest for the NM and TFRX scenarios, and highest for the HTP scenario (Figure 9).

Figure 9.
Estimated total carbon and PM2.5 emissions (prescribed fire + wildfire) from the four treatment scenarios.
4. Discussion
Mature and old-growth (MOG) forests are rare and increasingly threatened in seasonally dry forests of the western US [1,4,9]. We simulated wildfire with and without fuel reduction and forest-restoration treatments in an iconic old-growth forest stand in the Sierra Nevada of California and found that extensive overstory mortality is likely under severe fire weather conditions if live and dead fuel loadings are not sufficiently mitigated. Our results support the growing science that recommends serious consideration of active management as an old forest-conservation tool in seasonally dry, fire-prone forest types [4,15,59].
Our results demonstrate that management scenarios that incorporate thinning and controlled burning are most likely to result in restored MOG stand structure (as estimated by NRV), as well as in fuels and forest conditions that are conducive to large-tree survival under fire weather conditions that typify escaped wildfires during the Sierra Nevada summer. Of the four management scenarios we compared, two (no thinning, and the spring prescribed fire with no antecedent thinning) resulted in complete stand mortality from our simulated wildfire, while the other two scenarios (HTP and TFRX) suffered minimal loss of basal area, especially from large trees. The preferential retention of larger, older trees is a major priority in Sierra Nevada forests, and both the TFRX and the HTP treatments were successful in that regard.
However, the HTP and TFRX scenarios differed in some important ways. First of all, the HTP treatment left higher densities of medium-sized trees (30.5–100 cm dbh) in the stand both before and after wildfire. This led to basal areas in HTP being notably above the NRV, and rSDI values that were well into the zone of imminent mortality from density-dependent competition [33]. Although our simulated wildfire left many of these trees alive in the HTP scenario, their elevated presence in the stand under this scenario portends accelerated ladder fuel development in the future, faster surface fuel accumulations, higher levels of competition for water under warming and drying summers, and higher exposure of trees to density-dependent mortality agents like the current Scolytus outbreak that has killed millions of white and red fir across the central and southern Sierra Nevada and is currently killing trees at Emerald Point.
Another important consideration is the role of heavy fuels in fire simulations, or rather, the lack of such a role. Pre-treatment, the mean CWD loadings (i.e., downed fuels >7.62 cm in diameter) at our study site were almost 9× higher than the average YPMC NRV mean values reported in [24] (123 Mg ha−1 vs. 14 Mg ha−1), and more than 5× higher than the average modern YPMC values from the most recent FIA inventory in the Sierra Nevada (23 Mg ha−1; [24]). CWD is ignored by contemporary fire behavior models, which are based on the Rothermel/Albini equations for the rapidly burning, flaming fire front and only consider combustion of 1 to 100 h fuels [60]. As a result, our simulations underestimate the potential effects of wildfire at Emerald Point, as our study site has extreme loading in the CWD fuel class. The principal phenomenon at play is the long duration of burning and sustained high heat output that characterizes combustion in heavy fuels [61]. The Emerald Point site has experienced multiple waves of tree mortality over the last four decades, and, with the slow decomposition rates that typify dry western conifer forests [24,62], the legacies of these mortality events persist as a deepening stack of downed logs and other CWD, currently weighing in at 123 Mg ha−1. Only two of our management scenarios reduced CWD by more than 60% (TFRX and HTP), and the latter of these two left over 35 Mg ha−1 on site after treatment. Under severe wildfire conditions (hot, dry, windy), combustion and smoldering of the heavy fuels in the HTP scenario would probably lead to (potentially much) higher tree mortality than FVS-FFE simulates (see, e.g., [16]).
This concern of course extends to the two less efficacious scenarios (no management and SRX), which both result in predicted 100% mortality even without accounting for very heavy CWD loading. In these cases—as well as in the HTP scenario—other deleterious impacts related to combustion of heavy fuels must also be considered, including effects on soil, smoke emissions, and ash, as well as nutrient inputs into Lake Tahoe. Soil responses to high-intensity burning are of particular concern and include greater loss of organic matter and decreased nutrient availability via volatilization [63], disruption of soil structure, and decreased water infiltration rates [64], fire-induced hydrophobicity of soils through the formation of water-repellent compounds, resulting in further infiltration issues, and increasing surface runoff and erosion [65]. These changes in soil properties not only affect nutrient cycling and water availability, but also influence plant community composition and successional trajectories in postfire environments [66].
Smoke emissions from wildfire are always a cause of public distress and are of particular concern in high-profile, highly visited natural areas such as the Lake Tahoe Basin. Smoldering combustion—which generates notably more particulate emissions than flaming combustion [67]—is more common in fuel types like duff, organic soils, and rotten logs, due to low oxygen availability in these substrates. These fuel types are abundant at Emerald Point—as they are in many long-unburned MOG forests—and our active management scenarios varied widely in their reduction in these fuels, with treatments that failed to remove a majority of both the CWD and the deep layer of duff more likely to result in high smoke (PM2.5) emissions. This is particularly the case with the NM and SRX scenarios, but the HTP treatment was also predicted to produce smoke levels only slightly below SRX, due to the retention of the thick duff layer and insufficient reduction in CWD. Because the initial step of the TFRX treatment greatly reduced large fuels and the subsequent fall-prescribed fire notably thinned the duff layer, this management scenario had the lowest risk of high smoke emissions in a wildfire event. Our active management scenarios each emitted varying levels of smoke during treatment as well, ranging from about 0.7 Mg ha−1 PM2.5 to about 1.1 Mg ha−1. Taking both sources of smoke into account (Figure 9), the clear winner among the efficacious treatment scenarios (efficacious = >0% tree survival) was TFRX, which released a third less carbon and PM2.5 than HTP.
Long-duration burning driven by high CWD loading would likely also increase wind- and runoff-driven ash inputs to the lake. Ash deposition and excessive nutrient loading (especially N and P [68]) in the deposited ash can lead to algal blooms, increased turbidity, and reduced light penetration [69,70], which can impact the growth of aquatic plants, alter habitat availability for fish and invertebrates, and influence overall ecosystem productivity [71].
Tree densities that significantly exceed NRV, as observed at our study site, can exacerbate risks to tree health and lead to increased instances of mortality from various non-wildfire-related factors [72,73,74]. The low tree densities historically found in seasonally dry western forests with high-frequency fire regimes resulted in low levels of inter-tree competition ([33], Figure 2), whereas contemporary fire-prone forests support tree densities that more often fall into the “full competition” and “imminent mortality” categories found in considerations of relative stand density [33,75]. Water stress driven by high competition can cause tree mortality directly [76] or indirectly by increasing susceptibility to other factors, such as beetle and disease outbreaks [77]. Additionally, high tree density itself can elevate the risk of widespread disease and beetle outbreaks [78]. Interactions between tree competition and water stress were shown to be a major driver of the record conifer mortality experienced across the Sierra Nevada between 2012 and 2016 [79], and we infer that both of these factors are among the major causes of mortality in the Emerald Point stand. Decreasing tree density to within NRV—or some other restoration- or resilience-based target—and reducing relative SDI to below the zone of imminent mortality (as our TFRX scenario did) can alleviate these pressures and increase overall forest health and resilience.
The loss of large trees also represents a loss of important habitat for wildlife. MOG forest stands and large trees in general play a crucial role in providing nesting habitat for raptors like osprey (Pandion haliaetus) and bald eagle (Haliaeetus leucocephalus), both of which often nest near the shores of Emerald Bay. At the time of writing, there are no active osprey nests at Emerald Point, although there are many across the bay. However, there is an active bald eagle nest at the top of a very large ponderosa pine that by chance falls in one of our forest inventory plots (plot D-3). This plot supports the highest stem density among all of our plots at Emerald Point Studies, with 79 trees >10 cm but <50 cm dbh sharing the 400 m2 that surround the 158 cm dbh nest tree; this equates to a stem density of 1975 trees ha−1, which does not include the many trees that are <10 cm dbh (Figure 10). In addition, many medium-sized trees have grown up into the canopy of the nest tree, and in the case of fire, the risk of canopy ignition is very high due to fuel laddering. Ironically, a lightning strike in the Emerald Point stand ignited a fire just outside our inventory plot in 2022 but it was fortuitously suppressed before the stand canopy was engaged (Figure 10).
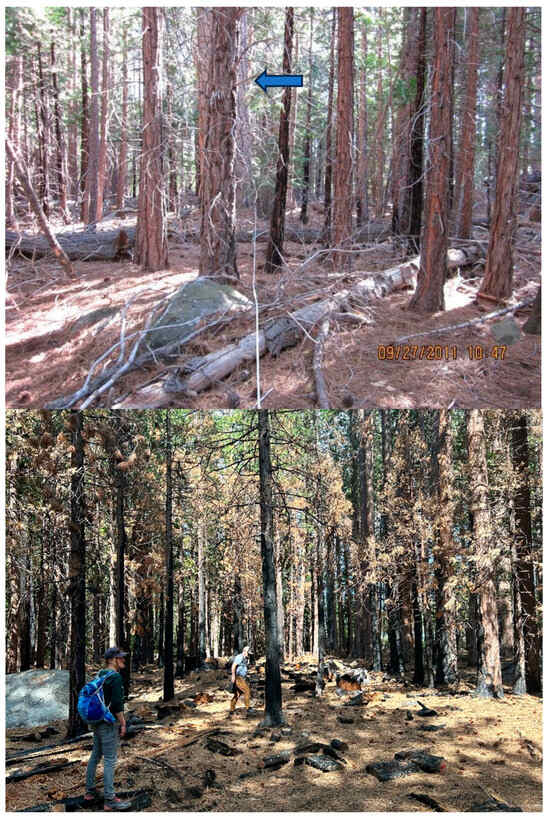
Figure 10.
(Top)—General aspect of our inventory plot D-3, which contains the bald eagle nest at Emerald Point. Photo from the 2011 inventory. Some of the small trees have died in the meantime and the surface fuel loading has increased. The ponderosa pine nest tree is visible just left of center in the background (arrow). (Bottom)—Site of suppressed lighting ignition from 2022, approximately 20 m left of the top photo. Photos by H. Safford.
Numerous studies have highlighted the importance of large, old trees as preferred bald eagle nesting sites due to their structural integrity and elevated canopy positions, which offer enhanced visibility and protection from predators [80,81,82,83]. The combination of old-growth trees and proximity to a large lake makes our study site a unique and important site for bald eagle breeding, as lakes are a major foraging source, and smaller lakes are not as suitable for a primary breeding habitat [84]. Beyond the risk of wildfire eliminating the habitat altogether, a more open forest structure is positively correlated with bald eagle nesting sites, with canopy covers of <40 percent (and often <20 percent) being preferred [81]. At our study site, canopy cover in the forest surrounding plot D-3 averages about 85% currently, although the overall study site average is closer to 50%.
Hesitancy to engage in active management in areas with special interest species is common, but similar hesitancy has previously led to major fire-driven losses of habitat for other MOG-associated species of concern (e.g., spotted owl [4,85,86]; and California fisher [87]). In general, research shows that human disturbance has a minimal effect on the productivity of bald eagles at existing nesting sites [88,89,90,91], but the timing of forest management is important and should be limited to fall and winter when possible [81,92].
Finally, the biodiversity payoffs of carefully conducted thinning and prescribed burning in the Emerald Point old-growth stand could be large. We did not analyze biodiversity patterns in this study, but the stand is currently characterized by a very short plant species list, with only 35 species found across all of our monitoring plots. Beta diversity is very low, and per plot richness is only about nine species, with most of them trees or shrubs. A nearby study in the Angora Fire using the same plot protocol also showed low plant richness in unburned and untreated YPMC forest, but values were higher than at Emerald Point due to lower tree cover and much lower cover and thickness of litter and duff. When the unburned Angora plots were subjected to thinning, mean plant species richness rose by an average of almost 50%, and beta diversity among plots also rose significantly [93]. In the same study, low- and moderate-severity burning in the Angora Fire also increased plant species richness. Ref. [94] demonstrated analogous results across a set of eight Sierra Nevada wildfires, where low- and moderate-severity burning increased plant species richness by up to 40% compared to unburned forest areas (and by up to 25% compared to severely burned areas). Increasing structural heterogeneity in the Emerald Point stand would also be likely to increase bird and small mammal diversity, especially if low to moderate-severity burning is included as part of the treatment plan (e.g., [95,96].
5. Conclusions
Our results strongly support the urgency of proactively managing the most important old-growth forest stand in the Lake Tahoe Basin, in order to protect an extraordinary place and the ecological values it sustains. Our modeling results and considerations of heavy fuel loadings, ongoing stand mortality, and likely environmental impacts of wildfire highlight the importance of accomplishing significant restorative fuel reduction in the near future. These same considerations, combined with what we know about, e.g., plant and animal diversity and bald eagle life history, suggest that a treatment which moves stand conditions to within or near the natural range of variation (like our TFRX scenario) or some other resilience-based target is most likely to be successful, which we define as a notable reduction in fire and drought risk, as well as a restorative reduction in the ecological sense. We suggest that management follow a staged calendar, with perhaps 1/3 of the stand treated at a time, so as to permit monitoring and learning, as well as both social and ecological accommodation to the new stand conditions. We are confident that the end results will be a more heterogeneous, more fire- and drought-resilient, and more biodiverse old-growth stand, and one that is likely to continue to support ancient trees and inspire people for generations to come. We recommend that similar analyses and management considerations be applied to other seasonally dry MOG forests in the North American West.
6. Epilogue
As we were putting the finishing touches on this manuscript, we learned of severe burning in the famous Beaver Creek Pinery (BCP), in the Lassen National Forest’s Ishi Wilderness. BCP was probably the largest MOG forest stand on California’s Sierra Nevada-Cascade Range west-slope that continued to support NRV-similar forest structures (relatively open canopy, relatively low tree densities, high structural heterogeneity, pine and oak dominated), even after a century of fire exclusion [97,98]. This was mostly because the site had never been logged, and a handful of wildfires had escaped control and been able to reach the site through the 20th century, most notably in 1990 and 1994. BCP has served as an important reference site for forest-restoration planning in northern California [24]. Fire modeling carried out on modern forest plot data from 2016 suggested that most of the BCP was “wildfire resilient” [98], but the weather conditions that characterized the giant Park Fire in late July 2024 were extreme (20–40 km h−1 winds, 38° temperatures, 3% 10-h fuel moistures), and postfire high-resolution aerial photos of the site indicate that at least 60% of the Pinery experienced stand-replacing fire. Because of the ecological and scientific importance of the BCP, pressure had been building on the Forest Service to develop a fuel-reduction/restoration plan for the site that included prescribed fire and potentially managed wildfire, but under the weight of many competing priorities, the project never came to fruition.
Author Contributions
Conceptualization, H.S. and J.W.; methodology, J.W., B.N., H.S. and S.B.; analysis, J.W. and H.S.; writing—original draft preparation, J.W., H.S. and B.N.; writing—review and editing, H.S. and S.B.; supervision, H.S. and S.B.; project administration, H.S.; funding acquisition, H.S. All authors have read and agreed to the published version of the manuscript.
Funding
Field research was supported by internal funding at the University of California-Davis and the USDA Forest Service Pacific Southwest Region. Analysis was partially funded by the California Department of Forestry and Fire Protection (CalFire), through agreement 3540-8CA06198 to Safford.
Institutional Review Board Statement
Not applicable.
Informed Consent Statement
Not applicable.
Data Availability Statement
The datasets used and/or analyzed during the current study are available from the corresponding author on reasonable request.
Acknowledgments
Our 2017 field data collection was conducted under permit 7-2017 from California State Parks, Sierra District. We thank Dan Shaw, Rich Adams, and Sveta Yegorova for their help in procuring the permit, approving field protocols, and consulting on forest-management scenarios for our simulations. We thank Katharyn Duffy (Vibrant Planet and Northern Arizona University) for her review of our FVS modeling and reporting, and Zeke Lunder (Deer Creek Resources and The Lookout) and Eric Knapp (US Forest Service, Pacific Southwest Research Station) for sharing information on and aerial photos of the Beaver Creek Pinery.
Conflicts of Interest
The authors declare no conflicts of interest.
References
- Franklin, J.F.; Fites-Kaufman, J. Assessment of late-successional forests of the Sierra Nevada. In Sierra Nevada Ecosystem Report. Final Report to Congress. Volume II. Assessments and Scientific Basis for Management Options; Center for Water and Wildland Resources, University of California: Davis, CA, USA, 1996; pp. 627–656. [Google Scholar]
- Moore, K.D. In the Shadow of the Cedars: The Spiritual Values of Old-Growth Forests. Conserv. Biol. 2007, 21, 1120–1123. [Google Scholar] [CrossRef] [PubMed]
- Spies, T.A.; Duncan, S.L. Old-Growth in a New World: A Pacific Northwest Reexamination; Island Press: Washington, DC, USA, 2009. [Google Scholar]
- Steel, Z.L.; Jones, G.M.; Collins, B.M.; Green, R.; Koltunov, A.; Purcell, K.L.; Sawyer, S.C.; Slaton, M.R.; Stephens, S.L.; Stine, P.; et al. Mega-disturbances cause rapid decline of mature conifer forest habitat in California. Ecol. Appl. 2022, 33, e2763. [Google Scholar] [CrossRef]
- USDA. Northwest Forest Plan. Record of Decision. USDA Forest Service, Pacific Northwest and Southwest Regions. 1994. Available online: www.fs.usda.gov/Internet/FSE_DOCUMENTS/stelprd3843201.pdf (accessed on 30 December 2024).
- USDA. Sierra Nevada Forest Plan Amendment. Record of Decision; USDA Forest Service, Pacific Southwest Region: Vallejo, CA, USA, 2001. [Google Scholar]
- Beesley, D. Reconstructing the landscape: An environmental history, 1820–1960. In Sierra Nevada Ecosystem Report. Final Report to Congress. Volume II. Assessments and Scientific Basis for Management Options; Center for Water and Wildland Resources, University of California: Davis, CA, USA, 1996; pp. 1–24. [Google Scholar]
- Barbour, M.G.; Pavlik, B.; Drysdale, F.; Lindstrom, S. California’s Changing Landscapes: Diversity and Conservation of California Vegetation; California Native Plant Society: Sacramento, CA, USA, 1993. [Google Scholar]
- Spies, T.A.; Hemstrom, M.A.; Youngblood, A.; Hummel, S. Conserving old-growth forest diversity in disturbance-prone landscapes. Conserv. Biol. 2006, 20, 351–362. [Google Scholar] [CrossRef]
- Kolb, T.E.; Agee, J.K.; Fulé, P.Z.; McDowell, N.G.; Pearson, K.; Sala, A.; Waring, R.H. Perpetuating old ponderosa pine. For. Ecol. Manag. 2007, 249, 141–157. [Google Scholar] [CrossRef]
- North, M.P.; Stephens, S.L.; Collins, B.M.; Agee, J.K.; Aplet, G.; Franklin, J.F.; Fulé, P.Z. Reform forest fire management. Science 2015, 349, 1280–1281. [Google Scholar] [CrossRef] [PubMed]
- Stephens, S.L.; Moghaddas, J.J.; Edminster, C.; Fiedler, C.E.; Haase, S.S.; Harrington, M.; Keeley, J.E.; Knapp, E.E.; McIver, J.D.; Metlen, K.; et al. Fire treatment effects on vegetation structure, fuels, and potential fire severity in western US forests. Ecol. Appl. 2009, 19, 305–320. [Google Scholar] [CrossRef] [PubMed]
- Schwilk, D.W.; Keeley, J.E.; Knapp, E.E.; McIver, J.; Bailey, J.D.; Fettig, C.J.; Fiedler, C.E.; Harrod, R.J.; Moghaddas, J.J.; Outcalt, K.W.; et al. The national fire and fire surrogate study: Effects of fuel reduction methods on forest vegetation structure and fuels. Ecol. Appl. 2009, 19, 285–304. [Google Scholar] [CrossRef] [PubMed]
- North, M.P.; Collins, B.M.; Safford, H.D.; Stephenson, N.L. Montane forests. In Ecosystems of California; Mooney, H.A., Zavaleta, E., Eds.; University of California Press: Berkeley, CA, USA, 2016; pp. 553–577. [Google Scholar]
- Hessburg, P.F.; Prichard, S.J.; Hagmann, R.K.; Povak, N.A.; Lake, F.K. Wildfire and climate change adaptation of western North American forests: A case for intentional management. Ecol. Appl. 2021, 31, e02432. [Google Scholar] [CrossRef] [PubMed]
- Stephens, S.L.; Bernal, A.A.; Collins, B.M.; Finney, M.A.; Lautenberger, C.; Saah, D. Mass fire behavior created by extensive tree mortality and high tree density not predicted by operational fire behavior models in the southern Sierra Nevada. For. Ecol. Manag. 2022, 518, 120258. [Google Scholar] [CrossRef]
- Agee, J.K. Fire Ecology of Pacific Northwest Forests; Island Press: Washington, DC, USA, 1993. [Google Scholar]
- Keeley, J.E.; Safford, H.D. Fire as an ecosystem process. In Ecosystems of California; Mooney, H.A., Zavaleta, E., Eds.; University of California Press: Berkeley, CA, USA, 2016; pp. 27–45. [Google Scholar]
- Noss, R.F.; Franklin, J.F.; Baker, W.L.; Schoennagel, T.; Moyle, P.B. Managing fire-prone forests in the western United States. Front. Ecol. Environ. 2006, 4, 481–487. [Google Scholar] [CrossRef]
- Steel, Z.L.; Safford, H.D.; Viers, J.H. The fire frequency-severity relationship and the legacy of fire suppression in California forests. Ecosphere 2015, 6, 1–23. [Google Scholar] [CrossRef]
- van Wagtendonk, J.W.; Sugihara, N.G.; Stephens, S.L.; Thode, A.E.; Shaffer, K.E.; Fites-Kaufman, J.J. (Eds.) Fire in California’s Ecosystems; University of California Press: Berkeley, CA, USA, 2018. [Google Scholar]
- Safford, H.D.; Van de Water, K.M. Using Fire Return Interval Departure (FRID) Analysis to Map Spatial and Temporal Changes in Fire Frequency on National Forest Lands in California; Research Paper PSW-RP-266; USDA Forest Service, Pacific Southwest Research Station: Albany, CA, USA, 2014. [Google Scholar]
- Parks, S.A.; Miller, C.; Parisien, M.A.; Holsinger, L.M.; Dobrowski, S.Z.; Abatzoglou, J. Wildland fire deficit and surplus in the western United States, 1984–2012. Ecosphere 2015, 6, 275. [Google Scholar] [CrossRef]
- Safford, H.D.; Stevens, J.T. Natural Range of Variation (NRV) for Yellow Pine and Mixed Conifer Forests in the Sierra Nevada, Southern Cascades, and Modoc and Inyo National Forests, California, USA; General Technical Report PSW-GTR-256; USDA Forest Service, Pacific Southwest Research Station: Albany, CA, USA, 2017. [Google Scholar]
- Hagmann, R.K.; Hessburg, P.F.; Prichard, S.J.; Povak, N.A.; Brown, P.M.; Fule, P.Z.; Keane, R.E.; Knapp, E.E.; Lydersen, J.M.; Metlen, K.L.; et al. Evidence for widespread changes in the structure, composition, and fire regimes of western North American forests. Ecol. Appl. 2021, 31, e02431. [Google Scholar] [CrossRef]
- Abatzoglou, J.T.; Juang, C.S.; Williams, A.P.; Kolden, C.A.; Westerling, A.L. Increasing synchronous fire danger in forests of the western United States. Geophys. Res. Lett. 2021, 48, e2020GL091377. [Google Scholar] [CrossRef]
- Biswell, H.H. Prescribed Burning in California Wildlands Vegetation Management; University of California Press: Berkeley, CA, USA, 1989. [Google Scholar] [CrossRef]
- Birdsey, R.; Pregitzer, K.; Lucier, A. Forest carbon management in the United States: 1600–2100. J. Environ. Qual. 2006, 35, 1461–1469. [Google Scholar] [CrossRef] [PubMed]
- North, M.P.; Stine, P.; O’Hara, K.; Zielinski, W.J.; Stephens, S.L. An Ecosystem Management Strategy for Sierran Mixed-Conifer Forests; General Technical Report PSW-GTR-220; USDA Forest Service, Pacific Southwest Research Station: Albany, CA, USA, 2009. [Google Scholar]
- Covington, W.W.; Moore, M.M. Postsettlement changes in natural fire regimes and forest structure: Ecological restoration of old-growth ponderosa pine forests. J. Sustain. For. 1994, 2, 153–181. [Google Scholar] [CrossRef]
- Merschel, A.; Vora, R.S.; Spies, T. Conserving dry old-growth forest in Central Oregon, USA. J. For. 2019, 117, 128–135. [Google Scholar] [CrossRef]
- Hessburg, P.F.; Charnley, S.; Wendel, K.; White, E.M.; Singleton, P.H.; Peterson, D.W.; Halofsky, J.E.; Gray, A.N.; Spies, T.A.; Flitcrof, R.L.; et al. The 1994 Eastside Screens Large-Tree Harvest Limit: Review of Science Relevant to Forest Planning 25 Years Later; General Technical Report PNW-GTR-990; USDA Forest Service: Portland, OR, USA, 2020. [Google Scholar]
- North, M.P.; Tompkins, R.E.; Bernal, A.A.; Collins, B.M.; Stephens, S.L.; York, R.A. Operational resilience in western US frequent-fire forests. For. Ecol. Manag. 2022, 507, 120004. [Google Scholar] [CrossRef]
- Barbour, M.; Kelley, E.; Maloney, P.; Rizzo, D.; Royce, E.; Fites-Kaufmann, J. Present and past old-growth forests of the Lake Tahoe Basin, Sierra Nevada, US. J. Veg. Sci. 2002, 13, 461–472. [Google Scholar] [CrossRef]
- Taylor, A.H. Identifying forest reference conditions on early cut-over lands, Lake Tahoe Basin, USA. Ecol. Appl. 2004, 14, 1903–1920. [Google Scholar] [CrossRef]
- Maxwell, R.S.; Taylor, A.H.; Skinner, C.; Safford, H.D.; Isaacs, R.; Airey, C.; Young, A. Landscape scale modeling of reference period forest conditions and fire behavior on heavily-logged lands. Ecosphere 2014, 5, 32. [Google Scholar] [CrossRef]
- Thorne, J.H.; Safford, H.D.; Boynton, R.; Stewart, J.; Lindström, S. Forests and climate change in the Lake Tahoe Basin. In Ecosystem Resilience, Climate Change, and Environmental Management in the Tahoe Basin; Coats, B., Ed.; University of Nevada Press: Reno, NV, USA, 2025. [Google Scholar]
- USDA. Lake Tahoe Basin Management Unit Management Plan, Record of Decision; US Department of Agriculture, Forest Service: Vallejo, CA, USA, 2016. [Google Scholar]
- TRPA. TRPA Threshold Standards and Regional Plan; Tahoe Regional Planning Agency: Stateline, NV, USA, 2021. [Google Scholar]
- Williams, J.N.; Safford, H.D.; Steel, Z.L.; Paulson, A.K.; Enstice, N. High severity burn area and proportion exceed historic conditions in forests of Sierra Nevada and adjacent ranges (USA). Ecosphere 2023, 14, e4397. [Google Scholar] [CrossRef]
- Dickinson, M.B.; Johnson, E.A. Fire effects on trees. Chapter 14. In Forest Fires: Behaviour and Ecological Effects; Johnson, E.A., Miyanishi, K., Eds.; Academic Press: New York, NY, USA, 2001. [Google Scholar]
- Michaletz, S.E.; Johnson, E.A. A biophysical process model of tree mortality in surface fires. Can. J. For. Res. 2008, 38, 2013–2029. [Google Scholar] [CrossRef]
- WRCC (Western Regional Climate Center). RAWS USA Climate Archive. 2024. Available online: https://wrcc.dri.edu/cgi-bin/rawMAIN.pl?caCBRN (accessed on 17 May 2024).
- Schweickert, R.A.; Moore, J.G.; Lahren, M.M.; Kortemeier, W.; Kitts, C.; Adamek, T. The Tahoe-Sierra frontal fault zone, Emerald Bay area, Lake Tahoe, California: History, displacements, and rates. Geosphere 2019, 15, 783–819. [Google Scholar] [CrossRef]
- CSRL. Soilweb. California Soil Resources Lab, University of California-Davis and UC-Division of Agriculture and Natural Resources. 2024. Available online: https://casoilresource.lawr.ucdavis.edu/gmap/ (accessed on 17 May 2024).
- Beaty, R.M.; Taylor, A.H. Fire disturbance and forest structure in old-growth mixed conifer forests in the northern Sierra Nevada, California. J. Veg. Sci. 2007, 18, 879–890. [Google Scholar]
- USDA. Forest Service Region 5 Common Stand Exam Field Guide. US Department of Agriculture, Forest Service, Vallejo, California. 2012. Available online: https://www.fs.usda.gov/nrm/fsveg/index.shtml (accessed on 30 December 2024).
- Safford, H.D.; Stevens, J.T.; Merriam, K.; Meyer, M.D.; Latimer, A.M. Fuel treatment effectiveness in California yellow pine and mixed conifer forests. For. Ecol. Manag. 2012, 274, 17–28. [Google Scholar] [CrossRef]
- Carlson, C.H.; Dobrowksi, S.Z.; Safford, H.D. Variation in tree mortality and regeneration affect forest carbon recovery following fuel treatments and wildfire in the Lake Tahoe Basin, California, USA. Carbon Balance Manag. 2012, 7, 7. [Google Scholar] [CrossRef]
- Brown, J.K. Handbook for Inventorying Surface Fuels and Biomass in the Interior West; US Department of Agriculture, Forest Service, Intermountain Forest and Range Experiment Station: Ogden, UT, USA, 1982; Volume 129. [Google Scholar]
- Rebain, S.A. The Fire and Fuels Extension to the Forest Vegetation Simulator: Updated Model Documentation; USDA Forest Service, Forest Management Service Center: Fort Collins, CO, USA, 2022. [Google Scholar]
- Hummel, S.; Kennedy, M.; Steel, E.A. Assessing forest vegetation and fire simulation model performance after the Cold Springs wildfire, Washington USA. For. Ecol. Manag. 2013, 287, 40–52. [Google Scholar] [CrossRef]
- Ghilardi, C.R.; Knapp, B.O.; He, H.S.; Larsen, S.R.; Kabrick, J.M. Evaluation of the Fire and Fuels Extension to the Forest Vegetation Simulator within the Missouri Ozarks. In Proceedings of the 2017 Forest Vegetation Simulator (FVS) e-Conference, virtual, 28 February–2 March 2017; e-General Technical Report SRS-224. Keyser, C.E., Keyser, T.L., Eds.; USDA Forest Service, Southern Research Station: Asheville, NC, USA, 2017; pp. 94–97. [Google Scholar]
- Barker, J.S.; Fried, J.S.; Gray, A.N. Evaluating model predictions of fire-induced tree mortality using wildfire-affected forest inventory measurements. Forests 2019, 10, 958. [Google Scholar] [CrossRef]
- Young, D.; Meyer, M.D.; Estes, B.E.; Gross, S.E.; Wuenschel, A.; Restaino, C.M.; Safford, H.D. Forest recovery following extreme drought in California, USA: Natural patterns and effects of pre-drought management. Ecol. Appl. 2020, 30, e02002. [Google Scholar] [CrossRef]
- Scott, J.H.; Burgan, R.E. Standard Fire Behavior Fuel Models: A Comprehensive Set for Use with Rothermel’s Surface Fire Spread Model; Gen. Tech. Rep. RMRS-GTR-153; USDA Forest Service, Rocky Mountain Research Station: Ft. Collins, CO, USA, 2005. [Google Scholar]
- NFDRS. Pocket Card for Lake Tahoe Basin. National Fire Danger Rating System. 2022. Available online: https://wildfireweb-prod-media-bucket.s3.us-gov-west-1.amazonaws.com/2022-11/2022_CA_TMU_ERC_FMY.pdf (accessed on 30 December 2024).
- Curtis, R.O.; Marshall, D.D. Technical note: Why quadratic mean diameter? West. J. Appl. For. 2000, 15, 137–139. [Google Scholar] [CrossRef]
- Jones, G.M.; Stanley, C.K.; Peery, M.Z.; Maxwell, C.; Wilson, K.N. Accelerated forest restoration may benefit spotted owls through landscape complementation. Anim. Conserv. 2024, volume, pages. [Google Scholar] [CrossRef]
- Rothermel, R.C. How to Predict the Spread and Intensity of Forest and Range Fires; General Technical Report INT-GTR-143; USDA Forest Service, Intermountain Forest and Range Experiment Station: Ogden, UT, USA, 1983. [Google Scholar]
- Stephens, S.L.; Collins, B.M.; Fettig, C.J.; Finney, M.A.; Hoffman, C.M.; Knapp, E.E.; North, M.P.; Safford, H.D.; Wayman, R.B. Drought, tree mortality, and wildfire in forests adapted to frequent fire. BioScience 2018, 68, 77–88. [Google Scholar] [CrossRef]
- Harmon, M.E.; Franklin, J.F.; Swanson, F.J.; Sollins, P.; Gregory, S.V.; Lattin, J.D.; Anderson, N.H.; Cline, S.P.; Aumen, N.G.; Sedell, J.R.; et al. Ecology of coarse woody debris in temperate ecosystems. Adv. Ecol. Res. 1986, 15, 133–302. [Google Scholar]
- Certini, G. Effects of fire on properties of forest soils: A review. Oecologia 2005, 143, 1–10. [Google Scholar] [CrossRef] [PubMed]
- Imeson, A.C.; Verstraten, J.M.; van Mulligen, E.J.; Sevink, J. The effects of fire and water repellency on infiltration and runoff under Mediterranean type forest. Catena 1992, 19, 345–361. [Google Scholar] [CrossRef]
- Shakesby, R.; Doerr, S. Wildfire as a hydrological and geomorphological agent. Earth-Sci. Rev. 2006, 74, 269–307. [Google Scholar] [CrossRef]
- Pausas, J.G.; Keeley, J.E. Evolutionary ecology of resprouting and seeding in fire-prone ecosystems. New Phytol. 2014, 204, 55–65. [Google Scholar] [CrossRef] [PubMed]
- Ottmar, R.D. Wildland fire emissions, carbon, and climate: Modeling fuel consumption. For. Ecol. Manag. 2014, 317, 41–50. [Google Scholar] [CrossRef]
- Miller, W.W.; Johnson, D.W.; Gergans, N.; Carroll-Moore, E.M.; Walker, R.F.; Cody, T.L.; Wone, B. Update on the effects of a Sierran wildfire on surface runoff water quality. J. Environ. Qual. 2013, 42, 1185–1195. [Google Scholar] [CrossRef] [PubMed]
- Ellis, B.K.; Craft, J.A.; Stanford, J.A. Long-term atmospheric deposition of nitrogen, phosphorus and sulfate in a large oligotrophic lake. PeerJ 2015, 3, e841. [Google Scholar] [CrossRef] [PubMed]
- Scordo, F.; Sadro, S.; Culpepper, J.; Seitz, C.; Chandra, S. Wildfire smoke effects on lake-habitat specific metabolism: Toward a conceptual understanding. Geophys. Res. Lett. 2022, 49, e2021GL097057. [Google Scholar] [CrossRef]
- Ladd, T.M.; Catlett, D.; Maniscalco, M.A.; Kim, S.M.; Kelly, R.L.; John, S.G.; Carlson, C.A.; Iglesias-Rodriguez, M.D. Food for all? Wildfire ash fuels growth of diverse eukaryotic plankton. Proc. R. Soc. B. 2023, 290, 20231817. [Google Scholar] [CrossRef]
- Das, A.; Battles, J.; Stephenson, N.; Mantgem, P. The contribution of competition to tree mortality in old-growth coniferous forests. For. Ecol. Manag. 2011, 261, 1203–1213. [Google Scholar] [CrossRef]
- Fettig, C.J.; Hilszczański, J. Management strategies for bark beetles in conifer forests. In Bark Beetles: Biology and Ecology of Native and Invasive Species; Vega, F.E., Hofstetter, R.W., Eds.; Academic Press: Amsterdam, The Netherlands, 2015; pp. 555–584. [Google Scholar]
- Restaino, C.M.; Young, D.J.; Estes, B.; Gross, S.E.; Wuenschel, A.; Meyer, M.D.; Safford, H.D. Forest structure and climate mediate drought-induced tree mortality in forests of the Sierra Nevada, USA. Ecol. Appl. 2019, 29, e01902. [Google Scholar] [CrossRef] [PubMed]
- Long, J.N.; Shaw, J.D. A density management diagram for even-aged Sierra Nevada mixed-conifer stands. West. J. Appl. For. 2012, 27, 187–195. [Google Scholar] [CrossRef]
- Choat, B.; Brodribb, T.J.; Brodersen, C.R.; Duursma, R.A.; López, R.; Medlyn, B.E. Triggers of tree mortality under drought. Nature 2018, 558, 531–539. [Google Scholar] [CrossRef] [PubMed]
- Weed, A.S.; Ayres, M.P.; Hicke, J.A. Consequences of climate change for biotic disturbances in North American forests. Ecol. Monogr. 2013, 83, 441–470. [Google Scholar] [CrossRef]
- Asaro, C.; Koch, F.H.; Potter, K.M. Denser forests across the USA experience more damage from insects and pathogens. Sci. Rep. 2023, 13, 3666. [Google Scholar] [CrossRef] [PubMed]
- Young, D.J.; Stevens, J.T.; Earles, J.M.; Moore, J.; Ellis, A.; Jirka, A.L.; Latimer, A.M. Long-term climate and competition explain forest mortality patterns under extreme drought. Ecol. Lett. 2017, 20, 78–86. [Google Scholar] [CrossRef]
- McEwan, L.C.; Hirth, D.H. Southern bald eagle productivity and nest site selection. J. Wildl. Manag. 1979, 43, 585–594. [Google Scholar] [CrossRef]
- Lehman, R.N. A Survey of Selected Habitat Features of 95 Bald Eagle Nest Sites in California; Administrative Report 79-1; State of California Resources Agency, Department of Fish and Game: Sacramento, CA, USA, 1980. [Google Scholar]
- Anthony, R.G.; Knight, R.L.; Allen, G.T.; McClelland, B.R.; Hodges, J.I. Habitat use by nesting and roosting bald eagles in the Pacific Northwest. In US Fish and Wildlife Publications 1982, 34, 332–342. [Google Scholar]
- Peterson, A. Habitat Suitability Index Models: Bald Eagle (Breeding Season); U.S. Fish & Wildlife Service Biological Report; US Department of the Interior: Washington, DC, USA, 1986; Volume 82. [Google Scholar]
- Leighton, F.A.; Gerrard, J.M.; Gerrard, P.; Whitfield, D.W.; Maher, W.J. An aerial census of bald eagles in Saskatchewan. J. Wildl. Manag. 1979, 33, 61–69. [Google Scholar] [CrossRef]
- Stephens, S.L.; Miller, J.D.; Collins, B.M.; North, M.P.; Keane, J.J.; Roberts, S.L. Wildfire impacts on California spotted owl nesting habitat in the Sierra Nevada. Ecosphere 2016, 7, e01478. [Google Scholar] [CrossRef]
- Jones, G.M.; Gutiérrez, R.J.; Tempel, D.J.; Whitmore, S.A.; Berigan, W.J.; Peery, M.Z. Megafires: An emerging threat to old-forest species. Front. Ecol. Environ. 2016, 14, 300–306. [Google Scholar] [CrossRef]
- Thompson, C.; Smith, H.; Green, R.; Wasser, S.; Purcell, K. Fisher use of postfire landscapes: Implications for habitat connectivity and restoration. West. N. Am. Nat. 2021, 81, 225–242. [Google Scholar] [CrossRef]
- Mathisen, J.E. Effects of Human Disturbance on Nesting of Bald Eagles. J. Wildl. Manag. 1968, 32, 1–6. [Google Scholar] [CrossRef]
- Grier, J.W. Bald eagle behavior and productivity responses to climbing to nests. J. Wildl. Manag. 1969, 33, 961–966. [Google Scholar] [CrossRef]
- Jaffee, N.B. Nest Site Selection and Foraging Behavior of the Bald Eagle (Haliaeetus leucocephalus) in Virginia. Master’s Thesis, William & Mary University, Williamsburg, VA, USA, 1980; p. 1539625093. [Google Scholar] [CrossRef]
- Stocek, R.; Pearce, P. Status of breeding success of New Brunswick bald eagles. Can. Field Nat. 1981, 95, 428–433. [Google Scholar] [CrossRef]
- Burke, M. Bald eagle nesting improved with silvicultural manipulation in northeastern California. In Biology and Management of Bald Eagles and Ospreys; Bird, D.M., Seymour, N.R., Gerrard, J.M., Eds.; MacDonald Raptor Research Center, McGill University: Montreal, QC, Canada, 1983; pp. 101–105. [Google Scholar]
- Weeks, J.; Miller, J.E.; Steel, Z.L.; Batzer, E.E.; Safford, H.D. High-severity fire drives persistent floristic homogenization in human-altered forests. Ecosphere 2023, 14, e4409. [Google Scholar] [CrossRef]
- Richter, C.J.; Rejmánek, M.; Miller, J.E.D.; Weeks, J.; Welch, K.R.; Safford, H.D. The species diversity x fire severity relationship is hump-shaped in yellow pine and mixed conifer forests. Ecosphere 2019, 10, e02882. [Google Scholar] [CrossRef]
- Converse, S.J.; White, G.C.; Farris, K.L.; Zack, S. Small mammals and forest fuel reduction: National-scale responses to fire and fire surrogates. Ecol. Appl. 2006, 16, 1717–1729. [Google Scholar] [CrossRef] [PubMed]
- Roberts, L.J.; Burnett, R.; Fogg, A. Fire and mechanical forest management treatments support different portions of the bird community in fire-suppressed forests. Forests 2021, 12, 150. [Google Scholar] [CrossRef]
- Taylor, A.H. Fire disturbance and forest structure in an old-growth Pinus ponderosa forest, southern Cascades, USA. J. Veg. Sci. 2010, 21, 561–572. [Google Scholar] [CrossRef]
- Pawlikowski, N.C.; Coppoletta, M.; Knapp, E.; Taylor, A.H. Spatial dynamics of tree group and gap structure in an old-growth ponderosa pine-California black oak forest burned by repeated wildfires. For. Ecol. Manag. 2019, 434, 289–302. [Google Scholar] [CrossRef]


Disclaimer/Publisher’s Note: The statements, opinions and data contained in all publications are solely those of the individual author(s) and contributor(s) and not of MDPI and/or the editor(s). MDPI and/or the editor(s) disclaim responsibility for any injury to people or property resulting from any ideas, methods, instructions or products referred to in the content. |
© 2025 by the authors. Licensee MDPI, Basel, Switzerland. This article is an open access article distributed under the terms and conditions of the Creative Commons Attribution (CC BY) license (https://creativecommons.org/licenses/by/4.0/).