Article

A Methodological Approach to Address Economic Vulnerability to Wildfires in Europe

1
The James Hutton Institute, Aberdeen AB15 8QH, UK
2
Environmental Remote Sensing Research Group, Department of Geology, Geography and the Environment, Universidad de Alcalá, Calle Colegios 2, 28801 Alcalá de Henares, Spain
3
Forest Fire Laboratory (LABIF), University of Córdoba, Campus de Rabanales, 14071 Córdoba, Spain
*
Author to whom correspondence should be addressed.
Fire 2025, 8(10), 379; https://doi.org/10.3390/fire8100379
Submission received: 27 June 2025 / Revised: 1 September 2025 / Accepted: 11 September 2025 / Published: 23 September 2025

Abstract

The assessment of the economic vulnerability of natural disasters is a necessary step in the evaluation of any risks. This study proposes the approach implemented under the H2020 FirEurisk project to value the economic damage of wildfires on a European scale. Economic damage is assessed as the net value change in natural (agricultural and forestry resources and their ecosystem services) and manufactured assets under simulated fire intensity, taking into consideration the time necessary for natural capital to recover to the pre-damaged conditions. We show minimum, maximum, and average damage for European countries and map the critical areas. Damages to provisioning-ecosystem services are more pronounced in Central Europe because of the lower resilience of ecosystems compared to the Mediterranean, suggesting that mitigation measures (such as managing vegetation to reduce fuel; improving access to fire services; and engaging communities through education, agriculture, and forest management participation) must be enforced. We are confident that the approach proposed may stimulate further research to test the goodness of the estimates proposed and suggest where it is more appropriate to invest in fire prevention.

1. Introduction

Wildfires are a natural disturbance in many ecosystems, aiding in species success by creating habitat heterogeneity and increasing the number of ecological niches and the diffusion of new species [1,2,3]. In addition, wildfires may make a beneficial contribution to humans by regulating ecosystem services via pathogen reduction [4] and limitations in the transmission of infectious diseases [5]. Notwithstanding these benefits, environmental, social, and economic damages seem to prevail, caused by the loss of up to 600,000 ha of land every year in Southern Europe and up to 100,000 ha in Northern European countries [6]. These losses trigger human interventions to limit the impact of natural or human-induced fires, because of their deleterious consequences on environmental assets and economic infrastructure, including casualties and health issues [7].
Countering the effect and managing the damage inflicted by spontaneous and human-induced fires requires an integrated approach. This includes addressing the link between wildfire vulnerability and climate change through better modeling [8,9]; implementing land-management actions, such as thinning, prescribed fires, and grazing [9,10]; investing in green infrastructures; and adopting risk prevention and management plans [11] to better consider the interactions between natural and human systems [12] and optimize resources necessary to prevent fires [7].
An approach to adequately address fire risk management is to make an early assessment of risk. This considers the likelihood that a fire ignites and propagates; the human, ecological, and economic values potentially affected by fire; and the ability to cope with the damage through the implementation of institutional and voluntary initiatives, mitigating environmental and socio-economic impacts [13]. In this research, we focus on the potential damage of fires, better known as vulnerability, the potential for damage or loss influenced by the ecosystem’s exposure, sensitivity, and adaptive capacity to fire effects (see Section 2). This research is part of the H2020 project FirEUrisk, Developing A Holistic, Risk-Wise Strategy For European Wildfire Management, which has developed an integrated risk framework to provide a holistic assessment of fire danger, exposure, and vulnerability [14]. It also builds on previous reviews addressing economic impacts and the valuation of natural, physical, human, and social capitals [13,15].
While the literature shows a prominent interest in the concept of exposure and danger (hazard), vulnerability has received limited attention [16]. This paper addresses the question of how it is possible to combine fire modeling and socioeconomic vulnerability to wildfires at a continental scale by proposing an ex-ante assessment of the damage to a range of threatened natural and built assets. The approach proposed operates at the European territory (see Section 3), dealing with physical and economic processes at the resolution of 1 km2, the same chosen in the FirEUrisk project, which is a good compromise between the different spatial resolutions of the input data used for this study (from 1 hectare to an NUT region). This scale is appropriate to assist strategic decision makers in allocating human, technical, and financial resources in those areas highly susceptible to fire impacts, though lacking the capacity to describe natural processes at finer levels usually adopted for landscape [17,18,19] or local levels [7]. The 1 km2 resolution is commonly used to model fire risk [14], assess ecological vulnerability to wildfires [20], and model ecosystem services [21,22] at a continental scale and is suitable to compare vulnerability between ecosystems and economic assets between countries. Inspired by two recent reviews on wildfire socio-economic damage [13,15], this research follows the approach adopted by Chuvieco et al. [23,24], who introduced the concept of vulnerability in risk assessment at a global scale, dealing with economic values of natural and infrastructural assets and resilience and estimated by combining the following: (1) coping capacity or capacity to absorb the impact of fires modeled using a penalty coefficient (in the range 0 to 1) as a proxy for the percentage of damage; (2) recovery time of the damaged ecosystems to its undisturbed conditions. We maintain this approach by selecting coefficients of loss and the recovery time of natural assets from the recent literature to maximize the impacts for the European territory.
This paper proposes first the concept of vulnerability adopted for the economic valuation of natural and manufactured capitals and then describes the approach to measure damage by combining the value of assets with their resilience to predicted fires. Results look at the geographic occurrence and the typology of assets damaged, while the discussion proposes considerations on the reliability of the predicted damages, the limits of the approach used, and new avenues to improve it.

2. The Vulnerability Approach

In this paper, risk is seen as the potential for adverse consequences or impacts caused by a natural or human-induced disaster. The conceptual model of risk, proposed by the H2020 FirEUrisk project, is shown in Figure 1 and described in [14]. It builds on the concept of risk disaster [25,26] and ideas elaborated in [23,24] that recognize risk as a combination of the following: (1) danger: the probability of ignition and propagation of fire; (2) exposure: the extent to which people, infrastructure, and ecosystems are exposed to fires; and (3) vulnerability: the potential damages caused by fires to economic and ecological assets.
We deal with the concept of vulnerability in this paper, defined by the United Nations Office for Disaster Risk Reduction [27] as “the propensity or predisposition of an individual, a community, infrastructure, assets or systems (including ecosystems) to be adversely affected by one or multiple hazards”. Vulnerability is associated with the damage function of socio-economic values [23,24,28], resilience of vegetational types to fire intensity [23,29,30,31], and human adaptation [32,33,34].
Several aspects influence vulnerability or the capacity to reduce or prevent impacts, such as previous knowledge and experience, investments, demographic variables, and perceived risk, among others [34]. Papers dealing with all these issues are scarce because of the difficulties of integrating into one indicator all these dimensions. The most studied are the socio-economic, physical, and ecological variables. Examples focusing on the role of social and demographic components on fire vulnerability are proposed by [35,36]. Consideration of other dimensions (e.g., economic and ecological) is proposed by [33], who have also attempted to integrate institutional aspects, such as proactive (e.g., integrated fire management plan; models of fire propagation; maps of risks, etc.) and reactive (i.e., fire suppression) societal responses to risk reduction [34]. Further immaterial aspects able to limit fire vulnerability are not frequently considered or integrated in risk frameworks, such as the role of information on fire, awareness of good soil and vegetation management practices, local training, capacity building, and any volunteer non-professional initiatives taken to reduce fire risk [37]. In addition, cultural dimensions, such as knowledge and practices, especially of indigenous communities, may be important in the vulnerability and risk assessment of wildfires for creating territory protection and cleaning, as well as enhancing spiritual and esthetic values [38].
In the FirEUrisk project, vulnerability is determined by two components: the values of the assets at risk and their resilience, expressed as coping capacity, or resistance to fire, and recovery time after damage. By the former term, we consider the capacity of any natural system to become less sensitive to fire, and any human strategy that can be adopted to cope with and adapt to recurrent damage [39]. The approach proposed in this paper considers fire damage to a range of natural assets and ecosystem services, and their capacity to recover [40], recognizing that resilience is not yet well considered in research and practice. These peculiarities are described in the Methods. We exclude from the analysis any form of impact on “ecological values” which cannot be monetized and that are already proposed by [20].

3. Materials and Methods

This section presents the method used for the valuation of natural and manufactured capital and then proposes the approach adopted for the analysis of damage through the implementation of two components: (1) a function describing the loss of the asset after fire; and (2) the capacity of the assets to recover by implementing the concept of resilience. Figure 2 reports the flow chart of the operations made to estimate wildfire damage.

3.1. Area of Investigation

The vulnerability analysis is carried out in the European Territory (ET) area, which was defined by the FirEUrisk project to include the continental territories of the European Union and neighboring countries, excluding EU territories located in other biomes (tropical islands and overseas). All vulnerability variables presented in this research were applied to this study area at a resolution of 1 km2.
We have focused our attention on a range of ecosystem services and residential properties as a proxy for manufactured capital. Table 1 lists the assets considered in the valuation process, while Table A1 in Appendix A reports the information used to make their valuation. We have not considered damages to other infrastructures, such as roads, railways, communication cables, and towers, etc., and to non-market benefits, such as recreational values and public health (physical and mental health), due to the lack of data covering the area of investigation. In addition, we have not considered indirect effects on the economy of the EU (for instance, in the manufacturing sector) that can be triggered by the damage to the capital assets considered in this paper.

3.2. Provisioning Ecosystem Services

Table 1 (left part) lists significant provisioning services that can be damaged by fire. Having these assets’ market values, they can be simply assessed by knowing the unitary price and the quantity of goods exchanged in the market. Following the accounting procedures proposed by the UN System of Environmental Accounting [41,42], we have valued these provisioning services using the resource rent approach, a method for valuing natural resources by estimating the surplus value (rent) generated from their use, after accounting for all costs [43]. We have expressed these values as annual benefits in Euros per unit of land (hectare) reported for the year 2021.
The valuation was carried out by using different sources. EUROSTAT was consulted to obtain statistics on the physical quantity of provisioning services at the European scale NUTS 1 and NUTS 2, if available. The database, gray, and peer-reviewed literature were consulted to outline prices of each of these resources and define costs of production or margins of profitability to measure their net value.
Annual benefits of seasonal crops are not considered because they are not affected by fires, owing to the mismatch between harvesting and wildfire season. Other resources can be of high value locally, such as non-timber forest products like mushrooms, truffles, and cork, especially in areas where Quercus species and Quercus suber are dominant. These assets are not captured by EUROSTAT and are, therefore, not reported in our analysis.
To generate the spatialized valuation of the provisioning services reported in Table 1, we proceeded as follows for each variable (details and references of the EUROSTAT data listed below are provided in Appendix A):
(a) Olive groves: The value is reported at the national scale in 2021 Euro currency. This is based on EUROSTAT data on olive production for the period 2011 to 2021, and a conservative price in the range of EUR 0.45–0.90/kg, observed in 2021, by the Italian Institute of Food Market (ISMEA). This revenue has been divided by the area of olive groves to achieve the lower bound revenue of EUR 500–1000/ha. A 3% capitalization rate has been used to calculate the capital value of olive groves. Using EUROSTAT’s national codification, data were spatialized, while the Corine Land Cover (2018) [44] was used to crop the areas classified as olive groves in the study area.
(b) Vineyards: The economic value of vineyards, based on the 2010 NUTS 2 classification, has been constructed using data from EUROSTAT. This includes wine production volumes, expressed in hectoliters, and vineyard area (in hectares) at NUTS 2 level for the years 2007 and 2008 (the most recent available from EUROSTAT). For the economic value, we used the average price of unbottled wine in 2021, which was EUR 1.5/L, as provided by ISMEA. To the annual revenue calculation, we applied a 25% profit margin, the average between periods of low and high demand [45]. A capitalization rate of 10% [46] is used to determine the vineyard’s capital value per hectare. For the spatialization of this variable, we used the national codes provided by EUROSTAT and the Corine Land Cover (2018) [44] for the areas classified as vineyards.
(c) Fruit groves: The value of fruit groves was derived from EUROSTAT data on fruit production and revenues for the year 2017, adjusted for inflation to reflect 2021 values. A profit margin of 20% has been used to obtain the net annual benefit expressed in Euros per hectare per year, while a capitalization rate of 4% was used to assess the capital value of the asset in Euros per hectare. For the spatialization, we used the NUTS 2 codes from EUROSTAT and Corine Land Cover (2018) [44].
(d) Timber: We mapped the average value of timber land by merging information from the growth of timber expressed in cubic meters per hectare in each European country provided by EUROSTAT and the average stumpage price of softwood (EUR 70/m3 in 2021) to obtain the annual values of the growing stock in Euros per hectare. A margin of 5% is used to assess the net annual revenue. Because the density of timber provided by EUROSTAT generated a “border effect” between countries, we preferred mapping the timber value by using the JRC Forest Biomass Map [47], representing the aboveground forest biomass density in Europe in 2010, expressed in Mg/ha. In doing this, we divided the forest biomass map by the average density of timber (600 kg/m3), and then we multiplied the results by the average stumpage price proposed above.
(e) Sheep: We estimated the net revenue (profit) per sheep at EUR 100 per head (see Table A1 in Appendix A for details). The value of livestock expressed in Euros per hectare was obtained by dividing the livestock value by the area of the specific use reported by the Corine Land Cover (2018) in each NUTS 2 region. The spatialization of this variable was carried out using the NUTS codes, multiplying the number of sheep reported by the FAO [48] by the net revenue per sheep proposed above.
(f) Cattle: We considered for this study only the value of cattle beef. The average net revenue per head is estimated at EUR 150 (see Table A1 in the Appendix A for details). The spatialization of cattle was performed using the NUTS code, multiplying the number of cattle beef published by the FAO [48] by the average net revenue per cattle proposed above.

3.3. Economic Value of Properties

We used the average national prices reported in 2021 US dollars ($) by the website NUMBEO for countryside properties and corrected by the Euros–US dollars exchange rate (1 Euro = 1.18 US$) [49]. We then normalized these national values by the average per capita GDP of the country where properties are located and multiplied the result by the local GDP, a measure of the local per capita income in the EU territory, proposed at the scale of 1 km2 [50]. We produced a map of property values characterized by high granularity, assuming that property prices follow linearly the local GDP. Local GDP, measured by [50] in 2015 dollars, was converted into Euros and deflated in 2021 values by the GDP price deflator of the Euro area (11% inflation compared to 2015) [51]. The map of properties’ values was finally filtered by the Wildland Urban Interface (WUI) areas generated within the project [52] to generate a map of the properties that are expected to be affected by wildfires.

3.4. Regulating Ecosystem Services

We used the economic values of regulating ecosystem services produced by the KIP INCA project [21,53,54]. The JRC INCA Platform contains a database of ecosystem services mapped in biophysical and monetary units for the 27 countries of the EU, at the scale resolution of 1 km2. Estimates made for the most recent year (2018) were used and converted to 2021 Euro currency using the consumer price index, for both supplied and demanded ecosystem services. Among the range of ecosystem services produced, we used those listed in Table 1. We considered crop pollination, soil retention, and carbon sequestration as key regulating services that are negatively affected by fire, whose mapped values can be easily implemented in the damage function (see Section 3.9 on Valuation of economic damage). Crop pollination is an intermediate service provided by pollinators (bees, birds, and some mammals) that contributes to crop production (mainly fruit trees); soil retention is the capacity of soil and associated vegetational habitats to keep the structure and chemical properties in place, contributing to ecosystem productivity (in agricultural ecosystems). Finally, carbon sequestration is the capacity of the vegetated biomass to remove carbon from the atmosphere and store it in leaves, stems, and soil. Details on the bio-physical and monetary models used to assess the regulating services adopted in this study are available in [21,54,55]. Other regulating services, mapped by the KIP INCA project, such as water purification and flood regulation, were not considered in this research because of the need to modify the original dose response function for these services, whose value can be deeply affected by fire, before being used in the analysis of vulnerability.

3.5. Simulation of Fire

Following the approach of the FirEUrisk project, we focused on extreme fires, which are those causing the most damage in the European territory. We did not estimate the fire propagation of specific fires, but rather the propagation of potential fires and, more specifically, the spatial difference in propagation. For this reason, we focused on weather conditions associated with the historical occurrence of large fires. First, we selected those days when large fires (>1000 ha) occurred anywhere in the European Territory in the period 2001–2019. The selection of ignition dates was based on the analysis of the time series of the FireCCI51 burned area product, generated from a hybrid classification algorithm applied to satellite Terra observations [56] within the Climate Change Initiative Program of the European Space Agency (https://climate.esa.int/en/projects/fire/, accessed on 10 September 2025). Ignition points (and respective dates) were obtained by computing the geographic centroid of the contiguous pixels that have no other neighboring pixels with a previous fire date, following the algorithm of [57]. A total of 403 high-risk days corresponding to those ignition points were obtained for the 19 years of the available FireCCI51 time series. Weather parameters at 12 h for those 403 days were computed from ERA5-Land global reanalysis data (https://cds.climate.copernicus.eu/datasets/reanalysis-era5-land-timeseries?tab=overview, accessed on 10 September 2025), which were spatially interpolated to 1 km2 resolution. The 95% percentile of temperature and wind and the 5% percentile of rainfall and relative humidity were extracted to estimate the moisture conditions of dead fuels. The live fuel moisture content (LFMC) was estimated from Sentinel-3 reflectance data. In this case, since the whole historical period was not available (Sentinel-3A was launched in 2016), the extreme conditions (lower moisture content) for each pixel were estimated by selecting the 5% lowest FMC values computed for the year 2023–2024. The LFMC was computed from daily observations at 300 m resolution and afterwards resampled to the target resolution of 1 km2. Topographic data was obtained from the NASA Shuttle Radar Topography Mission (SRTM) (https://www.earthdata.nasa.gov/data/catalog/lpcloud-srtmgl1-003, accessed on 10 September 2025) and 90 m resolution and downscaled to 1 km2. Fuel characterization was based on a dedicated fuel classification map developed by [58], from which fuel parameters were assigned for surface fuels based on models provided by [59]. For forested areas, crown conditions were obtained from a new crown fuel dataset generated for the ET area based on satellite lidar observations [60,61].
With these parameters, Rothermel’s fire behavior equation was used to simulate the rate of spread (m/s), reaction intensity (kW/m2), fire line intensity (kW/m), and flame length (m). The approach used for the assessment of the potential losses from fires is based on the interaction between the economic value of the environmental services, proposed in the previous section, the coping capacity, measured as the proportion of value loss (net value change), a function of the fire intensity [62], and the recovery time of the asset [7,23]. We used the estimations of the fire line intensity and flame length to compute the reduction in pre-fire values that would occur as a result of having those extreme weather conditions, based on six categories of damage assessed in Spain on Mediterranean vegetational assets (see Table 2). Net value change estimation and the effect of recovery time on vegetation are proposed in the next sections.

3.6. Analysis of Net-Value Change

The fire impact depends on a range of factors, such as adaptation of manufactured assets (properties) to resist combustion, the ecosystem characteristics (e.g., sprouting or germination strategy, maturity, bark thickness), and the fire parameters, such as flame length, spread rate, and fire-line intensity. The latter aspects are related to fire severity and depend on the fuel load and weather conditions [63]. A range of studies in the Mediterranean landscapes support the relations between fire intensity levels (FILs) and fire impacts [64,65]. Authors operating in Chilean ecosystems [62] suggested correlating fire impact with reconstructed fire intensity based on flame length to produce the foreseen fire impact (FIP), a measure of coping capacity expressed as net value change (NVC) or percentage of loss of the assets affected by fire.
The net-value change (NVC) approach has been used for appraisal-related studies to assess the resource deterioration caused by fires of different intensities [19,30,64,65,66,67]. It was adopted in Mediterranean ecosystems, showing the effect of six categories of foreseen fire impacts (FIP) on timber [64], cattle and sheep [19], carbon sequestration [68], and soil [69,70]. Ref. [64] established different sampling plots in ten large forest fires to identify the tree mortality, percentage of affected timber, and the reduction in the timber price according to each FIP. Ref. [19] assessed the damaged pastures using permanent sampling plots under different FIP and rainfall patterns, until their recovery, while [68,71] assessed damage to carbon storage, finding differences according to the spread of surface and crown fires. The fire damage to soil was assessed, combining information from the potential rainfall erosion estimated by the Universal Soil Loss Equation (RUSLE) and FIP [72].
Table 2 reports the coping capacity (loss coefficients or depreciation ratios) adopted in this research, assuming the transferability from Mediterranean ecosystems to vegetational types dominating other European countries. The impact evidence of different fire intensities is not available for perennial crops (olive groves, fruits, vineyards), and therefore, we decided to use the coefficients developed for the impact of fire on timber. Damage to ecosystem-regulating services, such as crop pollination, largely depends on semi-natural habitats; therefore, we decided to use the depreciation factors developed for carbon sequestration.
Table 2. Coping capacity measured by loss coefficients (0 to 1) describing the impact of fire on natural capital assets. Based on 1 [64]; 2 [19]; 3 [71] and 4 [69].
Ecosystem ServicesForeseen Fire Impact (FIP) Under Different Flame Length
I
2 m
II
2–3 m
III
3–6 m
IV
6–9 m
V
9–12 m
VI
>12 m
Timber 10.080.170.390.580.830.90
Olive_groves0.080.170.390.580.830.90
Fruit_groves0.080.170.390.580.830.90
Vineyard0.080.170.390.580.830.90
Cattle and sheep 20.450.650.851.001.001.00
Crop_pollination0160.400.600.850.981.00
Carbon sequestration 30.160.400.600.850.981.00
Soil retention 40.150.250.450.650.951.00

3.7. Analysis of Fire Loss in Manufactured Capital

A similar approach is used to assess impacts on manufactured capital. The capacity to resist fire depends on the intrinsic properties of the asset, including the construction material [73]. We assumed that there were only structures made of wood and a combination of concrete and bricks. The latter dominate in the Mediterranean regions, while wooden structures are mostly prevalent in Northern countries. The loss coefficients for properties are reported in Table 3. Considering that wood characterizes 20–30% of roofs and 5% of walls [74], it was proposed that the combined brick–concrete structures constitute the main material for at least 70% of the European properties, while the remaining 30% are made of wood.
Support for the figures proposed in Table 3 is provided by [73], who, in estimating the damage of the most important fire event in Portugal, the Pedrógão Grande fire complex, found that in areas characterized by high fire intensity, equivalent to FIP V and VI, damage to concrete structures (called masonry in the paper) amounted to 40%, while wooden structures were completely destroyed. Conversely, the constructions that were slightly damaged (probably affected by fire of lower intensity equivalent to FIP I and II in Table 3) were damaged with a proportion of 13%. We must add that the construction material is not the only cause of damage. Age, occupation, destination (civil or industrial use), and the characteristics of the roof and windows are determining factors in house burn [73], as well as the existence of overhanging vegetation [76]. The loss coefficients proposed in Table 3 are a function exclusively of the construction material.

3.8. Assessing the Recovery Time of Natural Capital Assets to Fire

Damage valuation cannot be assessed without considering the time needed for the natural capital asset to recover. In this study, time is a good proxy for the capacity of the ecosystem to bounce back to its original state [77,78]. This is influenced by several factors, such as slope, solar radiation, hydrological conditions, soil nutrients [79,80], intensity of disturbance, and fire frequency [81,82,83,84]. We assumed that the damaged ecosystem does not incur tipping points [85] or irreversible changes to new conditions, showing a diverse ecological role (for instance, a shift from forest to grassland).
We provide, in this section, a justification of time recovery for the natural capital assets described in the previous sections. Analyses based on remote sensing suggest an interval of 15–20 years for a full recovery of vegetation after fire [86,87]. Similar considerations are proposed by [88], who analyzed the Normalized Burn Ratio (NBR) of wildfires that occurred in pine forests in North America between 2000 and 2007. They found that NBR recovery across forest types varied between 30% and 44% after five years from the fire; 47% to 72% after ten years; and 54% to 77% after 13 years [88]. Recovery was affected by fire severity and forest characteristics.
Combining spectral data of fire size and field measurements of canopy, understory features, and species composition, ref. [84] suggested that, after a period of 25 years, most fire-affected communities had not recovered (e.g., reaching a state similar to unburned communities), especially those experiencing severe burning.
In semi-natural forests dominated by Pinus sylvestris in Central Europe, ref. [89] found that the tree layer cover remained significantly lower in burnt plots compared to unburnt ones after 25–50 years from the fire and estimated a full recovery only after 140 years from the damage.
In the analysis of damage proposed in this paper, a recovery time of 50 years for forest trees is adopted. The assumption is that burnt trees lose their value entirely (we ignored the problem of salvage stumps), and that 50 years is required for a new tree to achieve commercial maturity or rotation age. This figure can be considered as the average rotation time between the quick turnover (10–20 years) of softwoods (poplar, birch, eucalyptus) and the long turnover (over 100 years) of hardwoods (oak, ash, beech, maple).
The recovery time of shrubs was estimated to be 6 years [80,89], and it was adopted as a proxy for the recovery of pollination services that are influenced by semi-natural habitats and shrublands.
Grasslands, upon which livestock depend, have a quick turnover and fast recovery after a fire [90] (usually less than a year). This time can be considered the proxy for the recovery of the value of livestock assets. However, the time of culling being up to one year for lamb and two years for cattle, we assume that the recovery for livestock cannot be completed before 24 months.
Fires can be associated with post-fire bare soil conditions, inducing a higher erosion rate, between 45 t/ha/year and 56 t/ha/year, until vegetation recovers [90,91]. According to fire intensity, vegetation recovery may vary between 6 and 20 years [91,92], while ref. [93] suggested that soil organic carbon and total concentration of nitrogen (N), phosphorus (P), and potassium (K) necessitate more than 40 years to recover to pre-fire levels. We follow, in our analysis of the damage, the proposal made by [91,92].
There is limited evidence for the recovery time of permanent crops (olives, fruits, vines, etc.). Some authors [94] suggested a recovery of 20% per year from the time of fire, suggesting that these assets can generate income after 5 years from the damage. It is assumed here that 5 years is the minimum time for perennial crops to start reproducing fruits and become ready to generate new income. Table 4 summarizes the recovery time adopted in the damage function.

3.9. Valuation of Economic Damage

Two different models to measure fire damage were adopted. In the first model, the discounted value of the yearly damages (lost benefit) is calculated until the full recovery of the natural capital asset [7,23,64]. In doing this, three elements are considered: the value of the asset (Benefit), the capacity to resist fire (Loss), and the recovery time after the damage (RT) (1). To model the damage, we assumed that a fraction (Loss estimated by net value change in Table 2 and Table 3) of the asset is lost for a period (RT) necessary for the asset to fully recover (Table 4). In this model, the benefit lost is assumed to be constant for the entire recovery time. The final value is influenced by the choice of the discount rate (r), a coefficient that measures the level of impatience in society and the opportunity cost of capital. We used, for our analysis, a social discount rate of 3.5%, as suggested by [95], and a geometric discounting model, instead of the hyperbolic progression as adopted by [7]; because of the limited time, the geometric discounting is applied to provide a more cautious estimate of the damage.
D a m a g e = B e n e f i t × L o s s ×   1 ( 1 + r ) R T r
A different model, based on a logistic function recovery, was considered for the valuation of carbon sequestration. Instead of assuming that the loss is constant for the entire time of recovery, we model the decrease of carbon sequestration loss according to the recovery of the vegetational habitats, following a sigmoid function (2) [96]:
F R T = L 1 + e K ( R T x o )
where L is the maximum value of the natural capital asset normalized to 1 (in the absence of damage); K is the growth rate (1/year); RT is the time of recovery (year); and xo is the time (year) necessary for the biomass to recover at 50% of its capacity. In (2), the function F(RT) is discounted for each RT period at the discount rate r, and the result is subtracted at each time (RT) from the discount factor [1/(1 + r)RT] to obtain the cumulative discounted factor of the damaged asset. The result is then multiplied by the value of the asset [Benefit in (1)] and by the loss coefficient [Loss in (1)] to estimate the monetary value of the damaged asset (expressed in Euros/ha).
Table 5 presents the discounted factors, assuming a forest asset that regrows in 50 years at a discount rate of 3.5%. The sensitivity of K and xo on the discount factor was tested. It is assumed that under an FIP of low intensity (I and II), the forest recovers 50% of the biomass in xo = 10 years; for medium FIP (III and IV), in xo = 25 years; and for high FIP (V and VI), in xo = 35 years. Keeping a constant xo, K has not much influence on the discount factor, while the latter may change at different values of xo. We have averaged the discounted factors proposed for each xo at different values of K to simulate the damage for three levels of damage: low (FIP I and II), medium (FIP III and IV), and high (FIP V and VI).

4. Results

4.1. Potential Benefits Generated by the Ecosystem Services

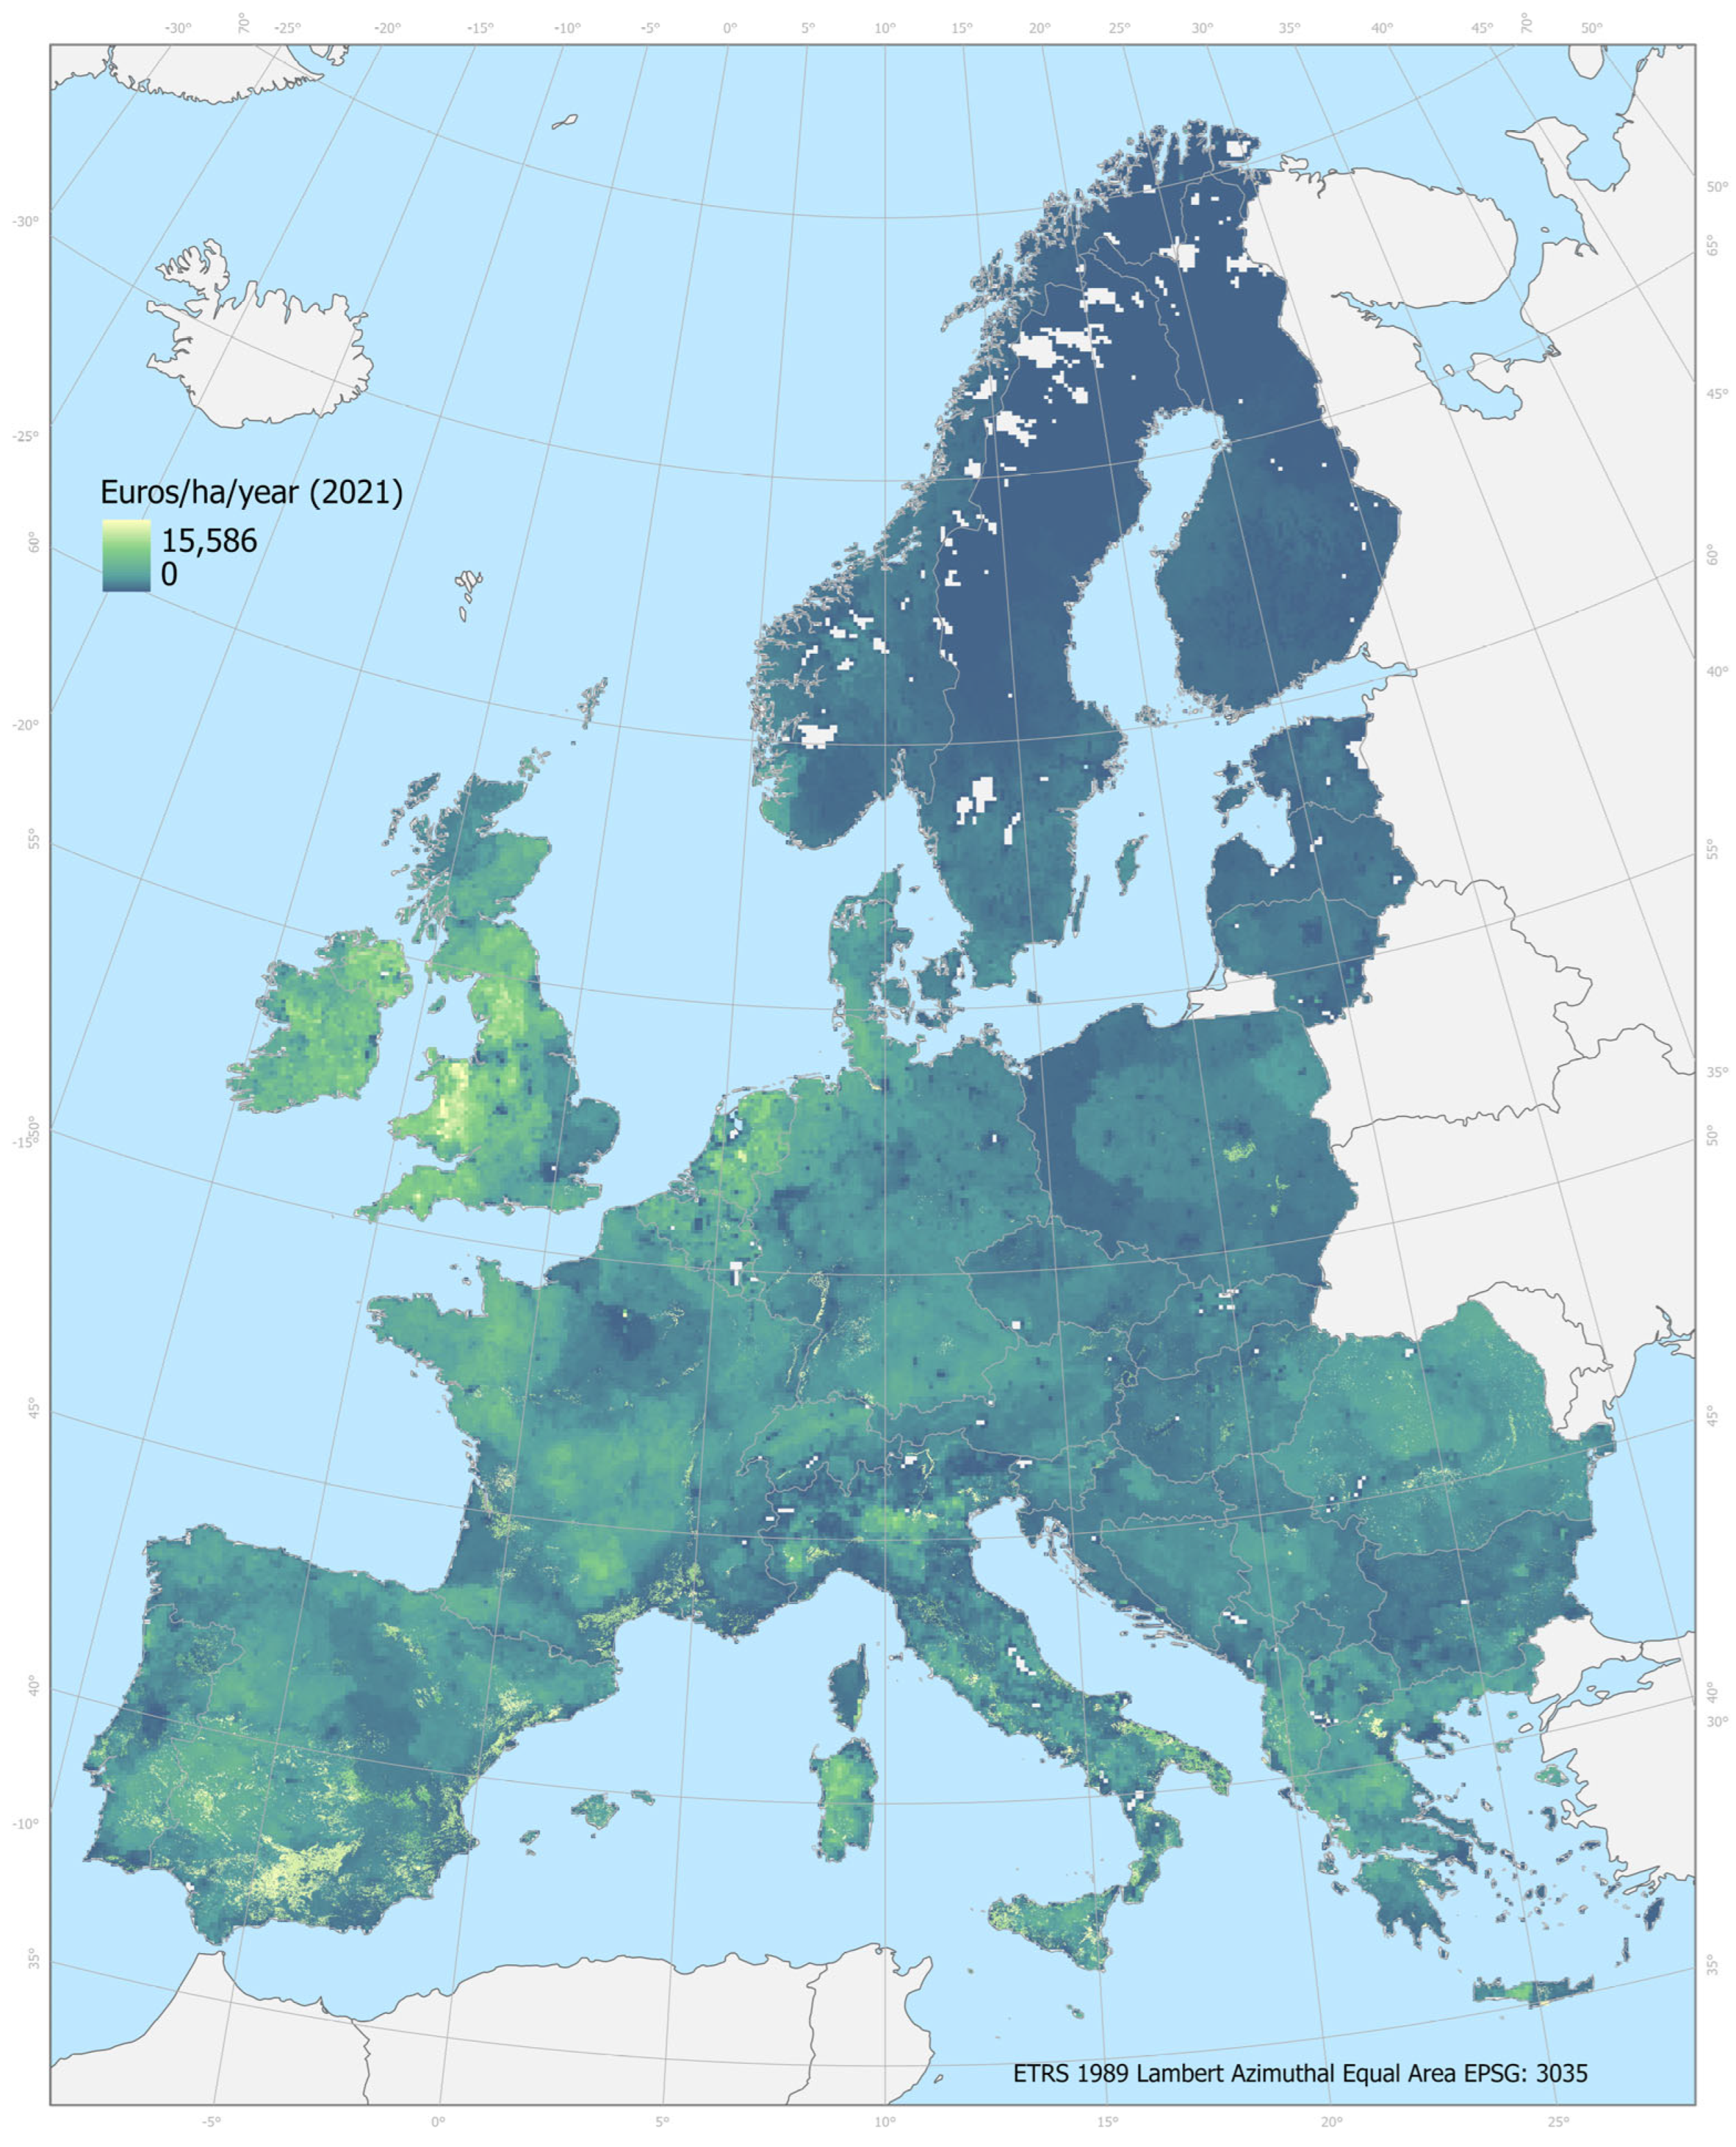
Figure 3 reports the aggregated values of the annual benefits generated by provisioning ecosystem services, expressed in 2021 Euros per hectare per year. The average value for the European territory, inclusive of agricultural assets, is EUR 6000/ha/year. Considering an average rate of return between 5% and 10%, the net capital value of land can be quantified in EUR 60,000/ha to EUR 150,000/ha. Timber, proxied by softwood, in Central Northern Europe has a capital value of EUR 30,000/ha. Fruit trees show higher values in some localities of France, Germany, and Italy, being valued at EUR 50,000 to EUR 120,000/ha. Olive trees’ highest values are distributed in the southern and eastern part of Spain (average value between EUR 25,000 to EUR 30,000/ha), while highly valuable vineyards are located in eastern France, northern, and southeastern part of Italy, and the central–eastern area of Germany, whose values range from EUR 40,000 to EUR 80,000/ha. The livestock highest values are recorded in the Netherlands and several parts of the UK (Wales and the Scottish Highlands), both characterized by a high extension of pastureland.
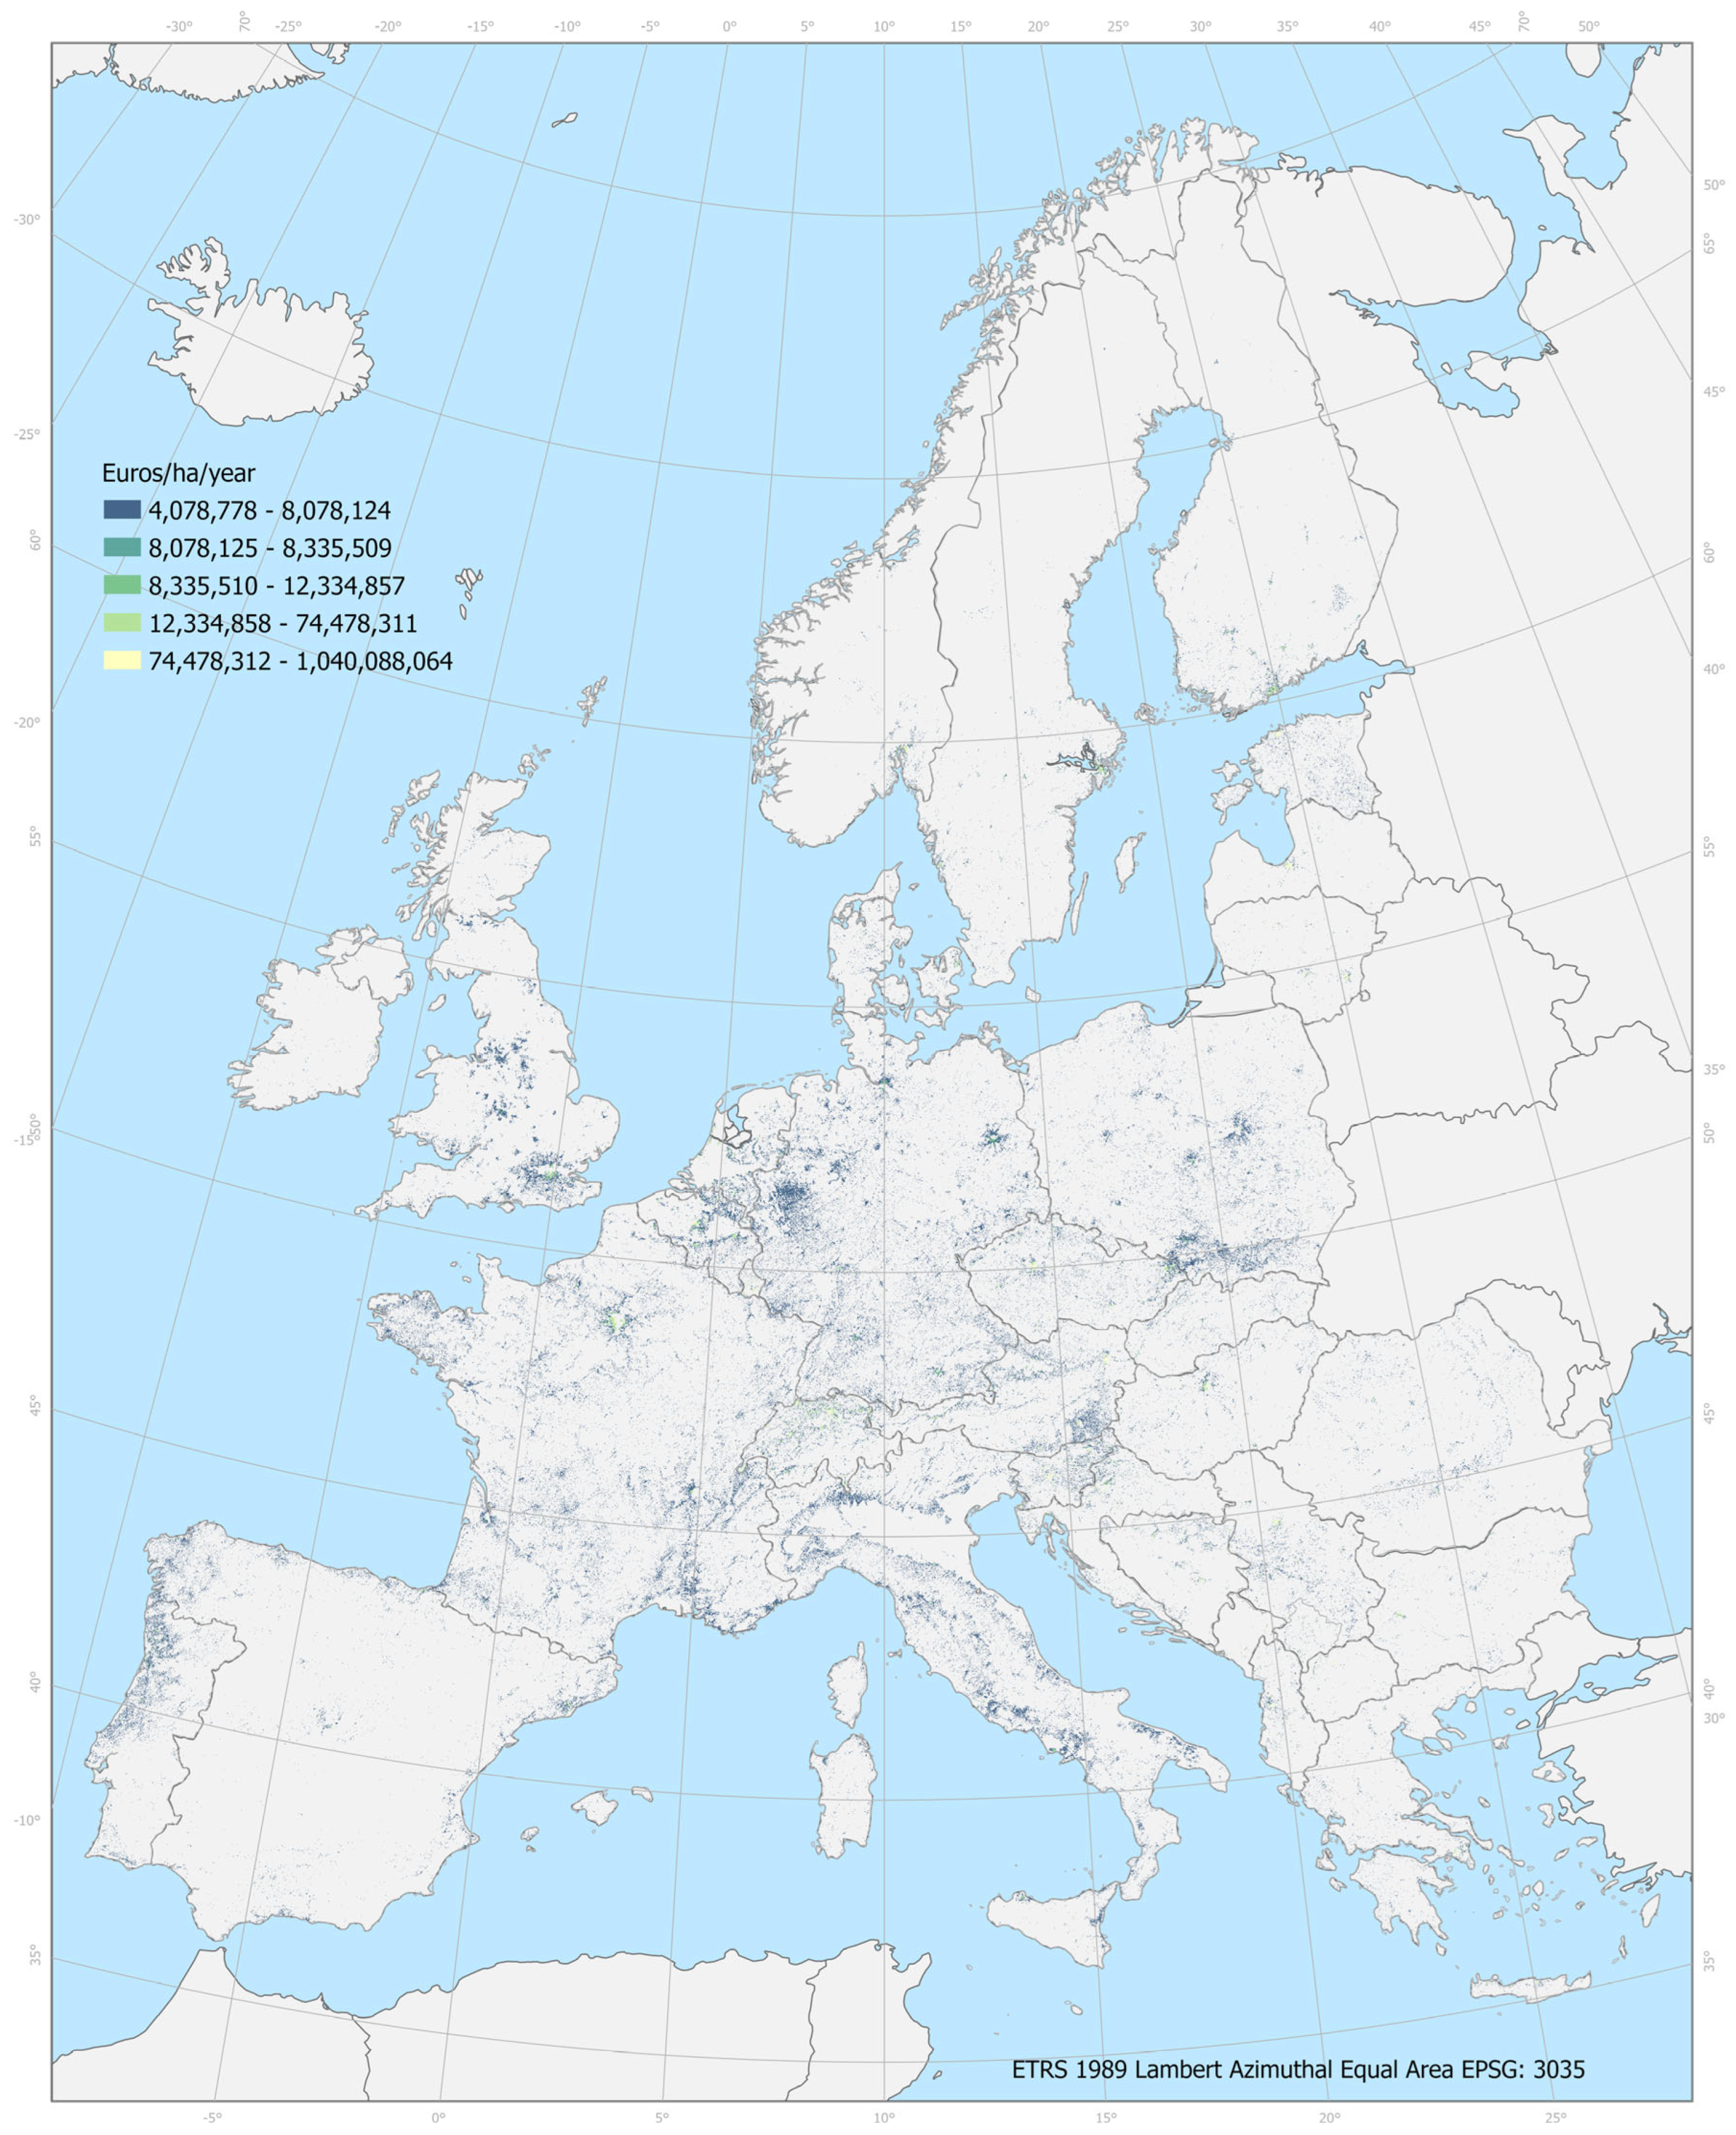
The most valuable economic asset is represented by properties, as reported in Figure 4. Excluding the biggest European cities, characterized by the highest values, but with low probability of being affected by fire, the wildland urban interface is valued between a few hundred euros to one thousand euros per square meter. These values account for the built infrastructure and land [7].
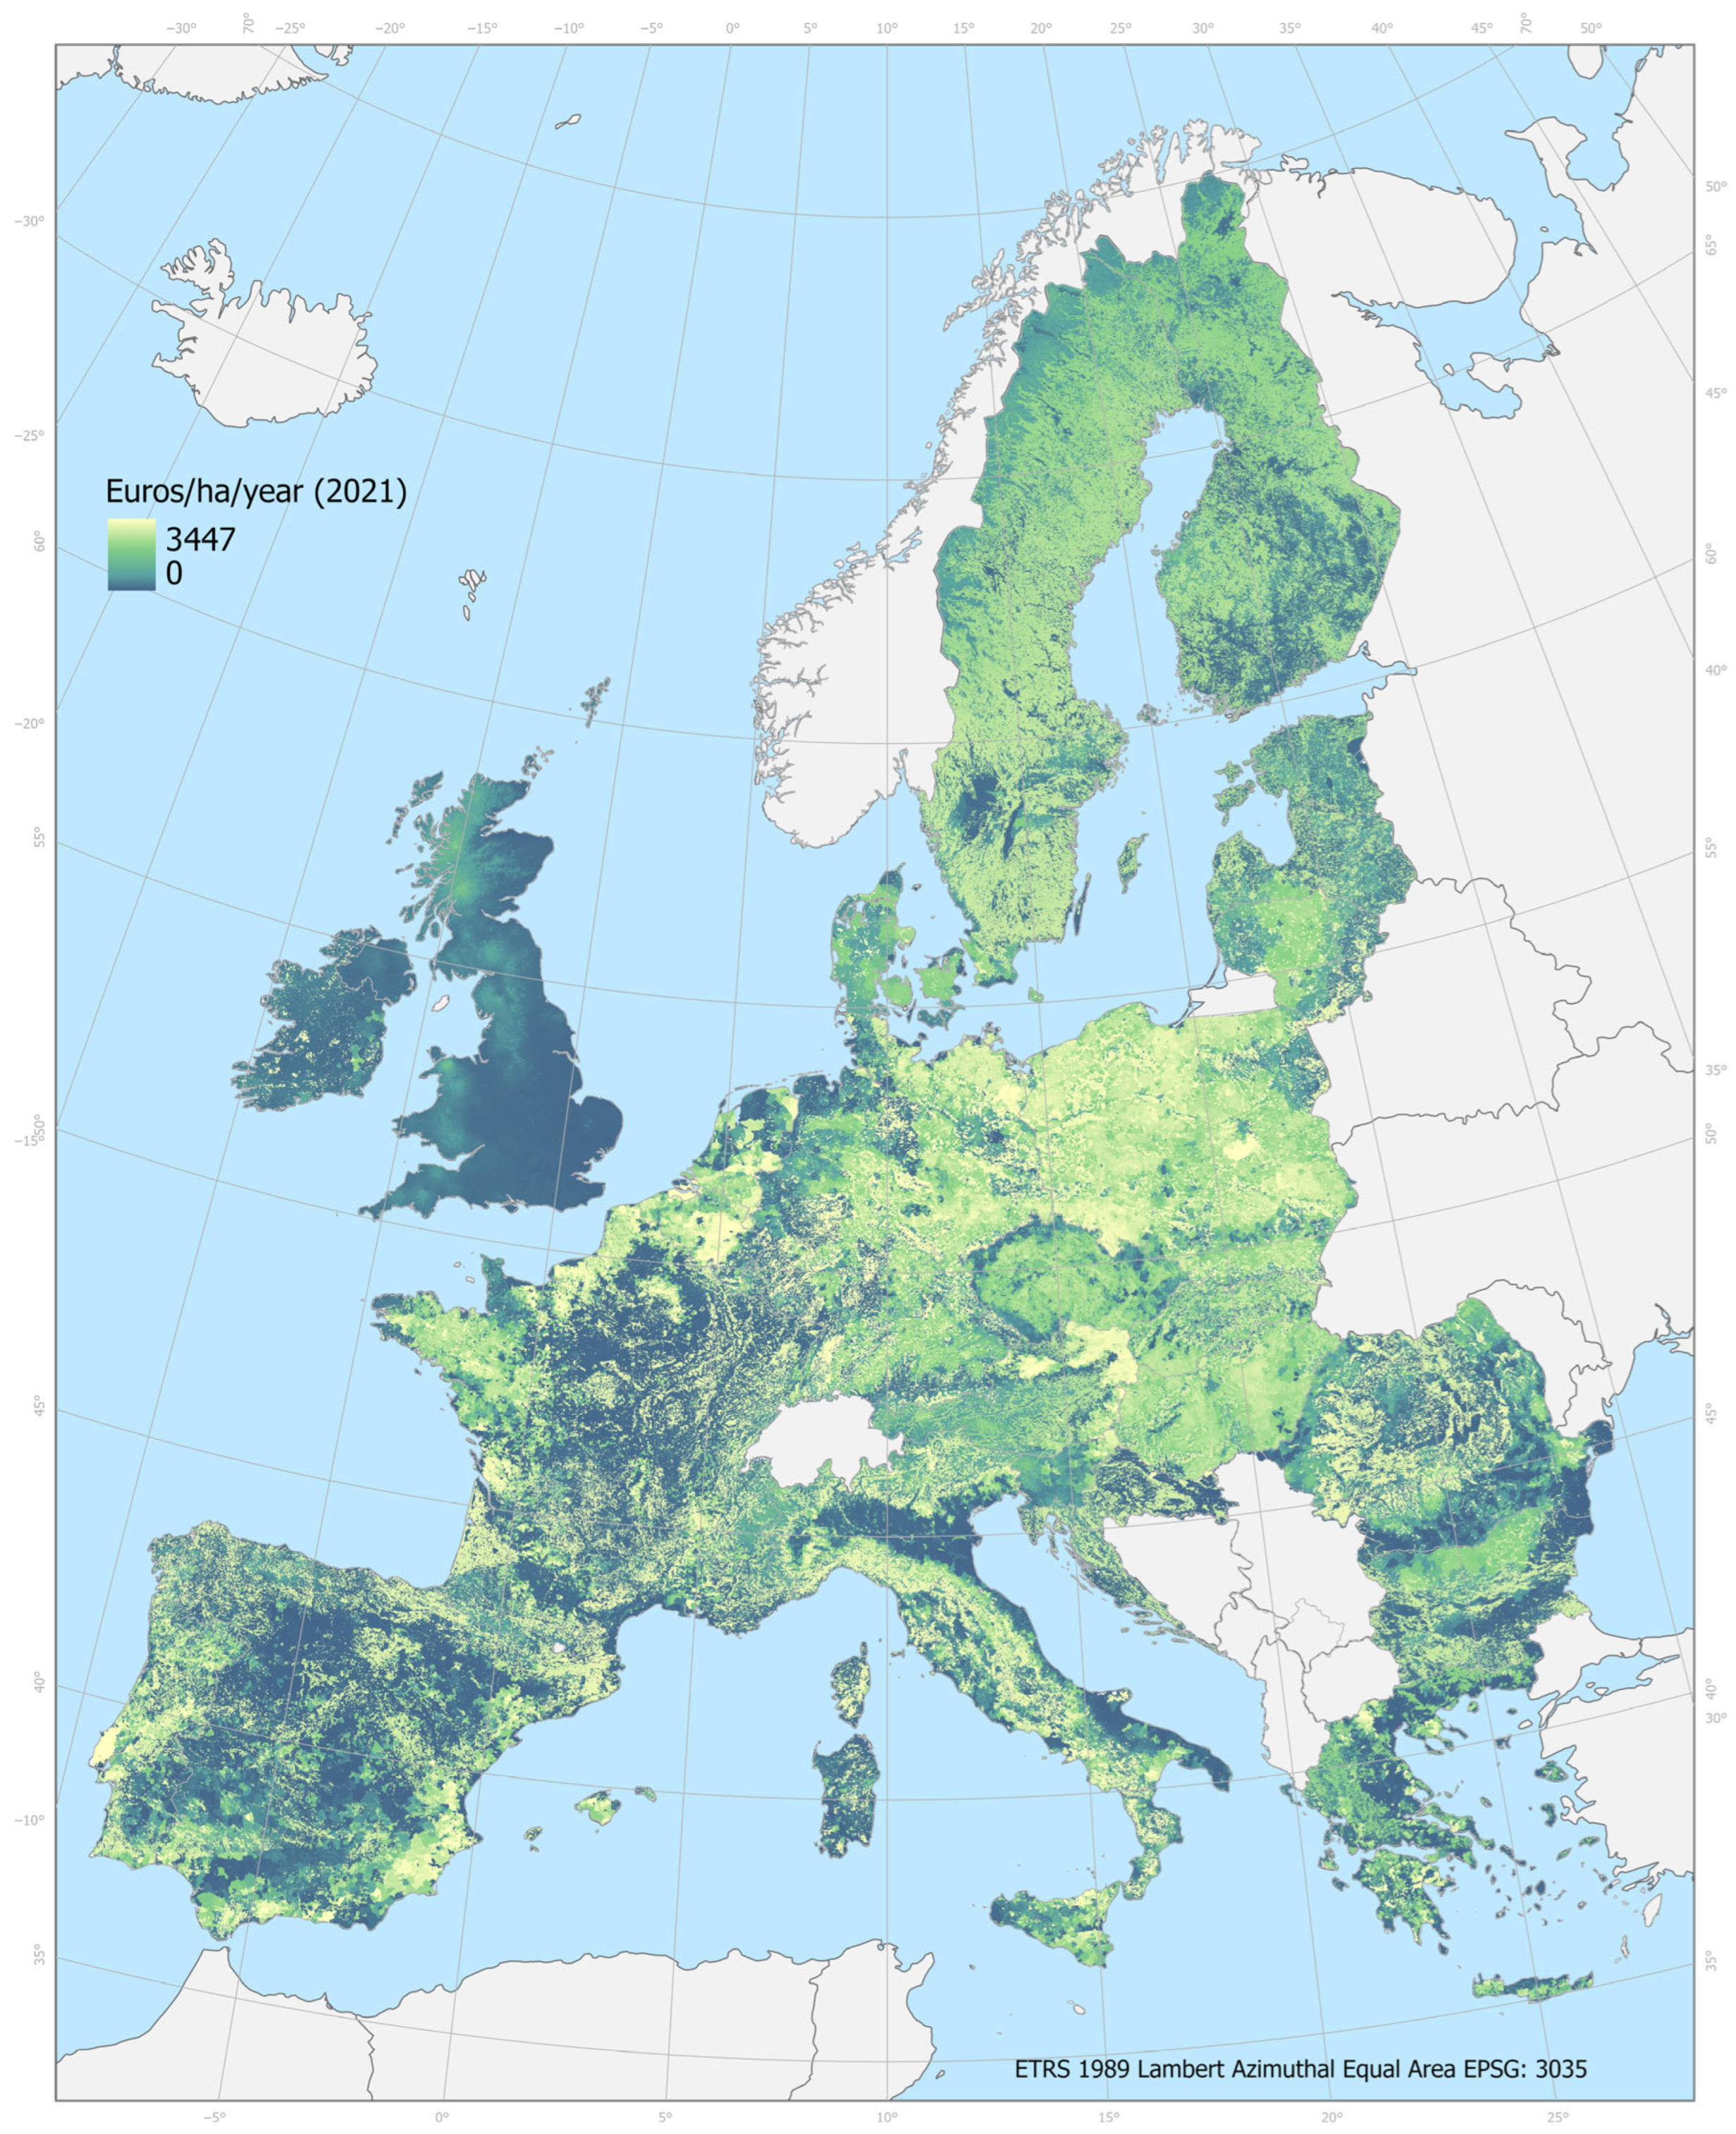
Figure 5 reports the annual values of the ecosystem-regulating services provided by the KIP INCA project in 2018, corrected for inflation in 2021 Euros/ha. These figures also include those services that are not considered in the assessment of damage (e.g., water purification and flood control). Benefits from ecosystem services are distributed more evenly than the agricultural asset values but are characterized by much lower figures than the provisioning services, with a maximum value of EUR 3500/ha. The most valued ecosystem-regulating service is carbon sequestration (EUR 48/ha), while the average lowest value is recorded for soil retention (EUR 0.5/ha). High values are recorded for flood control and crop pollination in Portugal, Belgium, the Netherlands, and Poland. The total average value of all the ecosystem-regulating services is a few hundred Euros per hectare.
These values can be interpreted as real potential damage only in the case of complete loss of the assets generating the ecosystem services. The next section shows the expected damage as a function of the FIP.

4.2. Assessment of Damage

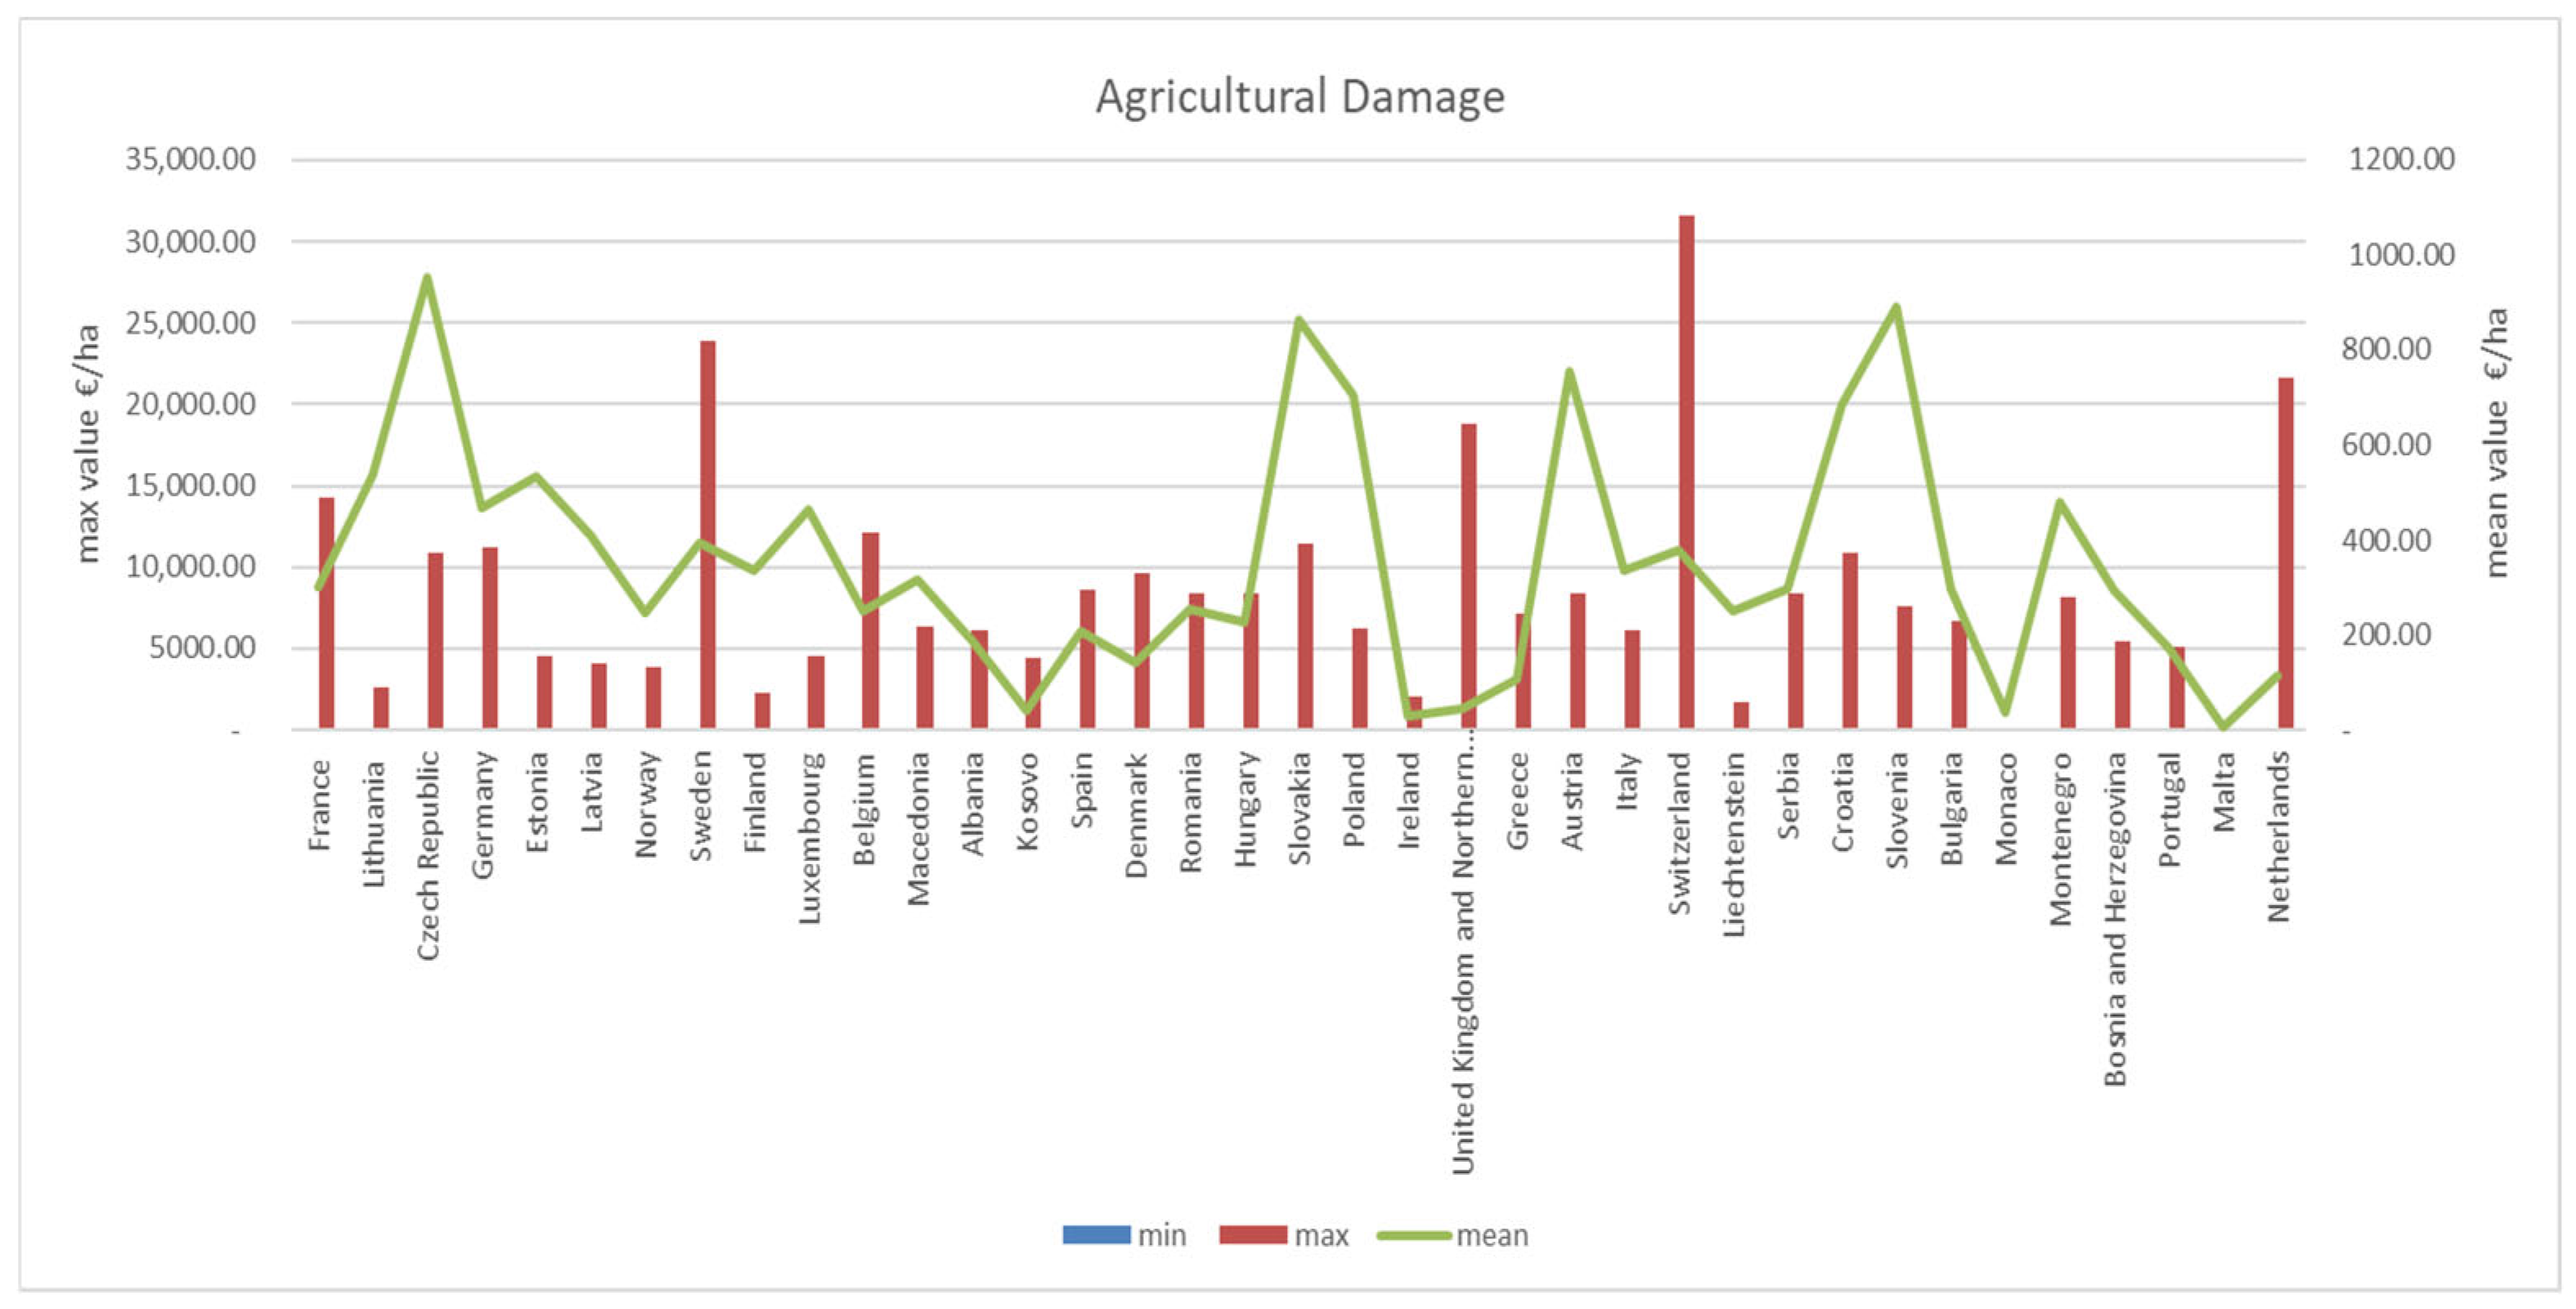
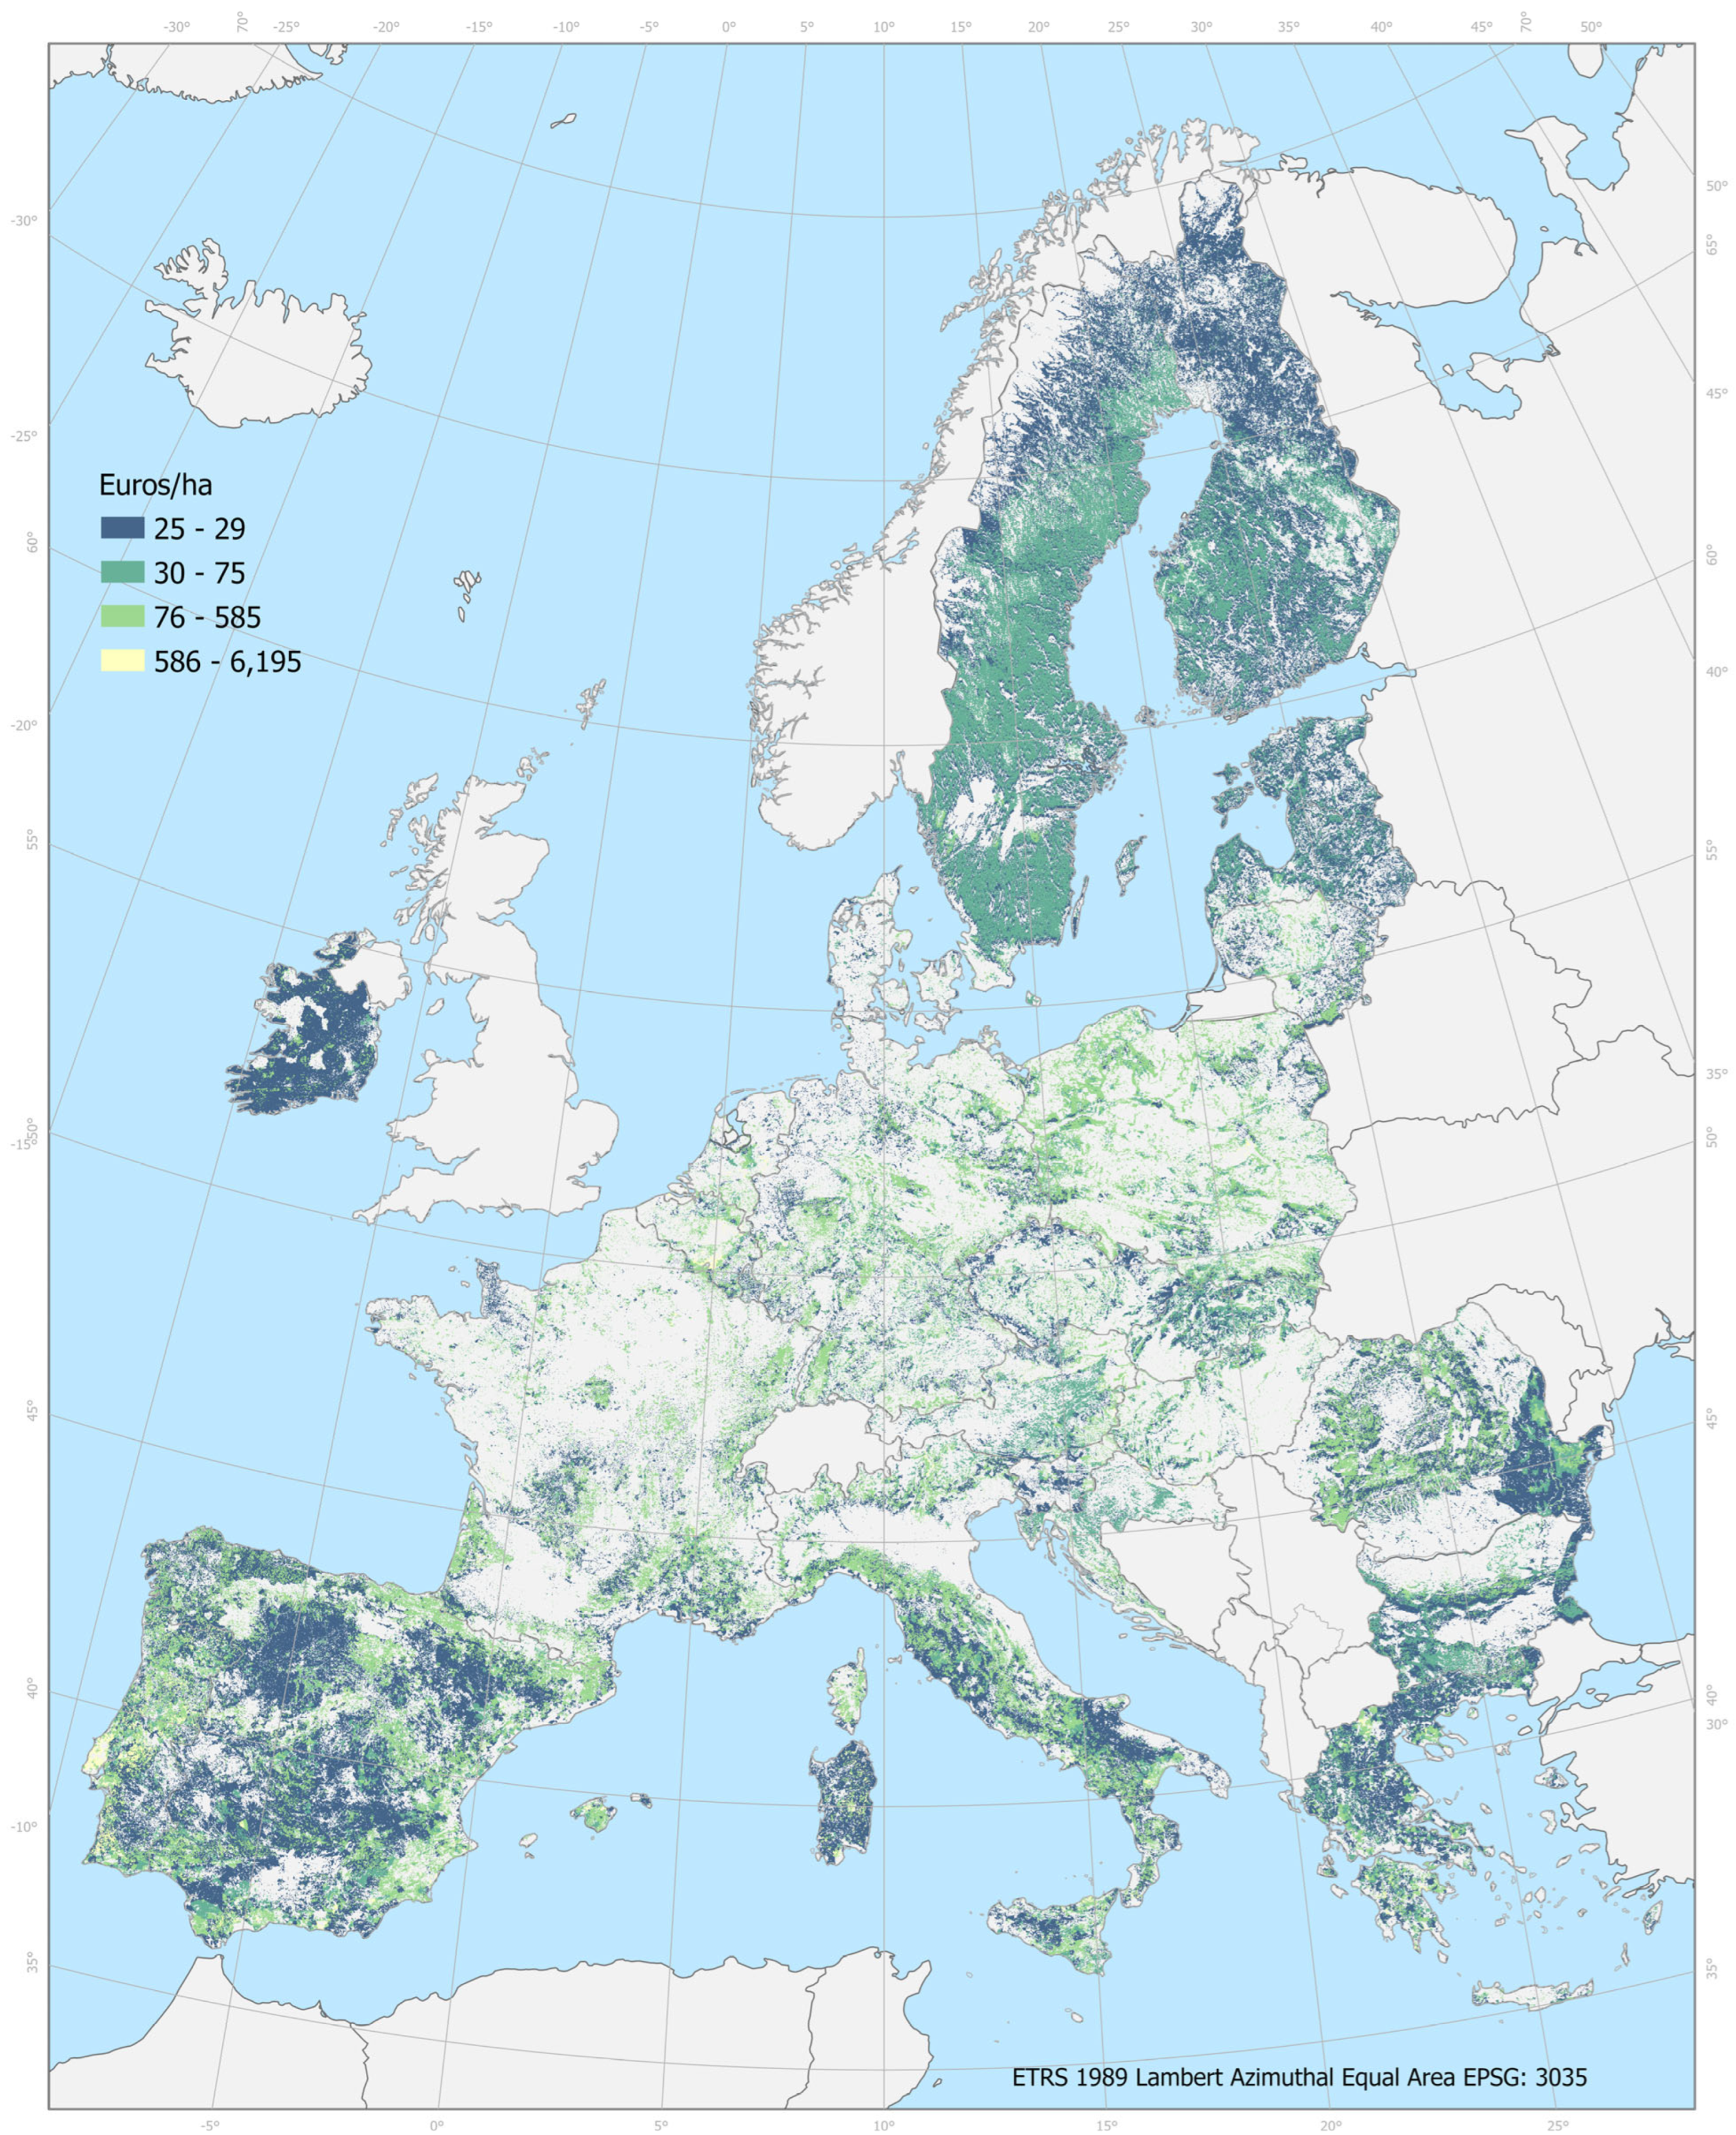
Damage to European agricultural and forestry assets is reported in Figure 6, assuming that a fire may occur anywhere in the European territory. The average highest damages are not expected where the highest benefits are measured, but in those areas experiencing high FIP and low resilience of the environmental assets at stake. Sweden, which is not characterized by the highest agricultural values (Figure 3), shows, on average, very high damage. Forecasted fires seem to significantly affect central and northern European countries, such as Germany, Poland, Estonia, and the Czech Republic, which show expected damage above the average (Figure 7).
High damage is also reported in the Balkan peninsula, the most affected area in Europe, with average values in the range of EUR 400–800/ha, up to two times higher than the average European damage estimated at EUR 352/ha. The average damage in Europe is between EUR 6/ha and EUR 954/ha, while the highest values are recorded for Sweden, Switzerland, and the Netherlands, ranging between EUR 20,000/ha and EUR 35,000/ha.
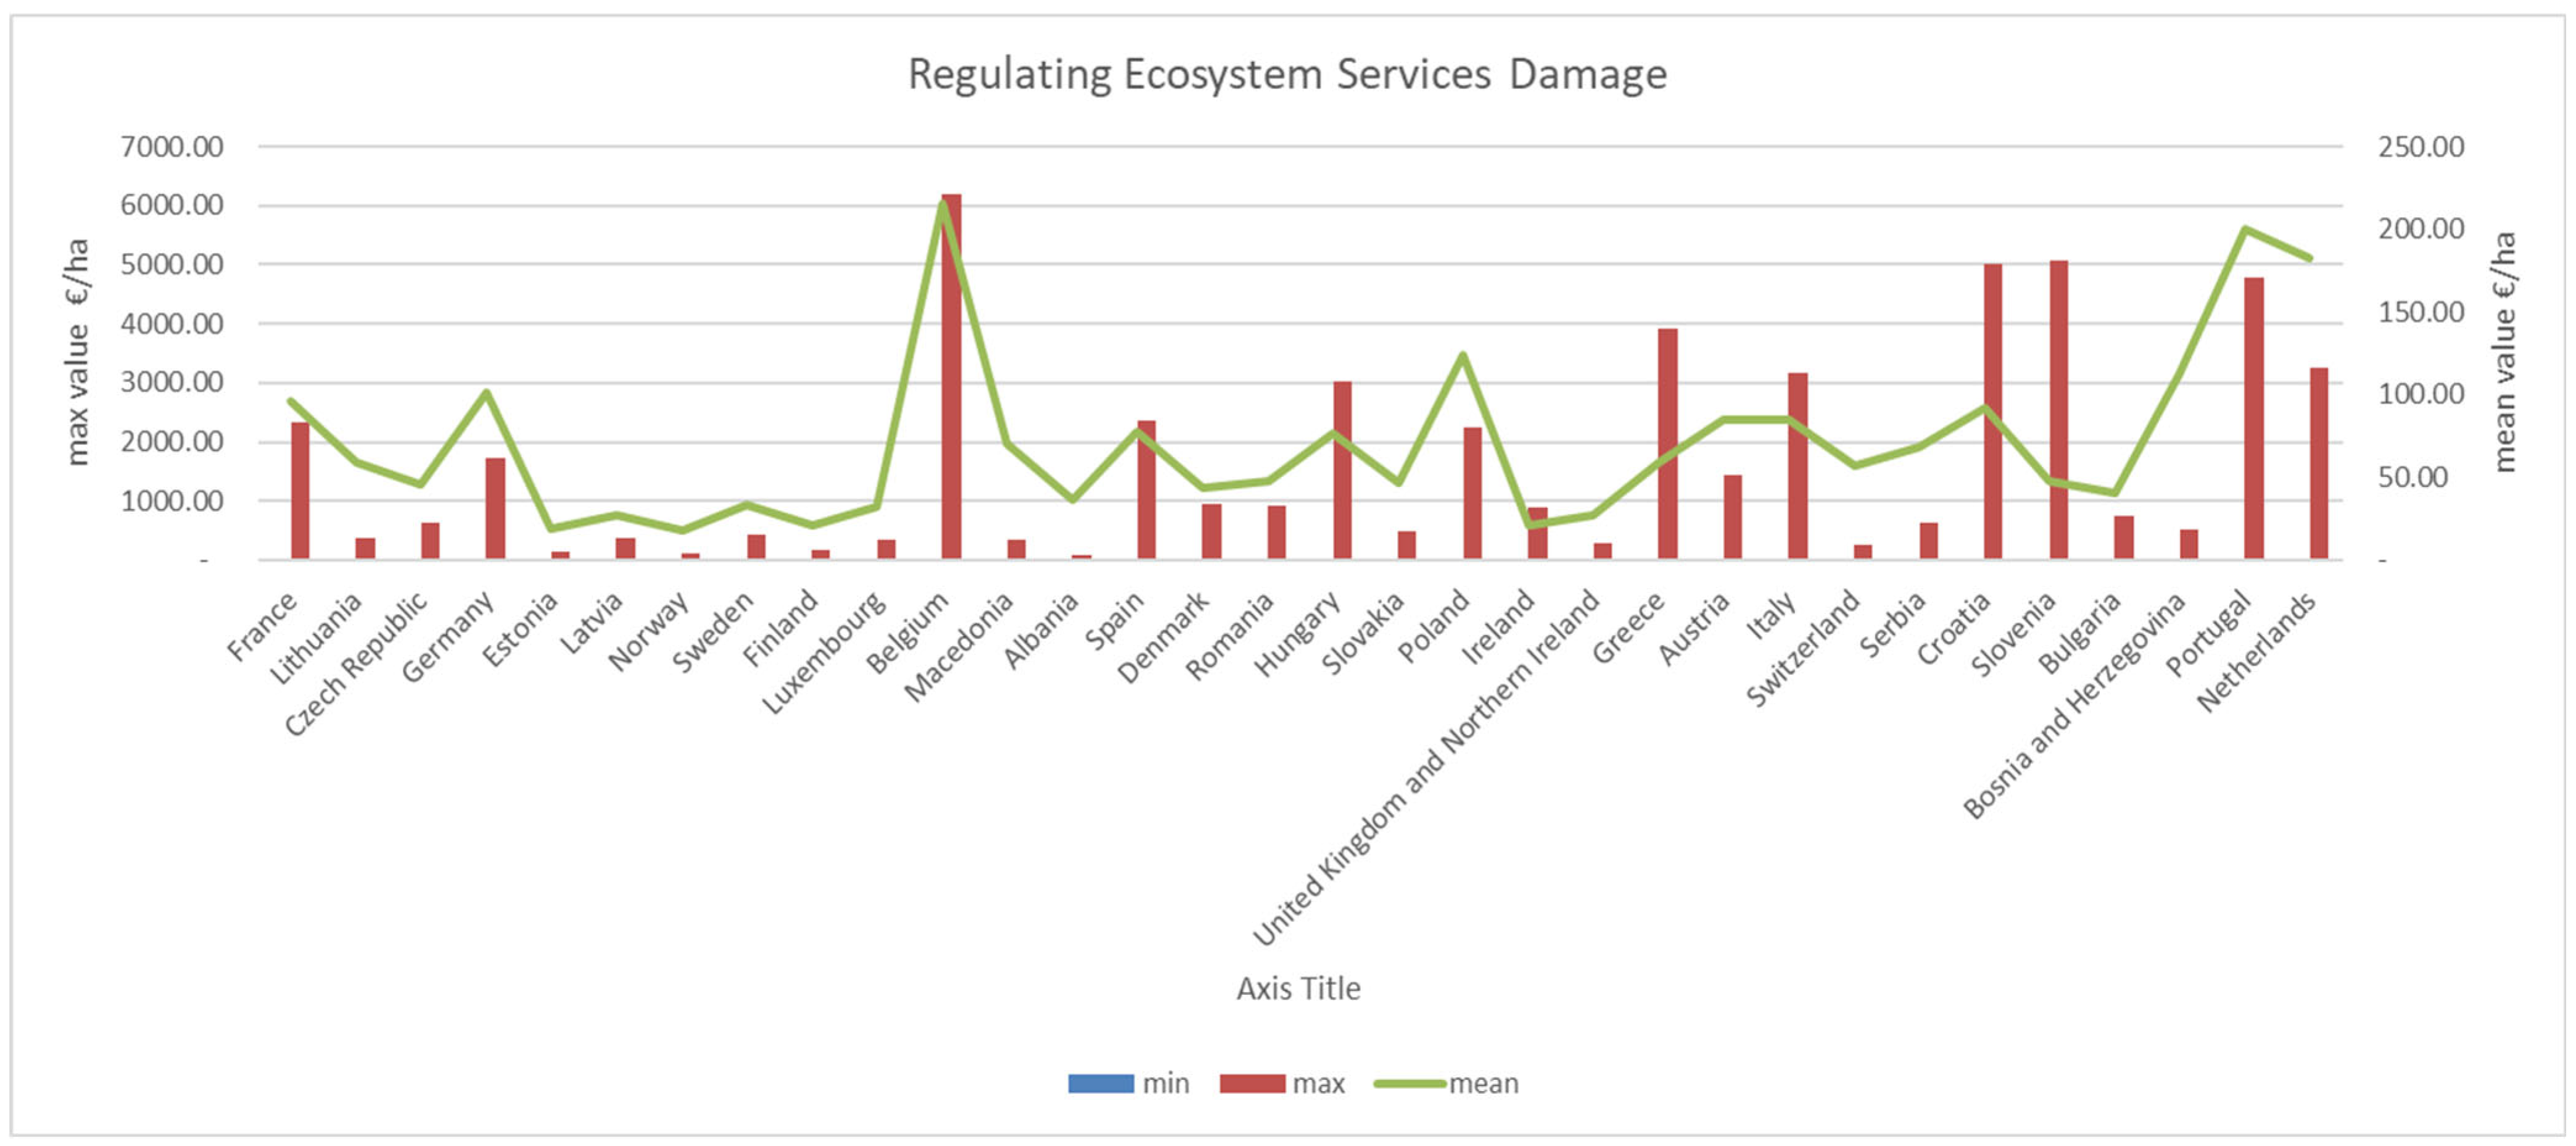
The damages estimated for the ecosystem services are reported in Figure 8. It is visible how these damages are mainly localized in the central–southern part of Europe (Portugal, Spain, Italy, and Greece) with some sparse hotspots in the central and eastern countries. In particular, the average damage is estimated at EUR 71/ha, ranging from EUR 18/ha to EUR 216/ha. There are 12 countries out of 32 suffering an expected damage above the average value. Belgium and Portugal have an average damage (nearly EUR 200/ha) that is three times higher than that estimated for the whole European territory, mainly triggered by the loss of carbon sequestration and crop pollination. Maximum values are recorded in the Balkan peninsula and Belgium, with values ranging from EUR 4000/ha to EUR 6000/ha (Figure 9).
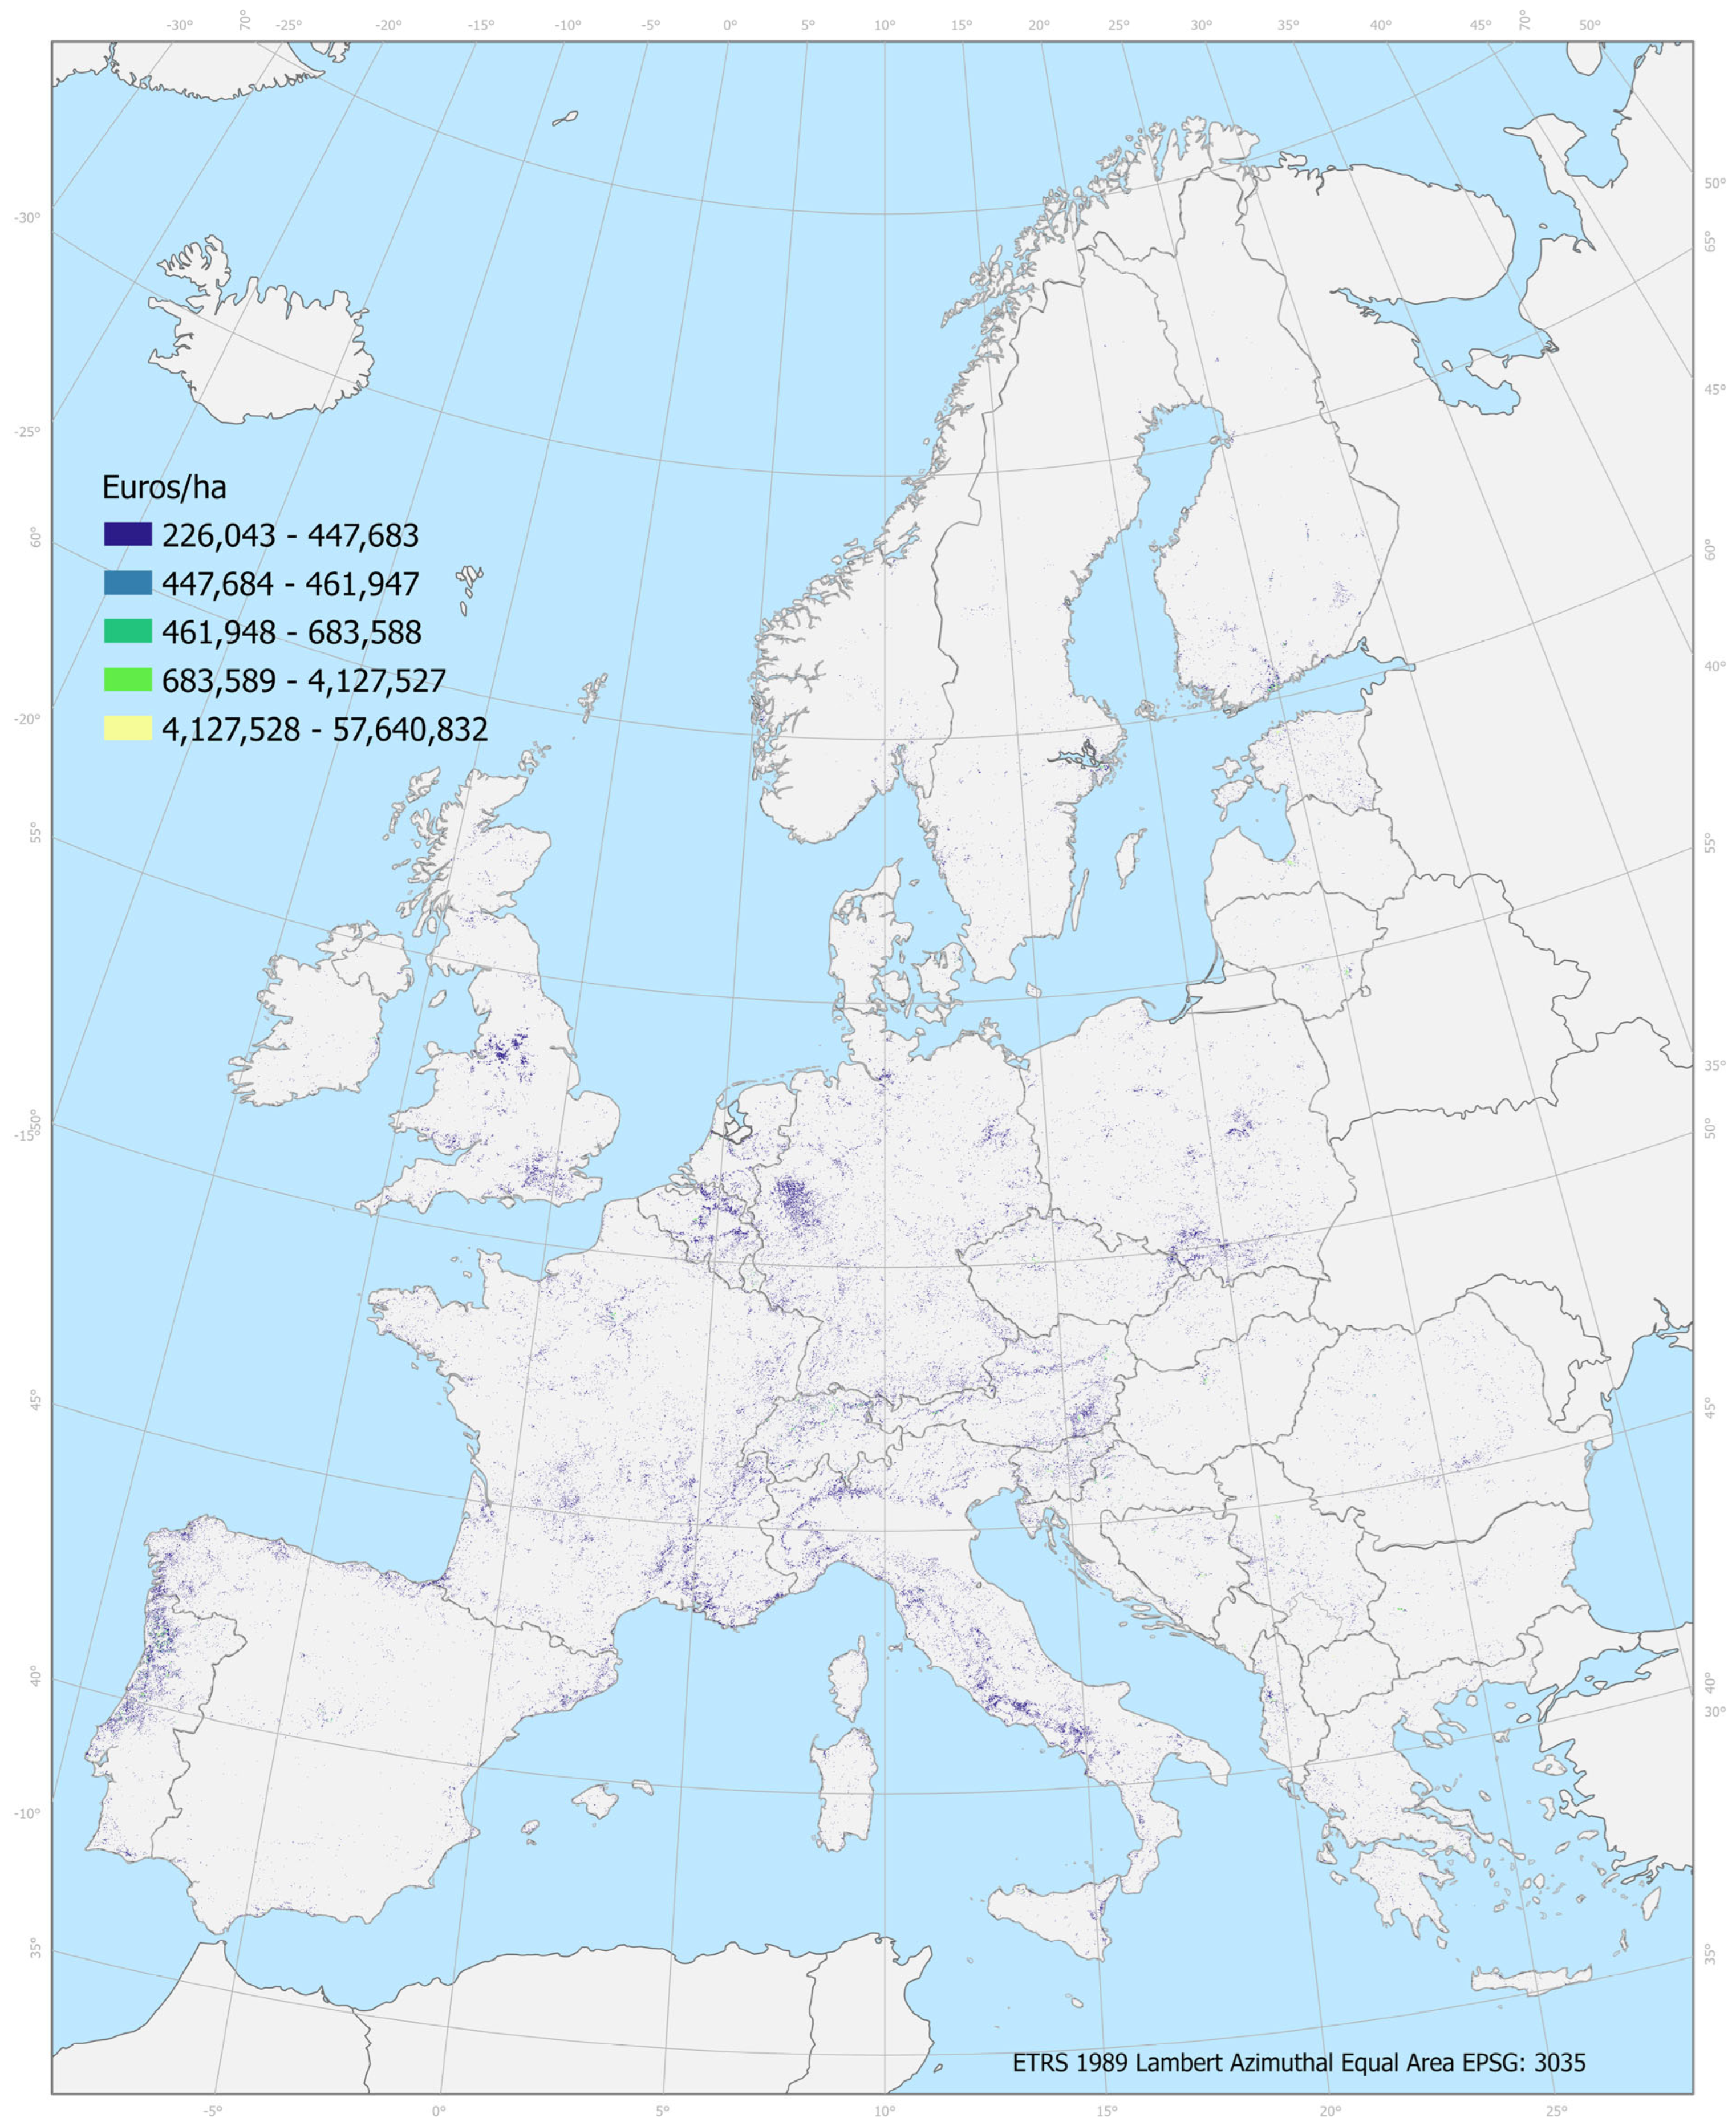
Finally, Figure 10 shows the expected damage to residential properties. Within the WUI, the average damage is valued from EUR 226,000/ha to EUR 1,130,000/ha, three orders of magnitude higher than the agricultural damage. The areas that are mainly affected are those surrounding the European metropolitan areas in France, Germany, the UK, Italy, and the Nordic countries. The Scandinavian countries, making use of wooden infrastructures, report losses of the same order of magnitude as those experienced by the Southern European countries. Exceptions are shown for the Netherlands, Switzerland, and eastern–central part of Portugal, where average damages are expected to be from three to eight times higher (EUR 3 million/ha to EUR 8 million/ha).

5. Discussions

5.1. Contribution to the Current Knowledge on Fire Damage Estimate

We discuss key results in the light of recent estimates provided by the scientific literature, with a focus on some areas of damage that could be further investigated in future studies, and the difficulties of addressing them on a European scale.
The scientific literature is not sparse in the economic valuation of fire damage, as shown in recent reviews [13,15]. Forests are the natural assets most frequently considered because of their provision of multiple ecosystem services [97,98], with damages assessed at the landscape [69,99,100], catchment [101], and regional scales [102].
Timber is certainly the most studied provisioning service damaged by fire, sometimes associated with non-timber forest products, such as firewood and mushroom [7]. Some authors [100] assessed the damage of fires for the supply of three provisioning ecosystem services in Portugal, including timber (softwood), firewood, and wild mushrooms, providing an estimate between EUR 1000/ha and EUR 3000/ha. The damage we assessed for timber alone covers a broader range, from EUR 62/ha to EUR 16,000/ha. The areas more predominantly dominated by vegetational damages are in the central and northern part of Europe, with average values between EUR 1500/ha and EUR 3000/ha, reflecting the low resilience of temperate and boreal forests to fire [20].
Estimates of damage are also proposed in the agricultural sector, which is particularly vulnerable to post-fire desertification and abandonment [103]. In Southern Europe, fires usually occur during the dry season; thus, seasonal crops such as cereals are only marginally affected. More relevant is the impact on permanent crops, such as tree-orchards, olive trees, or vines, that can be severely damaged with significant implications for the local economy [104,105]. The estimates shown in this study are not comparable with those proposed by [105], who assessed direct damage not only to crops and livestock but also to indirect agricultural assets, such as infrastructure, premises, and machinery.
Despite the simplicity of estimating the damage to the agricultural assets, we could not find many examples of wildfire damage to permanent crops. The literature mainly refers to the loss of the product quality (e.g., grapes) caused by fire smoke rather than the direct combustion of the commodity [106]. However, where addressed, estimates of direct damage to crop and agricultural landscapes were carried out using the consolidated concept of fire intensity and natural asset resilience [7,68]. Some scholars [19] used this approach to value acorns, a resource that is priceless, although necessary to feed the Iberian swine.
Because of the lack of direct damage to permanent crops, such as fruit trees, olive groves, and vineyards, it is not possible to verify the robustness of our estimate. Our calculation supports the idea that these damages mainly affect the southern part of Europe, with average estimates higher than those proposed for timber, ranging from EUR 2000/ha to EUR 3000/ha for vineyards and olive groves, and from EUR 4000/ha to EUR 5000/ha for fruit trees.
Among the regulating ecosystem services that can be affected by fire, such as soil erosion, flood regulation, crop pollination, water purification, etc., the most studied is carbon sequestration. Estimates of damage to this service are made considering either social or market values [107]. We used an approach based on discounting the expected carbon sequestration for a period equivalent to the rotation age of the forest stand [68], without making a distinction between species and age of the forest stand, and assuming that the burnt trees lose their commercial value and that the new generation of seeders or resprouters needs 50 years to reach maturity before being commercialized. Carbon losses reported by [68] in Spain were valued at EUR 55–800/ha. Estimates of similar magnitude were proposed by [99] in Oregon (USD 2–400/ha). The average value in the European territory for carbon losses is estimated in our study at EUR 97/ha, with a broad range from EUR 0.1/ha to EUR 1300/ha. The highest estimates of damage were reported for Portugal (EUR 500/ha to EUR 1300/ha), while the lowest values were estimated for the Scandinavian forests (up to EUR 480/ha). On average, the mountain areas of the Alps, Apennines, Pyrenees, and Carpathians recorded damages in the range of EUR 80/ha to EUR 500/ha, confirming the estimates made by other studies outside the European territory.
Some damage is proposed in the literature for recreational values. Using the net value change approach, some authors [29] found that the tourists declined from 2.04% to 76.67% annually in Andean landscapes and from 68.13% to 91.01% in Spanish areas after wildfires. Research has also shown behavioral changes in the use of landscapes affected by fire by recreationists such as hikers, mountain bikers [108,109,110], and users of riverine waters [111]. While we recognize that these values are relevant to inform recovery strategies or setting economic resources to invest in fire risk prevention, these estimates acquire significance mainly on a local scale and cannot be easily transferred to the regional scale targeted by our study. Similar consideration can be made for studies addressing the loss of biodiversity. Some authors [67] addressed the impacts of wildfires on biodiversity, focusing on the concept of flagship species. They assessed the recovery costs for species protection and their habitats, analyzing public investments in recovery programs and conducting contingent valuation (CV) surveys to elicit people’s willingness to pay (WTP) for the conservation of keystone species.
Fire impact on soil is widely studied, considering microbial biomass [112], contamination of soil and waters through the mobilization of heavy metals [90,113], and an increase in the frequency of debris flows [114,115,116] and rockfalls [117]. However, research on soil economic damage is not available to the best of our knowledge. We found that the countries most affected by soil damage are Portugal, Spain, Italy, and Greece, with average values estimated between EUR 1/ha and EUR 20/ha. While these estimates seem negligible, they are primarily based on the cost of nitrogen (e.g., replacement cost at market price) necessary to compensate for the loss of nutrients. They are not an expression of the marginal productivity of soil nutrients on crops, which is expected to be higher than the market price of nitrogen.
Damage to infrastructures can be assessed using a cost-based method (considering expenses for rebuilding or repairing) [105], although the local market price of properties has also been adopted [7]. Owing to the difficulties in retrieving such capillary information for the entire European territory, this research has proposed an approach based on the linear relationship between the market price of properties and the local GDP. While this approach needs to be validated, we found similarities between our estimates and those proposed by [7] for Spain, especially in the WUI, where our model estimated damages in the range of EUR 200,000/ha to EUR 1,000,000/ha.
The approach proposed focuses on direct damage to key natural capital assets and their ecosystem services. However, other losses are possible but are difficult to map at the scale considered by this study. Some of those that are rarely considered in vulnerability studies refer to the analysis of health damage and indirect impacts on the economy. These damages were not estimated in our study, although they can be more relevant than direct impacts to natural capital assets and make a strong case for more effective fire prevention and suppression policies. Damage to health (e.g., caused by fire smoke) is well valued in the American literature, using a range of approaches, such as Benefit Transfer Method, Contingent Valuation Method (CVM), Cost–Benefit Analysis, Cost of Illness (COI), Defensive Behavior Method (DBM), and Life Satisfaction Approach [118,119,120,121,122]. Conversely, there is a lack of research in Europe, and transfer of benefits from US estimates is not feasible because of the different geographic and socio-economic contexts between the study site and the areas of policy intervention. Finally, indirect impacts on the economy are likely to occur after a fire. Reference [123] measured the cascading effect of wildfires on regional and national supply chains by using advanced regional input–output modeling, while [124] examined the effect of large wildfires on employment growth.

5.2. Innovation in the Approach Proposed

This paper has described in detail the vulnerability approach adopted in the H2020 FirEUrisk project [14] to value the economic damage caused by fires on a range of natural capital assets and ecosystem services. We implemented this approach, building on the widely accepted concept of vulnerability in international literature [24] with the goal of complementing the analysis of ecological vulnerabilities to wildfires for the European biomes [14,60].
While ecological and economic vulnerabilities are described by two distinct outputs (a qualitative score for the ecological vulnerability and a monetary enumerator for the economic assessment of damage), they share some conceptual similarities. Both build on the idea that ecosystems must be analyzed according to their resilience to fire, showing a capacity to resist and recover according to the presence of fire-adapted ecological traits [125]. Assessing economic damage requires three key aspects: (1) the real value of the assets; (2) the coping capacity expressed as expected losses from fires; and (3) the time necessary for the natural capital asset to generate new sources of income.
We have considered the approach proposed by [23,24] using penalty coefficients to describe the resistance of ecosystem services to fire. As per [7,23], the recovery time is a function of the natural capital asset and damage, assumed constant until the natural capital returns to the pre-fire ecological conditions. A range of recovery times is considered for different assets. Common values are 20 years for forests, 5 years for shrublands, and a few months for grasslands [23]. However, these values can be corrected in case of unfavorable conditions using a multiplier of 1.5. Other authors [7] used time multipliers calibrated according to conditions and vulnerabilities, referring to rainfall, soil erosion rate, frequency of fire, and fuel availability. Using these multipliers, the recovery time may cover a broad lifespan from 1 to 9 years for grasslands, from 6 to 28 years for shrublands, and from 45 to 209 years for seeding trees [7]. While this approach provided a variety of punctual values, we opted for a simplified solution because of the lack of knowledge necessary to carry out such a detailed valuation: a range of penalty factors (loss coefficients) that depend on fire intensity and a fixed recovery time to regenerate the streams of revenues from the natural capital assets.
Conversely, an innovative approach to modeling the recovery values of carbon sequestration was proposed by adopting a logistic function, in which the service modeled is assumed to be a dynamic and time-dependent function of the capacity of the natural asset to recover. The recovery time adopted is aligned with the lower range provided by [7] and justified by the recent peer-reviewed literature on the recovery of forests, as proposed in the Methodology Section. Using a longer time of recovery would not generate a much higher estimate of damage because of the relevant impact of the discount rate on the benefits accruing late in the cash flow [126,127,128,129]. Because of the public nature of the goods considered, economic values were actualized using a social discount factor as proposed by [7] using a geometric discount rate rather than a hyperbolic one, the latter usually adopted for very long cash flow (e.g., when considering the effect of climate change over a period of more than 100 years) [95].

5.3. Limits of the Approach

The approach proposed in this paper is the first attempt to solve, in a tractable way, the problem of assessing economic fire vulnerability on a continental scale. To achieve this, a set of assumptions in the assessment of the coping capacity and time of recovery of natural assets was introduced, including the full recovery of natural capital assets to the pre-fire status. The most important is the use of the loss coefficient studied in the Mediterranean ecosystem, which may not be necessarily suitable for Central European ecosystems. To improve the estimates of this model, the loss coefficients tested in Spain should be empirically measured for the ecosystems of all the countries included in the damage function, at least at the biome scale [20]. However, owing to the impossibility of measuring these coefficients for the biomes covering central European countries, the model assumed that temperate and boreal ecosystems respond to fire similarly to those dominating the Mediterranean climate. This is a limitation, considering that temperate and boreal forests show a lower resilience determined by a longer recovery time [20].
A second limit of the approach proposed is that the vulnerability model cannot be easily validated [23], limiting its ability to support wildfire prevention and suppression policies. A possible solution would consist of the assessment of the impacts measured after the occurrence of extreme fires. Although validation at the European scale would be difficult because the few studies available have a local dimension, we have verified that the estimates of damage provided by this research have the same order of magnitude as studies carried out in Mediterranean countries.
Beyond the limits proposed above, it is evident that the difficulty lies in working at a scale covering all European territories because of the limited access to physical and economic data provided by reliable statistical sources. While we were able to find biophysical information collected using a common approach for all the EU countries in the EUROSTAT database, for economic data, it is necessary to dig into statistics reported in several databases of any country considered in the study. Common databases collating, in a congruent way, economic information (e.g., prices) are not available. For reasons of simplicity, we decided to use prices referring to one or two markets (e.g., the UK price for timber and the price of olives for Italy), assuming that the same goods are traded at the same price everywhere in Europe. The use of multiple sources (physical and economic) having a different range of resolutions (from 1 ha to NUT regions) means that a compromise must be found (we opted for rescaling data to 1 km2) at the cost of losing some granularity.
To provide a more detailed analysis of the damage, other values should be assessed: the infrastructure, cables, roads, and railways should be considered, although, for lack of data covering the entire European territory, these assets were excluded in our research. Public values such as health may be severely affected by fire. However, while specific literature is available in the US, European academia has not dedicated the same attention to this topic.
We found some difficulties in reconstructing the value and damage of properties for the entire European continent. Because of the lack of a common database reporting residential values on a granular scale, we used ballpark figures proposed by NUNBEO (a non-peer-reviewed source) at the national or regional scale, which, when scaled using localized measures of GDP per capita, generated estimates aligned with (i.e., of the same order of magnitude as) the current market price.
Finally, more ecosystem services should be considered. We refer here to the possibility of treating damage not only to tourism and recreation but also to regulating services, such as water purification and flood mitigation. In particular, the last two ecosystem services should play an important role, and their exclusion may cause a misleading perception of the total expected environmental damage. While benefits provided by these excluded ecosystem services are assessed under optimal conditions, as estimated by the KIP INCA project, their use in fire damage models is not straightforward. The change in the ecosystem extent and condition induced by fires needs to be considered in the supply function of these ecosystem services affected by fire before estimating the economic damage.

6. Conclusions

We have proposed an approach to assess the expected damage of fires to a range of natural and semi-natural assets and ecosystem services within the European territory at the resolution of 1 km2. We found that damage to provisioning services (agriculture, forestry, and livestock) is quite relevant, especially in central and northern countries, while the Mediterranean regions show higher impacts on regulating ecosystem services and residential properties (particularly central and northern areas of Portugal and Spain).
Some ecological hotspots expected to suffer relevant damage are the mountain areas of the Pyrenees, Alps, and Apennines, as well as the Caucasian, Carpathian, and Balkan regions, showing the relevance of forest vegetation in the definitive assessment of the economic damage induced by fires. It is in these areas that the results of this study suggest mitigation interventions by reinforcing management strategies to prevent and suppress fires through additional investments in fuel management, such as prescribed burns and grazing, fire-resistant community development with building codes and vegetation management, and community engagement via education and risk awareness programs [130,131]. Integrated Fire Management (IFM) can be used to combine these strategies with early detection, rapid response, and post-fire restoration [132].
Excluding residential properties, the average damage of all the ecosystem services under extreme fire conditions was estimated at EUR 1100/ha, although the minimum–maximum interval was quite broad (EUR 100/ha to EUR 7300/ha), with values evidencing a right-skewed distribution. The most valuable agricultural assets (fruit trees and vineyards) suffered damages ranging from EUR 3000/ha to EUR 5000/ha. Among the ecosystem services, crop pollination and carbon sequestration showed the highest damage, nearly EUR 30/ha and EUR 100/ha, respectively. Finally, the average damage expected from residential areas was 2–3 orders of magnitude higher than natural capital losses, between EUR 200,000/ha and EUR 3 million/ha.
While these estimates are an initial point of discussion, around which to propose new protection policies, the results suffer from the difficulties of being validated. However, we are confident that the approach used is robust enough based on consolidated valuation methods adopted in the current international literature dealing with environmental disasters. We are also confident in the rigorousness of damage in the Mediterranean countries, and that the estimates provided by our study, building on coefficients of damage empirically measured in Spanish ecosystems, are likely adaptable to similar geographical and ecological contexts. However, it is not possible to state with confidence the extent to which these coefficients can be used in non-Mediterranean ecosystems. To overcome this issue, new research is needed. It is expected that our study may stimulate further research on those ecosystems that show low resilience to fire, focusing on the empirical analysis of the damage and recovery of natural assets. This would contribute to generating new empirical estimates of damage that can help validate and refine the results suggested by this research.
Notwithstanding this limit, we think that the results of this study are valuable to discriminate areas of major concerns at risk of damage in Europe and stimulate countries to intervene by the implementation of different measures against wildfire hazards, the definition of the expected level of compensation in case of damage, and the inclusion of these costs in national or regional budgets.

Author Contributions

Design: S.M., E.C., J.R.M. and C.O.; data analysis: S.M. and C.O.; GIS analysis and mapping: C.O.; methods: S.M., J.R.M. and E.C.; first draft: S.M., J.R.M., C.O. and E.C.; editing: J.R.M., C.O., E.C. and S.M.; finalization and submission: S.M.; review and editing: S.M. All authors have read and agreed to the published version of the manuscript.

Funding

This paper is funded by the H2020 Project FirEUrisk (Grant Agreement Number: 101003890). This research is also supported by the Rural and Environment Science and Analytical Services Division of the Scottish Government through its Strategic Research Program (2022–2027), project JHI-D5-1 “Bringing in participatory approaches to widen the scope of natural capital valuation” and JHI-D5-2 “Climate Change Impacts on Natural Capital”, in the Natural resources Theme.

Data Availability Statement

We have provided information in the Methods Section and Table A1 of Appendix A to show the raw data and the approach adopted to measure the benefits of the natural capital assets considered in this study. In addition, we have a file containing the layers published in the article (https://doi.org/10.5281/zenodo.17121905), and a file inventorying maps of natural capital assets and ecosystem services, and the process followed to calculate the damage caused by wildfires (https://doi.org/10.5281/zenodo.17121793). The GeoTIFF maps elaborated in this research referring to individual agricultural assets and ecosystem services can be made available upon request by contacting Clara Ochoa at mclara.ochoa@uah.es or Emilio Chuvieco at emilio.chuvieco@uah.es.

Acknowledgments

We are grateful to the reviewers that have provided valuable comments to improve the coherence of this manuscript.

Conflicts of Interest

The authors declare no conflicts of interest.

Appendix A

Table A1. Summary of the information used for the valuation of ecosystem services; source: [13], Appendix C of the Report on Methodological Frameworks for Vulnerability Assessment—deliverable D1.4 of the FirEurisk project. The weblinks reported in Table A1 were accessed in 2022 at the time the ref [13] was produced.
Asset Biophysical InformationPrice InformationCost or Profit Margin
Forest/
Timber
Timber growth expressed in m3/ha in each country is provided by EUROSTAT (https://www.eea.europa.eu/data-and-maps/indicators/forest-growing-stock-increment-and-fellings-3/assessment, accessed on 10 May 2025)
JRC provided a forest Biomass Map showing the aboveground forest biomass density in Europe for 2010 [47].
Stumpage price of softwood (EUR 70/m3 in June 2022) is provided by Forest Research (https://www.forestresearch.gov.uk/tools-and-resources/statistics/statistics-by-topic/timber-statistics/timber-price-indices/, accessed on 10 May 2025).Profitability of 5% was used to calculate the net annual revenue expressed in EUR/ha per year (https://finmodelslab.com/blogs/how-much-makes/lumber-yard#:~:text=Profit%20Breakdownsandtext=For%20instance%2C%20while%20gross%20margins,boost%20margins%20in%20niche%20markets, accessed on 10 May 2025).
Fruit groveEUROSTAT provided the data on fruit production and revenue for the year 2017 (https://ec.europa.eu/eurostat/statistics-explained/SEPDF/cache/53634.pdf, accessed on 10 May 2025; Statistics|Eurostat (europa.eu).A profit margin of 20% was considered following [133].
Olive groveEUROSTAT provided data on olive production for the period 2011 to 2021 (https://ec.europa.eu/eurostat/databrowser/view/TAG00122/default/table, accessed on 10 May 2025).We used the average price of EUR 0.45/kg, observed in 2021 by the Italian Institute for food market (ISMEA), to convert production into revenue (https://www.ismeamercati.it/flex/cm/pages/ServeBLOB.php/L/IT/IDPagina/652, accessed on 10 May 2025)
Total revenue has been divided by the area of olive plantations per country as reported by EUROSTAT (https://ec.europa.eu/eurostat/databrowser/view/orch_olives2/default/table?lang=en, accessed on 10 May 2025)
The cost of managing olive groves was estimated at EUR 500/ha (following ISMEA).
An interest rate of 3% was used to calculate the capital value for olive groves.
VineyardValues of the vineyard were calculated at NUTS 2, building on EUROSTAT data (according to the classification provided in 2010). Production of wines in hectolitres is available at https://ec.europa.eu/eurostat/databrowser/view/VIT_AN7$DEFAULTVIEW/default/table, accessed on 10 May 2025.
Areas of vineyard production are provided by EUROSTAT at https://ec.europa.eu/eurostat/databrowser/view/VIT_AN5$DEFAULTVIEW/default/table, accessed on 10 May 2025.
Information is provided for the years 2007 and 2008.
We used the economic value of wine provided by ISMEA in 2021. We considered the price of unbottled wine as EUR 1.5 per liter. (https://www.ismeamercati.it/flex/cm/pages/ServeBLOB.php/L/IT/IDPagina/2603, accessed on 10 May 2025). This price is also confirmed by [134].A margin of 25% was used to calculate the net annual revenue of a vineyard. We assumed depreciation and maintenance costs of EUR 4000 per ha—(http://www.inumeridelvino.it/2014/02/il-costo-di-conduzione-della-vigna-e-potenziale-riduzione-studio-camera-agricola-di-bordeaux.html#:~:text=Il%20costo%20totale%20di%20conduzione,chimica%20ma%20molte%20pi%C3%B9%20lavorazioni, accessed on 10 May 2025).
CattleEUROSTAT reports the number of heads up to 2016 at NUTS 2 scale (https://ec.europa.eu/eurostat/databrowser/view/EF_LSK_MAIN__custom_3144197/default/table, accessed on 10 May 2025)We used the average price of cattle in the UK, which, in 2021, was GBP 1600 (https://ahdb.org.uk/dairy-cattle-rearing-calf-prices, accessed on 10 May 2025).
According to ISMEA, the market price of a life head per kg in Italy was approximately EUR 3.4 in 2022 (https://www.ismeamercati.it/flex/cm/pages/ServeBLOB.php/L/IT/IDPagina/722, accessed on 10 May 2025).
Assuming an average weight of 600 kg per head (weight that can be achieved in 1 year), the value of a store cattle per head is approximately EUR 1800.
In Italy, for the year 2016, the cost of rearing livestock was approximately EUR 2.50 per kg (https://informatorezootecnico.edagricole.it/bovini-da-carne/ismea-nei-vitellone-costi-non-coprono-spese/, accessed on 10 May 2025).
Correcting for inflation (prices 10% higher in 2022 than in 2016), the cost of rearing is recalculated as EUR 2.75/kg
(https://tradingeconomics.com/euro-area/consumer-price-index-cpi#:~:text=Consumer%20Price%20Index%20CPI%20in%20Euro%20Area%20is%20expected%20to,macro%20models%20and%20analysts%20expectations, accessed on 10 May 2025).
We assume a cost per head of EUR 1650 and a net value per head of EUR 150.
SheepEUROSTAT is used to cosuder at the NUTS 2 region the number of heads up to the year 2016 (https://ec.europa.eu/eurostat/databrowser/view/EF_LSK_MAIN__custom_3144197/default/table, accessed on 10 May 2025).The cost of rearing a sheep was, in 2021, on average GBP 60 per ewe in the UK (https://www.cafre.ac.uk/2022/04/21/managing-rising-costs-on-sheep-farms-plan-ahead-to-remain-profitable-with-this-years-lamb-crop/, accessed on 10 May 2025).
Similar values are recorded for the USA market, where the cost of rearing sheep was about USD 60 per ewe (https://familyfarmlivestock.com/raising-sheep-for-profit-lets-look-at-some-numbers//, accessed on 10 May 2025).
We assume a rearing cost of EUR 70 per head, with revenue per head in the order of EUR 3 to 4 per kg (https://www.ismeamercati.it/flex/cm/pages/ServeBLOB.php/L/IT/IDPagina/817, accessed on 10 May 2025).
We assumed an average weight of 50 kg per ewe; the gross revenue per head is estimated at EUR 150 to EUR 200.
We assume that, on average, the net revenue per sheep can be approximately EUR 100.

References

  1. Martin, R.; Sapsis, D. Fires as Agents of Biodiversity: Pyrodiversity Promotes Biodiversity. In Proceedings of the Conference on Biodiversity of Northwest California, Santa Rosa, CA, USA, 28–30 October 1991; pp. 150–157. [Google Scholar]
  2. Andersen, A.N. Responses of Ant Communities to Disturbance: Five Principles for Understanding the Disturbance Dynamics of a Globally Dominant Faunal Group. J. Anim. Ecol. 2019, 88, 350–362. [Google Scholar] [CrossRef] [PubMed]
  3. Isbell, F.; Gonzalez, A.; Loreau, M.; Cowles, J.; Díaz, S.; Hector, A.; Mace, G.M.; Wardle, D.A.; O’Connor, M.I.; Duffy, J.E.; et al. Linking the Influence and Dependence of People on Biodiversity across Scales. Nature 2017, 546, 65–72. [Google Scholar] [CrossRef]
  4. Pausas, J.G.; Keeley, J.E. Wildfires as an Ecosystem Service. Front. Ecol. Environ. 2019, 17, 289–295. [Google Scholar] [CrossRef]
  5. Scasta, J.D. Fire and Parasites: An Under-Recognized Form of Anthropogenic Land Use Change and Mechanism of Disease Exposure. EcoHealth 2015, 12, 398–403. [Google Scholar] [CrossRef]
  6. European Commission. Communication from the Commission to the European Parliament, the Council, the European Economic and Social Committee and the Committee of the Regions. In Forging a Climate-Resilient Europe—The New EU Strategy on Adaptation to Climate Change; European Commission: Brussels, Belgium, 2021. [Google Scholar]
  7. Román, M.V.; Azqueta, D.; Rodrígues, M. Methodological Approach to Assess the Socio-Economic Vulnerability to Wildfires in Spain. For. Ecol. Manag. 2013, 294, 158–165. [Google Scholar] [CrossRef]
  8. Xepapadeas, P.; Douvis, K.; Kapsomenakis, I.; Xepapadeas, A.; Zerefos, C. Assessing the Link between Wildfires, Vulnerability, and Climate Change: Insights from the Regions of Greece. Sustainability 2024, 16, 4822. [Google Scholar] [CrossRef]
  9. Ochoa, C.; Bar-Massada, A.; Chuvieco, E. A European-Scale Analysis Reveals the Complex Roles of Anthropogenic and Climatic Factors in Driving the Initiation of Large Wildfires. Sci. Total Environ. 2024, 917, 170443. [Google Scholar] [CrossRef] [PubMed]
  10. Kerns, B.K.; Tortorelli, C.; Day, M.A.; Nietupski, T.; Barros, A.M.G.; Kim, J.B.; Krawchuk, M.A. Invasive Grasses: A New Perfect Storm for Forested Ecosystems? For. Ecol. Manag. 2020, 463, 117985. [Google Scholar] [CrossRef]
  11. Robinne, F.-N.; Hallema, D.W.; Bladon, K.D.; Flannigan, M.D.; Boisramé, G.; Bréthaut, C.M.; Doerr, S.H.; Di Baldassarre, G.; Gallagher, L.A.; Hohner, A.K.; et al. Scientists’ Warning on Extreme Wildfire Risks to Water Supply. Hydrol. Process. 2021, 35, e14086. [Google Scholar] [CrossRef]
  12. Kinoshita, A.M.; Chin, A.; Simon, G.L.; Briles, C.; Hogue, T.S.; O’Dowd, A.P.; Gerlak, A.K.; Albornoz, A.U. Wildfire, Water, and Society: Toward Integrative Research in the “Anthropocene”. Anthropocene 2016, 16, 16–27. [Google Scholar] [CrossRef]
  13. Martino, S.; Roberts, M.; Wooldridge, T.; Pol, P.O.; Mouillot, F.; Pernice, U.; Ortega, M.; Velea, R.; Laterza, R.; Moreira, B. Developing an Integrated Capitals Approach to Understanding Wildfire Vulnerability: Preliminary Considerations from a Literature Review. In Advances in Forest Fire Research 2022; Imprensa da Universidade de Coimbra: Coimbra, Portugal, 2022; pp. 849–861. ISBN 978-989-26-2298-9. [Google Scholar]
  14. Chuvieco, E.; Yebra, M.; Martino, S.; Thonicke, K.; Gómez-Giménez, M.; San-Miguel, J.; Oom, D.; Velea, R.; Mouillot, F.; Molina, J.R.; et al. Towards an Integrated Approach to Wildfire Risk Assessment: When, Where, What and How May the Landscapes Burn. Fire 2023, 6, 215. [Google Scholar] [CrossRef]
  15. Martino, S.; Roberts, M.; Wooldridge, T.; Nijnik, M.; Ovando, P.; Moreira, B.; Ortega, M.; Molina, J.R.; Velea, R.; Laterza, R.; et al. Chapter 7—Economic Impacts of Fire—A Focus on Analysis of Economic Vulnerability of Natural and Human Capitals and Proposal of an Integrated Capitals Approach to Wildfire Vulnerability. D1.4 Report on Methodological Frameworks for Vulnerability Assessment (D, S) in the FirEUrisk-Wiki. 2023. Available online: https://share.google/dOZn31nXJxyKrVWOD (accessed on 10 May 2025).
  16. Lamsaf, H.; Lamsaf, A.; Kerroum, M.A.; Almeida, M. Assessing Trends in Wildland-Urban Interface Fire Research through Text Mining: A Comprehensive Analysis of Published Literature. J. For. Res. 2024, 35, 71. [Google Scholar] [CrossRef]
  17. Molina, J.R.; y Silva, F.R. Valuation of the Economic Impact of Wildland Fires on Landscape and Recreation Resources: A Proposal to Incorporate Them on Damages Valuation; Gen. Tech. Rep. PSW-GTR-261 (English); U.S. Department of Agriculture, Forest Service, Pacific Southwest Research Station: Albany, CA, USA, 2019; pp. 228–238.
  18. Molina, J.R.; Rodríguez y Silva, F.; Herrera, M.Á. Economic Vulnerability of Fire-Prone Landscapes in Protected Natural Areas: Application in a Mediterranean Natural Park. Eur. J. Forest Res. 2017, 136, 609–624. [Google Scholar] [CrossRef]
  19. Molina, J.R.; Herrera Machuca, M.; Zamora Díaz, R.; Rodríguez y Silva, F.; González-Cabán, A. Economic Losses to Iberian Swine Production from Forest Fires. For. Policy Econ. 2011, 13, 614–621. [Google Scholar] [CrossRef]
  20. Arrogante-Funes, F.; Mouillot, F.; Moreira, B.; Aguado, I.; Chuvieco, E. Mapping and Assessment of Ecological Vulnerability to Wildfires in Europe. Fire Ecol. 2024, 20, 98. [Google Scholar] [CrossRef]
  21. Vallecillo, R.S.; La, N.A.; Kakoulaki, G.; Kamberaj, J.; Robert, N.; Dottori, F.; Feyen, L.; Rega, C.; Maes, J. Ecosystem Services Accounting—Part II Pilot Accounts for Crop and Timber Provision, Global Climate Regulation and Flood Control. Available online: https://publications.jrc.ec.europa.eu/repository/handle/JRC116334 (accessed on 2 February 2023).
  22. Vallecillo, S.; Kakoulaki, G.; La Notte, A.; Feyen, L.; Dottori, F.; Maes, J. Accounting for Changes in Flood Control Delivered by Ecosystems at the EU Level. Ecosyst. Serv. 2020, 44, 101142. [Google Scholar] [CrossRef]
  23. Chuvieco, E.; Martínez, S.; Román, M.V.; Hantson, S.; Pettinari, M.L. Integration of Ecological and Socio-Economic Factors to Assess Global Vulnerability to Wildfire. Glob. Ecol. Biogeogr. 2014, 23, 245–258. [Google Scholar] [CrossRef]
  24. Chuvieco, E.; Aguado, I.; Yebra, M.; Nieto, H.; Salas, J.; Martín, M.P.; Vilar, L.; Martínez, J.; Martín, S.; Ibarra, P.; et al. Development of a Framework for Fire Risk Assessment Using Remote Sensing and Geographic Information System Technologies. Ecol. Model. 2010, 221, 46–58. [Google Scholar] [CrossRef]
  25. Field, C.B.; Barros, V.R. Climate Change 2014: Impacts, Adaptation, and Vulnerability Working Group II Contribution to the Fifth Assessment Report of the Intergovernmental Panel on Climate Change; Cambridge University Press: New York, NY, USA, 2014; ISBN 978-1-107-64165-5. [Google Scholar]
  26. McGlade, J.; Bankoff, G.; Abtahams, J.; Cooper-Knock, S.; Cotecchia, F.; Desanker, P.; Erian, W.; Gencer, E.; Gibson, L.; Girgin, S. Global Assessment Report on Disaster Risk Reduction (GAR)|GAR; UN Office for Disaster Risk Reduction: Geneva, Switzerland, 2019. [Google Scholar]
  27. UNDRR. The Sendai Framework Terminology on Disaster Risk Reduction. “Disaster Risk”. Available online: https://www.undrr.org/terminology/disaster-risk (accessed on 10 September 2025).
  28. Parente, J.; Pereira, M.G. Structural Fire Risk: The Case of Portugal. Sci. Total Environ. 2016, 573, 883–893. [Google Scholar] [CrossRef]
  29. Molina, J.R.; Moreno, R.; Castillo, M.; Rodríguez, Y. Silva, F. Economic Susceptibility of Fire-Prone Landscapes in Natural Protected Areas of the Southern Andean Range. Sci. Total Environ. 2018, 619–620, 1557–1565. [Google Scholar] [CrossRef]
  30. Rodriguez y Silva, F. VISUAL-SEVEIF, a Tool for Integrating Fire Behavior Simulation and Economic Evaluation of the Impact of Wildfires. In Proceedings of the Fourth International Symposium on Fire Economics, Planning, and Policy: Climate Change and Wildfires, Mexico City, Mexico, 5–11 November 2013; GENERAL TECHNICAL REPORT PSW-GTR-245; Department of Agriculture, Forest Service, Pacific Southwest Research Station: Albany, CA, USA, 2013. [Google Scholar]
  31. Rodriguez y Silva, F.; González-Cabán, A. “SINAMI”: A Tool for the Economic Evaluation of Forest Fire Management Programs in Mediterranean Ecosystems. Int. J. Wildland Fire 2010, 19, 927–936. [Google Scholar] [CrossRef]
  32. Fuchs, R.; Brown, C.; Rounsevell, M. Europe’s Green Deal Offshores Environmental Damage to Other Nations. Nature 2020, 586, 671–673. [Google Scholar] [CrossRef] [PubMed]
  33. Oliveira, A.; Rajão, R.; Filho, B.; Oliveira, U.; Santos, L.; Assunção, A.; Hoff, R.; Rodrigues, H.; Carvalho Ribeiro, S.M.; Merry, F.; et al. Economic Losses to Sustainable Timber Production by Fire in the Brazilian Amazon. Geogr. J. 2018, 185, 55–67. [Google Scholar] [CrossRef]
  34. Oliveira, S.; Gonçalves, A.; Benali, A.; Sá, A.; Zêzere, J.L.; Pereira, J.M. Assessing Risk and Prioritizing Safety Interventions in Human Settlements Affected by Large Wildfires. Forests 2020, 11, 859. [Google Scholar] [CrossRef]
  35. Mallinis, G.; Petrila, M.; Mitsopoulos, I.; Lorenț, A.; Neagu, S.; Apostol, B.; Gancz, V.; Ionel, P.; Goldammer, J. Geospatial Patterns and Drivers of Forest Fire Occurrence in Romania. Appl. Spat. Anal. Policy 2019, 12, 773–795. [Google Scholar] [CrossRef]
  36. Andersen, L.M.; Sugg, M.M. Geographic Multi-Criteria Evaluation and Validation: A Case Study of Wildfire Vulnerability in Western North Carolina, USA Following the 2016 Wildfires. Int. J. Disaster Risk Reduct. 2019, 39, 101123. [Google Scholar] [CrossRef]
  37. Górriz-Mifsud, E.; Burns, M.; Marini Govigli, V. Civil Society Engaged in Wildfires: Mediterranean Forest Fire Volunteer Groupings. For. Policy Econ. 2019, 102, 119–129. [Google Scholar] [CrossRef]
  38. Bilbao, B.A.; Ferrero, B.G.; Falleiro, R.M.; Moura, L.C.; Fagundes, G.M. Traditional Fire Uses by Indigenous Peoples and Local Communities in South America. In Fire in the South American Ecosystems; Fidelis, A., Pivello, V.R., Eds.; Springer Nature: Cham, Switzerland, 2025; pp. 39–81. ISBN 978-3-031-89372-8. [Google Scholar]
  39. European Commission. Joint Research Centre. Science for Disaster Risk Management 2020: Acting Today, Protecting Tomorrow; Publications Office: Luxembourg, 2021. [Google Scholar]
  40. Kasperson, R.; Kasperson, J. Climate Change, Justice and Vulnerability|Joseph Rowntree Foundation; Stockholm Environment Institute: Tockholm, Sweden, 2001. [Google Scholar]
  41. United Nations System of Environmental Economic Accounting|Ecosystem Accounting. 2021. Available online: https://seea.un.org/ecosystem-accounting/ (accessed on 10 May 2025).
  42. Edens, B.; Maes, J.; Hein, L.; Obst, C.; Siikamaki, J.; Schenau, S.; Javorsek, M.; Chow, J.; Chan, J.Y.; Steurer, A.; et al. Establishing the SEEA Ecosystem Accounting as a Global Standard. Ecosyst. Serv. 2022, 54, 101413. [Google Scholar] [CrossRef]
  43. ONS UK Natural Capital Accounts Methodology Guide: 2023—Office for National Statistics. Available online: https://www.ons.gov.uk/economy/environmentalaccounts/methodologies/uknaturalcapitalaccountsmethodologyguide2023 (accessed on 25 April 2025).
  44. JRC. EEA CORINE Land Cover. Available online: https://land.copernicus.eu/en/products/corine-land-cover (accessed on 25 April 2025).
  45. Wine Search Gross Margins: Breaking Down the Price of a Bottle of Win. Available online: https://www.wine-searcher.com/m/2014/06/gross-margins-breaking-down-wine-prices?srsltid=AfmBOooahxZNN744DQwfv_PVlirTJiFgM5fgb--F9wTIu7ILy_JAAHsj (accessed on 10 May 2025).
  46. Wine Business Monthly Insight & Opinion: Vineyard Values: “Million Dollar Vineyards in Napa Valley?!”. Available online: https://www.winebusiness.com/wbm/article/183534#:~:text=At%20purchase%20prices%20of%20$275%2C000%20to%20even,the%20large%20institutional%20investment%20funds%20have%20re%2D (accessed on 10 May 2025).
  47. Avitabile, V.; Baldoni, E.; Baruth, B.; Bausano, G.; Boysen-Urban, K.; Caldeira, C.; Camia, A.; Cazzaniga, N.; Ceccherini, G.; De Laurentiis, V.; et al. Biomass Production, Supply, Uses and Flows in the European Union; JRC: Brussels, Belgium, 2023. [Google Scholar]
  48. Robinson, T.P.; Wint, G.R.W.; Conchedda, G.; Boeckel, T.P.V.; Ercoli, V.; Palamara, E.; Cinardi, G.; D’Aietti, L.; Hay, S.I.; Gilbert, M. Mapping the Global Distribution of Livestock. PLoS ONE 2014, 9, e96084. [Google Scholar] [CrossRef]
  49. Exchange Rates Euro to US Dollar Spot Exchange Rates for 2021. Available online: https://www.exchangerates.org.uk/EUR-USD-spot-exchange-rates-history-2021.html (accessed on 15 October 2024).
  50. Kummu, M.; Taka, M.; Guillaume, J.H.A. Gridded Global Datasets for Gross Domestic Product and Human Development Index over 1990–2015. Sci. Data 2018, 5, 180004. [Google Scholar] [CrossRef]
  51. Trading Economics Euro Area GDP Deflator. Available online: https://tradingeconomics.com/euro-area/gdp-deflator (accessed on 15 October 2024).
  52. Schug, F.; Bar-Masada, A.; Carlson, A.; Cox, H.; Hawbaker, T.J.; Helmers, D.; Hostert, P.; Kaim, D.; Kasraee, N.; Lewinska, K.E.; et al. Mapping and Quantifying the Global Wildland-Urban Interface. AGU Fall Meet. Abstr. 2022, 2022, NH12A-08. [Google Scholar]
  53. La Notte, A.; Vallecillo, S.; Polce, C.; Zulian, G.; Maes, J. Implementing an EU System of Accounting for Ecosystems and Their Services: Initial Proposals for the Implementation of Ecosystem Services Accounts; Publications Office: Luxembourg, 2017. [Google Scholar]
  54. La Notte, A.L.; Czúcz, B.; Vallecillo, S.; Polce, C.; Maes, J. Ecosystem Condition Underpins the Generation of Ecosystem Services: An Accounting Perspective. One Ecosyst. 2022, 7, e81487. [Google Scholar] [CrossRef]
  55. Vallecillo, R.S.; La, N.A.; Polce, C.; Zulian, G.; Alexandris, N.; Ferrini, S.; Maes, J. Ecosystem Services Accounting: Part I—Outdoor Recreation and Crop Pollination. Available online: https://publications.jrc.ec.europa.eu/repository/handle/JRC110321 (accessed on 15 October 2024).
  56. Lizundia-Loiola, J.; Otón, G.; Ramo, R.; Chuvieco, E. A Spatio-Temporal Active-Fire Clustering Approach for Global Burned Area Mapping at 250 m from MODIS Data. Remote Sens. Environ. 2020, 236, 111493. [Google Scholar] [CrossRef]
  57. Laurent, P.; Mouillot, F.; Yue, C.; Ciais, P.; Moreno, M.V.; Nogueira, J.M.P. FRY, a Global Database of Fire Patch Functional Traits Derived from Space-Borne Burned Area Products. Sci. Data 2018, 5, 180132. [Google Scholar] [CrossRef]
  58. Aragoneses, E.; García, M.; Salis, M.; Ribeiro, L.M.; Chuvieco, E. Classification and Mapping of European Fuels Using a Hierarchical, Multipurpose Fuel Classification System. Earth Syst. Sci. Data 2023, 15, 1287–1315. [Google Scholar] [CrossRef]
  59. Scott, J.H. Standard Fire Behavior Fuel Models: A Comprehensive Set for Use with Rothermel’s Surface Fire Spread Model; U.S. Department of Agriculture, Forest Service, Rocky Mountain Research Station: Fort Collins, CO, USA, 2005.
  60. Aragoneses, E.; García, M.; Ruiz-Benito, P.; Chuvieco, E. Mapping Forest Canopy Fuel Parameters at European Scale Using Spaceborne LiDAR and Satellite Data. Remote Sens. Environ. 2024, 303, 114005. [Google Scholar] [CrossRef]
  61. Aragoneses, E.; García, M.; Tang, H.; Chuvieco, E. A Multi-Sensor Approach Allows Confident Mapping of Forest Canopy Fuel Load and Canopy Bulk Density to Assess Wildfire Risk at the European Scale. Remote Sens. Environ. 2025, 318, 114578. [Google Scholar] [CrossRef]
  62. Castillo, M.E.; Molina, J.R.; Rodríguez y Silva, F.; García-Chevesich, P.; Garfias, R. A System to Evaluate Fire Impacts from Simulated Fire Behavior in Mediterranean Areas of Central Chile. Sci. Total Environ. 2017, 579, 1410–1418. [Google Scholar] [CrossRef] [PubMed]
  63. Keeley, J.E. Fire Severity and Plant Age in Postfire Resprouting of Woody Plants in Sage Scrub and Chaparral. Madroño 2006, 53, 373–379. [Google Scholar] [CrossRef]
  64. Rodríguez y Silva, F.; Ramón Molina, J.; González-Cabán, A.; Machuca, M.Á.H. Economic Vulnerability of Timber Resources to Forest Fires. J. Environ. Manag. 2012, 100, 16–21. [Google Scholar] [CrossRef] [PubMed]
  65. Castillo Soto, M.E. Integración de Variables y Criterios Territoriales Como Apoyo a la Protección Contra Incendios Forestales. Área piloto: Valparaiso-Chile Central. Ph.D. Thesis, Universidad de Córdoba, Córdoba, Spain, 2013. [Google Scholar]
  66. Zamora, R.; Molina-Martínez, J.R.; Herrera, M.A.; Rodríguez y Silva, F. A Model for Wildfire Prevention Planning in Game Resources. Ecol. Model. 2010, 221, 19–26. [Google Scholar] [CrossRef]
  67. Molina, J.R.; Zamora, R.; Rodríguez y Silva, F. The Role of Flagship Species in the Economic Valuation of Wildfire Impacts: An Application to Two Mediterranean Protected Areas. Sci. Total Environ. 2019, 675, 520–530. [Google Scholar] [CrossRef]
  68. Molina, J.R.; Herrera, M.A.; Rodríguez y Silva, F. Wildfire-Induced Reduction in the Carbon Storage of Mediterranean Ecosystems: An Application to Brush and Forest Fires Impacts Assessment. Environ. Impact Assess. Rev. 2019, 76, 88–97. [Google Scholar] [CrossRef]
  69. Gomez, J.A.; Amato, M.; Celano, G.; Koubouris, G.C. Organic Olive Orchards on Sloping Land: More than a Specialty Niche Production System? J. Environ. Manag. 2008, 89, 99–109. [Google Scholar] [CrossRef] [PubMed]
  70. Molina, J.R. Integración de Herramientas Para la Modelización Preventiva Y Socioeconómica Del Paisaje Forestal Frente a Los Incendios en Relación Con El Cambio Climático. Ph.D. Thesis, Universidad de Córdoba (ESP), Córdoba, Spain, 2008. Available online: http://purl.org/dc/dcmitype/Text (accessed on 10 May 2025).
  71. Molina, J.R.; González-Cabán, A.; Rodríguez y Silva, F. Potential Effects of Climate Change on Fire Behavior, Economic Susceptibility and Suppression Costs in Mediterranean Ecosystems: Córdoba Province, Spain. Forests 2019, 10, 679. [Google Scholar] [CrossRef]
  72. Molina, J.R.; Rodriguez y Silva, F.; Herrera, M.A.; Zamora, R. A Simulation Tool for Socio-Economic Planning on Forest Fire Suppression Management. In Forest Fires: Detection, Suppression, and Prevention; Nova Science Publishers: Hauppauge, NY, USA, 2009; pp. 33–88. [Google Scholar]
  73. Ribeiro, L.M.; Rodrigues, A.; Lucas, D.; Viegas, D.X. The Impact on Structures of the Pedrógão Grande Fire Complex in June 2017 (Portugal). Fire 2020, 3, 57. [Google Scholar] [CrossRef]
  74. Zandonella Callegher, C.; Grazieschi, G.; Wilczynski, E.; Oberegger, U.F.; Pezzutto, S. Assessment of Building Materials in the European Residential Building Stock: An Analysis at EU27 Level. Sustainability 2023, 15, 8840. [Google Scholar] [CrossRef]
  75. Catalina, M. Los Edificios en Los Incendios de Interfase Urabno-Forestal; EDICIONES DEL GENAL: Malaga, Spain, 2014; ISBN 978-84-616-6586-0. [Google Scholar]
  76. Samora-Arvela, A.; Aranha, J.; Correia, F.; Pinto, D.M.; Magalhães, C.; Tedim, F. Understanding Building Resistance to Wildfires: A Multi-Factor Approach. Fire 2023, 6, 32. [Google Scholar] [CrossRef]
  77. Gunderson, L.H. Ecological Resilience—In Theory and Application. Annu. Rev. Ecol. Evol. Syst. 2000, 31, 425–439. [Google Scholar] [CrossRef]
  78. Dakos, V.; Kéfi, S. Ecological Resilience: What to Measure and How. Environ. Res. Lett. 2022, 17, 043003. [Google Scholar] [CrossRef]
  79. Zhong, C.; Guo, M.; Zhou, F.; Li, J.; Yu, F.; Guo, F.-T.; Li, W. Forest Succession Trajectories after Fires in Valleys and on Slopes in the Greater Khingan Mountains, China. J. For. Res. 2023, 34, 623–640. [Google Scholar] [CrossRef]
  80. Meneses, B.M. Vegetation Recovery Patterns in Burned Areas Assessed with Landsat 8 OLI Imagery and Environmental Biophysical Data. Fire 2021, 4, 76. [Google Scholar] [CrossRef]
  81. Wei, Y.; Hu, H.; Sun, J.; Yuan, Q.; Sun, L.; Liu, H. Effect of Fire Intensity on Active Organic and Total Soil Carbon in a Larix Gmelinii Forest in the Daxing’anling Mountains, Northeastern China. J. For. Res. 2016, 27, 1351–1359. [Google Scholar] [CrossRef]
  82. Zhang, W.; Yu, Y.; Wu, X.; Pereira, P.; Borja, M.E.L. Integrating Preferences and Social Values for Ecosystem Services in Local Ecological Management: A Framework Applied in Xiaojiang Basin Yunnan Province, China. Land Use Policy 2020, 91, 104339. [Google Scholar] [CrossRef]
  83. Smith-Ramírez, C.; Castillo-Mandujano, J.; Becerra, P.; Sandoval, N.; Fuentes, R.; Allende, R.; Paz Acuña, M. Combining Remote Sensing and Field Data to Assess Recovery of the Chilean Mediterranean Vegetation after Fire: Effect of Time Elapsed and Burn Severity. For. Ecol. Manag. 2022, 503, 119800. [Google Scholar] [CrossRef]
  84. Rodrigues, M.; de la Riva, J.; Domingo, D.; Lamelas, T.; Ibarra, P.; Hoffrén, R.; García-Martín, A. An Empirical Assessment of the Potential of Post-Fire Recovery of Tree-Forest Communities in Mediterranean Environments. For. Ecol. Manag. 2024, 552, 121587. [Google Scholar] [CrossRef]
  85. Dakos, V.; Matthews, B.; Hendry, A.P.; Levine, J.; Loeuille, N.; Norberg, J.; Nosil, P.; Scheffer, M.; De Meester, L. Ecosystem Tipping Points in an Evolving World. Nat. Ecol. Evol. 2019, 3, 355–362. [Google Scholar] [CrossRef]
  86. Pérez-Cabello, F.; Montorio, R.; Alves, D.B. Remote Sensing Techniques to Assess Post-Fire Vegetation Recovery. Curr. Opin. Environ. Sci. Health 2021, 21, 100251. [Google Scholar] [CrossRef]
  87. Tanase, M.; de la Riva, J.; Santoro, M.; Pérez-Cabello, F.; Kasischke, E. Sensitivity of SAR Data to Post-Fire Forest Regrowth in Mediterranean and Boreal Forests. Remote Sens. Environ. 2011, 115, 2075–2085. [Google Scholar] [CrossRef]
  88. Bright, B.C.; Hudak, A.T.; Kennedy, R.E.; Braaten, J.D.; Khalyani, A.H. Examining Post-Fire Vegetation Recovery with Landsat Time Series Analysis in Three Western North American Forest Types. Fire Ecol. 2019, 15, 8. [Google Scholar] [CrossRef]
  89. Adámek, M.; Hadincová, V.; Wild, J. Long-Term Effect of Wildfires on Temperate Pinus Sylvestris Forests: Vegetation Dynamics and Ecosystem Resilience. For. Ecol. Manag. 2016, 380, 285–295. [Google Scholar] [CrossRef]
  90. Abraham, J.; Dowling, K.; Florentine, S. Risk of Post-Fire Metal Mobilization into Surface Water Resources: A Review. Sci. Total Environ. 2017, 599–600, 1740–1755. [Google Scholar] [CrossRef]
  91. Milazzo, F.; Fernández, P.; Peña, A.; Vanwalleghem, T. The Resilience of Soil Erosion Rates under Historical Land Use Change in Agroecosystems of Southern Spain. Sci. Total Environ. 2022, 822, 153672. [Google Scholar] [CrossRef]
  92. Ortega, M.; Lora, Á.; Yocom, L.; Zumaquero, R.; Molina, J.R. Effects of Fire Recurrence and Severity on Mediterranean Vegetation Dynamics: Implications for Structure and Composition in Southern Spain. Sci. Total Environ. 2025, 961, 178392. [Google Scholar] [CrossRef]
  93. Liu, X.; Pan, C. Effects of Recovery Time after Fire and Fire Severity on Stand Structure and Soil of Larch Forest in the Kanas National Nature Reserve, Northwest China. J. Arid Land 2019, 11, 811–823. [Google Scholar] [CrossRef]
  94. Belgodere, A.; Allaire, F.; Filippi, J.-B.; Mallet, V.; Guéniot, F. On the Marginal Cost of the Duration of a Wildfire. J. For. Econ. 2023, 38, 265–292. [Google Scholar] [CrossRef]
  95. UK Treasury the Green Book. 2022. Available online: https://www.gov.uk/government/publications/the-green-book-appraisal-and-evaluation-in-central-government/the-green-book-2020 (accessed on 17 October 2024).
  96. Amani, B.H.K.; N’Guessan, A.E.; Van der Meersch, V.; Derroire, G.; Piponiot, C.; Elogne, A.G.M.; Traoré, K.; N’Dja, J.K.; Hérault, B. Lessons from a Regional Analysis of Forest Recovery Trajectories in West Africa. Environ. Res. Lett. 2022, 17, 115005. [Google Scholar] [CrossRef]
  97. Costanza, R.; de Groot, R.; Sutton, P.; van der Ploeg, S.; Anderson, S.J.; Kubiszewski, I.; Farber, S.; Turner, R.K. Changes in the Global Value of Ecosystem Services. Glob. Environ. Chang. 2014, 26, 152–158. [Google Scholar] [CrossRef]
  98. Campos, P.; Caparrós, A.; Oviedo, J.L.; Ovando, P.; Álvarez-Farizo, B.; Díaz-Balteiro, L.; Carranza, J.; Beguería, S.; Díaz, M.; Herruzo, A.C.; et al. Bridging the Gap Between National and Ecosystem Accounting Application in Andalusian Forests, Spain. Ecol. Econ. 2019, 157, 218–236. [Google Scholar] [CrossRef]
  99. Huang, C.-H.; Finkral, A.; Sorensen, C.; Kolb, T. Toward Full Economic Valuation of Forest Fuels-Reduction Treatments. J. Environ. Manag. 2013, 130, 221–231. [Google Scholar] [CrossRef]
  100. Sil, Â.; Fernandes, P.M.; Rodrigues, A.P.; Alonso, J.M.; Honrado, J.P.; Perera, A.; Azevedo, J.C. Farmland Abandonment Decreases the Fire Regulation Capacity and the Fire Protection Ecosystem Service in Mountain Landscapes. Ecosyst. Serv. 2019, 36, 100908. [Google Scholar] [CrossRef]
  101. Mueller, J.M.; Soder, A.B.; Springer, A.E. Valuing Attributes of Forest Restoration in a Semi-Arid Watershed. Landsc. Urban Plan. 2019, 184, 78–87. [Google Scholar] [CrossRef]
  102. Varela, E.; Jacobsen, J.B.; Mavsar, R. Social Demand for Multiple Benefits Provided by Aleppo Pine Forest Management in Catalonia, Spain. Reg. Environ. Chang. 2017, 17, 539–550. [Google Scholar] [CrossRef]
  103. Kailidis, D.; Karanikola, P. Forest Fires 1900–2000; Giahoudis Editions: Thessaloniki, Greece, 2004. [Google Scholar]
  104. Brémond, P.; Grelot, F.; Agenais, A.-L. Review Article: Economic Evaluation of Flood Damage to Agriculture—Review and Analysis of Existing Methods. Nat. Hazards Earth Syst. Sci. 2013, 13, 2493–2512. [Google Scholar] [CrossRef]
  105. Stougiannidou, D.; Zafeiriou, E.; Raftoyannis, Y. Forest Fires in Greece and Their Economic Impacts on Agriculture. KnE Soc. Sci. 2020, 4, 54–70. [Google Scholar] [CrossRef]
  106. Zakowski, E.; Parker, L.E.; Johnson, D.; Aguirre, J.; Ostoja, S.M. California Wine Grape Growers Need Support to Manage Risks from Wildfire and Smoke. Calif. Agric. 2023, 77, 40–48. [Google Scholar] [CrossRef]
  107. Valatin, G. Carbon Valuation in Forestry and Prospects for European Harmonisation. Efi Tech. Rep. 97. 2014. Available online: https://efi.int/sites/default/files/files/publication-bank/2018/tr_97.pdf (accessed on 10 May 2025).
  108. Loomis, J.; Gonzalez-Caban, A.; Englin, J. Testing for Differential Effects of Forest Fires on Hiking and Mountain Biking Demand and Benefits. J. Agric. Resour. Econ. 2001, 26, 508–522. [Google Scholar]
  109. Hesseln, H.; Loomis, J.B.; González-Cabán, A.; Alexander, S. Wildfire Effects on Hiking and Biking Demand in New Mexico: A Travel Cost Study. J. Environ. Manag. 2003, 69, 359–368. [Google Scholar] [CrossRef]
  110. Hesseln, H.; Loomis, J.; González-Cabán, A. The Effects of Fire on Recreation Demand in Montana. West. J. Appl. For. 2004, 19, 47–53. [Google Scholar] [CrossRef][Green Version]
  111. Boxall, P.C.; Englin, J.E. Fire and Recreation Values in Fire-Prone Forests: Exploring an Intertemporal Amenity Function Using Pooled RP-SP Data. J. Agric. Resour. Econ. 2008, 33, 19–33. [Google Scholar][Green Version]
  112. Singh, A.K.; Kushwaha, M.; Rai, A.; Singh, N. Changes in Soil Microbial Response across Year Following a Wildfire in Tropical Dry Forest. For. Ecol. Manag. 2017, 391, 458–468. [Google Scholar] [CrossRef]
  113. Jensen, A.M.; Scanlon, T.M.; Riscassi, A.L. Emerging Investigator Series: The Effect of Wildfire on Streamwater Mercury and Organic Carbon in a Forested Watershed in the Southeastern United States. Environ. Sci. Process. Impacts 2017, 19, 1505–1517. [Google Scholar] [CrossRef]
  114. Cannon, S.H.; Gartner, J.E.; Rupert, M.G.; Michael, J.A.; Rea, A.H.; Parrett, C. Predicting the Probability and Volume of Postwildfire Debris Flows in the Intermountain Western United States. GSA Bull. 2010, 122, 127–144. [Google Scholar] [CrossRef]
  115. Santi, P.; Cannon, S.; DeGraff, J. 13.16 Wildfire and Landscape Change. In Treatise on Geomorphology; Shroder, J.F., Ed.; Academic Press: San Diego, CA, USA, 2013; pp. 262–287. ISBN 978-0-08-088522-3. [Google Scholar]
  116. Staley, D.M.; Tillery, A.C.; Kean, J.W.; McGuire, L.A.; Pauling, H.E.; Rengers, F.K.; Smith, J.B. Estimating Post-Fire Debris-Flow Hazards Prior to Wildfire Using a Statistical Analysis of Historical Distributions of Fire Severity from Remote Sensing Data. Int. J. Wildland Fire 2018, 27, 595–608. [Google Scholar] [CrossRef]
  117. De Graff, J.V.; Gallegos, A.J. The Challenge of Improving Identification of Rockfall Hazard after Wildfires. Environ. Eng. Geosci. 2012, 18, 389–397. [Google Scholar] [CrossRef]
  118. Jones, B.A.; Thacher, J.A.; Chermak, J.M.; Berrens, R.P. Wildfire Smoke Health Costs: A Methods Case Study for a Southwestern US ‘Mega-Fire’. J. Environ. Econ. Policy 2016, 5, 181–199. [Google Scholar] [CrossRef]
  119. Jones, B.A. Willingness to Pay Estimates for Wildfire Smoke Health Impacts in the US Using the Life Satisfaction Approach. J. Environ. Econ. Policy 2018, 7, 403–419. [Google Scholar] [CrossRef]
  120. Richardson, L.A.; Champ, P.A.; Loomis, J.B. The Hidden Cost of Wildfires: Economic Valuation of Health Effects of Wildfire Smoke Exposure in Southern California. J. For. Econ. 2012, 18, 14–35. [Google Scholar] [CrossRef]
  121. Richardson, L.; Loomis, J.B.; Champ, P.A. Valuing Morbidity from Wildfire Smoke Exposure: A Comparison of Revealed and Stated Preference Techniques. Land Econ. 2013, 89, 76–100. [Google Scholar] [CrossRef]
  122. Tan-Soo, J.-S.; Pattanayak, S.K. Seeking Natural Capital Projects: Forest Fires, Haze, and Early-Life Exposure in Indonesia. Proc. Natl. Acad. Sci. USA 2019, 116, 5239–5245. [Google Scholar] [CrossRef]
  123. Wang, D.; Guan, D.; Zhu, S.; Kinnon, M.M.; Geng, G.; Zhang, Q.; Zheng, H.; Lei, T.; Shao, S.; Gong, P.; et al. Economic Footprint of California Wildfires in 2018. Nat. Sustain. 2021, 4, 252–260. [Google Scholar] [CrossRef]
  124. Nielsen-Pincus, M.; Moseley, C.; Gebert, K. Job Growth and Loss across Sectors and Time in the Western US: The Impact of Large Wildfires. For. Policy Econ. 2014, 38, 199–206. [Google Scholar] [CrossRef]
  125. Kattge, J.; Bönisch, G.; Díaz, S.; Lavorel, S.; Prentice, I.C.; Leadley, P.; Tautenhahn, S.; Werner, G.D.A.; Aakala, T.; Abedi, M.; et al. TRY Plant Trait Database—Enhanced Coverage and Open Access. Glob. Chang. Biol. 2020, 26, 119–188. [Google Scholar] [CrossRef]
  126. Pearce, D.W.; Turner, R.K. Economics of Natural Resources and the Environment; Johns Hopkins University Press: Baltimore, MD, USA, 1990; ISBN 978-0-8018-3986-3. [Google Scholar]
  127. Pearce, D.; Groom, B.; Hepburn, C.; Koundouri, P. Valuing the Future: Recent Advances in Social Discounting. World Econ. 2003, 4, 121–141. [Google Scholar]
  128. Pearce, D.; Atkinson, G.; Mourato, S. Cost-Benefit Analysis and the Environment: Recent Developments; OECD: Paris, France, 2006; ISBN 978-92-64-01004-8. [Google Scholar]
  129. Lozhnikova, A.V.; Akkerman, E.N.; Muravyov, I.V.; Kirpotin, S.N. The ‘Tyranny of Discounting’ in Economic Efficiency Evaluation of Capital Investment Projects Susceptible to Ecological and Climatic Changes. Int. J. Environ. Stud. 2014, 71, 768–773. [Google Scholar] [CrossRef]
  130. Paveglio, T.B.; Abrams, J.; Ellison, A. Developing Fire Adapted Communities: The Importance of Interactions Among Elements of Local Context. Soc. Nat. Resour. 2016, 29, 1246–1261. [Google Scholar] [CrossRef]
  131. Paveglio, T.B.; Stasiewicz, A.M.; Edgeley, C.M. Understanding Support for Regulatory Approaches to Wildfire Management and Performance of Property Mitigations on Private Lands. Land Use Policy 2021, 100, 104893. [Google Scholar] [CrossRef]
  132. Domingos, T.; Kalapodis, N.; Sakkas, G.; Chandramouli, K.; Gama, I.; Proença, V.; Ribeiro, I.; Pio, M. Advancing Integrated Fire Management and Closer-to-Nature Forest Management: A Holistic Approach to Wildfire Risk Reduction and Ecosystem Resilience in Quinta Da França, Portugal. Forests 2025, 16, 1306. [Google Scholar] [CrossRef]
  133. Badiu, D.; Arion, F.H.; Muresan, I.C.; Lile, R.; Mitre, V. Evaluation of Economic Efficiency of Apple Orchard Investments. Sustainability 2015, 7, 10521–10533. [Google Scholar] [CrossRef]
  134. Dimitrova, D.; Dimitrov, V. Anuual Changes in the Prices of Table Grapes and Price Margins in the Supply Chain. Sci. Pap. Ser. Manag. Econ. Eng. Agric. Rural. Dev. 2021, 21, 219–226. [Google Scholar]
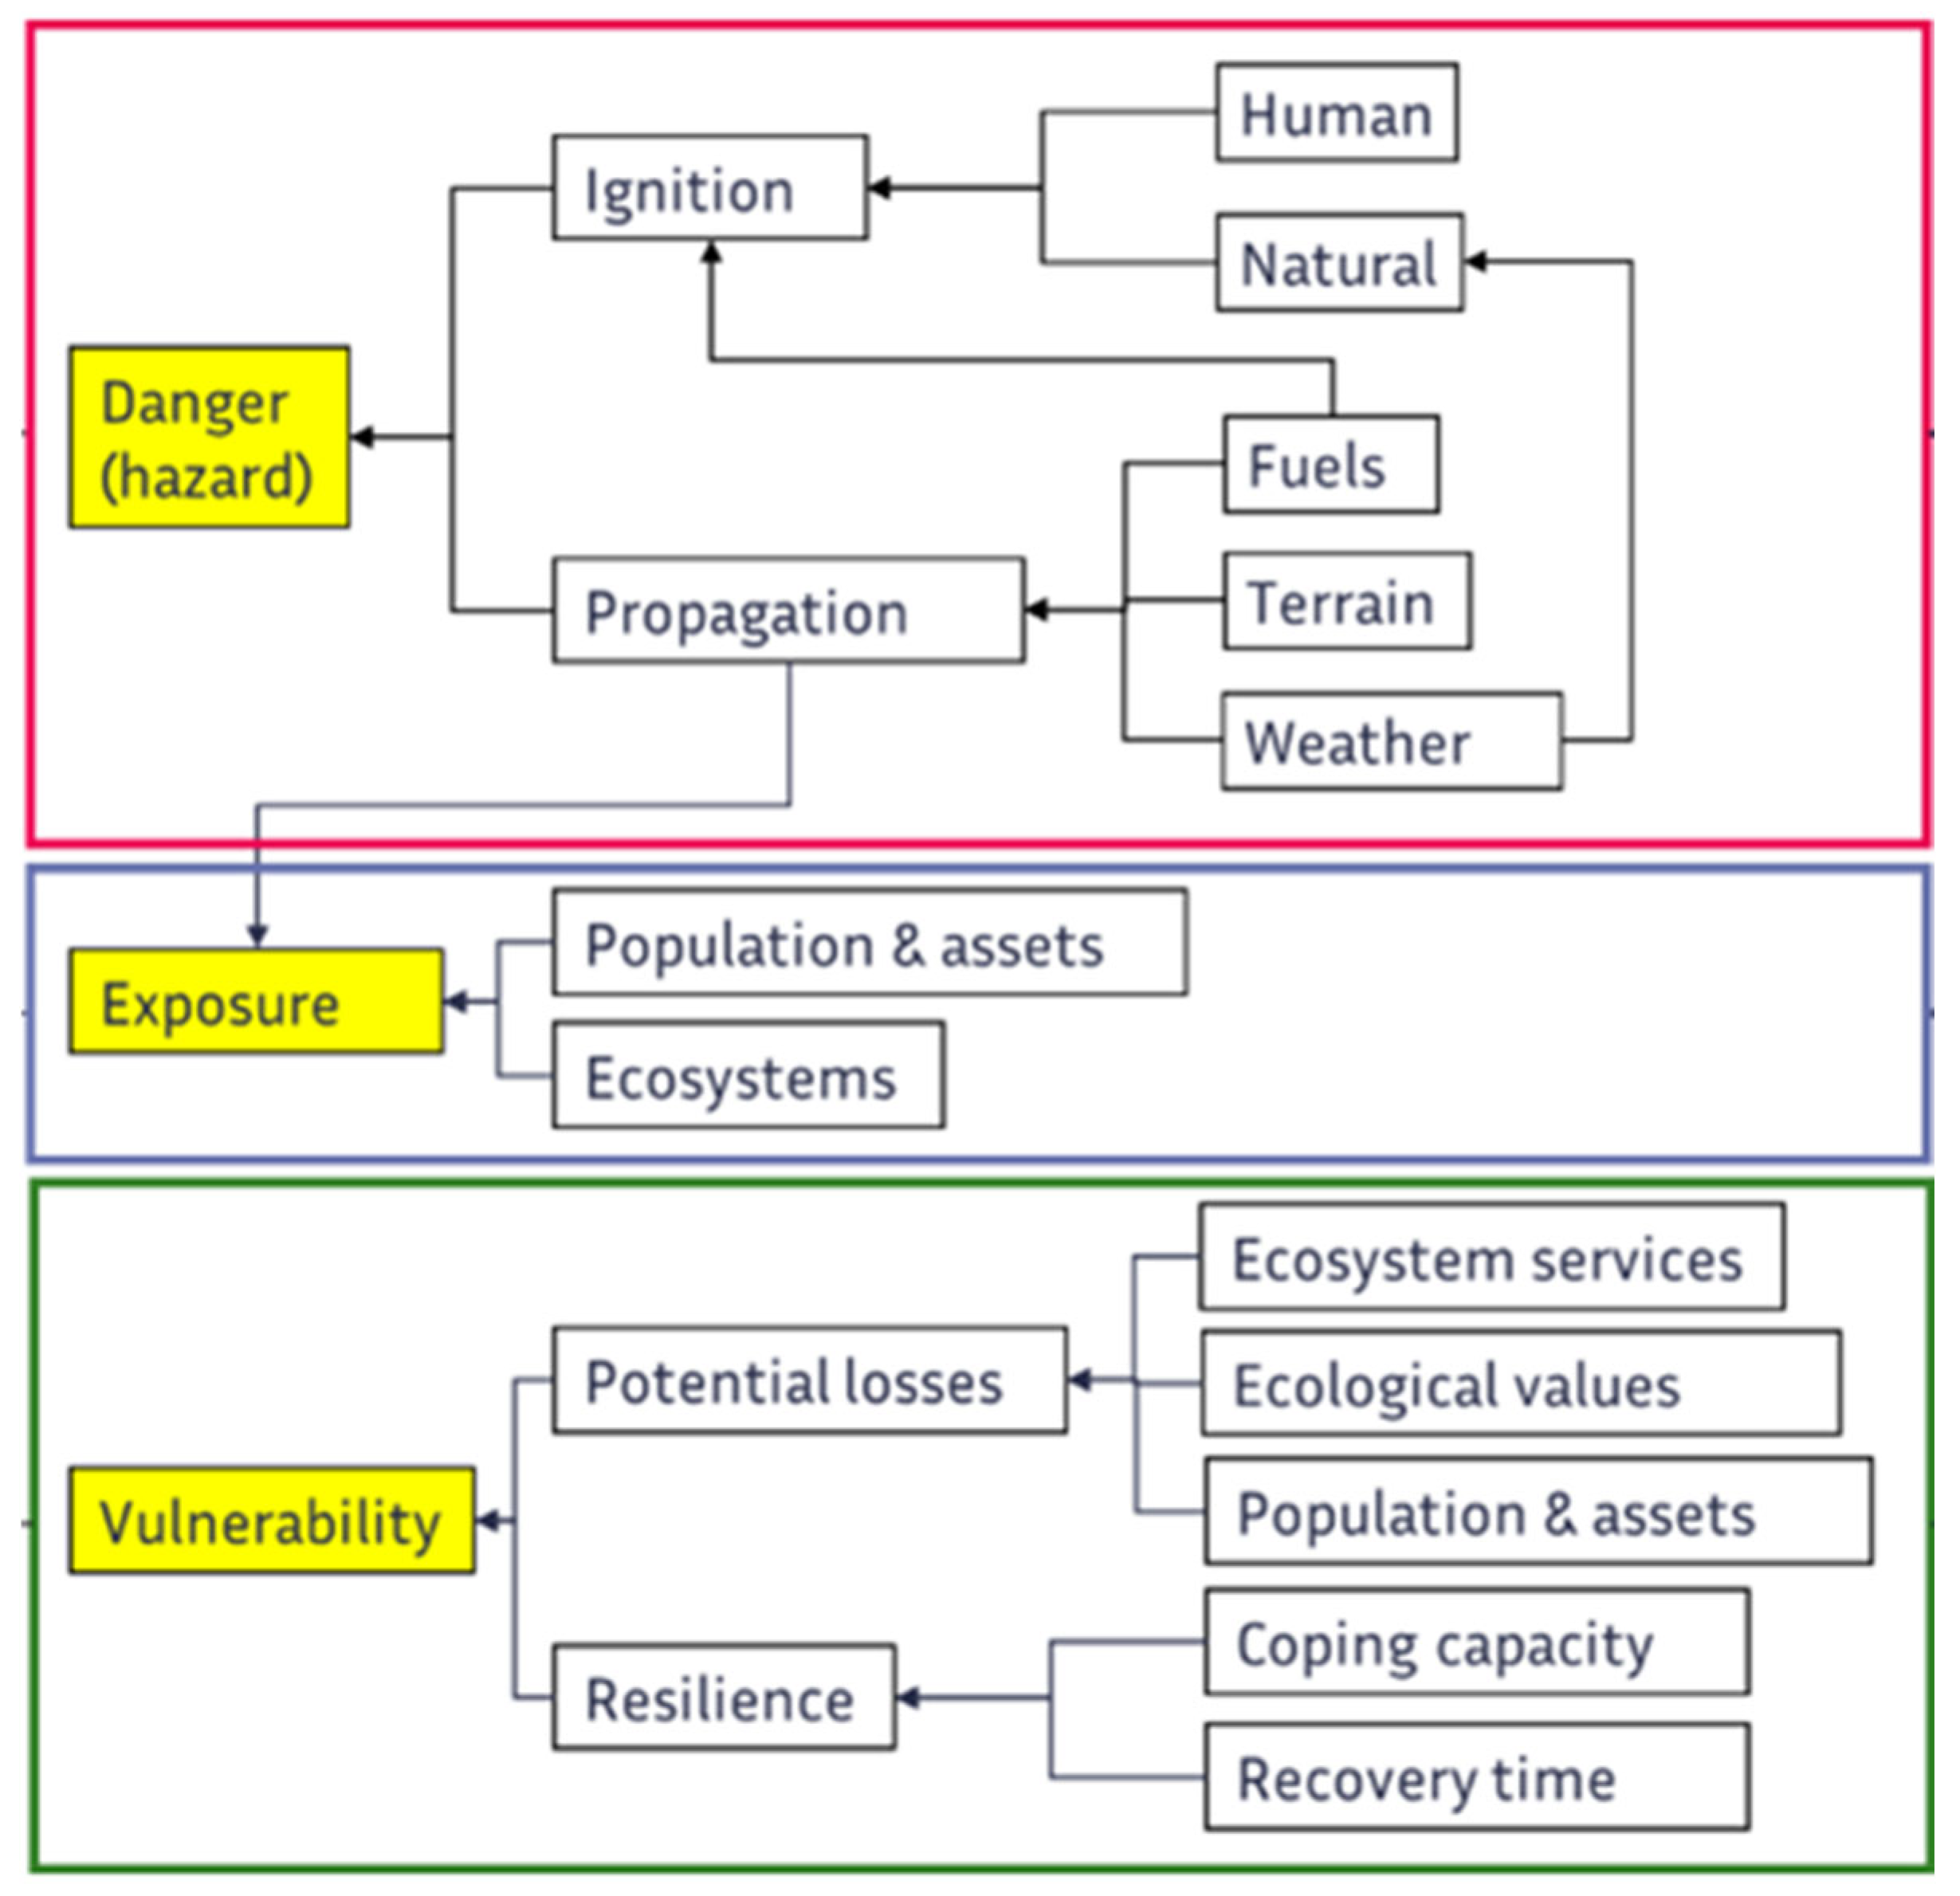
Figure 1. Conceptual framework within the FirEUrisk project to integrate fire risk components; source: [14].
Fire 08 00379 g001
Figure 2. Steps followed in the valuation of wildfire damage.
Fire 08 00379 g002
Figure 3. Representation of annual socio-economic values at the European scale, expressed in 2021 euros/ha/year. This estimate includes timber, fruit groves, vineyards, olives groves, and livestock (cattle and sheep).
Fire 08 00379 g003
Figure 4. Property values within the wildland urban interface, expressed in 2021 price.
Fire 08 00379 g004
Figure 5. Ecosystem-regulating services’ values at the European scale, expressed in Euros per hectare per year at 2021 prices. This estimate includes carbon sequestration, crop pollination, soil retention, flood control, and water purification.
Fire 08 00379 g005
Figure 6. Expected damage from simulated fire for all the provisioning services at the European scale, expressed in Euros/ha (in 2021 price).
Fire 08 00379 g006
Figure 7. Expected agricultural damage per country expressed in Euros/ha. The red bars are the expected maximum value, reported on the left of the vertical axis, while the green line is the average value, provided on the right side of the vertical axis.
Fire 08 00379 g007
Figure 8. Expected damage for regulating ecosystem services at the European scale expressed in 2021 Euros/ha.
Fire 08 00379 g008
Figure 9. Expected damage to regulating ecosystem services per country expressed in euros/ha. The red bars are the expected maximum value, reported on the left of the vertical axis, while the green line is the average value, provided on the right side of the vertical axis.
Fire 08 00379 g009
Figure 10. Expected damage for all the residential properties expressed in Euros per hectare (in 2021 price).
Fire 08 00379 g010
Table 1. List of assets considered in the analysis of damage.
Provisioning Ecosystem
Services
EUR/ha/year (2021)
Regulating
Ecosystem Services
EUR/ha/year (2021)
Manufactured
Capital
EUR/ha/year (2021)
Fruit grovesCattleCrop pollinationResidential properties
Olive grovesSheepSoil retention
TimberVineyardsCarbon sequestration
Table 3. Loss coefficients describing the impact of fire on manufactured assets, based on [31,75]. Information from the material used for roofs and walls is provided by [74].
PropertiesFIP and Flame Length
IIIIIIIVVVI
Made of wood 0.050.200.520.770.900.95
Made of concrete and bricks0.010.050.120.200.400.60
Property made of 30% wood and 70% concrete and bricks0.0220.0950.240.370.550.71
Table 4. Recovery time used in the damage function (reported in Equations (1) and (2)).
AssetRecovery Time
Fruit trees, olive groves, vineyard5 years
Timber50 years
Carbon sequestration50 years
Pollination6 years
Soil erosion6 years—for FIP intensity (I and II)
13 years—for FIP intensity (III and IV)
20 years—for FIP intensity (III and IV)
Livestock1 year—sheep
2 years—cattle
Table 5. Discounted factors to measure the damage to carbon sequestration. They are assessed assuming a full recovery time of the forest in RT = 50 years. The discount rate adopted is 3.5%.
Kxo = 10xo = 25xo = 35
0.108.4514.0717.3
0.257.6415.6519.36
0.507.7416.1119.73
average7.9415.2718.80
damageFIP
I and II
FIP
III and IV
FIP
V and VI
Disclaimer/Publisher’s Note: The statements, opinions and data contained in all publications are solely those of the individual author(s) and contributor(s) and not of MDPI and/or the editor(s). MDPI and/or the editor(s) disclaim responsibility for any injury to people or property resulting from any ideas, methods, instructions or products referred to in the content.