Article

Hazardous Chemical Laboratory Fire Risk Assessment Based on ANP and 3D Risk Matrix

1
School of Safety Engineering, Beijing Institute of Petrochemical Technology, Beijing 102617, China
2
Beijing Academy of Safety Engineering and Technology, Beijing 102617, China
*
Author to whom correspondence should be addressed.
Fire 2024, 7(8), 287; https://doi.org/10.3390/fire7080287
Submission received: 28 June 2024 / Revised: 6 August 2024 / Accepted: 13 August 2024 / Published: 16 August 2024
(This article belongs to the Special Issue Fire Safety Management and Risk Assessment)

Abstract

:
The laboratory is a high-risk place for scientific research and learning, and there are many risk factors and great potential for harm. Hazardous chemicals are important to consider and are the key objects to monitor in a laboratory. In recent years, hazardous chemical fire accidents have occurred in laboratories in various industries, bringing painful lessons and making it urgent to strengthen the safety management of hazardous laboratory chemicals. In this study, a semi-quantitative comprehensive risk assessment model for hazardous chemical laboratory fires was constructed by combining the bowtie model, three-dimensional risk matrix, and analytic network process (ANP). This study applied this method to the management of hazardous chemicals at the TRT Research Institute; evaluated the probability, severity, and preventive components of the corresponding indicators by constructing different index systems; and calculated the evaluation results using the weight of each index. The evaluation results show that the comprehensive likelihood level is 2, the comprehensive severity level is 3, the comprehensive preventive level is 3, and the final calculated comprehensive risk level is tolerable (II). Based on the results of the risk assessment, the corresponding control measures that can reduce the fire risk of hazardous chemicals in the laboratory are proposed according to the actual situation at the TRT Research Institute.

1. Introduction

In recent years, as universities, pharmaceutical companies, hospitals, and other industries have increased their scientific research efforts, various factors such as personnel management, systems, training, equipment and facilities, hazardous chemicals, changes, and fire emergencies have introduced a variety of uncertainties to laboratories, and the safety of laboratories in various industries is facing increasing challenges. Since hazardous chemicals are an important component in laboratory work, it is particularly important to carry out safety management. In recent years, there have been many laboratory accidents in China, resulting in tragic consequences, such as casualties. Hazardous chemical accidents in the laboratory have the characteristics of rapid occurrence and difficulty in rescuing those in the laboratory. Table 1 lists typical cases of hazardous chemical laboratory fires in China since 2018.
Despite improvements in laboratory supervision and management, several accidents have still dealt a heavy blow to laboratory research work. This shows that the advanced safety management in laboratories should be improved, and that investigations into risk classification and hidden dangers should be strengthened such that risk assessment of laboratories ensures excellent working conditions for safe scientific research.
The bowtie model and risk matrix method can be combined to solve the problems of risk assessment. Lu [1] used the fuzzy method to calculate the probability of failure and assessed the severity of accidents through an index system of casualties, economic losses, and environmental damage to put forward a risk matrix consisting of a probabilistic ranking criterion and a consequence criterion to obtain complete quantitative conclusions based on the bowtie model. Xie [2] established an FEAOD assessment method based on the bowtie model and, to address the uncertainty and fuzziness of the basic event probability data in the expert-inspired process, proposed a cloud hierarchy analysis method (CloudAHP) and group cloud decision-making (GCDM) algorithm based on fuzzy cloud affiliation function. Combined with the probability estimation algorithm and sensitivity analysis, they proposed a quantitative assessment of the risk of the BT model based on the theory of cloud model algorithm. Because the hierarchical analysis method has the advantage of calculating indicator weights, it can be applied to the quantitative calculation process of the risk matrix method [3], and the AHP calculates the indicator weights of the influencing factors to provide a more professional applicability of quantitative risk assessment for the two-dimensional risk matrix. In addition, to further enrich the diversity of the use of the risk matrix, a third risk attribute can be added to constitute a three-dimensional risk matrix [4,5].
Laboratories, as an important location for research activities in universities, hospitals, research institutes, and companies, have always faced significant risk problems. In the context of risk assessment for laboratory waste liquid disposal, Ho et al. [6] explored the risk prioritization procedure for liquid waste disposal using an expert questionnaire. To assess and analyze the concentration of pollutants in a non-steady state, Davardoost et al. [7] used computational fluid dynamics (CFD) models to assess the health risk in buildings, focusing on three pollutants with OEL-C, OEL-STEL, and OEL-TWA parameters. Ozdemir et al. [8] applied the AHP in the evaluation and weighting phase of the severity (S), incidence (O), and detectability (D) parameters of the FMEA. They used IT2FVIKOR to evaluate university laboratories, which revealed the hazard points of high importance in the experiments. For the management of pathogenic microbiology laboratories, Zhao et al. [9] combined the Technique for Order Preference by Similarity to Ideal Solution (TOPSIS) method with the RSR method for the comprehensive evaluation of laboratories. Mastrantonio et al. [10] collected relevant data from three different activities in three laboratories at a university in Italy and used the MoVaRisCh, COSHH Essentials, LaboRisCh, and Datarisch methods to analyze the risk profile of various chemicals. Marendaz et al. [11] established a new safety management plan specifically adapted to the academic environment—MICE (Management, Information, Control and Emergency Response). Chen et al. [12] extracted the causes of accidents in university laboratories in the last six years and used the gray system theory to perform a correlation analysis to rank the factors affecting laboratory safety behaviors in terms of their correlations. Choi et al. [13] investigated 10 provincial universities and proposed two safety rating techniques, a risk assessment technique, and a risk assessment method based on the analysis results. Based on the foundation of the Bayesian network, Zhang et al. [14] established a school laboratory model for evaluating the evolution and consequences of gas leakage, which can quantitatively evaluate the factors affecting the probability and consequences of gas leakages.
Mascia et al. [15] proposed a useful tool, the FMEA strip worksheet, which helps scientists engaged in non-supervised research with quality management and risk assessment of critical scientific procedures and processes, with the ultimate goal of increasing and improving the efficiency and efficacy of research control. Li et al. [16] proposed a semi-quantitative method based on the object element topological theory and combinatorial ordered weighted average (C-OWA) operator to assess the risk of a chemistry laboratory in a university. To evaluate whether the power laboratory management and training system can improve students’ learning interest, Yu et al. [17] proposed a model–view–controller (MVC) architecture for co-designing a management training system module, describing the key steps in developing this module using PHP. The environmental risk assessment of high-level biosafety laboratories is an important element of biosafety research [18]. Marendaz et al. [19] proposed a methodology based on the assessment and classification of laboratory hazards. The tool consists of a series of 28 specific hazards categorized into four levels (from 0 to 3), allowing for the identification of laboratories with high or cumulative hazards. The bowtie approach provides background information and describes research programs and techniques using academic laboratories [20].
Fatemi et al. [21] categorized hazards on a five-level scale and reviewed the quantitative and qualitative data using standards from laboratory safety guidelines (OSHA), occupational hazards data sheets (ILO), and ACGIH, IARC, and NFPA codes. Chen et al. [22,23,24] used the 24 model, the 5Whys methodology, the 4M, and HAZOP to conduct a risk assessment, including those for laboratory explosions. Sundawa et al. [25] assessed five potential hazards and risks in laboratories using a Likert scale. Based on the laboratory hazard index (LCI) model, Zhang et al. [26] analyzed the research specificities of civil engineering laboratories through a literature review and expert interviews. Alshammar et al. [27] estimated the proportion and types of hazardous chemicals used in laboratories through a chemical inventory. Dehdashti et al. [28] developed a risk assessment using a combination of hazards and risk factors to establish a scale of measures for risk reduction action plans. Cho et al. [29] conducted a survey of the current state of management and hazardous factors and classified research and development activities based on these data. Bai et al. [30] analyzed the current status and challenges of laboratory safety in Chinese universities and proposed future directions. The main methods used for laboratory risk assessments are shown in Table 2.
Researchers have conducted various risk assessments for laboratory management; however, combined with the above accident statistics, most laboratory hazardous chemical fire accidents have the characteristics of rapid occurrence, instantaneous damage, and difficulty in treatment. Therefore, it is necessary to analyze the prevention ability of laboratories before an accident (emergency drills, improving relevant system documents, hidden danger investigation, etc.) as part of its risk assessment. This paper integrated the bowtie model with a three-dimensional risk matrix (adding a third risk attribute, “preventive”) and used the ANP method to form a complete set of semi-quantitative risk assessment methods. The risk of specific incidents of laboratory fires involving hazardous chemicals was also assessed.

2. Introduction to the Theoretical Approach

This section provides a theoretical introduction to the bowtie model, the three-dimensional risk matrix, the ANP method, and the combined application of all three. The methodology provides a working basis for subsequent practical laboratory risk assessment situations.

2.1. Bowtie Model

Figure 1 shows the bowtie model, a risk assessment methodology that integrates accident tree analysis and event tree analysis. This model combines the concepts of these methodologies to analyze the basic events leading to the top event and to describe the potential consequences of further accidents resulting from the top event. Additionally, the bowtie model proposes preventive and control measures for both the basic events and the consequences of accidents, forming a safety barrier to prevent the occurrence of events and accidents.
Figure 1 illustrates the bowtie model, with the top event at the center. The left side of the model represents the accident tree analysis, while the right side represents the event tree analysis. The safety of the top event is closely related to the implementation of safety barrier measures. The degree of safety for the top event can be assessed by analyzing the level of danger from the hazard source and the possible consequences of the accident.

2.2. ANP Analysis Method

The ANP analysis process involves the following steps: (1) developing the ANP network model structure, (2) constructing the unweighted initial supermatrix, (3) calculating the weighted supermatrix, and (4) determining the risk factor weights by calculating the limit supermatrix. This section introduces the ANP theory using both textual explanations and formulas, laying the foundation for developing a comprehensive risk assessment model.

2.2.1. ANP Network Model Structure

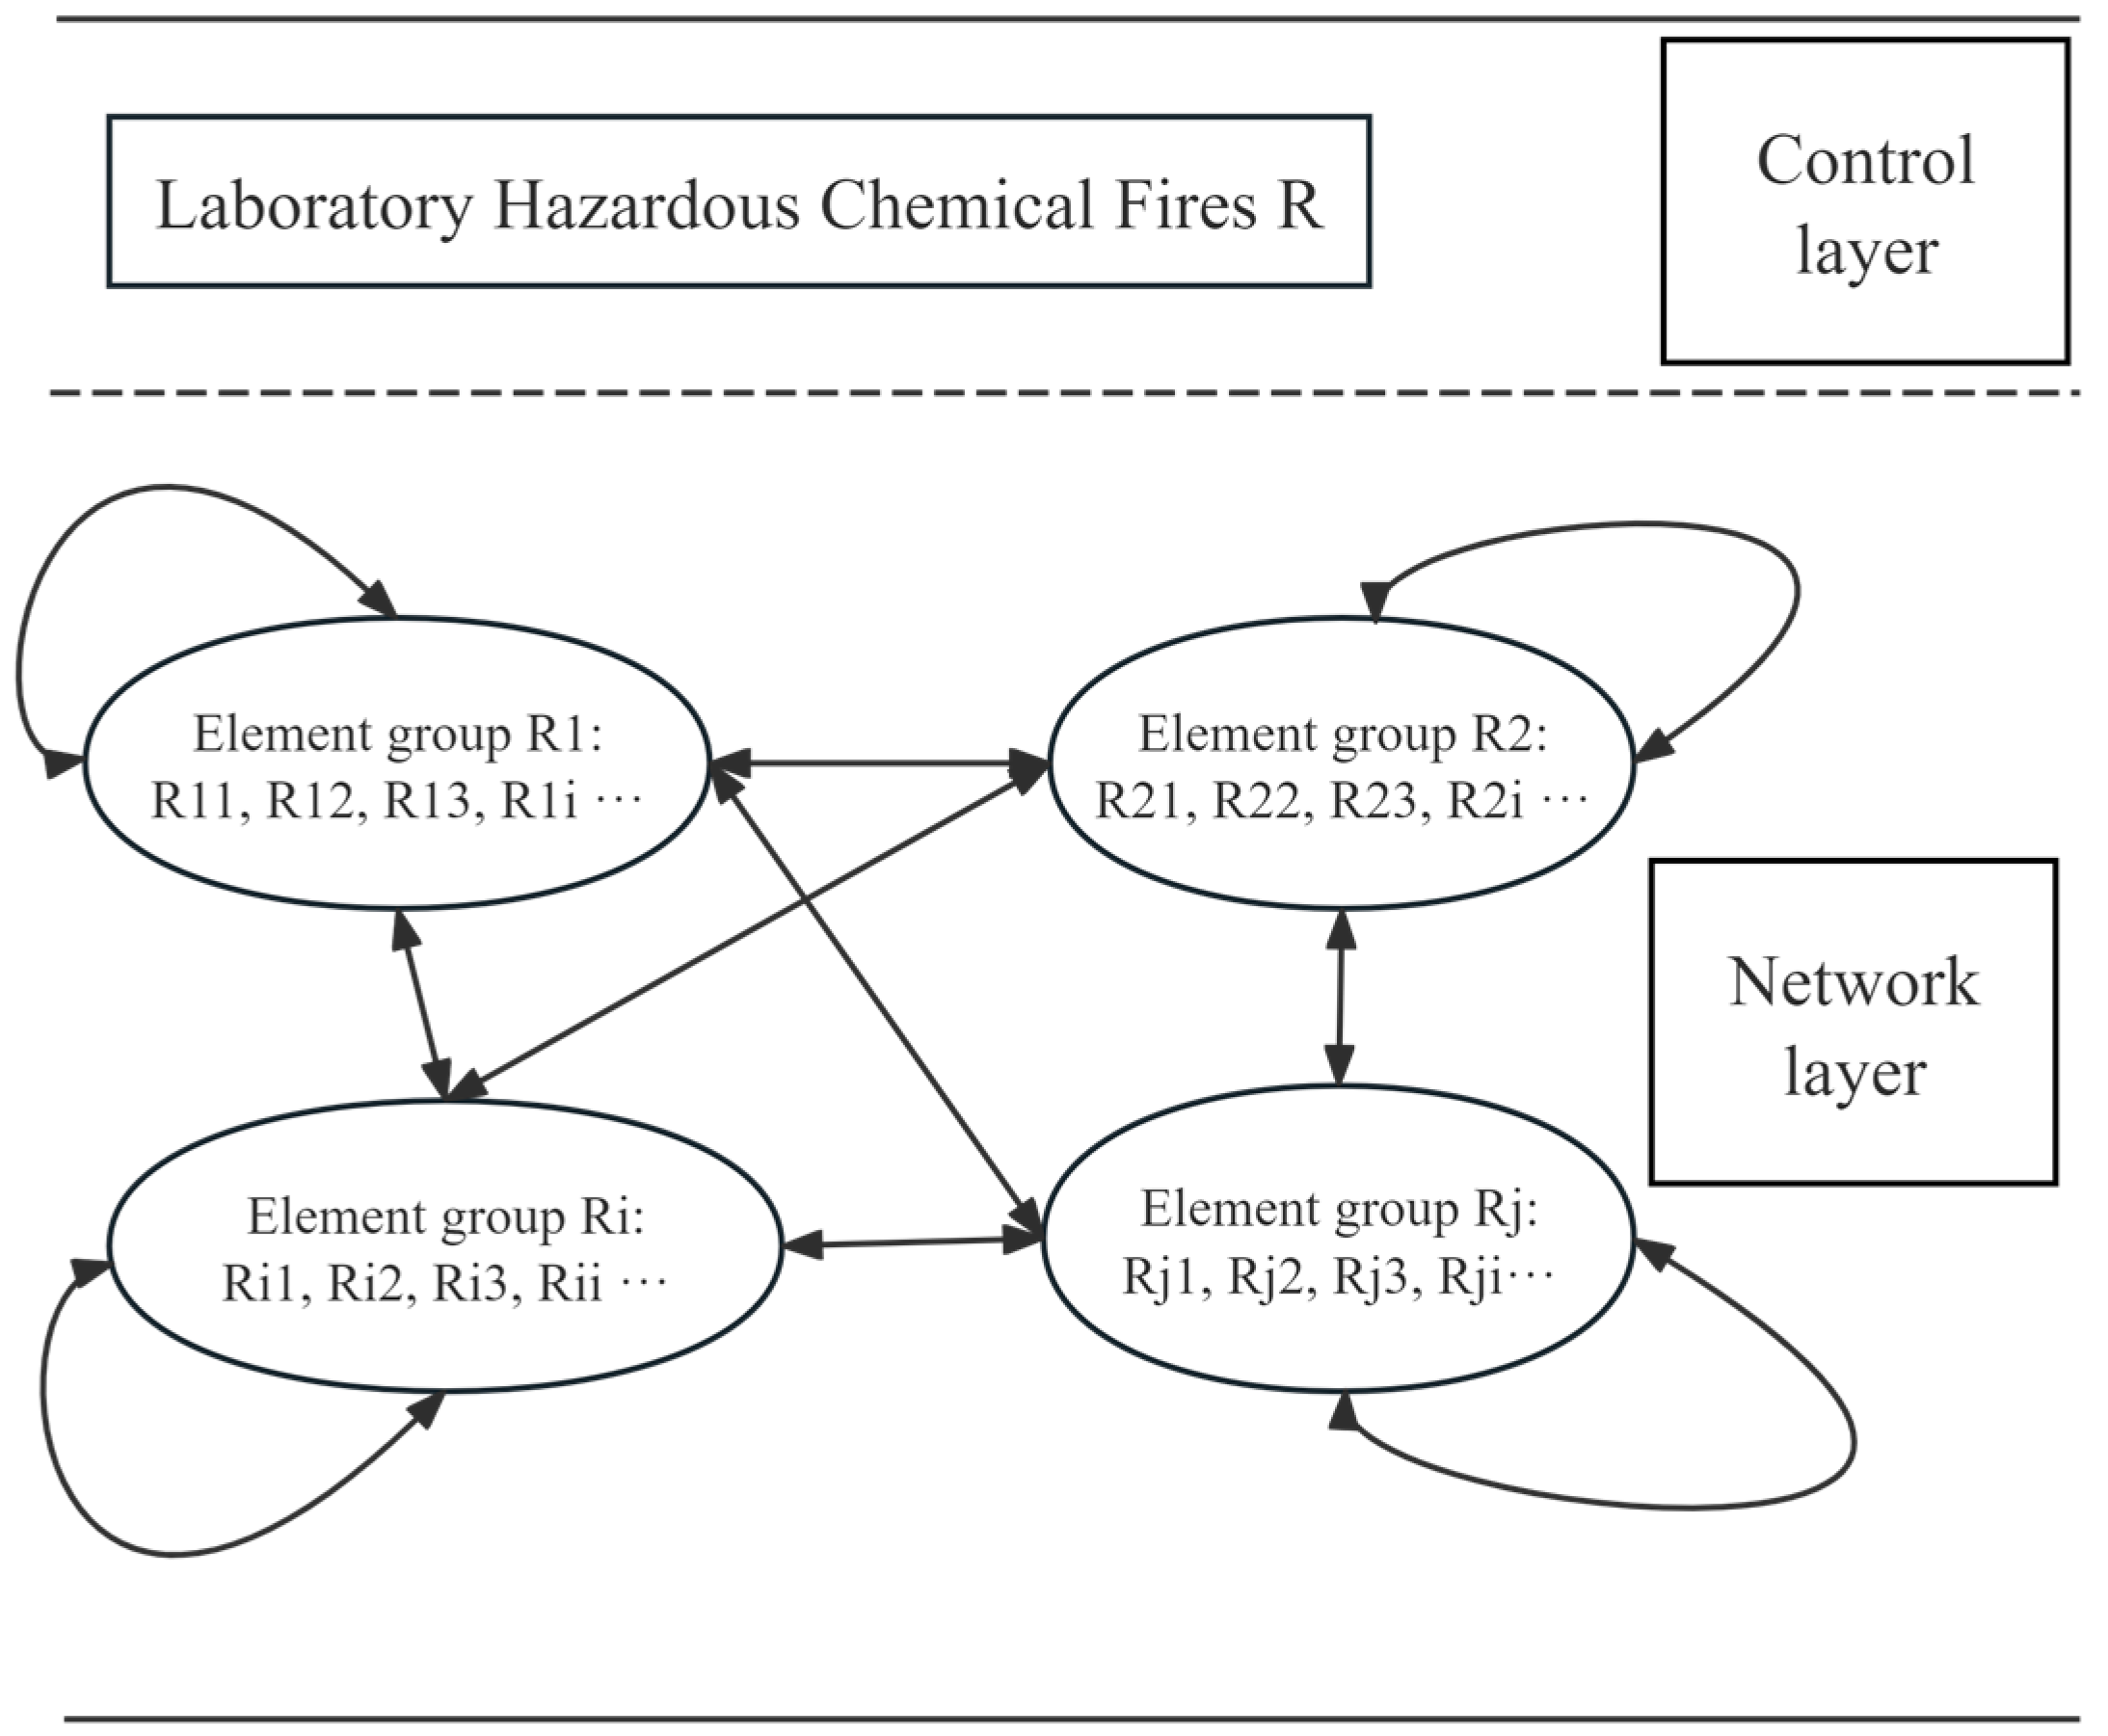
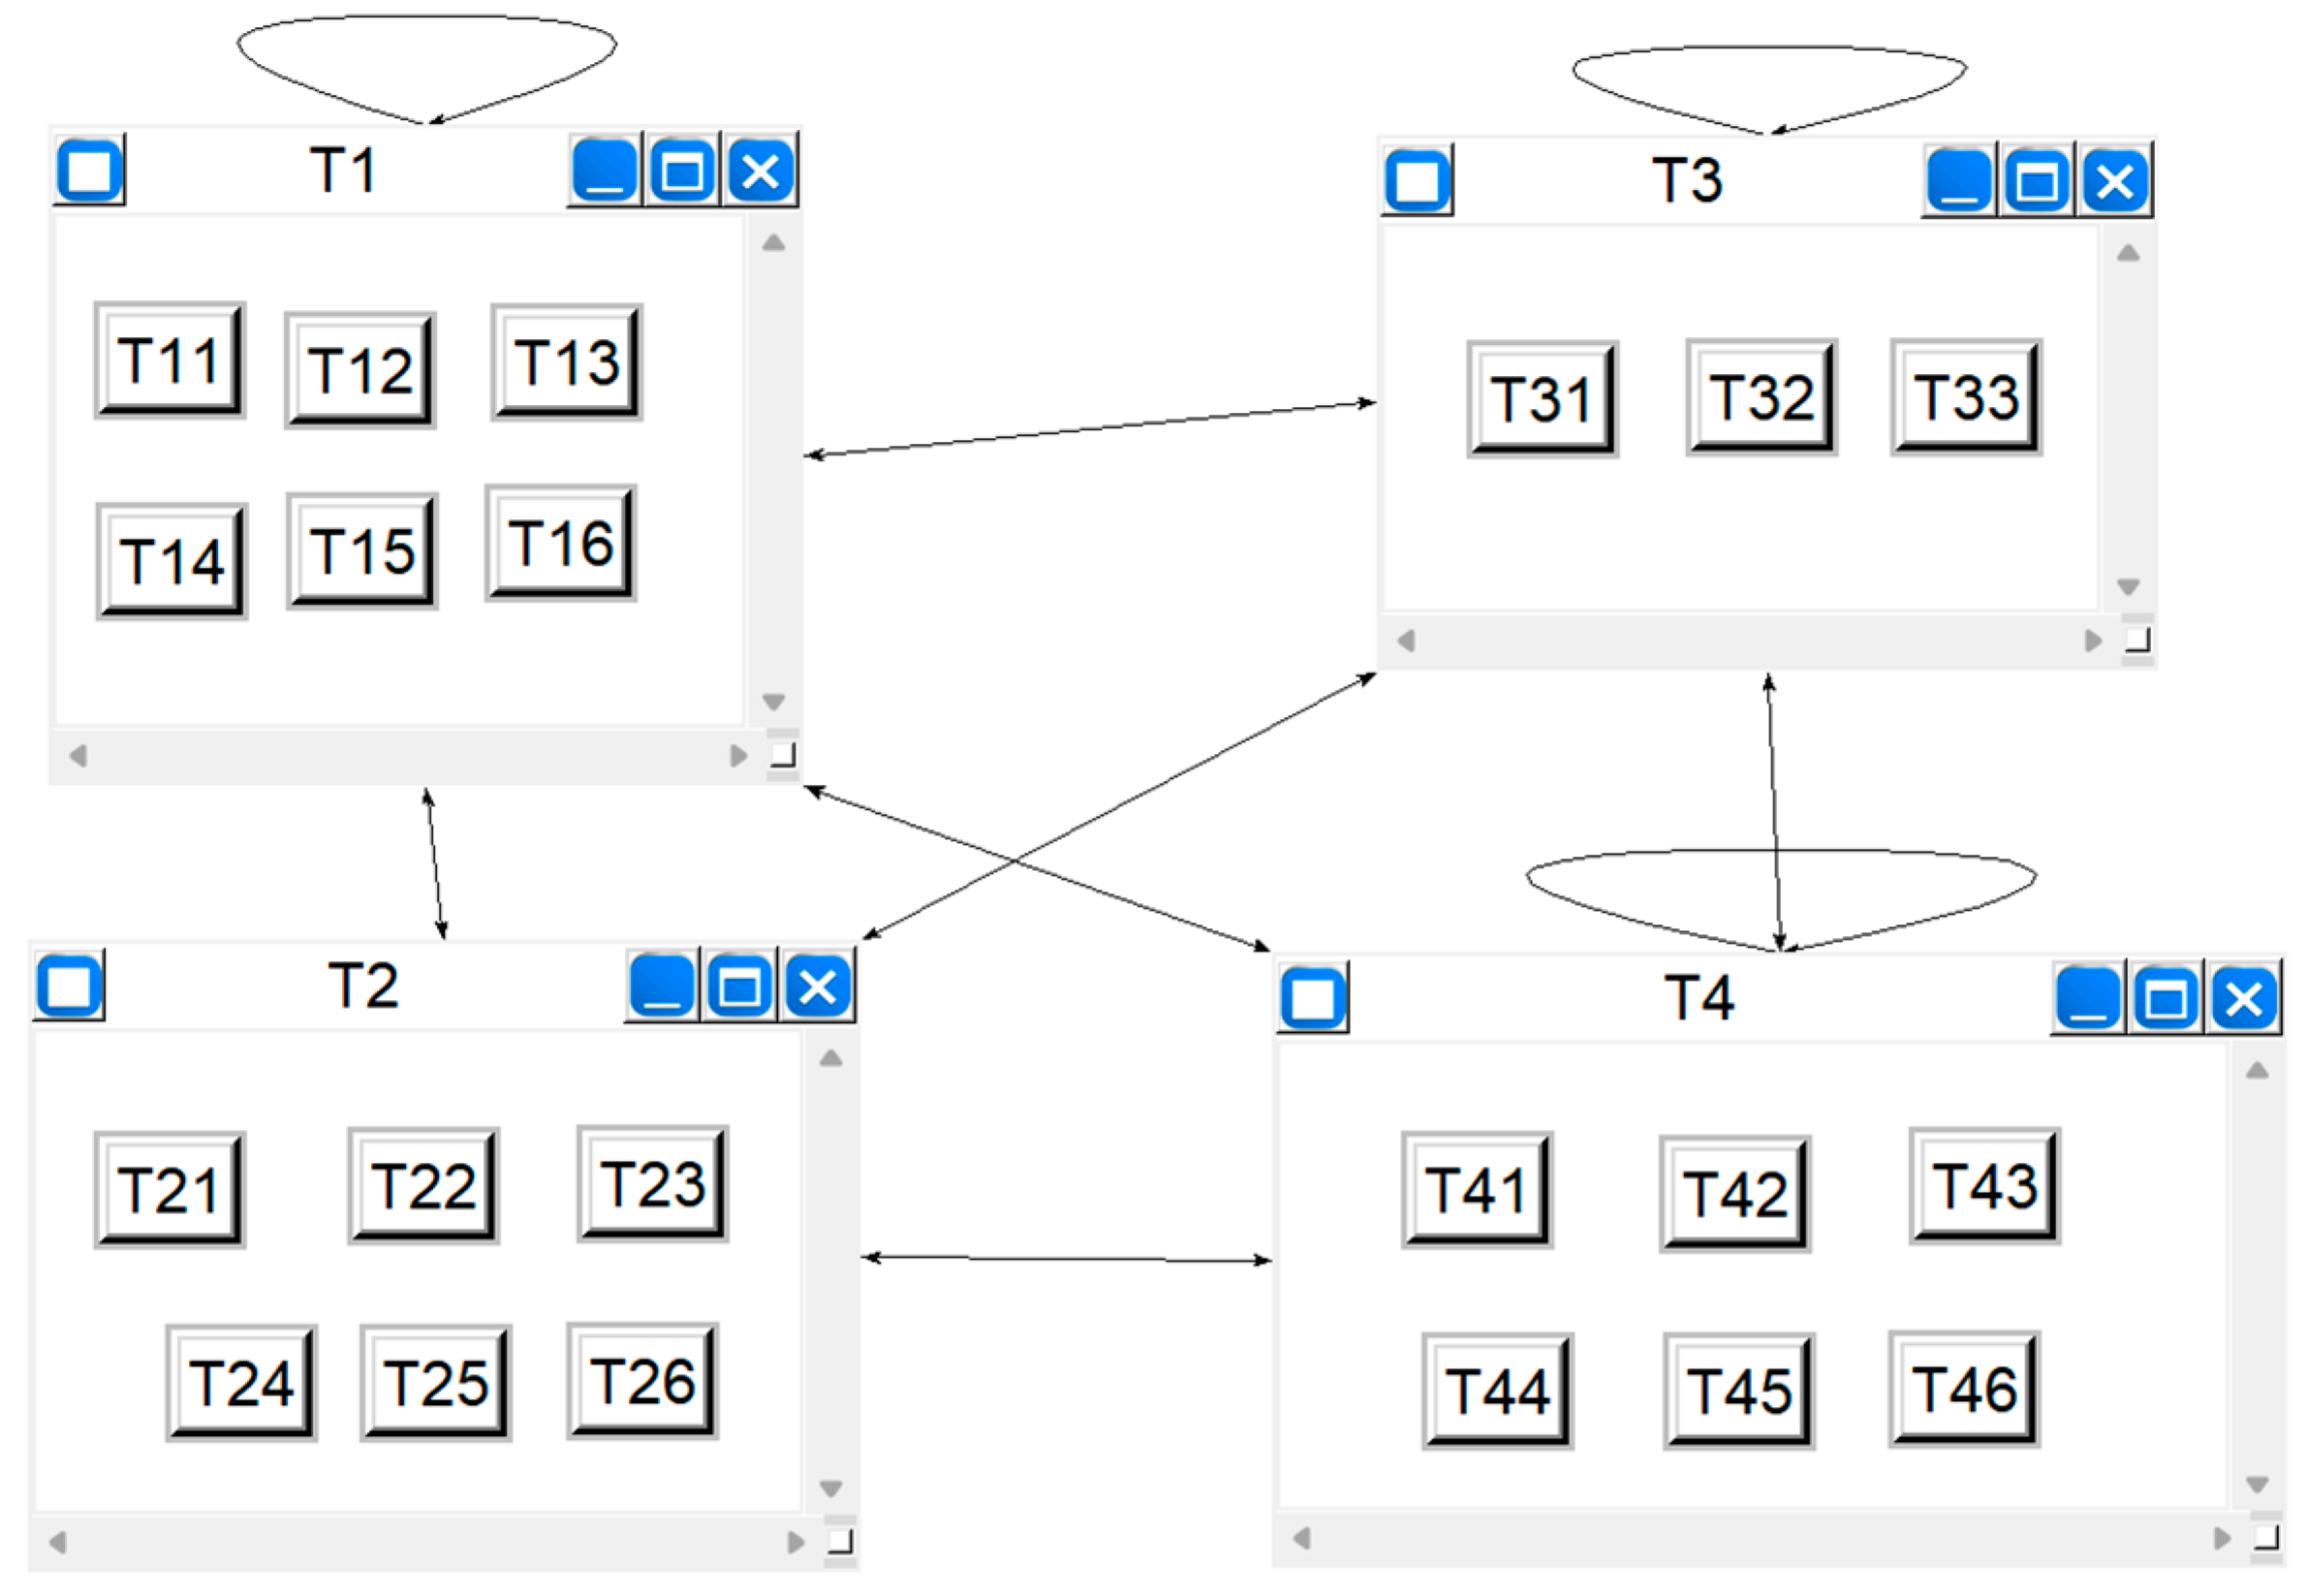
As shown in Figure 2, the ANP methodology in this paper consists of a control layer and a network layer where the control layer refers to the corresponding research object and the network layer refers to the categories of risk factors and the roles and links between them.

2.2.2. Unweighted Initial Supermatrix Construction

Based on indirect dominance comparison and expert panel judgments, the factor Rji (i = 1, 2 … N) in the risk Rj was used as the sub-criterion. The factors in Ri were compared two by two, and a pairwise comparison matrix was established using the 1–9 scale method [31], as shown in Table 3.
The maximum eigenroot was calculated, and the eigenvectors were normalized. The ratio of the difference between the largest eigenroot λmax of the judgment matrix and n (n is the order of the judgment matrix) to (n − 1) was introduced to the AHP as a measure of the deviation of the judgment matrix from consistency, as shown in Equation (1).
C I = ( λ m a x n ) n 1
The ratio of the consistency index CI to the average random consistency index RI for that order is denoted as CR (Equation (2)).
C R = C I R I < 0.1
That is, it passes the consistency test.
Sorting vectors were computed using the eigenroot method, referring to Wij (Equation (3)).
W i j = ω i 1 j 1 ω i 1 j 2 ω i 1 j n j ω i 2 j 1 ω i 2 j 2 ω i 2 j n j ω i n i j 1 ω i n i j 2 ω i n i j n j
The column vector of Wij is the ranked vector of the degree of influence of the factor Rii in the element group Ri on the factor Rji in the element group Rj. If the factor in Ri has no influence on the factor in Rj, then wij = 0 (i = 1, 2, N; j = 1, 2, N). This results in an unweighted supermatrix of factor interactions.

2.2.3. Weighted Supermatrix Calculation

Wij in the above supermatrix is the sorting vector obtained by a two-by-two comparison of the factors in Ri with Rji as the sub-criterion, verified to pass the consistency test. The score of the sorting vector of the group of factors not related to Rj was 0, and the weighting matrix A was obtained (Equation (4)).
W i j = ω i 1 j 1 ω i 1 j 2 ω i 1 j n j ω i 2 j 1 ω i 2 j 2 ω i 2 j n j ω i n i j 1 ω i n i j 2 ω i n i j n j
Weighting the risk factors in the supermatrix W yields W ¯ = ( w ¯ i j ) , the weighted supermatrix (Equation (5)), where the columns sum to one.
W ¯ = a 11 w 11 a 12 w 12 a 1 j w 1 j a 1 N w 1 N a 21 w 21 a 22 w 22 a 2 j w 2 j a 2 N w 1 N a i 1 w i 1 a i 2 w i 2 a i j w i j a i N w i N a N 1 w N N a N 2 w N 2 a N j w N j a N N w N N

2.2.4. Limit Supermatrix Calculation to Determine the Risk Factor Weights

Sufficiently weighted risk factor indicator operations were performed to avoid further variation in the weighted supermatrix, with the normalized result being the limiting supermatrix. Its column vector was the software project risk factor indicator Rii weight vector W′, as shown in Equation (6).
W = ( W 11 , W 12 , , W i i W N N ) T
The vector of the normalized weights for each risk factor Rij in the respective risk category Ri to which it belongs is shown in Equation (7).
W i = ( W i 1 , W i 2 , W i i ) T

2.3. Three-Dimensional Risk Matrix

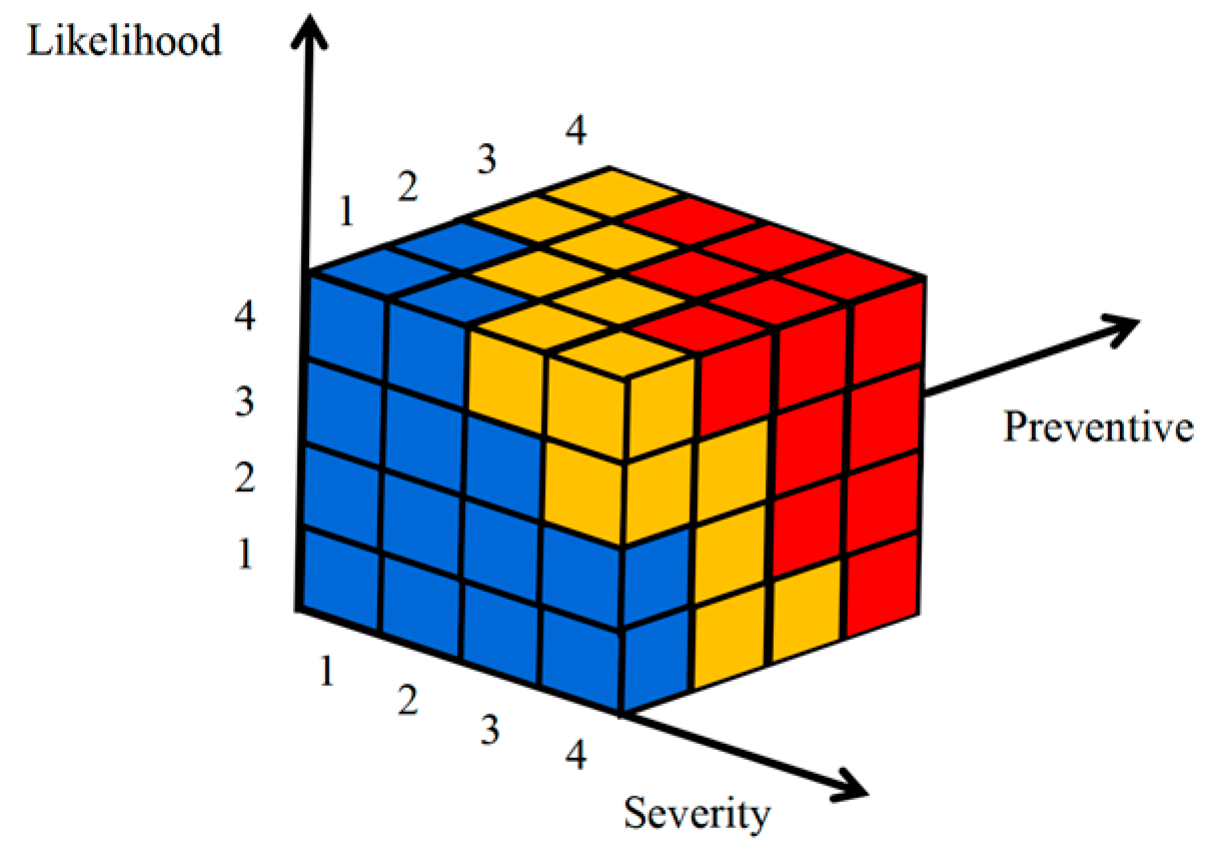
The traditional two-dimensional risk matrix consists of two parts: event likelihood and severity where likelihood refers to the probability of an event occurring and severity refers to the degree of the consequence or impact on the object of study [32]. The two-dimensional risk matrix suffers from problems such as homogenization due to the lack of analytical assessment of multiple attributes of risk [33,34]. In order to optimize the ability to identify risk levels and address the specific circumstances of laboratory hazardous chemical fires, a third risk attribute, “preventive,” was added to form a three-dimensional risk matrix [35] where preventive refers to the level of ability to prevent accidents from occurring.

2.3.1. Guidelines for Establishing Risk Attributes

In order to identify the overall likelihood level, a likelihood criterion (Table 4) was established that contains three elements: the overall likelihood value, the likelihood level, and the relevant description. The likelihood level is divided into four aspects (1, 2, 3, and 4) and corresponds to the relevant likelihood value of the integrated risk so as to complete the determination of the integrated risk level. Similarly, comprehensive severity criteria (Table 5) and comprehensive precautionary criteria (Table 6) were established.

2.3.2. Establishment of a Three-Dimensional Risk Matrix

For laboratory fire incidents involving hazardous chemicals, the likelihood (1, 2, 3, and 4), severity (1, 2, 3, and 4), and precautionary (1, 2, 3, and 4) criteria were used to create a corresponding three-dimensional risk matrix.
R(combined risk) = R1(likelihood) × R2(severity) × R3(precautionary)
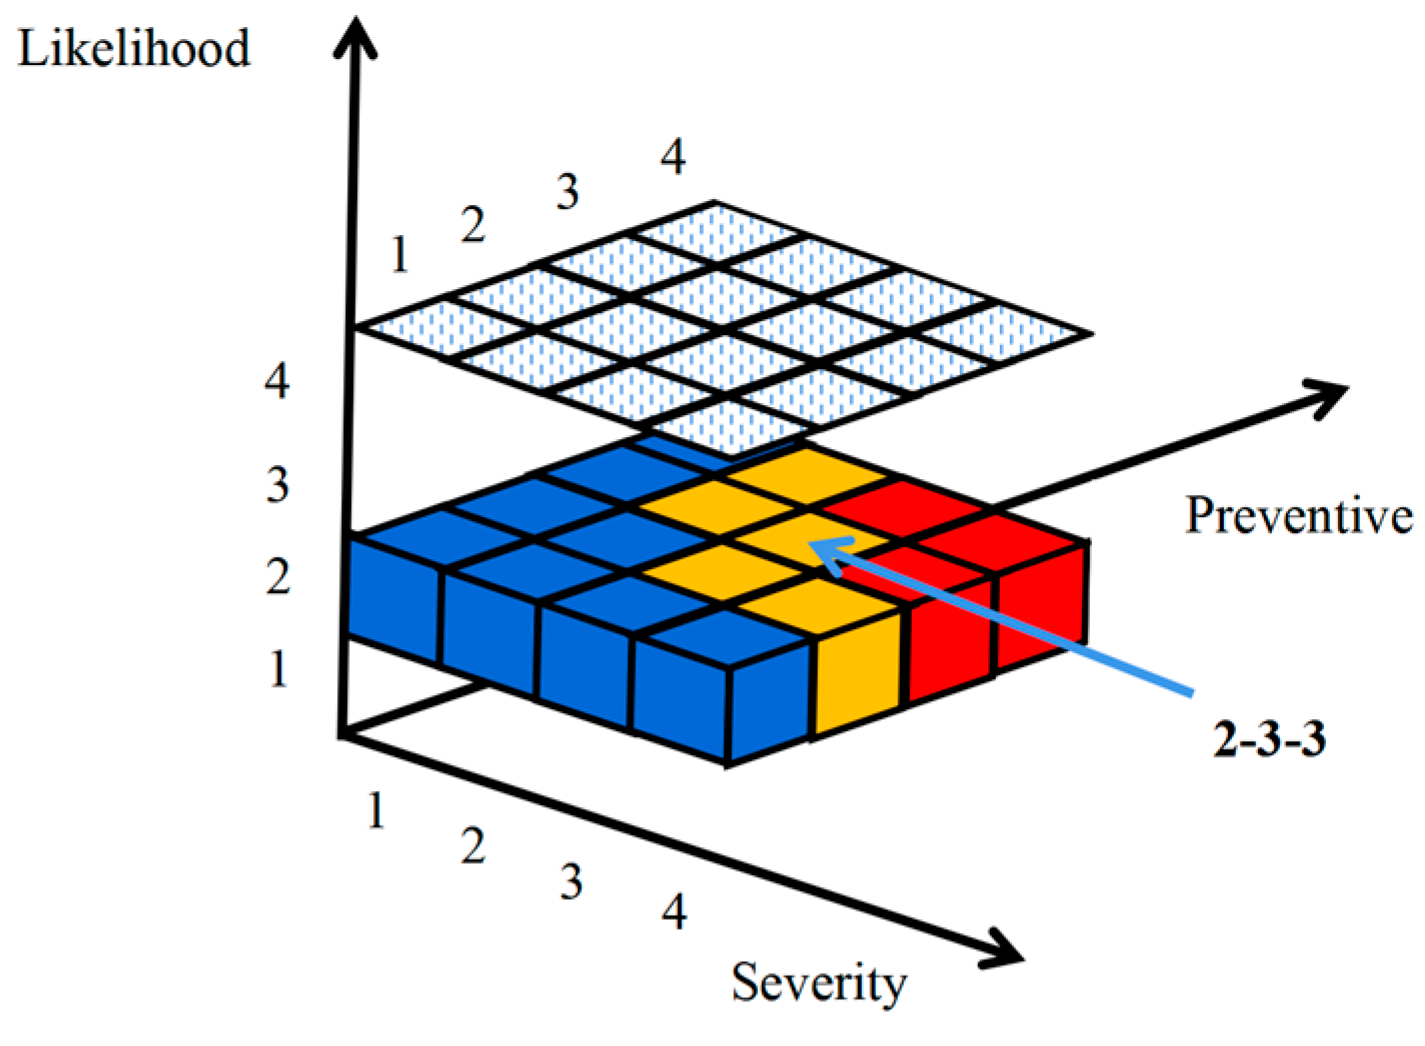
According to each of the four levels of the three indicators, there were 64 cases in total. Consequently, the three-dimensional risk matrix was divided into 64 risk units. The ALARP (As Low As Reasonable Practice) principle is a kind of project risk criterion principle that is widely used at the current acceptable level of risk. The comprehensive risk size was calculated using Equation (8). Based on the formulated risk range and the ALARP guidelines, it was classified into three risk levels: Acceptable (I), Tolerable (II), and Unacceptable (III). Corresponding risk level descriptions are proposed, which are shown in Table 7 and Figure 3.

2.4. Combination of Methods

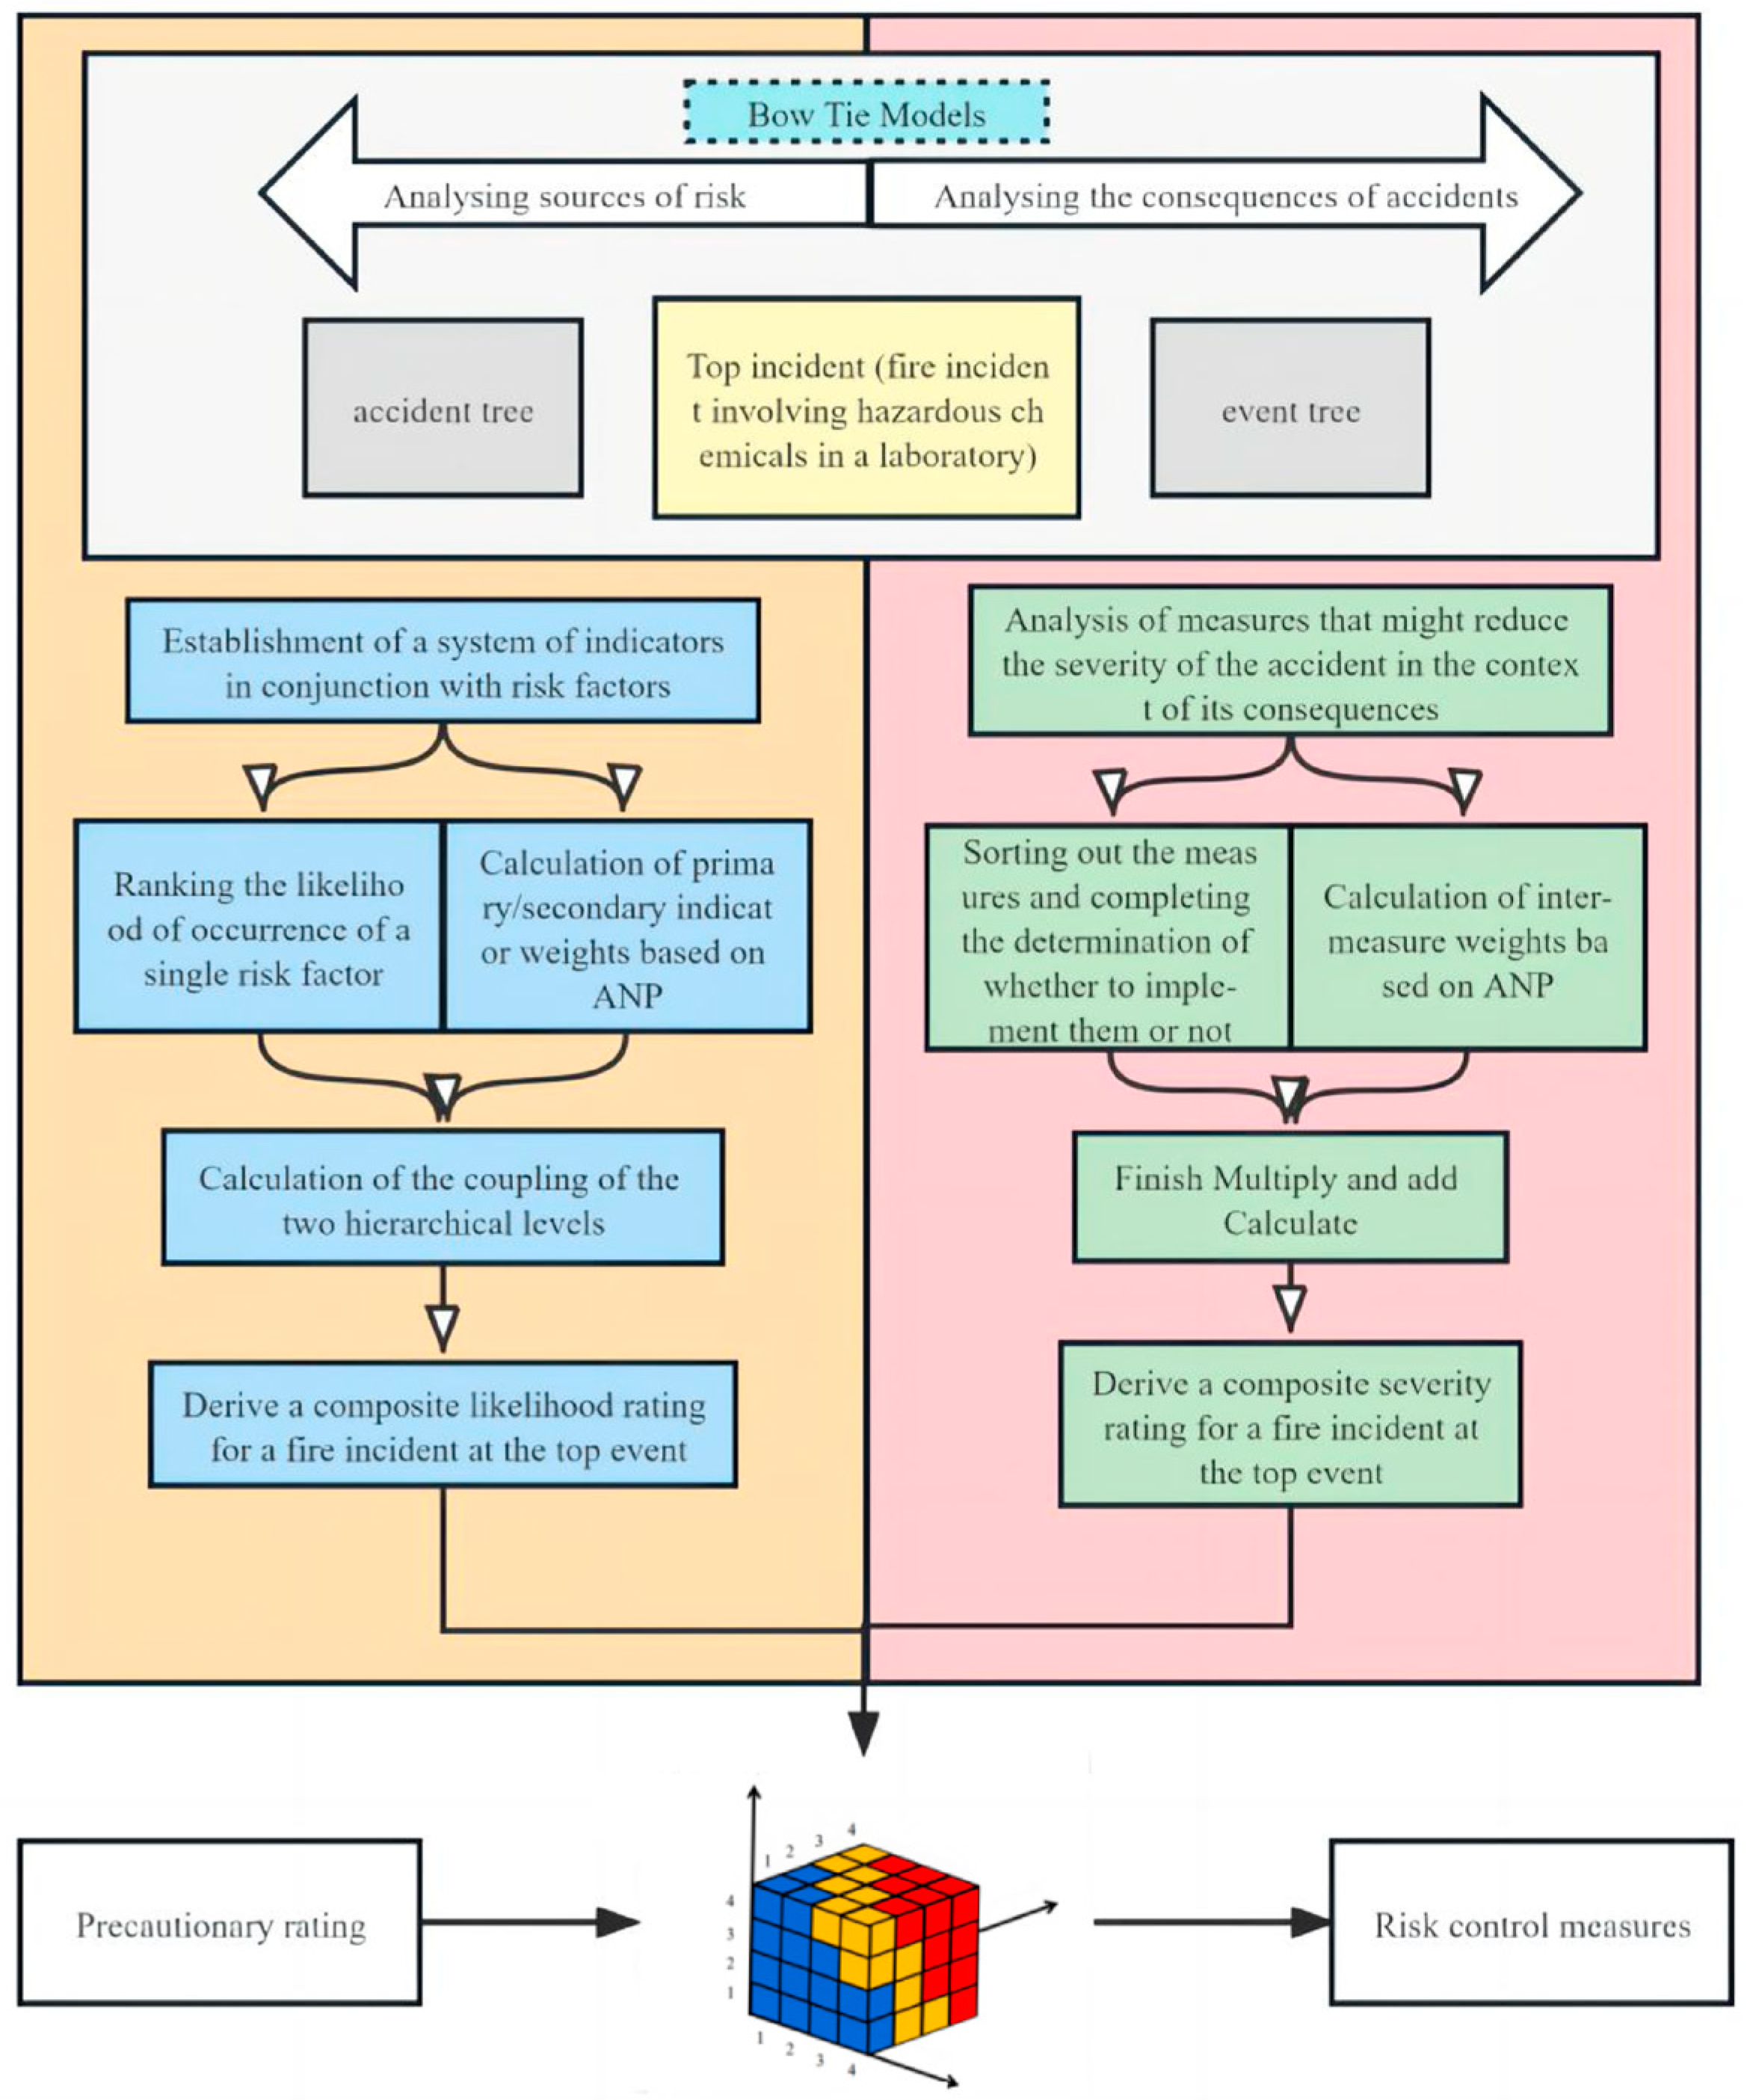
The three methods—the bowtie model, three-dimensional risk matrix, and ANP—were integrated and finally presented visually with the hierarchical judgment of the risk matrix, as shown in Figure 4. The three were cross-linked to form a comprehensive risk assessment model, which was used to complete the risk assessment and analysis of a research object and can be targeted to propose risk control measures.
As shown in Figure 4, the model is divided into two parts. On the left side, based on the results of the risk factor analysis of the accident tree, the corresponding primary and secondary indicators are determined, and the weights of the corresponding indicators are calculated to establish the risk determination level of the secondary indicators. On the right side, based on the analysis of the event tree, control measures for mitigating the serious consequences of an accident are clarified. These control measures are subject to a single level of determination and weighted to determine the comprehensive severity level. In addition, the comprehensive preventive measures are determined intuitively through the inspection of the system, plan, account, and other contents of the research object.

3. Comprehensive Risk Analysis

The TRT Research Institute was established in 2007 as a platform for scientific and technological innovation through an innovative research mechanism and system and the concentration of advantageous research resources. The Research Institute has a building area of 16,000 square meters, nearly 850 sets of fixed assets, and a high level of various experimental instruments and equipment. The institute’s procedures encompass the whole process of purchasing, storing, using, and discarding hazardous chemicals, as well as operating electrical equipment and using gas cylinders, ovens, and other sources of risk. This includes a variety of dangerous chemicals, such as flammable, toxic, and explosive substances, which can be studied as typical cases. The TRT Research Institute mainly focuses on the storage and use of hazardous chemicals, the operation of electrical equipment, and the use of gas cylinders, ovens, and other sources of risk. This study assessed the fire risks associated with liquid, gas, and solid hazardous chemicals present in the laboratories within the TRT Research Institute.

3.1. Bowtie Modeling

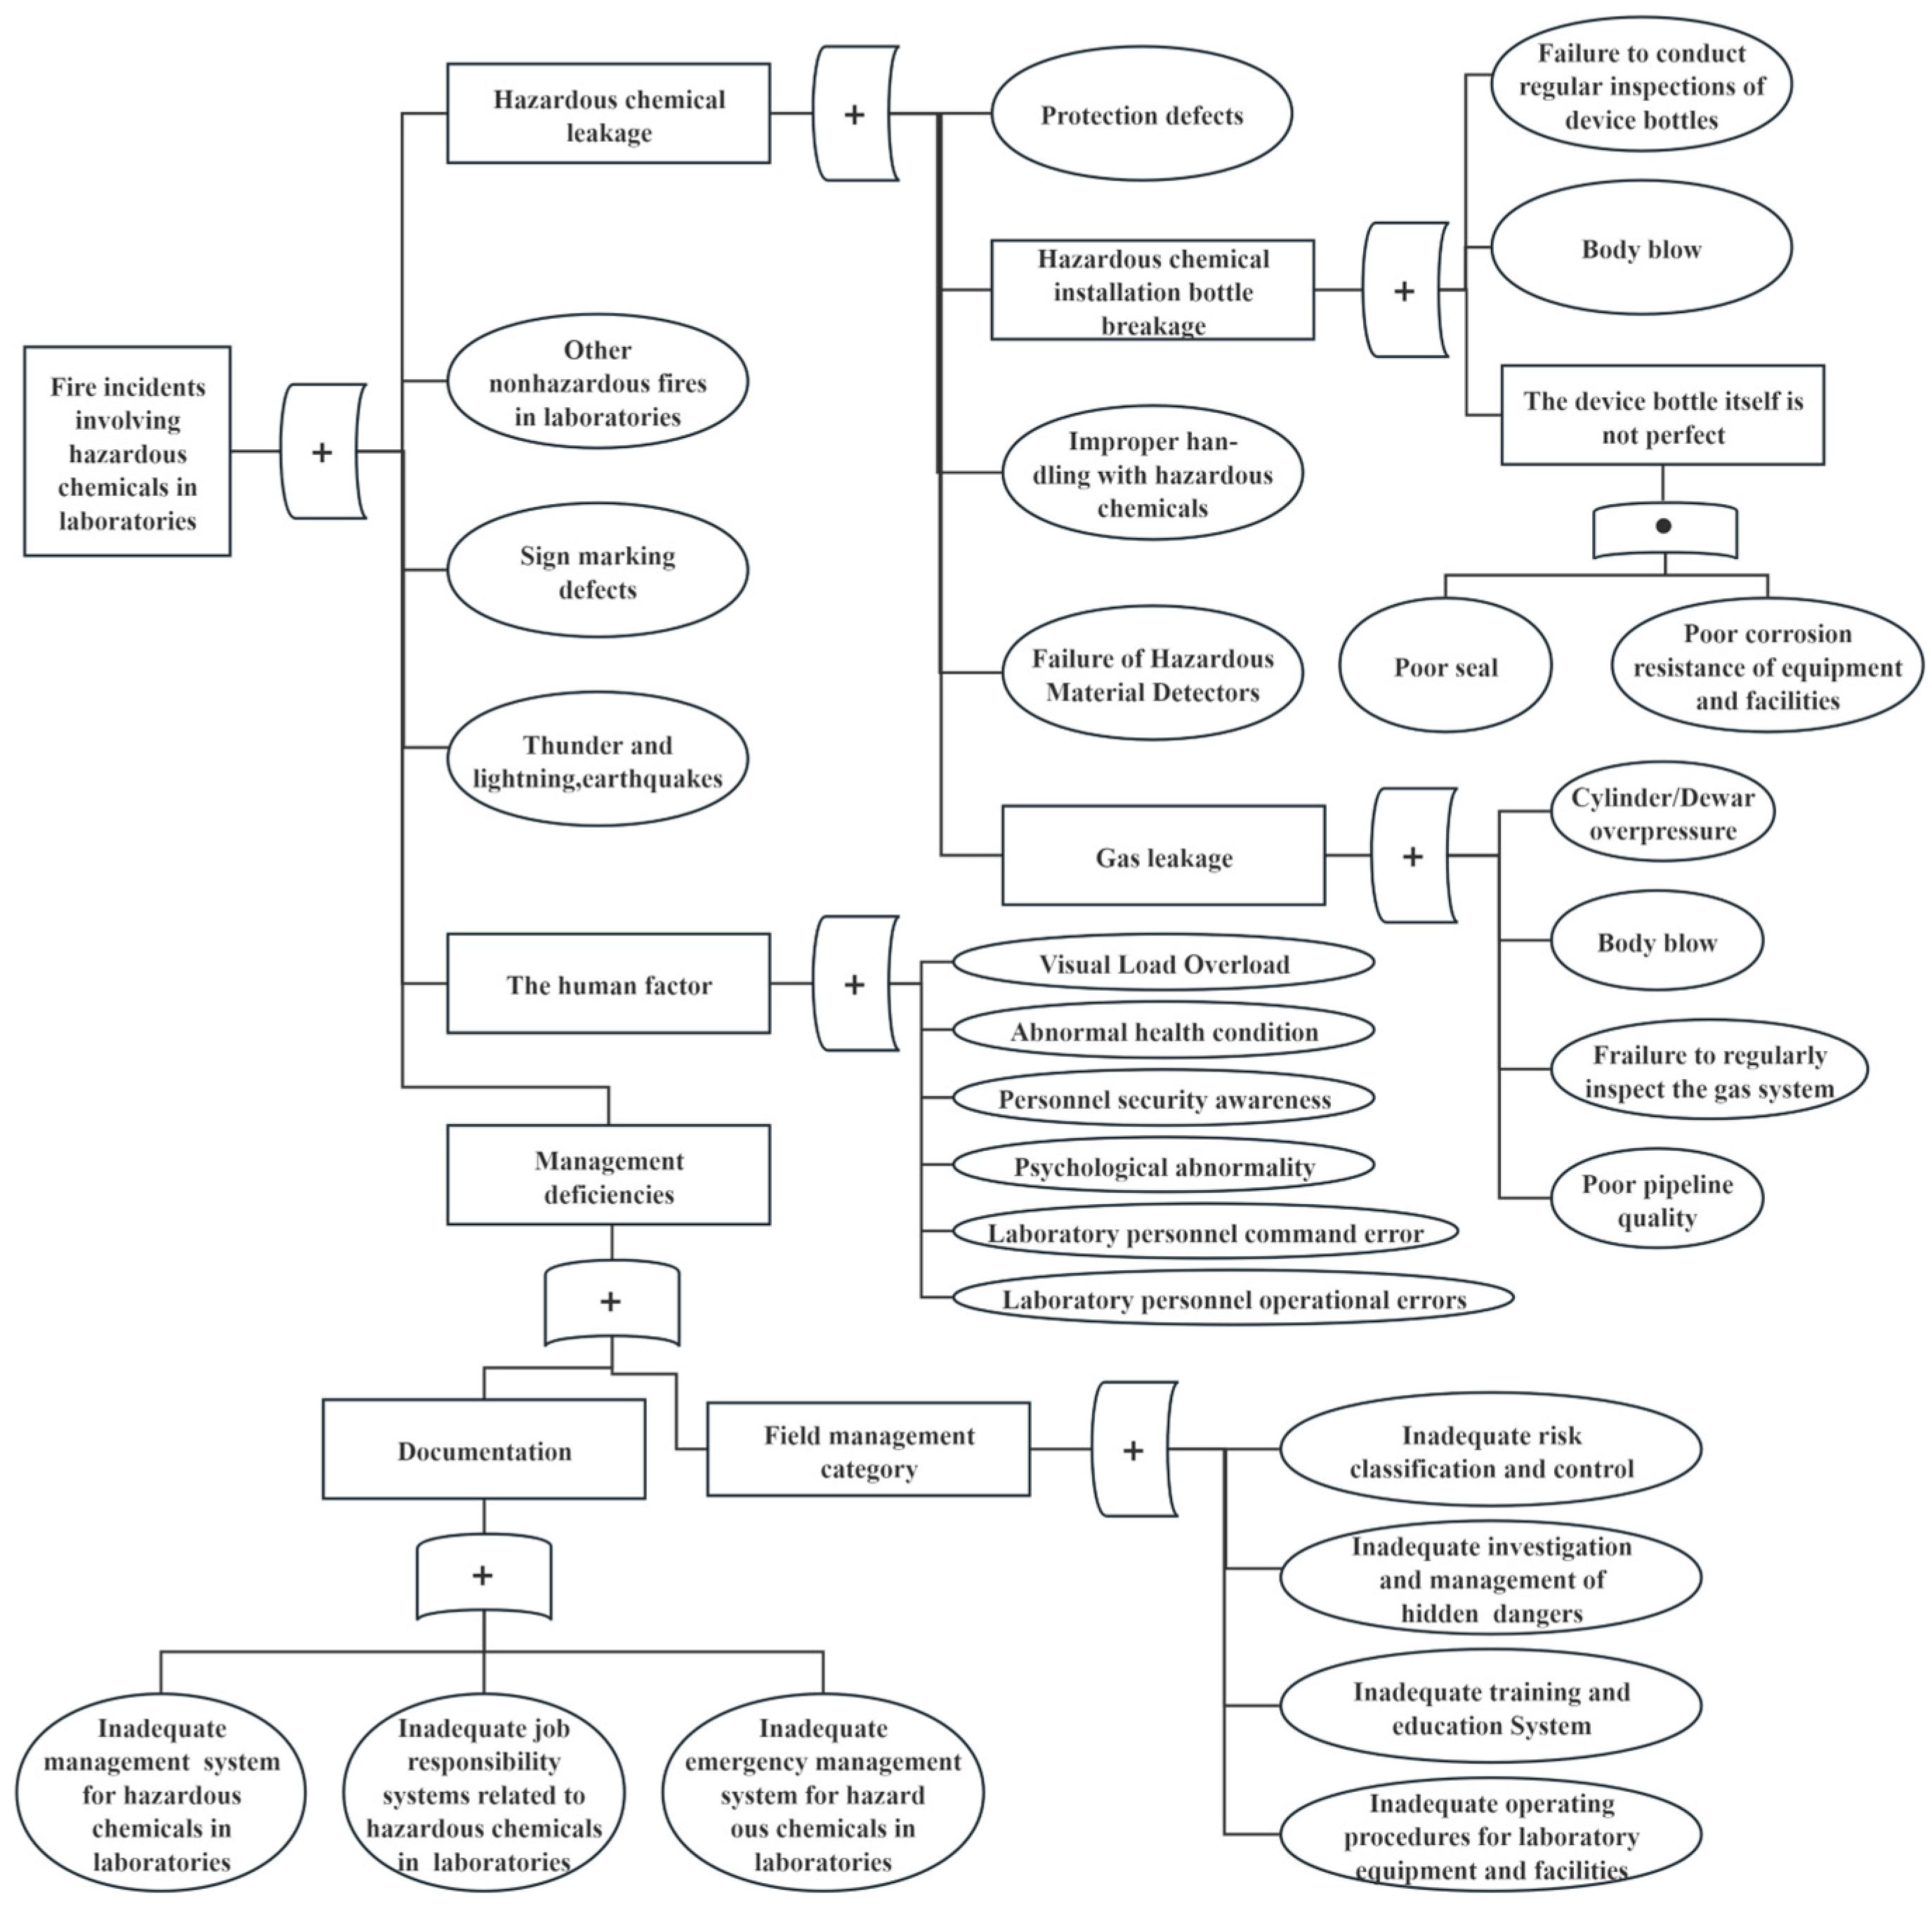
A bowtie model for fire incidents involving hazardous chemicals at the TRT Research Institute was constructed. First, a hazardous chemical fire accident tree analysis for the laboratories was completed, as shown in Figure 5. The results of this analysis were used to populate the left side of the bowtie model. As can be seen in Figure 6, the risk prevention measures were matched one by one to the basic events identified in the accident tree.
Using the event tree analysis method, we assessed whether control measures such as personnel protection, firefighting, ventilation, and clean-up are implemented to determine whether a hazardous chemical fire can be controlled. This approach is divided into two parts within the bowtie model: consequence analysis for both control and out-of-control scenarios. Analysis of the bowtie model can help identify preventive and control measures for hazardous chemical fire accidents in the TRT Research Institute’s laboratories, thereby improving the Institute’s risk control capabilities.

3.2. Comprehensive Likelihood Analysis

Based on the actual situation at the TRT, the 27 basic events shown in Figure 6 were summarized and classified to establish a hazardous laboratory chemical fire accident indicator system, as shown in Figure 7. The indicator system is divided into four primary indicators and 21 secondary indicators.
The process of determining the likelihood of a single indicator and the corresponding weighting of indicators to calculate a composite likelihood rating based on the hazardous laboratory chemical fire indicator system is described below.

3.2.1. Single-Indicator Possibilities Identified

A total of 21 secondary indicators (T11–T46), shown in Figure 7, were described in terms of single likelihood, with levels defined as low, medium, and high, and assigned values of 1, 2, and 3, respectively. The assessment was combined with the university laboratory fire safety management standards and the Guidelines for Safety Management of Hazardous Chemicals in Beijing Scientific Research Units. The description of the likelihood of these secondary indicators is detailed in Table 8.
An on-site investigation at the TRT Research Institute included hidden danger assessment, safety document inspection, and fire evacuation drills. Based on the findings, the grade for the secondary indicators of the Institute was determined, as shown in Table 9.

3.2.2. Calculation of ANP Indicator Weights

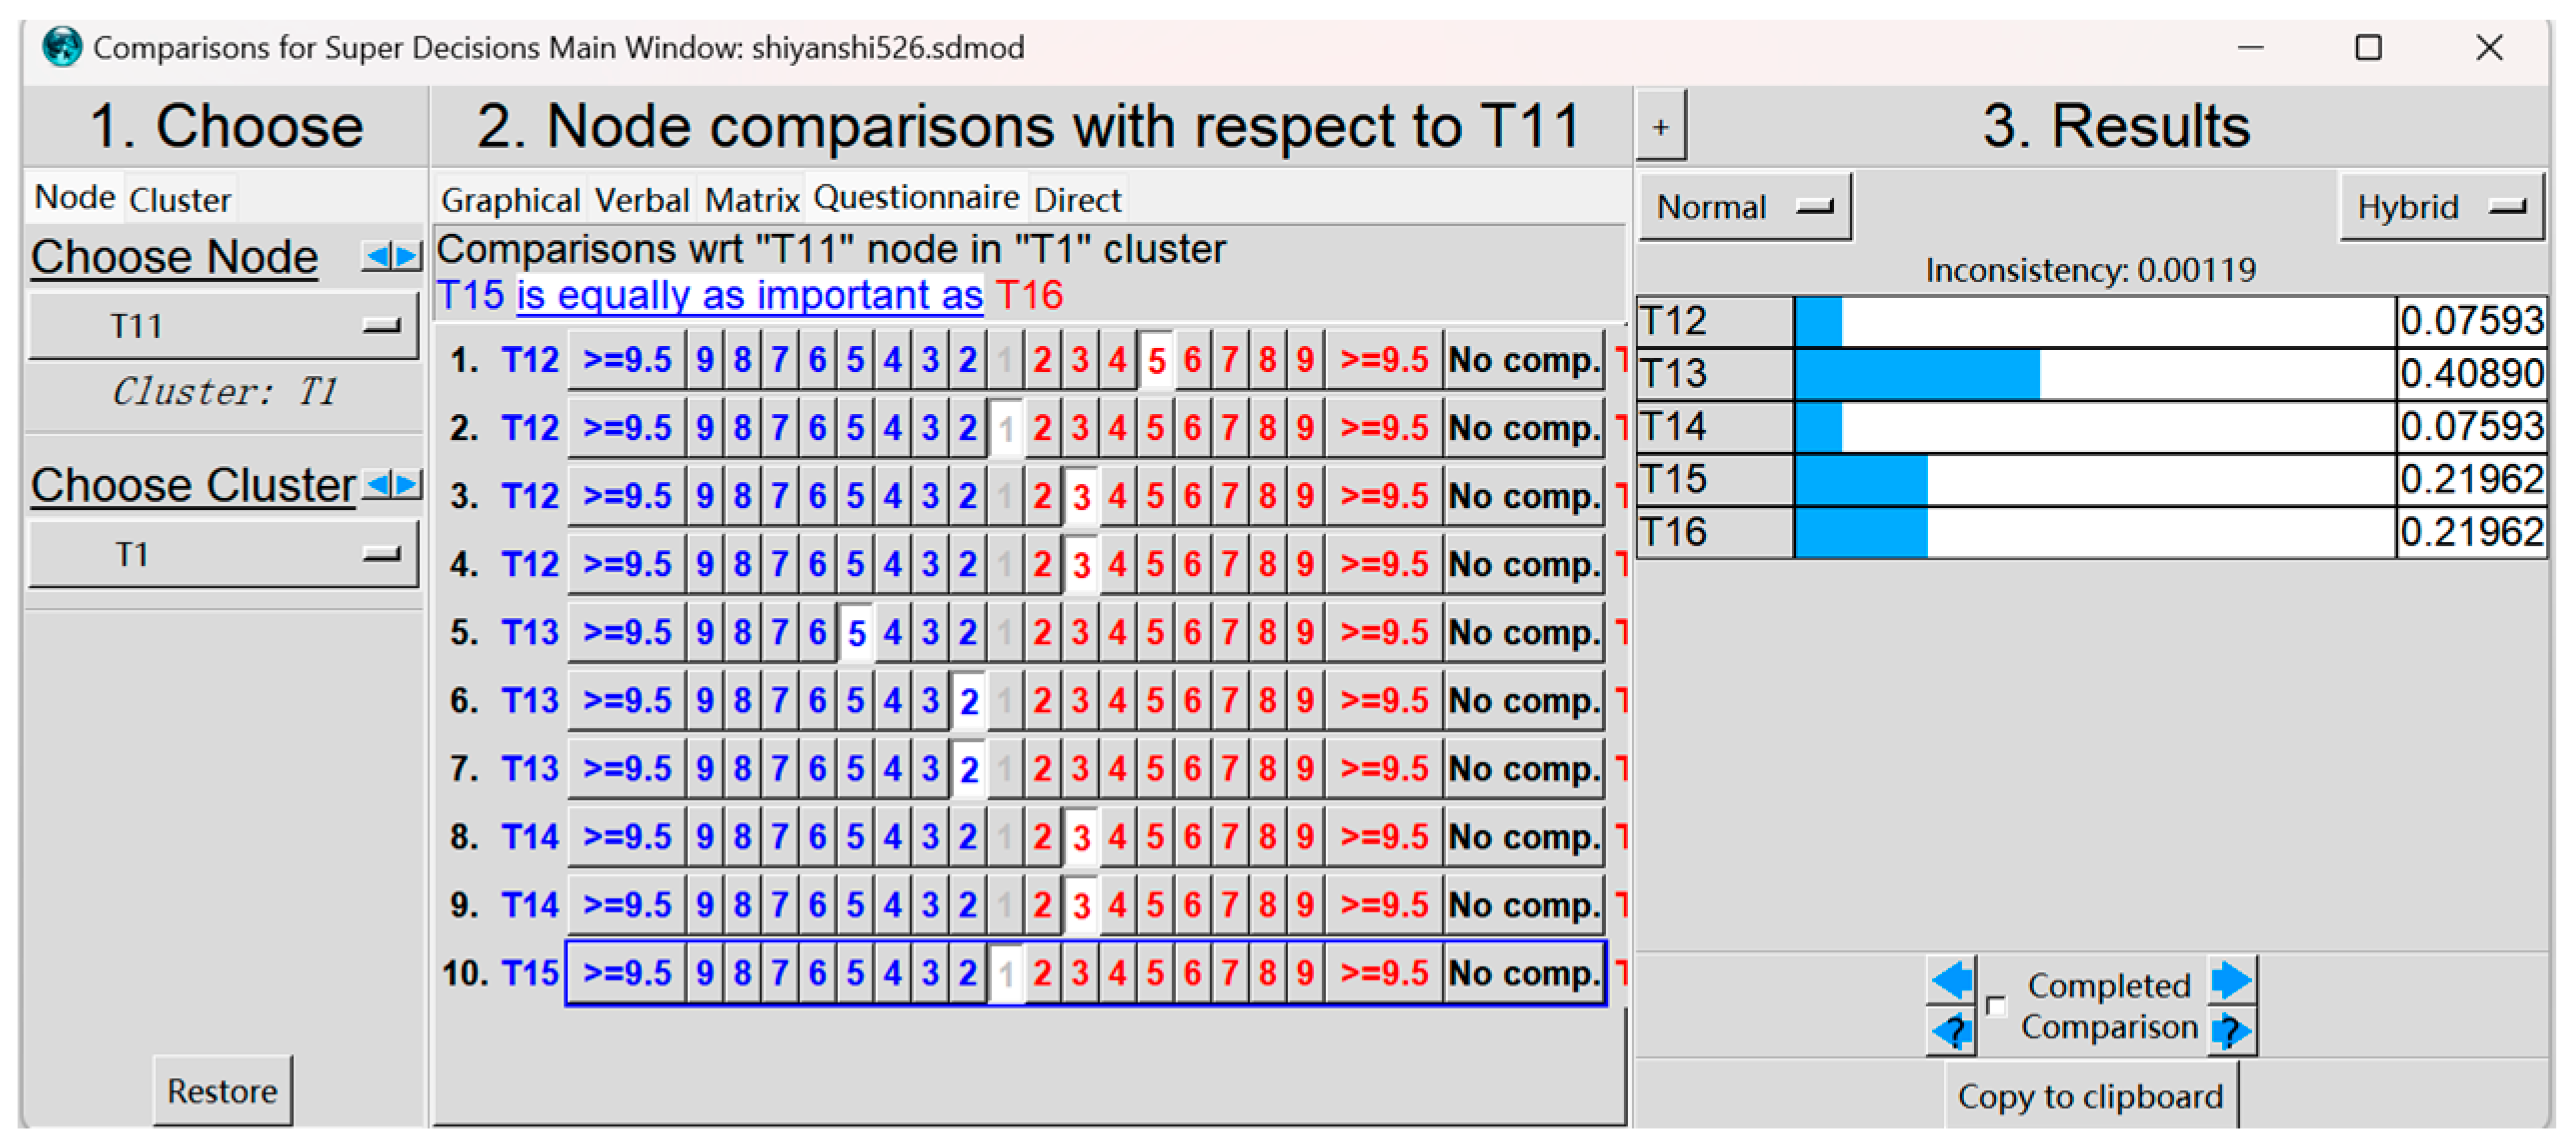
The ANP method was used to calculate the weights of four primary indicators and 21 secondary indicators, utilizing Super decisions V3.2 software. First, the interactions and connections between the indicators, as shown in Figure 8, were established. Next, a comparison of the importance of different indicators, depicted in Figure 9, was completed. Finally, the limit supermatrix data were derived, and the relevant weights of the four first-level and 21 second-level indicators were determined (Table 10). The combined likelihood values were calculated by combining the results of the judgments in Table 9.

3.2.3. Composite Likelihood Rating Calculation

The combined likelihood values were calculated by combining the single indicator likelihood ratings (Table 9) with the indicator weights (Table 10) according to Equation (9).
H = i = 1 n T i W i
The final calculation resulted in a composite likelihood value of 1.56, which, when combined with the likelihood classification guidelines established in Table 4, reached a composite likelihood level of 2.

3.3. Comprehensive Severity Analysis

According to the results of the accident consequence analysis using the bowtie model, the implementation of the relevant measures will affect the severity of laboratory hazardous chemical fire accidents. Therefore, control measures were established with corresponding assessment indicators, as shown in Figure 10. The ANP method was used to determine the relevant weights for these indicators, as shown in Table 11, to calculate the integrated severity value and the corresponding integrated severity level.
On the one hand, the implementation status of the control measures was determined based on emergency response drills for dangerous chemical fire accidents and the results of the hidden danger investigation at the TRT Research Institute (Table 11). On the other hand, the corresponding weights of the control measures were calculated as P{0.45227, 0.35357, 0.14616, 0.04801} in combination with the ANP method. The combined severity value of 2.09817 was calculated using Equation (9), and the combined severity level was determined to be level 3, based on Table 5.

3.4. Integrated Preventive Analysis

By conducting inspections of the actual hidden danger, emergency drills, education and training, system and document reviews, and account records of the Institute, the comprehensive preventive capacity of the Institute was determined based on the implementation of these five areas, as shown in Table 12.
By determining the actual performance of the TRT Research Institute and calculating the results of the weighting calculations, a combined preventive value of 2.018 was obtained. Based on the preventive criteria of the three-dimensional risk matrix in Table 6, a combined preventive rating of 3 for the Institute was obtained.

3.5. Combined Risk Level Determination

By assessing the comprehensive likelihood level, comprehensive severity level, and comprehensive preventive level judgment of hazardous material fire accidents in the laboratories of the Institute, the overall risk level of the Institute could be determined, as shown in Table 7. The combined risk value was calculated as RCombined risk = 2 × 3 × 3 = 18, which results in an overall risk rating of Tolerable (II) for the Institute, as shown in Figure 11.

4. Results and Discussion

The process of determining the risk level at the TRT Research Institute was completed using the developed risk assessment model, and the results were analyzed with respect to the combination of likelihood, severity, and precaution.
(1)
Comprehensive likelihood analysis
First, the 27 basic events of the bowtie model were summarized and classified into four primary indicators and 21 secondary indicators. The ANP was used to calculate the weights of these indicators, and the results showed that management factors had the highest weights, followed by human factors. This suggests that management and human factors should be prioritized in controlling the risk of fire or hazardous chemicals at the Institute. Meanwhile, the calculation of the weights for secondary indicators revealed that the main issues in safety management are the lack of safety awareness among personnel, incorrect commands by laboratory personnel, and an imperfect management system and education and training. Consequently, this aspect of the TRT Research Institute’s safety management was rated as level 2.
(2)
Comprehensive severity analysis
Combining the results from the control measures section of the event tree analysis in the bowtie model, the weights of the control measures were calculated using the ANP. The results show that personnel protection has the highest weight, followed by firefighting measures, ventilation measures, and cleaning measures. Among these, ventilation measures were identified as the weakest aspect of the actual management of the TRT Research Institute. Consequently, this aspect of the TRT Research Institute was rated as level 3.
(3)
Integrated preventive analysis
The ANP weighting results show that the system documents and emergency drills should also be updated and optimized to improve the safety management level of the Institute. In the comprehensive preventive analysis, the main problems faced by the TRT Research Institute lie in the areas of hidden danger investigations and record keeping. The Institute should focus on strengthening the management of these areas. Consequently, this aspect of the TRT Research Institute was rated as level 3.
(4)
Comprehensive risk analysis
The analysis resulted in a comprehensive risk level rated as tolerable level. This indicates the need for the Institute to continue strengthening the relevant systems, plans, ventilation measures, personnel awareness, and education and training. Additionally, environmental factors, operating procedures, and personnel operations should be further addressed. The Institute should commit to fully standardizing the management of hazardous chemicals in its laboratories, raising the importance of laboratory risk assessment and increasing investment in safety management.

5. Conclusions

In this study, a semi-quantitative risk assessment methodology for laboratory hazardous chemical fire events was developed by combining the bowtie model, the three-dimensional risk matrix, and the ANP method. This comprehensive risk assessment method solves the incompleteness and uncertainty of laboratory hazardous chemicals assessments. The application of this method was illustrated through a case study of laboratory hazardous chemicals at the TRT Research Institute. The conclusions of this article are as follows:
(1)
A new method for assessing fire risk related to hazardous chemicals in laboratories was developed. This method constructs a three-dimensional risk matrix based on three factors (comprehensive likelihood, comprehensive severity, and integrated preventive) to comprehensively assess the laboratory’s risk concerning hazardous chemical fires. By integrating these aspects, this method offers practical significance tailored to the specific characteristics of the accidents analyzed.
(2)
The conditions for determining the comprehensive preventive grade are mostly based on key points identified during the actual inspection process. Therefore, the level of risk can be updated in real time using inspection results, providing valuable references for law enforcement inspections of research institutes and government departments.
(3)
This study only focused on laboratory hazardous chemical fires, aiming to propose effective control measures in a timely manner through safety assessments to reduce casualties. However, it did not address environmental factors, reputation, and other related factors. Future research could explore these areas further using methods such as safety resilience analysis.

Author Contributions

Conceptualization, C.Q. and Q.Z.; methodology, Y.C. and Q.Z.; software, Y.C.; validation, Q.Z. and Y.C.; formal analysis, C.Q. and Q.Z.; investigation, M.M.; resources, C.Q.; data curation, M.M.; writing—original draft preparation, Y.C.; writing—review and editing, Q.Z. and M.M.; visualization, Q.Z.; supervision, C.Q. All authors have read and agreed to the published version of the manuscript.

Funding

This research received no external funding.

Institutional Review Board Statement

Not applicable.

Informed Consent Statement

Not applicable.

Data Availability Statement

The original contributions presented in the study are included in the article, further inquiries can be directed to the corresponding author.

Conflicts of Interest

The authors declare no conflicts of interest.

References

  1. Lu, L.; Liang, W.; Zhang, L.; Zhang, H.; Lu, Z.; Shan, J. A comprehensive risk evaluation method for natural gas pipelines by combining a risk matrix with a bow-tie model. J. Nat. Gas Sci. Eng. 2015, 25, 124–133. [Google Scholar] [CrossRef]
  2. Xie, S.; Dong, S.; Chen, Y.; Peng, Y.; Li, X. A novel risk evaluation method for fire and explosion accidents in oil depots using bow-tie analysis and risk matrix analysis method based on cloud model theory. Reliab. Eng. Syst. Saf. 2021, 215, 107791. [Google Scholar] [CrossRef]
  3. Tian, D.; Jia, C.; Song, W. Analysis of factors affecting emergency response capability of universities based on AHP and risk matrix method. Ind. Saf. Environ. Prot. 2022, 48, 1–5. [Google Scholar]
  4. Zhang, Y.; Zhang, H. Research on accident risk assessment of tourist attractions based on three-dimensional risk matrix. Tour. Res. 2014, 6, 69–74. [Google Scholar]
  5. Guo, R.; Zhao, X.; Zhang, Z. Research on three-dimensional matrix model for risk evaluation of train control operation. J. Railw. 2017, 39, 78–83. [Google Scholar]
  6. Ho, C.; Chen, M. Risk assessment and quality improvement of liquid waste management in Taiwan University chemical laboratories. Waste Manag. 2018, 71, 578–588. [Google Scholar] [CrossRef]
  7. Davardoost, F.; Kahforoushan, D. Health risk assessment of VOC emissions in laboratory rooms via a modeling approach. Environ. Sci. Pollut. Res. 2018, 25, 17890–17900. [Google Scholar] [CrossRef]
  8. Ozdemir, Y.; Gul, M.; Celik, E. Assessment of occupational hazards and associated risks in fuzzy environment: A case study of a university chemical laboratory. Hum. Ecol. Risk Assess. Int. J. 2017, 23, 895–924. [Google Scholar] [CrossRef]
  9. Zhao, C.; Liu, B.; Li, J.; Li, S.; Liu, Y.; Guo, Y.; Zhang, X. Evaluation of Laboratory Management Based on a Combination of TOPSIS and RSR Methods: A Study in 7 Provincial Laboratories of China. Front. Public Health 2022, 10, 883551. [Google Scholar] [CrossRef] [PubMed]
  10. Mastrantonio, R.; Scatigna, M.; D’Abramo, M.; Martinez, V.; Paoletti, A.; Fabiani, L. Experimental Application of Semi-Quantitative Methods for the Assessment of Occupational Exposure to Hazardous Chemicals in Research Laboratories. Risk Manag. Health Policy 2020, 13, 1929–1937. [Google Scholar] [CrossRef]
  11. Marendaz, J.-L.; Friedrich, K.; Meyer, T. Safety management and risk assessment in chemical laboratories. Chimia 2011, 65, 734–737. [Google Scholar] [CrossRef]
  12. Chen, L. Research of the safety path of colleges and universities laboratory basing on the analysis of grey correlation degree. J. Intell. Fuzzy Syst. 2021, 40, 7755–7762. [Google Scholar] [CrossRef]
  13. Choi, B.; Kim, E. Development of a Safety Rating Method for University Laboratories. J. Korean Soc. Hazard Mitig. 2019, 19, 169–175. [Google Scholar] [CrossRef]
  14. Zhang, X.; Hu, X.; Bai, Y.; Wu, J. Risk assessment of gas leakage from school laboratories based on the Bayesian network. Int. J. Environ. Res. Public Health 2020, 17, 426. [Google Scholar] [CrossRef]
  15. Mascia, A.; Cirafici, A.; Bongiovanni, A.; Colotti, G.; Lacerra, G.; Carlo, M.; Digilio, F.; Liguori, G.; Lanati, A.; Kisslinger, A. A failure mode and effect analysis (FMEA)-based approach for risk assessment of scientific processes in non-regulated research laboratories. Accredit. Qual. Assur. 2020, 25, 311–321. [Google Scholar] [CrossRef]
  16. Li, X.; Zhang, L.; Zhang, R.; Yang, M.; Li, H. A semi-quantitative methodology for risk assessment of university chemical laboratory. J. Loss Prev. Process. Ind. 2021, 72, 104553. [Google Scholar] [CrossRef]
  17. Yu, H.; Xu, H.; Xu, Y.; Li, Z.; Wang, P.; Wang, P. Construction and evaluation of PHP-based management and training system for electrical power laboratory. Comput. Appl. Eng. Educ. 2016, 24, 371–381. [Google Scholar] [CrossRef]
  18. Wang, Q.; Ding, F.; Li, S.; Zhao, X. Advance in environmental risk assessment of high level biosafety laboratory. Procedia Environ. Sci. 2012, 13, 1458–1461. [Google Scholar] [CrossRef]
  19. Marendaz, J.; Suard, J.; Meyer, T. A systematic tool for assessment and classification of hazards in laboratories (ACHiL). Saf. Sci. 2013, 53, 168–176. [Google Scholar] [CrossRef]
  20. Mulcahy, M.B.; Boylan, C.; Sigmann, S.; Stuart, R. Using bowtie methodology to support laboratory hazard identification, risk management, and incident analysis. J. Chem. Health Saf. 2017, 24, 14–20. [Google Scholar] [CrossRef]
  21. Fatemi, F.; Dehdashti, A.; Jannati, M. Implementation of Chemical Health, Safety, and Environmental Risk Assessment in Laboratories: A Case-Series Study. Front. Public Health 2022, 10, 898826. [Google Scholar] [CrossRef]
  22. Chen, M.; Wu, Y.; Wang, K.; Guo, H.; Ke, W. An explosion accident analysis of the laboratory in university. Process. Saf. Prog. 2020, 39, e12150. [Google Scholar] [CrossRef]
  23. Kim, T.; Rhie, K.; Seo, D.; Lee, I.; Yoon, C.; Lee, Y.; Park, J. A Study on the Hazard Identification of Laboratory using 4M & HAZOP. J. Korean Soc. Saf. 2013, 28, 88–94. [Google Scholar] [CrossRef]
  24. Kim, S. A Study on the Improvement of Risk Assessment Method in Laboratory. J. Soc. Disaster Inf. 2022, 18, 444–456. [Google Scholar] [CrossRef]
  25. Sundawa, B.V.; Hutajulu, E.; Sirait, R.; Banurea, W.; Indrayadi; Mulyadi, S. Risk assessment for safety laboratories in Politeknik Negeri Medan. J. Phys. Conf. Ser. 2017, 890, 012147. [Google Scholar] [CrossRef]
  26. Zhang, Y.; Mao, P.; Li, H.; Xu, Y.; You, D.; Liu, H.; Huang, W.; Yuan, J. Assessing the safety risks of civil engineering laboratories based on lab criticity index: A case study in Jiangsu province. Int. J. Environ. Res. Public Health 2020, 17, 6244. [Google Scholar] [CrossRef]
  27. Alshammari, S.; Irfan, U. Hazardous chemicals’ safety measures and awareness in public and private hospital laboratories in Buraydah, Al Qassim. Life Int. J. Health Life-Sci. 2018, 4, 102–117. [Google Scholar] [CrossRef]
  28. Dehdashti, A.; Fatemi, F.; Jannati, M.; Asadi, F.; Kangarloo, M. Applying health, safety, and environmental risk assessment at academic settings. BMC Public Health 2020, 20, 1328. [Google Scholar] [CrossRef]
  29. Cho, N.; Ji, Y. A study on application method & system introduction of laboratory pre-hazards risk analysis. J. Korean Soc. Saf. 2016, 31, 126–135. [Google Scholar] [CrossRef]
  30. Bai, M.; Liu, Y.; Qi, M.; Roy, N.; Shu, C.; Khan, F.; Zhao, D. Current status, challenges, and future directions of university laboratory safety in China. J. Loss Prev. Process. Ind. 2022, 74, 104671. [Google Scholar] [CrossRef]
  31. Cheng, L.; Wang, Y.; Peng, Y. Research on risk assessment of high-speed railway operation based on network ANP. Smart Resilient Transp. 2021, 3, 37–51. [Google Scholar] [CrossRef]
  32. Zhang, H. Research on Risk Control Model of Worker Safety Behaviour in Vehicle Service System Based on Gridding; Beijing Jiaotong University: Beijing, China, 2020. [Google Scholar]
  33. Williams, T. The two-dimensionality of project risk. Int. J. Proj. Manag. 1996, 14, 185–186. [Google Scholar] [CrossRef]
  34. Ward, C. Assessing and managing important risks. Int. J. Proj. Manag. 1999, 17, 331–336. [Google Scholar] [CrossRef]
  35. Song, Z.; Ma, Z. Discussion on airline operation risk evaluation based on risk matrix method and Borda ordinal value method. J. Civ. Aviat. 2022, 6, 12–15+11. [Google Scholar]
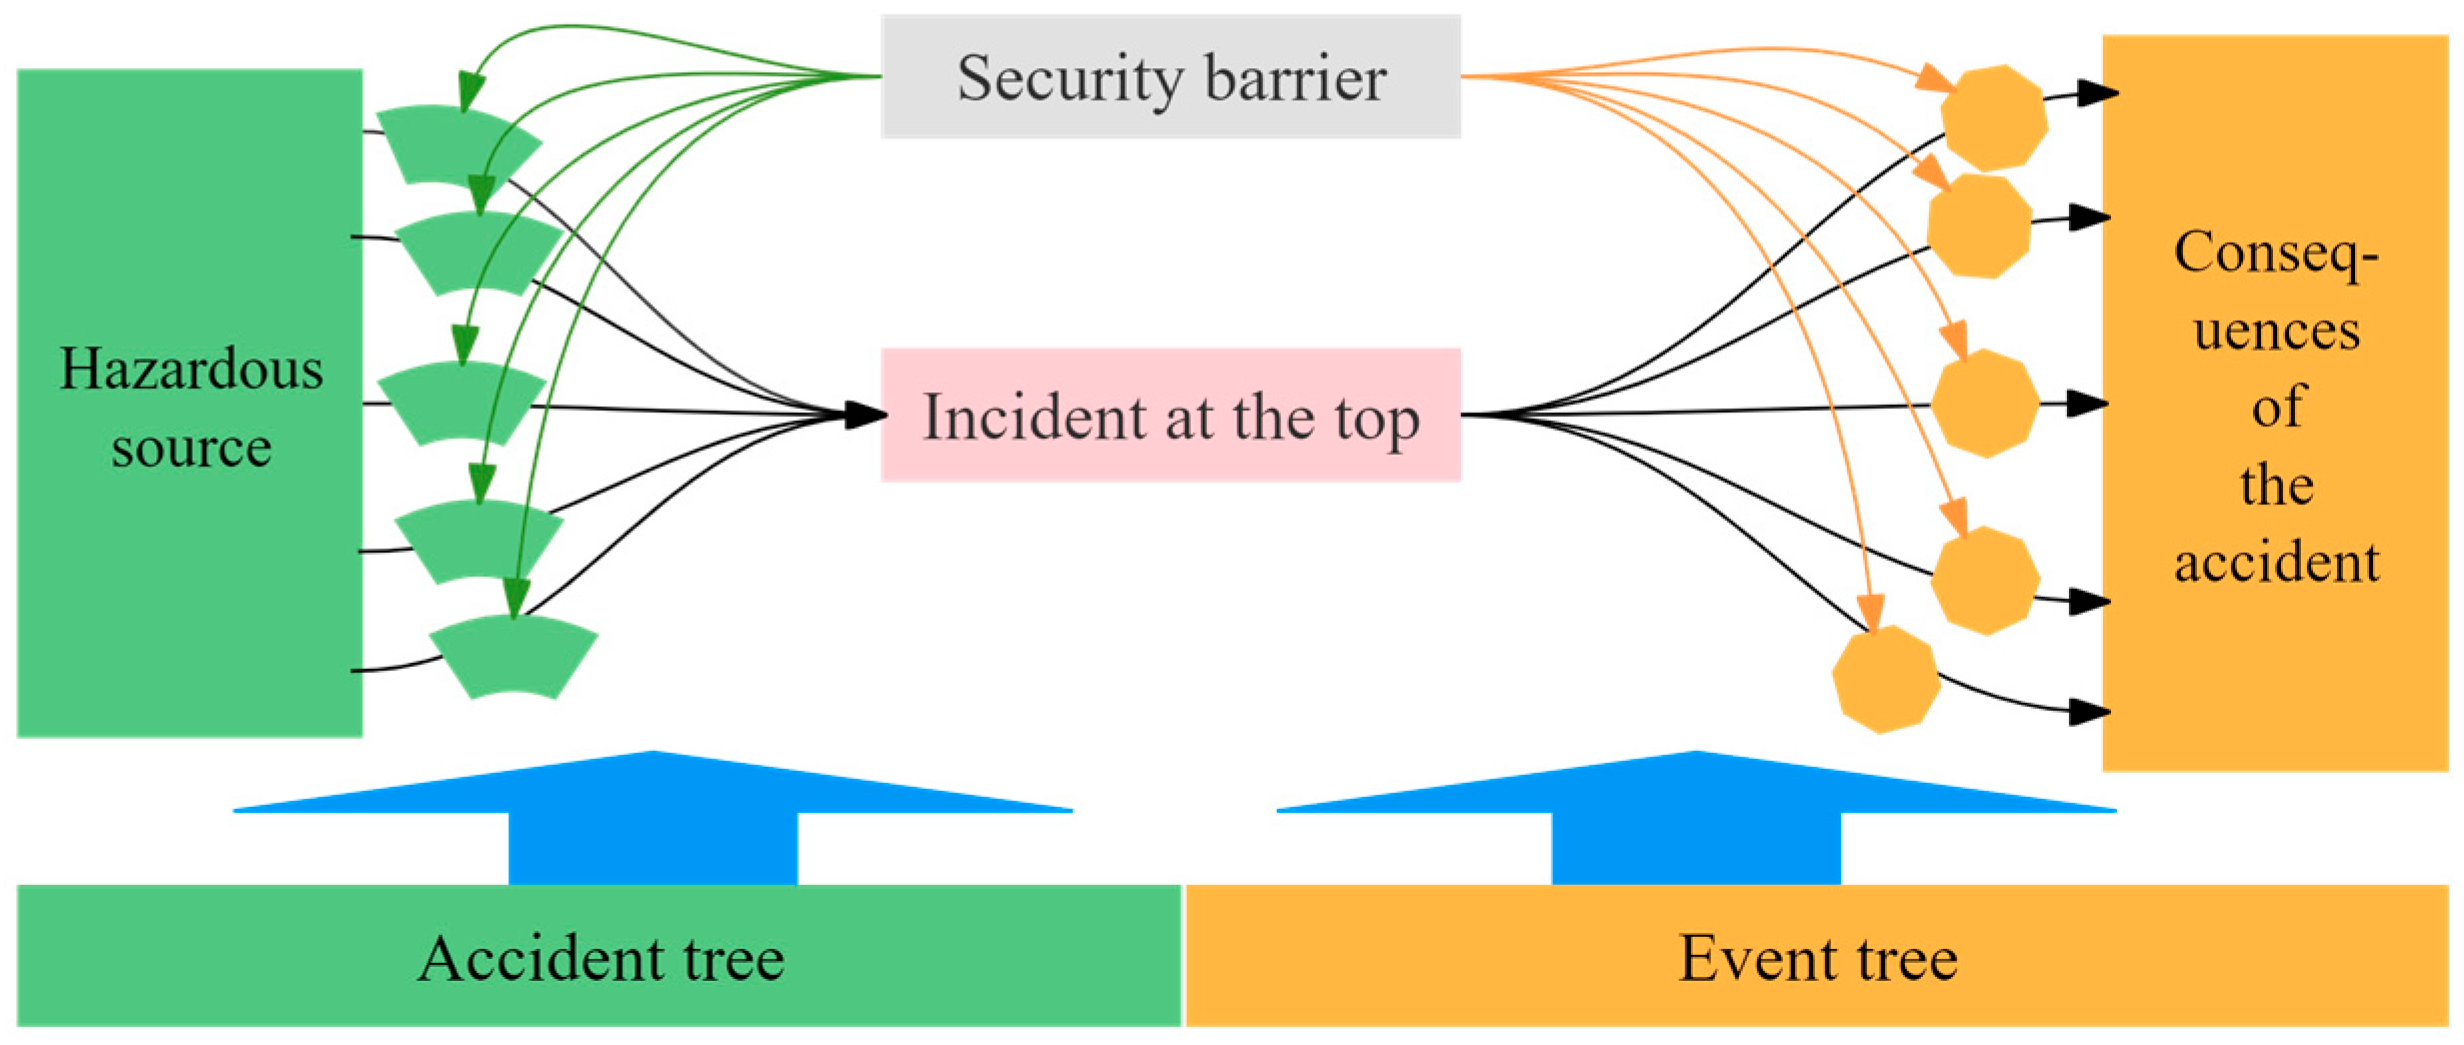
Figure 1. The bowtie model.
Fire 07 00287 g001
Figure 2. ANP network hierarchy model.
Fire 07 00287 g002
Figure 3. Three-dimensional risk matrix of hazardous chemical fires.
Fire 07 00287 g003
Figure 4. Bowtie model–3D risk matrix–ANP method correlation diagram.
Fire 07 00287 g004
Figure 5. Tree analysis of hazardous chemical fire accidents in the laboratories.
Fire 07 00287 g005
Figure 6. Hazardous laboratory chemical fire bowtie model.
Fire 07 00287 g006
Figure 7. Hazardous laboratory chemical fire index system.
Fire 07 00287 g007
Figure 8. Indicator contact.
Fire 07 00287 g008
Figure 9. Judgment of the importance of two indicators.
Fire 07 00287 g009
Figure 10. Hazardous laboratory chemical fire control measures index system.
Fire 07 00287 g010
Figure 11. Overall risk rating of Tolerable (II) for the Institute.
Fire 07 00287 g011
Table 1. Typical cases of hazardous chemical laboratory fires in China.
Serial NumberTimeType of Accident Accident Consequences
126 December 2018Explosion of sewage treatment experimental device5 died and 3 injured
224 October 2021Deflagration of hazardous chemicals2 died and 9 injured
321 July 2022Catalyst misfire1 died and 1 injured
431 March 2021Explosion of the reactor1 died
526 December 2019Flammable solvent fire1 died
Table 2. Risk assessment methods and their advantages and disadvantages.
Risk Assessment MethodsAdvantagesDisadvantages
FMEAIdentifies potential risks in advanceHigher requirements on the quality of personnel
HAZOPGives full play to collective wisdom, with strong flexibilityLimited to the evaluation of process flow
FTADetermines the various ways that lead to the top event, which is conducive to providing objective information for decision-makingThe focus is on specific events rather than processes
ANPBased on the possible correlation between elements, more comprehensive and objectiveExcessive subjectivity
Bowtie Visually displays the cause and the consequences of the accidentLimitations in dealing with complex systems and component polymorphisms
3D risk matrixDesigned for specific objects to improve applicabilityThe same matrix is not suitable for application in other situations
Table 3. Matrix scoring scale and meanings.
QuantitativeValue Meaning
1Indicates that element 1 is just as important as element 2
3Indicates that element 1 is slightly more important than element 2
5Indicates that element 1 is moderately more important than element 2
7Indicates that element 1 is significantly more important than element 2
9Indicates the extreme importance of element 1 compared with element 2
2, 4, 6, 8Intermediate value of two adjacent judgments
Table 4. The comprehensive probability level of the occurrence of hazardous chemical fire accidents in laboratories.
Combined Likelihood ValueJudgment LevelDescription
1–1.51Never happened in the past 10 years
1.5–22More than one occurrence in the past 5–10 years
2–2.53More than one occurrence in the past 2–5 years
2.5–34More than one occurrence in the past 2 years
Table 5. The comprehensive severity level of the occurrence of hazardous chemical fire accidents in laboratories.
Combined Severity ValueJudgment LevelDescription
1–1.51No injuries or property damage
1.5–22Individual minor illness or injury or small amount of property damage
2–2.53Serious personal injury or property damage
2.5–34Major property damage or death of an individual
Table 6. Comprehensive preventive level of the occurrence of hazardous chemical fire accidents in laboratories.
Combined Precautionary ValueJudgment LevelDescription
1–1.51Systems, plans, dual controls, etc., are relatively complete, with a high degree of preventive capabilities
1.5–22Missing part of the safety management documents, with a certain degree of preventive capabilities
2–2.53A large number of safety management documents and work accounts are missing, and there are omissions in on-site management, with poor preventive capabilities
2.5–34Large omissions in documents and on-site management, close to a loss of preventive capabilities
Table 7. Three-dimensional risk level range and related risk descriptions of laboratory hazardous chemical fire accidents.
RatingRisk ScopeRisk UnitRisk Level Description
Acceptable (I)1–121-1-1/1-1-2/1-1-3/1-1-4/1-2-1/1-2-2/1-2-3/1-2-4/1-3-1/1-3-2/1-3-3/1-3-4/1-4-1/1-4-2/1-4-3/2-1-1/2-1-2/2-1-3/2-1-4/2-2-1/2-2-2/2-2-3/2-3-1/2-3-2/2-4-1/3-1-1/3-1-2/3-1-3/3-1-4/3-2-1/3-2-2/3-3-1/3-4-1/4-1-1/4-1-2/4-1-3/4-2-1/4-3-1Adopt necessary risk management and control based on its own safety management system, preventive measures, control measures, contingency plans, etc., and no further measures need to be taken
Tolerable (II)16–271-4-4/2-2-4/2-3-3/2-3-4/2-4-2/2-4-3/2-4-4/3-2-3/3-2-4/3-3-2/3-3-3/3-4-2/4-1-4/4-2-2/4-2-3/4-3-2/4-4-1Need to take into account the actual situation of the enterprise and continue to strengthen the management of the relevant secondary indicators and other relevant risk factors when necessary
Unacceptable (III)32–643-3-4/3-4-3/3-4-4/4-2-4/4-3-3/4-3-4/4-4-2/4-4-3/4-4-4Control of the secondary indicators, taking into account the risk situation, with a greater risk of potential hazards
Table 8. Description of the likelihood of secondary indicators.
Serial NumberSecondary Indicator FactorsLikelihood DescriptionLikelihood Level
1Excessive visual load (T11)Position requiring more than 2 h of continuous work1 (Low)
Position requiring more than 4 h of continuous work2 (Medium)
High-load job requiring more than 8 h of continuous work3 (High)
2Abnormal health condition (T12)Completion of medical examination with fewer than 3 health problems1 (Low)
Completion of medical examination with more than 3 health problems2 (Medium)
Failure to complete medical examination3 (High)
3Lack of personnel safety awareness (T13)Completion of education and training with an assessment score of 60 or above1 (Low)
Completion of education and training with an assessment score of 60 or below2 (Medium)
Failure to conduct safety education and training work3 (High)
4Psychological abnormalities (T14)Psychological assessment of 60–80 points1 (Low)
Psychological assessment of 40–60 points 2 (Medium)
Psychological assessment of below 40 points 3 (High)
5Laboratory personnel command error (T15)Completion of education and training work, with assessment scores between 60 and 80 points1 (Low)
Completion of education and training, with an assessment score of 60 points or less2 (Medium)
Failure to conduct safety education and training3 (High)
6Laboratory personnel operating errors (T16)Completion of education and training work, with an assessment score of 60 or above1 (Low)
Completion of education and training in laboratory operation, with an assessment score of 60 or below2 (Medium)
Failure to carry out safety education and training work3 (High)
7Equipment and facilities protection defects (T21)Regular inspection of equipment and facilities, etc., with no problems1 (Low)
Regular inspection of equipment and facilities, with problems and rectification in progress2 (Medium)
Regular inspection of equipment and facilities, with problems but no rectification3 (High)
8Poor sealing of hazardous chemical device bottles (T22)Regularly carrying out inspections for hidden danger in hazardous chemical storage 1 (Low)
Missing 5 or fewer hidden danger inspections 2 (Medium)
Missing more than 5 hidden danger inspections3 (High)
9Poor corrosion resistance of hazardous chemical device bottles (T23)Regularly carrying out hazardous material storage inspections1 (Low)
Missing 5 or fewer hidden danger inspections2 (Medium)
Missing more than 5 hidden danger inspections3 (High)
10Gas cylinder/dewar tank overpressure (T24)Regularly carrying out hazardous material storage inspections 1 (Low)
Missing 5 or fewer hidden danger inspections 2 (Medium)
Missing more than 5 hidden danger inspections3 (High)
11Failure of relevant gas detectors (T25)Regularly carrying out hazardous material storage inspections 1 (Low)
Missing 5 or fewer hidden danger inspections2 (Medium)
Missing more than 5 hidden danger inspections 3 (High)
12Pipeline quality defects (T26)Regularly carrying out hazardous material storage inspections1 (Low)
Missing 5 or fewer hidden danger inspections 2 (Medium)
Missing more than 5 hidden danger inspections3 (High)
13Environmental clutter (T31)Regular laboratory inventory management1 (Low)
More than 5 laboratories are not properly arranged2 (Medium)
More than 8 laboratories are not properly arranged3 (High)
14Signage marking defects (T32)Signs and labels are posted, but they are missing or too small1 (Low)
Key signs are missing2 (Medium)
Not posted3 (High)
15Lightning and seismic hazards (T33)Emergency drills have been completed1 (Low)
Emergency drills have been completed, but there is a problem with going through the motions2 (Medium)
No education and training and no emergency drills3 (High)
16Relevant laboratory hazardous chemical management system is imperfect (T41)Laboratory hazardous materials system is established, but staff are not familiar with it1 (Low)
Relevant hazardous laboratory materials systems are established, but they do not match the actual situation2 (Medium)
No system in place3 (High)
17Laboratory hazardous chemical-related job responsibility system is imperfect (T42)Responsibility system is established, but employees are not familiar with it1 (Low)
Responsibility for laboratory hazards has been established, but it does not match the actual situation2 (Medium)
No system established3 (High)
18Laboratory hazardous chemical emergency management system is imperfect (T43)An emergency response system is established, but employees are not familiar with it1 (Low)
Establishment of a relevant emergency response system, and the actual situation cannot be matched2 (Medium)
No relevant emergency response system has been established3 (High)
19Imperfect dual control management (T44)Establishment of risk classification and control and a hidden danger investigation and management system1 (Low)
Risk classification and control and a hidden danger inspection and management system are established, but the use of the system is not smooth2 (Medium)
Dual control system is not established3 (High)
20Imperfect education and training (T45)Completion of education and training work, with an assessment score of 60 or above1 (Low)
Completion of education and training work, with an assessment score of 60 points or less2 (Medium)
Failure to carry out safety education and training3 (High)
21Laboratory equipment and facilities operating procedures are imperfect (T46)Relevant operating procedures are established, but employees are not familiar with them1 (Low)
Relevant operating procedures have been established, but they do not match the actual situation2 (Medium)
Failure to establish relevant operating procedures3 (High)
Table 9. Determination of the possibility levels for second-level indicators at the TRT Research Institute.
Serial NumberSecondary IndicatorsGrade Determination
1Excessive visual load (T11)1 (Low)
2Abnormal health condition (T12)1 (Low)
3Lack of personnel safety awareness (T13)1 (Low)
4Psychological abnormalities (T14)2 (Medium)
5Laboratory personnel command error (T15)1 (Low)
6Laboratory personnel operating errors (T16)1 (Low)
7Equipment and facilities protection defects (T21)2 (Medium)
8Poor sealing of hazardous chemical device bottles (T22)2 (Medium)
9Poor corrosion resistance of hazardous chemical device bottles (T23)2 (Medium)
10Gas cylinder/dewar tank overpressure (T24)1 (Low)
11Failure of relevant gas detectors (T25)2 (Medium)
12Pipeline quality defects (T26)2 (Medium)
13Environmental clutter (T31)2 (Medium)
14Signage marking defects (T32)1 (Low)
15Lightning and seismic hazards (T33)2 (Medium)
16Relevant laboratory hazardous chemical management system is imperfect (T41)1 (Low)
17Laboratory hazardous chemical-related job responsibility system is imperfect (T42)1 (Low)
18Laboratory hazardous chemical emergency management system is imperfect (T43)2 (Medium)
19Imperfect dual control management (T44)1 (Low)
20Imperfect education and training (T45)1 (Low)
21Laboratory equipment and facilities operating procedures are imperfect (T46)1 (Low)
Table 10. Risk factor secondary indicator weights.
Level 1 IndicatorsLevel 1 Indicator WeightsSecondary IndicatorsSecondary Indicator Weights
T10.37983T110.02445
T120.05433
T130.38555
T140.08463
T150.24698
T160.20407
T20.14972T210.32798
T220.0829
T230.08773
T240.22816
T250.12341
T260.14983
T30.07866T310.17769
T320.74675
T330.07557
T40.39179T410.2063
T420.12087
T430.17225
T440.08901
T450.36813
T460.04343
Table 11. Determination of the implementation of control measures.
Serial NumberCategory of Control MeasuresMeasure JudgmentTRT Research Institute Actual ImplementationControl Measures Weight Calculation
1Personnel protection (P1)Yes (1)Implementation but not effective enough (2)0.45227
Implemented but not effective enough (2)
No (3)
2Firefighting measures (P2)Yes (1)Implementation but not effective enough (2)0.35357
Implemented but not effective enough (2)
No (3)
3Ventilation measures (P3)Yes (1)No (3)0.14616
Implemented but not effective enough (2)
No (3)
4Clearance measures (P4)Yes (1)Yes (1)0.04801
Implemented but not effective enough (2)
No (3)
Table 12. Comprehensive preventive judgment calculation.
Serial No.Satisfaction Survey CategorySatisfaction JudgmentActual Implementation of TRT Research InstituteSatisfaction Category Weighting Calculation
1Hidden danger detectionSatisfied (1)Dissatisfied (3)0.187
More satisfied (2)
Dissatisfied (3)
2Emergency drillsSatisfied (1)More satisfied (2)0.269
More satisfied (2)
Dissatisfied (3)
3Education and trainingSatisfied (1)More satisfied (2)0.109
More satisfied (2)
Dissatisfied (3)
4DocumentationSatisfied (1)Satisfied (1)0.302
More satisfied (2)
Dissatisfied (3)
5RecordsSatisfied (1)Dissatisfied (3)0.133
More satisfied (2)
Dissatisfied (3)
Disclaimer/Publisher’s Note: The statements, opinions and data contained in all publications are solely those of the individual author(s) and contributor(s) and not of MDPI and/or the editor(s). MDPI and/or the editor(s) disclaim responsibility for any injury to people or property resulting from any ideas, methods, instructions or products referred to in the content.