Article

Thermal Characteristics of Multiple Blockages with Various Sizes in Longitudinal Ventilated Tunnel Fire

1
School of Safety Engineering, China University of Mining and Technology, Xuzhou 221116, China
2
China Coal Technology & Engineering Xi’an Research Institute (Group) Co., Xi’an 710077, China
3
College of Resources, Shandong University of Science and Technology, Tai’an 271019, China
4
State Key Laboratory for Fine Exploration and Intelligent Development of Coal Resources, Xuzhou 221116, China
*
Author to whom correspondence should be addressed.
Fire 2024, 7(8), 269; https://doi.org/10.3390/fire7080269
Submission received: 8 June 2024 / Revised: 6 July 2024 / Accepted: 16 July 2024 / Published: 2 August 2024

Abstract

:
In longitudinal ventilation tunnel fires, the thermal characteristics become more intricate due to the presence of blockages. This phenomenon becomes more complex when multiple blockages occur, which results in a unique interaction between the fire and longitudinal ventilation through gaps between the blockages. Most of the previous studies have only considered single obstacles or have only performed qualitative analyses and have not obtained predictive models. To fill this research gap, we conducted numerical simulations using the Fire Dynamic Simulator (FDS) to study the effects of vehicular blockages in three lanes and two fire locations. Our study highlights the differences in the flame behavior, maximum temperature rise, and smoke back-layering length in the presence of multiple blockages and reveals that as the ventilation velocity increases, the flame bifurcation angle increases and the smoke back-layering length decreases. Additionally, when the fire is in the side lane, the flame tilts towards the sidewall, leading to higher maximum temperatures compared to those in the middle lane. Based on these findings, we have developed modified formulas that predict the maximum temperature rise, smoke back-layering length, and maximum temperature ratio at different fire locations and blockage rates, which are linearly related.

1. Introduction

The role of road tunnels in the public transportation system cannot be overemphasized. They significantly shorten travel distances and alleviate traffic congestion. However, with the increasing construction of tunnels, there have been several serious traffic tunnel fires that have garnered widespread attention [1,2,3,4,5]. The smoke and heat produced by these fires pose the greatest threat to people trapped in the tunnel and the structural integrity of the tunnel [6,7,8,9]. Previous research has explored the smoke flow and temperature distribution in tunnel fires [10,11,12,13,14,15,16,17] but has mainly focused on the location of the fire source and the ventilation system.
Without considering the effect of fires, the flow field in the near wake of a blockage is complicated and is characterized by the turbulent flow dynamics past a bluff body [18,19,20,21,22]. In reality, the impact of vehicular blockages, which can interfere with the longitudinal wind and fire, has often been neglected. Hu et al. [23] revealed the pool fire flame behaviors in the near wake of a square cylinder, which first linked these two different fields.
To explore the influence of blockages on the thermal properties such as the fire flames and smoke movement, recent studies have begun incorporating the concept of the blockage rate. Part of Oka and Atkinson’s work [24] examined the impact of the blockage ratio on the critical velocity. They investigated different blockage sizes above which burners were placed, shedding light on the relationship between blockages and the critical velocities. Li et al. [25,26] established new formulas for the maximum temperature and critical velocity under different blockage ratios. Meng et al. [27,28,29] investigated the fire behavior near a wake flow and the temperature distribution of the fire-induced smoke flow and addressed the combined effect of the longitudinal ventilation velocity and blockage ratio on the back-layering length of the thermal smoke flow. Wang et al. [30] and Han et al. [31] focused on blocked tunnel fires with one closed portal, which is rarely reported, including different blockage ratios and slopes. Wang et al. [32] reported the effect of the blockage ratio on the smoke extraction efficiency in a natural ventilation tunnel with a shaft. As the fire source moves away from the near-wake blockage, the vortexes gradually disappear and the longitudinal wind flows become normal. Hu et al. [33] and Tang et al. [34] noted this and developed global models for the maximum excess temperature, back-layering length, and critical velocity, considering both the blockage ratio and blockage–fire distance, and concluded that the temperatures beneath the ceiling are independent of a downstream blockage. Zhang et al. [35,36,37,38] focused on the presence of a metro train and found that the blockage ratio influenced the critical ventilation velocity and the back-layering length. Jiang et al. [39] summed the factors that influence the critical velocity, including the height of the burning surface, the location of the fire source, and the lateral wall open area of the vehicle. Merve Altay and Ali Surmen [40] also found that a vehicular blockage in a tunnel fire had a great impact on the smoke flow pattern and critical ventilation velocity. Meng et al. [41] proposed a correlation of the critical ventilation velocity for blockages directly upstream of a fire and horizontally positioned. Furthermore, Tang et al.’s work [42] covered extremely small blockage–fire distances, namely 0 m, and obtained a revised dimensionless correlation of the maximum excess temperature with various blockage–fire distances and longitudinal ventilation velocities. Gannouni et al. [43] studied the effect of a blockage on the critical velocity and back-layering length in longitudinally ventilated tunnel fires by changing its location relative to the tunnel floor. However, they neglected the multi-blockage scenarios that are more common in tunnel fires.
Severe traffic jams usually occur in tunnels when vehicles catch fire, but there are few studies on road tunnel fires involving multi-blockages. Kunikane et al. [44] first found that the stationary vehicles greatly shortened the back-layering length and had a lesser effect on the critical velocity. In Lee and Tsai’s study [45], three types of blockages were set in two or three lanes and the reduction ratio of the critical velocity was approximately equal to the blockage ratio. Gao et al. [46] explored the temperature distributions in tunnel fires with two lanes and two sizes of cars, which combined different scenes. Ho et al. [47] investigated the effect of vehicular blockages on the back-layering length considering the shape and the arrangement of the vehicular blockages, the blockage ratio, and the fire location. Alva et al. [48] found that the relative size of the vehicular obstacle and the relative location of the fire source can have a reversed effect on the critical velocities. Ming et al. [49] focused on two types of configurations of blockages, namely transverse and longitudinal, and analyzed the flow field and the temperature characteristics. Luo et al. [50] investigated the temperature and smoke spread length inside the tunnel by increasing the blockage length in the longitudinal direction. However, they ignored the effects of multi-blockages in the transverse direction. Caliendo et al. [51] used FDS to build a two-lane straight unidirectional horseshoe-shaped tunnel and study the fire characteristics, such as the temperatures, radiant heat flux, and toxic gases. However, they did not take into account the effect of the obstruction size and their work lacked quantitative analyses.
While there has been significant research on road tunnel fires, few studies have considered multi-blockages. Recent studies have shown that stationary vehicles can shorten the length of the smoke layer. There is also a lack of research examining the unique flow field, quantitative temperature distribution, and smoke back-layering length in tunnel fires involving multiple blockages of different sizes. This knowledge gap motivates the current study, which uses numerical simulations to investigate the temperature characteristics and smoke flow in a three-lane tunnel with multi-blockages of various sizes and different longitudinal ventilation velocities. This research addresses a knowledge gap in tunnel fire studies, offering innovative insights that can significantly enhance fire detection and evacuation strategies in tunnel engineering. Ultimately, the findings will contribute to improved safety measures, not only in the specific location studied but also globally, ensuring enhanced public safety in tunnel environments.

2. Numerical Model

Numerical simulation, driven by the exponential growth in computing power, is increasingly used to provide in-depth results on flow fields. One of the most widely used numerical models is the Fire Dynamics Simulator (FDS), developed by the National Institute of Standards and Technology (NIST). In this work, FDS 6.8.0 was selected as the numerical software of choice, due to its proven accuracy, as verified by numerous previous studies [52,53,54,55,56].

2.1. Physical Model

The full-scale tunnel, as depicted in Figure 1, with a rectangular cross-section, measured 100 m in length, 12 m in width, and 6 m in height. A steady-state heat release rate (HRR) of 10 MW was applied to the fire source, which is comparable to that of a small passenger bus or a 3-passenger car fire [57]. Four blockage cross-sections, with dimensions of 2 m × 2 m, 2 m × 3 m, 3 m × 3 m, and 3 m × 4 m (width × height) and a length of 5 m, were also introduced. As shown in Figure 1, three steel cubic blockages were positioned 1 m upstream of the fire source, in three lanes, to simulate vehicular blockages. Here, we regarded this as the most common longitudinal spacing between vehicles in a stopped state. The fire source was simulated using a heptane burner (2 m × 2 m), which was 2 m in length and 2 m in width and was located at the center of the tunnel. To account for the possibility of a fire occurring in any lane, two fire scenarios were modeled. The first scenario simulated a fire in the middle lane, while the second scenario simulated a fire in the side lane. The tunnel walls were modeled as concrete with electrical conductivity of 1.8 W/(m·K), specific heat of 1.04 kJ/(kg·K), and a density of 2280 kg/m3. One end of the tunnel was designated as a “supply” boundary condition, while the other end was set as an “open” boundary condition. The left end of the model was set as “Supply” with ventilation velocities of 0.4 m/s, 0.8 m/s, 1.2 m/s, 1.6 m/s, and 2 m/s, respectively. The test conditions are listed in Table 1.
The longitudinal and transverse ceiling temperature measuring points were arranged at 0.5 m intervals and 0.2 m below the ceiling, above the two fire locations. Two thermocouple trees with 0.5 m vertical spacing were set in the centerline of the tunnel, 10 m upstream and downstream of the fire source. Two longitudinal temperature slices were set at fire locations 1 and 2.
The default environmental temperature was set at 20 °C and atmospheric pressure. Each simulation was run for 400 s, and, after 200 s of ignition, the flow field stabilized. The parameters in the study were based on the average values collected during the 50 s stable stage.

2.2. Grid Independence Analysis

Grid sensitivity analysis is closely related to the accuracy of the simulation results and the consumed time. According to the FDS user guide [58], the value of D * / δ x is suggested to be in the range of 4~16, where D * is the characteristic fire diameter, and δ x is the nominal grid size.
D * = Q ˙ ρ a C p T a g 2 5
where Q ˙ is the heat release rate (HRR), ρ a is the density of the ambient air, C p is the specific heat capacity, T a is the ambient temperature, and g is gravity acceleration.
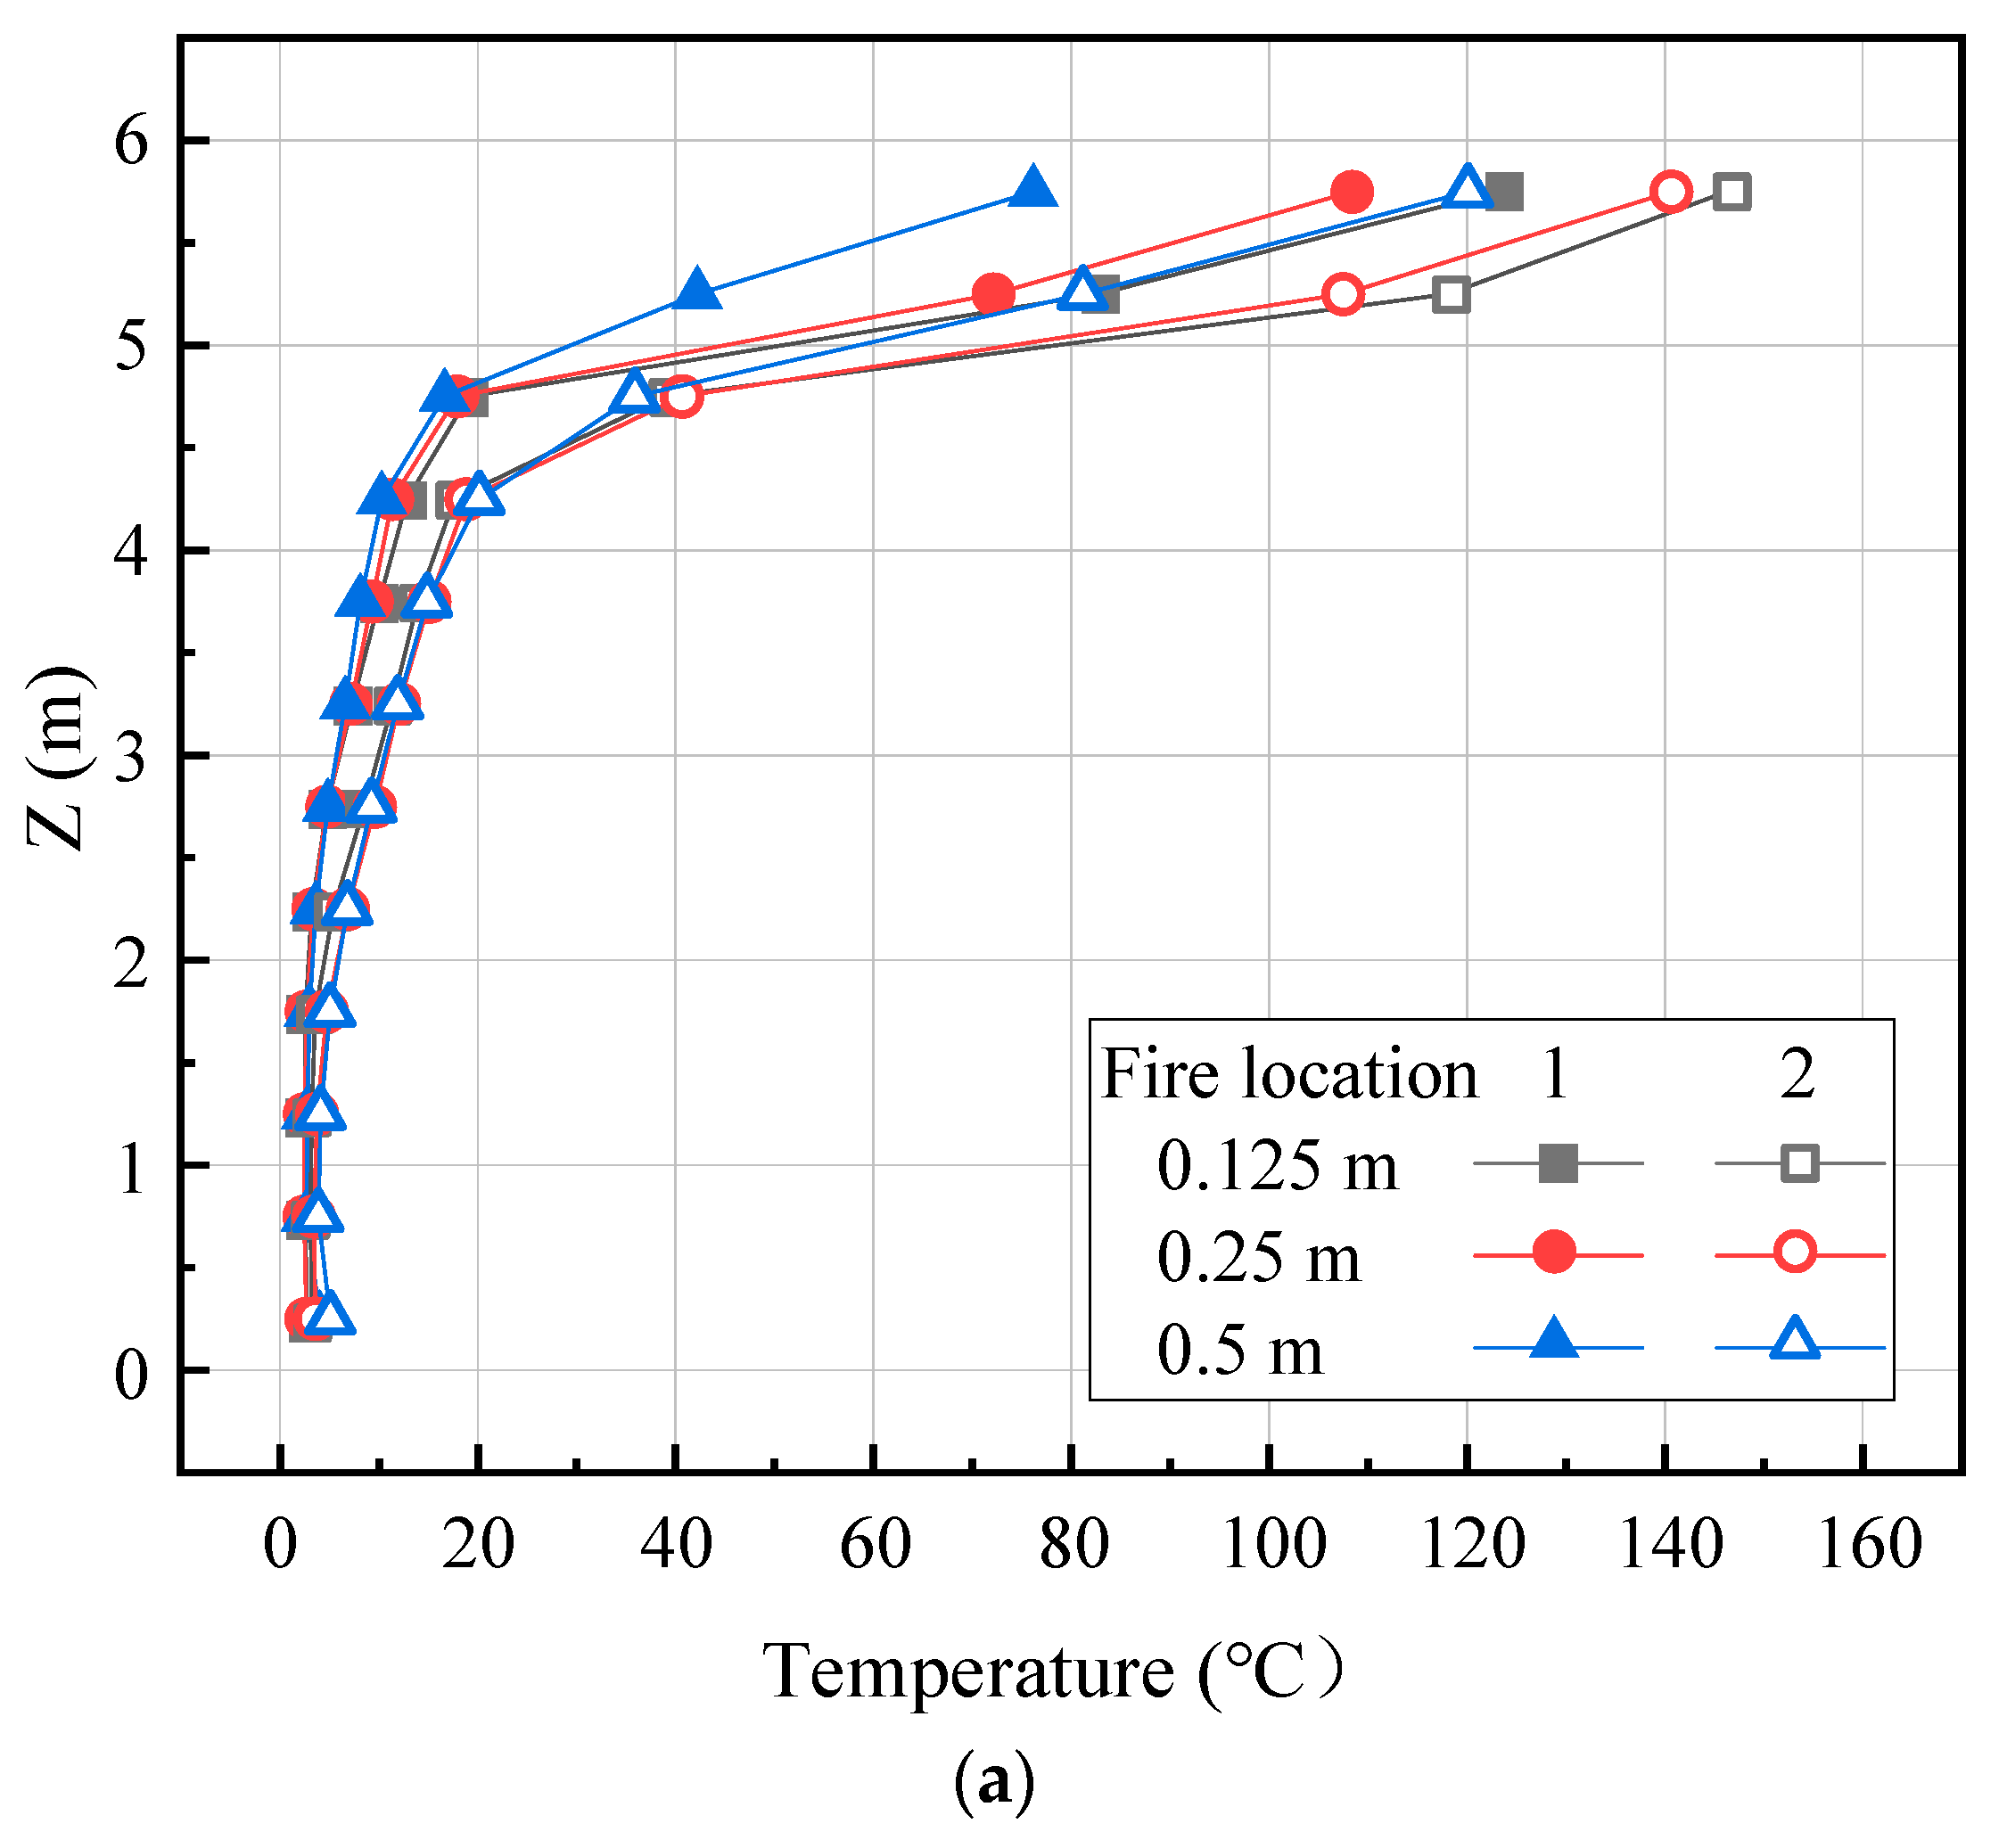
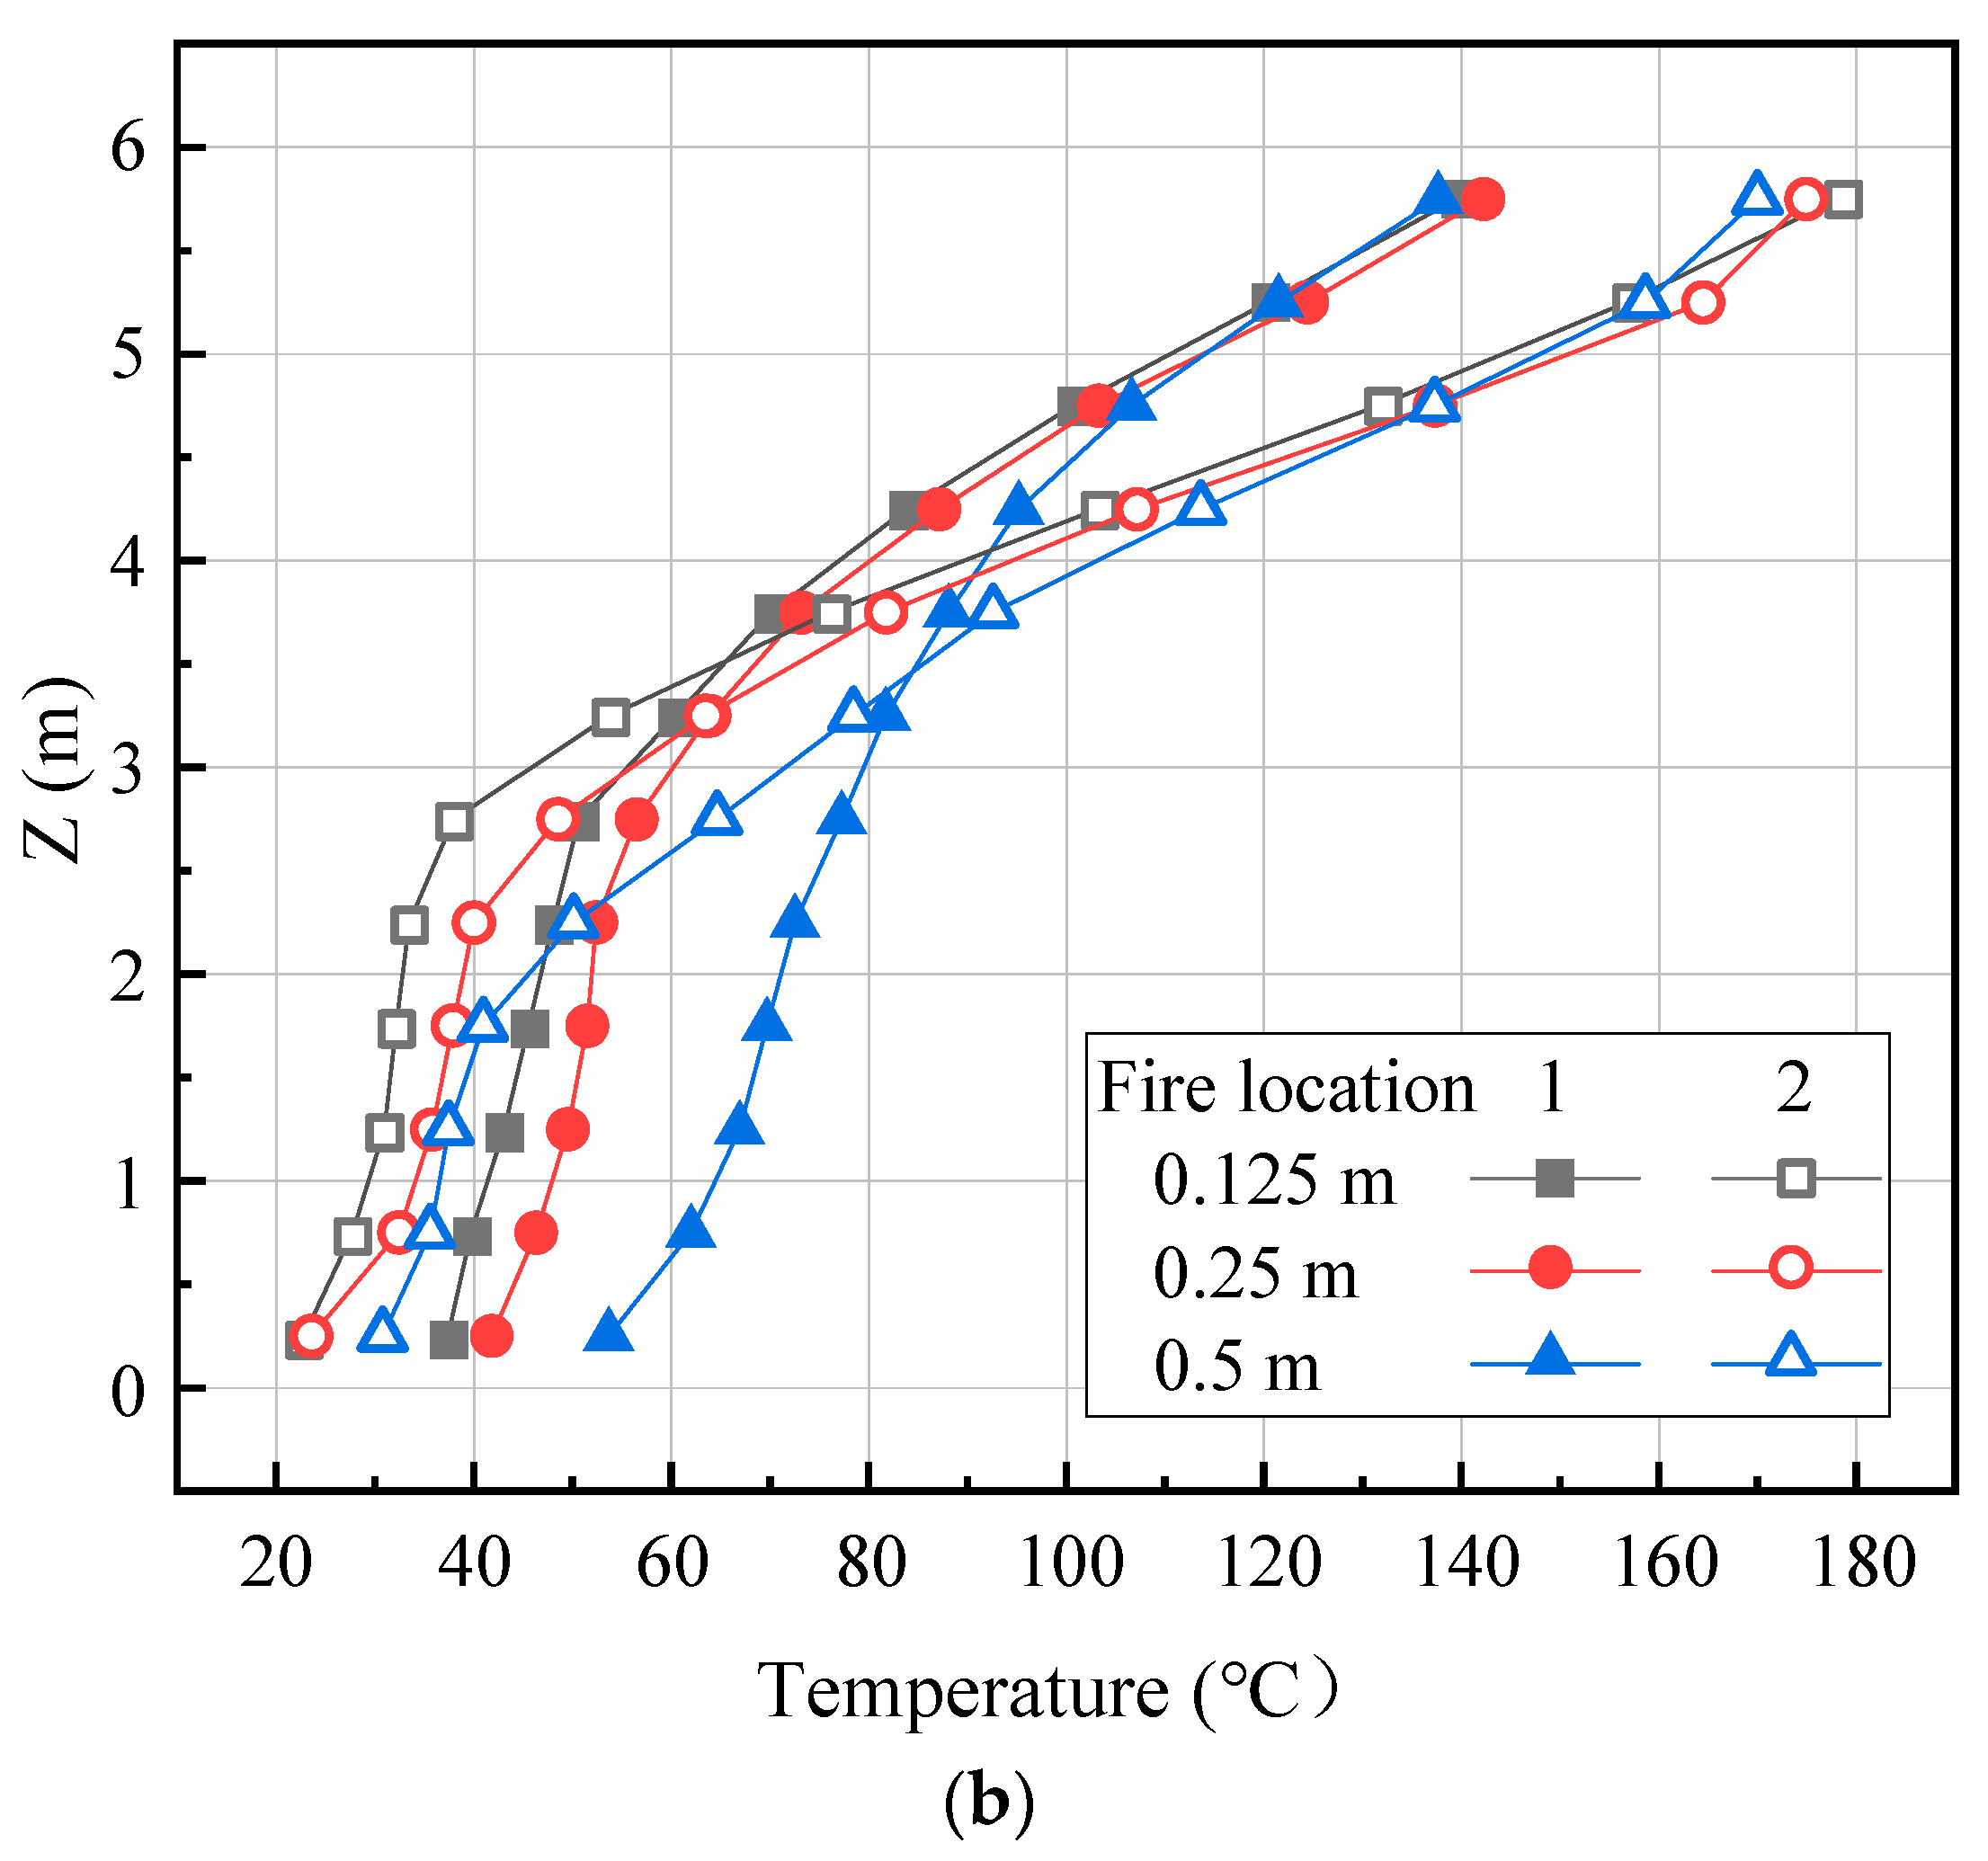
To determine the finest grid size, three grid sizes of 0.125 m, 0.25 m, and 0.5 m were evaluated when the heat release rate (HRR) was equal to 10 MW. The calculated grid size was found to be in the range of 0.15 to 0.59 m. As seen in Figure 2, the results indicated that there was no significant difference in temperature dispersion between 0.125 m and 0.25 m, suggesting that reducing the grid size did not result in improved accuracy. Instead, it led to a significant increase in processing time. Therefore, the finest grid size was determined to be 0.25 m.

2.3. Dependability Verification

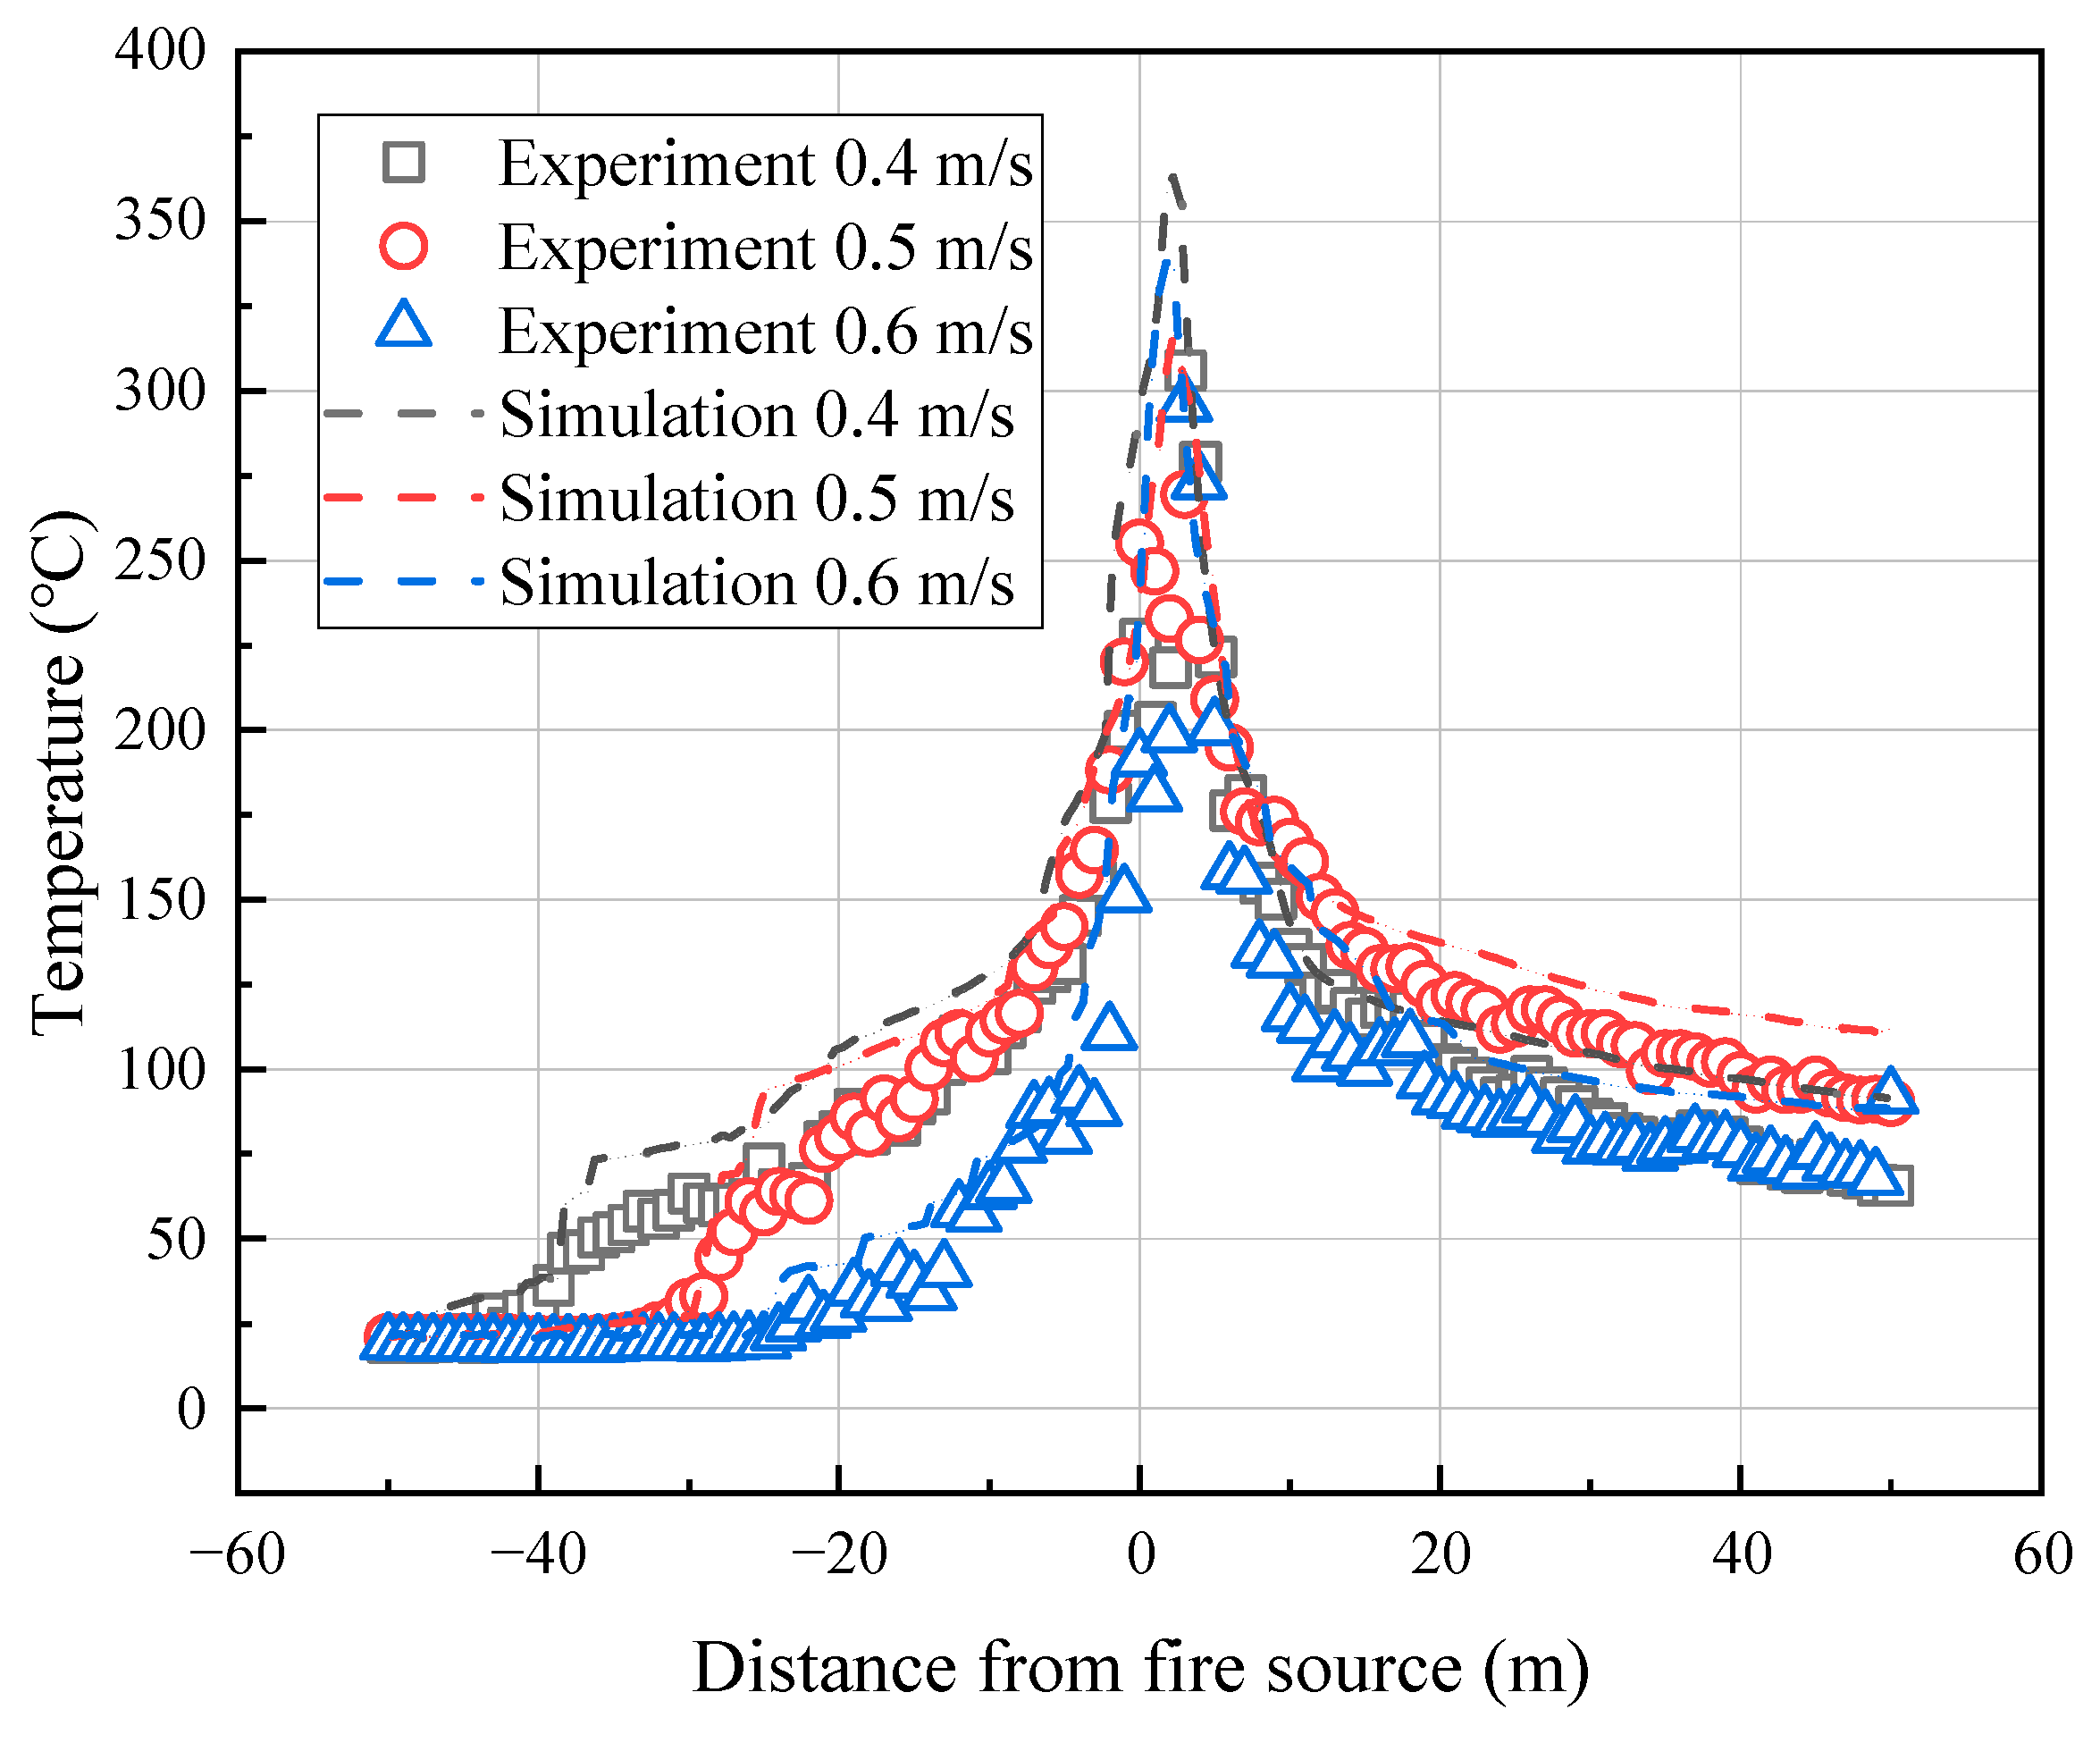
To further verify the accuracy and reasonability of the FDS model, we conducted a series of experiments in a 1:10 reduced-scale tunnel (10 m length, 0.7 m height, and 0.3 m width). A mechanical fan was installed at one end of the tunnel with 3 fixed air velocities of 0.4 m/s, 0.5 m/s, and 0.6 m/s. In our experiments, the alcohol pool fire source was placed in the middle of the tunnel without obstacles. The measured heat release rate was 32.13 kW, corresponding to 10.16 MW in the full-size model. We simulated the three sets of conditions in Figure 3, and it was clear that our numerical results were very close to the experimental data, confirming the validity of our study.

3. Results and Discussion

3.1. Flow Field and Flame Behavior

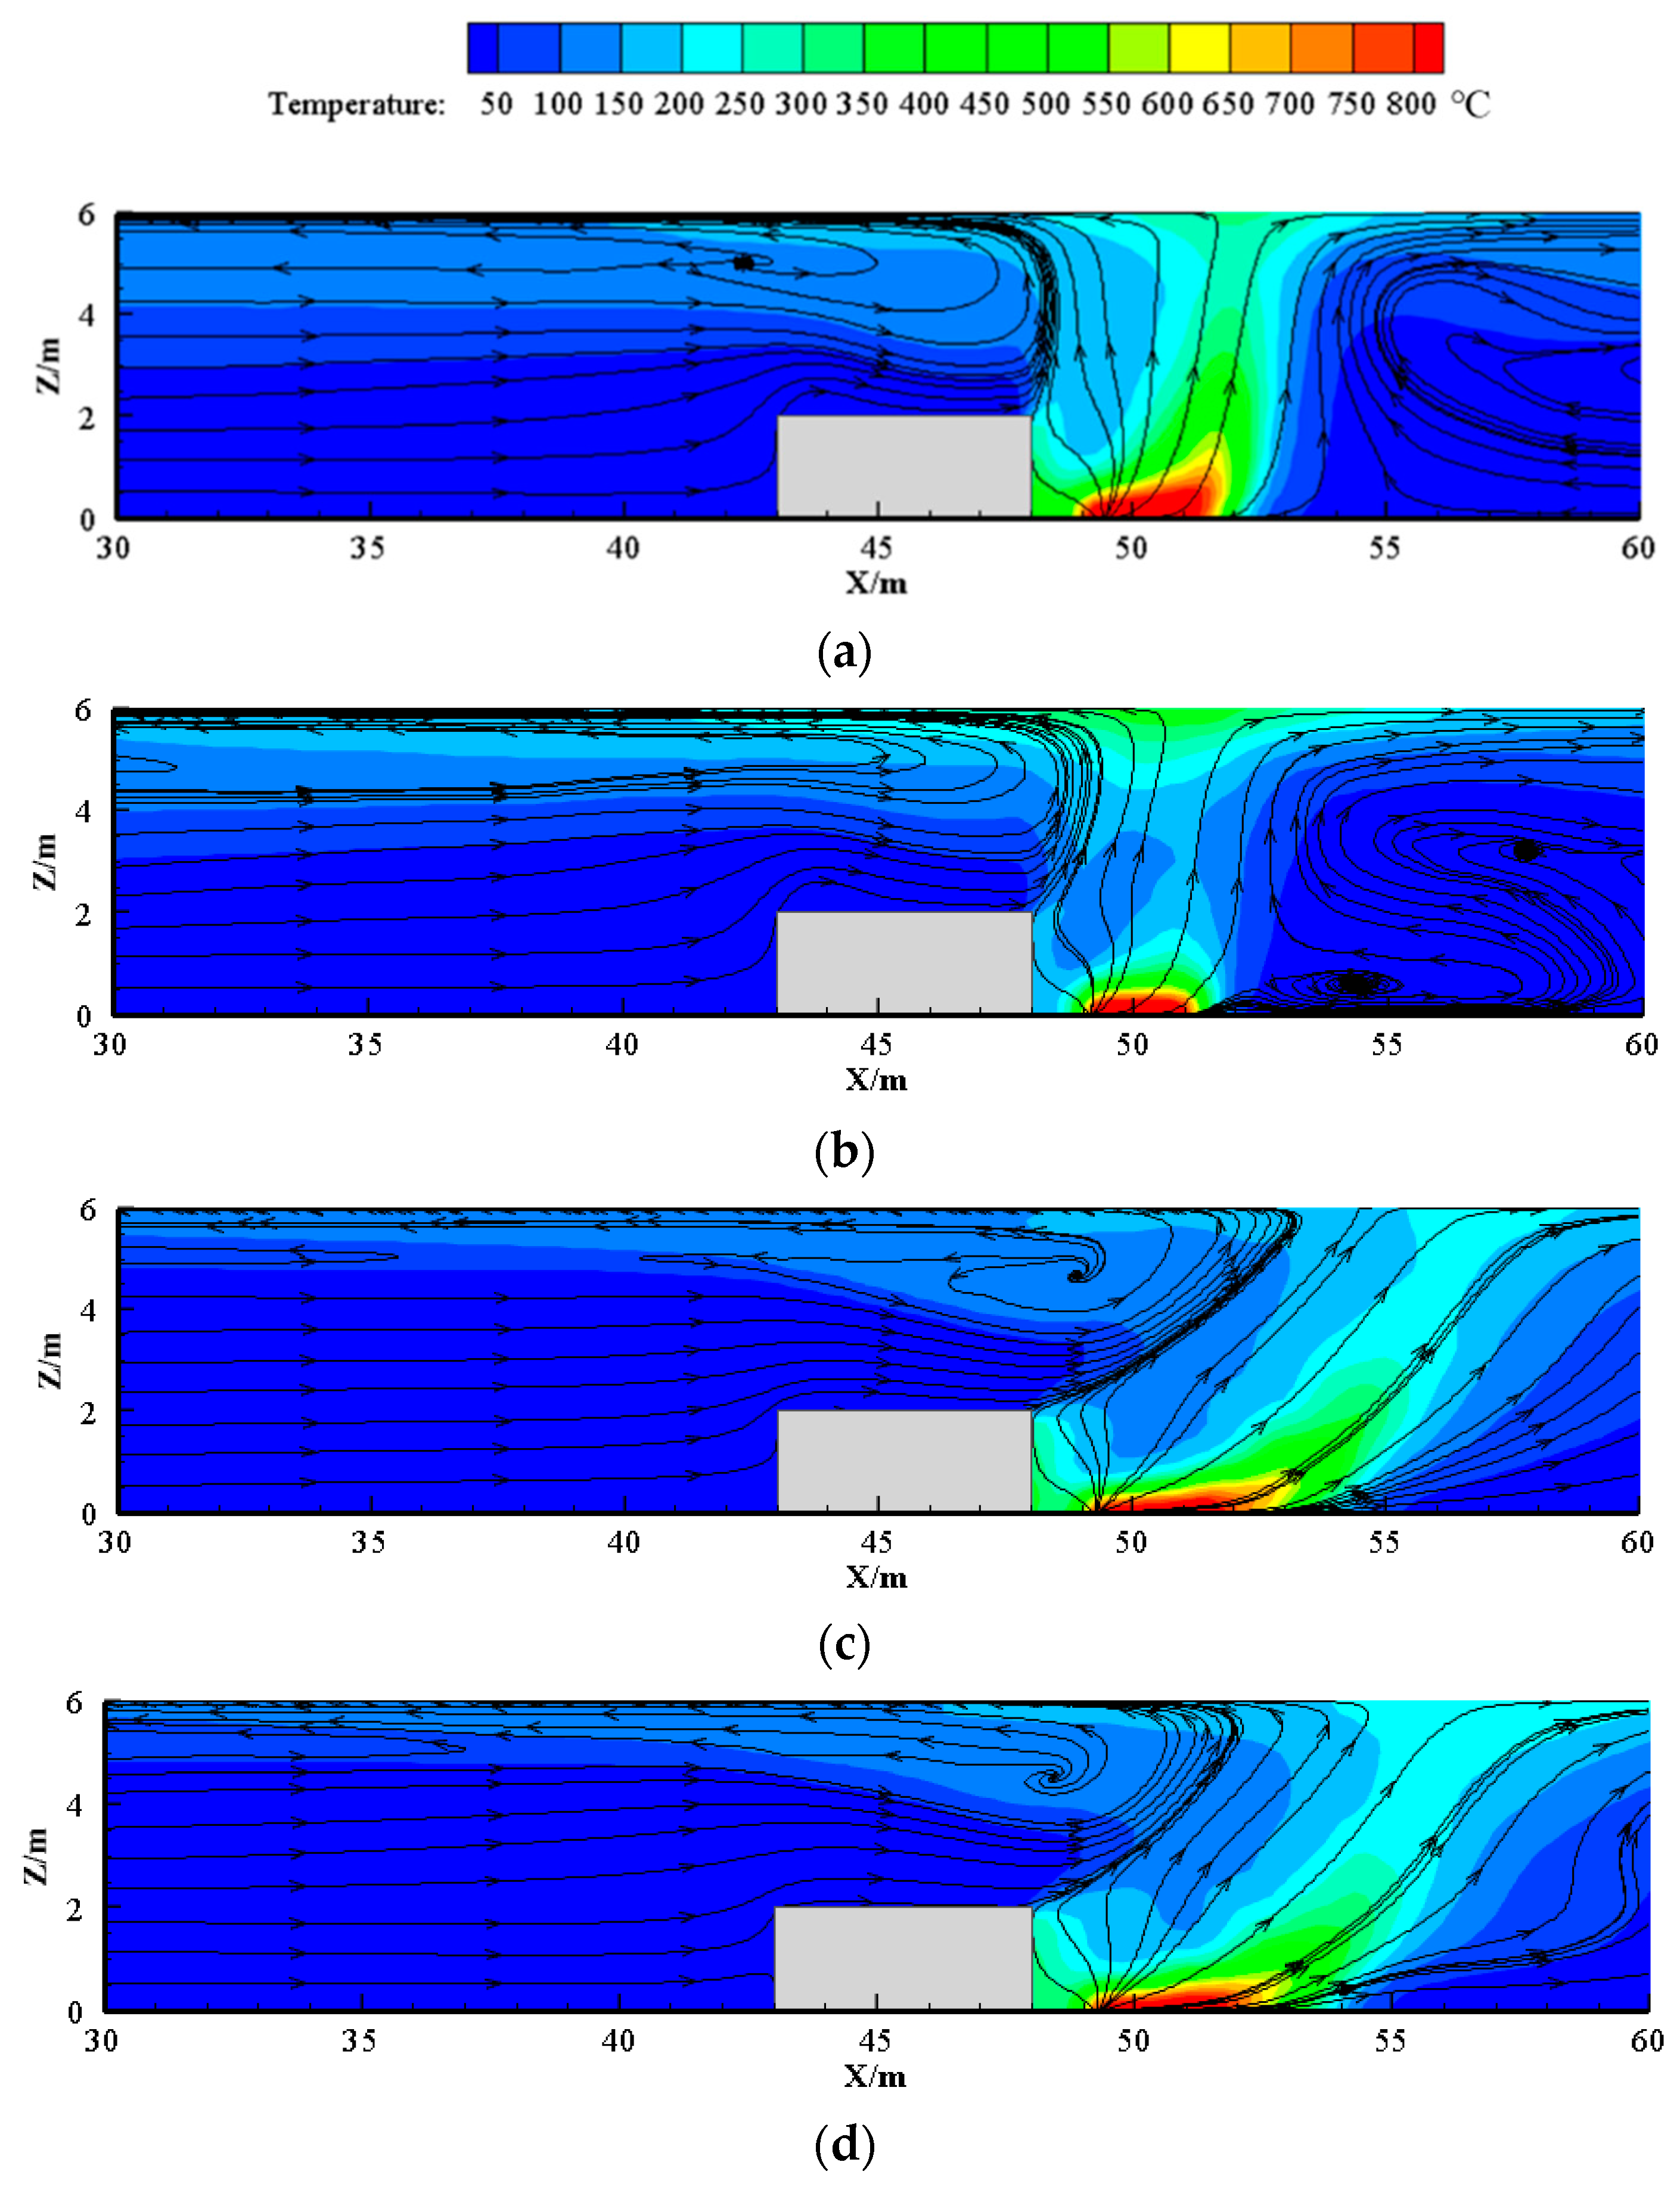
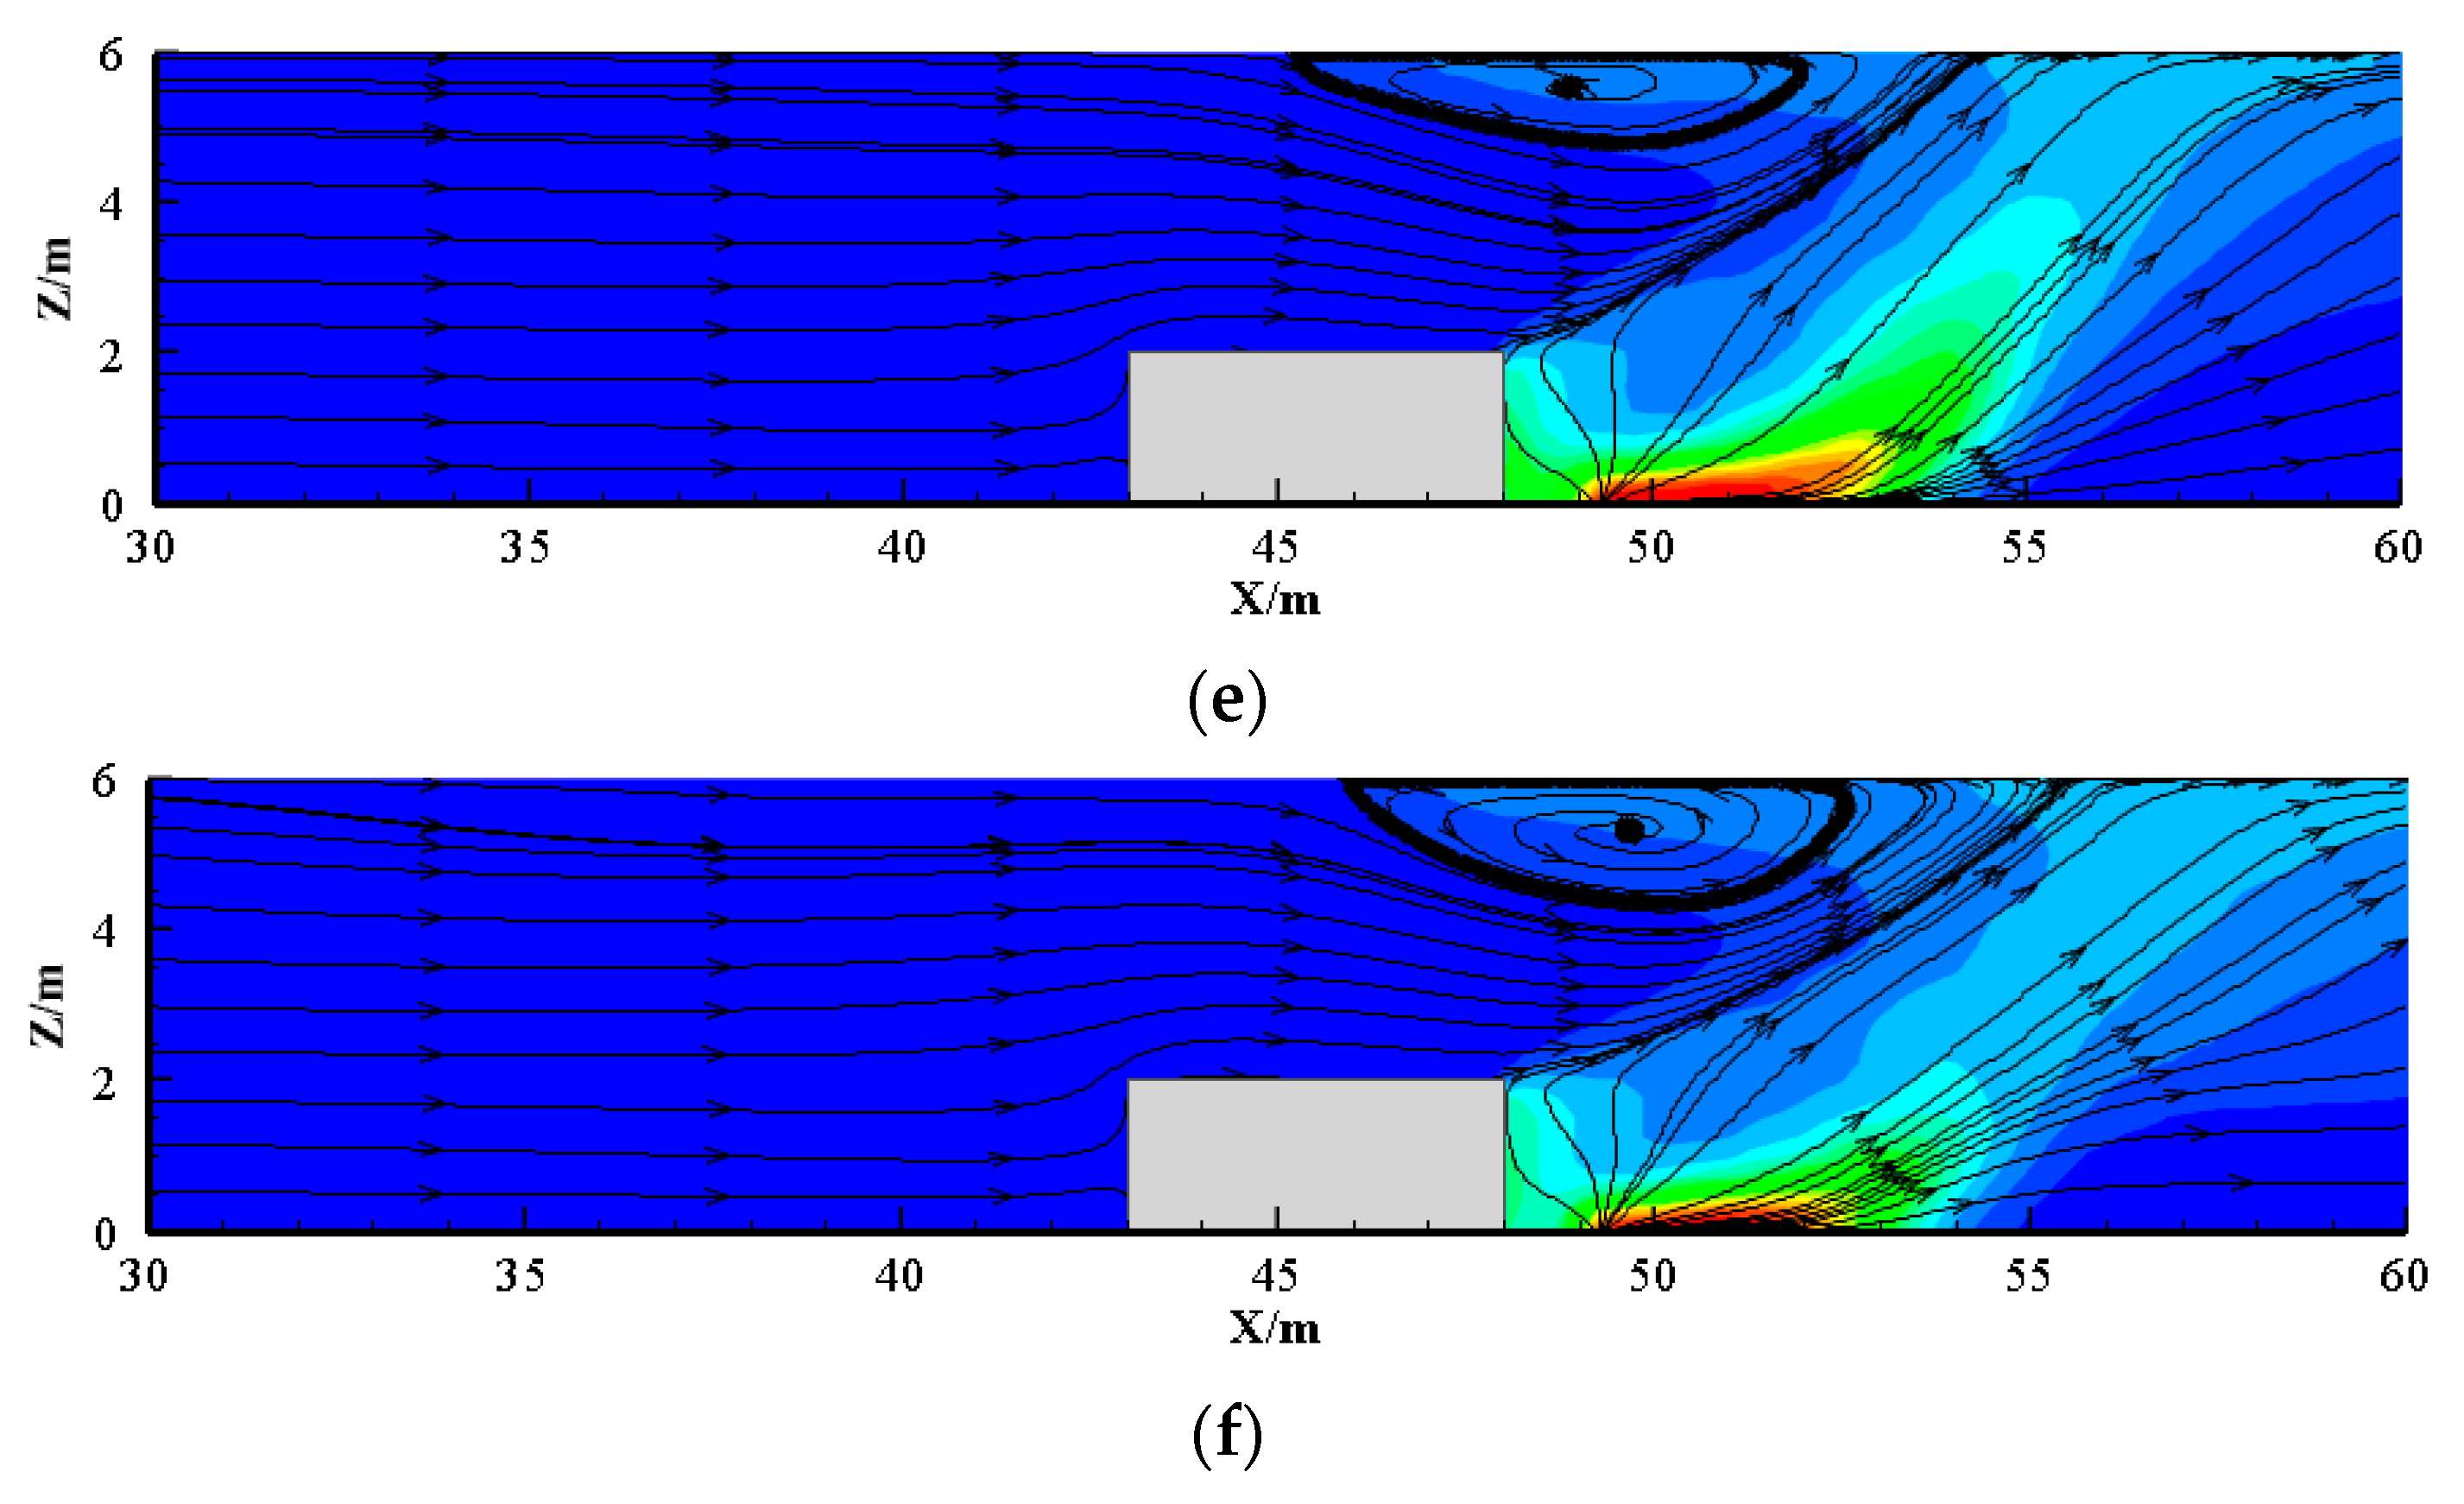
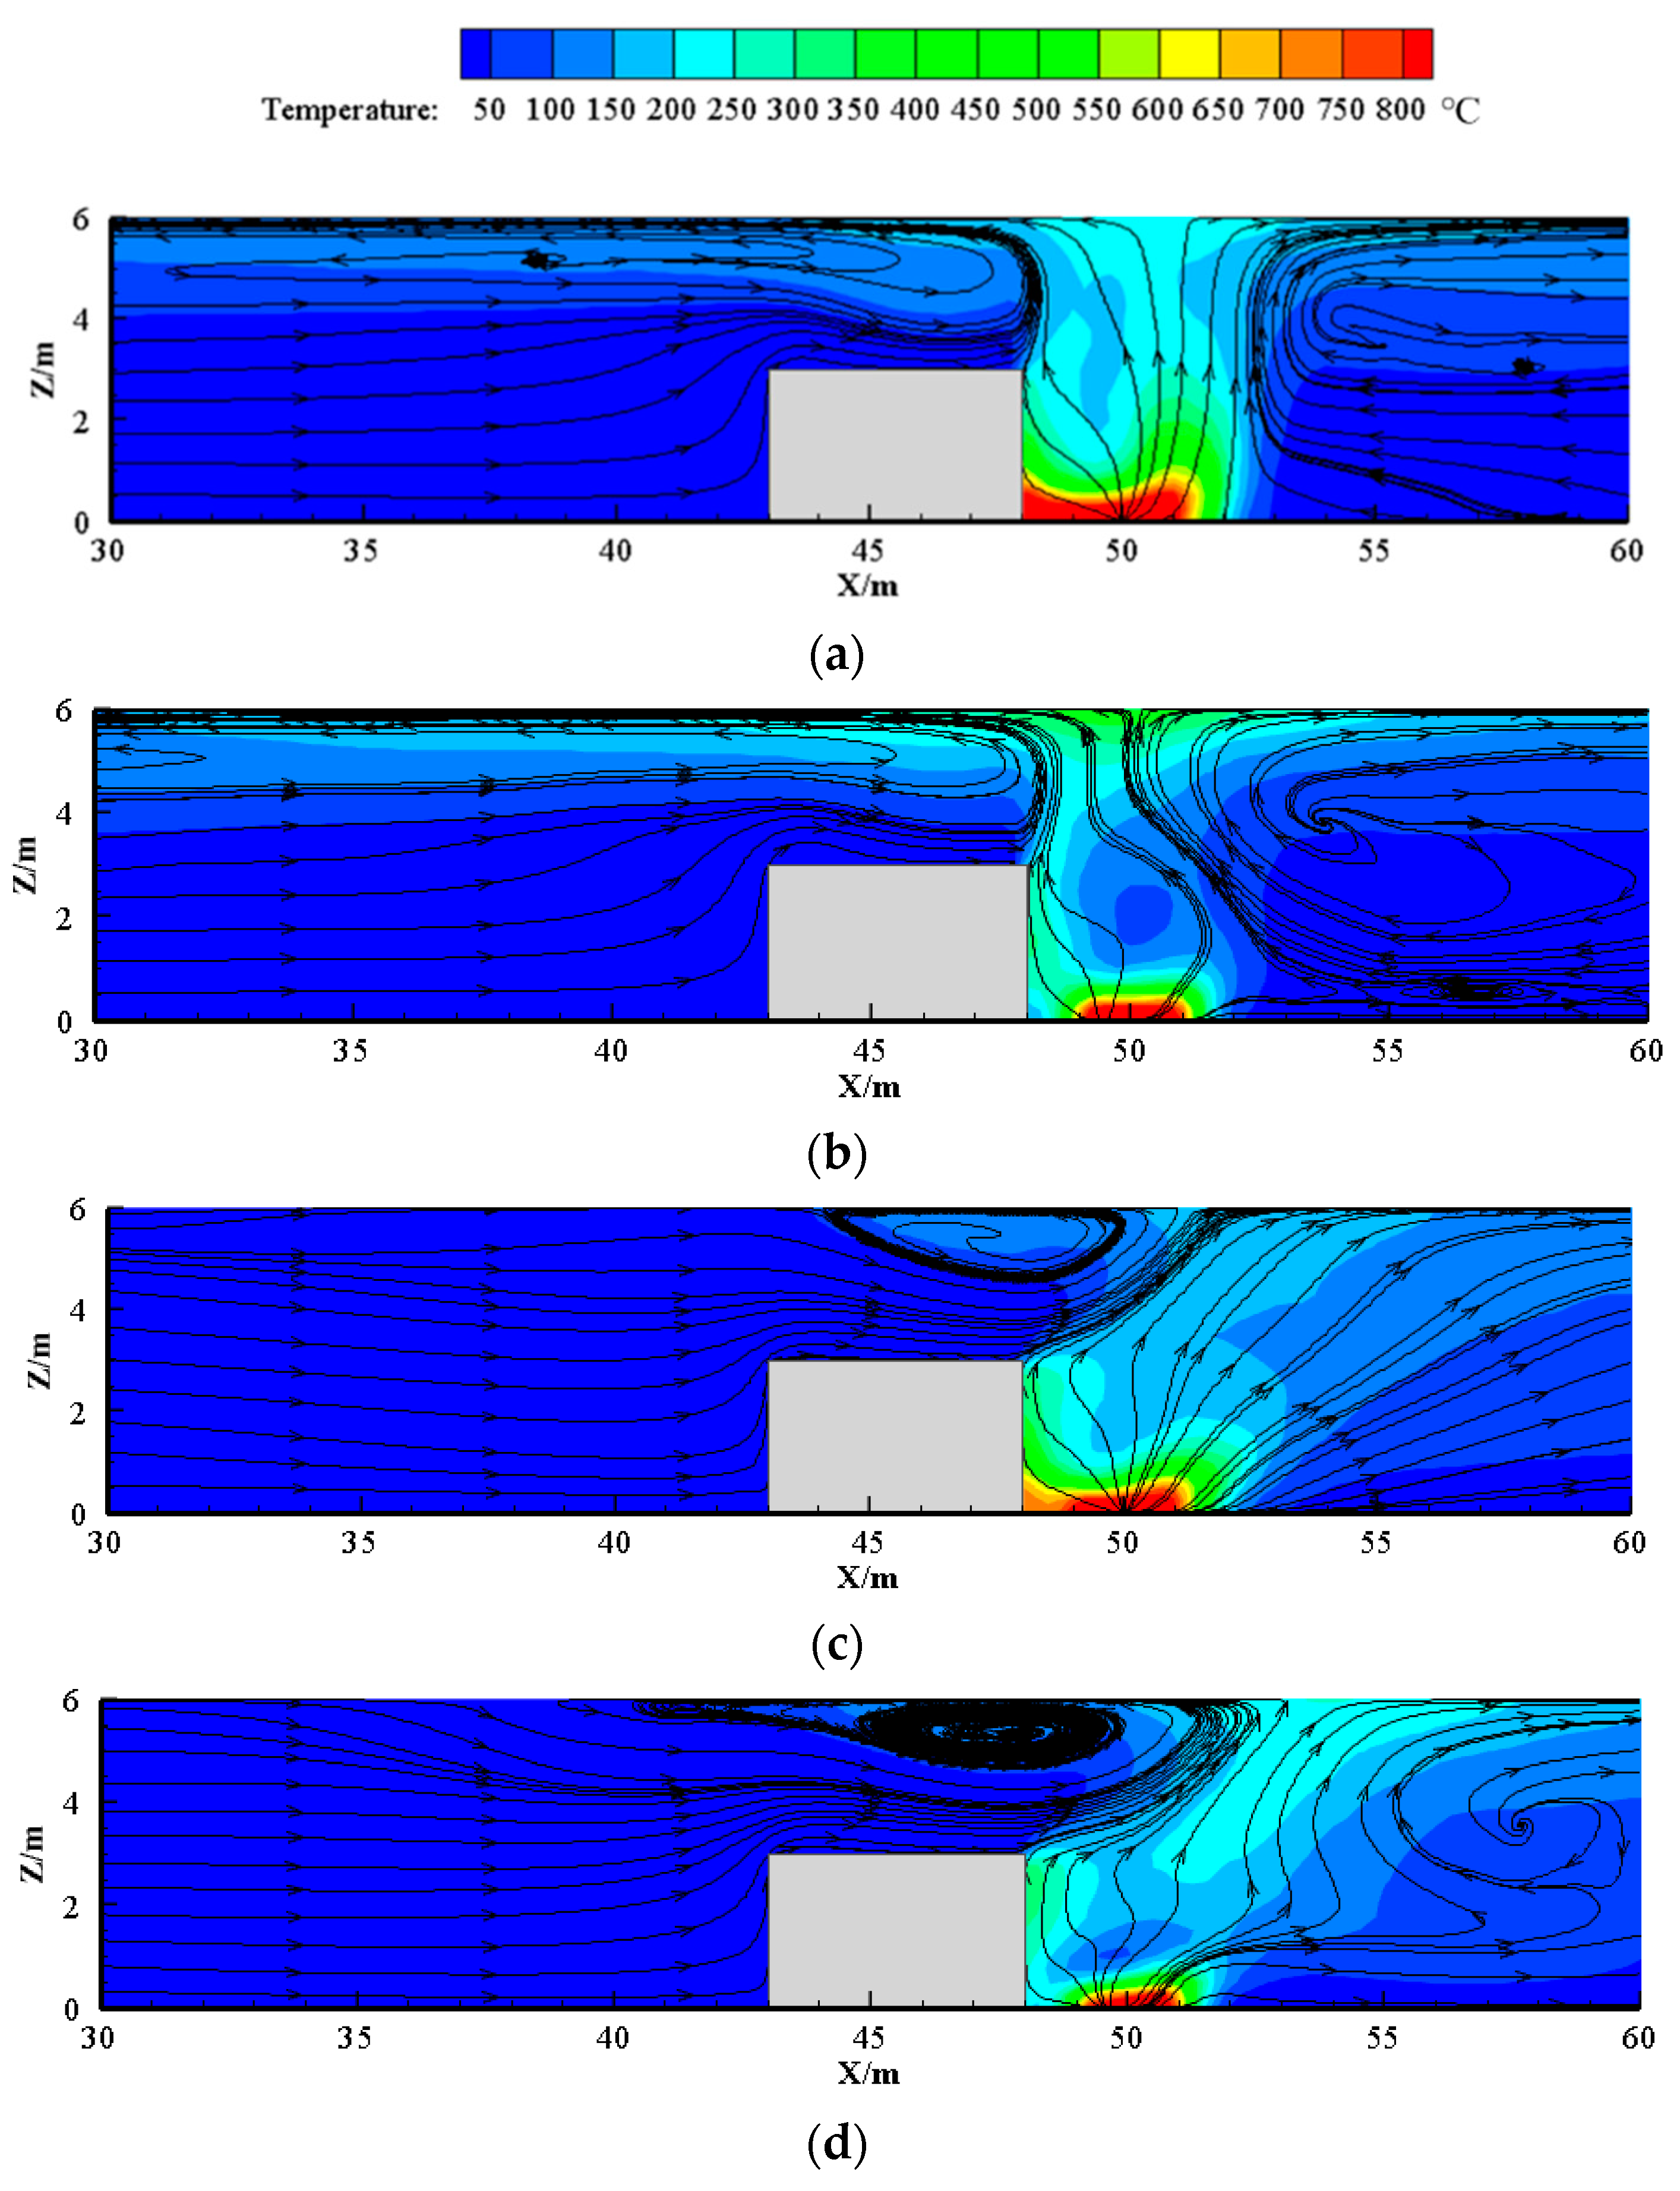
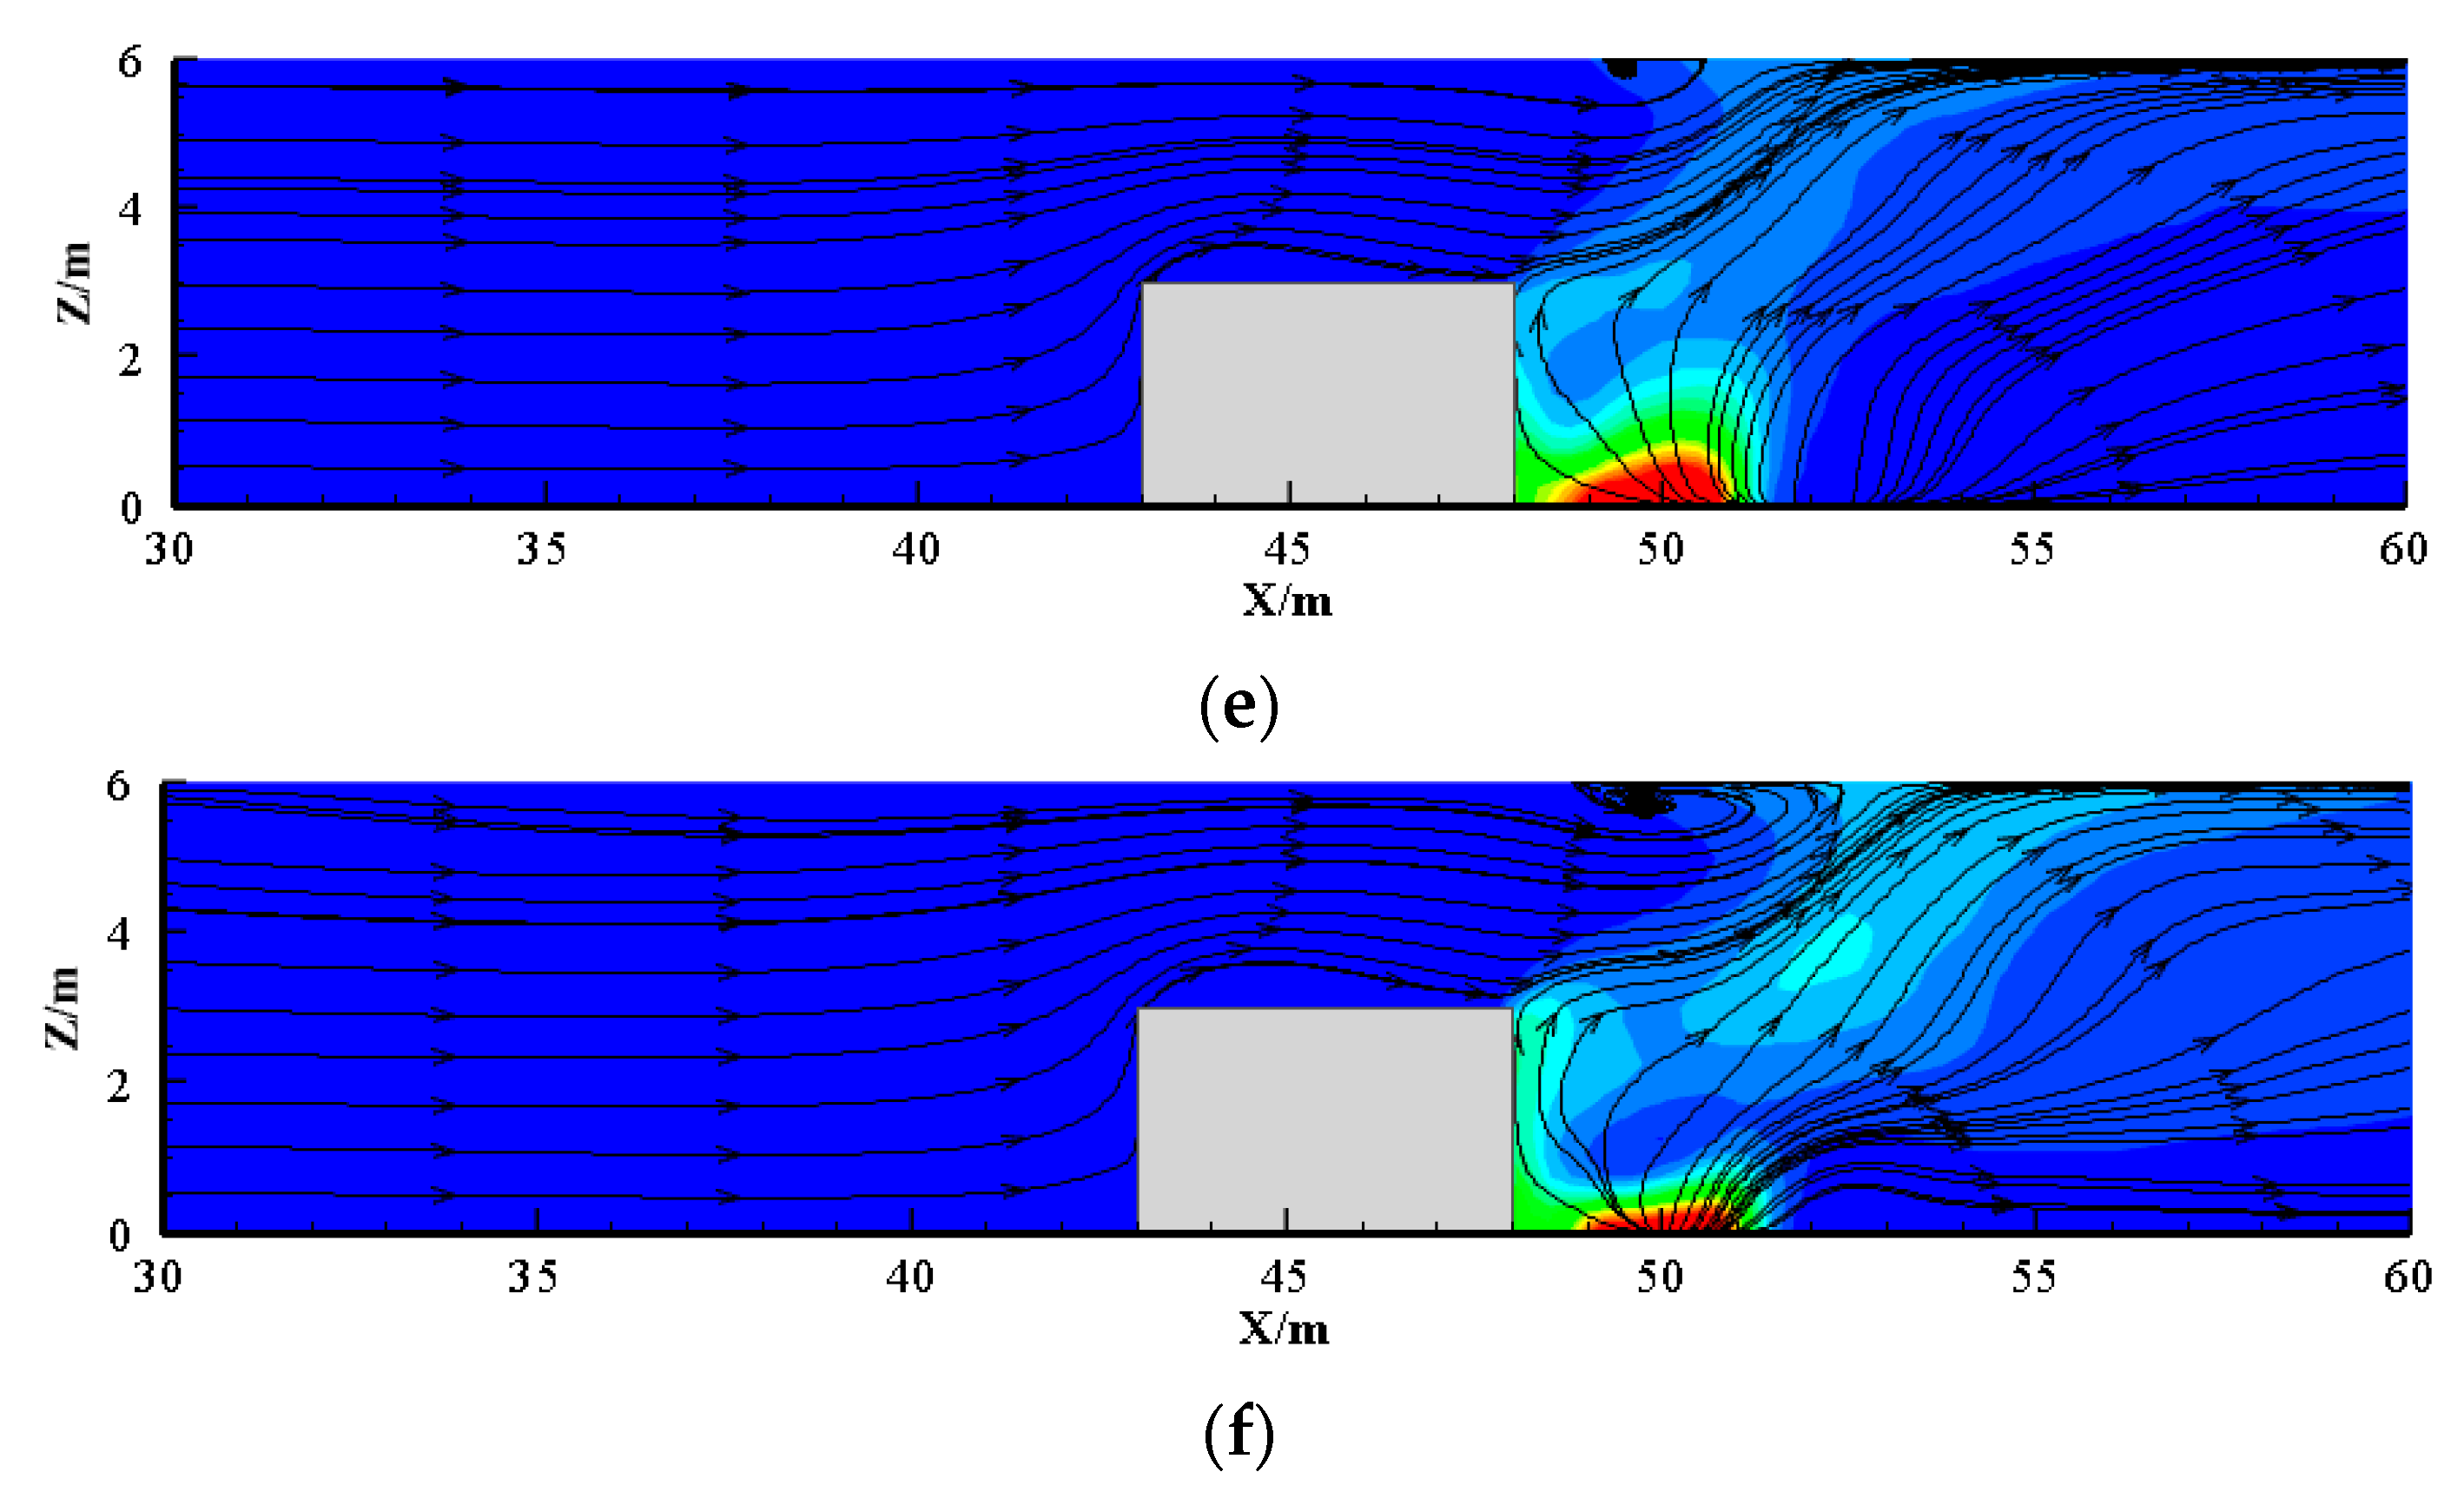
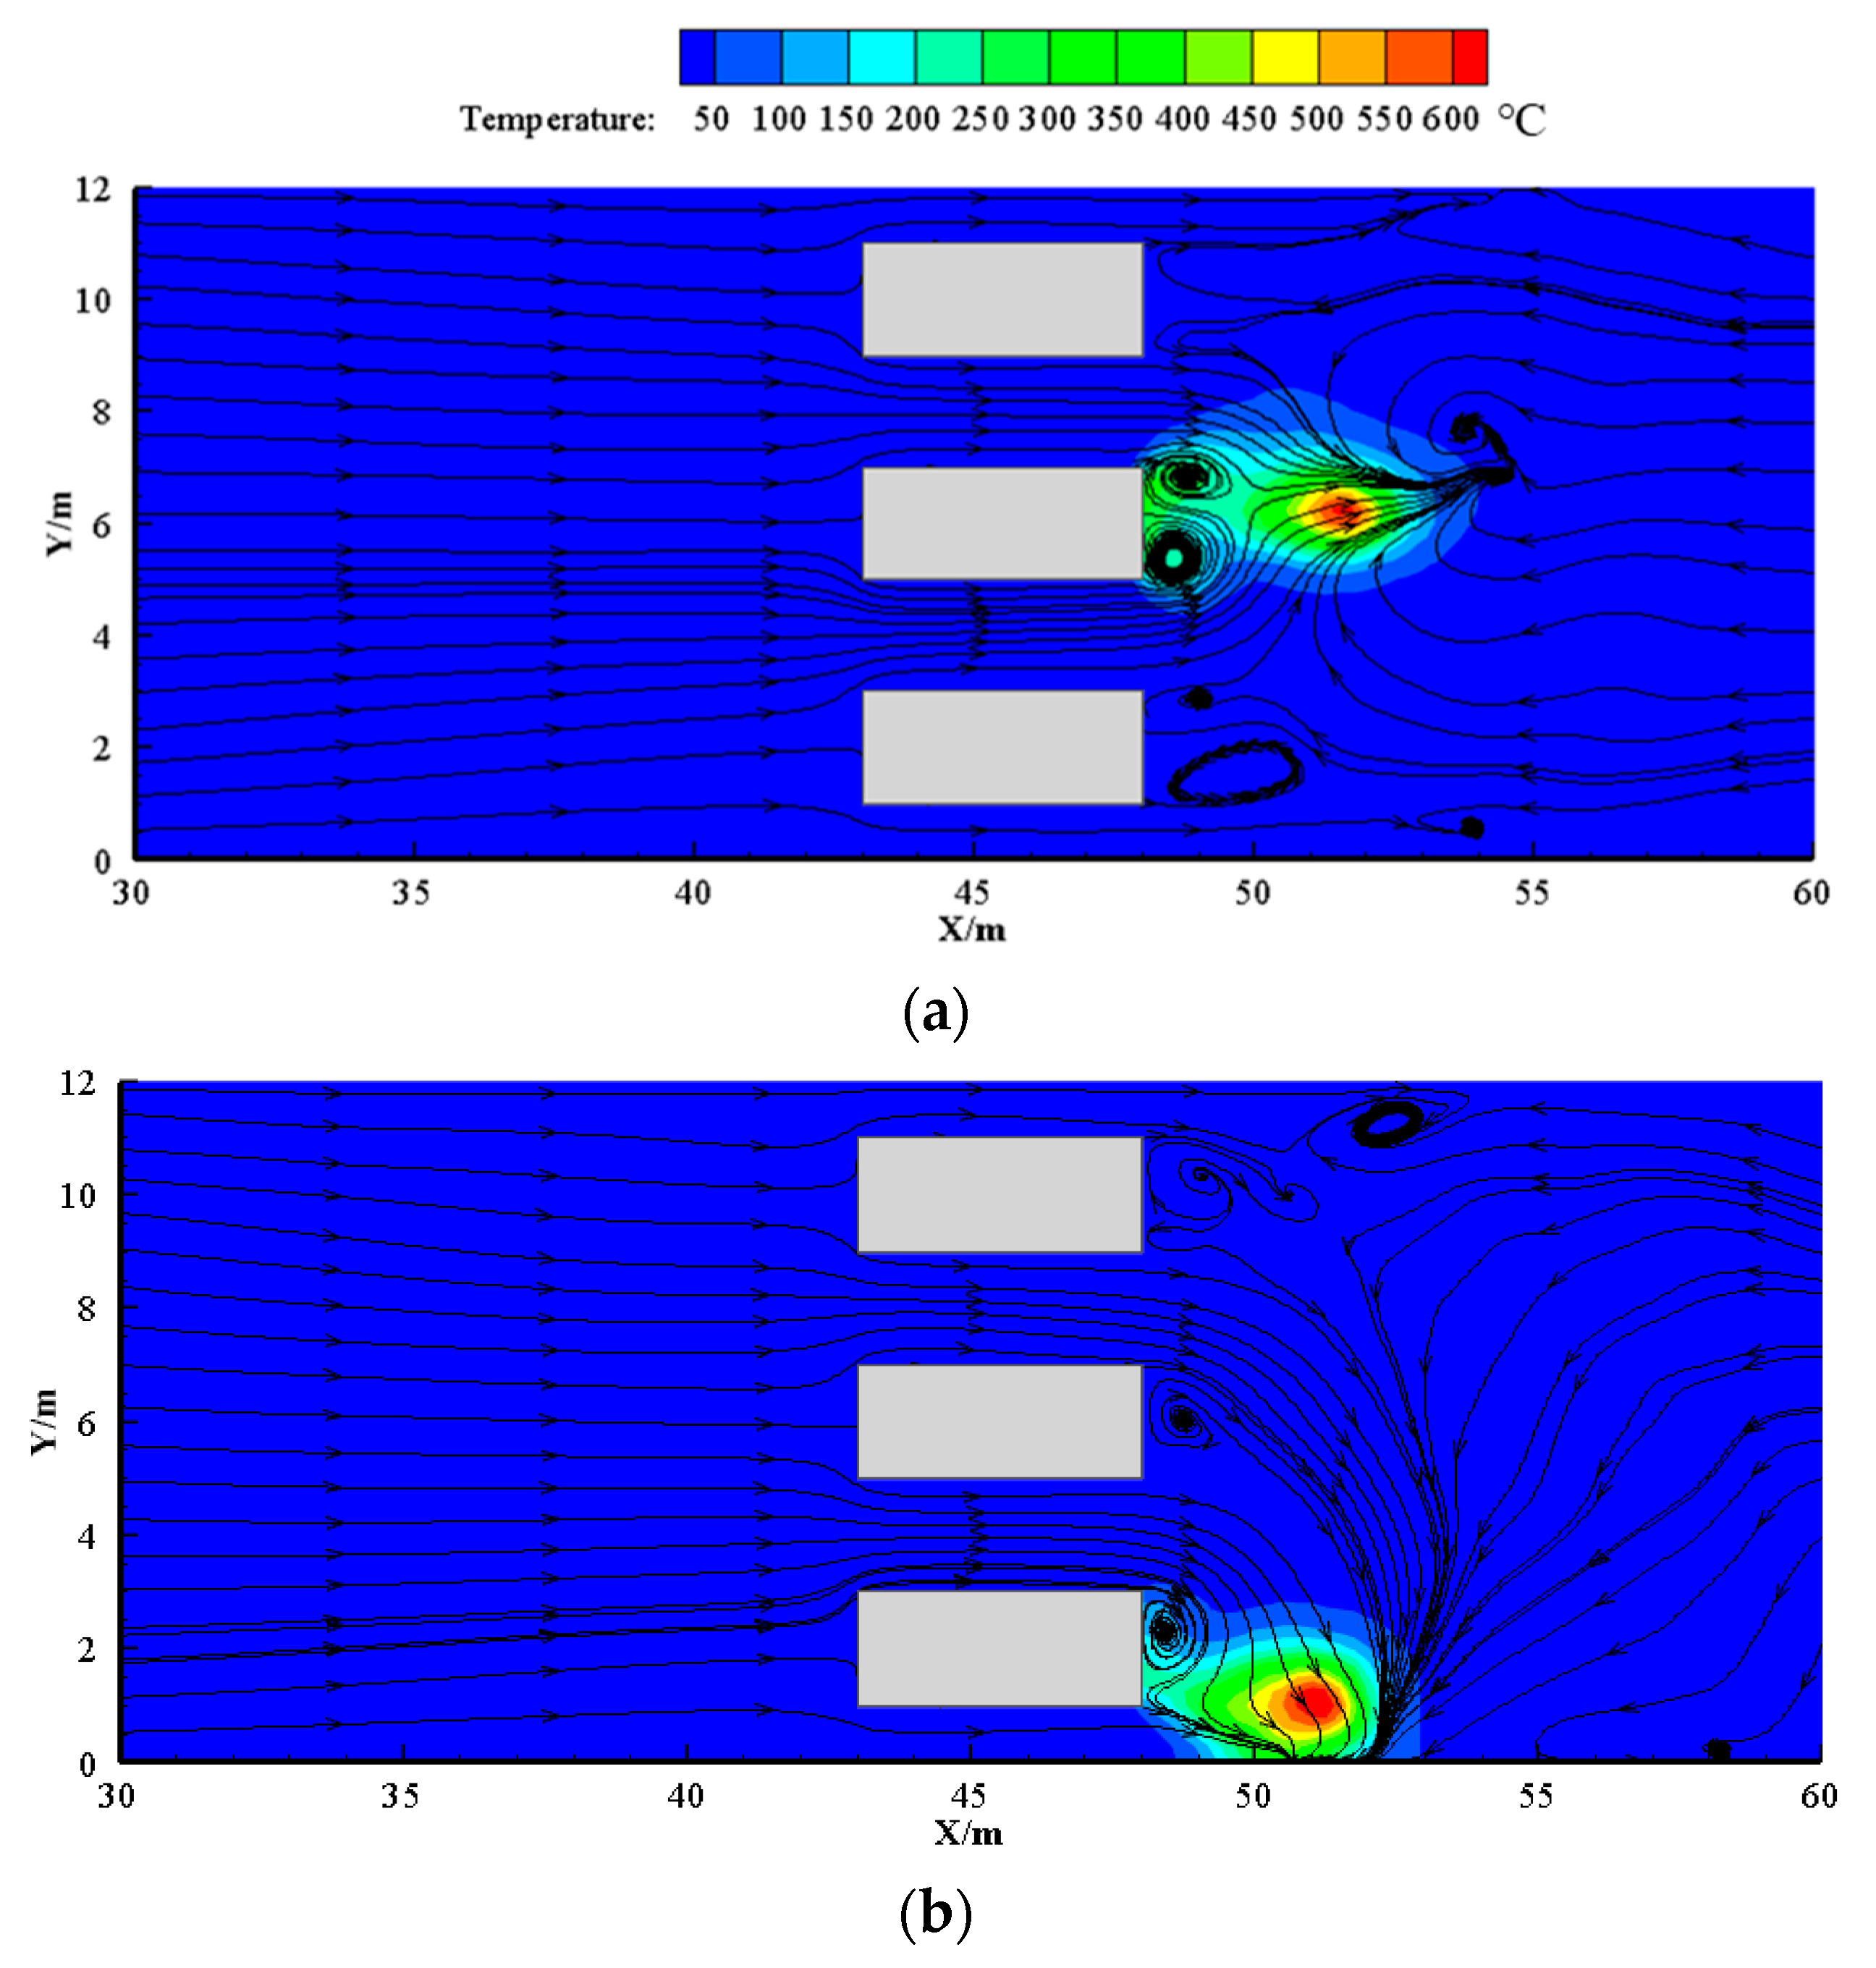
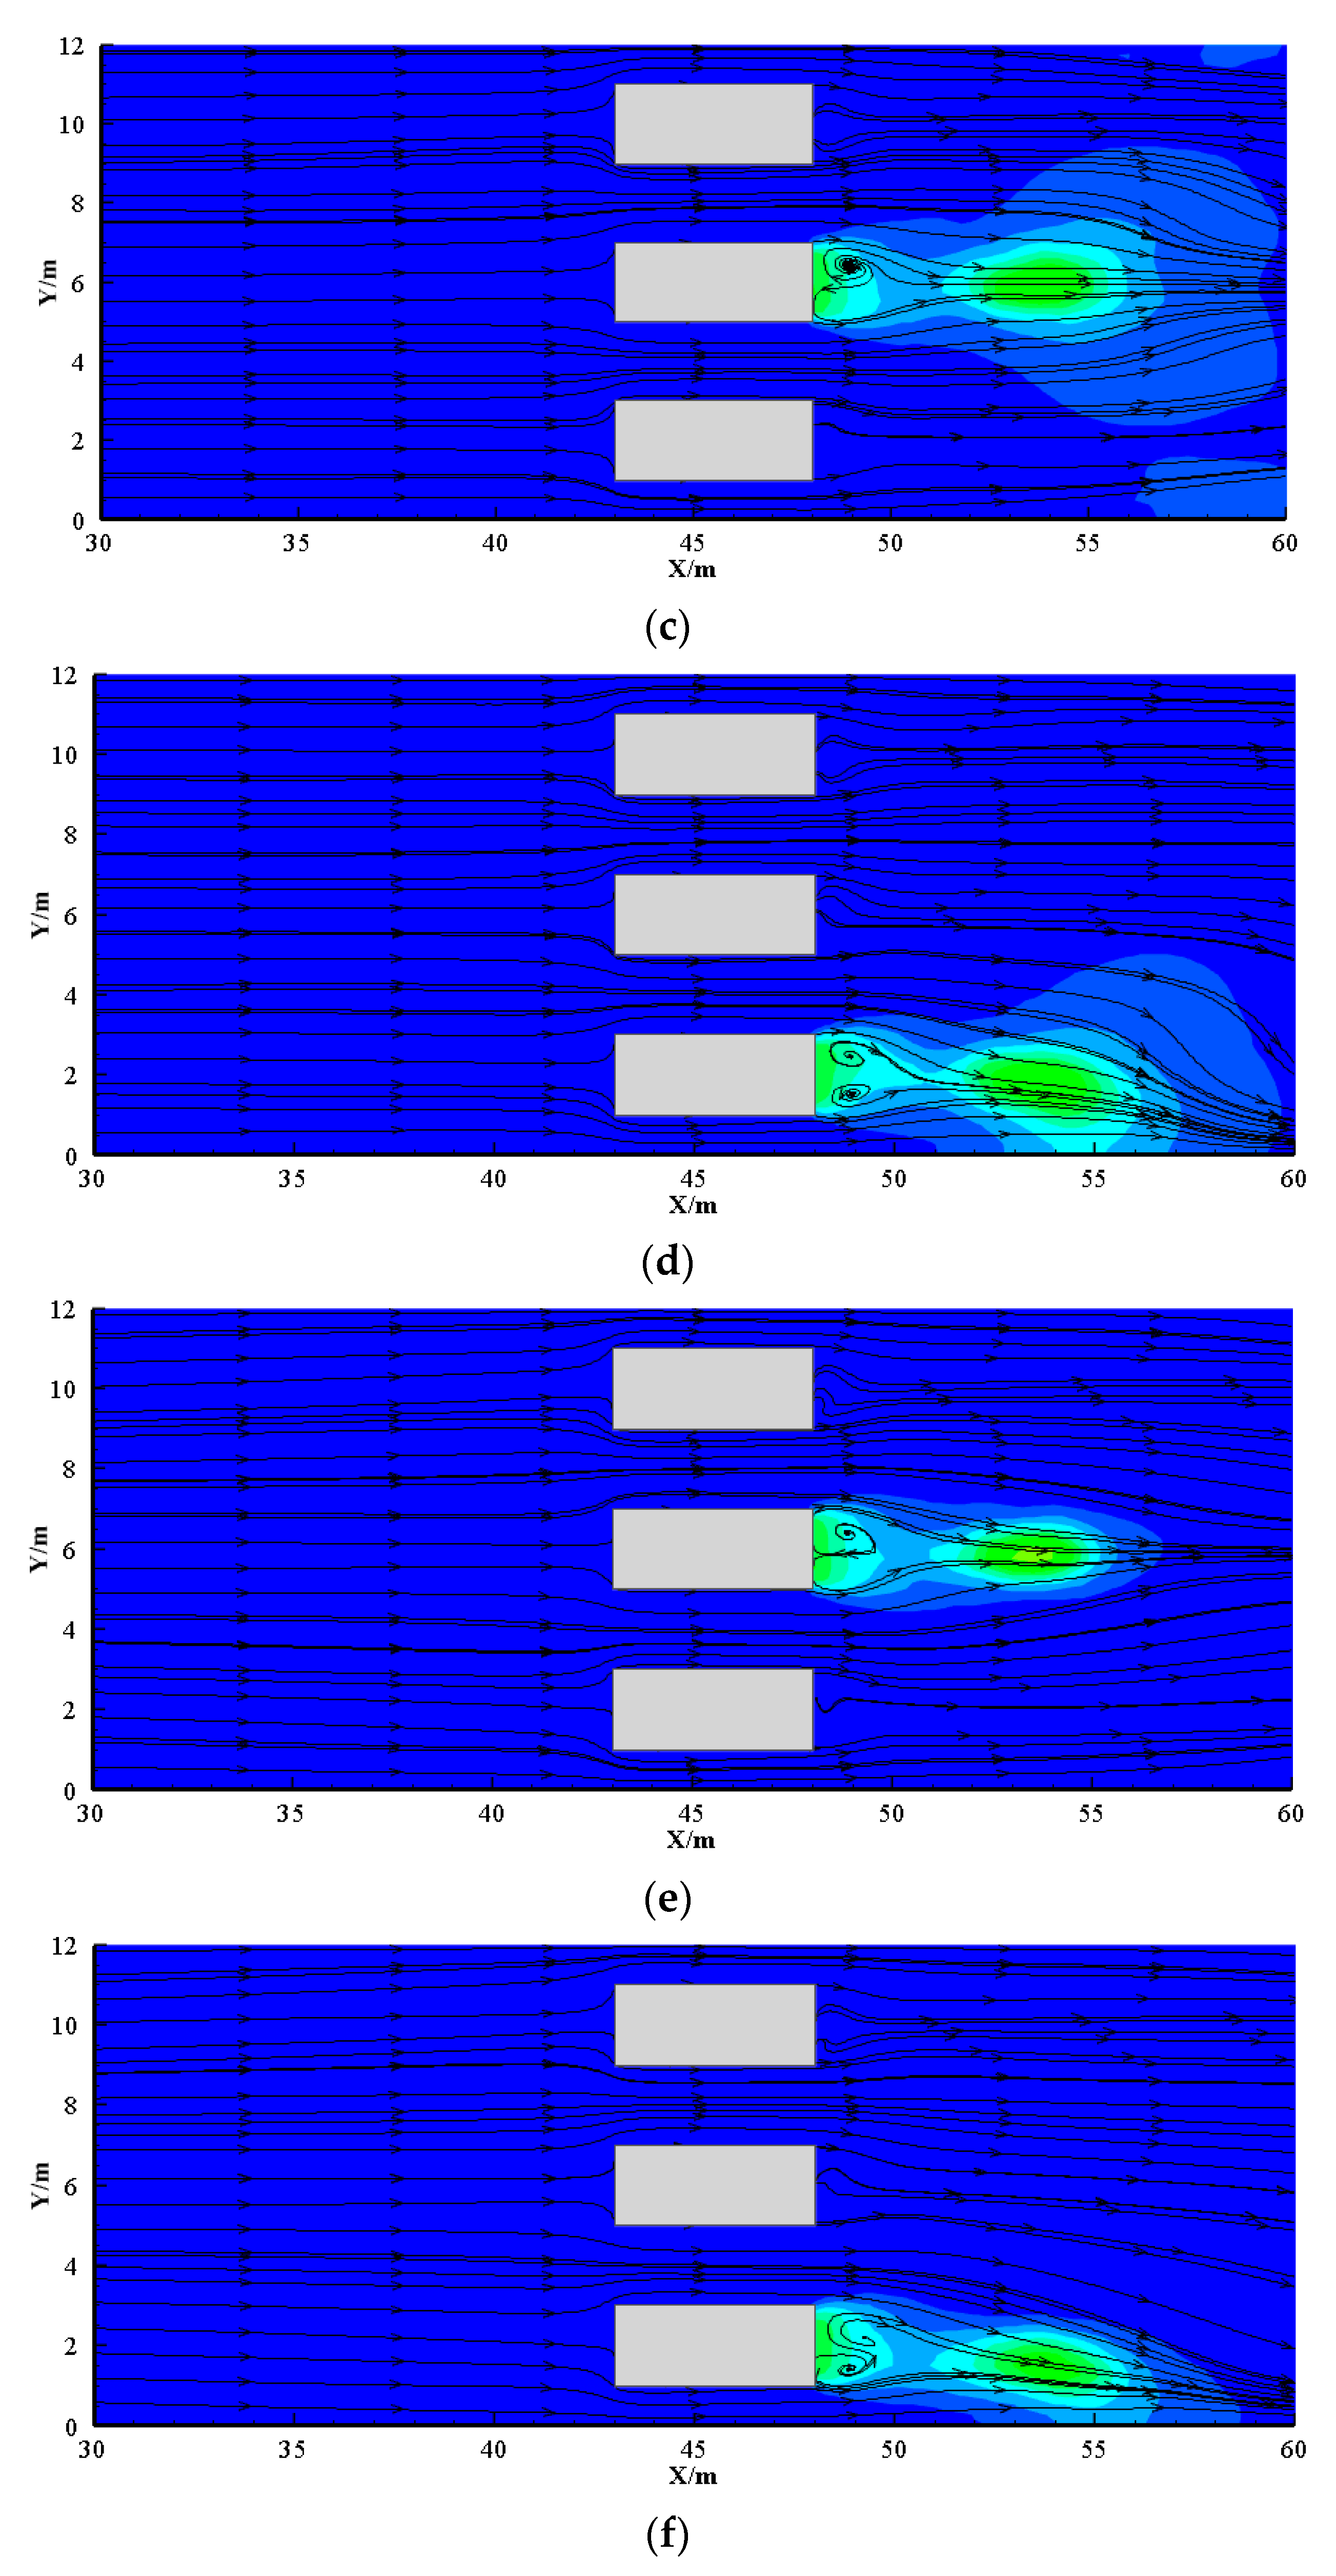
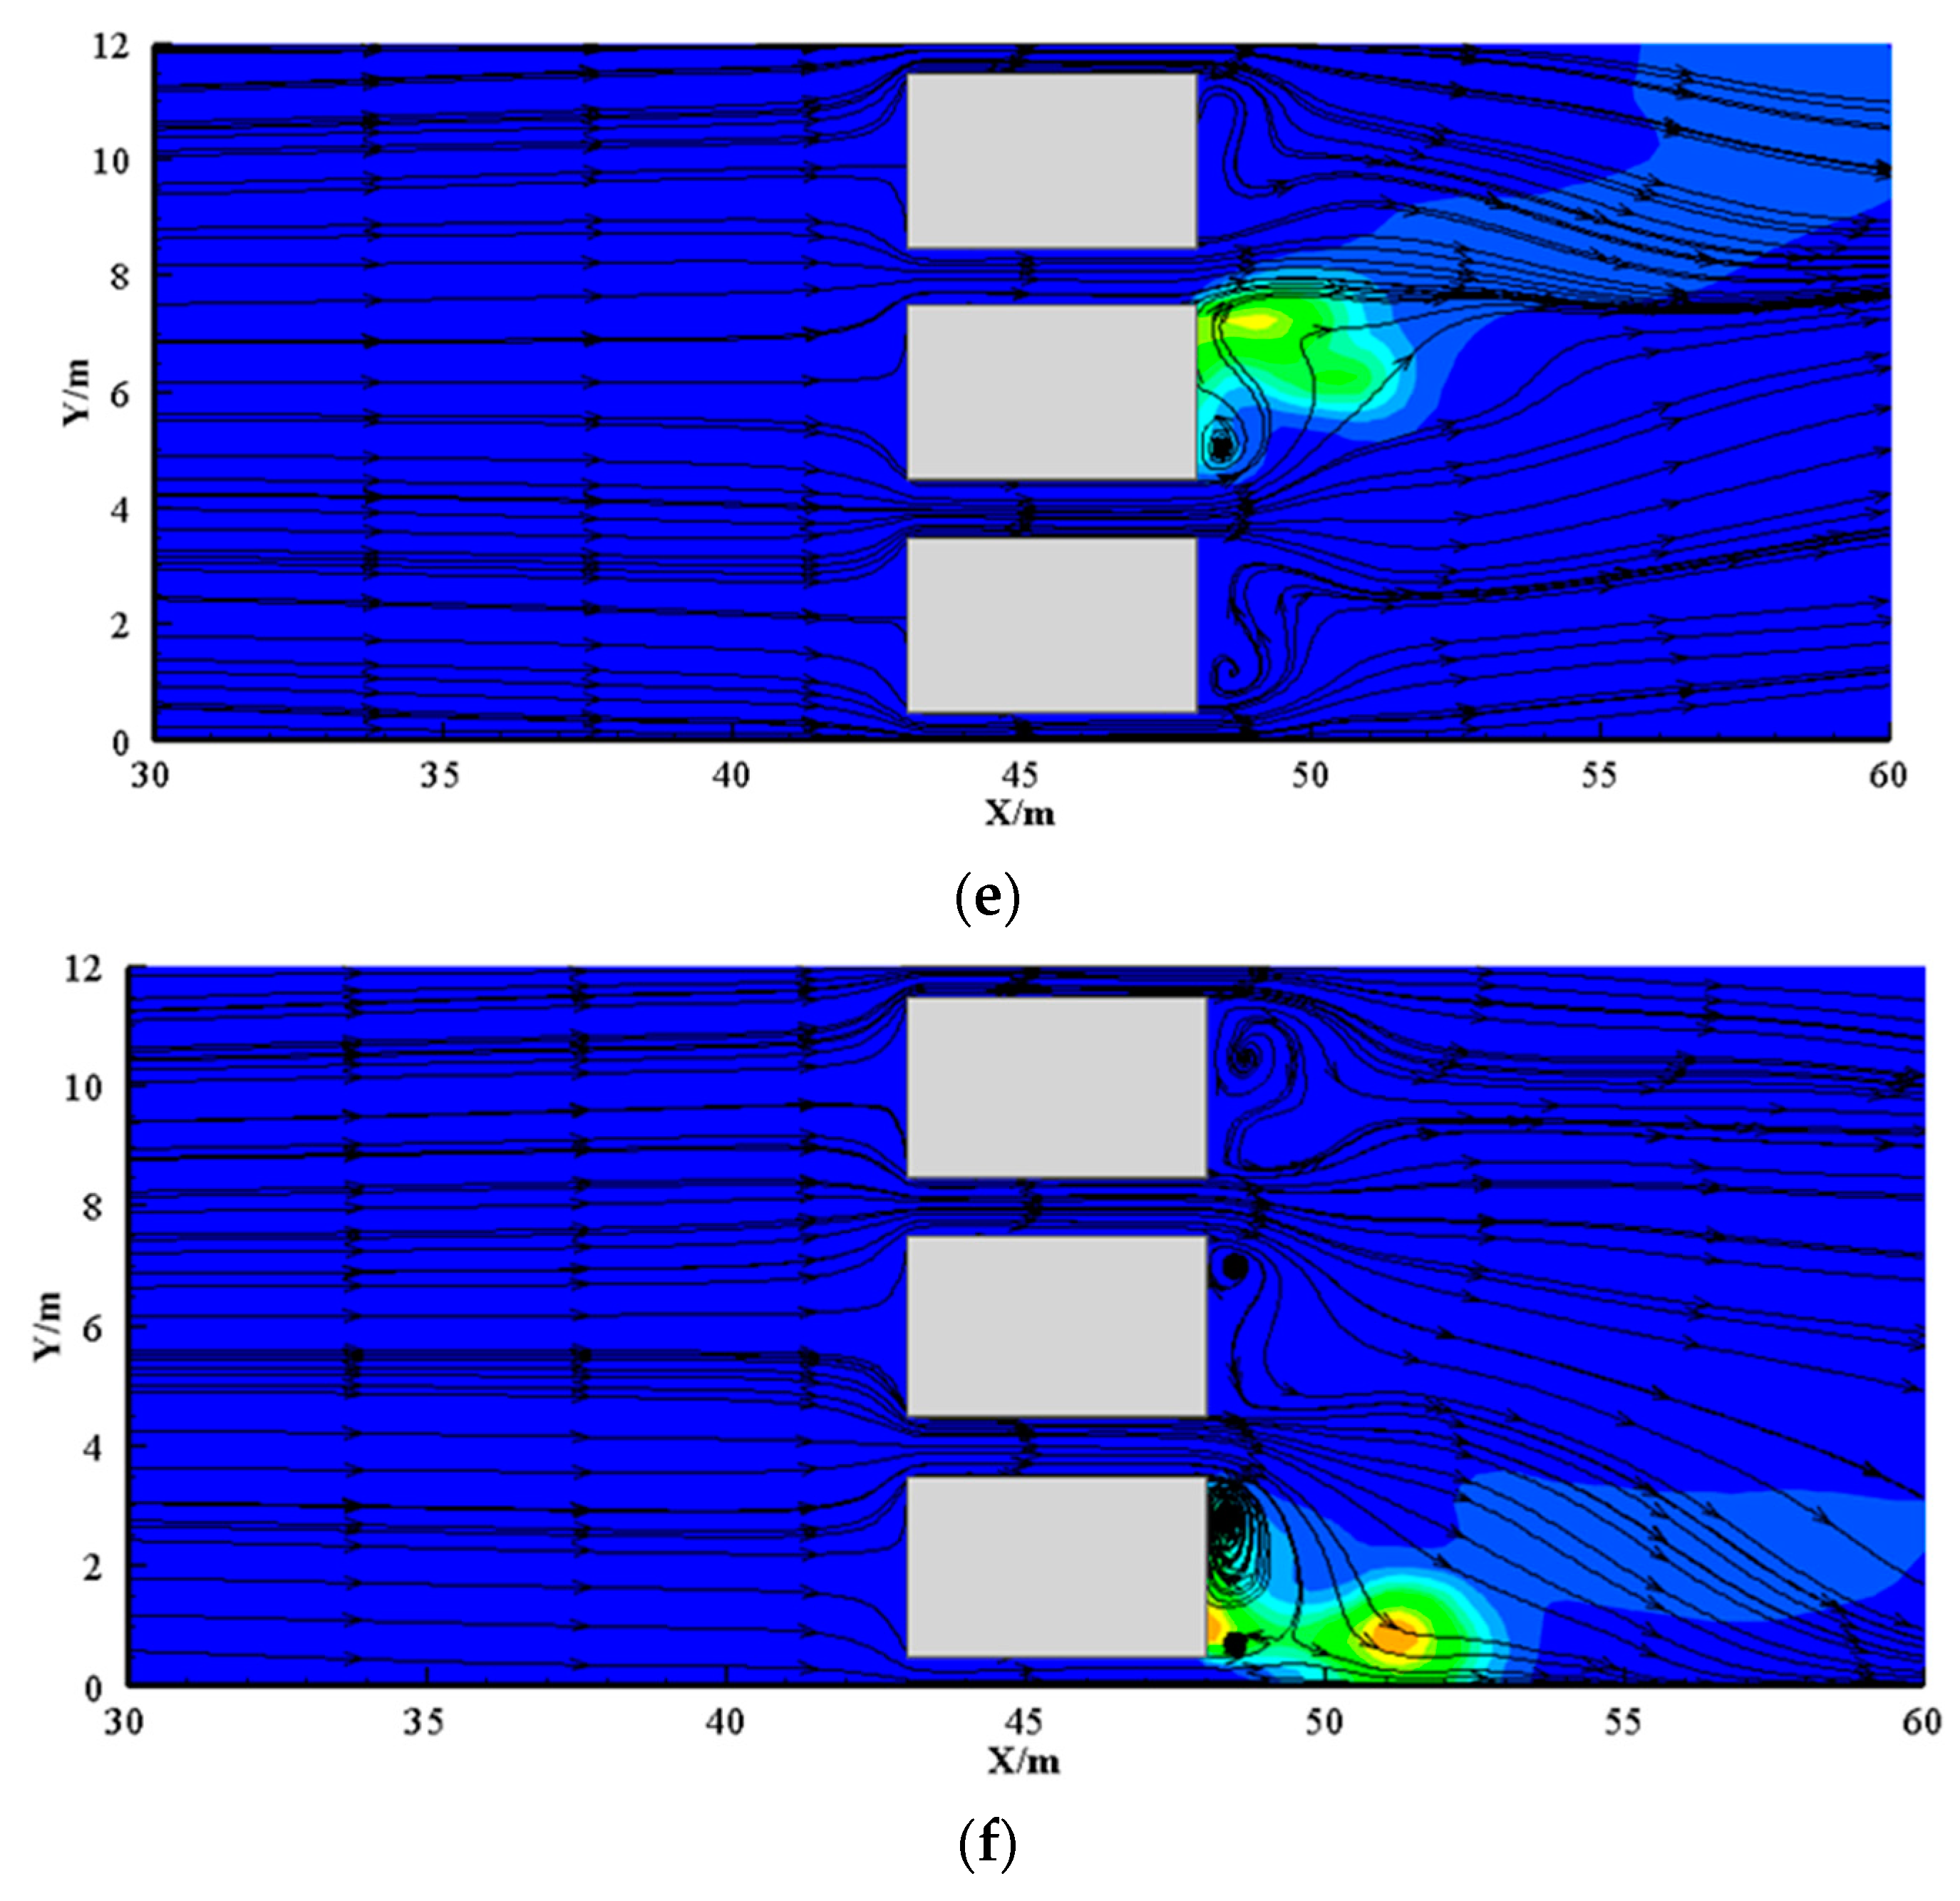
Figure 4, Figure 5, Figure 6 and Figure 7 display the temperature contours and flow fields in the vicinity of the blockages, as seen from the side and top views, under three different longitudinal ventilation velocities (u). As can be seen, as the longitudinal ventilation velocity rises as it passes the blockage, it encounters the upward heat flow, leading to the formation of large turbulence and a recirculation region between the fire source and the blockage, which has been discussed previously [23,28,29].
Figure 4 and Figure 5 illustrate that the flame bifurcation angle increases with the increase in longitudinal ventilation. On one hand, the recirculation region causes some of the flame to remain behind the blockage. On the other hand, the increasing ventilation velocity causes the flame to tilt downstream. The forced longitudinal wind also reduces the spreading of smoke upstream, ultimately leading to the disappearance of smoke back-layering. Comparing two scenarios with different blockage ratios reveals that, as the blockage ratio increases, the recirculation region expands and the length of the back-layering decreases. Moreover, when the cross-section of the blockage is 3 m × 3 m, the flame is virtually straight and does not tilt downstream.
Figure 6 and Figure 7 illustrate the temperature contour and flow field from the top view. They demonstrate the formation of vortices behind each blockage. Unlike a solitary blockage in a tunnel, the flame can interact directly with the longitudinal ventilation through the spaces between multiple blockages. Moreover, as the blockage cross-section increases, the gaps become narrower. It is noteworthy that, for the second fire location, the flames tend to incline towards the side wall. This is due to the smaller gap between the blockage and the side wall as compared to the gap between the blockages, resulting in a higher wind velocity and lower pressure.

3.2. Temperature Distribution

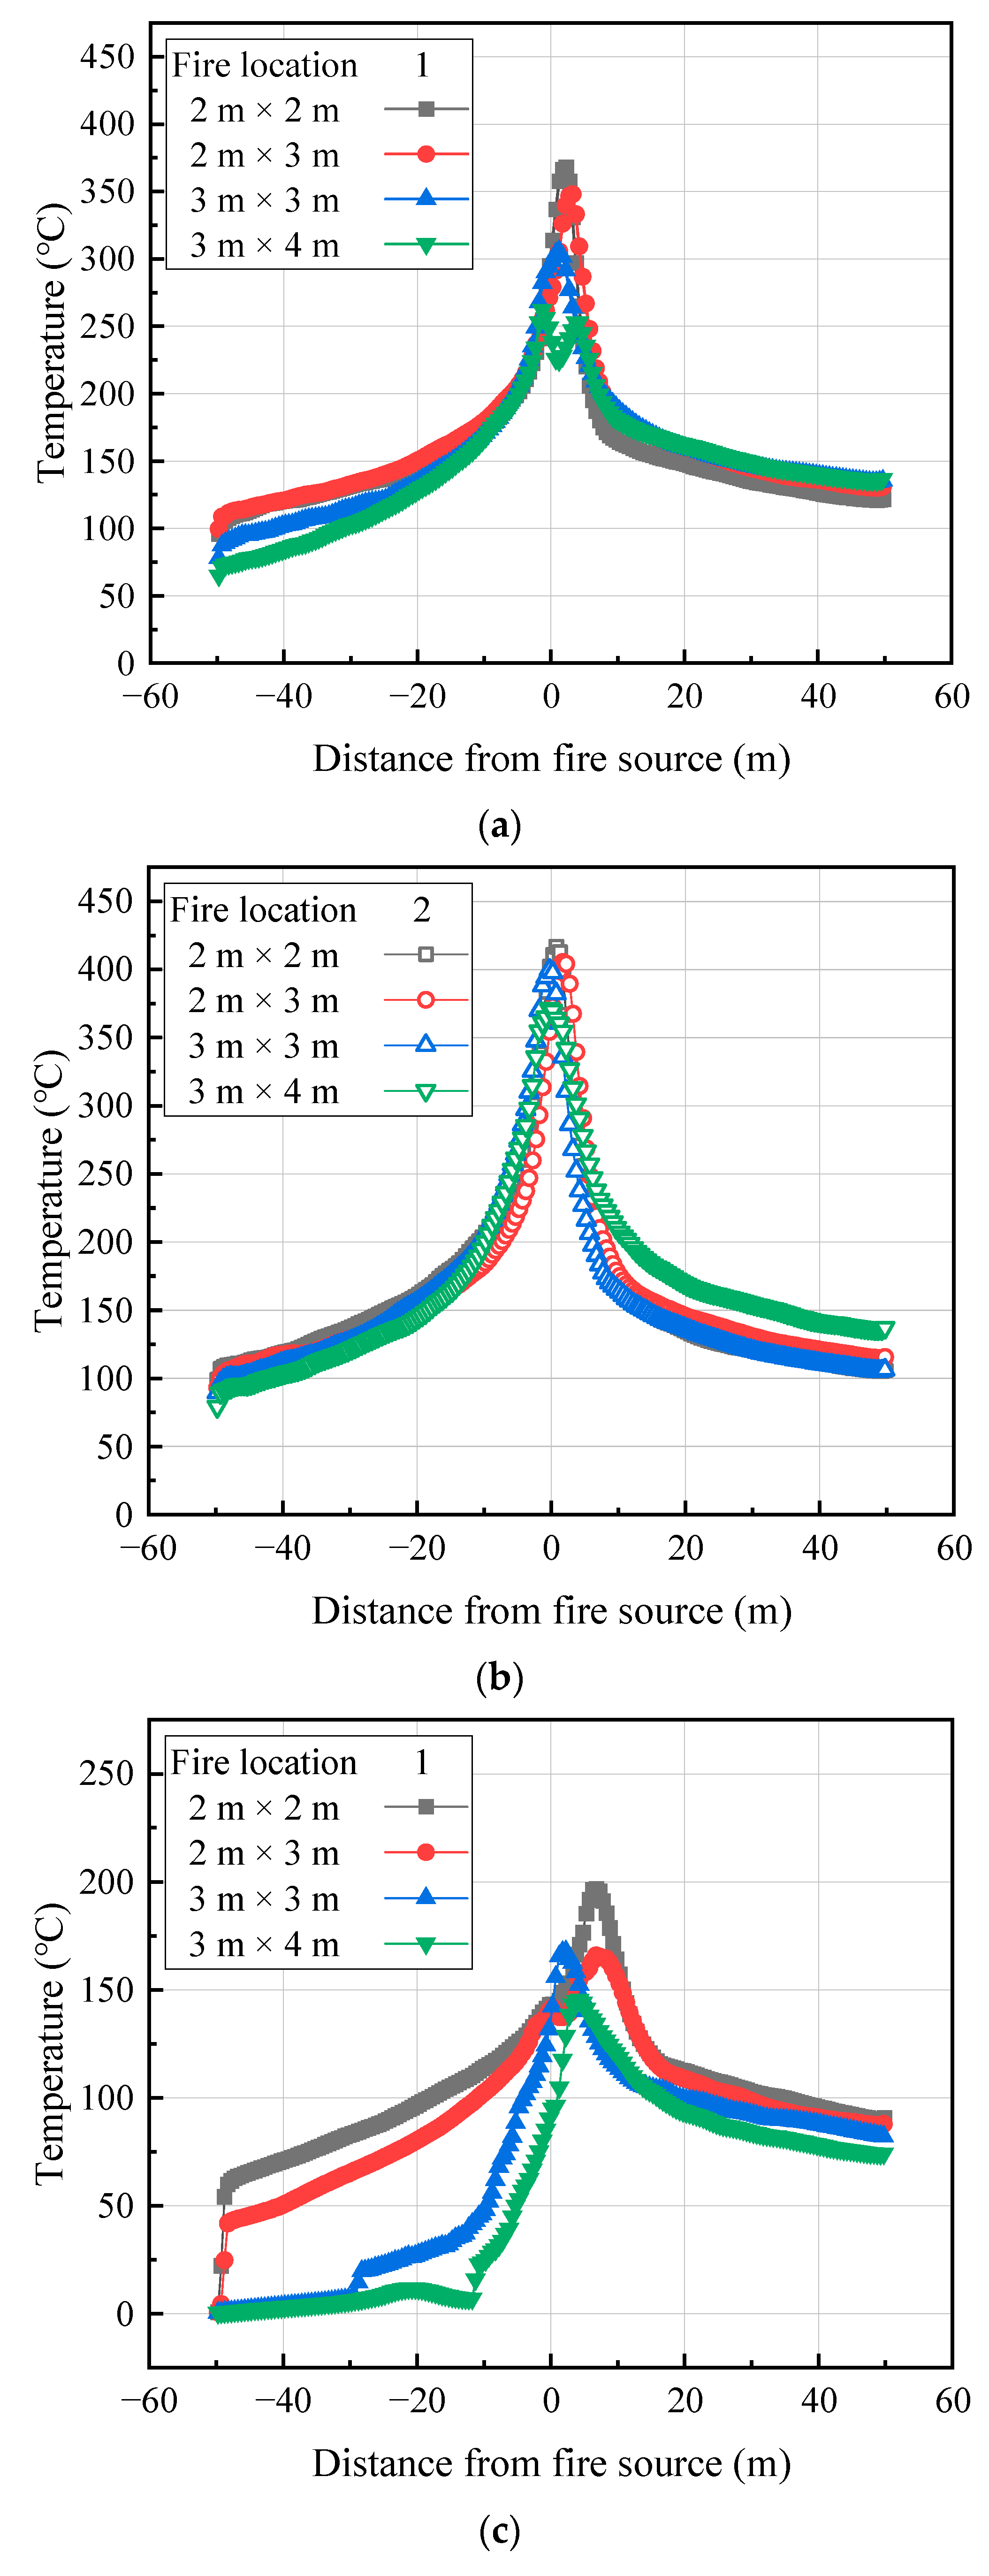
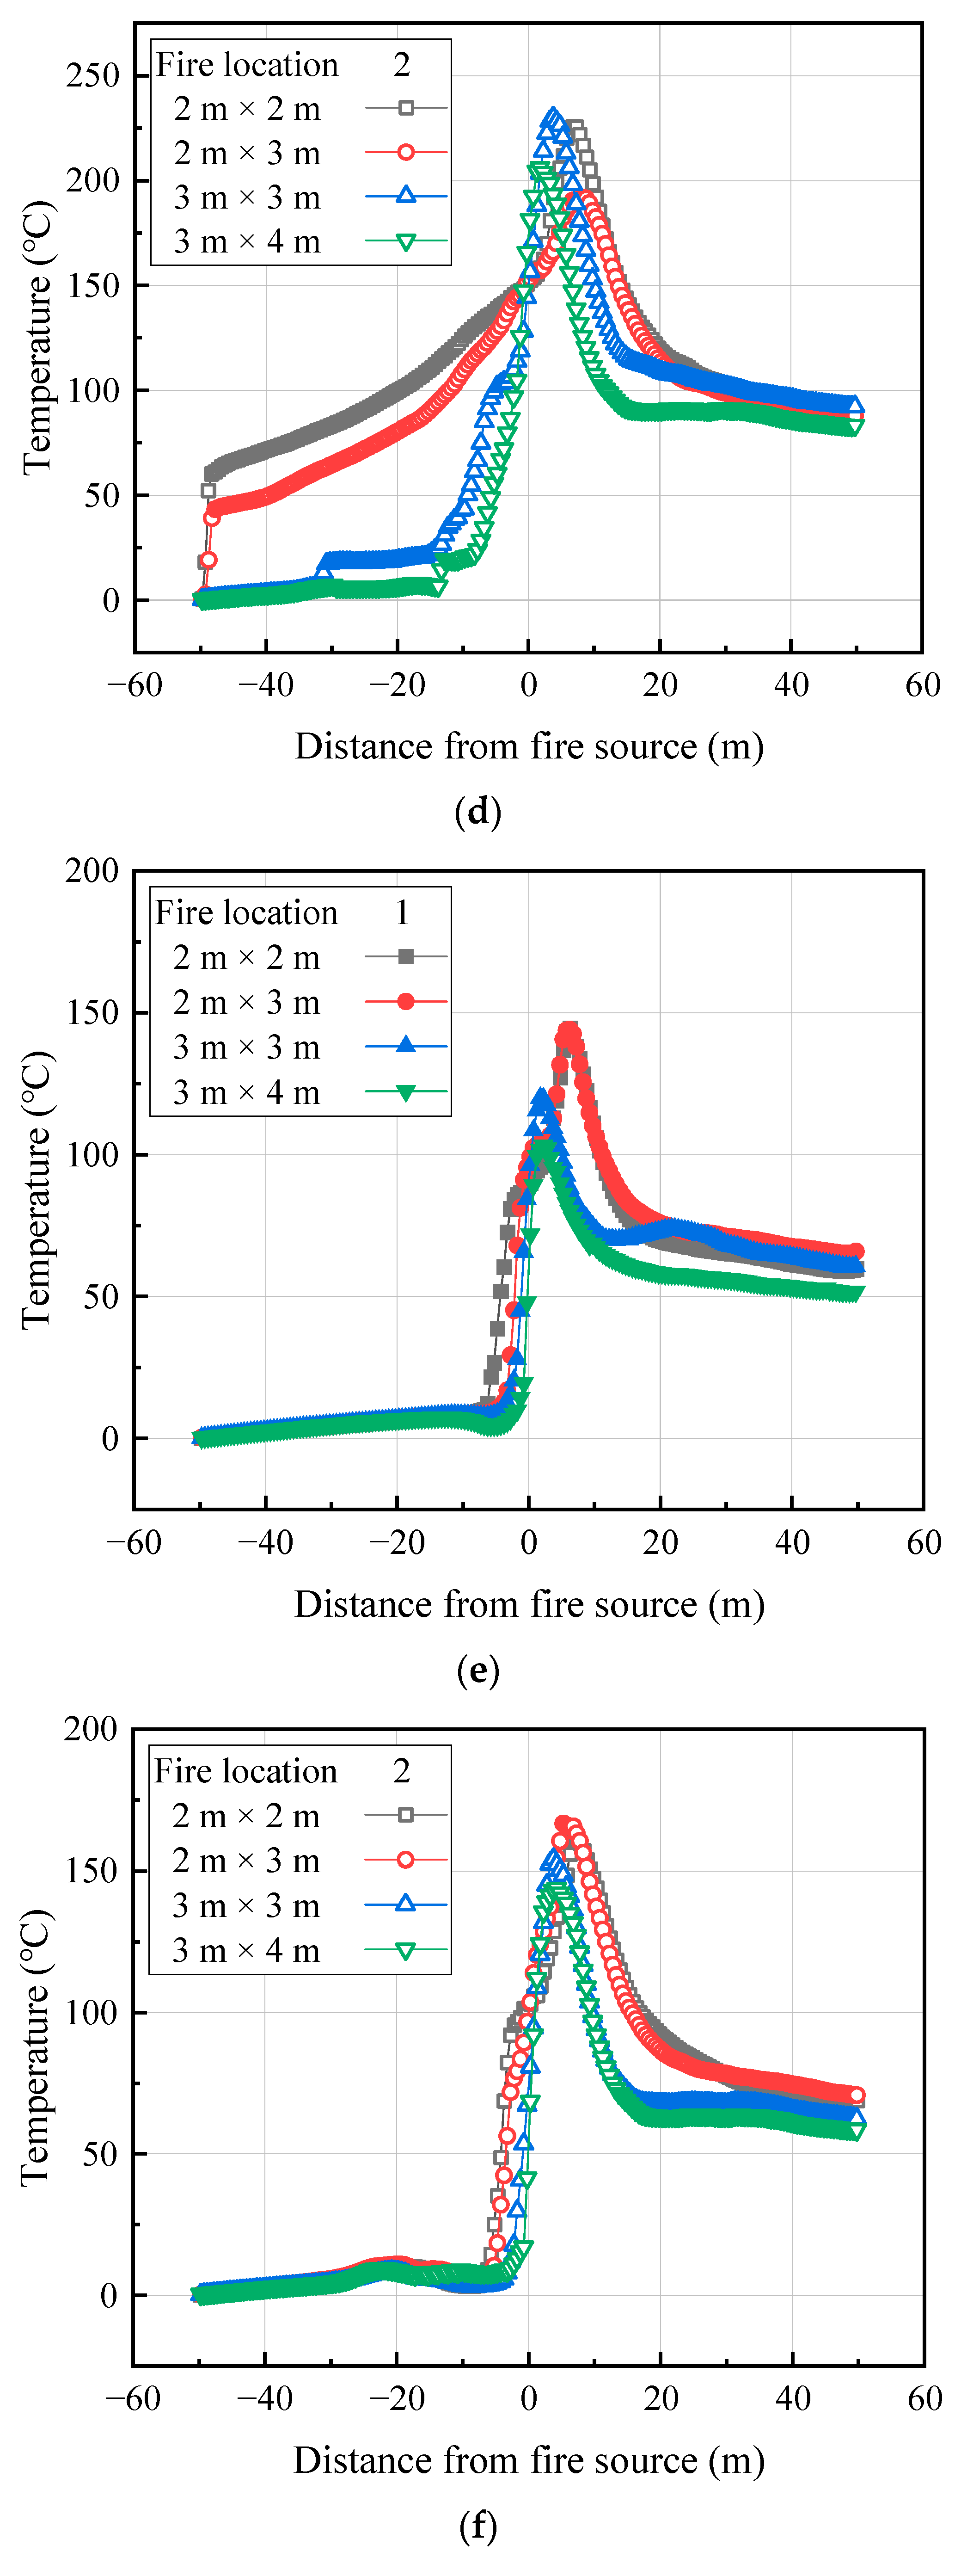
Figure 8 displays the longitudinal temperature distribution under three typical ventilation velocities. It can be observed that at a specific ventilation velocity and blockage ratio, the maximum temperatures at fire location 2 are higher than those at fire location 1. This can be attributed to two factors. Firstly, as per a previous summary [4], the smoke spread process in large tunnels can be divided into five phases in terms of the smoke flow pattern. During the third phase, the smoke moves downwards along the vertical walls and creates an anti-buoyant wall jet that forces a portion of the smoke to flow back, resulting in a rise in the smoke temperature under the ceiling compared to the centerline of the tunnel. Secondly, the flame is tilted towards the side wall. The increased flame height can entrain more fresh air due to the confinement of the side wall, causing the ceiling to receive more heat.
In addition, the maximum temperature points move upstream from downstream as the blockage ratio increases. This is because the flame bifurcation angle decreases with the increase in the blockage rate, causing the impingement points of the flame to deviate. The temperature distributions beneath the tunnel ceiling exhibit similar trends for both fire locations, excluding the near-fire region. This can be explained by the transverse position of the fire source having less impact on the smoke during the one-dimensional flow phase. Moreover, the upstream temperature distribution varies distinctly due to the varying back-layering lengths under different blockage ratios. For instance, at u = 1.2 m/s, the temperature drops sharply for 3 m × 3 m and 3 m × 4 m near the fire source, but there is little fluctuation for 2 m × 2 m and 2 m × 3 m. The downstream temperature difference with the increasing blockage ratio enlarges at a relatively high ventilation velocity.
For the maximum temperature rise, Kurioka et al. [59] proposed the following prediction model via a series of tunnel fire tests, but when the ventilation speed u = 0, F r is equal to 0, and the right-hand side of Equation (2) tends to infinity. Thus, it will be meaningless when the ventilation is extremely small.
Δ T m a x T a = γ Q ˙ * 2 / 3 F r 1 / 3 ε
Q ˙ * = Q ˙ ρ a C p T a g H d 5 / 2
F r = u 2 / g H d
Q ˙ * 2 / 3 F r 1 / 3 < 1.35 ,   γ = 1.77 ,   ε = 6 / 5
Q ˙ * 2 / 3 F r 1 / 3 1.35 ,   γ = 2.54 ,   ε = 0
where H d is the distance between the fire source and the tunnel ceiling.
Han et al. [60] established two modified correlations via simple data fitting based on Equation (5) and the experimental data published before:
Δ T m a x T a = 0.84 Q ˙ * 2 / 3 F r   1 / 3 0.295
u local   = u 1 1 ϕ
F r = u local     2 / g H d
where u l o c a l is the local wind velocity; ϕ is the blockage ratio, with four sizes of multi-blockages considered here, corresponding to the blockage ratios of 16.67%, 25%, 37.5%, and 50%, respectively.
Based on the abovementioned empirical models, a modified prediction model including various blockage ratios and local ventilation velocities can be assumed as follows.
Δ T m a x T a = γ Q ˙ * 2 / 3 F r   1 / 3 ε
By fitting the data of fire source location 1, a new prediction equation for the middle lane is obtained:
Δ T m a x ,   1 T a = 1.04 Q ˙ * 2 / 3 F r   1 / 3 1.12
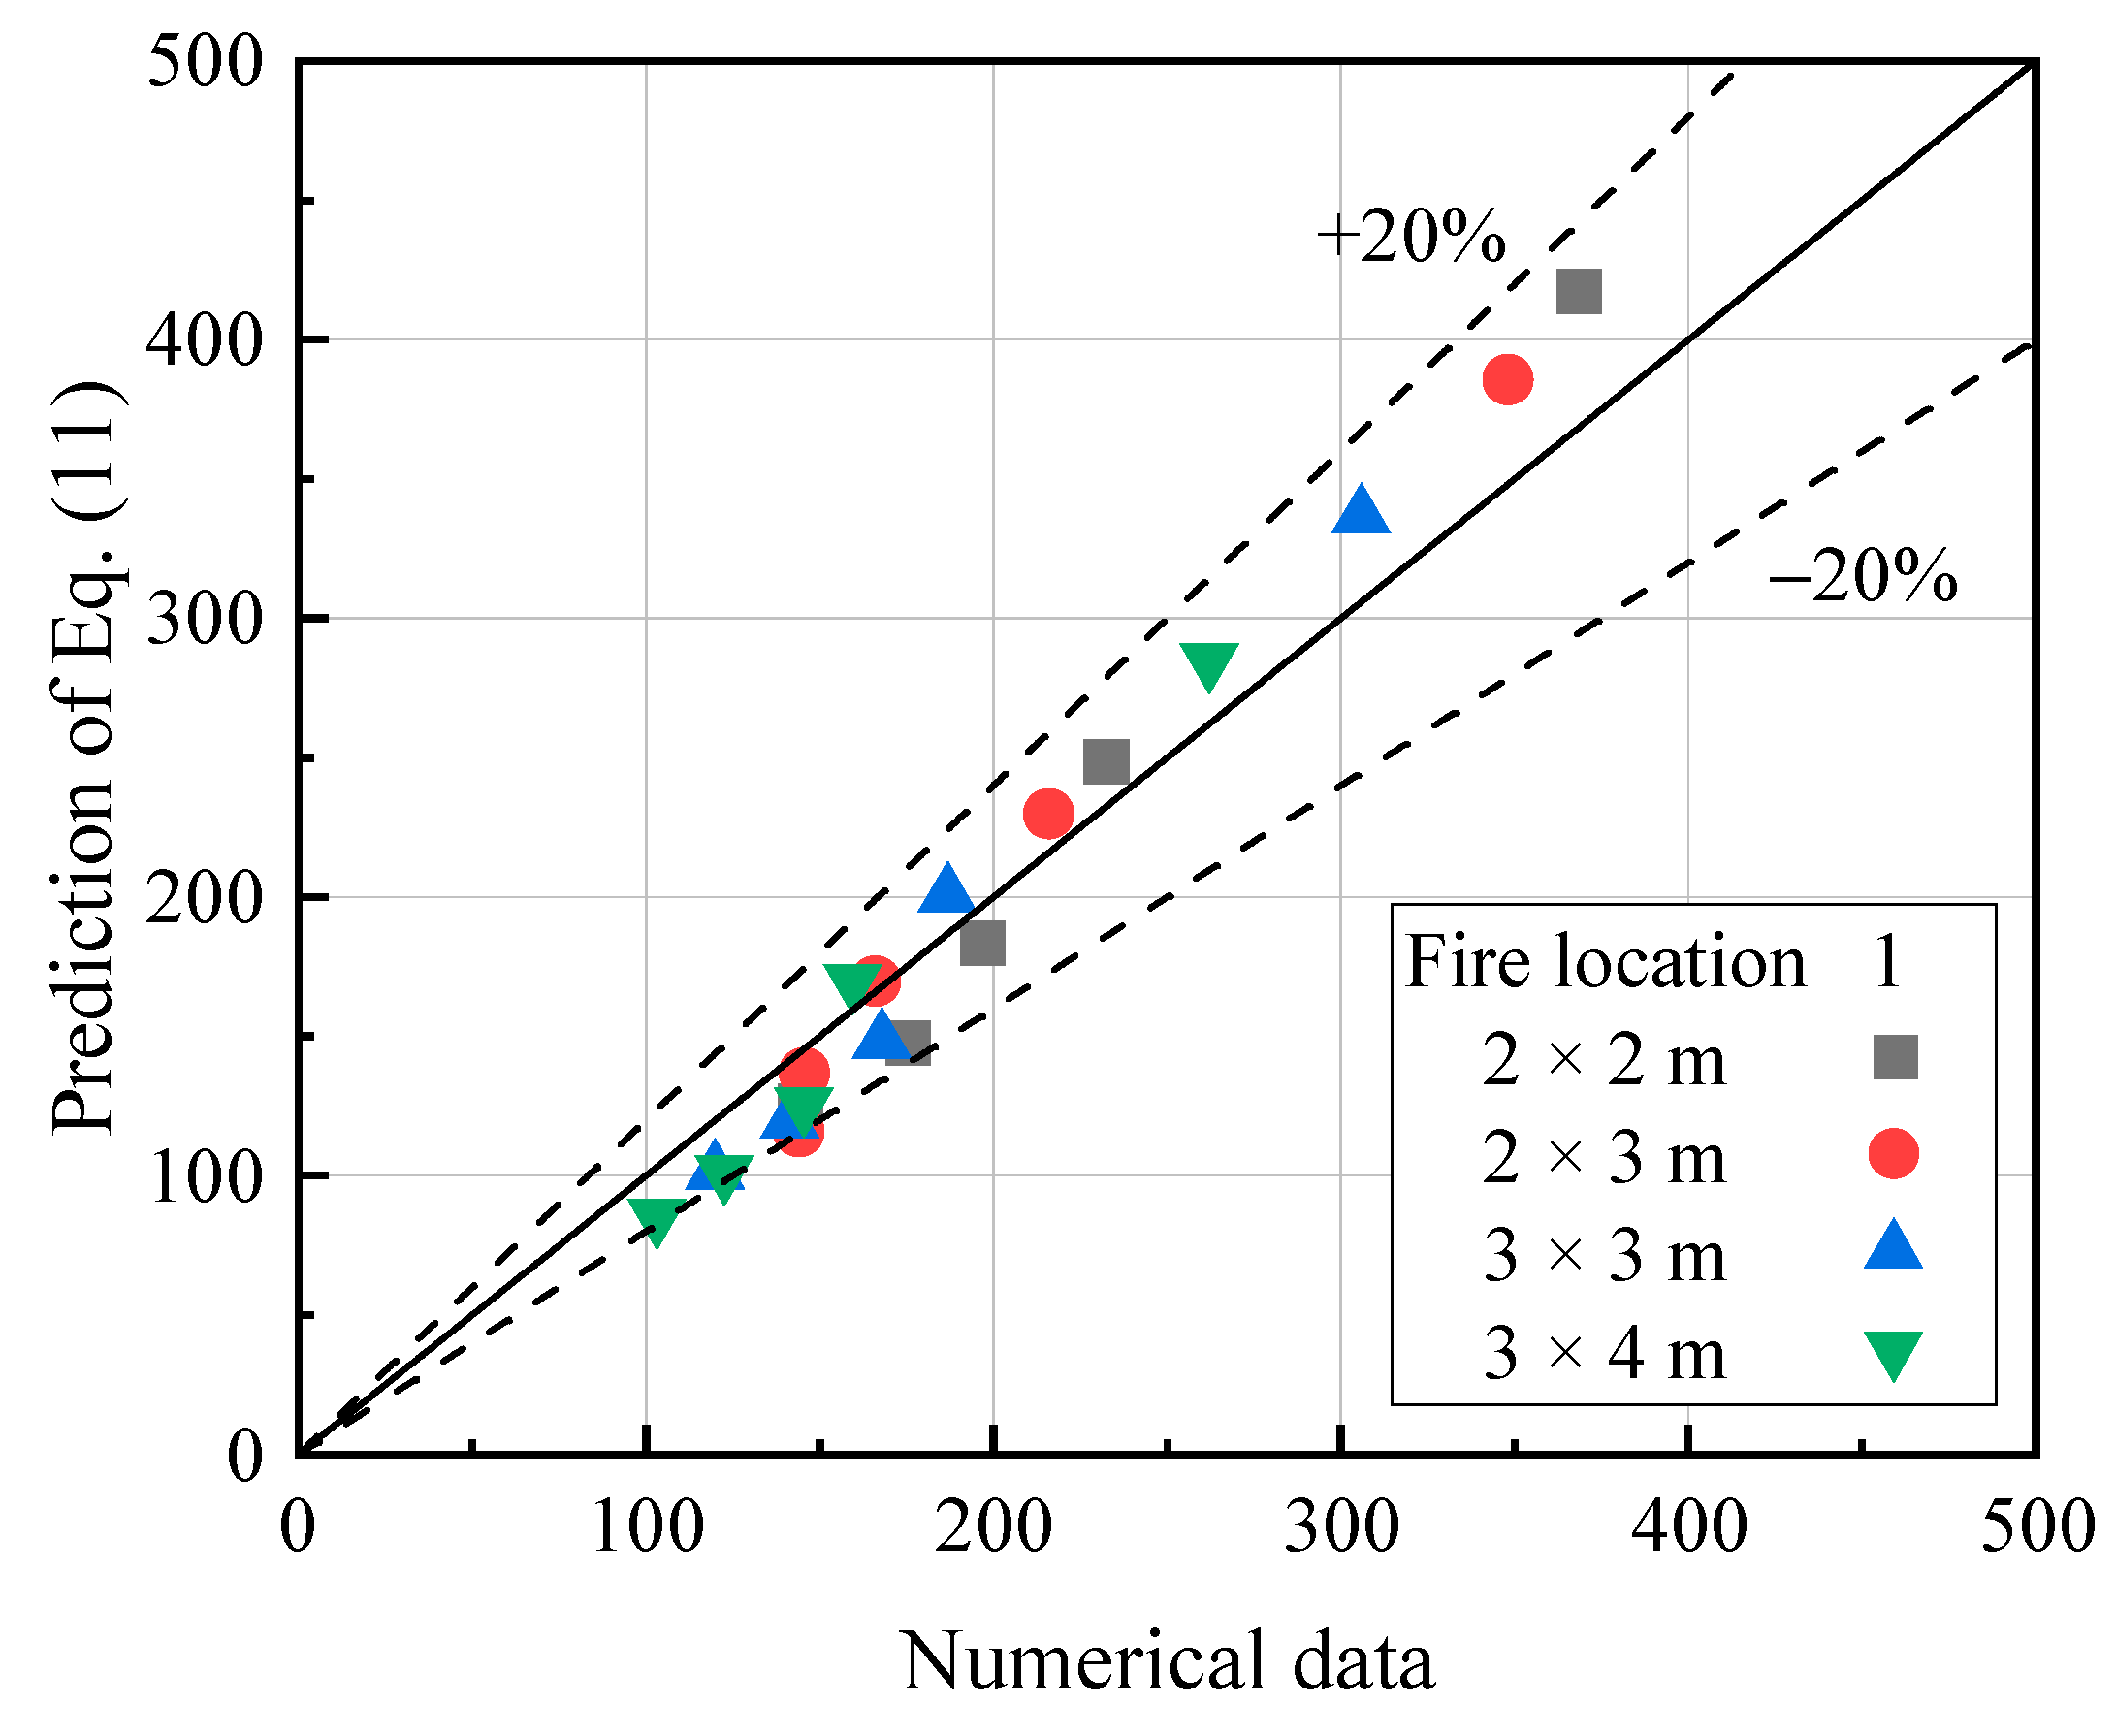
Figure 9 presents the comparison between the proposed formula (Equation (11)) and the numerical results. It can be seen that the calculated values show good agreement with the data.
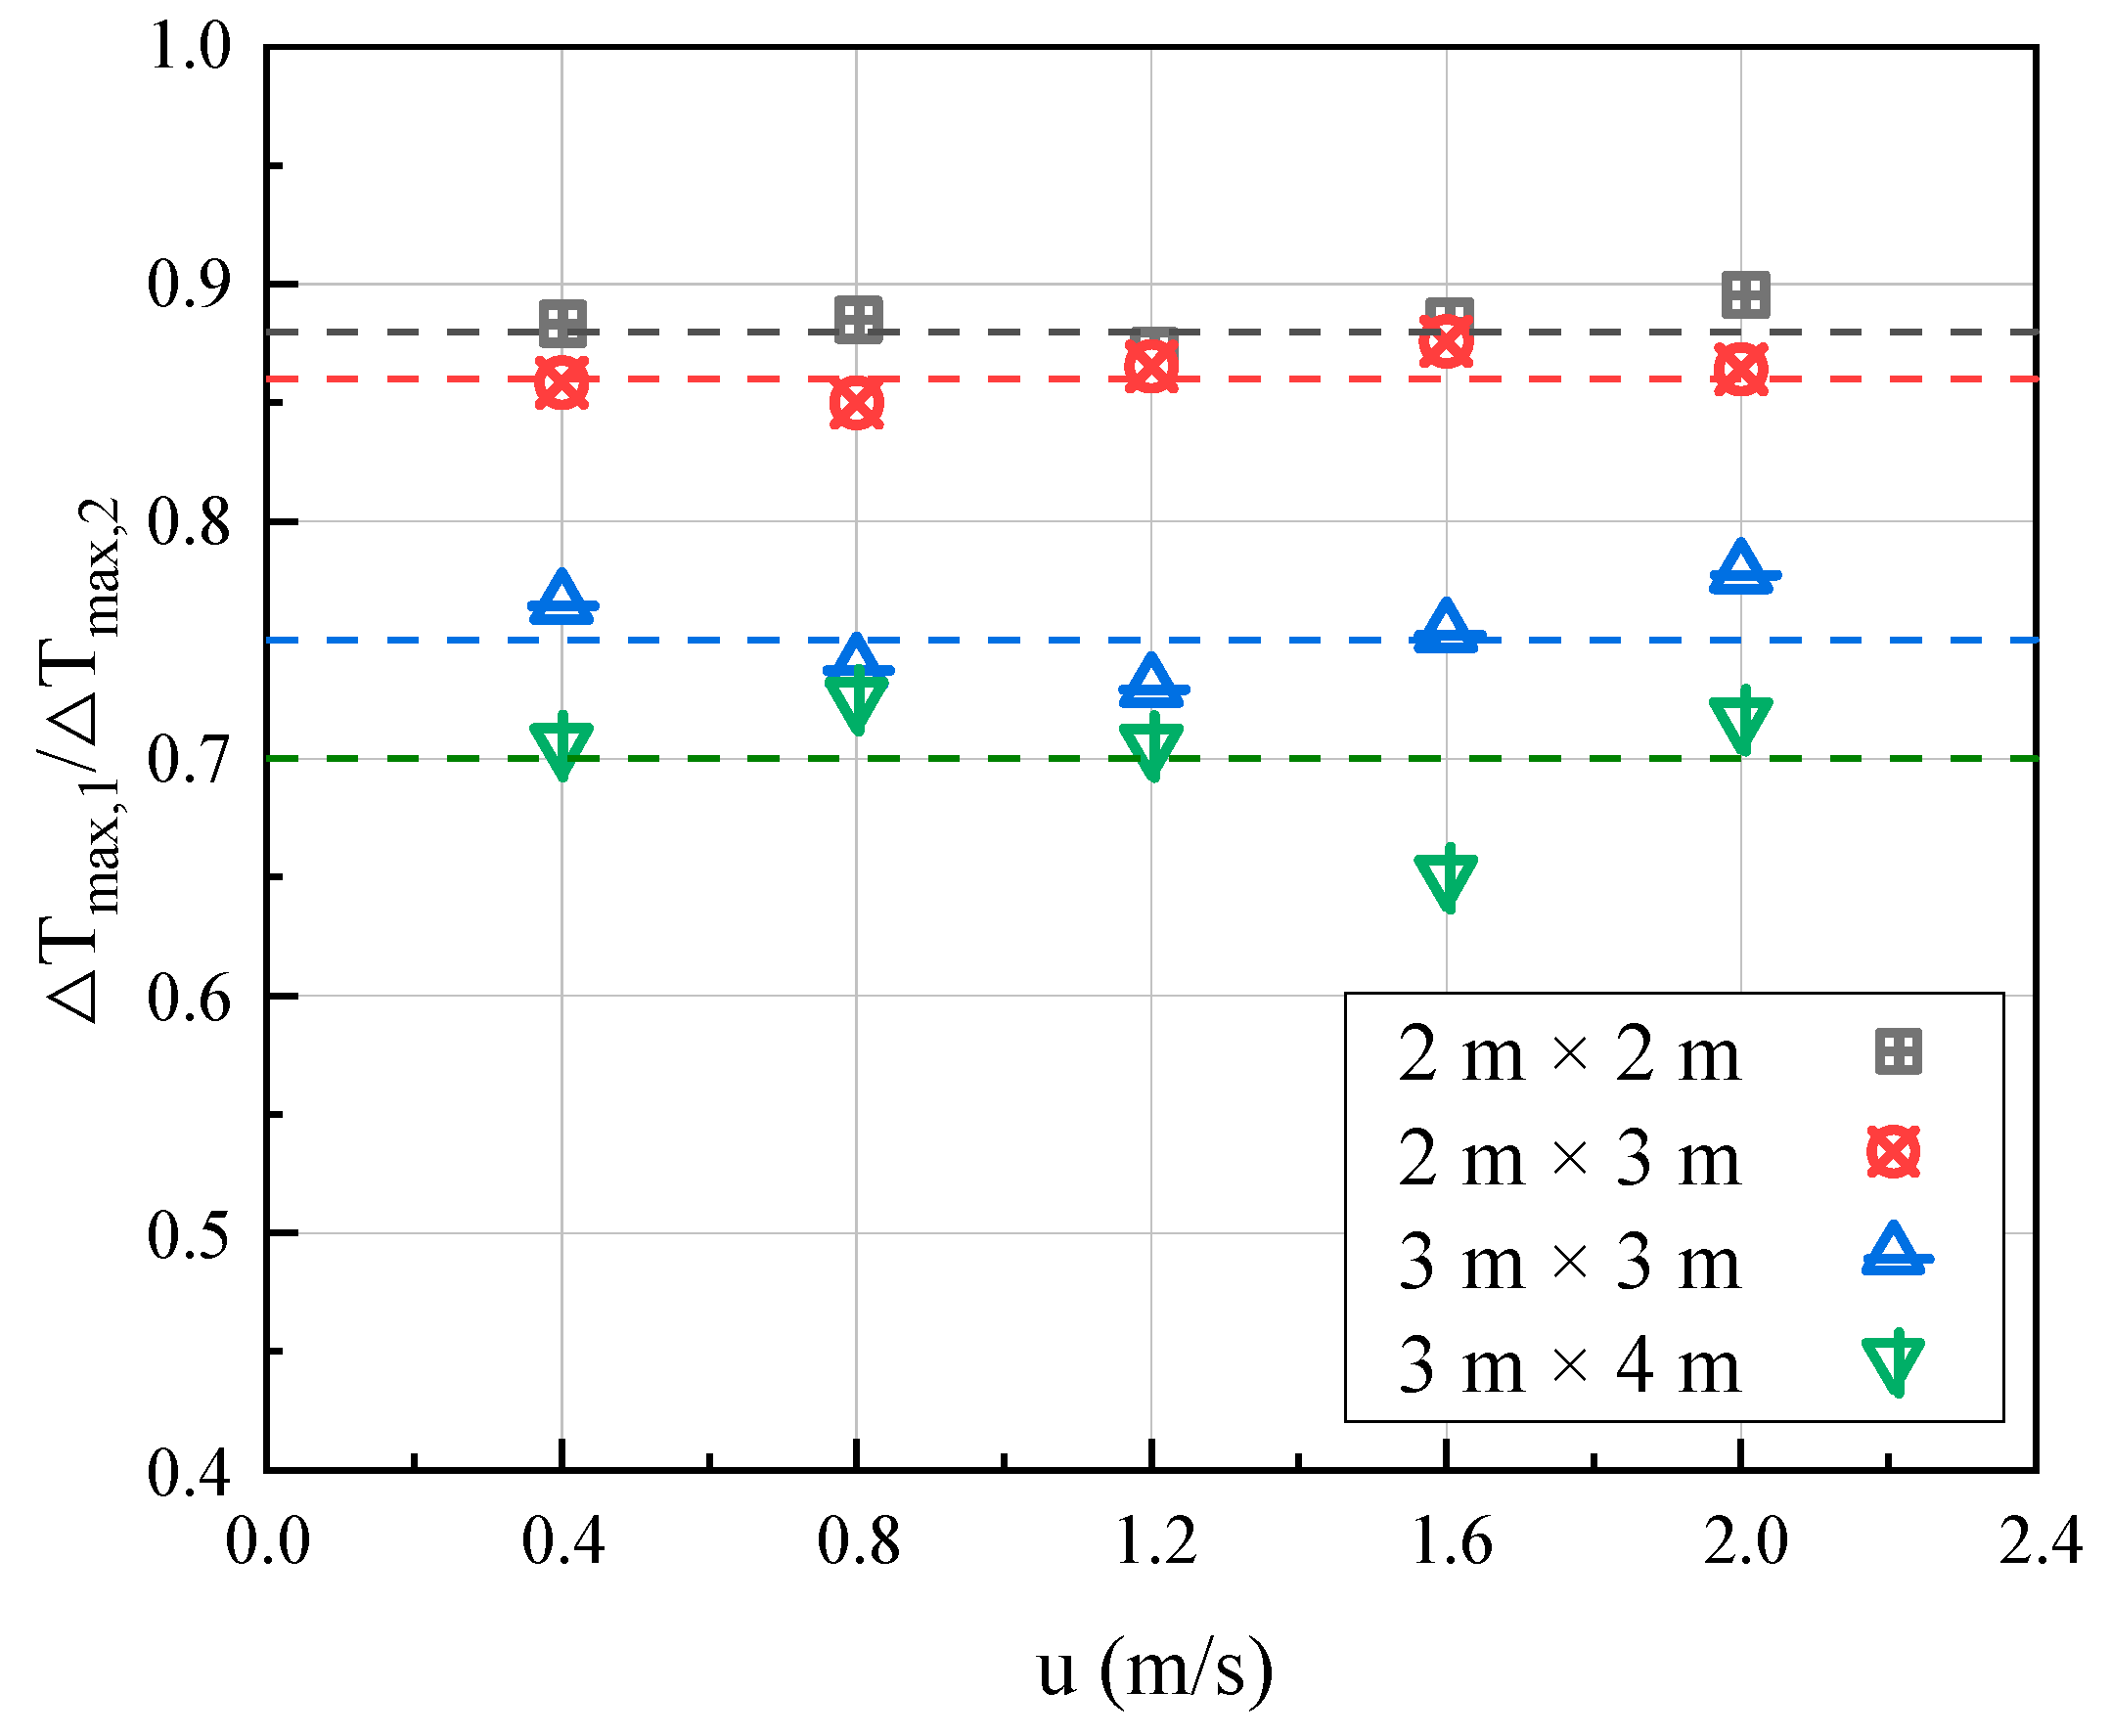
As can be seen from the results shown in Figure 10, the proportion of the maximum temperature rise at fire locations 1 and 2 decreases as the cross-sectional area of the obstruction increases. It can be seen that the blocking rate has a significant effect on the maximum temperatures induced by the two different fire locations; namely, as the blocking rate increases, the temperature at fire location 1 decreases more significantly. At the same time, the increase in the longitudinal ventilation rate, albeit causing some fluctuations in the maximum temperature rise, generally conforms to the horizontal fitting trend. It is noteworthy that a significant decrease in the proportion is observed when the height of the blockage changes from 2 m to 3 m. This highlights the fact that the height of the blockage, rather than its width, has a stronger impact on the temperature in a vehicle fire that occurs in the side lane.
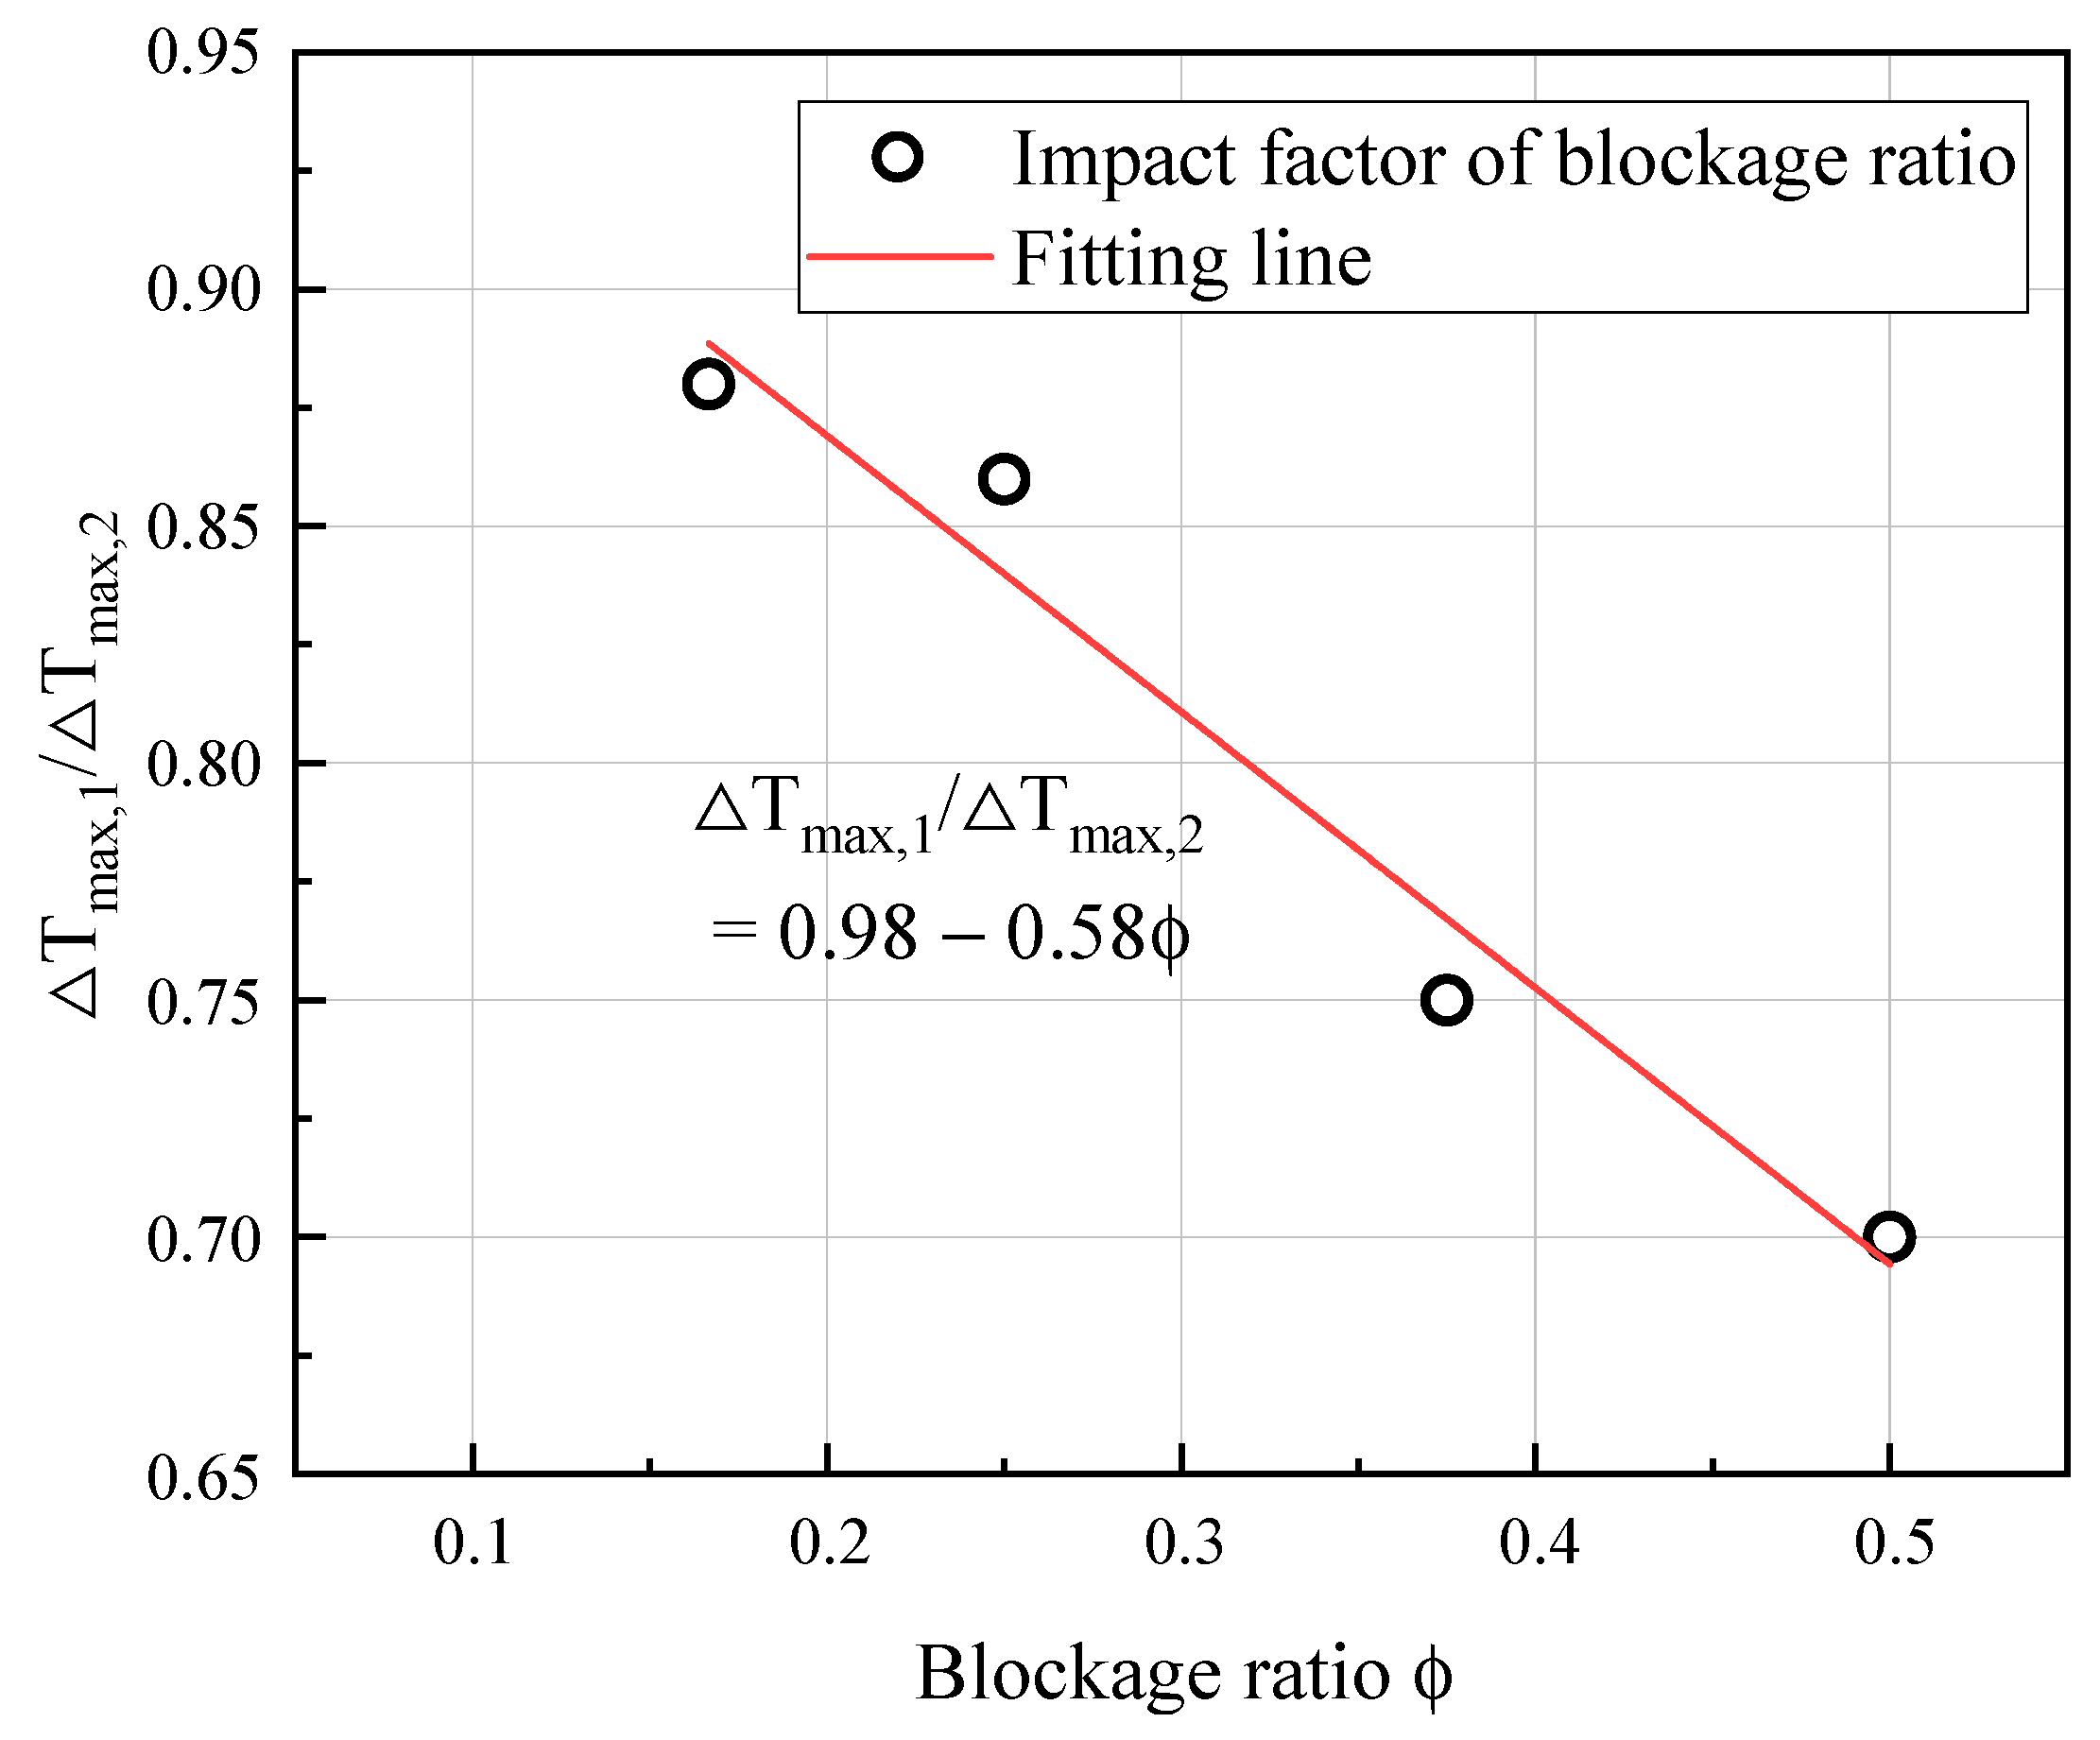
Based on the values of the horizontal fit in Figure 10, the relationship between the Δ T m a x , 1 Δ T m a x , 2 and the blockage ratio is correlated in Figure 11.
Δ T m a x , 1 Δ T m a x , 2 = 0.98 0.58 ϕ
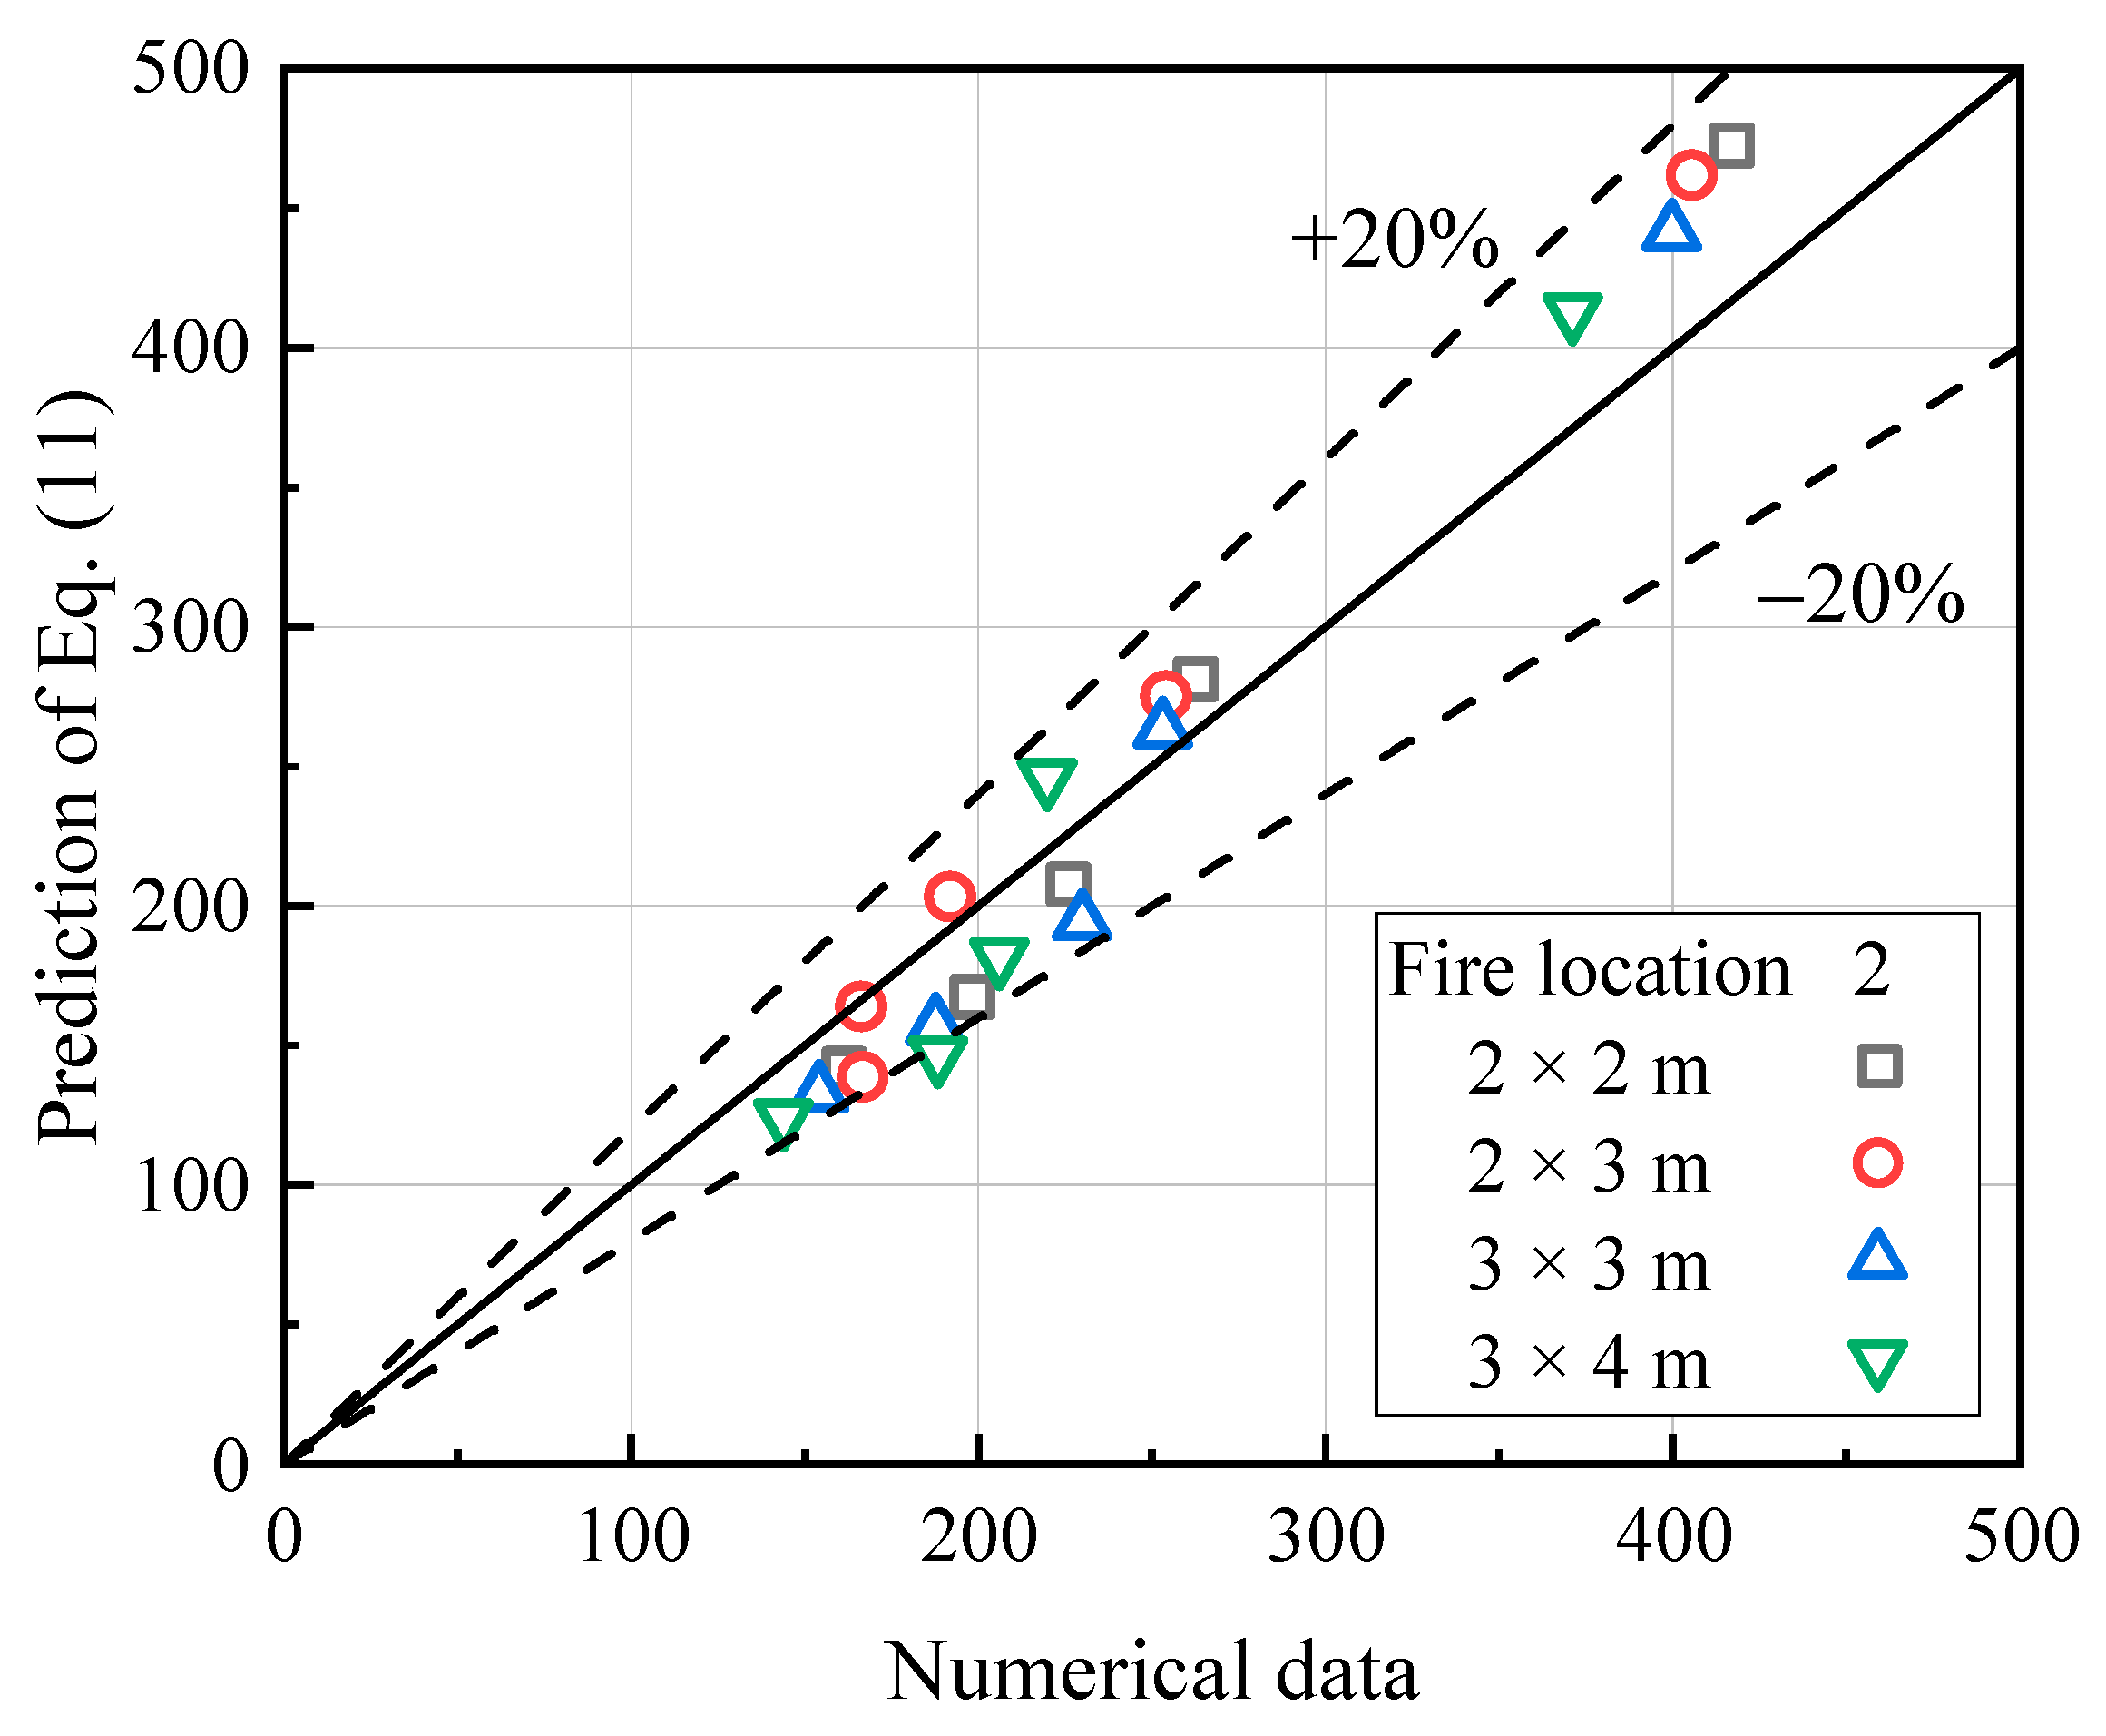
Combining Equations (11) and (12), the prediction model for the maximum temperature rise in a side-lane vehicle fire versus the numerical results is shown in Figure 12, and the error is within an acceptable range.

3.3. Back-Layering Length

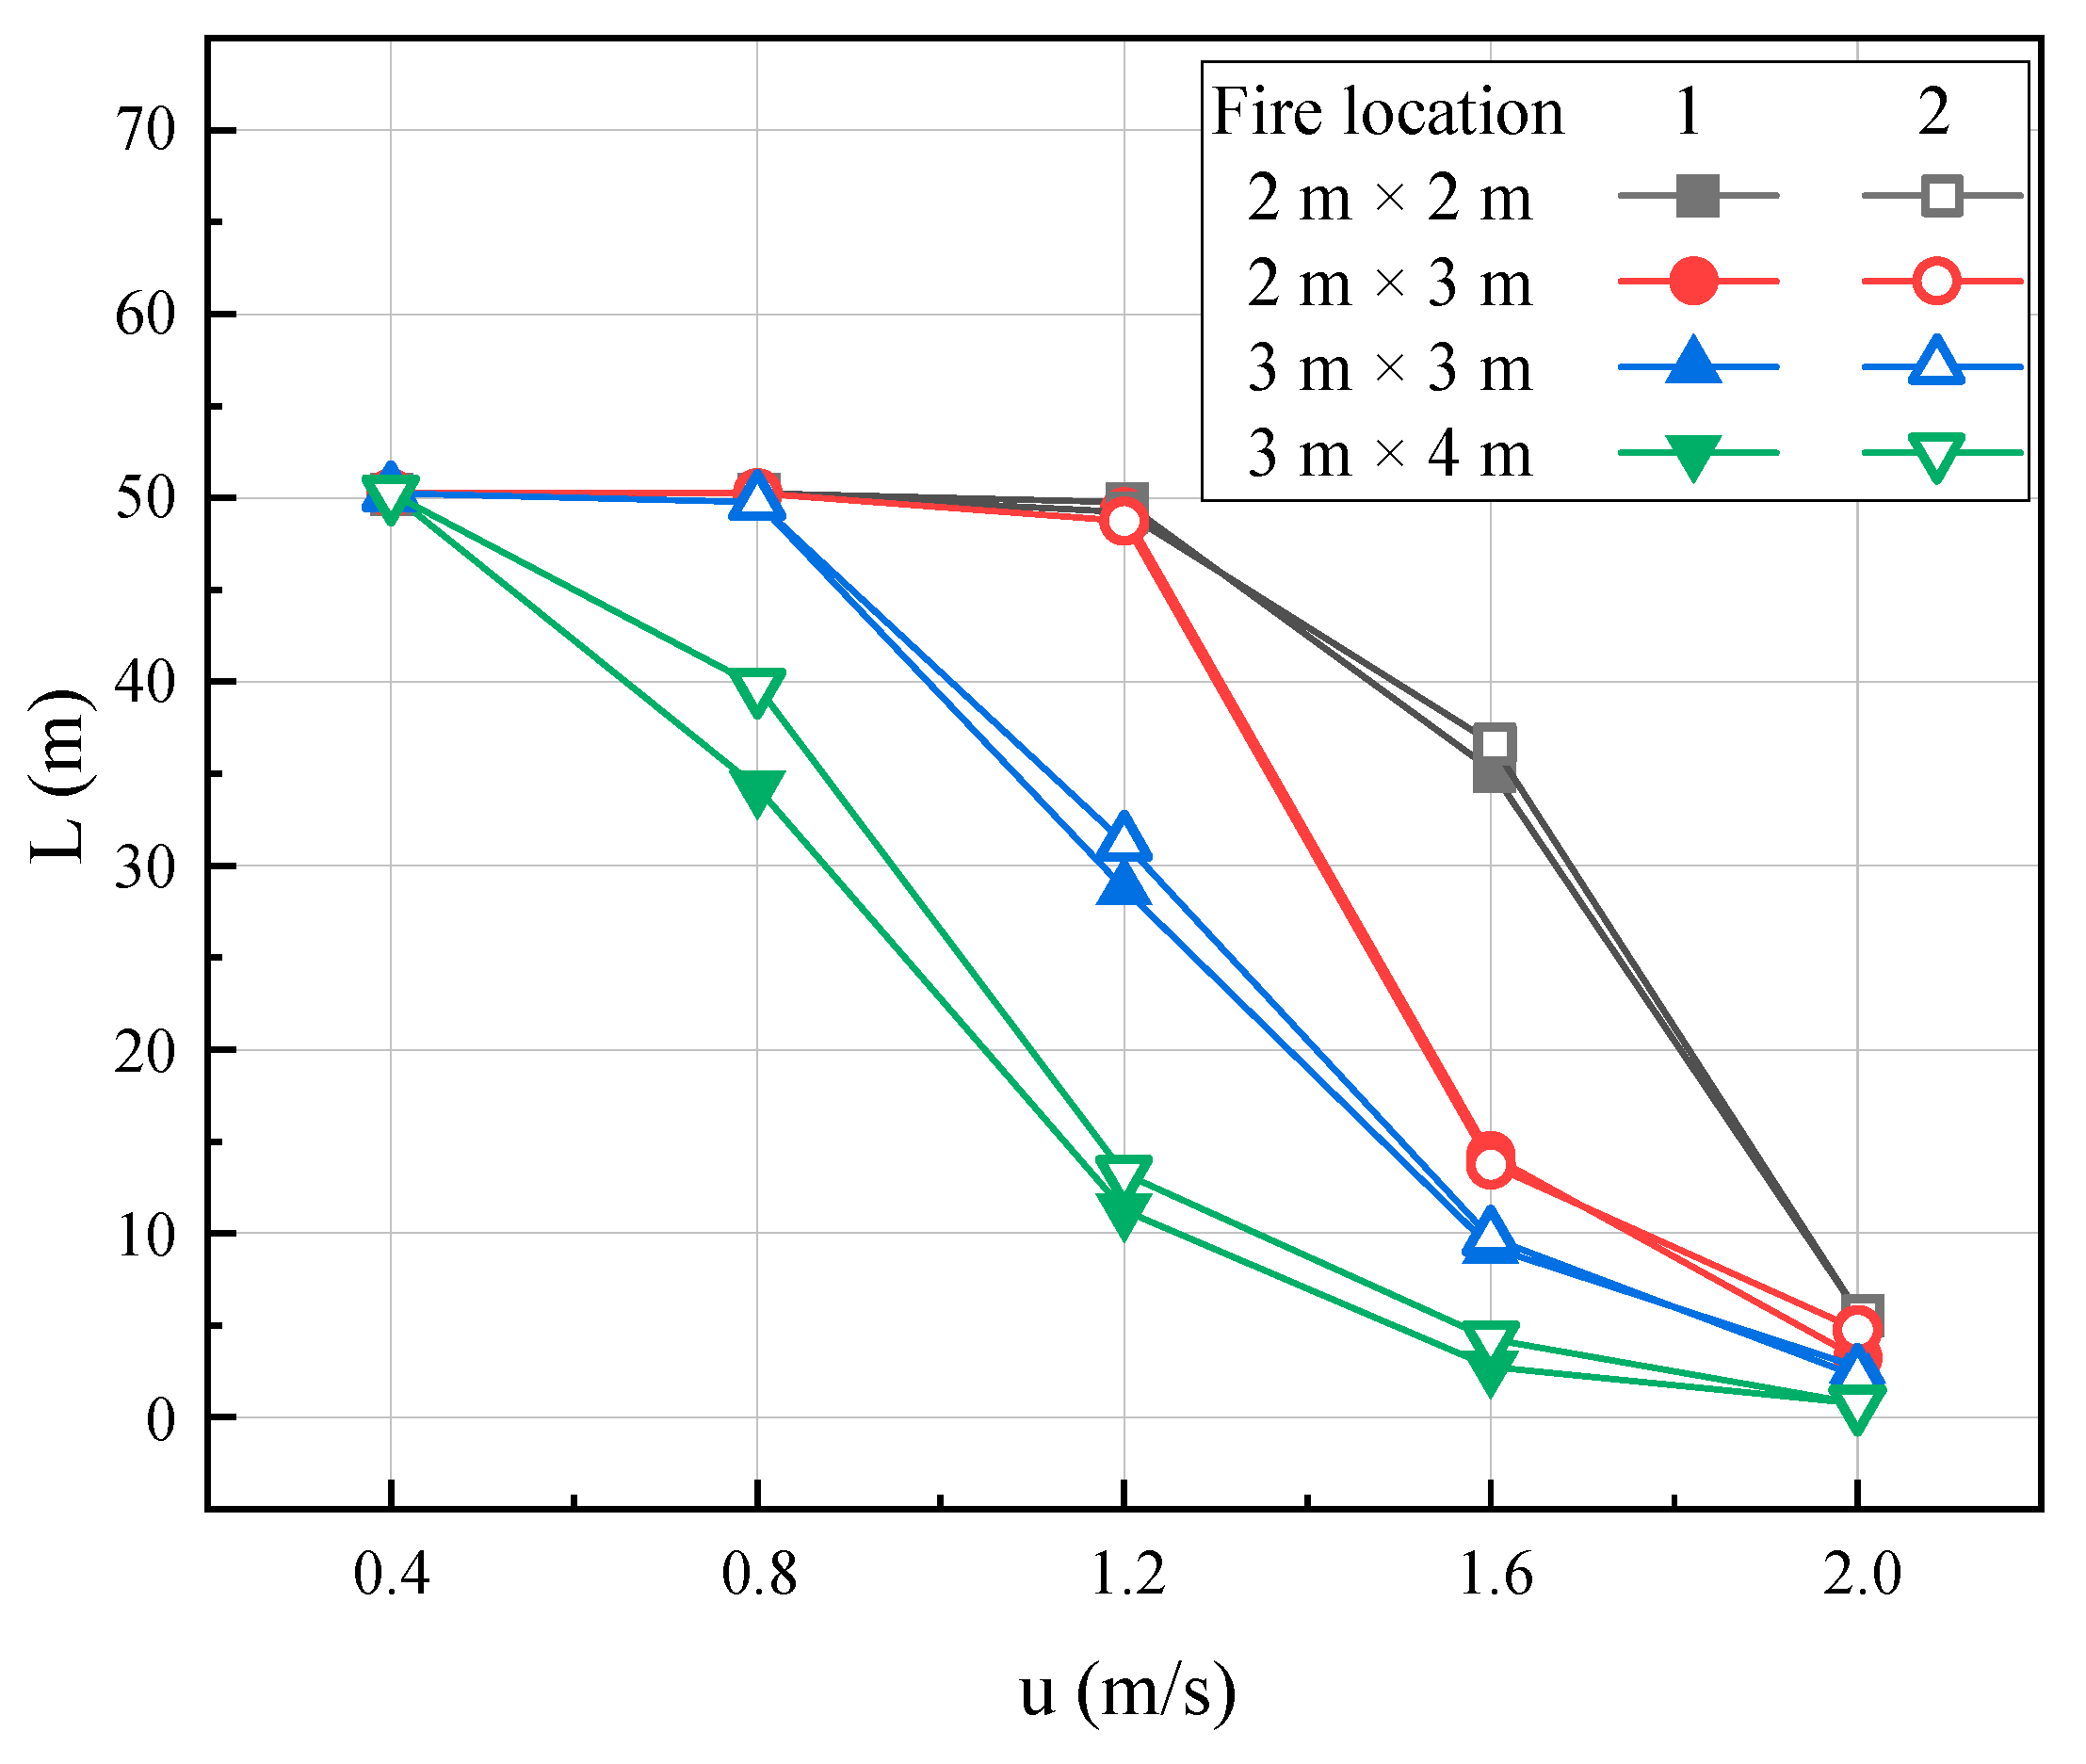
The length of the back-layering, denoted as L , is a crucial factor in determining the success rate of evacuation for trapped individuals, and the presence of blockages has a direct impact on the smoke backflow [27,29,34,47,60]. As demonstrated in Figure 8, which displays the longitudinal temperature distribution, the point at which the temperature begins to drop gradually is considered as the front of the back-layering smoke flow.
In Figure 13, it can be seen that the smoke in certain cases already reaches the upstream tunnel portal, and the back-layering length decreases with the increasing blockage ratio at a fixed ventilation velocity. This can be attributed to the acceleration of local ventilation caused by the increase in the blockage rate, which results in less smoke flowing upstream. Additionally, there is little difference in the smoke back-layering length between vehicle fires in different lanes.
Li et al. [61] investigated the following relationship between the dimensionless back-layering length and the ventilation velocity in tunnels without blockages.
L * = L H l n Q ˙ * 1 / 3 u *
u * = u g H
Since the effect of blockages on the smoke flow is mainly attributed to the change in the local ventilation velocity [27,34,60], herein, the dimensionless back-layering length considering the local ventilation velocity is obtained as in Equation (15).
L * l n Q ˙ * 1 / 3 u l o c a l *
u l o c a l * = u * 1 ϕ
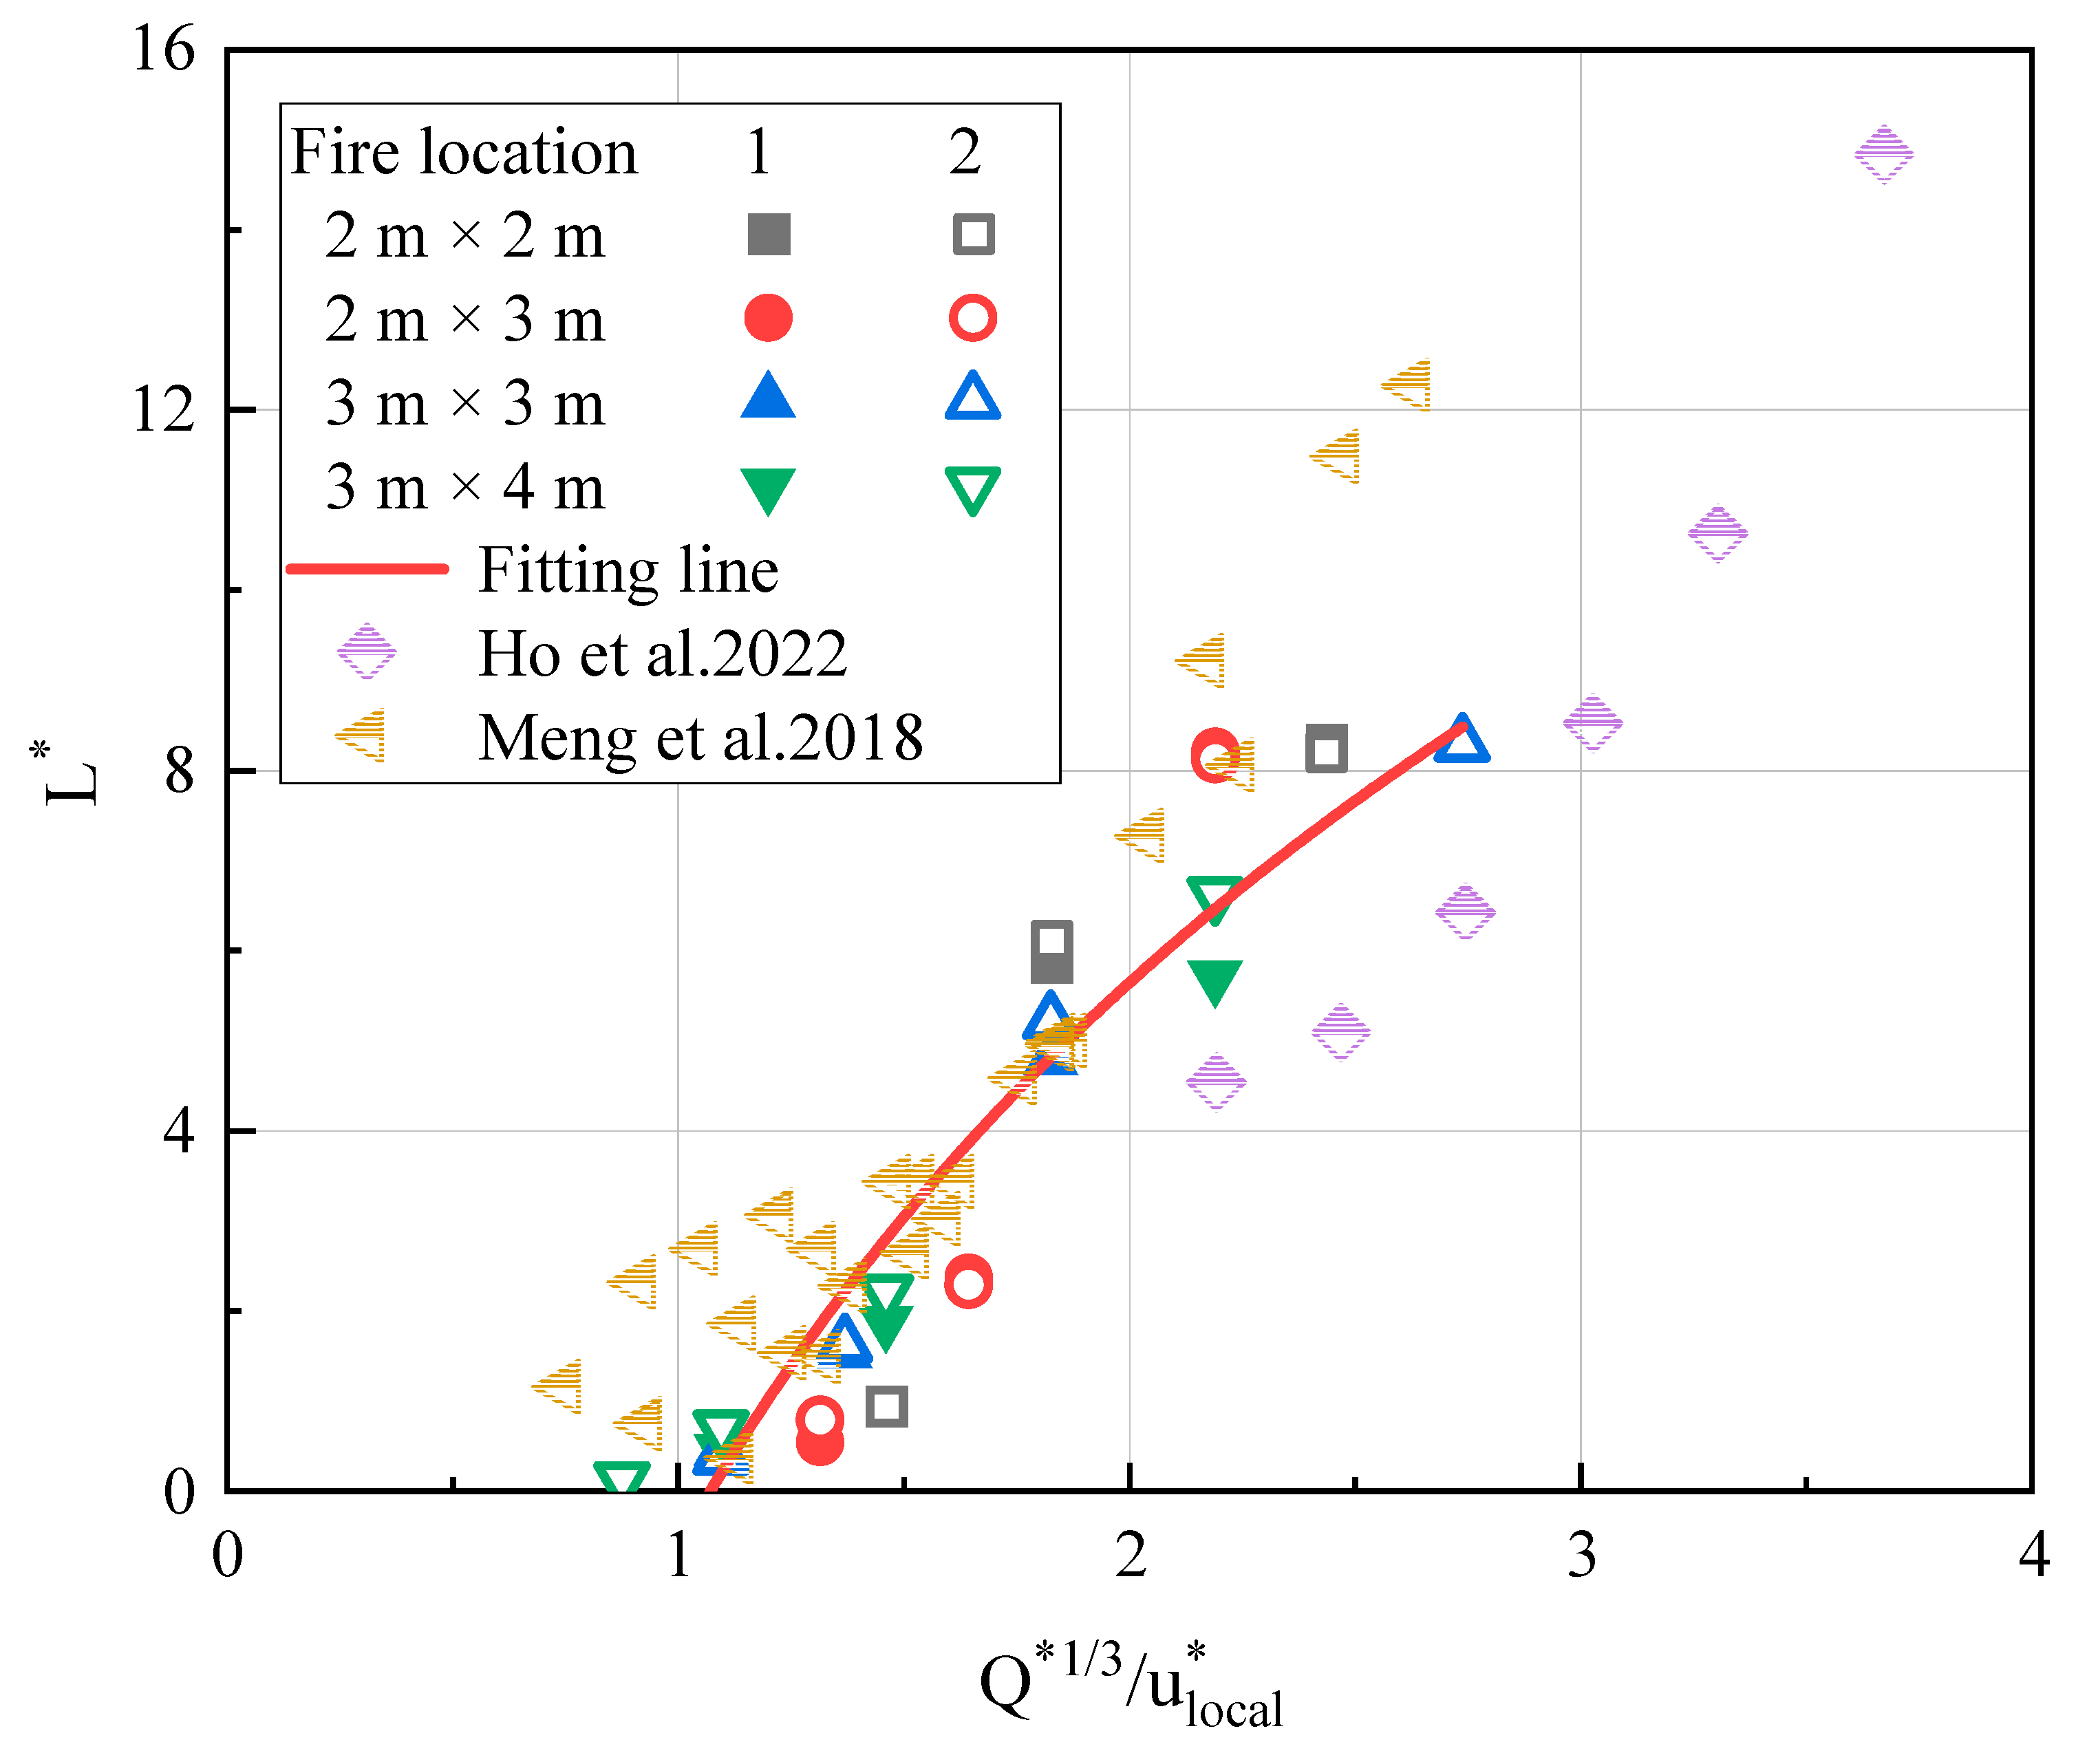
In Figure 14, the dimensionless back-layering length is plotted against Q ˙ * 1 / 3 / u l o c a l * and the cases where the smoke flows out of the upstream tunnel portal are excluded.
L * = 9.04 l n 0.93 Q ˙ * 1 / 3 u l o c a l *
We conducted a comparison between our study and the two-lane blockage fire scenarios investigated by Ho et al. [47]. Discrepancies were observed, particularly when Q ˙ * 1 / 3 / u l o c a l * was higher. These variations can be attributed to the differing blockage conditions in the respective studies. Despite the limited data available from their research, we managed to identify a similar trend by comparing the results, albeit with some deviations. We also compared the blockage ratios of 0.13, 0.18, 0.26, 0.39, and 0.51 at 56.1 kW from Meng et al. [27]’s experiment. It can be seen that, overall, the data are more similar, but the deviations become larger when the wind speed is higher, which may be attributed to the transverse multi-blockages used in this study.
Here, we focused on the condition of a transverse carriage blockage in a three-lane road tunnel. Further research is needed to explore the impact of different heat release rates and longer back-layering lengths on the smoke behavior in vehicle fires in multi-lane tunnels. This will help to provide a more comprehensive understanding of the dynamics of the smoke and heat spread in such environments, which is crucial for the development of effective fire safety strategies.

4. Conclusions

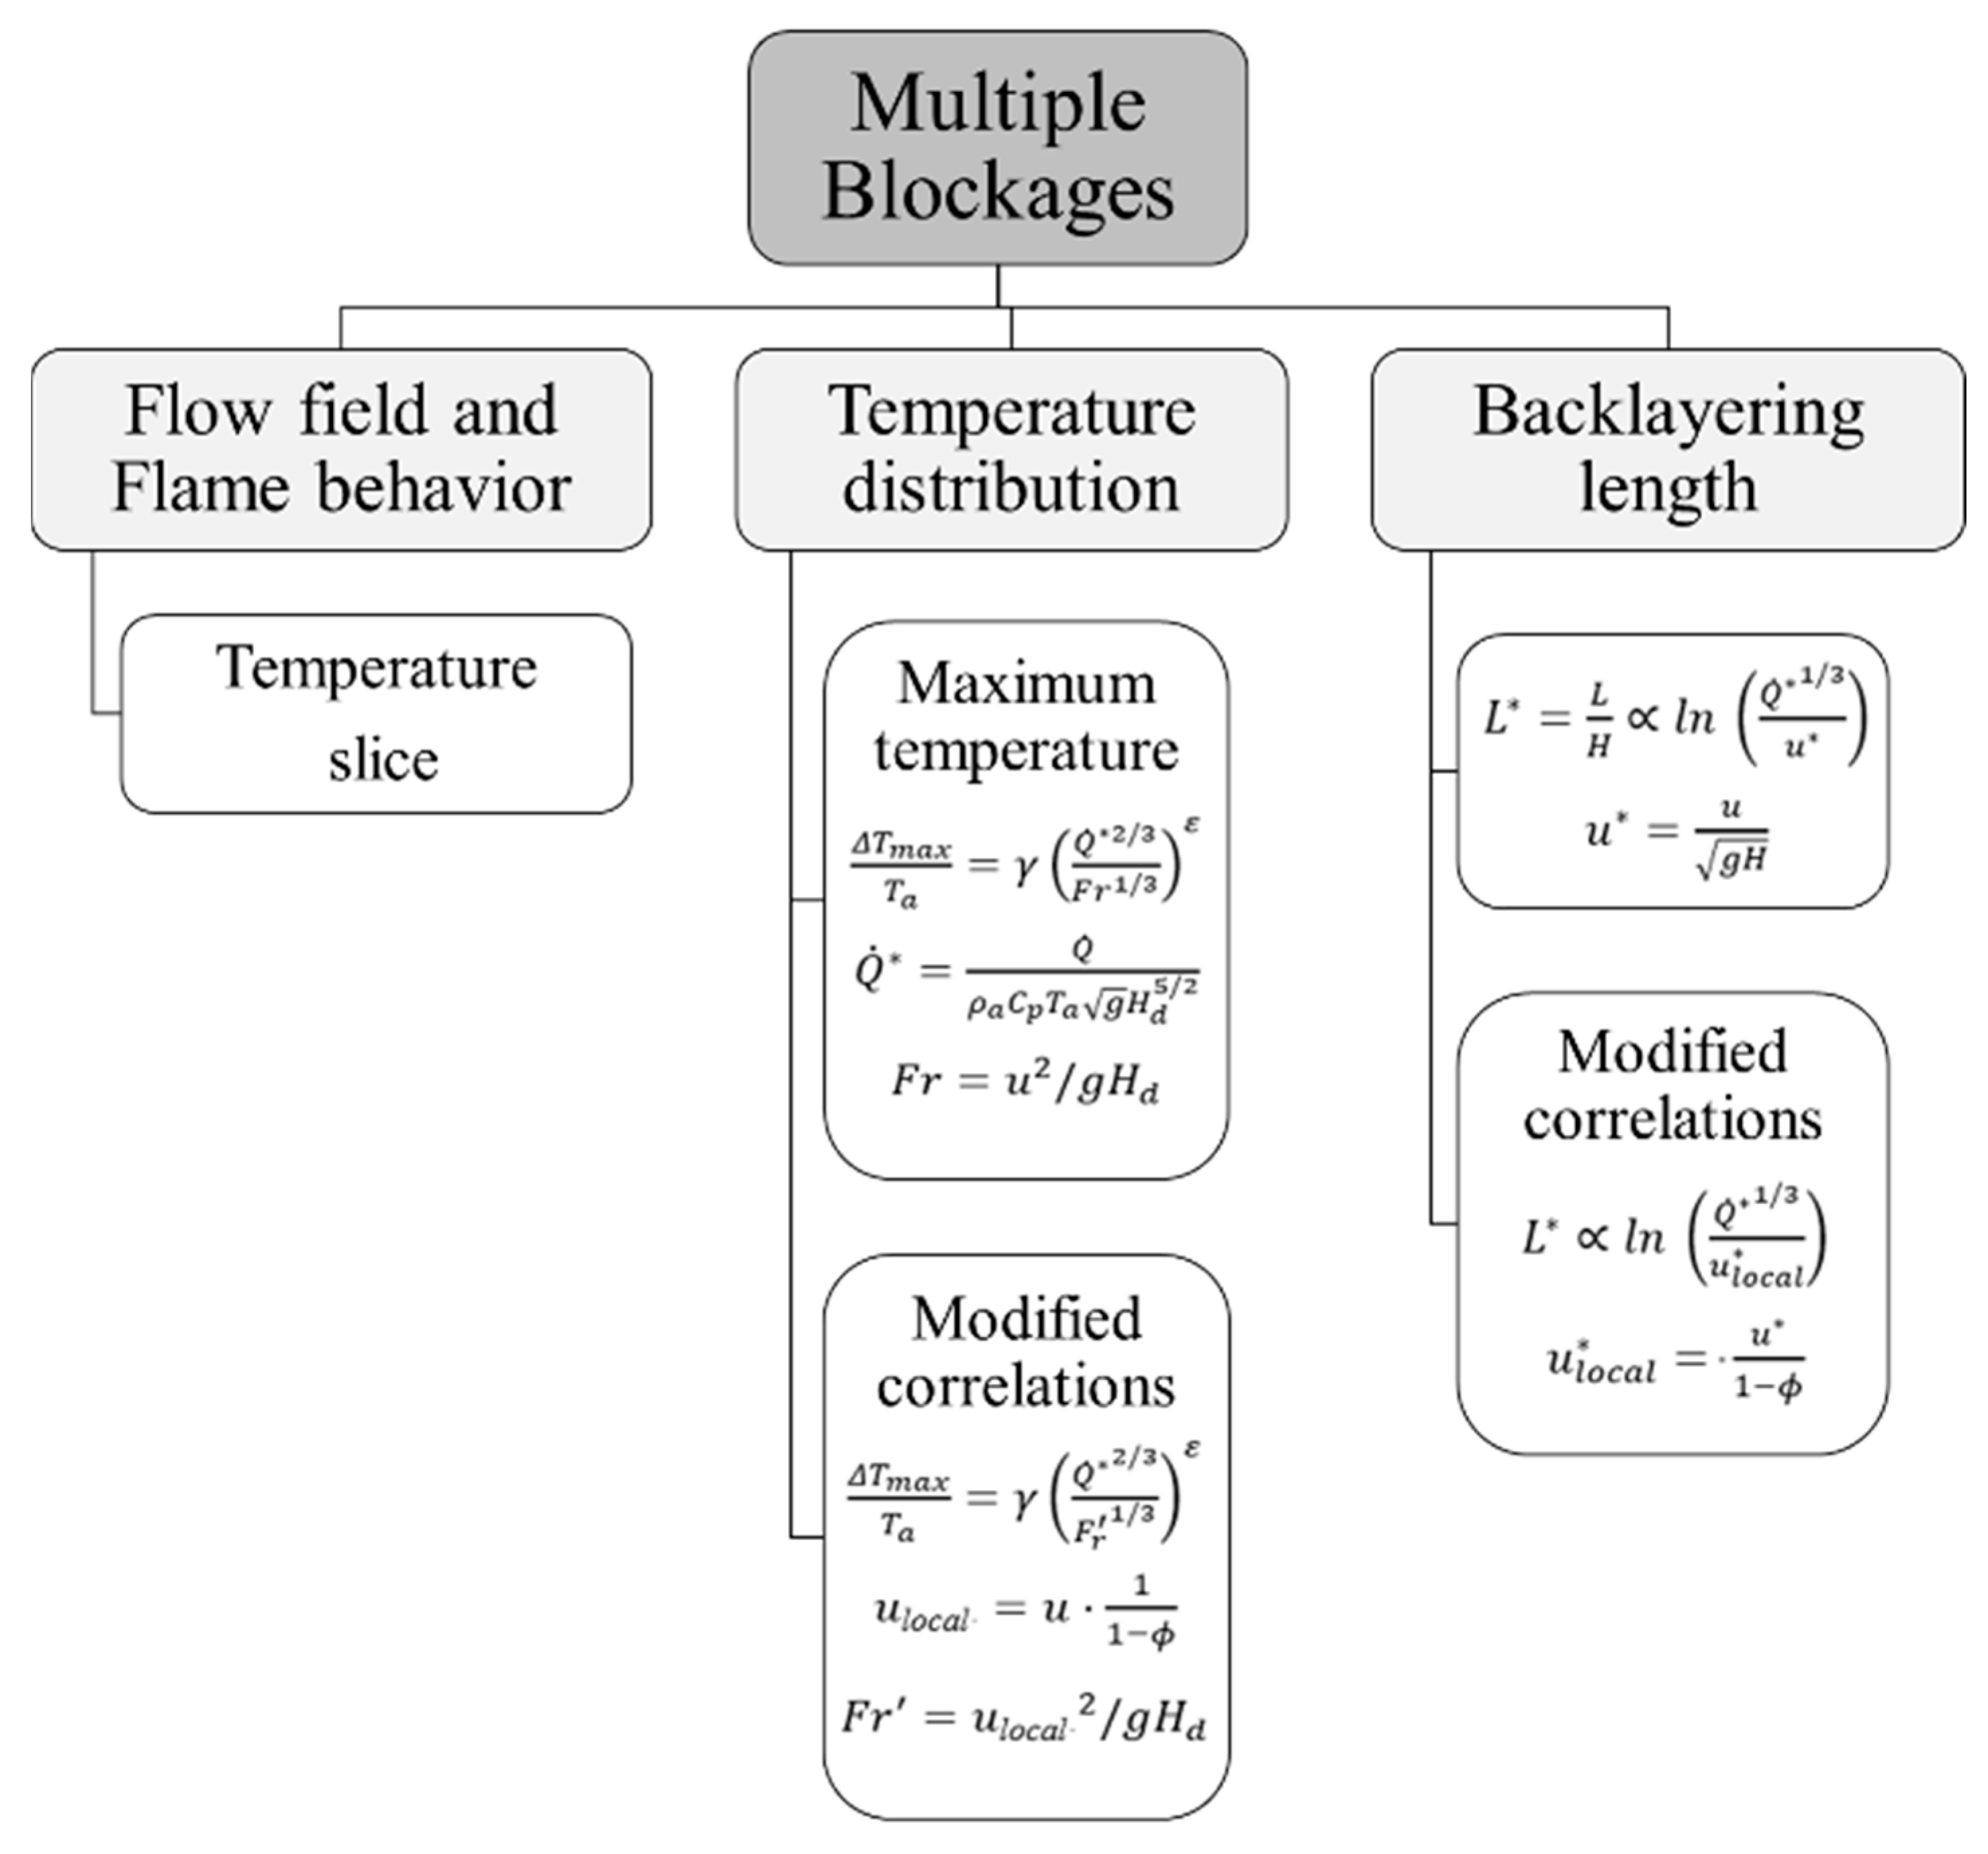
A comprehensive numerical simulation study was conducted to examine the impact of blockages of various sizes on three-lane tunnel fires. The flow fields of the near-fire regions were analyzed, and thorough assessments were performed on the maximum temperature and smoke back-layering length. The methods used in this study are shown in Figure 15. The following are the key results of the study.
  • As the ventilation velocity increases, the bifurcation angle of the flame increases and the back-layering length decreases. Meanwhile, the recirculation region expands with the increase in the blockage ratio. It is important to note that the flame in the side lane leans towards the sidewall due to lower pressure.
  • The fires in the side lane have higher maximum temperatures compared to those in the middle lane. Furthermore, the temperature distribution under the tunnel ceiling for both fire locations presents similar patterns, excluding the near-fire region. A new formula for the prediction of the maximum temperature rise of middle-lane vehicle fires was proposed and its correlation with the side-lane case was analyzed.
  • A modified correlation for the smoke back-layering length in three-blockage longitudinal ventilated tunnels was established, which is closely related to the local ventilation velocity (blockage ratio). Further research is required to explore cases with various heat release rates and longer back-layering lengths.
  • It is worth noting that we only considered three-lane road tunnel fires in this study. For tunnel fire scenarios with more lanes and more complex blockages, further research is needed in the future.

Author Contributions

Conceptualization, H.Z.; methodology, H.Z.; formal analysis, B.M.; investigation, Z.W.; resources, H.Z.; data curation, Z.W.; writing—original draft preparation, H.Z; writing—review and editing, H.Z; visualization, F.D.; supervision, F.D.; project administration, J.O.; funding acquisition, J.O. All authors have read and agreed to the published version of the manuscript.

Funding

This work was supported by the National Natural Science Foundation of China (51974305). We sincerely appreciate this support.

Institutional Review Board Statement

Not applicable.

Informed Consent Statement

Not applicable.

Data Availability Statement

Data are contained within the article.

Conflicts of Interest

Authors Fengqiang Dai and Zhengfei Wu were employed by the company China Coal Technology & Engineering Xi’an Research Institute (Group) Co. The remaining authors declare that the research was conducted in the absence of any commercial or financial relationships that could be construed as a potential conflict of interest. The China Coal Technology & Engineering Xi’an Research Institute (Group) Co. had no role in the design of the study; in the collection, analyses, or interpretation of data; in the writing of the manuscript, or in the decision to publish the results.

References

  1. Jeon, G.; Hong, W. Characteristic Features of the Behavior and Perception of Evacuees from the Daegu Subway Fire and Safety Measures in an Underground Fire. J. Asian Archit. Build. Eng. 2009, 8, 415–422. [Google Scholar] [CrossRef]
  2. Vuilleumier, F.; Weatherill, A.; Crausaz, B. Safety aspects of railway and road tunnel: Example of the Lötschberg railway tunnel and Mont-Blanc road tunnel. Tunn. Undergr. Space Technol. 2002, 17, 153–158. [Google Scholar] [CrossRef]
  3. Leitner, A. The fire catastrophe in the Tauern Tunnel: Experience and conclusions for the Austrian guidelines. Tunn. Undergr. Space Technol. 2001, 16, 217–223. [Google Scholar] [CrossRef]
  4. Ingason, H.; Li, Y.Z.; Lönnermark, A. Tunnel Fire Dynamics; Springer: New York, NY, USA, 2015; ISBN 978-1-4939-2198-0. [Google Scholar]
  5. Beard, A.; Carvel, R. The Handbook of Tunnel Fire Safety; Thomas Telford Publishing: London, UK, 2005; ISBN 978-0-7277-3875-2. [Google Scholar]
  6. aofst_6.pdf. Available online: https://publications.iafss.org/publications/aofst/6/s-5/view/aofst_6.pdf (accessed on 31 October 2023).
  7. Li, Y.Z.; Ingason, H. Overview of research on fire safety in underground road and railway tunnels. Tunn. Undergr. Space Technol. 2018, 81, 568–589. [Google Scholar] [CrossRef]
  8. Hietaniemi, J.; Kallonen, R.; Mikkola, E. Burning characteristics of selected substances: Production of heat, smoke and chemical species. Fire Mater. 1999, 23, 171–185. [Google Scholar] [CrossRef]
  9. Hu, L.H.; Tang, F.; Yang, D.; Liu, S.; Huo, R. Longitudinal distributions of CO concentration and difference with temperature field in a tunnel fire smoke flow. Int. J. Heat Mass Transf. 2010, 53, 2844–2855. [Google Scholar] [CrossRef]
  10. Ji, J.; Fan, C.G.; Zhong, W.; Shen, X.B.; Sun, J.H. Experimental investigation on influence of different transverse fire locations on maximum smoke temperature under the tunnel ceiling. Int. J. Heat Mass Transf. 2012, 55, 4817–4826. [Google Scholar] [CrossRef]
  11. Gao, Z.H.; Liu, Z.X.; Wan, H.X.; Zhu, J.P. Experimental study on longitudinal and transverse temperature distribution of sidewall confined ceiling jet plume. Appl. Therm. Eng. 2016, 107, 583–590. [Google Scholar] [CrossRef]
  12. Hu, L.H.; Chen, L.F.; Wu, L.; Li, Y.F.; Zhang, J.Y.; Meng, N. An experimental investigation and correlation on buoyant gas temperature below ceiling in a slopping tunnel fire. Appl. Therm. Eng. 2013, 51, 246–254. [Google Scholar] [CrossRef]
  13. Yao, Y.; He, K.; Peng, M.; Shi, L.; Cheng, X. The maximum gas temperature rises beneath the ceiling in a longitudinal ventilated tunnel fire. Tunn. Undergr. Space Technol. 2021, 108, 103672. [Google Scholar] [CrossRef]
  14. Peng, M.; Cheng, X.; He, K.; Cong, W.; Shi, L.; Yuen, R. Experimental study on ceiling smoke temperature distributions in near field of pool fires in the subway train. J. Wind Eng. Ind. Aerodyn. 2020, 199, 104135. [Google Scholar] [CrossRef]
  15. Tang, F.; Cao, Z.; Palacios, A.; Wang, Q. A study on the maximum temperature of ceiling jet induced by rectangular-source fires in a tunnel using ceiling smoke extraction. Int. J. Therm. Sci. 2018, 127, 329–334. [Google Scholar] [CrossRef]
  16. Li, Y.Z.; Lei, B.; Ingason, H. The maximum temperature of buoyancy-driven smoke flow beneath the ceiling in tunnel fires. Fire Saf. J. 2011, 46, 204–210. [Google Scholar] [CrossRef]
  17. Li, Y.Z.; Ingason, H. The maximum ceiling gas temperature in a large tunnel fire. Fire Saf. J. 2012, 48, 38–48. [Google Scholar] [CrossRef]
  18. Wang, H.F.; Zhou, Y. The finite-length square cylinder near wake. J. Fluid Mech. 2009, 638, 453–490. [Google Scholar] [CrossRef]
  19. Yen, S.C.; Liu, J.H. Wake flow behind two side-by-side square cylinders. Int. J. Heat Fluid Flow 2011, 32, 41–51. [Google Scholar] [CrossRef]
  20. Shanbhogue, S.J.; Husain, S.; Lieuwen, T. Lean blowoff of bluff body stabilized flames: Scaling and dynamics. Prog. Energy Combust. Sci. 2009, 35, 98–120. [Google Scholar] [CrossRef]
  21. Sohankar, A.; Norberg, C.; Davidson, L. Simulation of three-dimensional flow around a square cylinder at moderate Reynolds numbers. Phys. Fluids 1999, 11, 288–306. [Google Scholar] [CrossRef]
  22. Lyn, D.A.; Einav, S.; Rodi, W.; Park, J.-H. A laser-Doppler velocimetry study of ensemble-averaged characteristics of the turbulent near wake of a square cylinder. J. Fluid Mech. 1995, 304, 285–319. [Google Scholar] [CrossRef]
  23. Hu, L.H.; Zhao, X.Y.; Zhu, W.; Tang, F. An experimental investigation and characterization on flame bifurcation and leaning transition behavior of a pool fire in near wake of a square cylinder. Int. J. Heat Mass Transf. 2012, 55, 7024–7035. [Google Scholar] [CrossRef]
  24. Okaa, Y.; Atkinson, G.T. Control of Smoke Flow in Tunnel Fires. Fire Saf. J. 1995, 25, 305–322. [Google Scholar] [CrossRef]
  25. Li, L.; Cheng, X.; Cui, Y.; Li, S.; Zhang, H. Effect of blockage ratio on critical velocity in tunnel fires. J. Fire Sci. 2012, 30, 413–427. [Google Scholar] [CrossRef]
  26. Li, L.; Cheng, X.; Cui, Y.; Dong, W.; Mei, Z. Effect of blockage ratio on the maximum temperature under the ceiling in tunnel fires. J. Fire Sci. 2013, 31, 245–257. [Google Scholar] [CrossRef]
  27. Meng, N.; Liu, X.; Li, X.; Liu, B. Effect of blockage ratio on backlayering length of thermal smoke flow in a longitudinally ventilated tunnel. Appl. Therm. Eng. 2018, 132, 1–7. [Google Scholar] [CrossRef]
  28. Meng, N.; Liu, B.; Li, X.; Jin, X.; Huang, Y.; Wang, Q. Effect of blockage-induced near wake flow on fire properties in a longitudinally ventilated tunnel. Int. J. Therm. Sci. 2018, 134, 1–12. [Google Scholar] [CrossRef]
  29. Meng, N.; Yang, W.; Xin, L.; Li, X.; Liu, B.; Jin, X. Experimental study on backlayering length of thermal smoke flow in a longitudinally ventilated tunnel with blockage at upstream of fire source. Tunn. Undergr. Space Technol. 2018, 82, 315–324. [Google Scholar] [CrossRef]
  30. Wang, Z.; Han, J.; Wang, J.; Geng, P.; Weng, M.; Liu, F. Temperature distribution in a blocked tunnel with one closed portal under natural ventilation. Tunn. Undergr. Space Technol. 2021, 109, 103752. [Google Scholar] [CrossRef]
  31. Han, J. The effect of blockage and tunnel slope on smoke spread and ceiling temperature distribution in a natural-ventilated metro depot. Energy Build. 2021, 253, 111540. [Google Scholar] [CrossRef]
  32. Wang, J. Effect of the blockage ratio on the smoke extraction efficiency in tunnel fires with natural ventilation. Tunn. Undergr. Space Technol. 2021, 117, 10416. [Google Scholar] [CrossRef]
  33. Hu, L.H.; Tang, W.; Chen, L.F.; Yi, L. A non-dimensional global correlation of maximum gas temperature beneath ceiling with different blockage–fire distance in a longitudinal ventilated tunnel. Appl. Therm. Eng. 2013, 56, 77–82. [Google Scholar] [CrossRef]
  34. Tang, W.; Hu, L.H.; Chen, L.F. Effect of blockage-fire distance on buoyancy driven back-layering length and critical velocity in a tunnel: An experimental investigation and global correlations. Appl. Therm. Eng. 2013, 60, 7–14. [Google Scholar] [CrossRef]
  35. Zhang, S.; Shi, L.; Li, X.; Huang, Y.; He, K.; Wang, J. Critical ventilation velocity under the blockage of different metro train in a long metro tunnel. Fire Mater. 2020, 44, 497–505. [Google Scholar] [CrossRef]
  36. Zhang, S.; Yao, Y.; Zhu, K.; Li, K.; Zhang, R.; Lu, S.; Cheng, X. Prediction of smoke back-layering length under different longitudinal ventilations in the subway tunnel with metro train. Tunn. Undergr. Space Technol. 2016, 53, 13–21. [Google Scholar] [CrossRef]
  37. Zhang, X.; Zhang, Z.; Tao, H. A numerical study on critical velocity and back-layering length with trains’ blockage in longitudinally ventilated tunnel fires. Tunn. Undergr. Space Technol. 2021, 116, 104093. [Google Scholar] [CrossRef]
  38. Zhang, S.; Cheng, X.; Yao, Y.; Zhu, K.; Li, K.; Lu, S.; Zhang, R.; Zhang, H. An experimental investigation on blockage effect of metro train on the smoke back-layering in subway tunnel fires. Appl. Therm. Eng. 2016, 99, 214–223. [Google Scholar] [CrossRef]
  39. Jiang, X.; Zhang, H.; Jing, A. Effect of blockage ratio on critical velocity in tunnel model fire tests. Tunn. Undergr. Space Technol. 2018, 82, 584–591. [Google Scholar] [CrossRef]
  40. Altay, M.; Surmen, A. Effect of the relative positions of vehicular blockage on the smoke flow behaviour in a scaled tunnel. Fuel 2019, 255, 115694. [Google Scholar] [CrossRef]
  41. Meng, N.; Hu, X.; Tian, M. Effect of blockage on critical ventilation velocity in longitudinally ventilated tunnel fires. Tunn. Undergr. Space Technol. 2020, 106, 103580. [Google Scholar] [CrossRef]
  42. Tang, F.; Cao, Z.L.; Chen, Q.; Meng, N.; Wang, Q.; Fan, C.G. Effect of blockage-heat source distance on maximum temperature of buoyancy-induced smoke flow beneath ceiling in a longitudinal ventilated tunnel. Int. J. Heat Mass Transf. 2017, 109, 683–688. [Google Scholar] [CrossRef]
  43. Gannouni, S.; Maad, R.B. Numerical study of the effect of blockage on critical velocity and backlayering length in longitudinally ventilated tunnel fires. Tunn. Undergr. Space Technol. 2015, 48, 147–155. [Google Scholar] [CrossRef]
  44. Kunikane, Y.; Kawabata, N.; Yamada, T.; Shimoda, A. Influence of Stationary Vehicles on Backlayering Characteristics of Fire Plume in a Large Cross Section Tunnel. JSME Int. J. Ser. B 2006, 49, 594–600. [Google Scholar] [CrossRef]
  45. Lee, Y.-P.; Tsai, K.-C. Effect of vehicular blockage on critical ventilation velocity and tunnel fire behavior in longitudinally ventilated tunnels. Fire Saf. J. 2012, 53, 35–42. [Google Scholar] [CrossRef]
  46. Gao, Y.; Wang, Z.; Liu, Q.; Ren, J.; Fu, Z. Impact of block transportation on buoyancy flows during fires in a shallow urban road tunnel. Procedia Eng. 2017, 205, 1850–1857. [Google Scholar] [CrossRef]
  47. Ho, Y.-T.; Kawabata, N.; Seike, M.; Hasegawa, M.; Chien, S.-W.; Shen, T.-S. Scale Model Experiments and Simulations to Investigate the Effect of Vehicular Blockage on Backlayering Length in Tunnel Fire. Buildings 2022, 12, 1006. [Google Scholar] [CrossRef]
  48. Rojas Alva, W.U.; Jomaas, G.; Dederichs, A.S. The influence of vehicular obstacles on longitudinal ventilation control in tunnel fires. Fire Saf. J. 2017, 87, 25–36. [Google Scholar] [CrossRef]
  49. Ming, Y.; Zhu, G.; He, L.; Zhou, Y.; Liu, X.; Wang, X.; Wang, G.; Wu, L. Effect of different configurations of multi-blockages on the fire characteristics in tunnel fires with longitudinal ventilation. Therm. Sci. Eng. Prog. 2023, 45, 102113. [Google Scholar] [CrossRef]
  50. Luo, J. Effect of vehicular blocking scene on smoke spread in the longitudinal ventilated tunnel fire. Case Stud. Therm. Eng. 2019, 14, 100495. [Google Scholar] [CrossRef]
  51. Caliendo, C.; Genovese, G.; Russo, I. Risk Analysis of Road Tunnels: A Computational Fluid Dynamic Model for Assessing the Effects of Natural Ventilation. Appl. Sci. 2020, 11, 32. [Google Scholar] [CrossRef]
  52. Chow, W.K.; Gao, Y.; Zou, J.F.; Liu, Q.K.; Chow, C.L.; Miao, L. Numerical Studies on Thermally-Induced Air Flow in Sloping Tunnels with Experimental Scale Modelling Justifications. Fire Technol. 2018, 54, 867–892. [Google Scholar] [CrossRef]
  53. Ji, J.; Guo, F.; Gao, Z.; Zhu, J.; Sun, J. Numerical investigation on the effect of ambient pressure on smoke movement and temperature distribution in tunnel fires. Appl. Therm. Eng. 2017, 118, 663–669. [Google Scholar] [CrossRef]
  54. Ji, J.; Tan, T.; Gao, Z.; Wan, H.; Zhu, J.; Ding, L. Numerical Investigation on the Influence of Length–Width Ratio of Fire Source on the Smoke Movement and Temperature Distribution in Tunnel Fires. Fire Technol. 2019, 55, 963–979. [Google Scholar] [CrossRef]
  55. Huang, Y.; Li, Y.; Dong, B.; Li, J.; Liang, Q. Numerical investigation on the maximum ceiling temperature and longitudinal decay in a sealing tunnel fire. Tunn. Undergr. Space Technol. 2018, 72, 120–130. [Google Scholar] [CrossRef]
  56. Li, Q.; Kang, J.; Wu, Y.; Luo, J. Theoretical and Numerical Study of Smoke Back-Layering Length for an Inclined Tunnel under Longitudinal Ventilation. Fire Technol. 2022, 58, 2143–2166. [Google Scholar] [CrossRef]
  57. Ko, J.; Yoon, C.; Yoon, S.; Kim, J. Determination of the applicable exhaust airflow rate through a ventilation shaft in the case of road tunnel fires. Saf. Sci. 2010, 48, 722–728. [Google Scholar] [CrossRef]
  58. McGrattan, K.B.; Forney, G.P. Fire Dynamics Simulator (Version 4): User’s Guide; National Institute of Standards and Technology: Gaithersburg, MD, USA, 2004. [CrossRef]
  59. Kurioka, H.; Oka, Y.; Satoh, H.; Sugawa, O. Fire properties in near field of square fire source with longitudinal ventilation in tunnels. Fire Saf. J. 2003, 38, 319–340. [Google Scholar] [CrossRef]
  60. Han, J.; Wang, F.; Wen, J.; Liu, F.; Ma, W.; Wang, Z.; Ma, Z. Investigation on the characteristics of fire burning and smoke spreading in longitudinal-ventilated tunnels with blockages. Tunn. Undergr. Space Technol. 2023, 131, 104790. [Google Scholar] [CrossRef]
  61. Li, Y.Z.; Lei, B. Ingason, Study of critical velocity and backlayering length in longitudinally ventilated tunnel fires. Fire Saf. J. 2010, 45, 361–370. [Google Scholar] [CrossRef]
Figure 1. Three-dimensional model.
Fire 07 00269 g001
Figure 2. Comparison of vertical temperature distribution for three grid sizes (cross-section of blockage = 3 m × 3 m, u = 0.8 m/s). (a) The 10 m upstream vertical temperature distribution. (b) The 10 m downstream vertical temperature distribution.
Fire 07 00269 g002aFire 07 00269 g002b
Figure 3. Comparison of numerical data and reduced-scale experimental data.
Fire 07 00269 g003
Figure 4. Temperature contours and flow fields with blockage cross-section = 2 m × 2 m at y = 6 m or 2 m. (a) u = 0.4 m/s, fire location 1; (b) u = 0.4 m/s, fire location 2; (c) u = 1.2 m/s, fire location 1; (d) u = 1.2 m/s, fire location 2; (e) u = 2 m/s, fire location 1; (f) u = 2 m/s, fire location 2.
Fire 07 00269 g004aFire 07 00269 g004b
Figure 5. Temperature contours and flow fields with blockage cross-section = 3 m × 3 m at y = 6 m or 2 m. (a) u = 0.4 m/s, fire location 1; (b) u = 0.4 m/s, fire location 2; (c) u = 1.2 m/s, fire location 1; (d) u = 1.2 m/s, fire location 2; (e) u = 2 m/s, fire location 1; (f) u = 2 m/s, fire location 2.
Fire 07 00269 g005aFire 07 00269 g005b
Figure 6. Temperature contours and flow fields with blockage cross-section = 2 m × 2 m at z = 1.5 m. (a) u = 0.4 m/s, fire location 1; (b) u = 0.4 m/s, fire location 2; (c) u = 1.2 m/s, fire location 1; (d) u = 1.2 m/s, fire location 2; (e) u = 2 m/s, fire location 1; (f) u = 2 m/s, fire location 2.
Fire 07 00269 g006aFire 07 00269 g006b
Figure 7. Temperature contours and flow fields with blockage cross-section = 3 m × 3 m at z = 1.5 m. (a) u = 0.4 m/s, fire location 1; (b) u = 0.4 m/s, fire location 2; (c) u = 1.2 m/s, fire location 1; (d) u = 1.2 m/s, fire location 2; (e) u = 2 m/s, fire location 1; (f) u = 2 m/s, fire location 2.
Fire 07 00269 g007aFire 07 00269 g007b
Figure 8. Longitudinal temperature distribution beneath tunnel ceiling under three ventilation velocities. (a) u = 0.4 m/s, fire location 1; (b) u = 0.4 m/s, fire location 2; (c) u = 1.2 m/s, fire location 1; (d) u = 1.2 m/s, fire location 2; (e) u = 2 m/s, fire location 1; (f) u = 2 m/s, fire location 2.
Fire 07 00269 g008aFire 07 00269 g008b
Figure 9. Comparison of simulation results with predictions of Equation (12).
Fire 07 00269 g009
Figure 10. Ratio of maximum temperature rise at fire locations 1 and 2.
Fire 07 00269 g010
Figure 11. The relationship between the proportion of the maximum temperature rise at fire locations 1 and 2 and the blockage ratio.
Fire 07 00269 g011
Figure 12. The prediction value of the maximum temperature rise in side-lane vehicle fires versus the numerical results.
Fire 07 00269 g012
Figure 13. The relationship between the back-layering length and ventilation velocity.
Fire 07 00269 g013
Figure 14. Dimensionless smoke back-layering length versus Q ˙ * 1 / 3 / u l o c a l * and comparison with Ho et al. [47] and Meng et al. [27].
Fire 07 00269 g014
Figure 15. Simplified flowchart of the methodology presented in this paper.
Fire 07 00269 g015
Table 1. Test conditions.
No.Fire LocationCross-Section of Blockage (m × m) u (m/s)
1~512 × 20.4 m/s, 0.8 m/s, 1.2 m/s, 1.6 m/s, 2 m/s
6~1012 × 30.4 m/s, 0.8 m/s, 1.2 m/s, 1.6 m/s, 2 m/s
11~1513 × 30.4 m/s, 0.8 m/s, 1.2 m/s, 1.6 m/s, 2 m/s
16~2013 × 40.4 m/s, 0.8 m/s, 1.2 m/s, 1.6 m/s, 2 m/s
21~2522 × 20.4 m/s, 0.8 m/s, 1.2 m/s, 1.6 m/s, 2 m/s
26~3022 × 30.4 m/s, 0.8 m/s, 1.2 m/s, 1.6 m/s, 2 m/s
31~3523 × 30.4 m/s, 0.8 m/s, 1.2 m/s, 1.6 m/s, 2 m/s
36~4023 × 40.4 m/s, 0.8 m/s, 1.2 m/s, 1.6 m/s, 2 m/s
Disclaimer/Publisher’s Note: The statements, opinions and data contained in all publications are solely those of the individual author(s) and contributor(s) and not of MDPI and/or the editor(s). MDPI and/or the editor(s) disclaim responsibility for any injury to people or property resulting from any ideas, methods, instructions or products referred to in the content.