The module’s generality means it can accommodate various methods for probability calculations and path planning. For the system, this paper implemented logistic regression and dynamic programming, both classic algorithms. This paper utilizes these two algorithms primarily because they are easy to implement and broadly applicable. Both logistic regression and dynamic programming have low implementation difficulty and wide applicability, supported by many open-source libraries and tools providing their implementations and optimization algorithms. This enables a quick setup and adjustment. For example, logistic regression models have fewer parameters compared to deep learning models, simplifying the tuning process and facilitating the rapid identification of the optimal model. Additionally, logistic regression requires less data, making it suitable for cases with small sample sizes. This is particularly crucial for forest fire prediction in areas where data are scarce or challenging to obtain. The regression coefficients in logistic regression are clearly interpretable, with each coefficient representing the direction and magnitude of the effect of the corresponding independent variable (like temperature, humidity, etc.) on the probability of fire occurrence. It can also test the parameter’s significance, which cannot be tested by artificial neural networks [
42]. Furthermore, logistic regression is a stable and robust model that can handle various data types, including continuous and categorical data. It also shows good tolerance to missing and outlier values, ensuring reliable predictions, even in complex and incomplete data environments. Optimal resource scheduling and routing are frequently required in fire prediction and control. Dynamic programming can address these optimal routing issues, ensuring the efficient allocation and use of resources, thus enhancing fire response efficiency. Dynamic programming is highly flexible and scalable, allowing model structures and parameters to be adjusted according to real-world needs. For example, the state space and transition rules of a dynamic programming model can be adjusted based on different distance and probability weight factors, improving the model’s adaptability and generalization abilities.
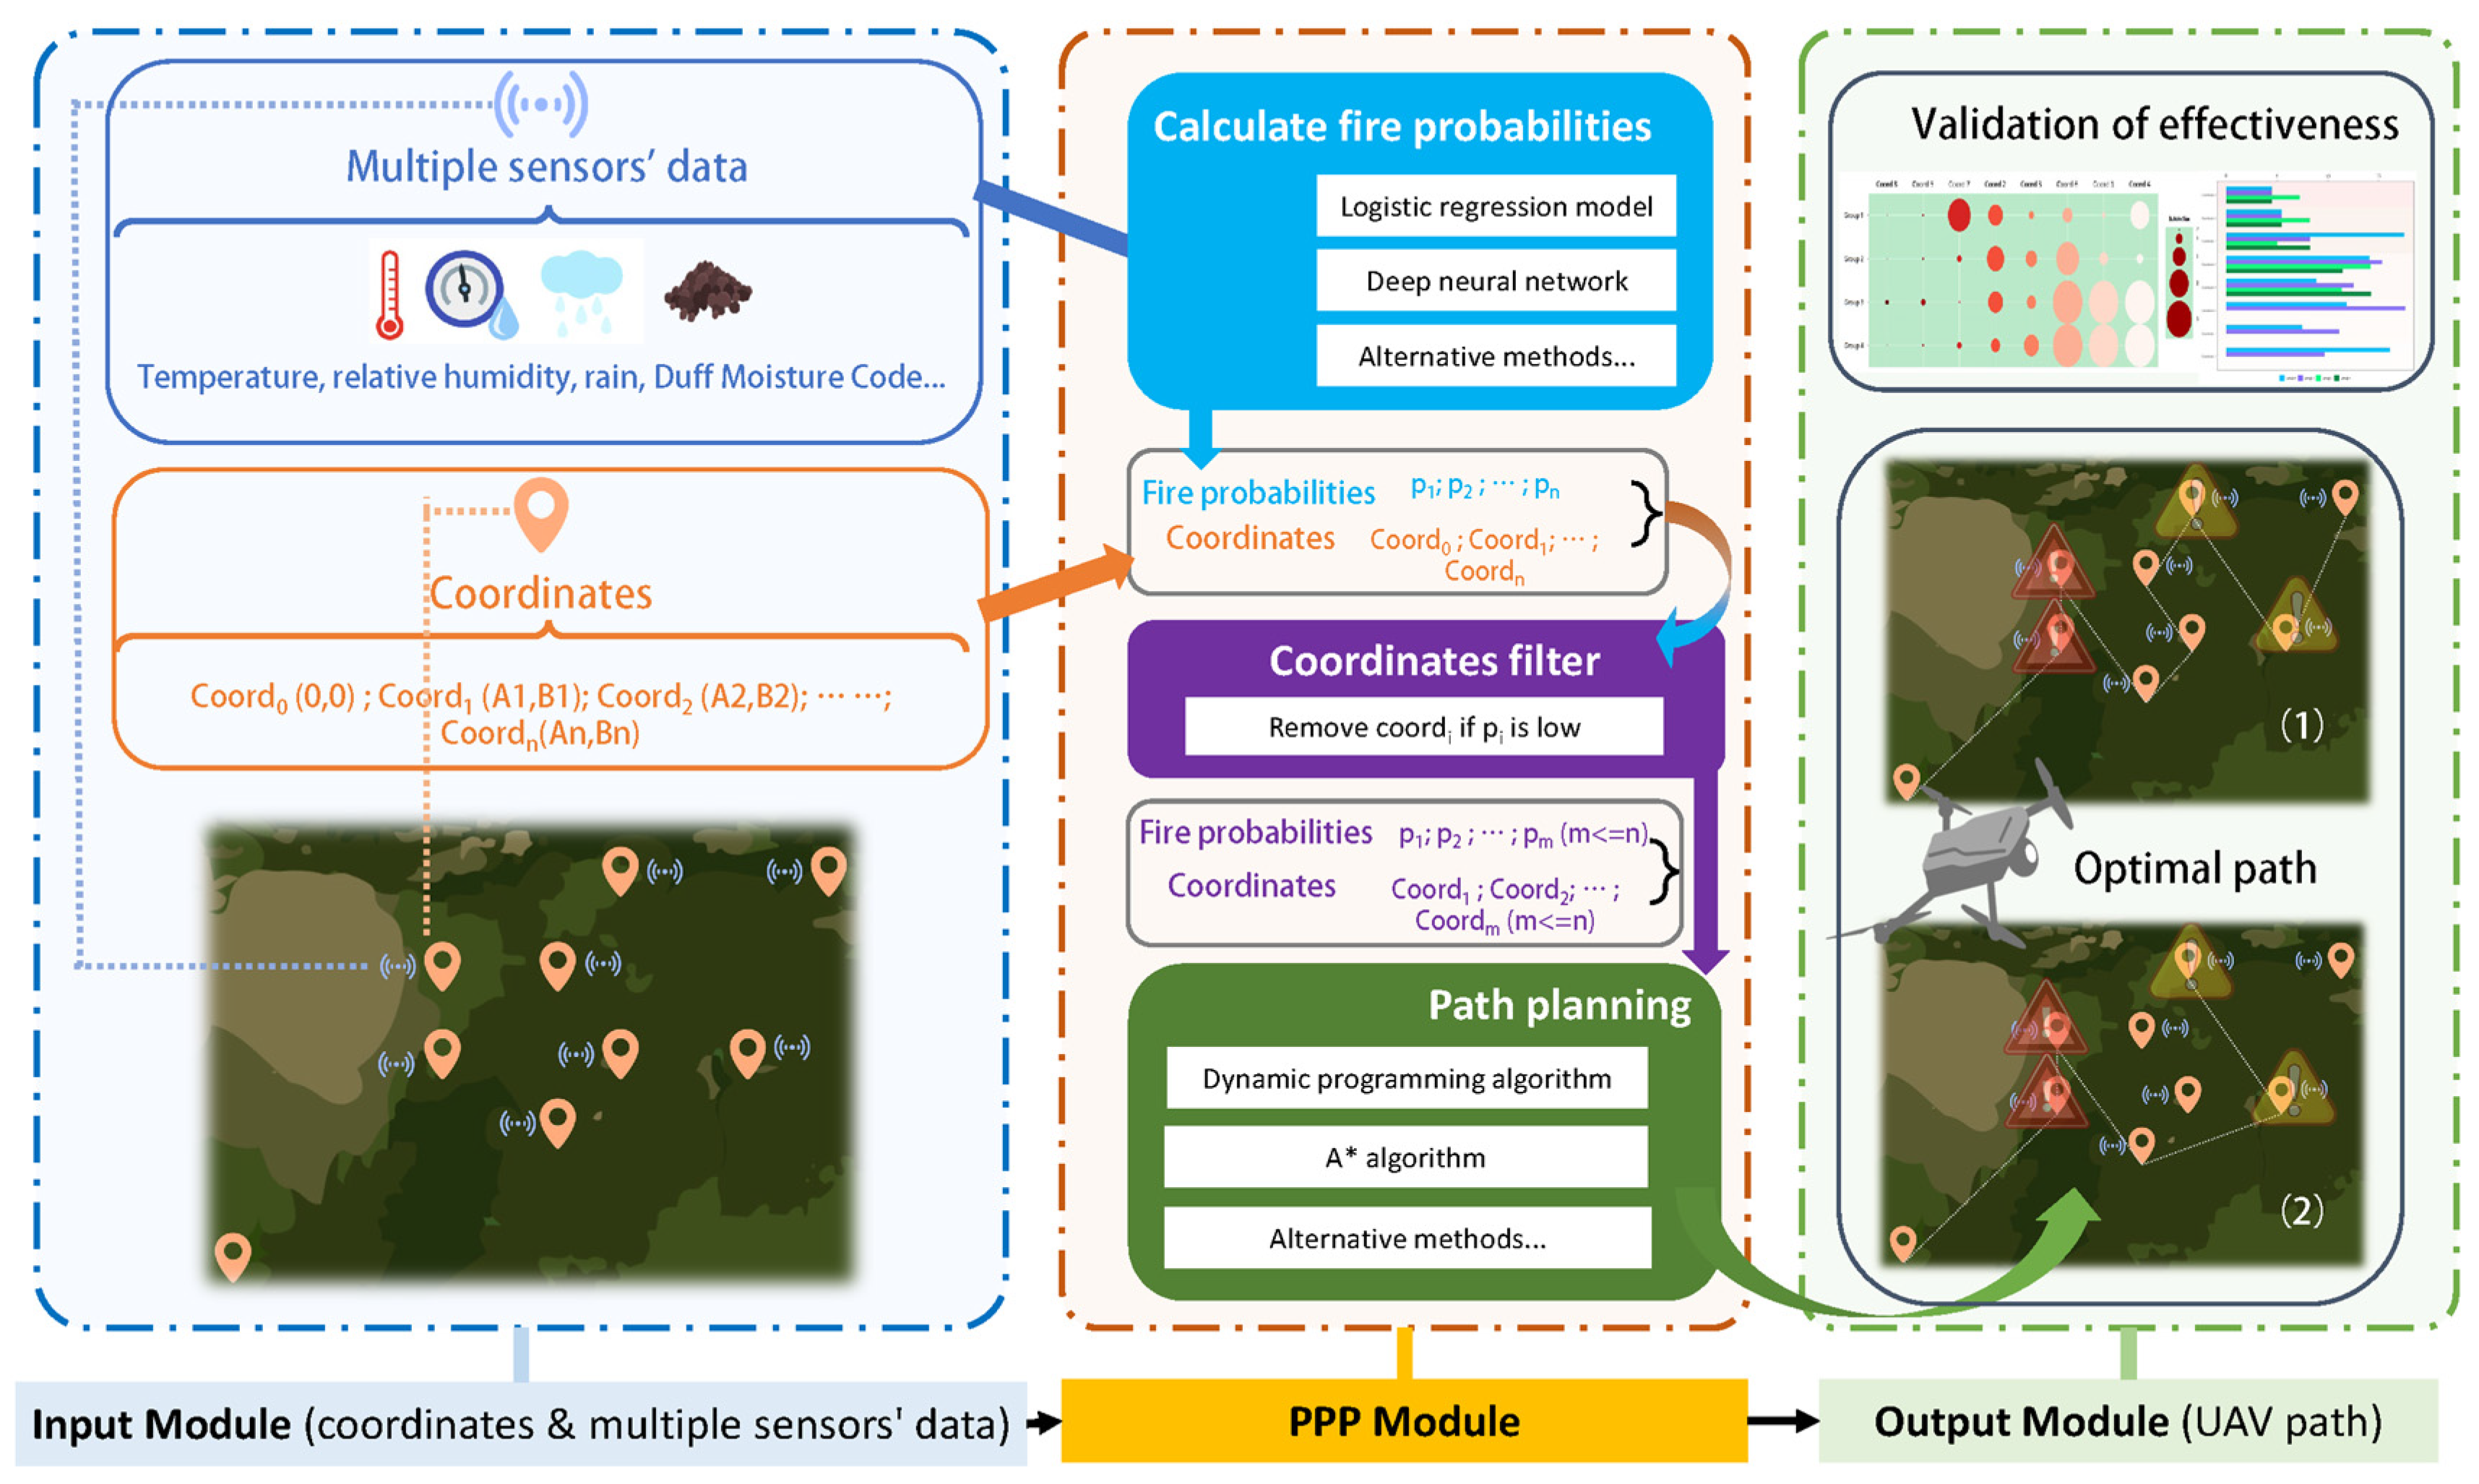
By combining dynamic programming with wildfire occurrence probabilities, the system provides an optimal path for the UAV in complex environments, considering both point distances and fire probabilities, thus improving the effectiveness of forest fire searches.
3.2.1. Establishing the Logistic Regression Model
Logistic regression is a statistical learning method designed for classification tasks. In the context of the forest fire prevention discussed in this paper, it involves a binary classification problem: determining whether a fire will occur in a specific area. The logistic regression model transforms a linear combination of input features into a probability value between 0 and 1 using the logistic function. The mathematical formula is as follows.
where P is the probability of the event, e is the base of the natural logarithm, and z is the linear combination. The linear combination is given by:
Here, x is the input feature vector,
x = (x1, x2, …, xn) is the corresponding weight vector
w = (w1, w2, …, wn), and b is a bias term. Thus, the relationship between P and
x can be expressed as:
This paper uses data from publicly available datasets [
43,
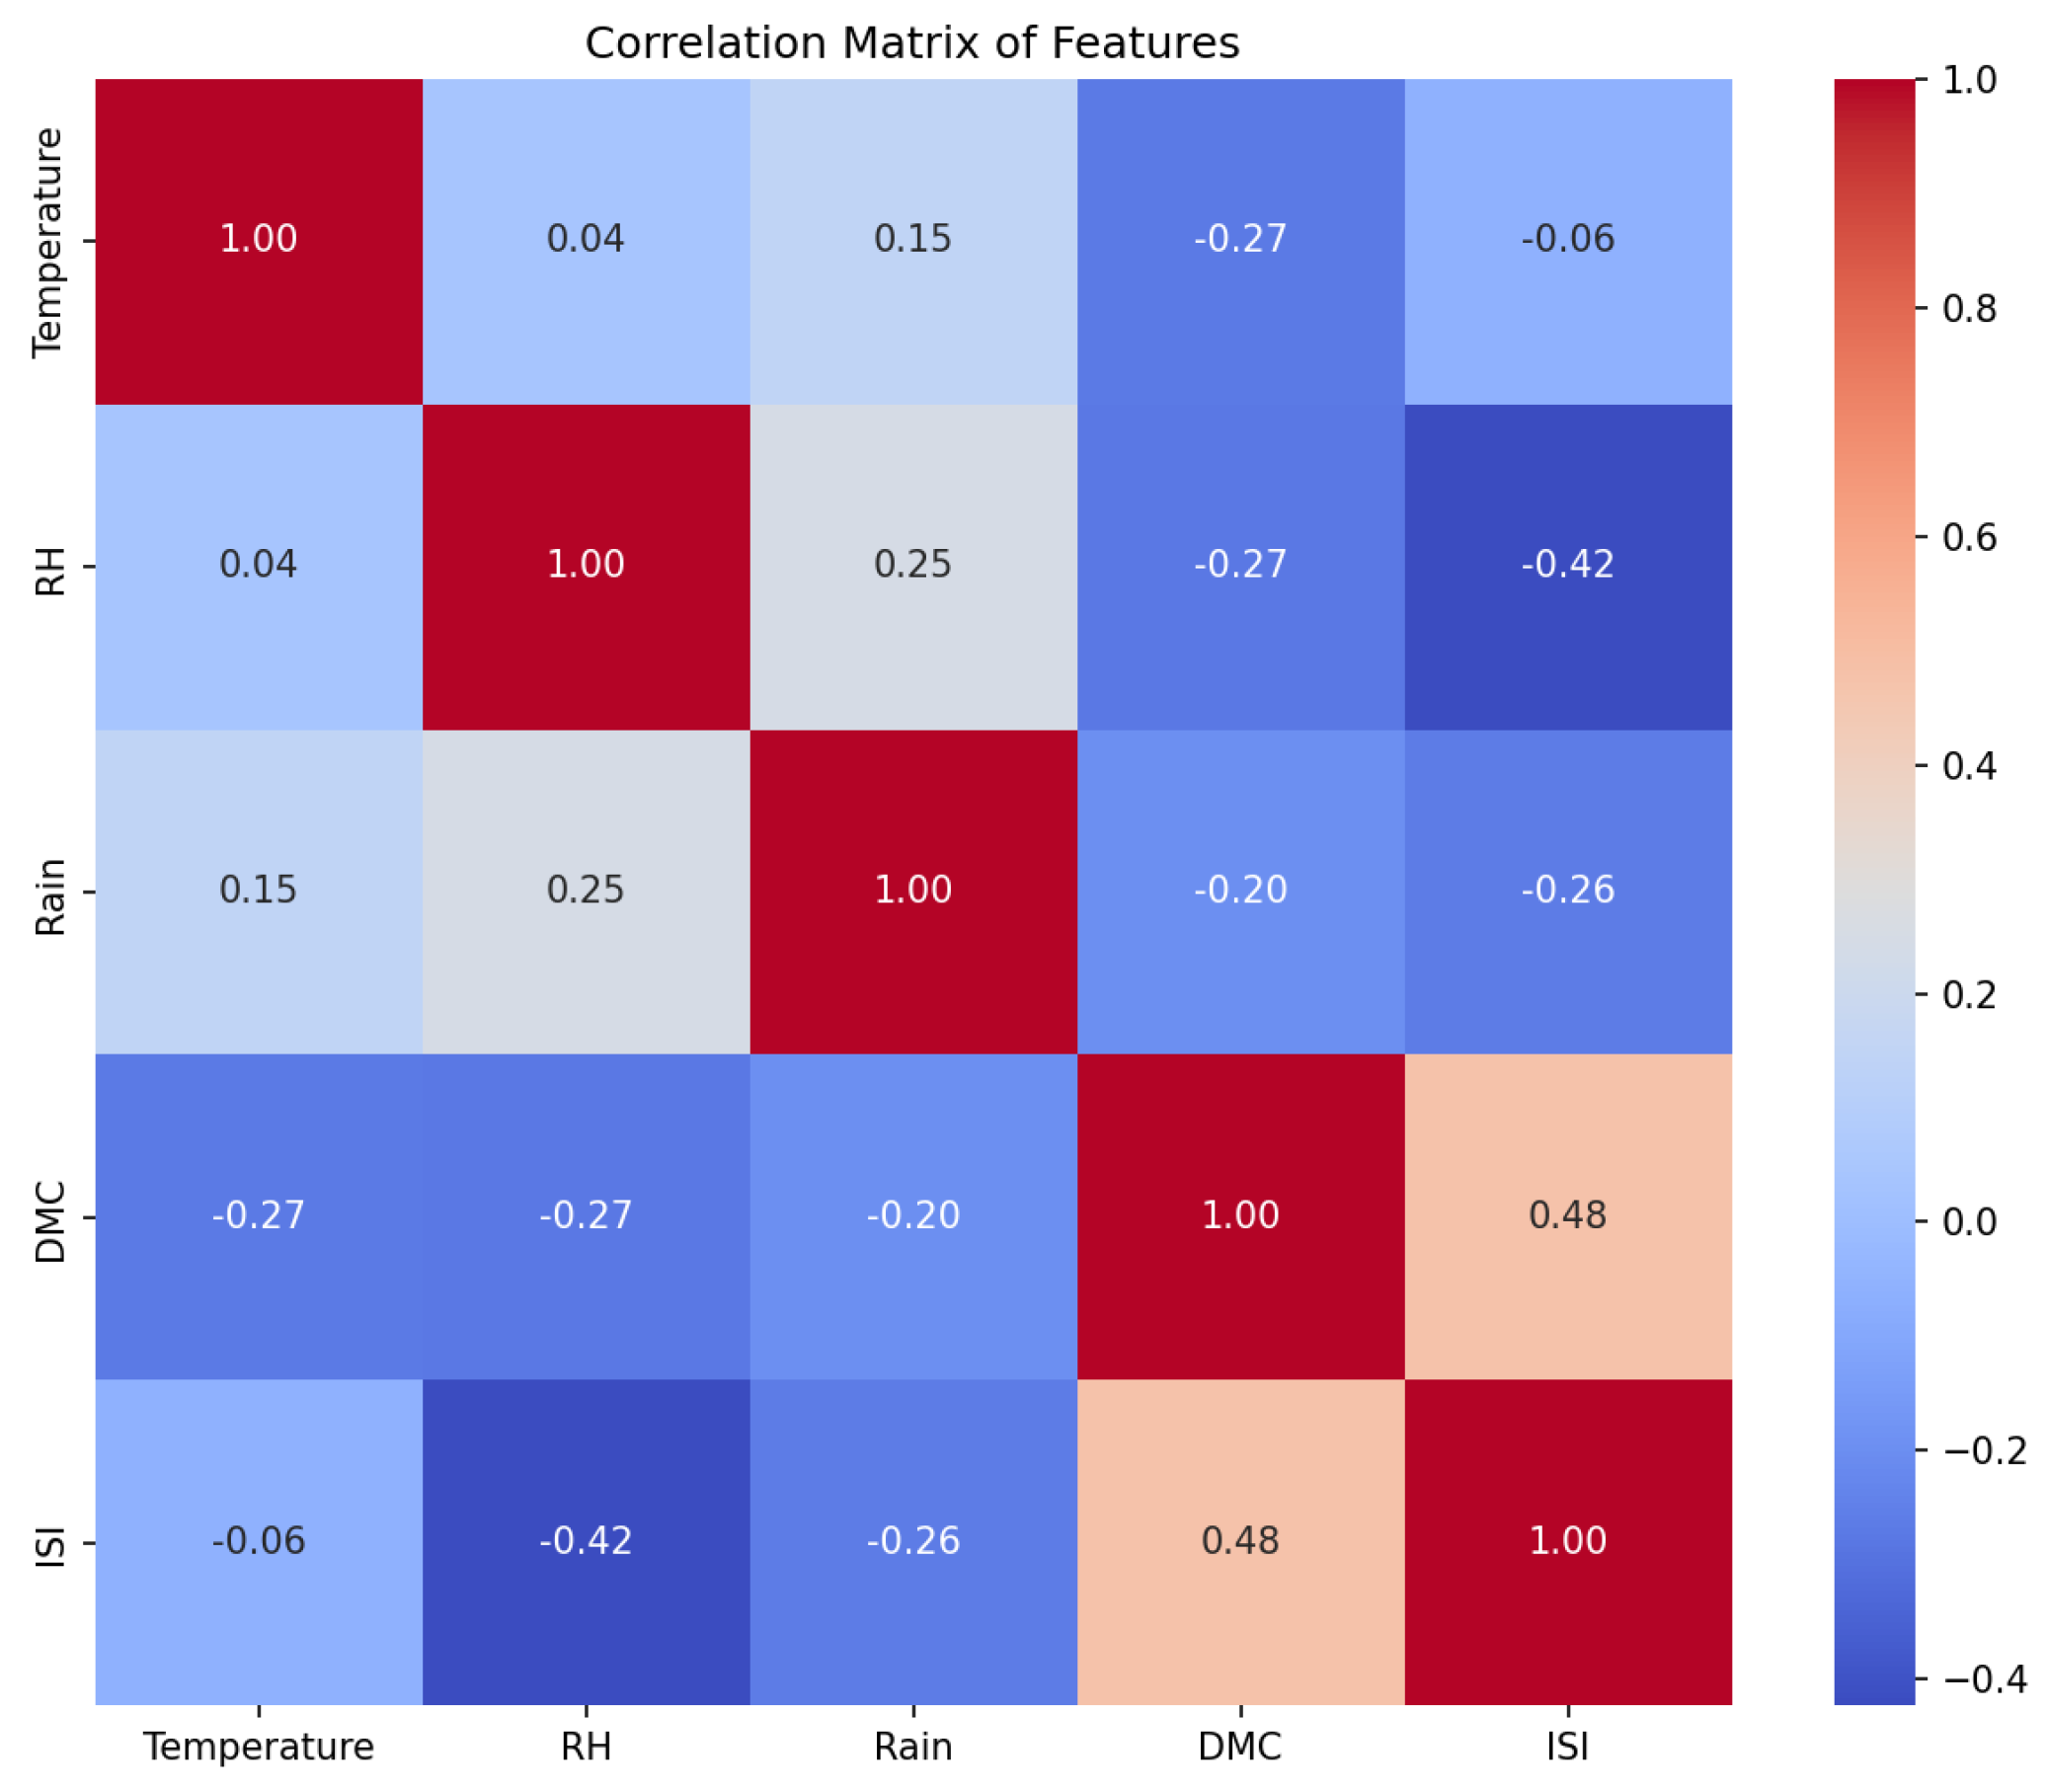
44]. The original dataset comprises the following eight features: temperature, relative humidity, wind, rain, FFMC (fine fuel moisture code), DMC, DC (drought code), and ISI. To ensure the stability of the model and the accuracy of the parameter estimates, this paper performed a correlation analysis of the data. A correlation-based feature selection method was used during the feature selection process. Initially, the correlation matrix of the features was calculated to identify potential multicollinearity issues. Severe multicollinearity can result in unstable parameter estimates, model overfitting, and reduced interpretability. Consequently, by combining correlation analysis with domain knowledge, features with high correlations and redundancy were removed: wind (with an average correlation of 0.53 with other features), FFMC (with an average correlation of 0.50 with other features), and DC (with an average correlation of 0.50 with other features). After the feature selection process, five features were retained: temperature, relative humidity, rain, DMC, and ISI. The average correlation value of these features with other features is less than 0.50. These features were chosen based on their importance in predicting fire probability while mitigating the issues caused by strong correlations. Specifically, in the final retained features, the highest correlation is between ISI and DMC at 0.48, with weaker correlations among the other variables. These features can be obtained from sensors positioned at specific points, with the parameters and their descriptions provided in
Table 1. This feature selection strategy reduces unnecessary, redundant information, enhancing the model’s interpretability and generalization ability. The correlation heatmap of the features, shown in
Figure 2, demonstrates that there are no highly correlated features among the retained ones, making them relatively suitable for model training.
L1 regularization is a technique used in machine learning and statistical modeling to control model complexity and prevent overfitting [
45]. It works by incorporating the L1 norm of the parameters into the loss function. The L1 norm is the sum of the absolute values of the parameter vector elements, where λ is the regularization parameter, and w is the weight vector of the model. The primary effect of L1 regularization is to sparsify the model by reducing the importance of irrelevant or redundant features, thereby improving the model’s generalization ability.
Based on the variables from the aforementioned dataset, a logistic regression model for predicting fire probability can be accurately trained by incorporating L1 regularization. This model calculates the probability of fire occurrence within the vicinity of a given point, which serves as a reference for subsequent path planning. The model parameters are shown in
Table 2 below.
The table indicates that the temperature, rain, and ISI significantly impact the fire probability (significance values ≤ 0.005), while the constant term and other variables do not have a significant influence. Specifically, increases in the temperature and ISI are positively correlated with the fire probability, whereas RH, rain, and DMC negatively impact fire occurrence. In the logistic regression model, Exp(B) is used to measure the impact of each independent variable on the dependent variable [
46]. The x1(temperature) has the highest Exp(B) value among variables with values greater than 1, indicating its strong positive effect on fire probability. The x3(rain) has the lowest Exp(B) value among variables with values less than 1, indicating its strong inhibitory effect on fire probability.
Based on the fitting results, the logistic regression model is formulated as follows.
The performance of logistic regression models is typically assessed using metrics such as accuracy, precision, recall, F1 score, ROC curve, and AUC value. The confusion matrix, a 2 × 2 matrix summarizing the model’s predictions, underpins these metrics. It includes the following key indicators.
True Positive (TP): Number of positive samples correctly predicted as positive.
True Negative (TN): Number of negative samples correctly predicted as negative.
False Positive (FP): Number of negative samples incorrectly predicted as positive (Type I error).
False Negative (FN): Number of positive samples incorrectly predicted as negative (Type II error).
Accuracy reflects the proportion of correct predictions but may not be reliable for imbalanced datasets. Precision indicates the ratio of true positives to the sum of true and false positives, showing the proportion of true positives among all positive predictions. Recall indicates the proportion of true positives correctly identified by the model out of all the actual positives, measuring the model’s ability to capture true positives. The F1 score, a harmonic mean of precision and recall, balances the two and is more reliable for imbalanced datasets.
The accuracy of the logistic regression model is 0.73. The specific precision, recall, F1 score, and support values are shown in
Table 3. This paper focuses on predicting the probability of forest fires using a logistic regression model, emphasizing the precision, recall, and F1 scores for class 1. The model performs well for class 1, with high precision, recall, and F1 scores, indicating its ability to effectively capture positive cases. For class 0, the metrics are slightly lower, indicating some false negatives, which minimally affect the paper’s objectives.
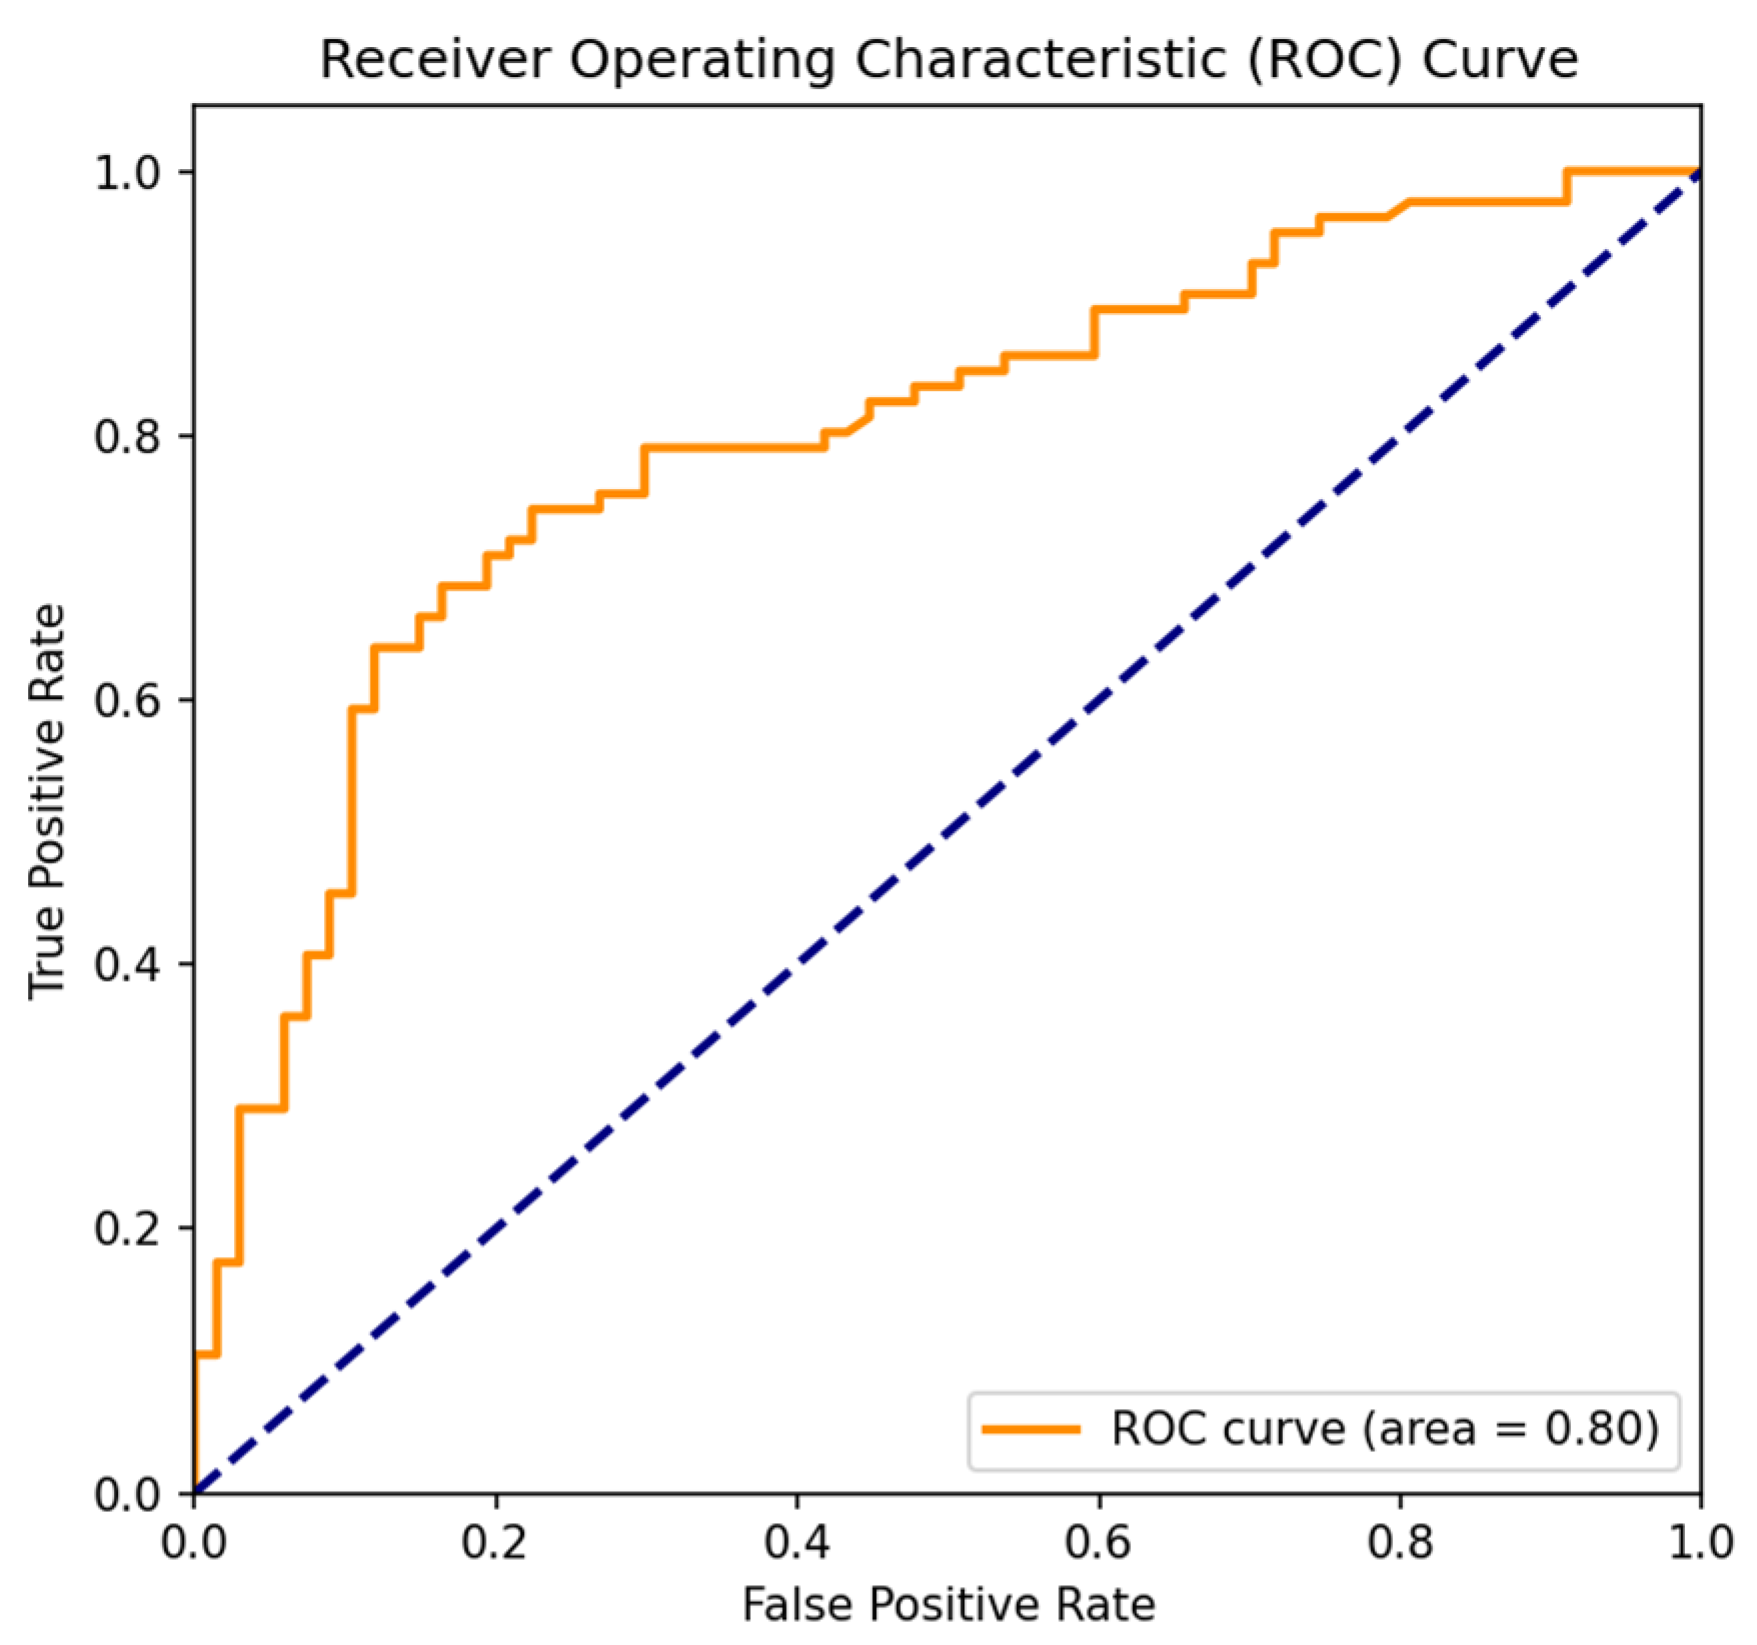
The receiver operating characteristic (ROC) curve plots the false-positive rate on the x-axis and the true-positive rate (i.e., recall) on the y-axis. The area under the curve (AUC) measures the model’s classification performance, with higher values indicating a better performance. As shown in
Figure 3, the ROC curve approaches the (0, 1) point and deviates significantly from the 45-degree diagonal line, demonstrating that the model’s predictors have strong explanatory power. The AUC is 0.80, much greater than 0.5, demonstrating that the model fits well. Therefore, the probability values output by the model are suitable for use as a basis for path planning research.
3.2.2. Dynamic Programming Algorithm
Dynamic programming is an algorithmic technique for solving multi-stage decision problems [
17]. Its core idea is to break down the original problem into smaller sub-problems, solve these sub-problems, and store the intermediate results to avoid redundant calculations, thus optimizing efficiency.
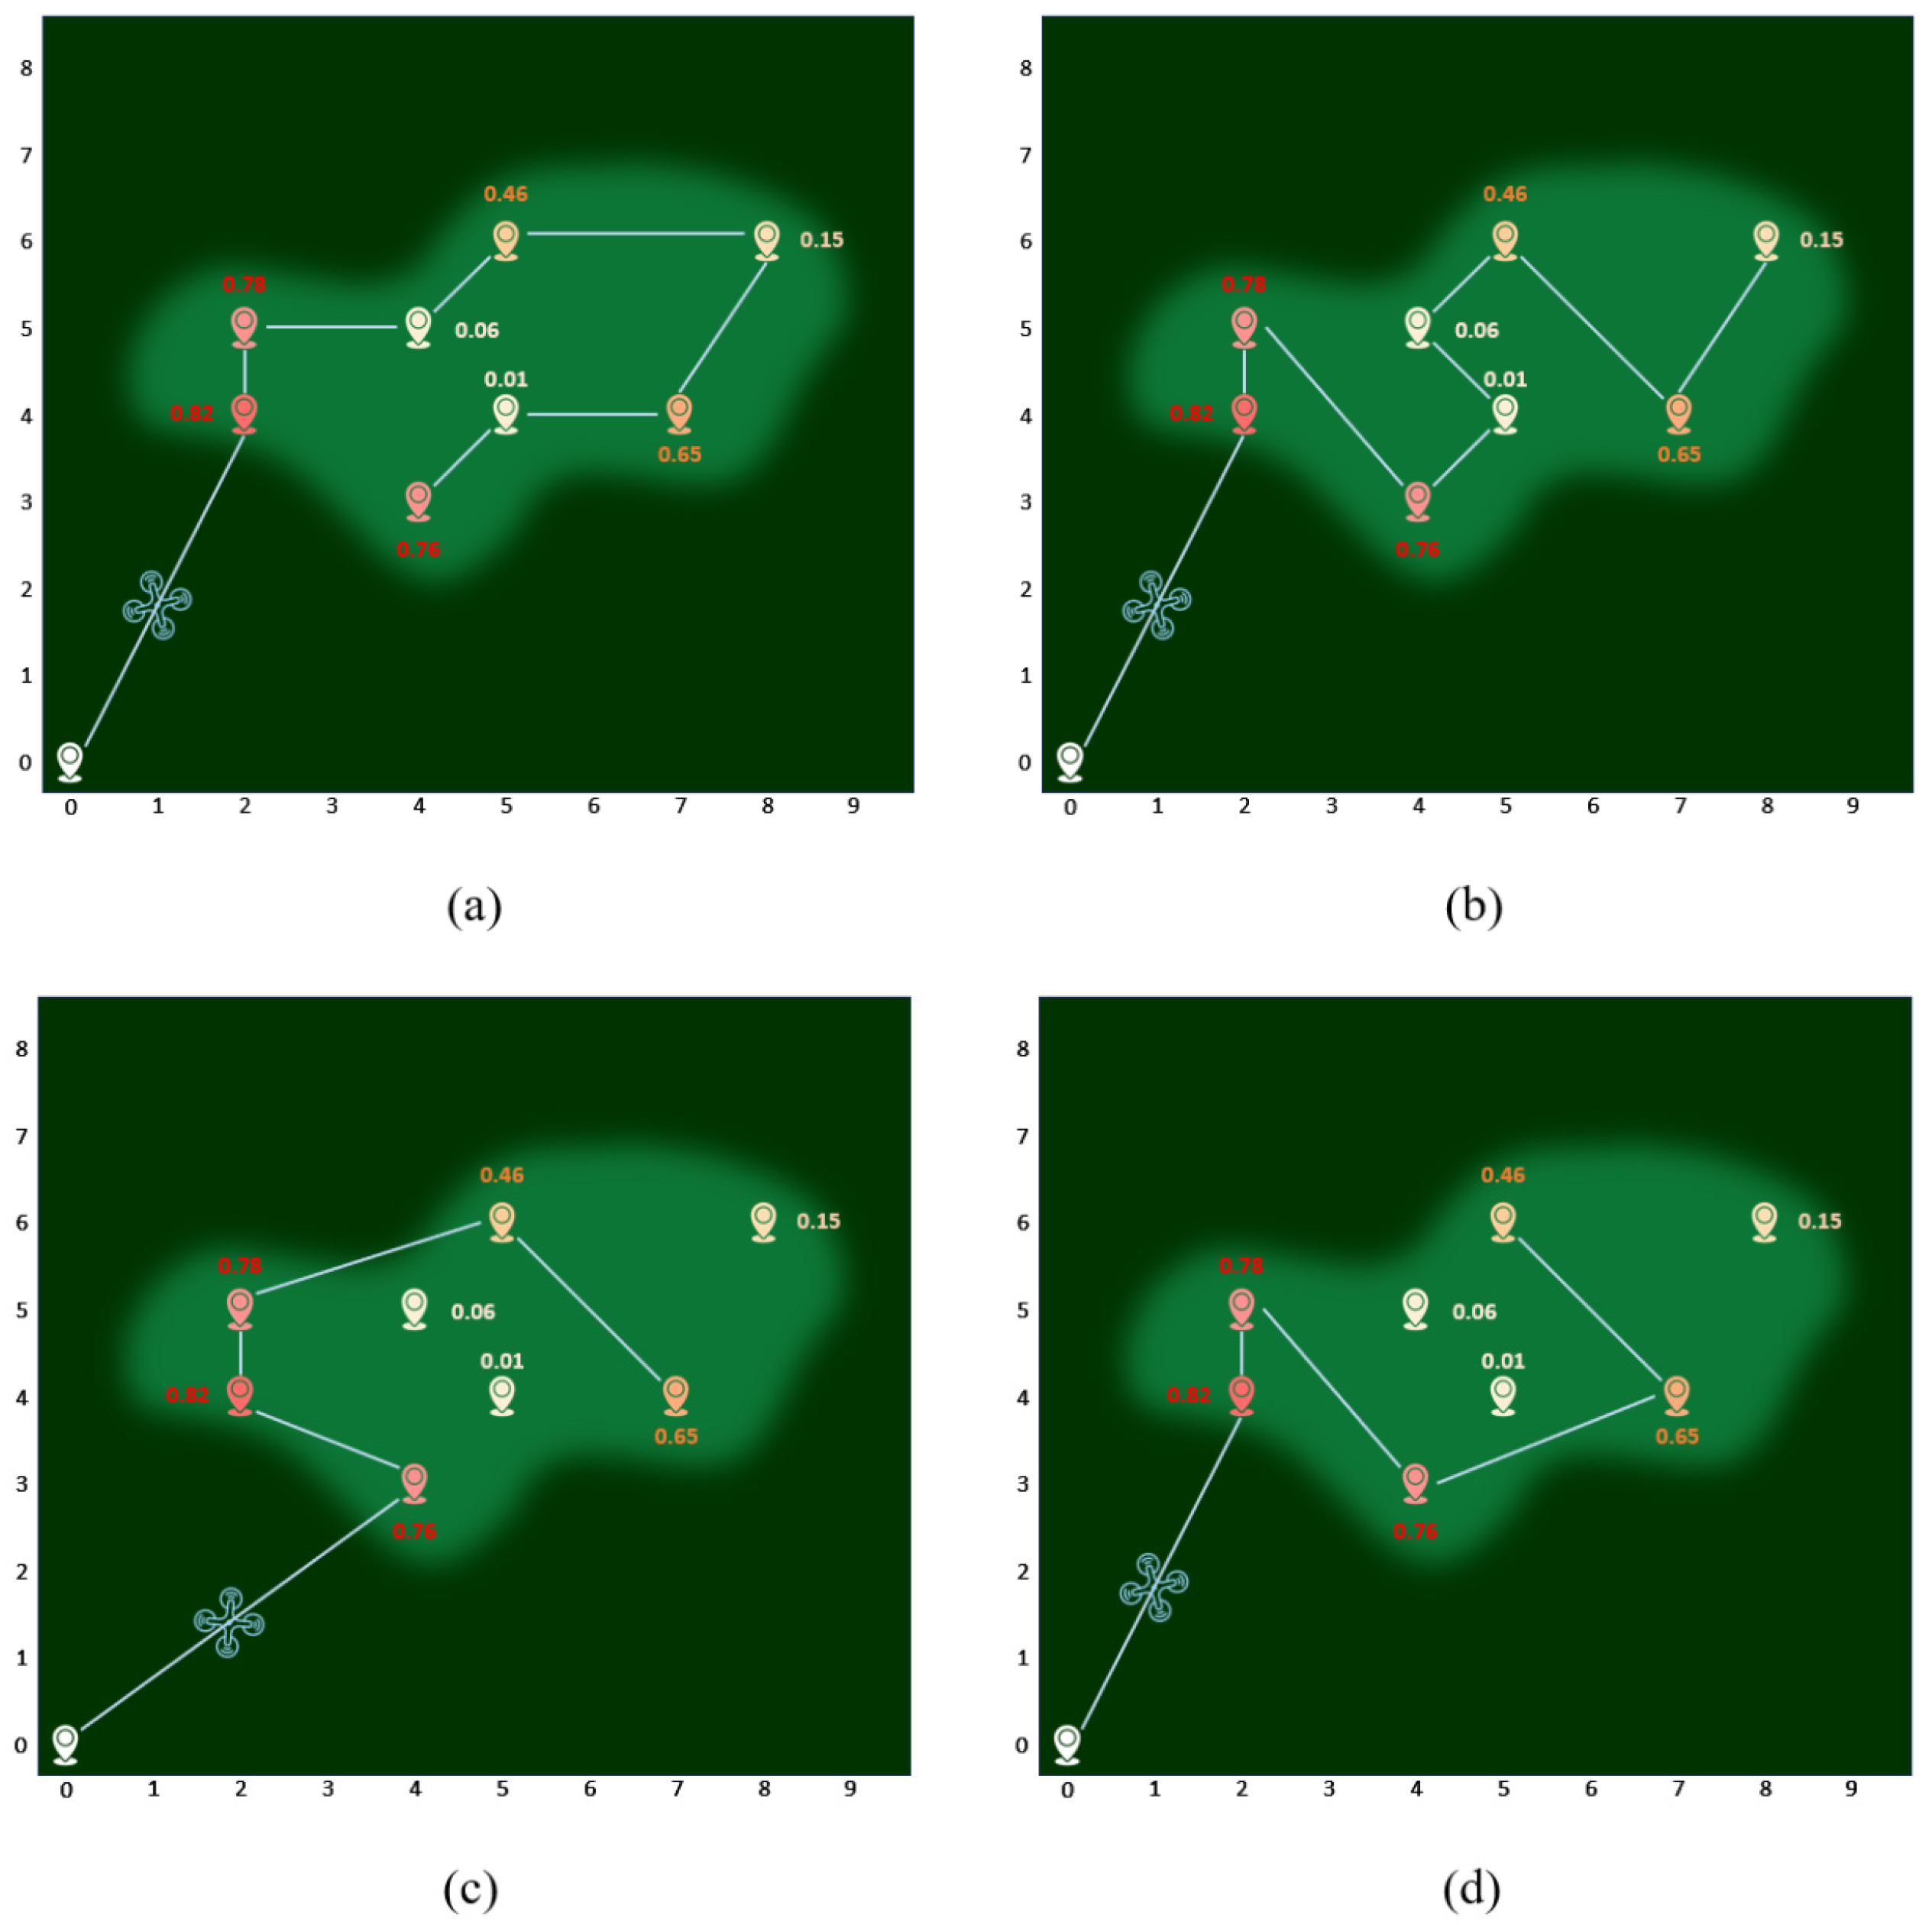
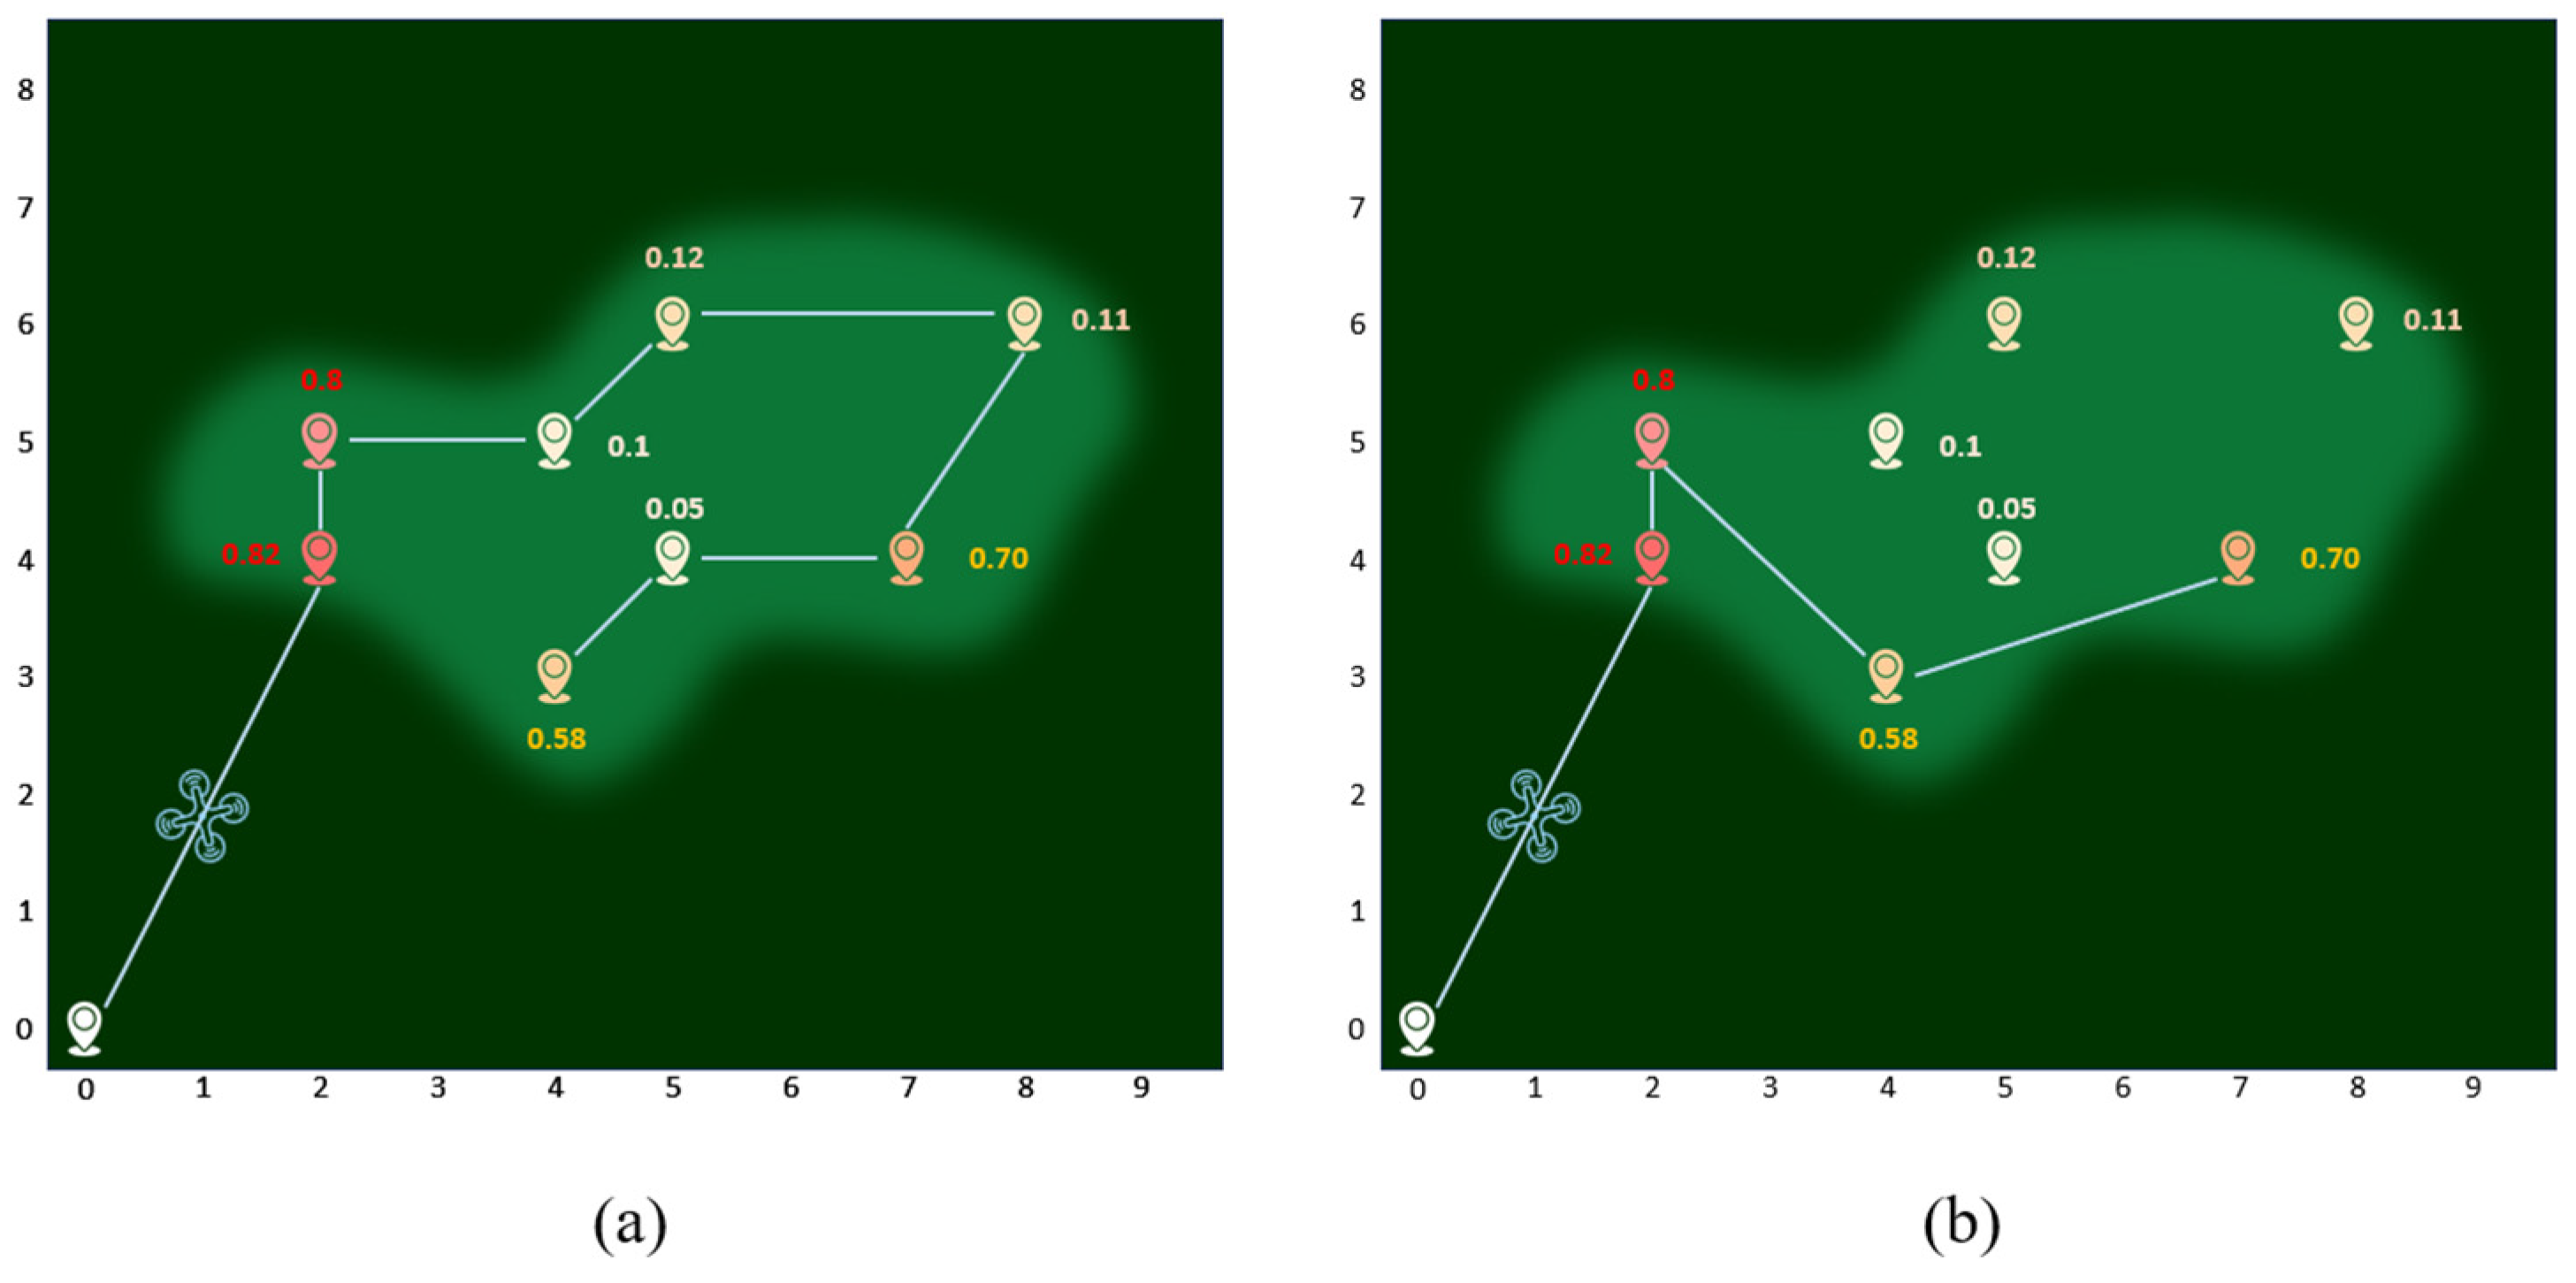
The objective of this paper is to find a UAV patrol route that allows the UAV to complete its search task while minimizing the cost of reaching areas with higher fire probabilities to make the UAV efficiently complete the forest fire search task.
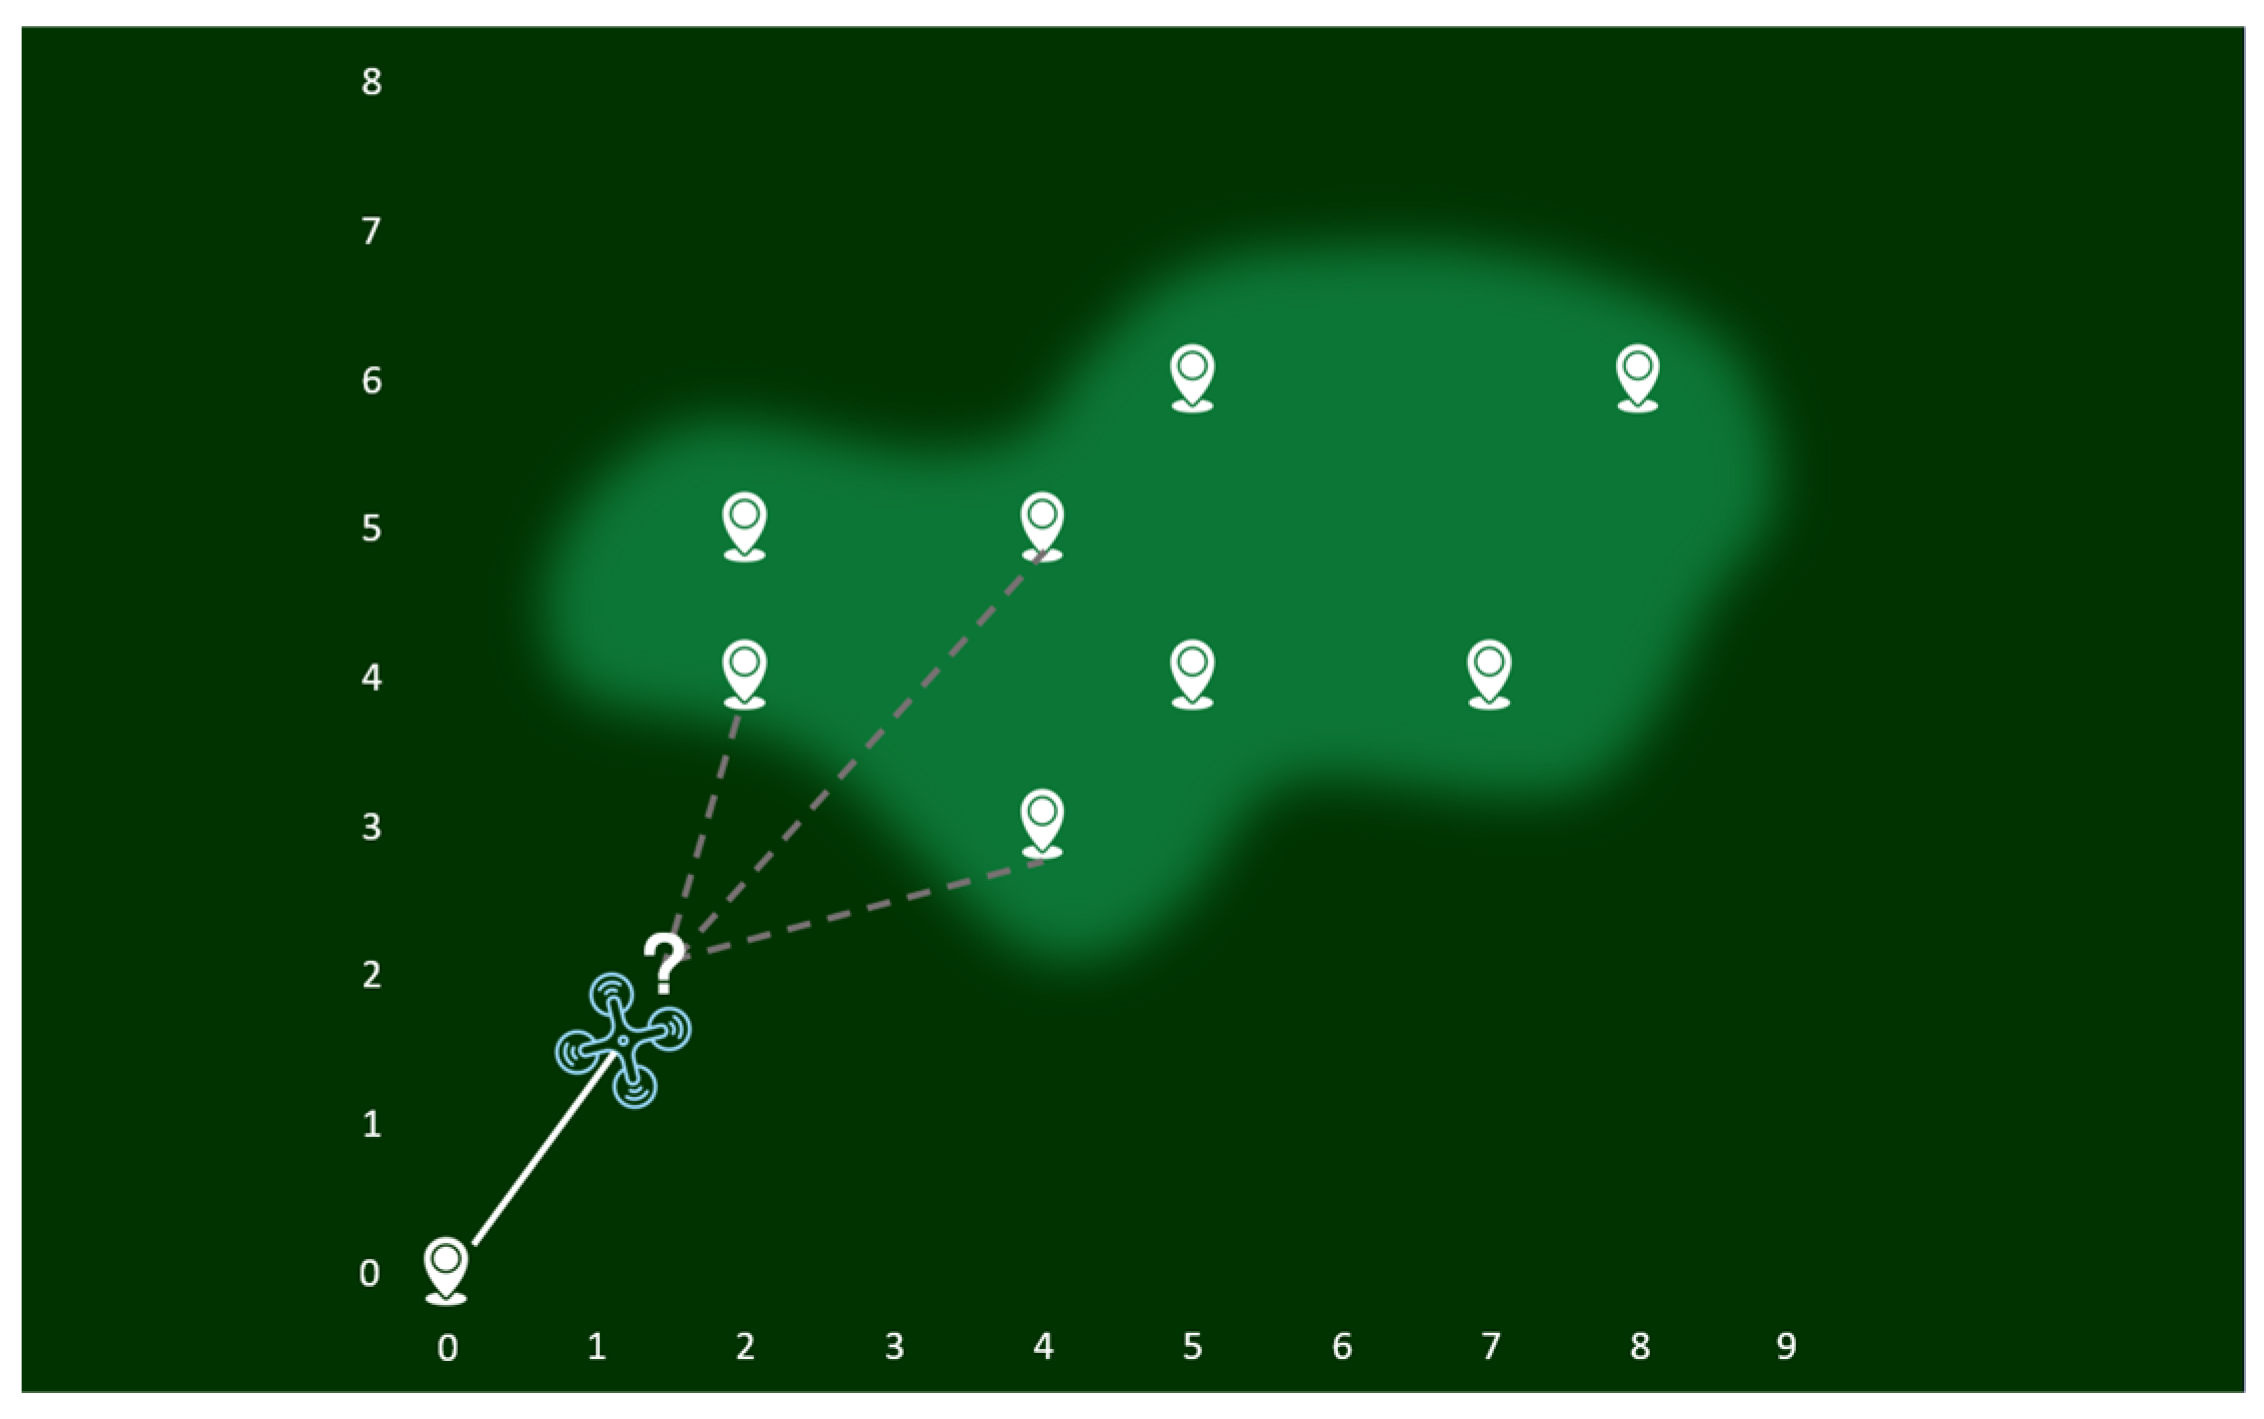
First, a logistic regression model is used to obtain the probability of fire occurrence at each point, which serves as a reference for path planning. Each coordinate with a fire probability represents a potential location. The task area is represented by nine discrete nodes, as shown in
Figure 4. The UAV starts from the origin, and the cost at each node is related to the distance between nodes and the fire probability.
To solve this problem, we decompose the overall task into multiple sub-tasks, requiring the UAV to minimize the cost at each node by considering both distance and probability. The path that connects nodes with a minimal cost represents the desired path. Using an improved DP algorithm, we integrate both probability and distance. Let C
i,j represent the cost from point
i to point
j, where dp
mask,i is the minimal cost from the starting point to point
i, dist
i,j is the spatial distance between point
i and point
j, (xi, yi) and (xj, yj) are the coordinates of point
i and point
j, respectively, and p
j is the fire probability at point
j. The cost to reach each point is given by:
Assuming the optimal path passes through coordinates point
0, point
1, point
2, …, point
n, where point
0 is the starting point, and point
n is the endpoint, the cost for each segment from point
i-1 to point
i (for i = 1, 2, …, n) can be calculated using the above formulas. Thus, the total cost of the optimal route is:
This approach enables optimal decision-making at each node, ultimately resulting in an efficient UAV search route.


