1. Introduction
The escalating frequency and severity of wildfires worldwide have made them a key focus of environmental and social research. These events, driven by climate change and human land use, pose significant risks not just through immediate destruction but also through their long-lasting impacts on societal structures [
1]. The devastating consequences of these wildfires have revealed how the most socially vulnerable people are disproportionately affected when wildfire strikes. For example, in the 2017 Northern Californian fire, a significant portion of the victims, specifically two-thirds of the 44 casualties, were aged 65 or older [
2]. During the wildfires in Greece in 2007, a tragic loss of 84 lives occurred primarily in rural areas, which were predominantly inhabited by lower-income populations [
3]. The study of how wildfires intersect with social vulnerability is particularly critical—an area gaining importance as certain populations face disproportionately greater challenges during and subsequent to such disasters [
4].
Social vulnerability is defined by the susceptibility of communities to external stressors on human health [
5]. It plays a vital role in understanding the magnitude of impacts observed in the aftermath of a disaster [
6]. However, most research focused on wildfire vulnerability lacks explicit references to the social vulnerability aspects of wildfires [
7]. Social vulnerability to wildfires refers to the susceptibility and capacity of individuals, communities, and social systems to experience adverse impacts and cope with the consequences of wildfires [
8]. It is a multidimensional concept that encompasses various socioeconomic, demographic, and infrastructural factors that influence a community’s ability to cope with, recover from, and adapt to wildfire events [
9]. Social vulnerability considers factors such as age, income, education, access to resources, housing conditions, community support networks, and so on [
10]. Understanding social vulnerability to wildfires is crucial for identifying and addressing disparities, developing targeted interventions, and promoting equitable and effective strategies for wildfire risk reduction and disaster management. Therefore, this study specifically concentrates on the social vulnerability which is highly related to wildfires.
A commonly employed method for evaluating social vulnerability to natural hazards is selecting and assigning weights to a set of indicators and constructing an index utilizing expert knowledge. For example, the Human Development Index was introduced by the United Nations Development Program to evaluate human development beyond traditional economic indicators like gross domestic product per capita [
11]. The Social Vulnerability Index (SoVI) developed by the US Centers for Disease Control and Prevention (CDC) relies on expert judgment for the selection of variables used in its construction [
12]. The Environmental Performance Index (EPI) was first introduced by researchers at Yale University and Columbia University in 2006. It is a composite index developed to assess and compare the environmental performance of countries worldwide [
13]. Cutter et al. introduced a quantitative approach to identify and categorize social vulnerability based on census data [
10]. Numerous studies have developed regional SoVI with a particular focus on assessing vulnerability to wildfires. For example, in the research conducted by Davies et al. [
14], it was revealed that census tracts predominantly inhabited by Black, Hispanic, and Native American populations demonstrated wildfire vulnerability levels of 50% or higher compared to other tracts throughout the US. Similarly, Palaiologou, P. et al. [
4] unveiled the extent of risk exposure faced by socially vulnerable populations by combining wildfire simulations with US census variables.
Social vulnerability is crucial in evaluating wildfires as it highlights the differential impacts and risk distribution among individuals and communities [
15]. Incorporating social vulnerability into wildfire assessments provides a comprehensive understanding of the human dimensions of these disasters, which is essential for addressing economic losses, structural damages, and threats to human life caused by wildfires. This approach also informs the management strategies that aim to prevent wildfires and mitigate risks, ensuring that resources and strategies for hazard reduction are distributed fairly and equitably. In the United States, particularly in the western states and the Pacific Northwest, wildfires are a significant environmental challenge. Annually, these regions experience substantial economic losses due to the high frequency and intensity of wildfires. For instance, the state of Idaho and neighboring areas have reported billions in damages over the past decade, underscoring the need for effective wildfire management strategies that prioritize the most vulnerable populations and locations.
There have been several studies evaluating social vulnerability to wildfires at different scales worldwide. For example, researchers have developed a social vulnerability index using principal component analysis, assessing this index against established measures of wildfire potential and wildland–urban interface designations in the U.S. [
16]. Another study investigated the spatial variation in social vulnerability and wildfire risk at the municipality level in Galicia, Spain, revealing that socioeconomic status, reliance on social programs, and household characteristics significantly contribute to social vulnerability [
17]. Furthermore, research in Germany conducted a spatial assessment of settlement exposure and social vulnerability to forest fires, highlighting the importance of social vulnerability in identifying settlements at potential risk of fire exposure [
18].
However, most social vulnerability assessments to wildfires are static [
19,
20], which means they focus on measuring vulnerability at a particular point in time without accounting for temporal changes and dynamic factors. For example, Zhang et al. conducted a multi-hazard risk assessment considering social vulnerability using machine learning techniques [
21]. These static assessments may inadequately capture the dynamic nature of social vulnerability over time due to their limited consideration of the temporal dimension [
19]. Moreover, static assessments often fail to acknowledge the potential for individuals who are typically not perceived as vulnerable to become vulnerable under specific circumstances [
22]. To address the limitations of static assessments, researchers and policymakers have recognized the need for more dynamic approaches and advanced machine learning methods [
23,
24,
25] to studying social vulnerability to wildfires. The recent literature highlights the importance of examining the dynamic nature of vulnerability over time [
26,
27]. In contrast, dynamic assessments consider temporal changes and the interactions between various factors which can provide a more comprehensive understanding of how vulnerability evolves over time [
20]. For example, Darlington, J.C. et al. [
5] presented an analysis of trends in indicators of social vulnerability across various levels of flood hazard over a 25-year period. Some researchers have examined the stability and heterogeneity of indicators over time and emphasized incorporating dynamics and temporal changes to consider the richness of additional information for the longitudinal monitoring of disaster risk, with a specific focus on vulnerability [
19]. By adopting dynamic assessments, decision-makers can better tailor risk reduction strategies, resource allocation, and emergency planning to address the evolving needs of vulnerable populations. Furthermore, these assessments enable a more proactive and adaptive approach to building community resilience in the face of increasing wildfire occurrences and changing environmental conditions.
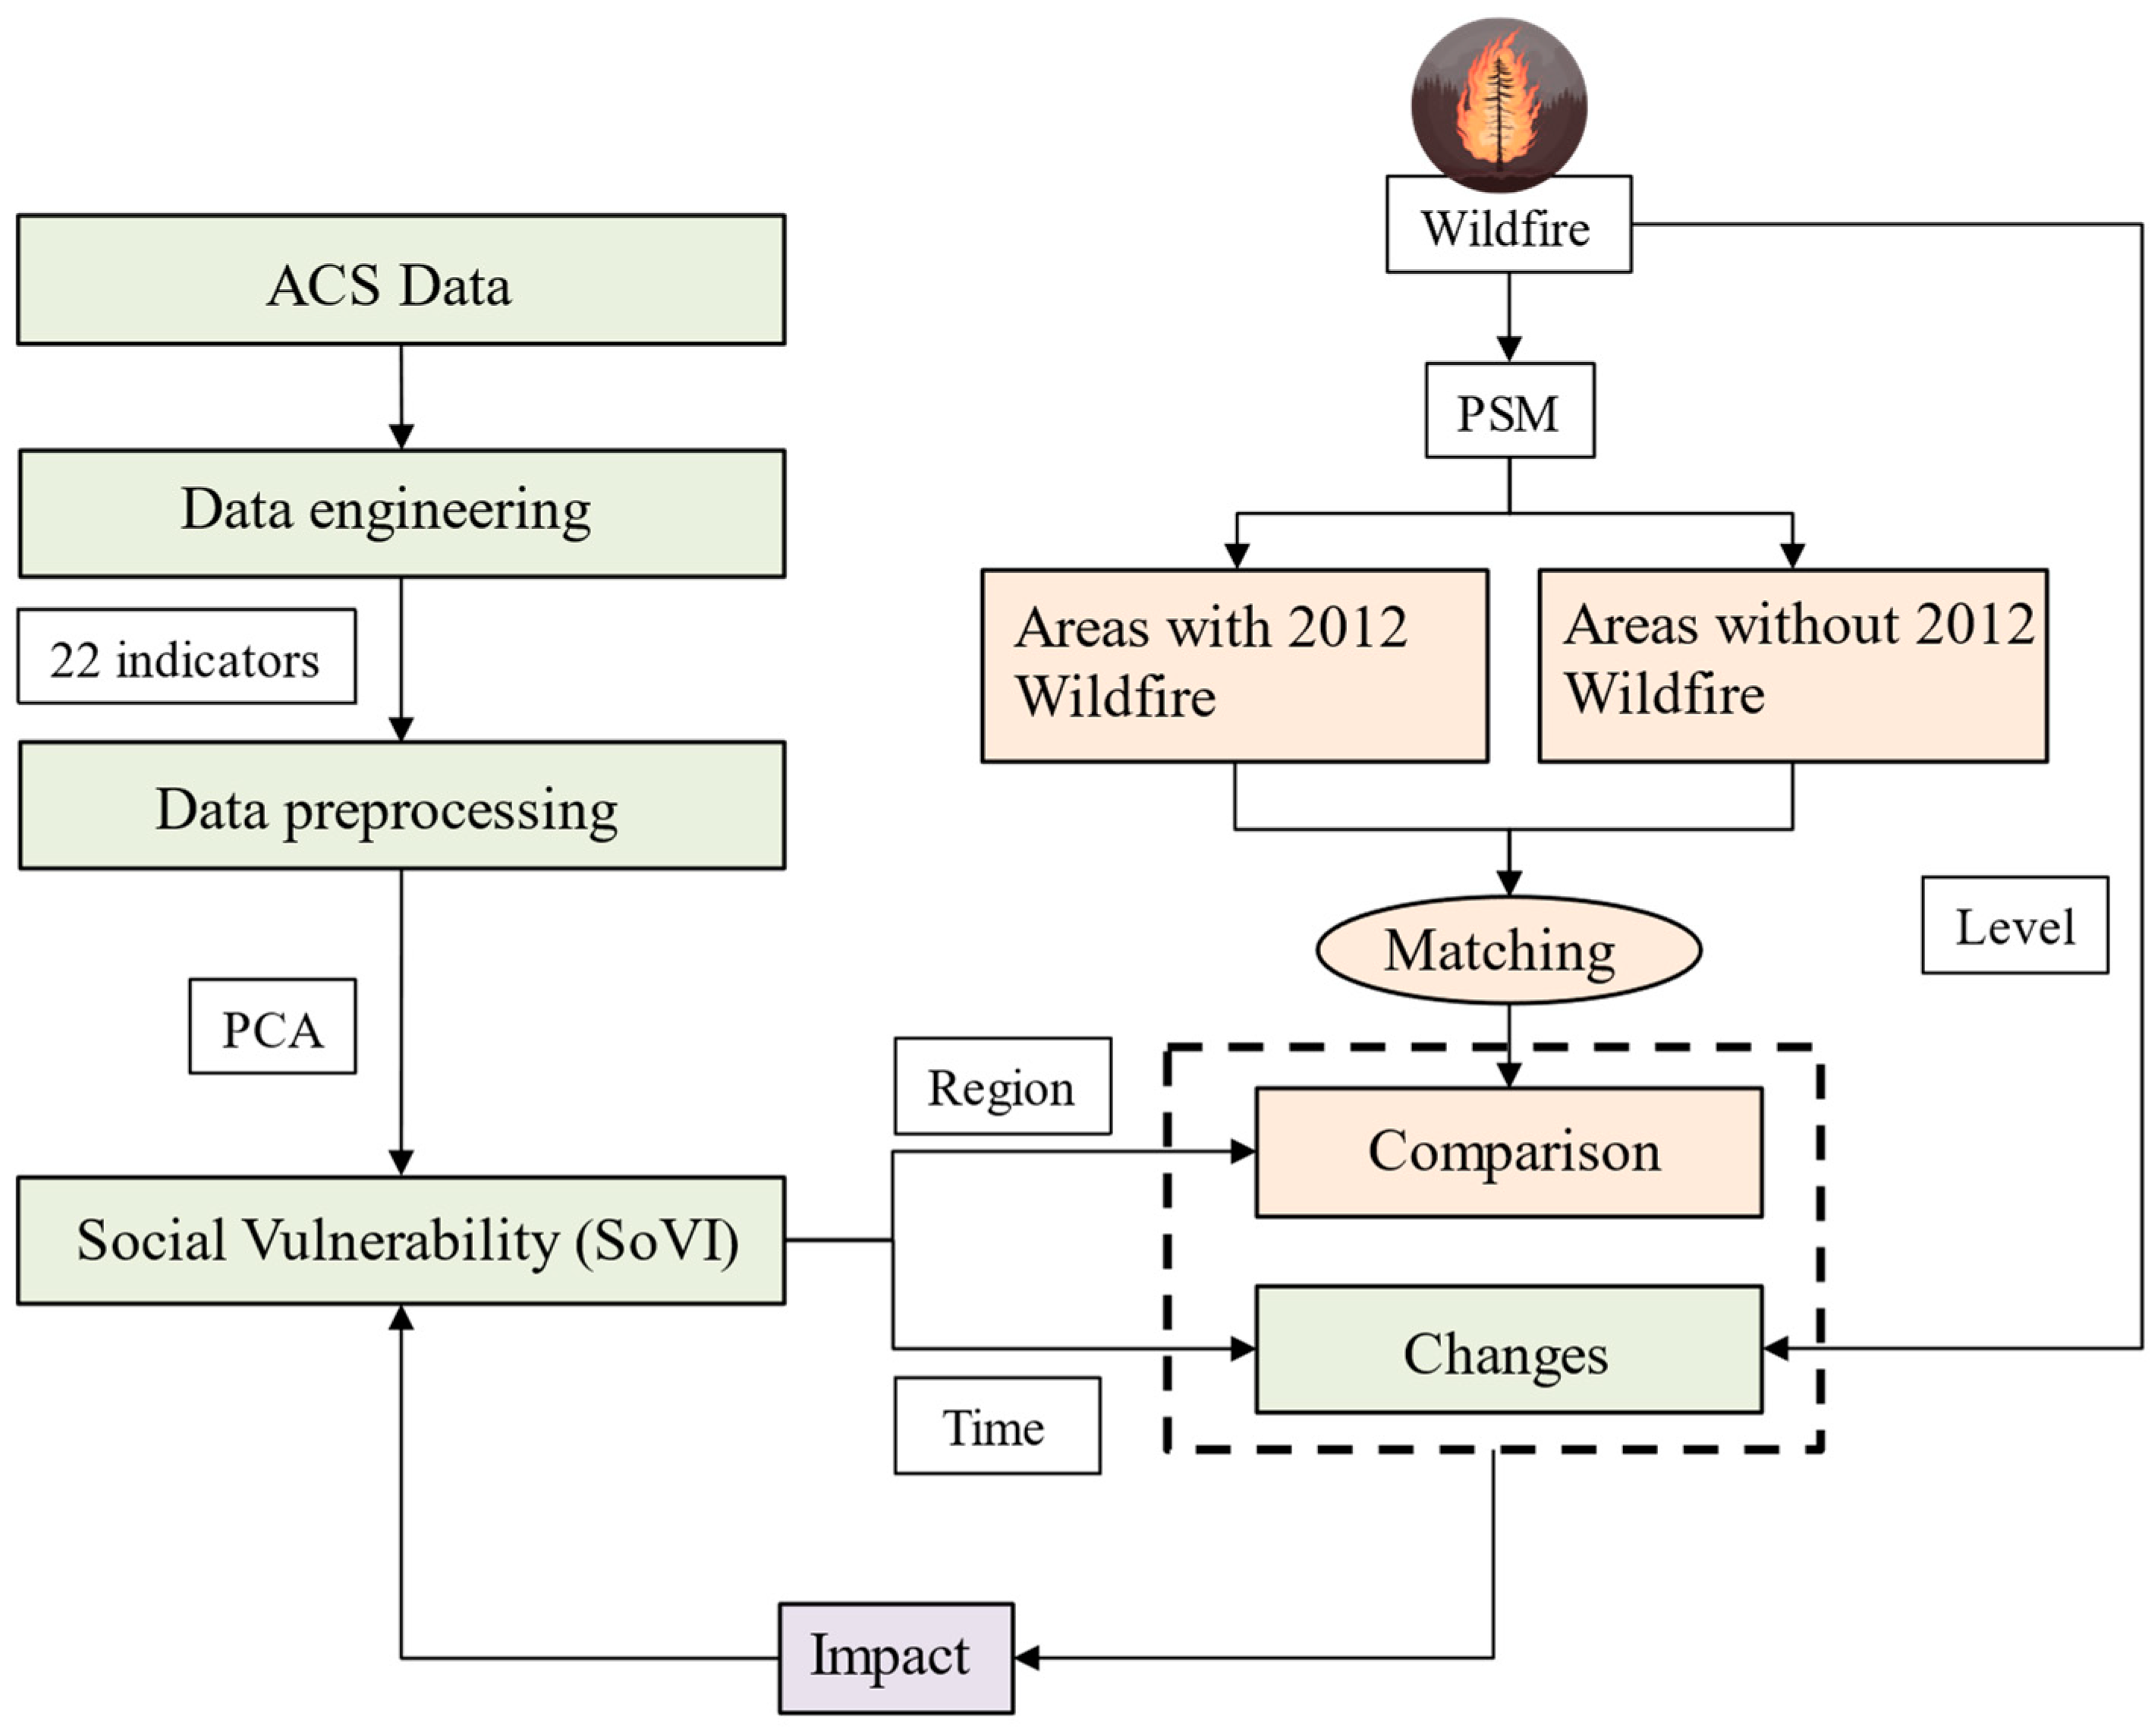
The analysis of social vulnerability, as revealed through the SoVI, provides valuable insights into the spatial–temporal dynamics of vulnerability. Understanding social vulnerability empowers decision-makers to allocate resources effectively, identify underlying factors, prioritize interventions, and enhance overall resilience in the context of wildfire events. Despite the existing literature on social vulnerability, its spatial and temporal dynamics concerning wildfires remain underexplored. This study aims to address this gap by investigating changes in social vulnerability patterns related to wildfires in Idaho. By examining indicators and the SoVI index over time, we lay the groundwork for a longitudinal evaluation of social vulnerability’s impact on wildfire responses. Our study has the three following primary objectives: (1) assess the stability and heterogeneity of indicators used in SoVI calculations over a decade; (2) provide recommendations for the longitudinal monitoring of wildfire risk, with a specific focus on social vulnerability; (3) study the impact of wildfires between a wildfire-affected area and its control group by using mapping techniques. This paper proposes to comprehensively analyze the spatial changes in social vulnerability to wildfires at a local scale using GIS-based tools. It combines the quantitative analysis of social vulnerability indicators with a quasi-experimental study design to provide insights into the relationship between wildfires and social vulnerability. The findings from this research contribute not only to the scientific understanding of social vulnerability to wildfires but also serve as a practical resource to provide insights for decision-making. As wildfire occurrences increase, our study may support the development of sustainable and adaptive strategies to protect vulnerable populations and enhance overall community resilience. By empowering communities with the knowledge to address their unique vulnerabilities, we aspire to promote a more resilient and prepared society, better equipped to face the challenges of wildfire disasters in the future.
3. Results
In this section, the impact of wildfires on time and space is studied.
3.1. Time Influence of Wildfires
The sensitivity analysis of the cutoffs in choosing the PCA components are calculated in order to obtain better SoVI results. The sensitivity analysis results are shown in
Figure 3.
The figure illustrates the impact of various eigenvalue cutoffs on the percentage of cumulative explained variance retained in the PCA results. When retaining components with eigenvalues greater than one, eight components would be retained and approximately 85.54% of the cumulative explained variance is preserved. This suggests that a substantial portion of the dataset’s variability is captured, supporting the robustness of the analyses derived from these components. In contrast, higher cutoffs of 1.5 and 2 retain significantly less variance, at 38.33% each, indicating a steep drop in the variance explained by the retained components. As the cutoff increases to 2.5 and 3, the explained variance further decreases to 28.10% and 15.97%, respectively.
These results highlight the effectiveness of using a cutoff greater than 1, which balances the retention of significant variance against the complexity of the model. Retaining components with eigenvalues greater than one ensures that the majority of the informative variance is included, enhancing the predictive power and stability of the resultant SoVI. Higher cutoffs, while simplifying the model by reducing the number of components, also discard a considerable amount of valuable information, as evidenced by the substantial reduction in explained variance.
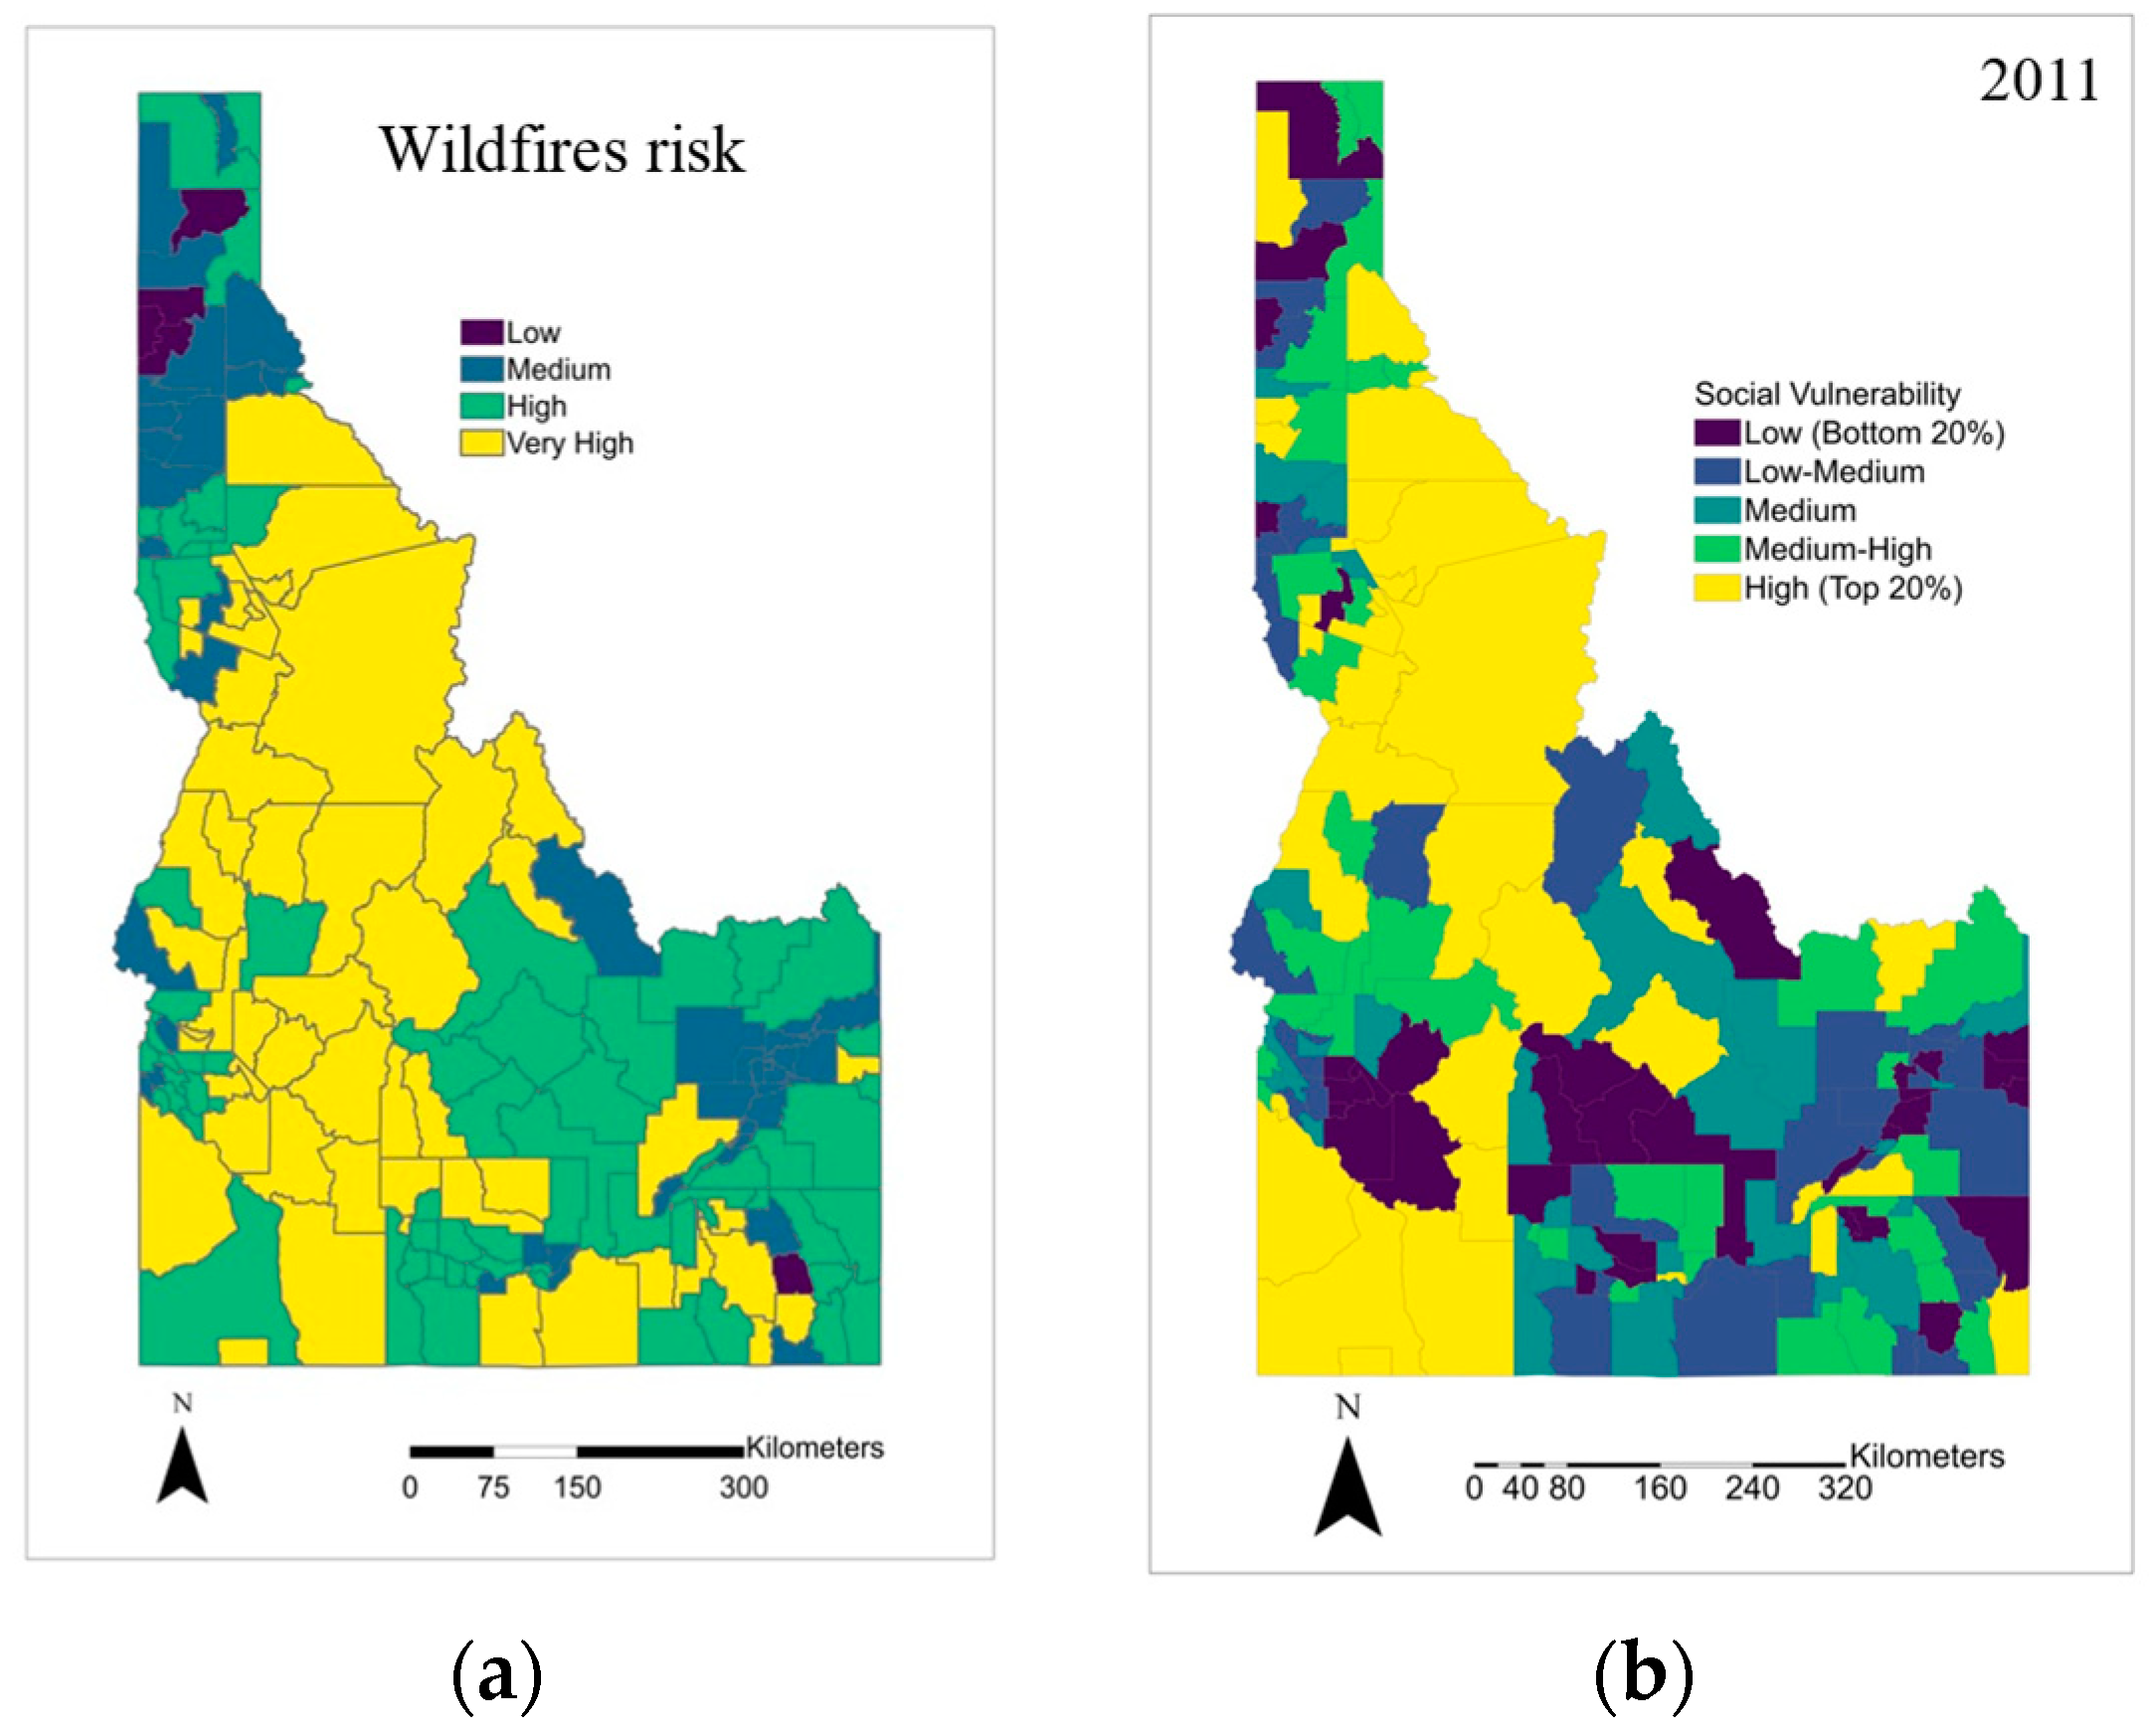
The wildfire level is obtained from the wildfire to communities and it is plotted in
Figure 4a. After the data engineering and data preprocessing, the level of each region is plotted in the Idaho map to show its distribution of the social vulnerability level as shown in
Figure 4b–d.
The wildfire hazard zones in Idaho are in a dispersed distribution. About half of the counties are at a high wildfire risk level, as shown in
Figure 4a. The very-high wildfire risk regions are mainly centered in the middle of the Idaho since the national forest is there and only a small number of people live here.
We plotted the 2011, 2016, and 2020 maps of Idaho to show the main change in the social vulnerability. The sequential maps of social vulnerability (
Figure 4b–d) demonstrate a dynamic landscape of community resilience and vulnerability. Following the major wildfires in 2012, the maps from 2011 to 2016 show a marked increase in vulnerability in the affected areas. This could reflect a multitude of factors including loss of housing, disruption to local economies, and the psychological impact on residents.
By 2020, the SoVI map indicates a regression towards pre-disaster vulnerability levels in many areas. This suggests that recovery initiatives, possibly including federal or state aid, community rebuilding efforts, and economic revitalization programs, have been effective in restoring stability.
Table 1 shows the details of the change. Red color identifies the number of regions that became worse (the social vulnerability level increased) in social vulnerability. The light blue color represents the number of regions where the social vulnerability is decreasing. The light yellow color represents the regions whose SoVI level does not change.
As shown in
Table 1, it can be calculated that, from 2011 to 2016, 38.24% of county subdivisions saw their SoVI level increased, while that number decreased to 34.12% from 2016 to 2020. It means that the ability of society to resist the disaster increased after the wildfire. It is also notable that 26.47% and 32.94% of the region’s SoVI level does not change during the period from 2011 to 2016 and from 2016 to 2020, respectively.
In order to see the overall changes in the SoVI from 2011 to 2020, a box plot is drawn in
Figure 4a. The SoVI distribution in different wildfire level regions is shown in
Figure 4b.
As shown in
Figure 5a, there are 222 subdivisions in each box. And there are a number of outliers in each box plot. This is because of the data processing methods as the use of min–max scaling and PCA for dimension reduction will enhance the visibility of outliers in the dataset. While these techniques help in normalizing the data and reducing dimensionality for better analysis, they can also lead to pronounced differences when extreme values are present. The median value of SoVI in Idaho does not change a lot during 2011 and 2012 since there is no wildfire that happened during this period. However, the SoVI started to increase from 2012, as shown in the red solid line. This is because a big wildfire happened in 2012 which could damage the infrastructures and transportation in society leading to an increase in social vulnerability. There are no long-term trends present in
Figure 5a and the medians of each year seem to average about 0.3, with the most recent two years (2019 and 2020) showing the most variability but fewer outliers.
Figure 5b shows the variance in SoVI with the level of wildfire risk. It appears that there are noticeable differences between the wildfire levels. The region with very high wildfire levels would have higher SoVI which means these regions have high social vulnerability compared to other regions with low wildfire levels. It suggests that wildfire risk level may influence the distribution of the social vulnerability distribution.
3.2. Spatial Influence of Wildfire
Table 2 presents the results of PSM and highlights significant baseline differences between matched wildfire-affected and non-wildfire-affected areas. The locations of matched and control areas in the study area are displayed in
Figure 5.
After matching, we observe an improvement in sample means and standardized mean difference (SMD) across covariates. On average, the wildfire-affected regions have higher proportions of Asian, Hispanic, and native American populations, as well as more renters, females, unoccupied housing units, civilian unemployment, poverty, mobile homes, and employment in extractive and service industries. These areas also have more households receiving social security benefits, households earning over USD 200,000 annually, and higher median housing values. It means that in these regions, the social disparity is severe. On the other hand, they exhibit lower proportions of black populations, children living in married-couple families, people per unit, female-headed households, female participation in the labor force, housing units with no car, and per capita income and median gross rent. Specifically, in comparison to non-wildfire-affected areas, the proportions of females (QFEMALE), unoccupied housing units (QUNOCCHU), mobile homes (QMOHO), and employment in extractive industries (QFEMLBR) are roughly 1.8% (
p-value = 0.5051), 6.0% (
p-value = 0.0825 < 0.1), 3.7% (
p-value = 0.0096 < 0.1), and 7.5% (
p-value = 0.3272) higher in wildfire-affected regions, respectively, while the proportion of female-headed households (QFHH) is 1.2% lower (
p-value = 0.2527). It shows that the QUNOCCHU and QMOHO have significant differences between the wildfire-affected and non-wildfire-affected areas. For a comprehensive view of the differences among all 22 indicators, please refer to
Table 2.
As shown in
Figure 6, the red part represents the places where the 2012 wildfires happened. The related yellow regions are the areas which were affected by the wildfire. The blue part is the region which was matched that could be compared with the yellow areas to evaluate the impact of wildfires on the social vulnerability.
After matching, the effectiveness of the wildfire impact on the social vulnerability is evaluated by ATT values. The ATT value can be regarded as the difference between the yellow and blue regions.
Table 3 displays the unique ATT values specific to wildfire-affected areas within the study region. The
p-value is also calculated to see if there is any significant difference between the matched regions, as indicated in red in
Figure 3. The
is the significance level which is 0.1 in this paper. This table also illustrates the changes in selected indicators between wildfire-affected and non-wildfire-affected areas.
stands for the changes before and after wildfires in wildfire-affected areas, while
represents the changes before and after wildfires in control group.
As we can see from
Table 3, the ATT values quantify the mean differences between the treated areas and control areas for each indicator of social vulnerability before and after the impact of wildfires.
In order to minimize the probability of false positives, which is crucial when multiple comparisons are involved, Bonferroni adjustment is utilized to adjust the significance level. The adjusted significance level can be calculated by the equation below.
where
is the Bonferroni adjusted significance level;
is the original significance level; and
n is the number of multiple comparisons (
n = 22). The adjusted significant value would be 0.00455. There would be no statistical significance in all indicators.
Although there is no statistical significance, some marginal changes can still be observed in certain indicators. In wildfire-affected areas, PERCAP shows an increase compared to non-wildfire-affected areas. That means that personal income increases after the wildfire. It is also interesting to see that the PERCAP in wildfire-affected areas (+ USD 1554.3) and non-wildfire-affected areas (+ USD 89.44) are both increased after the wildfire. Also, there is an increase of 2.74% in the unemployment rate for civilians in the labor force 16 years or over (QCVLUN). It shows that the QCVLUN has an increase in wildfire-affected areas (+1.71%) and a slight decrease in non-wildfire-affected areas (−0.03%). For the percentage of households earning over USD 200,000 annually (QRICH), there is a decrease of approximately 0.77% in ATT. It is interesting to see that the QRICH increased a bit in wildfire-affected areas (+0.92%). It might be caused by the decrease in the population in the area. A marginal decrease can still be observed in certain indicators, including the percentage of children residing in married couple families (QFAM), percentage of renters (QRENTER), percentage of unoccupied housing units (QUNOCCHU), and median gross rent (MDGRENT), within the areas affected by wildfires. Notably, most indicators, such as the percentage of Native American (QNATAM), and percentage of female-headed households (QFHH), remain minimally impacted by wildfires, with results indicating negligible influence.
4. Discussion
This study has offered new insights into the dynamics of social vulnerability in response to wildfire incidents, specifically within the state of Idaho. Our findings, which demonstrate significant increases in social vulnerability post-wildfires, contribute to a deeper understanding of how natural disasters can exacerbate existing socioeconomic disparities. Notably, this research can be applied in other geographical regions and disaster contexts.
The quasi-experimental design utilized in this study, particularly the use of propensity score matching, has proven effective in isolating the impacts of wildfires from other confounding factors. This robust methodological framework is not only pertinent to the study of wildfires but can also be used in other types of disasters such as floods and seismic events. Each of these disasters affects social vulnerability in unique ways, and the ability to adapt and apply a consistent methodological approach across various disaster types can provide comparably reliable and actionable insights. For instance, the increase in unemployment and decrease in higher-income households observed in wildfire-affected areas could similarly be examined in regions affected by floods or earthquakes, providing a holistic view of disaster impacts across different environmental and social settings.
Furthermore, the methods employed in this study can be effectively transferred to different countries or states, where different social, economic, and environmental conditions may prevail. This adaptability is crucial for global disaster management efforts, as it allows for tailored strategies that consider local vulnerabilities and capabilities. For example, regions with higher baseline social vulnerabilities might require different intervention strategies, which can be effectively planned using the analytical framework developed in this study.
In the future, we will focus on incorporating a larger dataset that encompasses more diverse socio-economic indicators and a broader geographical area which could provide a more comprehensive understanding of the impacts of disasters on social vulnerability. More extensive data could enable a more nuanced analysis of how different demographics are uniquely affected by disasters, leading to more targeted and effective policy interventions. Also, we will extend the timeframe of the study which could yield valuable insights into the long-term effects of disasters on social vulnerability. Longitudinal studies would allow researchers to observe recovery processes and the sustainability of resilience measures over time, providing a clearer picture of disaster impacts and recovery trajectories. Moreover, we can apply the methodology to different types of disasters within the same geographical regions. It could help identify commonalities and differences in social vulnerability responses to various disaster types. This could significantly enhance disaster preparedness and response strategies, making them more adaptable to the specific nature of the threat. By doing this comparison, the impact of wildfires on social vulnerability can be evaluated and studied more comprehensively.
5. Conclusions
This study has conducted an in-depth analysis of changes in social vulnerability to wildfires on a local scale in Idaho, analyzing data spanning a decade. Our findings reveal a quantifiable increase in social vulnerability in areas affected by wildfires. Specifically, these regions experienced a 2.74% increase in the unemployment rate and a 0.77% decline in the proportion of households earning over USD 200,000 annually. These statistics may highlight the severe socio-economic impacts of wildfires on vulnerable populations and underscore the urgent need for targeted intervention and robust policy frameworks.
Through the application of quasi-experimental designs like propensity score matching, this research has demonstrated some possible differences in social and economic indicators between wildfire-affected areas and their unaffected counterparts. This methodology provided tentative evidence that wildfires lead to increased social vulnerability, thereby complicating recovery and resource allocation efforts.
Furthermore, our study may contribute to the broader discourse on disaster risk reduction by illustrating the critical importance of incorporating social vulnerability assessments into wildfire management and planning processes. By prioritizing these assessments, policymakers and disaster response organizations can identify at-risk communities more effectively, enabling more precise and effective mitigation strategies.
Despite the findings, the study’s geographic focus on Idaho and its temporal limitation calls for further research in diverse settings and over longer periods. Future studies should aim to include broader socio-economic data and explore advanced predictive models to manage the social impacts of wildfires more effectively.
In conclusion, this study not only advances our understanding of the relationship between wildfires and social vulnerability but also serves as an essential resource for developing equitable and efficient strategies to enhance community resilience against such disasters. The insights provided should guide both future research and practical disaster management initiatives, ensuring that interventions are well-informed and appropriately targeted to support the most vulnerable populations effectively.


