Article

Time Delay Estimation for Acoustic Temperature Measurement of Loose Coal Based on Quadratic Correlation PHAT-β Algorithm

by
Yin Liu
1,2,
Jun Guo
1,3,*,
Wenjing Gao
1,3,
Hu Wen
1,3,
Guobin Cai
1,3,4,
Yongfei Jin
1,3 and
Kaixuan Wang
1
1
College of Safety Science and Engineering, Xi’an University of Science and Technology, Xi’an 710054, China
2
College of Energy Engineering, Xi’an University of Science and Technology, Xi’an 710054, China
3
National Mine Emergency Rescue Xi’an Research Center, Xi’an 710054, China
4
Shaanxi Xikuang Zhitong Technology Co., Ltd., Xi’an 710054, China
*
Author to whom correspondence should be addressed.
Fire 2024, 7(7), 228; https://doi.org/10.3390/fire7070228
Submission received: 22 May 2024 / Revised: 23 June 2024 / Accepted: 24 June 2024 / Published: 1 July 2024

Abstract

The acoustic temperature measurement method has a broad application prospect due to its advantages of high precision, non-contact, etc. It is expected to become a new method for hidden fire source detection in mines. The acoustic time of flight (TOF) can directly affect the accuracy of acoustic temperature measurement. We proposed a quadratic correlation-based phase transform weighting (PHAT-β) algorithm for estimating the time delay of the acoustic temperature measurement of a loose coal. Validation was performed using an independently built experimental system for acoustic temperature measurement of loose coals under multi-factor coupling. The results show that the PHAT-β algorithm estimated acoustic TOF values closest to the reference line as the sound travelling distance increased. The results of coal temperature inversion experiments show that the absolute error of the PHAT-β algorithm never exceeds 1 °C, with a maximum value of 0.862 °C. Using the ROTH weighted error maximum, when the particle of the coal samples is 3.0–5.0 cm, the absolute error maximum is 4.896 °C, which is a difference of 3.693 °C from the error minimum of 1.203 °C in this particle size interval. The accuracy of six algorithms was ranked as PHAT-β > GCC > PHAT > SCOT > HB > ROTH, further validating the accuracy and reliability of the PHAT-β algorithm.

1. Introduction

Coal, as one of the world’s major fossil energy sources, will continue to play an important role in the coming decades [1,2]. Coal consumption will account for 56.2 per cent of total energy consumption in China in 2022, an increase of 4.3 per cent from 2021 [3]. A spontaneous coal combustion disaster, as one of the most serious disasters in the process of coal mining, most often occurs in underground mining areas and other hidden spaces [4,5]. It is difficult for existing coal fire temperature measurement technology to detect the spontaneous combustion temperature of the loose coals in real time and accurately [6,7,8]. Acoustic temperature measurement is a non-contact temperature measurement technique that uses the relationship between the propagation velocity of acoustic waves and the temperature of the medium for temperature measurement. It has the advantages of high precision, wide range, large measurable space, non-contact, real-time continuity, etc. in the field of monitoring [9], and has a broad application prospect, as it is expected to become a new method for the detection of hidden fire sources in mines. Acoustic TOF is the most important parameter in acoustic temperature measurement, and its measurement error directly affects the accuracy of acoustic temperature measurement. There are other factors leading to the error, such as the uncertainty of the propagation speed and propagation path of the sound wave, the positional error of the sound source and receiver, and the interference of the environmental noise [10,11,12]. In order to improve the accuracy of acoustic temperature measurement, it is necessary to consider and optimize the design of these error factors, and to use appropriate algorithms and techniques for error correction and data processing [13,14,15]. Most scholars at home and abroad use the mutual correlation function method as the time-delay estimation algorithm of acoustic TOF when measuring acoustic TOF [16,17]. The method is based on the time difference between the propagation of sound waves at different locations; the received signal is used to perform a cross-correlation operation with a reference signal, and the peak value obtained corresponds to the time delay of the propagation of the sound wave. By inverting this time delay, the propagation speed and distance of the sound wave are calculated [14,17]. However, in the application process, the measurement of acoustic TOF needs to face the problems of sound wave attenuation and interference of background noise. The study of suitable acoustic delay estimation algorithms can effectively solve the interference in the measurement and ensure the accuracy of the acoustic TOF obtained. Therefore, much research has been carried out on the acoustic TOF estimation algorithm by relevant experts and scholars at home and abroad.
The Wiener–Khinchin theorem [18] shows that the mutual correlation function and mutual power spectral function for the time-delay estimation of the two signals are obtained by Fourier transform (FFT), and the spectra can be filtered by using different weighting functions of the generalized mutual correlation method, which reduces the effect of noise on the time-delay estimation results. Knapp [19] and Hero [20] et al. proposed generalized cross-correlation algorithms to eliminate or attenuate the effects caused by noise on cross-correlation time-delay estimation. Chen [21] analyzed the performance of several weighting functions in the generalized mutual correlation time-delay estimation algorithm; in comparison, PHAT weighting is characterized by small fluctuations, sharp peaks, and strong anti-interference ability. Wang [22] proposed a generalized mutual correlation time-delay estimation method based on RLS adaptive filtering, which provides higher time-delay estimation accuracy and lower estimation error than the generalized mutual correlation algorithm and the quadratic correlation algorithm in a low signal-to-noise ratio environment. Nikias and Pan [23,24] proposed a time-delay estimation method based on the third-order cumulants, but this method requires the inverse of the matrix, and it is difficult to estimate the time-delay if the matrix is a pathological matrix. Hsing-Hsing and Nikias [25,26] proposed a time-delay estimation method based on third-order cumulants and adaptive time-delay estimation methods based on previous studies. The method is applicable to time-delay estimation of non-Gaussian signals in the context of correlated additive Gaussian noise with unknown statistical properties, which can effectively suppress the effect of additive noise and improve the accuracy of time-delay estimation of acoustic TOF.
Time-delay estimation is well developed in the field of signal processing, such as generalized correlation based on wavelet transform [27], time-delay estimation based on time-frequency analysis [28], adaptive time-delay estimation based on genetic algorithms [29], and time-delay estimation based on wavelet neural networks [17]. However, these methods still have shortcomings, such as narrow application range, immature theory, large computational effort, and inability to meet the demand of real-time and rapid measurement. Therefore, this paper proposes a time-delay estimation of acoustic temperature measurement in loose coals based on the quadratic correlation PHAT-β algorithm, and verifies the feasibility of the algorithm by constructing an acoustic TOF measurement system in loose coals in an air-mining area and combining it with simulation and modeling methods. It is of great significance for the application of acoustic measurement technology in the field of temperature monitoring of loose coals in the mining area.

2. Basic Theory

The method of measuring the acoustic TOF of loose coals based on cross-correlation is to directly cross-correlate the sound source signals received by the microphones under two different positions, calculate the cross-correlation function under different time delays τ, and thus determine the value of the acoustic TOF of the sound source signals between the microphones under two different positions. The basic idea of generalized cross-correlation is to pre-filter the received signals before carrying out correlation operations to improve the time-delay estimation performance of direct cross-correlation operations. By pre-filtering the signal, the influence of background noise can be effectively suppressed to improve the measurement accuracy and reliability [17].
The principle of generalized cross-correlation is shown in Figure 1.
The ideal mathematical model is shown in Equation (1):
{ x 1 ( k ) = s ( k ) + w 1 ( k ) x 2 ( k ) = α s ( k + D ) + w 2 ( k )
where x1(k) and x2(k) are functions of the acoustic signals received by the proximal and distal microphones 1 and 2, respectively; s(k) is a function of the acoustic source signal received by x1(k); D refers to the sound travel-time delay between the two microphones; α refers to the relative attenuation coefficient during propagation of the acoustic signal; w1(k) and w2(k) are the noise functions received by the two microphones, respectively; and it is assumed that s(k), w1(k), and w2(k) are mutually uncorrelated smooth stochastic processes.
Where the mutual power spectral function of signals x1(k) and x2(k) is obtained as Equation (2) after performing a fast Fourier transform on the acoustic signals x1(k) and x2(k):
{ G y 1 y 2 ( f ) = H 1 ( f ) H 2 G x 1 x 2 ( f ) x x 1 x 2 ( f ) = F [ x 1 ( k ) ] F [ x 2 ( k ) ]
where * is complex conjugation. The generalized cross-correlation function between x1(k) and x2(k) can be expressed as Equation (3):
R y 1 y 2 ( τ ) = F 1 [ G y 1 y 2 ( f ) ] = ψ ( f ) G x 1 x 2 ( f ) e j 2 π f τ d f
where ψ ( f ) = H 1 ( f ) H 2 ( f ) ; F 1 is the Fourier inverse transform.
The estimate of G x 1 x 2 ( f ) from the finite observation x 1 ( n ) and x 2 ( n ) ( n = 1 , 2 , 3 , , N ) of x 1 ( k ) and x 2 ( k ) is G ^ x 1 x 2 ( f ) , so the above formula can be expressed as Equation (4):
R ^ y 1 y 2 ( τ ) = F 1 [ G y 1 y 2 ( f ) ] = ψ ( f ) G ^ x 1 x 2 ( f ) e j 2 π f τ d f
In Equation (2), ψ ( f ) = H 1 ( f ) H 2 * ( f ) is the weight function of the generalized cross-correlation time-delay estimation method. Common weight functions are ROTH, SCOT, PHAT, HB, and Eckart weight functions and ML (or HT) weight functions. The following different weight functions and improved quadratic correlation PHAT-β time-delay estimation algorithm are proposed to be studied in this paper.
(1)
Generalized Cross-Correlation (GCC)
The weight function of the GCC is 1 [30]. Before the acoustic TOF time-delay estimation, the power spectral density function of the sample function is calculated using the Fourier transform, and then the correlation function is calculated indirectly by performing the Fourier inverse transform on the power spectral density function, as in Equation (5):
R ^ 12 ( τ ) = F 1 [ F ( x 1 ) F ( x 2 ) ]
(2)
ROTH weighting
The ROTH weighting function is shown in Equation (6):
ψ ( f ) = 1 G x 1 x 1 ( f )
The GCC function is shown in Equation (7):
R ^ y 1 y 2 ( f ) = G ^ x 1 x 2 ( f ) G x 1 x 2 ( f ) e j 2 π f τ d f
ROTH weighting in generalized cross-correlation is equivalent to Wiener filtering, which can effectively suppress larger frequency bands in ambient noise.
(3)
Smooth Coherence Transform (SCOT) weighting
The weighting function is shown in Equation (8):
ψ ( f ) = 1 G x 1 x 1 ( f ) G x 2 x 2 ( f )
Then the generalized cross-correlation function is shown in Equation (9):
R ^ y 1 y 2 ( f ) = G ^ x 1 x 2 ( f ) G x 1 x 1 ( f ) G x 2 x 2 ( f ) e j 2 π f τ d f
The correlation coefficient is shown in Equation (10):
γ ^ 12 = G ^ x 1 x 2 ( f ) G x 1 x 1 ( f ) G x 2 x 2 ( f )
SCOT weighting in generalized cross-correlation similarly suppresses noise effects.
(4)
Phase Transform (PHAT) weighting
The weighting function is shown in Equation (11):
ψ ( f ) = 1 | G x 1 x 2 ( f ) |
Then the generalized cross-correlation function is shown in Equation (12):
R ^ y 1 y 2 ( f ) = G ^ x 1 x 2 ( f ) | G x 1 x 2 ( f ) | e j 2 π f τ d f
The PHAT weighting in generalized cross-correlation is equivalent to a whitening filter, which also suppresses noise effects after whitening the signal.
(5)
HB weighting
The weighting function is shown in Equation (13):
ψ ( f ) = | G x 1 x 2 ( f ) | G x 1 x 1 ( f ) G x 2 x 2 ( f )
Then the generalized cross correlation function is shown in Equation (14):
R ^ y 1 y 2 ( f ) = | G x 1 x 2 ( f ) | G x 1 x 1 ( f ) G x 2 x 2 ( f ) G ^ x 1 x 2 ( f ) e j 2 π f τ d f
The HB weighting has a suppression effect on the periodic components of the signal, and the effect is close to that of the GCC at low signal-to-noise ratios.
(6)
PHAT-β time-delay estimation algorithm based on quadratic correlation
Both the GCC-PHAT algorithm and the quadratic correlation algorithm can filter out some of the background noise effects on the acoustic TOF time-delay estimation results. The GCC-PHAT algorithm improves the signal-to-noise ratio and thus the measurement accuracy through weighting, which causes large errors when the signal-to-noise ratio is low. The quadratic correlation algorithm suppresses the effect of noise through the correlation function and has good noise immunity, but its time-delay estimation accuracy needs to be improved. Shen [31] proposed the PHAT-β generalized cross-correlation algorithm based on quadratic correlation, whose mutual power spectral function is shown in Equation (15):
G R x = F [ R x 1 , x 1 ] F [ R x 1 , x 2 ( n ) ]
The weighted reciprocal power spectral function is Fourier-inverted to obtain the time-delay estimation.
For the purpose of acoustic fly-through time measurement in a loose coal body, a mathematical model for acoustic delay estimation is constructed here, and a single-path acoustic fly-through time measurement device is taken as an example, which comprises a loudspeaker for transmitting acoustic signals and two microphones, 1 and 2, for receiving acoustic signals at different positions.
A schematic of the acoustic TOF measurement system is shown in Figure 2:
{ P A ( k ) = F [ x 1 ( n ) ] P B ( k ) = F [ x 2 ( n ) ]
where PA(k) is the spectrum of acoustic signal at point A; PB(k) refers to the spectrum of acoustic signal at point B; and F [·] is Fourier transform, as shown in Equation (17):
{ P A ( k ) = 1 r 1 P 0 ( k ) e α ( k ) r 1 e 2 π N n A k P B ( k ) = 1 r 2 P 0 ( k ) e α ( k ) r 2 e 2 π N n B k
where k is the thermal diffusivity taken as 2.21 × 10⁻⁵ m2/s; nA, nB are the number of points of time delay of the sound wave from the loudspeaker to the microphone at point A and point B, respectively; α(k) refers to the acoustic attenuation coefficient in a loose medium as shown in Equation (18):
α ( k ) = 2 F π f s d c 0
where F is the thermodynamic parameter of gas composite inside the loose medium, and the gas inside the loose coals in the text is all air, which is taken as 0.0047 m/s1/2; c0 is the adiabatic speed of sound in free space, which was determined to be 342.95 m/s.
Since x2(n) is the delayed signal of x1(n) with the number of time-delay points n0 = nB − nA, it can be obtained according to Equation (19):
P B ( k ) = r 1 r 2 P A ( k ) e α ( k ) ( r 2 r 1 ) e 2 π N n 0 k
where N is the observed length of the signal. The number of delay points can be calculated by applying n0 = fs·(l/cg); fs is the sampling frequency of the signal; l refers to the distance between points A and B; cg is the speed of sound propagation between two points A and B in a loose medium. The above three can be set up as needed.
A Fourier inverse transform is applied to both ends of Equation (20):
x 2 ( n ) = F 1 [ P B ( k ) ] = F 1 [ r 1 r 2 P A ( k ) e α ( k ) ( r 2 r 1 ) e 2 π N n 0 k P A ( k ) ]
where n0 = fs·(l/cg) is time-delay points and F−1[·] is Fourier inverse transform.
During the simulation of the acoustic TOF measurement using MATLAB R2024a, the distance parameters r1 and r2, as well as the signal form of x1(n) and the time delay n0, are first set according to Figure 2. The average pore diameter d between the measured media, the thermodynamic parameter F of the gas contained between the pores, and the speed of sound c0 in free space at the same temperature as the medium are then determined from the simulated loose medium. Then α(k) is calculated by Equation (18), and finally x2(n) can be found according to Equation (20). The band noise signal is generated by adding x1(n) and x2(n) to Gaussian white noise with different signal-to-noise ratios. After Fourier-transforming these signals, the acoustic propagation time estimation algorithm based on the cross-correlation theory is used to calculate them in the frequency domain. Finally, the results are converted to time-domain cross-correlation waveforms by Fourier inversion to find out the location of the maximum peak in the waveforms and finally determine the acoustic wave propagation time.

3. Experimental Systems and Methods

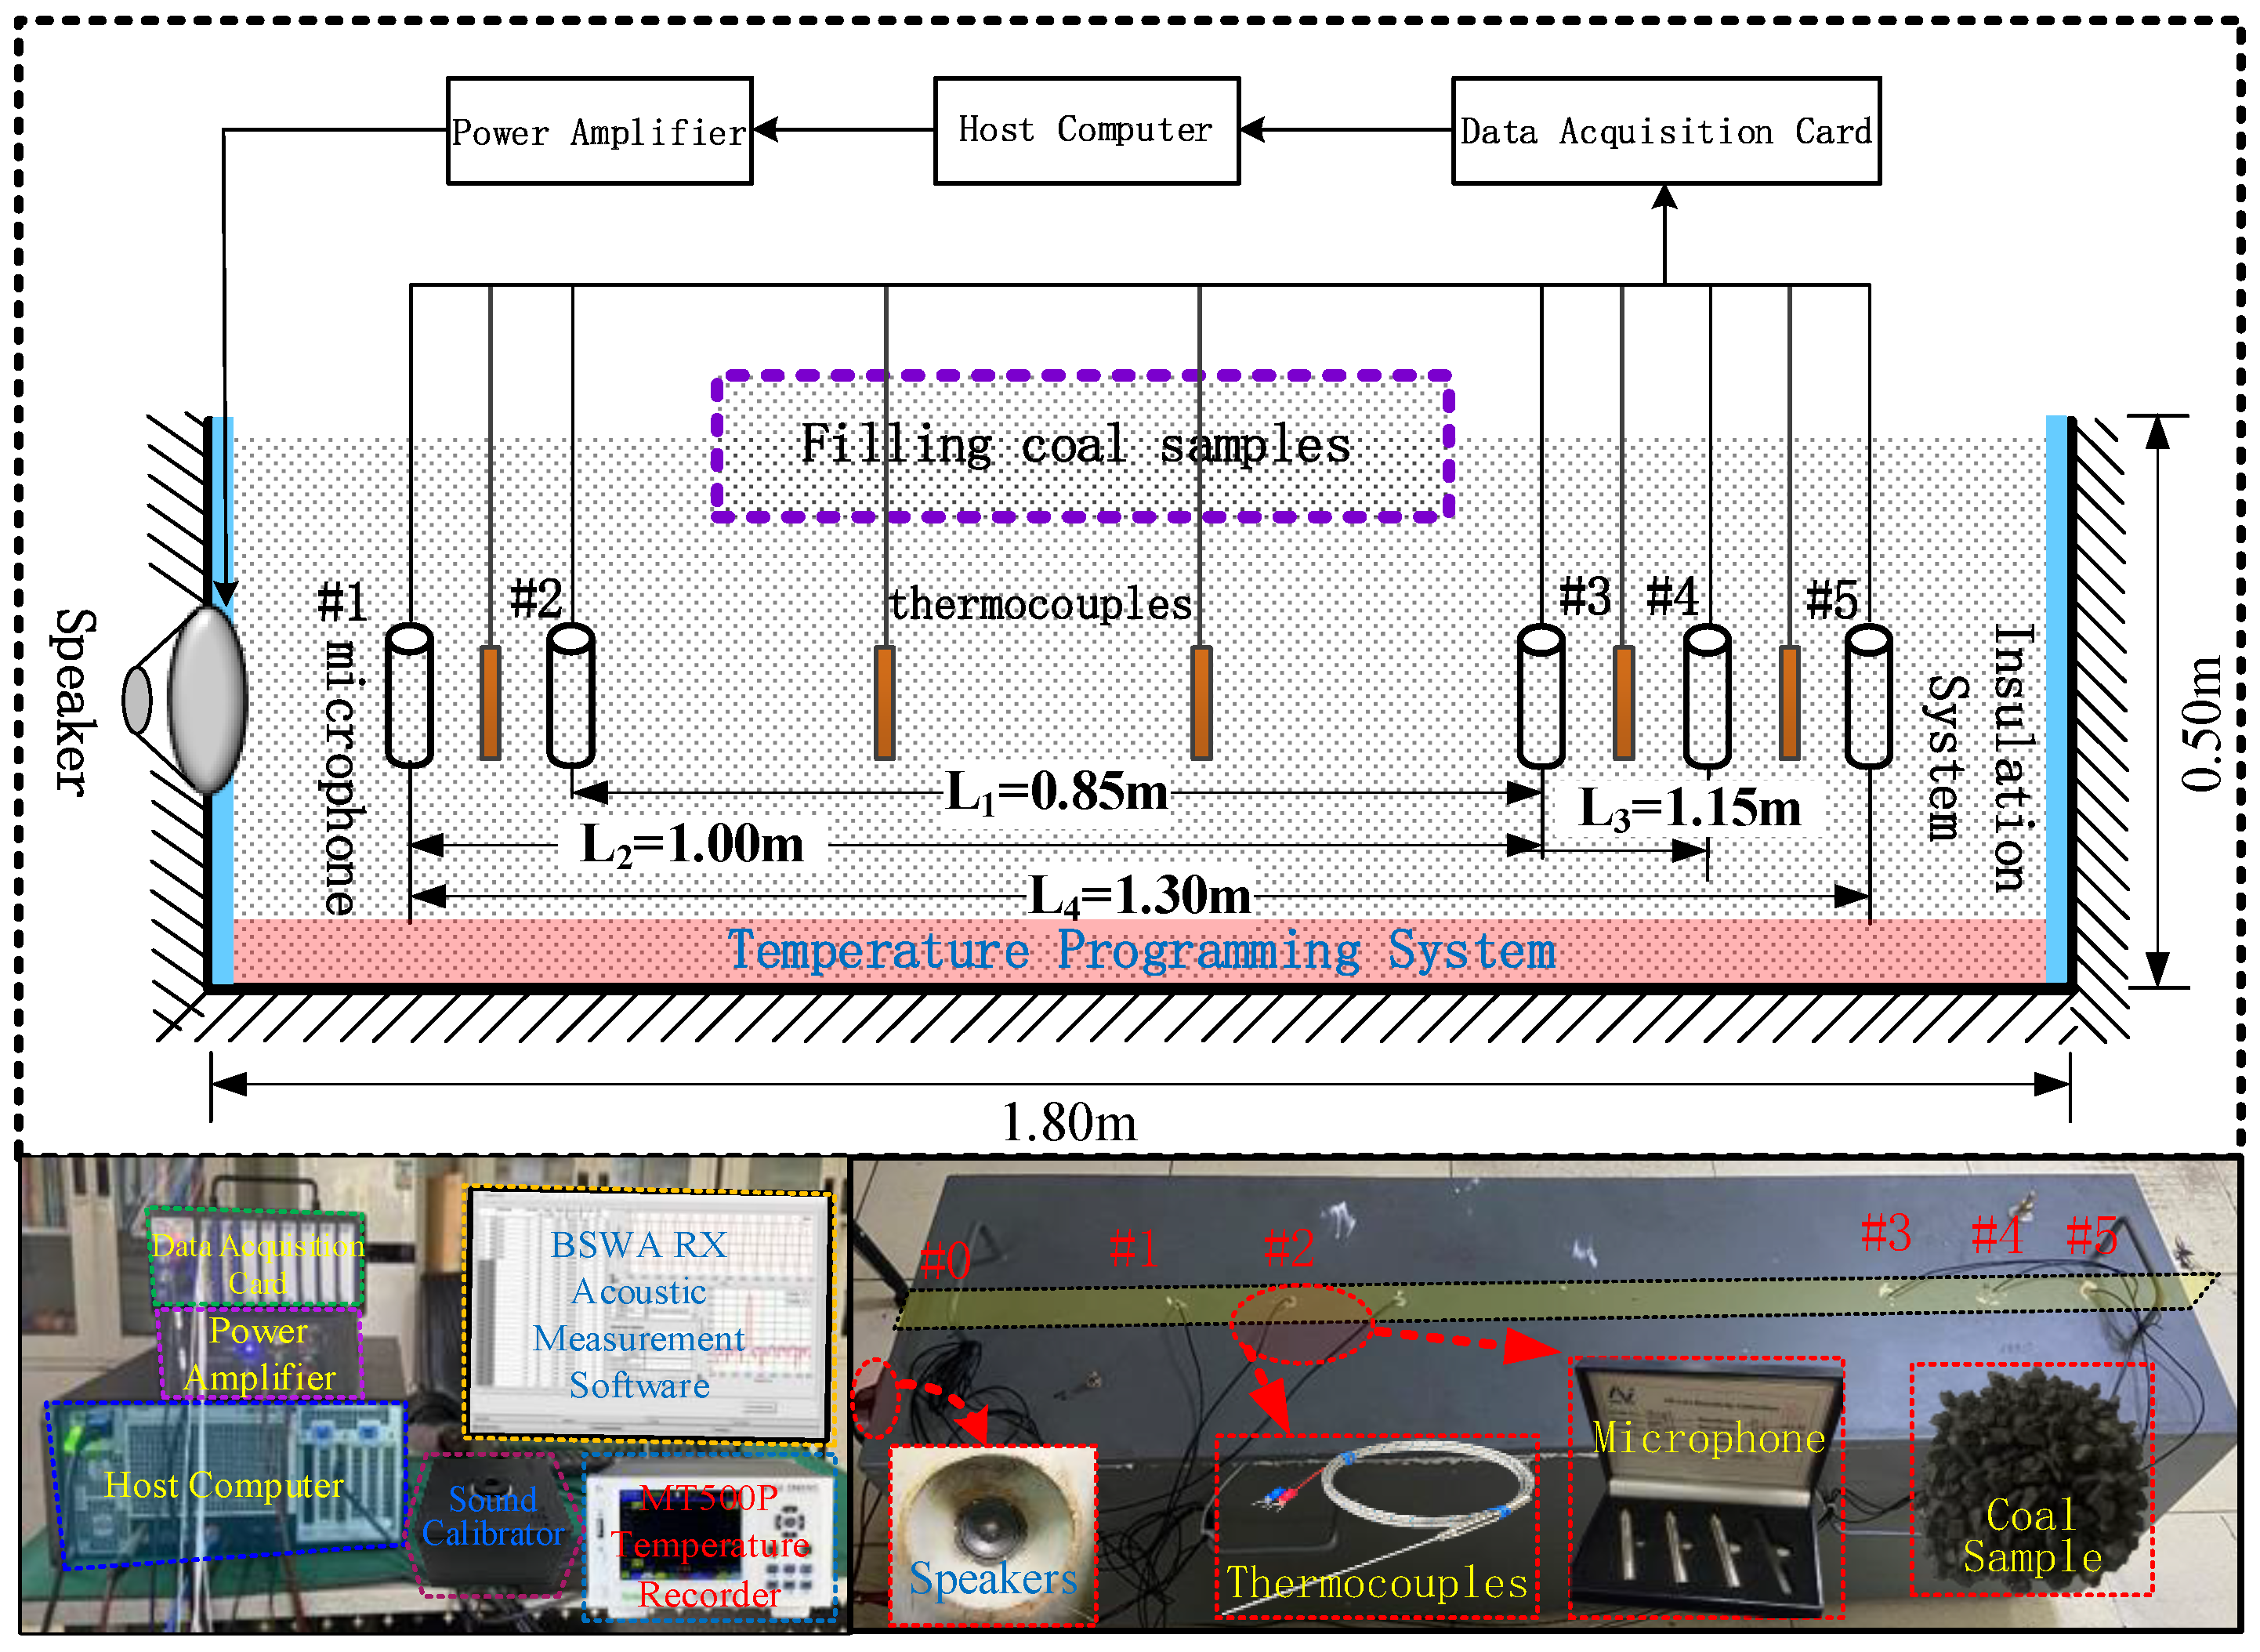
3.1. Experimental System

Based on the acoustic time-delay estimation mathematical model, an experimental system for acoustic temperature measurement of loose coals by acoustic method under multi-factor coupling is designed and constructed, as shown in Figure 3. The main part of the system includes the acoustic wave transceiver part and the coal sample box. The acoustic transceiver system uses a linear layout. It consists of a loudspeaker, a microphone, an amplifier, and a data acquisition card to form a single path for acoustic TOF measurement. The coal sample box is made of iron with sound-absorbing material attached to it to weaken the effect of reflected sound waves on the experimental results, and the size of the box is 180 cm × 50 cm × 50 cm.

3.2. Experimental Parameter Setting

As two acoustic source signals that have been widely used [32], sweep signals are simple to produce and easy to adjust [12], and pseudo-random signals have been widely used in the field of acoustic TOF measurements [33]. Therefore, the acoustic TOF measurement experiments will be carried out using these two acoustic source signals separately.
In this study, the maximum frequency of the sound source signal is 3 kHz, so the minimum sampling frequency should be 6 kHz [34]. In order to ensure the measurement accuracy and improve the sampling frequency, this paper selects the acquisition frequency fs of the sound source signal as 51,200 Hz [35,36,37].
When using the mutual correlation function as the acoustic TOF estimation algorithm, if the number of acoustic TOF delay points is n 0 = D f s , then the number of sampling points and the number of acoustic TOF delay points should satisfy: N > 4 n 0 [31,33]. According to a large amount of data in the previous period, the acoustic TOF in the experimental loose coals is roughly D = 3~6 ms. For a sampling frequency of 51,200 Hz, the calculation gives the number of sampling points of the sound source signal N > 4 n 0 = 4 D f s = 4 × 6 × 51.2 ≈ 1229.
This paper focuses on the early prevention and control of spontaneous coal combustion, as shown in Figure 4. When the temperature of the coal body reaches 30 °C, the warning level has reached grey [34]. Therefore, the experimental temperature is selected as 30–50 °C, and every 5 °C is a node.
Consider that the mechanical properties, porous medium, and other characteristics of loose coal in the mining area are similar to those of grain storage particles. With reference to the grain size, the size of the coal samples used in the experiment was greater than and equal to the grain size. The final sizes of coal samples were 0.5–0.8 cm, 0.8–1.0 cm, 1.0–3.0 cm, and 3.0–5.0 cm.

3.3. Experimental Conditions and Methods

Step 1: Long-flame coal was selected, crushed, and sieved into samples of 300 kg in each of the four size ranges mentioned above, and the required samples were spread evenly in the box.
Step 2: Thermocouples were inserted in the coal body at an insertion depth of 28.5 cm from the top plate with the microphone, and the initial temperature was 20 °C for the equipment. Let the measurement microphone intervals be L1 = 0.85 m, L2 = 1.00 m, L3 = 1.15 m, and L4 = 1.30 m, respectively.
Step 3: The experimental sound sources were set to be swept frequency signals and pseudo-random signals, respectively, and filtered by FIR filters. Adjust the sampling parameter to 51,200 Hz [35,36,37].
Step 4: Adjust the acoustic frequency to 1000–3000 Hz [35,36,37] so that the attenuation coefficient α(k) of the original and delayed signals is 1.
Step 5: GCC, ROTH, SCOT, HB, PHAT, and quadratic correlation PHAT-β weighting algorithms are used for acoustic TOF time-delay estimation and analytical processing [31].
Step 6: The swept frequency signal was made to be the acoustic source signal, and the four grain-size coal samples were heated to 30, 35, 40, 45, and 50 °C, respectively [38]. Only the quadratic correlation PHAT-β weighting algorithm was used to carry out step 5, and the experimental results of the coal temperature inversion of the quadratic correlation PHAT-β weighting algorithm for coal samples of different particle sizes were obtained.

3.4. Acoustic Source Signal Generation

3.4.1. Sweep Signal

Based on MATLAB software, chirp function is used to prepare the required swept signal. Its point frequency is 50 kHz, the signal band range is 1000~3000 Hz, the number of sampling points is 32,767, the sampling time t is 0.1 s, the delay time is set to 1 ms, and the number of delay points n0 is 50 sampling points. The background noise within the actual collected loose coals was used as the noise for the delayed signal. To control the variables, the attenuation coefficient α(k) of the original and delayed signals is made to be 1.

3.4.2. Pseudo-Random Signal

Based on the MATLAB software, an m-sequence of order 15 (period 215-1 = 32,767) with the principal polynomial of x15 + x + 1 is generated (the “0” in the m-sequence is denoted by −1 in the signal preparation).

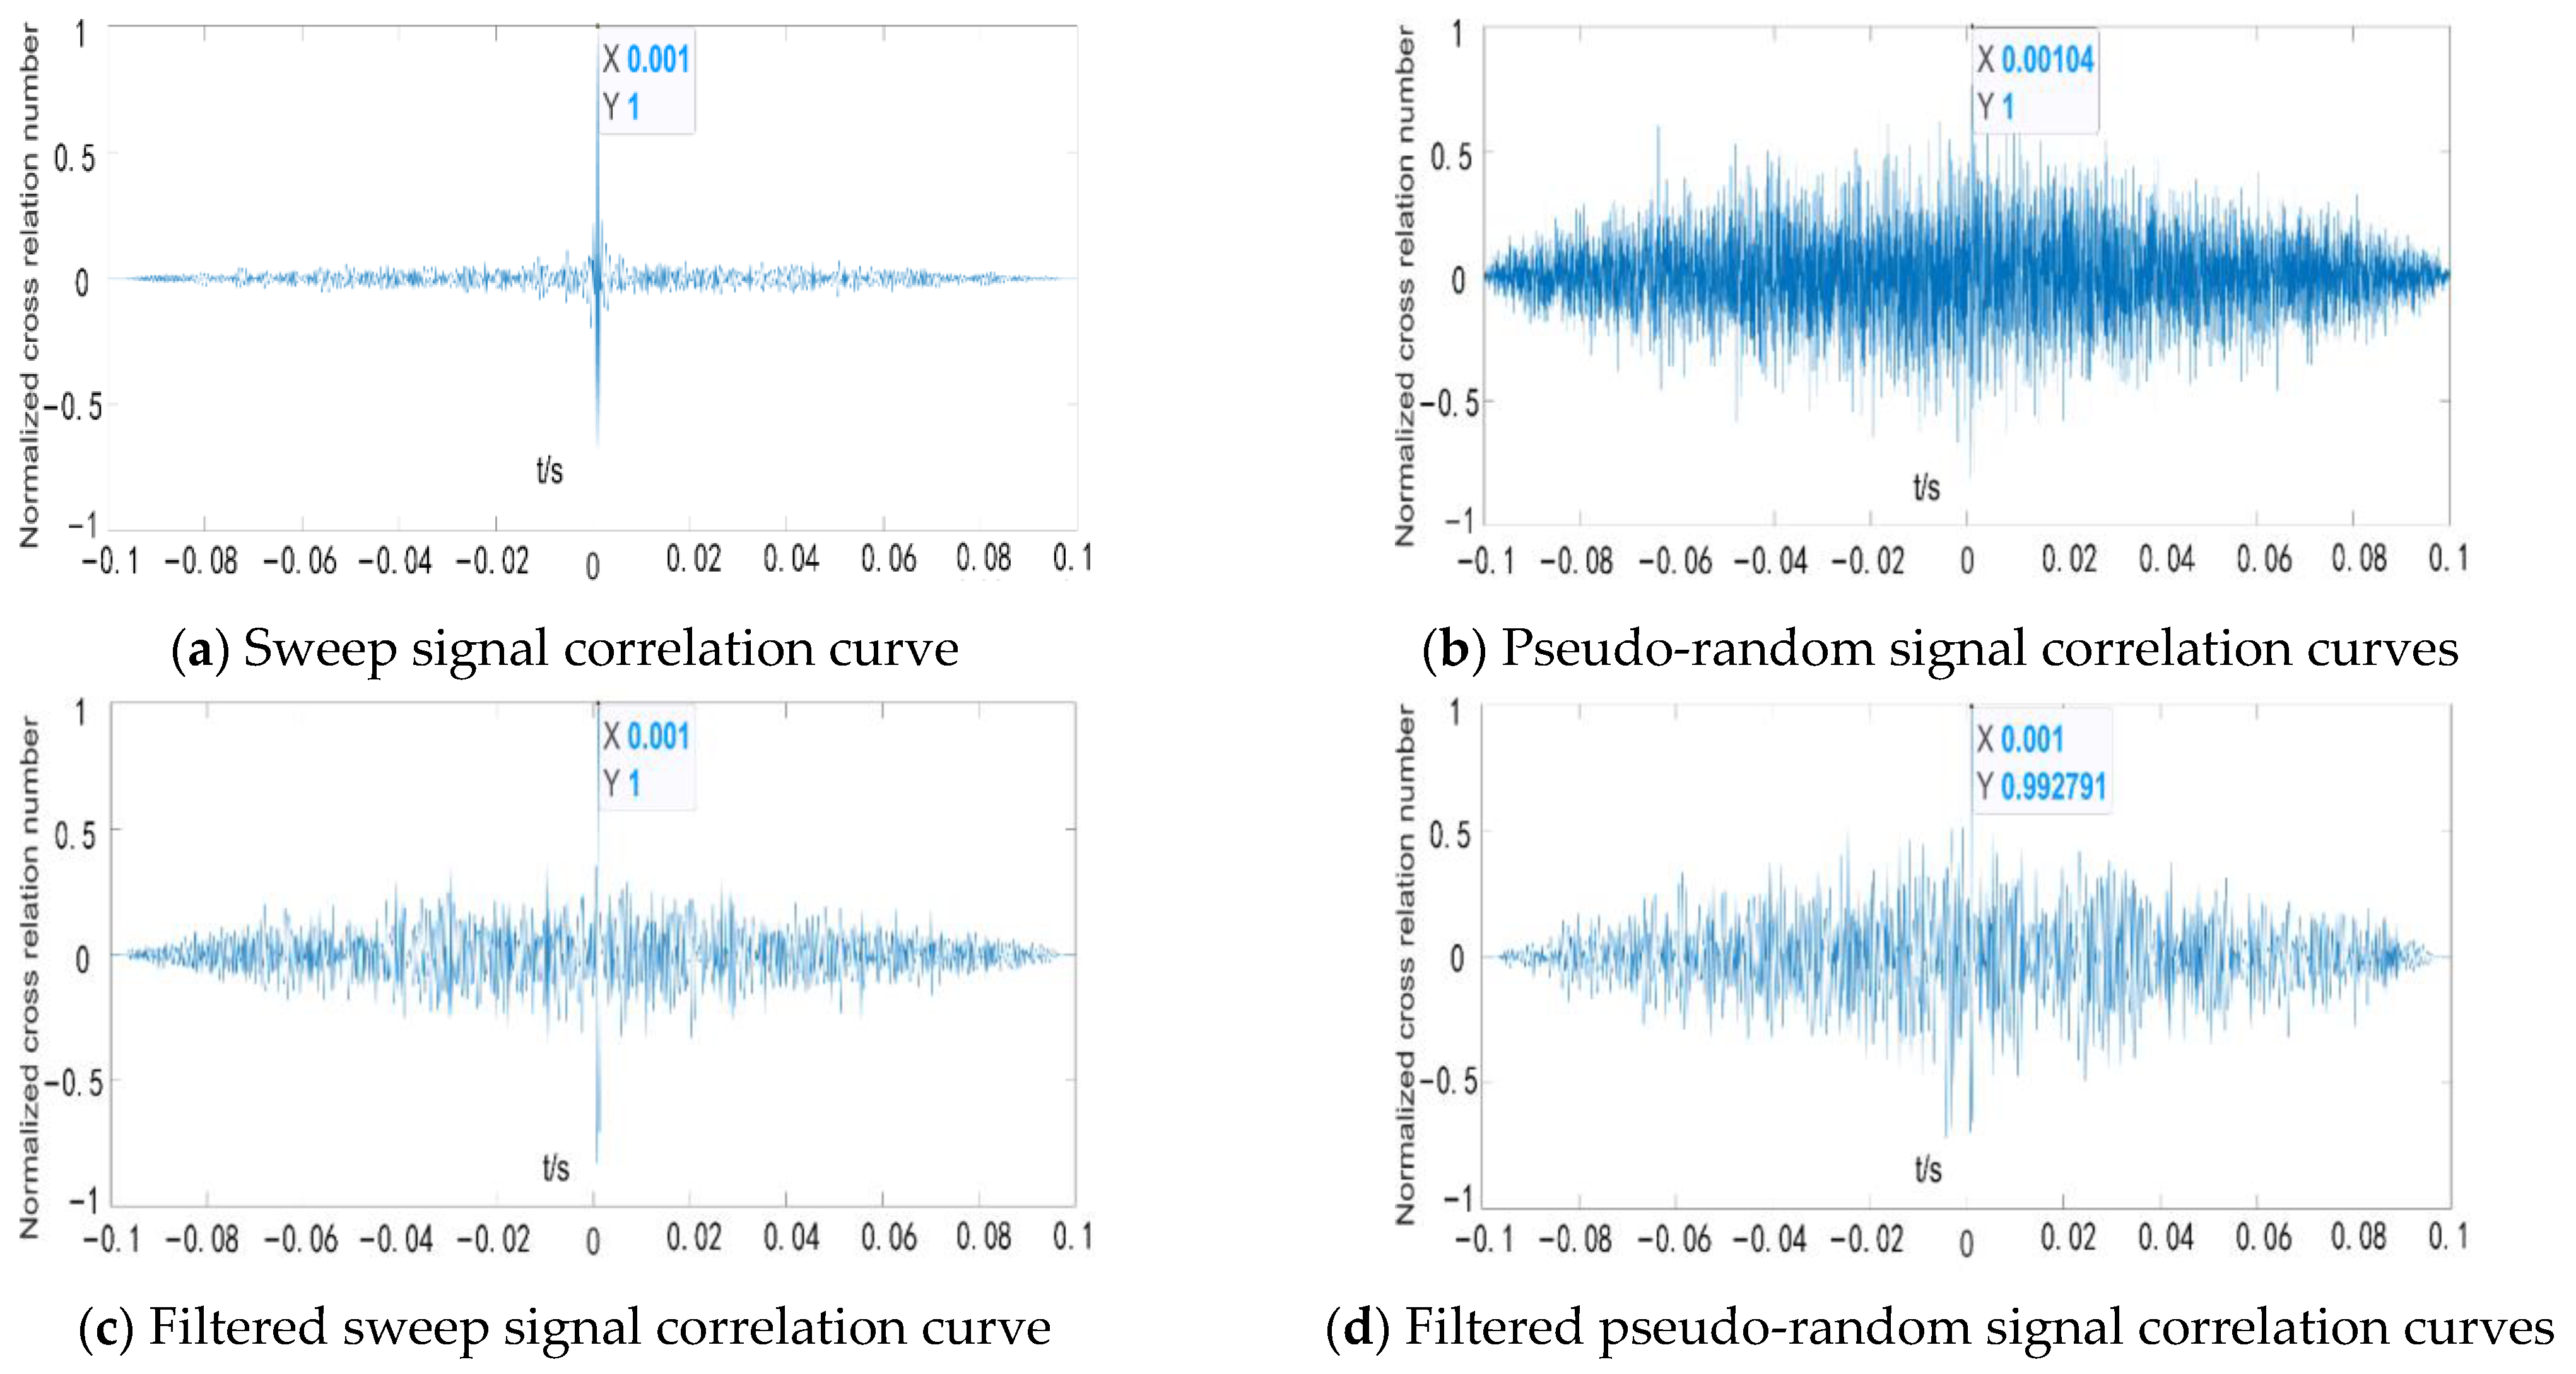
3.4.3. Filtered Linear Sweep Signals and Pseudo-Random Signal

A FIR filter is used to filter the swept and pseudo-random signals. This FIR filter can be used with a filter whose parameter is a sampling sinc function, so that the problem of acoustic fly-through time-delay estimation can be turned into a problem of calculating the parameters of an FIR filter. After optimal processing to automatically adjust the filter’s own structure and related parameters, the time-delay estimation under many different conditions is satisfied. A bandpass filter of order 502 is selected and the design method is a Kaiser window function with a passband frequency of 1000 to 3000 Hz and a passband amplitude of 1 dB. The first and second resistance band frequencies are 800 and 3200 Hz, respectively, and the first and second resistance band amplitudes are 60 and 80 dB, respectively. The swept and pseudo-random signals were filtered, using filters which were normalized to the maximum magnitude of the above signals for ease of comparison.

4. Results and Analyses

4.1. Anti-Noise Effect of Sound Source Signals under Different Signal-to-Noise Ratios

4.1.1. Anti-Noise Effect of Sound Source Signals under Different Signal-to-Noise Ratios

In order to investigate the noise immunity of the sound source signals under different signal-to-noise ratios, the four sound source signals to be considered and their time-delayed signals are added to the actual collected background noise within the loose coals, respectively. After estimation using the basic GCC time-delay estimation algorithm, its cross-correlation characteristics at different signal-to-noise ratios are compared, as shown in Figure 5, Figure 6, Figure 7 and Figure 8. The cross-correlation results of all sound source signals are normalized for comparison purposes.
As can be seen from Figure 5, when the signal-to-noise ratio is 10 dB, the swept signal, the pseudo-random signal, and the filtered two can be accurately obtained as the theoretical time-delay truth value at high signal-to-noise ratio. The cross-correlation peaks of all four signals are not disturbed by the side-lode value, and the peaks of the cross-correlation curves are very sharp. At this point, the peak of the curve is prominent at X = 0.001, Y = 1.
Observing Figure 6, it can be seen that when the signal-to-noise ratio is 0 dB, the cross-correlation curve of the swept signal and the pseudo-random signal is affected by the background noise, and a small side-lobe appears. Accurate time-delay estimation is obtained for the swept signal, but the pseudo-random-signal time-delay estimation results in 0.98 ms, which is 0.02 ms different from the theoretical time delay. The filtered swept signal and the pseudo-random signal have accurate time-delay values, the peaks of the two cross-correlation curves are sharp, and the generation of the side-lobe is reduced by the filtering process.
From Figure 7, when the signal-to-noise ratio is reduced to −10 dB, the paraxial value of the cross-correlation curve between the swept signal and the pseudo-random signal is larger and the peak of the cross-correlation curve is interfered with by the maximum paraxial value. The results using the basic GCC method are 0.96 ms and 1.04 ms, respectively, both differing from the theoretical delay of 1 ms by 0.04 ms, which is a small error. The peaks of the filtered curves are very prominent at high signal-to-noise ratios, dramatically reducing the side-lobe value and the interference of noise, and the time-delay results are accurate.
It is shown in Figure 8 that when the signal-to-noise ratio is increased to −12 dB, the cross-correlation curve between the swept signal and the pseudo-random signal is affected by the strong noise, the side-lobes continue to increase, and the peak of the curve is severely disturbed. The cross-correlation results for the two sound source signals are 8.84 ms and 9.58 ms, which are different from the theoretical time delay of 10 ms by 1.16 ms and 0.42 ms, respectively. The peak value of the cross-correlation curve of the two after filtering is not affected by the side-lobe value, and the delay value is real.
At low signal-to-noise ratios, the two filtered signals reduce some of the side-lobes, but the side-lobe value is still close to the true delay peaks. Therefore, during the experimental measurements, it is important to ensure that the loudspeaker is at as high a power as possible to prevent influencing the measurement results.

4.1.2. Frequency Sweeping and Pseudo-Random Signal Stability in Different Frequency Bands

When the acoustic signal propagates in loose coals, its high frequency will lead to serious signal attenuation, while too low a frequency will cause changes in the signal propagation time. These factors together affect the accuracy and stability of time-delay estimation of acoustic signals in the coal body. Therefore, a suitable upper and lower limit needs to be determined when determining the frequency band of the sound source signal.
The accuracy and stability of time-delay estimation of swept and pseudo-random signals must be compared under attenuation and with the influence of noise. In this paper, in the simulation process, the swept signal is taken as an example, and firstly, x1(n) is set to be the swept signal with no noise and no attenuation, and x2(n) is the swept signal with no noise and attenuation. The simulation parameters are set as in Section 3.3, where the values of each parameter required to calculate the acoustic attenuation coefficient α(k) are: c0 = 342.95 m/s, F = 0.0047 m/s1/2, d = 0.00634 m, and fs = 3 kHz, respectively. The x1(n) and x2(n) waveforms are shown in Figure 9.
From Figure 9, it can be seen that after the attenuation and distortion of the swept signal, the similarity between x1(n) and x2(n) remains low even in the noiseless condition. If the swept signal under this condition is noisy, the accuracy and stability of the time-delay estimation is further affected as the signal-to-noise ratio decreases.
Same as the above simulation conditions, x1(n) is set to be the swept signal with no noise and no attenuation, while x2(n) is the signal with background noise added after attenuation. Under signal attenuation and different signal-to-noise ratios, 100 acoustic TOF measurements were performed using nine swept and pseudo-random signals with different bandwidths as acoustic signal sources. The measurements were processed using the basic GCC time-delay estimation algorithm, and the acoustic TOF averages were calculated using the following equation:
t g ¯ = i = 1 100 t g i 100
s = i = 1 100 ( t g i t g ¯ ) 2 100 1 × 100 %
ν = s t g ¯ × 100 %
where t is the true value of the sound signal time delay, t g ¯ is the average of 100 acoustic TOF measurements, s is the standard deviation, and v is the standard deviation rate.
At the end of the simulation experiment, the experimental data were analyzed using the above two evaluation indexes, and a comparison of the stability of the acoustic TOF measurement data for different frequency bands of acoustic signals is shown in Figure 10. The standard deviation of the measured values of the swept and pseudo-random signals varies more gently, with the difference between the maximum and minimum values being 0.00815 and 0.00694, respectively. While the standard deviation curves of the two signals show great ups and downs between 200~2000 Hz and 1000~2000 Hz until they reach the minimum at 1000~3000 Hz, the standard deviation curves of the swept signals fluctuate less than those of the pseudo-random signals, which indicates that the swept signals are more stable as an acoustic source output result. In summary, it is concluded that the acoustic TOF measured by the swept and pseudo-random signals from 1000 to 3000 Hz has the greatest stability, but the stability of the swept signal measurements is greater than that of the pseudo-random signals. Therefore, in this paper, a linear swept signal of 1000~3000 Hz is selected as the acoustic signal source to carry out various acoustic propagation time measurement experiments.

4.2. Noise Suppression Effect of GCC Algorithm with Different Signal-to-Noise Ratios

4.2.1. Noise Suppression Effect of Generalized Cross-Correlation Algorithm with Different Signal-to-Noise Ratios

In order to test the time-delay estimation performance of the algorithms under correlated background noise, the comparisons of the time-delay estimation of different weighting functions of GCC, ROTH, SCOT, HB, PHAT, and quadratic correlation PHAT-β with the swept signal as the acoustic source when the signal-to-noise ratios are 10 dB, 0 dB, −10 dB, −12 dB are shown in Figure 11, Figure 12, Figure 13 and Figure 14.
The GCC algorithm has the same time-delay estimation for six different weighting functions when the signal-to-noise ratio is 10 dB, all of which give theoretical time-delay results. The GCC (weight function of 1) and quadratic correlation PHAT-β algorithms peak sharply and are singularly stable. The ROTH time-delay estimation results in a relatively high value of the correlation function side-lobe, with the side-lobe close to the main peak value. The cross-correlation peaks obtained from the weighting of HB, SCOT, and PHAT remained sharp, and a small number of the side-lobe value appeared, which did not affect the measurements.
When the signal-to-noise ratio is 0 dB, the time-delay estimation results for the other five different weighting functions of the GCC algorithm are consistent and the time-delay estimation is accurate, except for the ROTH weighting. The GCC (weight function of 1) and quadratic correlation PHAT-β algorithms peak sharply and are singularly stable. The correlation function obtained by ROTH showed a large number of pseudo-peaks, and multiple measurements were inaccurate. The cross-correlation peaks obtained from the weighting of HB, SCOT, and PHAT remained sharp, and they continued to increase without affecting the measurements.
When the signal-to-noise ratio = −10 dB and the noise intensity is greater than the signal intensity, only the GCC (with a weight function of 1) and the quadratic correlation PHAT-β algorithms yielded accurate time-delay estimations. The GCC continued were more numerous and very close to the peak, but no pseudo-peaks appeared. The secondary correlation PHAT-β algorithm peaks at a single stable value. Other weighting functions perform time-delay estimation and then the peaks are replaced by the side-lobe values, which cannot be eliminated after several measurements, and all of them end up with incorrect results.
When the signal-to-noise ratio = −12 dB, i.e., the noise intensity is much larger than the signal intensity, only the quadratic correlation PHAT-β algorithm yields accurate time-delay estimation results, with a stable single peak for multiple measurements, and pseudo-peaks obtained from measurements of other weighting functions. After several measurements, the pseudo-peaks could not be eliminated and the final results were misaligned.
Therefore, the accuracy of time-delay estimation of the GCC and quadratic correlation PHAT-β algorithms is better as the signal-to-noise ratio decreases. When the noise intensity is much larger than the signal intensity, the noise suppression effect of the quadratic correlation PHAT-β algorithm is stronger than that of the GCC; both need to be further investigated in acoustic TOF measurements in loose coals.

4.2.2. Analysis of Time-Delay Estimation Results at Different Distances

We compared and analyzed the time-delay estimation results of GCC, ROTH, SCOT, HB, PHAT, and quadratic correlation PHAT-β weighting functions in loose coals among the GCC correlation mutual function time-delay estimation algorithms that are widely used in the current acoustic TOF measurement process. According to the experimental method described in Section 3.3, acoustic TOF measurement tests on different paths were carried out, and the acoustic TOF measurement data on 10 different paths were calculated and analyzed using the algorithm described above; the obtained changes in acoustic TOF are shown in Figure 15. Through a large amount of experimental data in the previous period and calculation with the RX1.0.0.184 software in the industrial computer, the reference values and reasonable ranges of the acoustic TOF on different paths are obtained as the transverse reference line in Figure 15.
From Figure 15a, it can be seen that the acoustic TOF measurements estimated using the HB and SCOT weighting functions in the GCC time-delay estimation are more deviated from a reasonable range when the path length L1 = 0.85 m. The time-delay estimation of the path length, L1 = 0.85 m, has been shown in the following table. The HB weighting has a small portion within a reasonable range, and the ROTH weighted estimate is near the vicinity of the reference line. The GCC, PHAT-weighted, and quadratic correlation PHAT-β-weighted estimates are overall more reasonable, with the GCC and quadratic correlation PHAT-β-weighted estimates of acoustic TOF values closest to the reference value.
As in Figure 15b, when the path length L2 = 1.00 m, ROTH, PHAT, HB, and SCOT are weighted equally, and most of their estimates are outside the reasonable range. The GCC and quadratic correlation PHAT-β weighted estimates are within a reasonable range, with the quadratic correlation PHAT-β-weighted estimates being closer to the reference value than the GCC.
Observing Figure 15c, when the path length L3 = 1.15 m, most of the ROTH-, PHAT-, HB-, and SCOT-weighted estimates are still outside of the reasonable range, and only a few of them are within the reasonable range and far from the reference value. The estimates of GCC and quadratic correlation PHAT-β weighting are within a reasonable range, where the value of acoustic TOF estimated by quadratic correlation PHAT-β weighting is still closer to the reference line than the GCC.
As shown in Figure 15d, compared to the above three paths, when the path length L4 = 1.30 m, the estimated acoustic TOF values weighted by ROTH, PHAT, HB, and SCOT are almost all outside of the reasonable range, and only individually close to the reference line. The values of acoustic TOF estimated by GCC are also partly outside the reasonable range, but closer to it. The values of acoustic TOF estimated by the quadratic correlation PHAT-β weighting are still all within reasonable limits.
In summary, it can be concluded that as the acoustic TOF distance increases, the difference between the acoustic TOF measurements obtained from the weighting of ROTH, PHAT, HB, and SCOT and the standard values is large, which is unsuitable for the time-delay estimation of the acoustic TOF of loose coals in this paper. The acoustic TOF values estimated by CC and quadratic correlation PHAT-β weighting are basically in a reasonable range, but the estimation value of quadratic correlation PHAT-β weighting is closer to the reference line than that of GCC and the data fluctuation is smaller, which shows stronger accuracy and stability, and the overall effect is significantly better than that of the basic cross-correlation time-delay estimation, which is suitable for the time-delay estimation of the acoustic TOF in loose coals.

4.2.3. Stability and Accuracy of Time-Delay Estimation for the GCC Algorithms

We further evaluated the accuracy and stability of time-delay estimation of GCC, ROTH, SCOT, HB, PHAT, and quadratic correlation PHAT-β weighting functions in GCC time-delay estimation method under acoustic wave attenuation and with noise influence. We set x1(n) to be no noise, unattenuated swept signal, and x2(n) to be the swept signal with background noise added after attenuation.
As can be seen in Figure 16, the correlation of the swept signal after propagation decreases with decreasing signal-to-noise ratio. In terms of the relative error of the acoustic propagation time, all six algorithms can estimate the acoustic propagation time more accurately at high signal-to-noise ratios, but as the signal-to-noise ratio decreases, the accuracy of the GCC and the quadratic correlation-based PHAT-β algorithms is significantly better than that of the other four algorithms. Comparing the standard deviation and standard deviation rate, ROTH is significantly larger than the other algorithms as the signal-to-noise ratio varies, in terms of the average relative error e, the standard deviation s, and the standard deviation rate v. As with the conclusions of Section 4.2.1 and Section 4.2.2, the GCC and quadratic-correlation-based algorithms continue to have excellent stability. However, compared with the GCC algorithm, the quadratic correlation PHAT-β algorithm with quadratic correlation and improved weight function has good noise suppression ability and improves the stability and accuracy of the acoustic TOF measurements when the degree of acoustic signal attenuation and distortion is large.

4.2.4. Validation of Different Weighted Algorithms for Inversion of Coal Temperature

From the experimental results in Section 4.2.2 and Section 4.2.3, it can be seen that the PHAT-β-weighted algorithm has a significant advantage over the other five algorithms in acoustic TOF measurement. In order to further verify the accuracy of coal temperature inversion using the PHAT-β weighting algorithm, in this section, the microphone spacing of L4 = 1.30 m and the coal sample particle sizes of 0.5–0.8 cm, 0.8–1.0 cm, 1.0–3.0 cm, and 3.0–5.0 cm were selected for the coal temperature inversion experiments. The coal samples were heated using a programmed heating system so that the actual temperatures of the coal samples were 30 °C, 35 °C, 40 °C, 45 °C, and 50 °C, respectively. Through the “3.3 Experimental conditions and methods” combined with the acoustic temperature measurement principle, the loose coals acoustic temperature measurement experiment was performed. The absolute error between the inversion temperature and the measured temperature has been compiled for easy comparison, as shown in Figure 17.
As can be seen from the figure, the absolute error of the ROTH-weighted algorithm is lower than that of the other algorithms both in terms of accuracy and stability, and it is considered that the resulting inversion temperature values are not informative. The characteristics of the error distribution of the HB-weighted algorithm are similar to those of ROTH, which are reflected in a loose distribution and poor numerical stability. The accuracy and stability of the experimental results of the SCOT and PHAT weighting algorithms are slightly better than those of the ROTH and HB algorithms, but there is still a gap between them and the standard of accuracy. The two weighting algorithms that performed best were GCC and PHAT-β. The absolute errors of these two weighting algorithms were always between 0 and 1 °C when the particle sizes of the coal samples were located in the range of 0.5 to 0.8 cm, 0.8 to 1.0 cm, and 1.0 to 3.0 cm. As the particle size of the coal samples continued to increase to 3.0–5.0 cm, the error of the GCC and PHAT-β weighting algorithms reached the maximum. Some of the absolute error values of GCC exceeded 1 °C, but the PHAT-β weighting algorithm was always less than 1 °C, with a maximum value of 0.862 °C, reflecting an accuracy and stability beyond the other five algorithms.
In the process of analyzing and comparing the accuracy of different weighting algorithms, it was found that the absolute error values of the six algorithms appeared to be elevated to different degrees with the increase of the particle size of the coal samples, and the fluctuation amplitude of the values also increased simultaneously. For example, when the particle size of the coal samples is 3.0–5.0 cm, the absolute error maximum of the ROTH weighting algorithm is 4.896 °C, which is a difference of 3.693 °C from the error minimum of 1.203 °C in this particle size interval, which is the largest among all experimental groups. By analyzing the experimental principles and steps, it was concluded that the error arose during the drying process of the crushed coal samples in the pre-experimental period. During the process of drying the coal body, the gas in the coal body also has different degrees of release. Jia et al. [39] pointed out that the initial velocity of gas discharge of coal samples decreases with the increase of particle size in a power function relationship, i.e., the greater the fragmentation of the coal body, the greater the initial velocity of gas discharge. The propagation the speed of sound is affected by the composition of the gas medium; the greater the density of the medium, the faster the propagation speed of sound waves, and the warming process can accelerate the coal body on the gas dissipation rate, increasing the concentration of the gas medium in the box. The small-particle-size coal samples have been fully discharged and volatilized during the drying process, which greatly reduces the interference with the experimental results.
After comparing the absolute errors of the coal temperature inversion experimental results, it is not difficult to see that there is a large gap between the accuracy of the experimental data of the six weighting functions, but the overall pattern is the same as that of the acoustic TOF measurement experiments, and the order of their accuracy is: PHAT-β > GCC > PHAT > SCOT > HB > ROTH.
This paper establishes a method for acoustic fly-through time measurement in loose coal bodies by investigating the accuracy and stability of different experimental estimation algorithms. The research results provide a feasible method for the optimization of the time-delay estimation of the acoustic temperature measurement in loose coal bodies in the coal mining airspace, provide a new method for the temperature monitoring means of loose coal bodies, and provide theoretical support for the exploration of a new type of coal temperature detection technology. The next step can be to start from the influencing factors of the acoustic fly-through time of the loose coal body, such as the water content of the loose coal body, the atmosphere conditions, and other aspects of the study.

5. Conclusions

(1)
An experimental system for acoustic temperature measurement of loose coals under multi-factor coupling was designed and constructed, and the noise immunity and stability of the swept signal and the pseudo-random signal as the acoustic source signal were compared. The results show that the noise immunity of both signals can meet the experimental requirements, but the stability of the acoustic TOF results measured by the swept signal as a sound source is better than that of the pseudo-random signal; the frequency range of the signal band is determined to be 1000~3000 Hz, and the number of sampling points is 32,767.
(2)
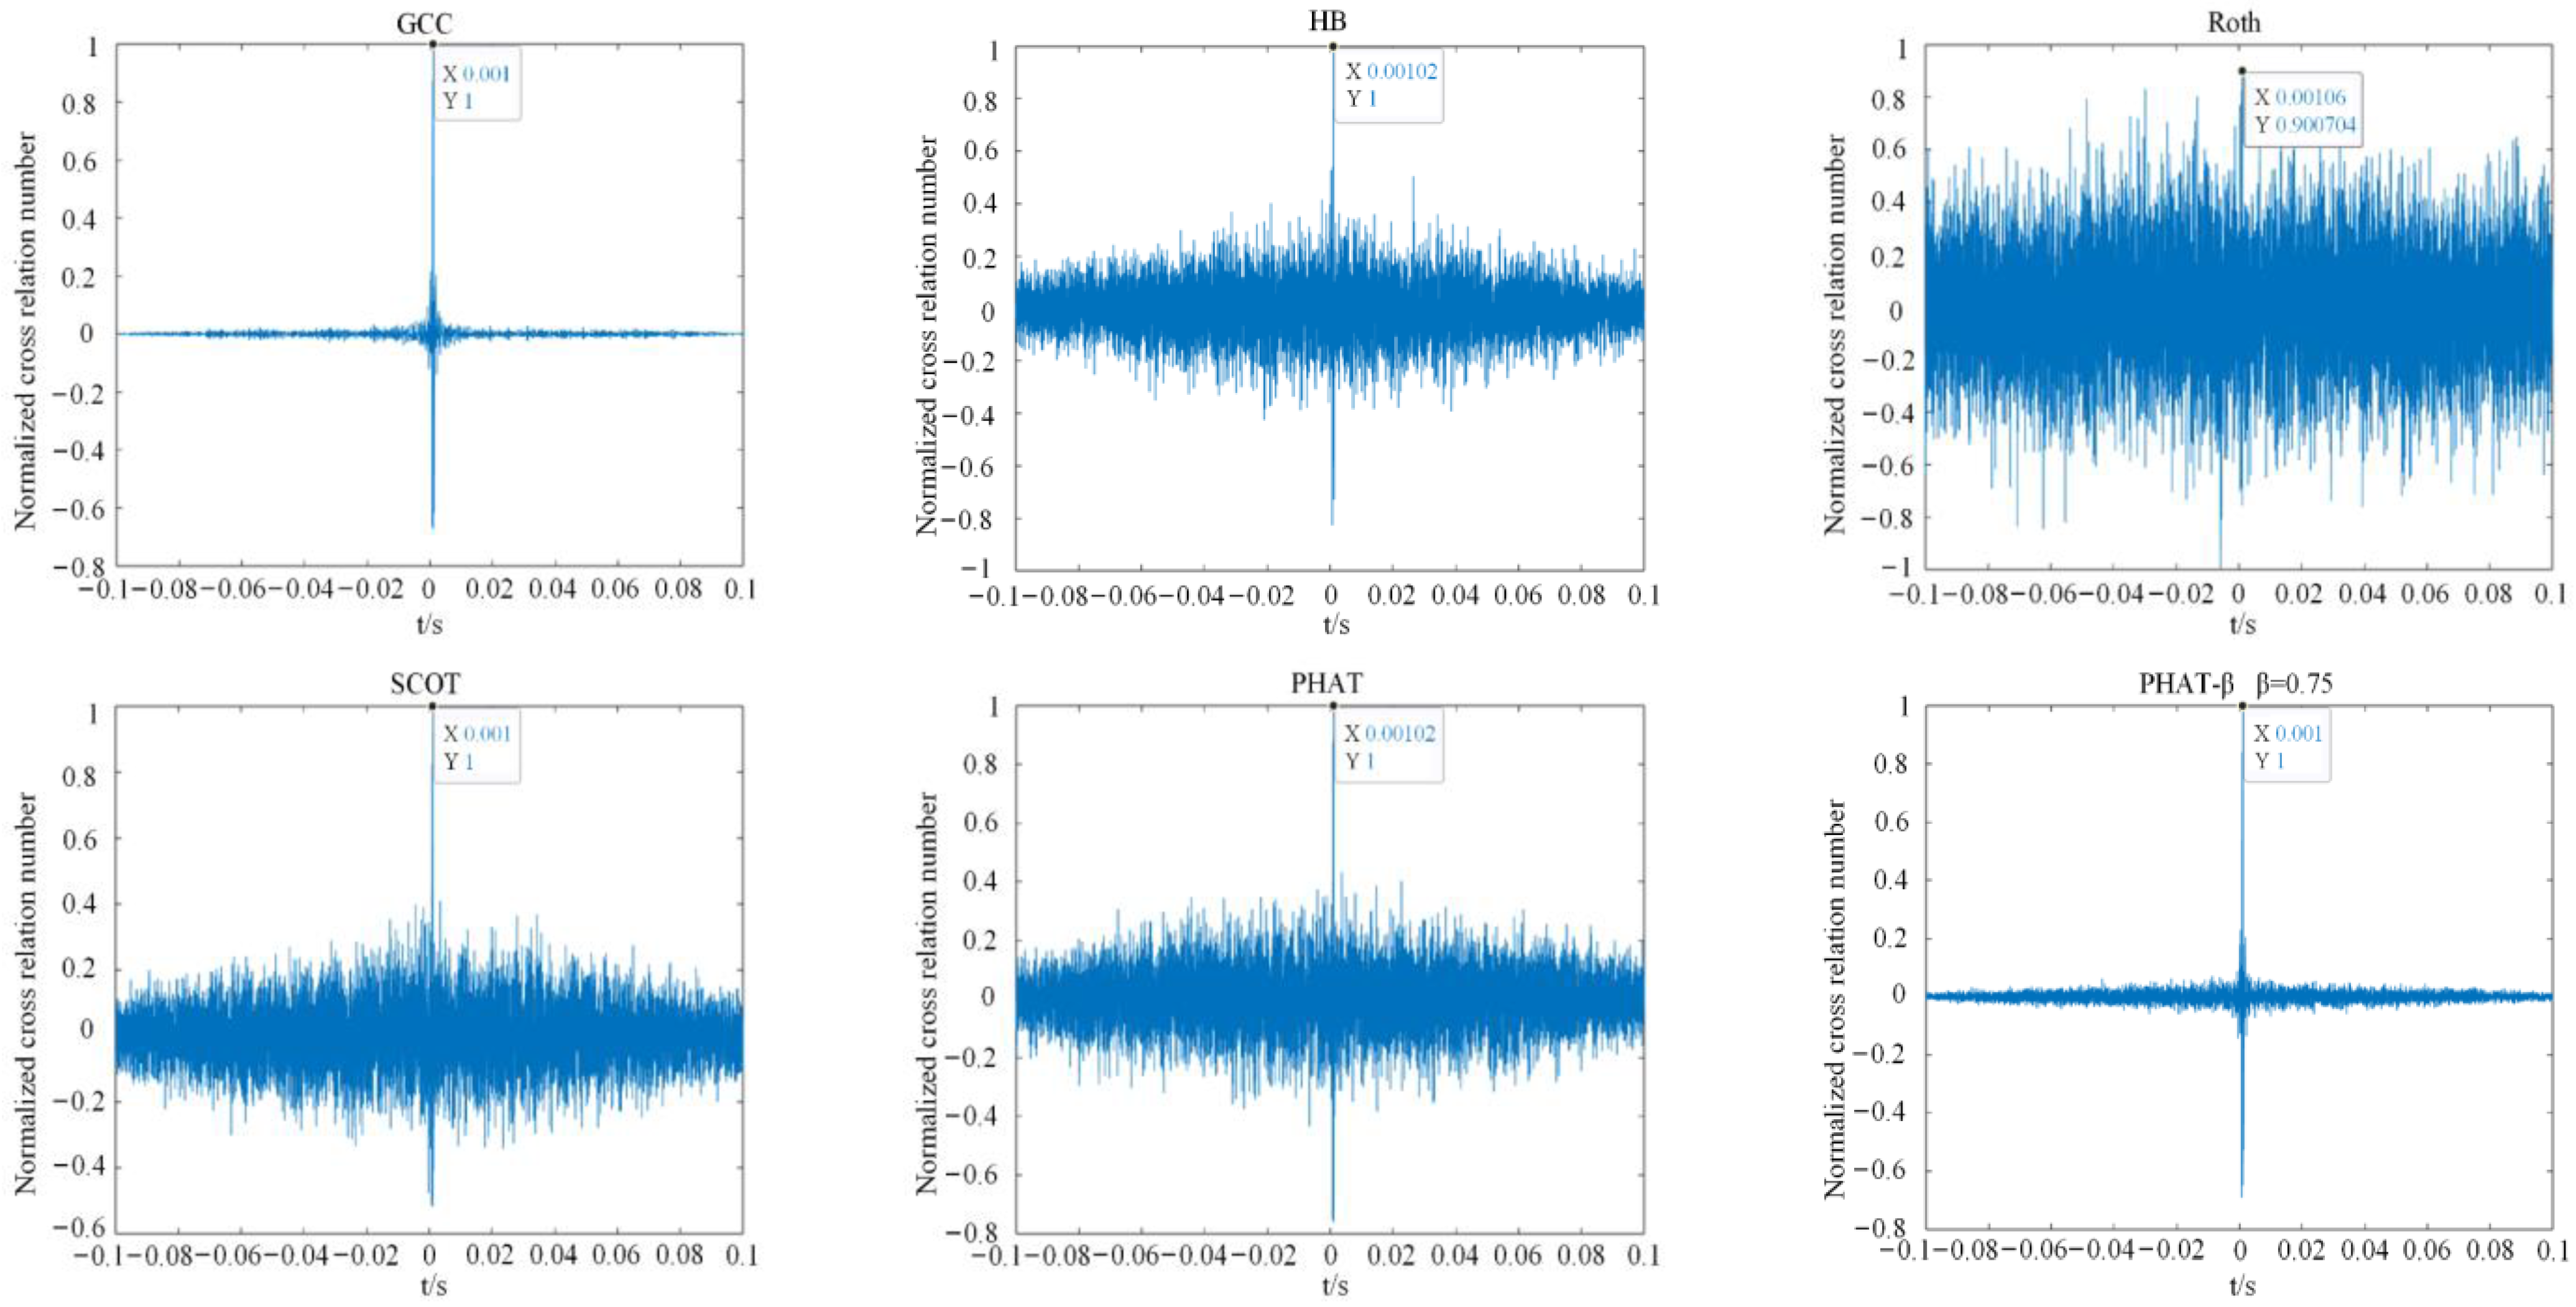
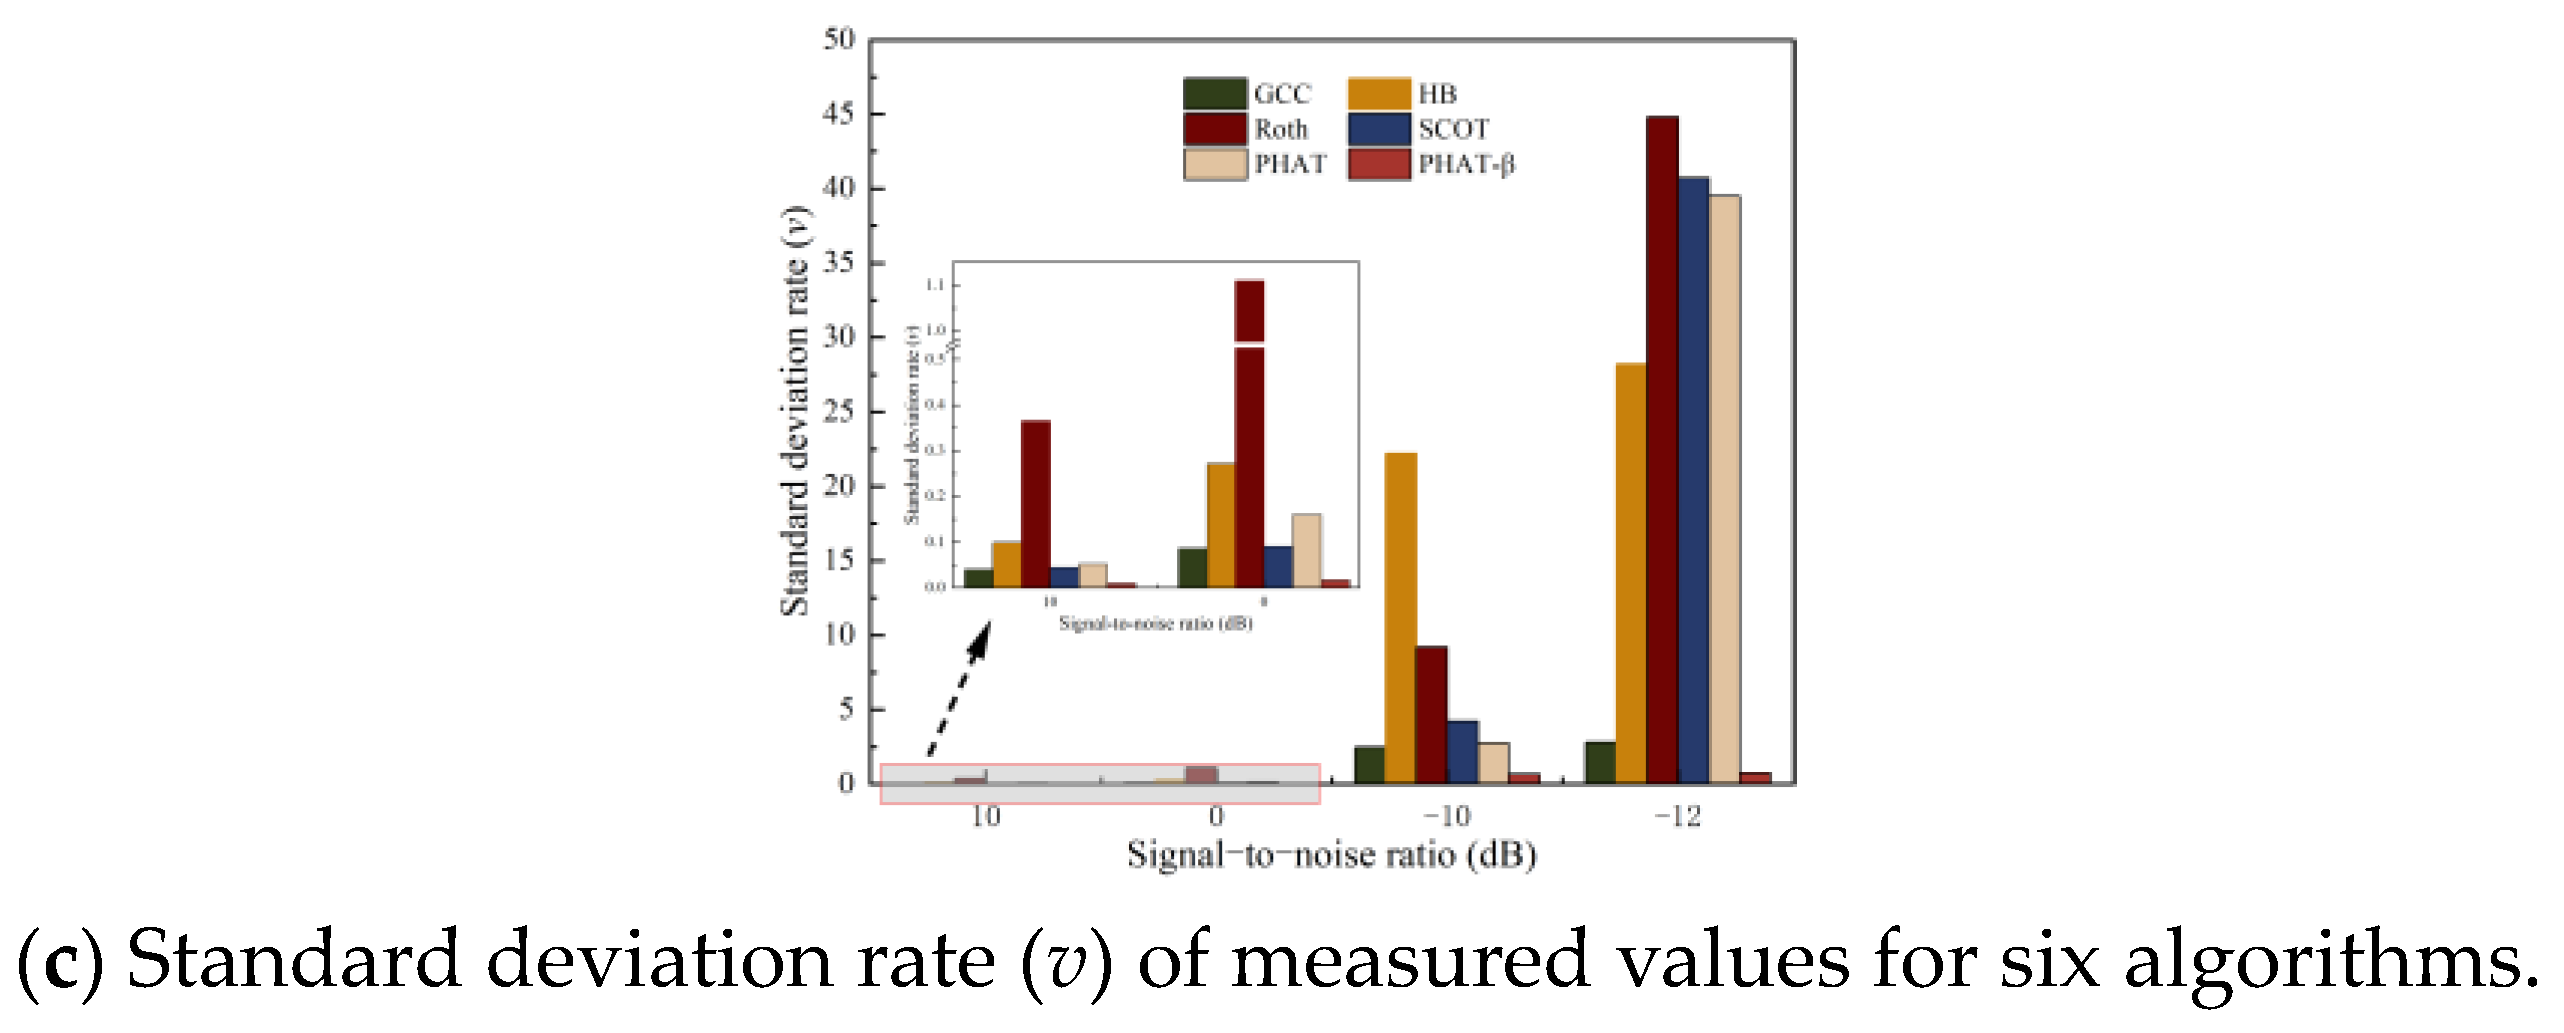
A time-delay estimation method for acoustic temperature measurement of loose coals based on quadratic correlation with phase transform weighting (PHAT-β) algorithm is proposed. Comparison of the results of six time-delay estimation algorithms using swept signals as the acoustic source with different signal-to-noise ratios and different acoustic transmission distances was carried out using an experimental system for acoustic temperature measurement of loose coals under multifactorial coupling with MATLAB numerical calculations. It is verified that the quadratic correlation PHAT-β algorithm can effectively eliminate the noise interference in the signal with good acoustic wave propagation time accuracy and measurement stability in the case of more serious acoustic signal attenuation and distortion.
(3)
Six algorithmic coal temperature inversion experiments were carried out under different grain-size coal samples, and when the actual temperature of the coal samples was 30 °C, 35 °C, 40 °C, 45 °C, and 50 °C, respectively, the experimental measurements of acoustic temperature measurement of loose coals were carried out. The results show that there is a large gap between the accuracy of the experimental data for the six weighting functions, and the ROTH and HB weighting algorithms are almost uninformative for inverse-performed coal sample temperature values due to their large errors. However, the overall pattern is the same as in the acoustic TOF measurement experiments, and the absolute error of the quadratic correlation PHAT-β algorithm never exceeds 1 °C, with a maximum value of 0.862 °C. The accuracy of the six weighting algorithms was ranked as PHAT-β > GCC > PHAT > SCOT > HB > ROTH, further validating the accuracy and reliability of the quadratic correlation PHAT-β algorithm.

Author Contributions

Writing—review and editing, writing—original draft, supervision, resources, project administration, Y.L.; data curation, investigation, J.G.; resources, methodology, investigation, conceptualization, W.G.; formal analysis, data curation, investigation, H.W.; investigation, conceptualization, G.C.; formal analysis, data curation, Y.J.; supervision, investigation, K.W. All authors have read and agreed to the published version of the manuscript.

Funding

The research was supported by National Natural Science Foundation of China (grant nos. 52174198, 52174197, 52004209 and 52304251); Shaanxi Science and Technology Association Young Talents Lifting Project (grant no. 20240205); and Shaanxi Postdoctoral Science Foundation (grant number 2023BSHEDZZ286).

Institutional Review Board Statement

Not applicable.

Informed Consent Statement

Not applicable.

Data Availability Statement

Data available on request due to restrictions legal.

Conflicts of Interest

Author Guobin Cai has received research grants from Shaanxi Xikuang Zhitong Technology Co., Ltd. The remaining authors declare that the research was conducted in the absence of any commercial or financial relationships that could be construed as a potential conflict of interest.

References

  1. Wang, Y.; Sun, Q.; Wu, J.; Han, S.; Zhang, R.; Jiang, S.; Gu, X. Research on the low carbon development path of China’s coal industry under carbon peaking & carbon neutral target: Based on the RCPs-SSPs framework. Resour. Policy 2023, 86, 104091. [Google Scholar] [CrossRef]
  2. Bui, T.; Tseng, J.; Tsai, F.M.; Ali, M.H.; Lim, M.K.; Tseng, M.L. Energy security challenges and opportunities in the carbon neutrality context: A hierarchical model through systematic data-driven analysis. Renew. Sustain. Energy Rev. 2023, 187, 113710. [Google Scholar] [CrossRef]
  3. National Bureau of Statistics of China. Statistical Communique of the People’s Republic of China on the 2022 National Economic and Social Development. People’s Daily, 1 March 2023. 1 March. [CrossRef]
  4. Gun, J.; Liu, Y.; Cheng, X.; Yan, H.; Xu, Y. A novel prediction model for the degree of rescue safety in mine thermal dynamic disasters based on fuzzy analytical hierarchy process and extreme learning machine. Int. J. Heat Technol. 2018, 36, 1336–1342. [Google Scholar] [CrossRef]
  5. Boleslav, T.; Zdenek, P. Investigation of the spontaneous combustion susceptibility of coal using the pulse flow calorimetric method: 25 years of experience. Fuel 2014, 125, 101–105. [Google Scholar] [CrossRef]
  6. Zhang, X.; Lu, B.; Zhang, J.; Fu, X.; Deng, H.; Qiao, L.; Ding, C.; Gao, F. Experimental and simulation study on hydroxyl group promoting low-temperature oxidation of active groups in coal. Fuel 2023, 340, 127501. [Google Scholar] [CrossRef]
  7. Zhang, X.; Liang, H.; Lu, B.; Qiao, L.; Huang, G.; Yu, C.; Zou, J. Correlation and stage change of key groups and thermal effects of spontaneous coal combustion due to long-term ultraviolet illumination. Energy 2024, 293, 130775. [Google Scholar] [CrossRef]
  8. Zhang, X.; Gui, Y.; Lu, B.; Bai, G.; Qiao, L.; Li, C. Experimental study on the effect of inhibitor on coal spontaneous combustion under low temperature freezing. Fuel 2024, 365, 131225. [Google Scholar] [CrossRef]
  9. Yang, G.; Yan, J.; Shen, G.; An, L.; Li, Z. Real time monitoring of accumulated pulverized coal temperature field based on acoustic method. Clean Coal Technol. 2022, 28, 59–65. [Google Scholar] [CrossRef]
  10. Mishra, R.K.; Roy, P.N.S.; Singh, V.K.; Pandey, J.K. Detection and delineation of coal mine fire in Jharia coal field, India using geophysical approach: A case study. J. Earth Syst. Sci. 2018, 127, 107. [Google Scholar] [CrossRef]
  11. Ren, S.; Zhang, Y.; Song, Z.; Xiao, Y.; Deng, J.; Shu, C. Initial exploration on potential fire hazards detection from coal spontaneous combustion applied by acoustic wave. Sci. Total Environ. 2023, 897, 165475. [Google Scholar] [CrossRef]
  12. Zhang, W.; Jiang, G.; Sun, J.; Lyu, W. Acoustic reconstruction of the vortex field in the nonuniform temperature field of a simulated furnace. Appl. Acoust. 2023, 207, 109334. [Google Scholar] [CrossRef]
  13. Ravichandran, A.; Logdesser, A.; Peller, N.; Manhart, M. Acoustic resonances in an automotive HVAC outlet. J. Sound Vib. 2023, 569, 118051. [Google Scholar] [CrossRef]
  14. Ettini, K.; Cotter, J.; Guldiken, R. Analytical, simulation, and experimental verification of ultrasonic thermometry technique. Appl. Acoust. 2023, 207, 109345. [Google Scholar] [CrossRef]
  15. Liu, Q.; Zhou, B.; Zhang, J.; Cheng, R.; Dai, M.; Zhao, X.; Wang, Y. A novel time-of-flight estimation method of acoustic signals for temperature and velocity measurement of gas medium. Exp. Therm. Fluid Sci. 2023, 140, 110759. [Google Scholar] [CrossRef]
  16. Gerasimov, S.I.; Glushnev, V.D.; Zhelbakov, I.N. Determination of propagation times of finite ultrasonic signals in the UFM measuring path. J. Phys.Conf. Ser. 2021, 2096, 315–356. [Google Scholar] [CrossRef]
  17. Costa-Júnior, J.F.S.; Cortela, G.A.; Maggi, L.E.; Rocha, T.F.D.; Pereira, W.C.A.; Costa-Felix, R.P.B.; Alvarenga, A.V. Measuring uncertainty of ultrasonic longitudinal phase velocity estimation using different time-delay estimation methods based on cross-correlation: Computational simulation and experiments. Measurement 2018, 122, 45–56. [Google Scholar] [CrossRef]
  18. Álvarez-Marcos, A.; Luis, A. Phase-space quantum Wiener-Khintchine theorem. Opt. Lett. 2022, 47, 4604–4607. [Google Scholar] [CrossRef]
  19. Knapp, C.; Carter, G. The generalized correlation method for estimation of time delay. IEEE Trans. Acoust. Speech Signal Process. 1976, 24, 320–327. [Google Scholar] [CrossRef]
  20. Hero, A.; Schwartz, S. A new generalized cross correlator. IEEE Trans. Acoust. Speech Signal Process. 1985, 33, 38–45. [Google Scholar] [CrossRef]
  21. Chen, L.; Liu, Y.; Kong, F.; He, N. Acoustic source localization based on generalized cross-correlation time-delay estimation. Procedia Eng. 2011, 15, 4912–4919. [Google Scholar] [CrossRef]
  22. Wang, M.; Fang, X.; Wang, Y.; Ding, J.; Sun, Y.; Luo, J.; Pu, H. A dual-loop active vibration control technology with an RBF-RLS adaptive algorithm. Mech. Syst. Signal Process. 2023, 191, 110079. [Google Scholar] [CrossRef]
  23. Nikias, C.L.; Pan, R. Time delay estimation in unknown Gaussian spatially correlated noise. IEEE Trans. Acoust. Speech Signal Process. 1988, 36, 1706–1714. [Google Scholar] [CrossRef]
  24. Nikias, C.L.; Liu, F. Bicepstrum computation based on second- and third-order statistics with applications. In Proceedings of the International Conference on Acoustics, Speech, and Signal Processing, Albuquerque, NM, USA, 3–6 April 1990; pp. 2381–2385. [Google Scholar] [CrossRef]
  25. Hsing-Hsing, C.; Nikias, C.L. Cumulant-based adaptive time delay estimation. In Proceedings of the Twenty-Second Asilomar Conference on Signals, Systems and Computers, Pacific Grove, CA, USA, 31 October–2 November 1988; pp. 15–19. [Google Scholar] [CrossRef]
  26. Hsing-Hsing, C.; Nikias, C.L. A new method for adaptive time delay estimation for non-Gaussian signals. IEEE Trans. Acoust. Speech Signal Process. 1990, 38, 209–219. [Google Scholar] [CrossRef]
  27. Vera-Diaz, J.M.; Pizarro, D.; Macias-Guarasa, J. Acoustic source localization with deep generalized cross correlations. Signal Process. 2021, 187, 108169. [Google Scholar] [CrossRef]
  28. Barkat, B. A quadratic model for the far-field direction of arrival estimation. Digit. Signal Process. 2018, 72, 208–215. [Google Scholar] [CrossRef]
  29. Cui, X.; Gao, Y.; Ma, Y.; Liu, F.; Wang, H. Time delay estimation using cascaded LMS filters fused by correlation coefficient for pipeline leak localization. Mech. Syst. Signal Process. 2023, 199, 110500. [Google Scholar] [CrossRef]
  30. Xia, H.; Huang, J.; Ji, H.; Wang, B. A new adaptive GCC method and its application to slug flow velocity measurement in small channels. Sensors 2022, 22, 153–186. [Google Scholar] [CrossRef]
  31. Shen, G.; Yang, J.; Chen, D.; Liu, W.; Zhang, S.; An, L. Study on time delay estimation in boiler acoustic temperature measurement based on second correlation PHAT-B algorithm. J. Chin. Soc. Power Eng. 2018, 38, 617–623. [Google Scholar] [CrossRef]
  32. Damhof, F.; Brekelmans, W.A.M.; Geers, M.G.D. Experimental analysis of the evolution of thermal shock damage using transit time measurement of ultrasonic waves. J. Eur. Ceram. Soc. 2009, 29, 1309–1322. [Google Scholar] [CrossRef]
  33. Zhang, S.; An, L.; Li, G.; Shen, G.; Feng, Q.; Deng, Z. Application of pseudo-random sequence signal in acoustic pyrometry of boiler furnace. J. Chin. Soc. Power Eng. 2012, 32, 378–382. [Google Scholar] [CrossRef]
  34. Dokhanchi, N.S.; Arnold, J.; Vogel, A.; Voelker, C. Measurement of indoor air temperature distribution using acoustic travel-time tomography: Optimization of transducers location and sound-ray coverage of the room. Measurement 2020, 164, 107934. [Google Scholar] [CrossRef]
  35. Ren, S.; Ma, T.; Zhang, Y.; Deng, J.; Xiao, Y.; Zhai, X.; Zhang, Y.; Song, Z.; Wang, C. Sound absorption characteristics of loose bituminous coal porous media with different metamorphic degrees. Fuel 2023, 332, 126091. [Google Scholar] [CrossRef]
  36. Guo, J.; Shang, H.; Cai, G.; Jin, Y.; Wang, K.; Li, S. Early detection of coal spontaneous combustion by complex acoustic waves in a concealed fire source. ACS Omega 2023, 8, 16519–16531. [Google Scholar] [CrossRef]
  37. Florencio, V.O.; Almeida, A.A.; Balata, P.; Nascimento, S.; Brockmann-Bauser, M.; Lopes, L.W. Differences and reliability of linear and nonlinear acoustic measures as a function of vocal intensity in individuals with voice disorders. J. Voice 2021, 37, 663–681. [Google Scholar] [CrossRef] [PubMed]
  38. Wang, Y.; Nicol, T. On statistical distance based testing of pseudo random sequences and experiments with PHP and Debian OpenSSL. Comput. Secur. 2015, 53, 44–64. [Google Scholar] [CrossRef]
  39. Jia, D.; Sun, J. Fragmentation of Different Metamorphic Degree Coal Affected to lnitial Velocity of Gas Emission. Coal Sci. Technol. 2013, 41, 68–70. [Google Scholar] [CrossRef]
Figure 1. Generalized cross-correlation (GCC) principle.
Fire 07 00228 g001
Figure 2. Schematic measurement of acoustic TOF.
Fire 07 00228 g002
Figure 3. Experimental system for measuring acoustic TOF of loose coal.
Fire 07 00228 g003
Figure 4. Theoretical classification of coal seam spontaneous combustion for early warning [34].
Fire 07 00228 g004
Figure 5. Cross-correlation curve of sound source signal when SNR = 10 dB.
Fire 07 00228 g005
Figure 6. Cross-correlation curve of sound source signal when SNR = 0 dB.
Fire 07 00228 g006
Figure 7. Cross-correlation curve of sound source signal when SNR = −10 dB.
Fire 07 00228 g007
Figure 8. Cross-correlation curve of sound source signal when SNR = −12 dB.
Fire 07 00228 g008
Figure 9. Waveform of sweep signal under attenuation and noise influence.
Fire 07 00228 g009
Figure 10. Stability of acoustic TOF measurement data of acoustic signals in different frequency bands.
Fire 07 00228 g010
Figure 11. Delay estimation under different weight functions when SNR = 10 dB.
Fire 07 00228 g011
Figure 12. Delay estimation under different weight functions when SNR = 0 dB.
Fire 07 00228 g012aFire 07 00228 g012b
Figure 13. Delay estimation under different weight functions when SNR = −10 dB.
Fire 07 00228 g013
Figure 14. Delay estimation under different weight functions when SNR = −12 dB.
Fire 07 00228 g014
Figure 15. Variation of acoustic TOF under different paths in a loose medium.
Fire 07 00228 g015
Figure 16. Performance comparison of six delay estimation methods under different SNRs.
Fire 07 00228 g016aFire 07 00228 g016b
Figure 17. Distribution of inversion error of coal temperature by weighting algorithm under different grain-size coal samples.
Fire 07 00228 g017
Disclaimer/Publisher’s Note: The statements, opinions and data contained in all publications are solely those of the individual author(s) and contributor(s) and not of MDPI and/or the editor(s). MDPI and/or the editor(s) disclaim responsibility for any injury to people or property resulting from any ideas, methods, instructions or products referred to in the content.

