Article

Experiments on a Mine System Subjected to Ascensional Airflow Fire and Countermeasures for Mine Fire Control

1
School of Safety Science and Engineering, Xinjiang Institute of Engineering, Urumqi 830023, China
2
Key Laboratory of Xinjiang Coal Mine Disasters Intelligent Prevention and Emergency Response, Xinjiang Institute of Engineering, Urumqi 830023, China
3
Key Laboratory of Xinjiang Coal Resources Green Mining, Ministry of Education, Xinjiang Institute of Engineering, Urumqi 830023, China
4
College of Safety Science & Engineering, Liaoning Technical University, Fuxin 123000, China
5
Key Laboratory of Mine Thermodynamic Disaster & Control of Ministry of Education, Liaoning Technical University, Huludao 125105, China
*
Author to whom correspondence should be addressed.
Fire 2024, 7(7), 223; https://doi.org/10.3390/fire7070223
Submission received: 18 May 2024 / Revised: 21 June 2024 / Accepted: 24 June 2024 / Published: 29 June 2024

Abstract

The disorder and disaster evolution characteristics of ascensional airflow fires in mine ventilation systems has been the focus of mine fire research. In this work, through repeated experiments, the variation characteristics of the temperature and air volume in the main and side branches of an ascensional airflow fire were obtained under different ventilation capacities. Using the TF1M(3D) software to solve the problems of mine physical ventilation and combined with the analysis of an example, the variation in the ascensional airflow fire and the process of disordered airflow in the ventilation system in an entire area mine were described in detail. Fire combustion served as the power source for uncontrolled energy release, and its fire pressure interacted with the thermal resistance of the mine ventilation, directly causing airflow disorder. As the fire intensified, the ascensional airflow fire caused the airflow in the side branch to decrease, stagnate, or reverse. Improving the fan supply capacity can not only help reduce the increase in the ventilation thermal resistance of the side branch but also help avoid the airflow reversal of the side branch. From the regular variation characteristics, the theoretical results were found to be in good agreement with the experimental results.

1. Introduction

An underground mine fire is one of the most dangerous hazards in the mining industry, leading to casualties, wastage of coal resources, and atmospheric pollution [1,2,3,4,5]. An upward ventilation fire (in which the fire source is in the upward ventilation tunnel) under the action of fire and high-temperature smoke causes airflow disorder in the ventilation system, even leading to the reversal of the wind flow in the side branch during strong periods of fire [6]. This type of disorder is uncontrollable, unstable, and inactive, and the large amounts of high-temperature toxic gases generated by the combustion spread with the wind flow [7], causing poisoning or asphyxiation of personnel.
Researchers have conducted experimental studies and software simulations to analyze the spread of smoke flow, evolution of the temperature, changes in the airflow, and evacuation of personnel during fires in mines. Ying et al. [7] conducted experimental model tests and a theoretical analysis and found that the poststratification length is related to the ratio of the longitudinal ventilation velocity to the critical velocity. Wang et al. [8] investigated the poststratification characteristics and flame length of tunnel fires. Litton [9] conducted large-scale experiments on an above-ground roadway to simulate typical fires occurring along conveyor transport systems within underground coal mines. Wan et al. [10] conducted several tunnel fire experiments and proposed a model for predicting the temperature distribution of ceiling gases. Wang et al. [11] experimentally investigated the effect of longitudinal wind speed on the mass flow distribution of fire plumes in longitudinally ventilated tunnels. Yuan et al. [12] developed a computational fluid dynamics (CFD) model to simulate the flame spread on a conveyor belt at the entrance of a mine. Huang et al. [13] proposed a method for the safe evacuation of people from an underground pedestrian street based on the analysis of the smoke movement using the fire simulation software FDS and the evacuation software, Building-Exodus. Hansen et al. [14] combined CFD simulation and full-scale fire experiments to simulate the temperature and velocity of a fire gas in longitudinally ventilated mine roadways. Kalech et al. [15] simulated the effect of a ventilation system on the smoke temperature distribution and stratification in the event of tunnel fires based on a CFD simulation. Based on a numerical simulation method, Li et al. [16] studied the effect of the rupture position of the ventilation pipe on the gas distribution in the event of a fire. Using the FDS software, Hu et al. [17] studied the smoke propagation characteristics in long passages during the period of a fire. Chen [18] used a 3D CFD approach to simulate parameters such as temperature–time histories, soot density, CO, and heat release rate. A model of the effect of fire smoke movement on the evacuation behavior of miners was established. Jingwei et al. [19] developed a visual evacuation model to simulate the evacuation process of a mine in a special underground environment. Wang [20] used PyroSim (TEPS), a fire simulation software from Thunderhead Engineering in the United States, to model a local ventilation system and develop fire smoke control measures. Adjiski [21] used the computer program MINEFIRE PRO+ to simulate and optimize evacuation routes during underground mine fires.
Research on emergency disaster control and the mitigation of mine fires is indispensable for emergency rescue management, which requires a disaster ventilation simulation technology to reflect the overall disaster resistance of a mine system and an advanced decision-making platform to minimize losses. Currently, there is a lack of research on a ventilation simulation technology platform based on physical mechanics, specifically for the spatial network domain of mines. In this study, the complex process of an ascensional airflow fire in a mine, in other words, the disaster evolution process and airflow disorder characteristics of the mine system, is elaborated using an experimental device for mine fire smoke flow disorder tests combined with the TF1M3D simulation platform.

2. Theoretical Model of the Airflow Disaster Process in Underground Mine Fires

In a source ventilation network [22], the fire smoke can be categorized as a nodal external wind source, and the mass balance equation of the wind network in a certain time step can be expressed as follows:
A·M = D
where A = [aij](m−1)×n is called the basic node incidence matrix. When the i node is the starting point of the j branch, aij = 1; when the i node is the end point of the j branch, aij = −1; otherwise, aij = 0. M = [Mj]n×1 is the ventilation mass flow vector, Mj is the mass wind flow of the branch j, kg/s, where Mj = ρj Qj; Qj is the volumetric air flow (air volume) of branch j, m3/s; ρj is the density of the branch wind flow of j, kg/m3; WS = [Wj]n×1 is the branch source term (vector), where WS represents the branch weak source; Wj is the branch wind source, the mass flow of the source term (gas gushing or gas produced by fire) on branch j, kg/s; D = [Di](m−1)×1 is the node source term (vector); Di is the node wind source, the mass flow rate of the source term (gas gushing or gas produced by fire) at node i, kg/s; and m and n are the numbers of nodes and branches, respectively.
The major difference between an active wind network and an ordinary wind network is that the right-hand side of the mass balance equation in the active wind network is not zero but source and sink terms.
The airflow during the period of a fire is an unsteady change process, and the wind pressure balance equation for the mine model roadway network is established for each step using the time difference.
B   H = B   H f + B   P e + B δ Δ τ
where B = [bs,j](n−m+1)×n is the basic loop matrix; bs,j is the coefficient element of B; H is the resistance vector of each branch in the network, Pa; Hf is the wind pressure vector of each branch fan in the network, Pa; Pe = [Pe,j]n×1 is the position pressure difference vector, where Pe is the position pressure difference of the j branch, Pa; δ = [δj] n×1 is the airflow unsteady term vector; τ is the time variable with the unit of s; and Δτ is the step of time with the unit of s.
p e ,   j = g z j , 1 z j , 2 ρ j z   d z   or   p e ,   j = g k = 1 n j ρ j , k Δ x s i n θ j , k
where ρj(z) is the airflow density of branch j along the height z direction, kg/m3; Zj,1 and Zj,2 are the elevations of the start and end nodes of branches j and m, respectively; Δx is the element length on discrete element k (difference node spacing), m; ρj,k is the airflow density of element k, kg/m3; ρj,k is the dip angle of element k, °; and n is the number of branches.
Evidently, the calculation of the fire heating air pressure is included in the wind flow unsteady movement–wind pressure balance equation on a certain return path “b” in the wind network, where the algebraic sum of the pressure differences at each branch level is the natural wind pressure. Therefore, the equation is as follows:
h F ,   b = s = 1 N s p e , s p e 0 , s
where b is the air return roadway; s is the branch on the air return roadway b; Ns is the number of branches on the air return roadway b; pe(0),s is the potential pressure difference of branch s before the fire; and hF,b is the fire heating air pressure of the air return roadway “b”.
The variation in the airflow temperature during a fire causes a change in the air density, according to the ideal gas law, as follows:
ρ j , F = ρ j , 0 T j , 0 T j , F
where ρj,0 and ρj,F are the average densities of branch j airflow before and after the fire, kg/m3, respectively, and Tj,0 and Tj,F are the thermodynamic temperatures before and after branch j, kg/m3, respectively.
The ventilation resistance of the high-temperature airflow in the roadway branch j during a fire can be expressed as follows:
h r , j = T j , F T j , 0 R t , j ρ j , 0 Q j , 0 2
where Rt,j is the newly defined roadway geometric wind resistance, m−4; hr,j is the ventilation resistance, Pa; and Qj,0 is the volume flow of the airflow with no fire, m3/s.
The equation for calculating the throttling local thermal resistance of the wind flow around the flame at the ignition point is as follows:
h e , r = 1 2 ξ ρ v 2
where ρ is the airflow density (outlet) in the fire area, kg/m3; v is the outlet wind speed, m/s; and ξ is the flame local resistance coefficient, dimensionless.
ζ = 1.7 k s 1 k s 2 , k s < 1
where ks is the ratio of the flame sectional area to the roadway sectional area, dimensionless. Depending on the type of fire source and the intensity of combustion, the maximum flame area coefficient generally ranges from 0.285 to 0.41, in which the fire source is strong, and therefore, this variable takes a high value; in the equation here, ks = 0.4
It is assumed that the main component of the smoke flow generated by fire combustion is CO2, which is converted from the oxygen in the airflow after combustion in equal amounts, whereas the other exogenous gases, such as CO, are limited in terms of the absolute amount compared with the airflow components. The flow and dispersion of the airflow and smoke from the combustion in the mine airflow system during a mine roadway fire are unsteady flows, and the concentration of the airflow and smoke on branch j in the wind network [23] can be expressed as follows:
c j τ + v j c j x = E x 2 c j x 2
in which cj is the average smoke concentration volume fraction of the roadway section, %; x is the location of the side branch, m; vj is the average wind speed of the roadway, m/s; and Ex is the longitudinal mechanical dispersion coefficient of the airflow, m2/s.

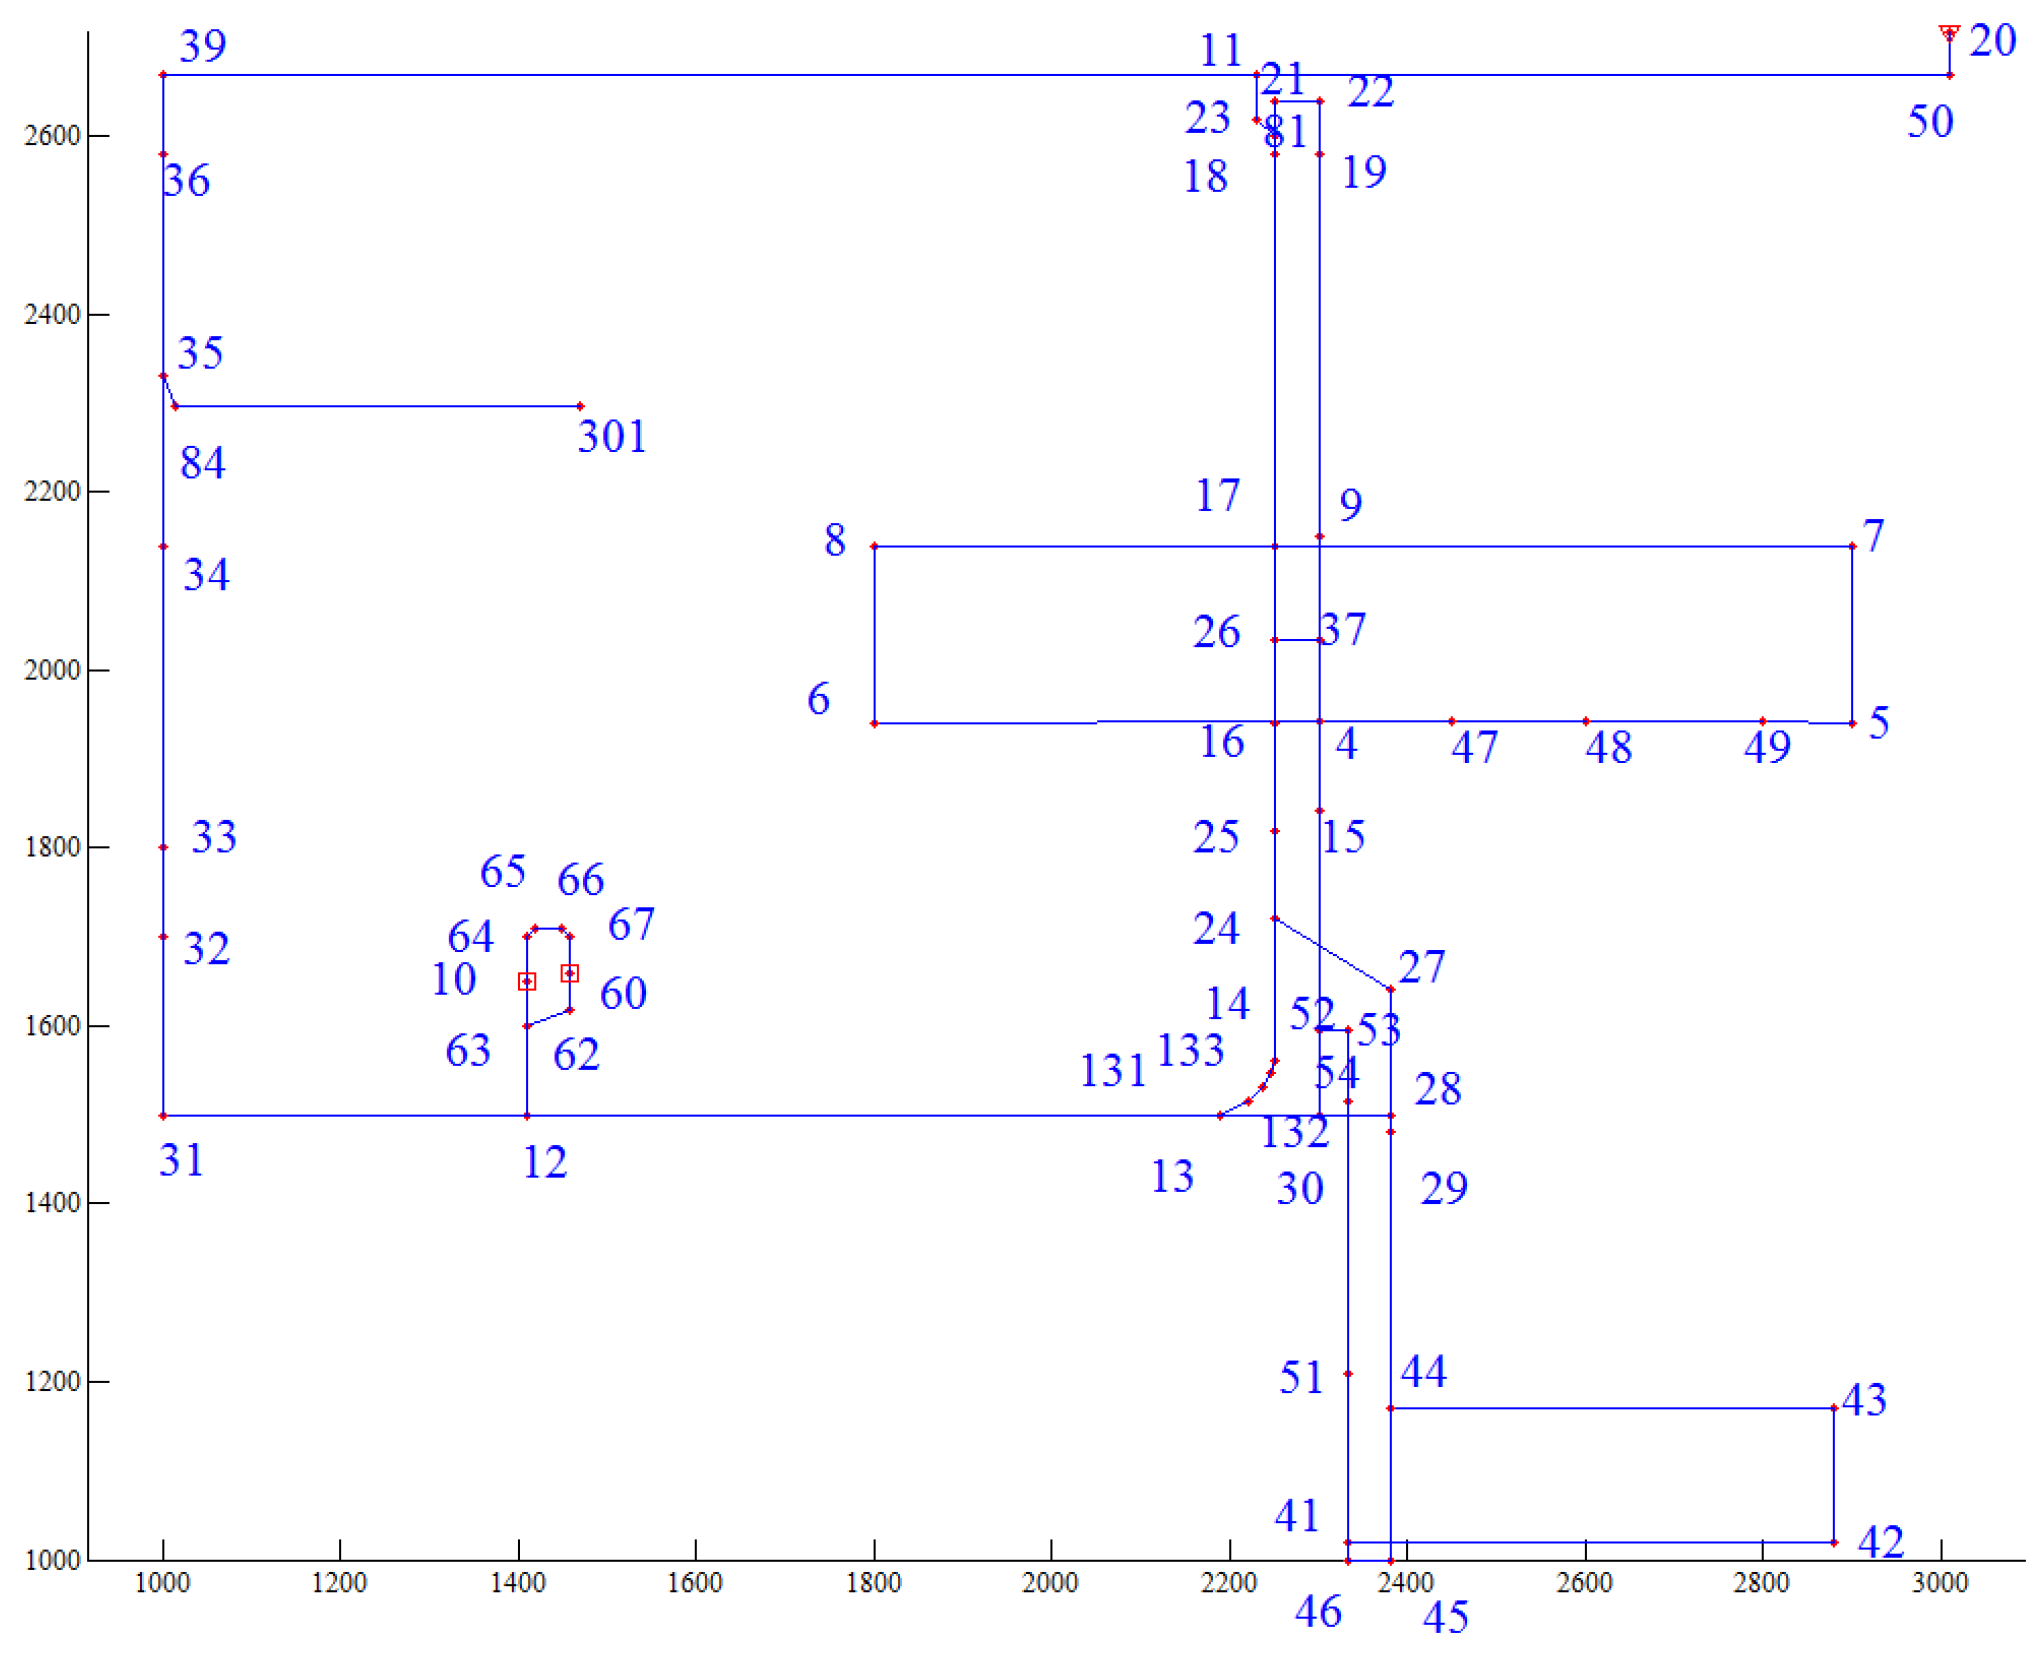
3. Experiment on Airflow System Disorder of Mine Fire

Figure 1 shows the schematic of the experimental device used for simulating the process of airflow system disorder in the event of mine fires. The experimental device comprised a ventilation duct, a microfan, a fire source electric heat wire, and a data acquisition module. Among these, the ventilation duct was a rectangular structure 3800 mm high and 1000 mm wide, including the total air inlet duct, total air outlet duct, fire main air duct, and the side branch connected to it. Table 1 presents the specific parameters of the experimental duct. The maximum loading voltage of the microfan was 12 V. It was arranged at the air inlet end of the total air inlet duct to simulate the mine fan and compress the air sent into the ventilation duct. The loading voltage of the fan can be varied through the power regulator to control its air supply capacity. A fire source electric heating wire was located at the center of the main air duct, the maximum loading voltage of the electric heating wire was 220 V, and the maximum heating power was 1 kW. The loading voltage of the electric heating wire was set using the power regulator to simulate the change in the exothermic intensity of the fire source combustion. Figure 2 shows the variation in the loading voltage of the heating wire with time. The data acquisition module included an RS485 acquisition module, three wind speed sensors, and five J-type thermocouples. The wind speed sensors had a range of 0–5 m/s, with a resolution of 0.01 m/s, and were distributed at the inlet ends of the total air duct, main air duct, and side branch air. J-type thermocouples with a resolution of 0.1 °C were used to measure the temperature inside the ventilation duct during the experiments. The RS485 acquisition module transmitted the temperature and signals of the wind speed to the computer.
The control variable method was used to visually understand the process and characteristics of the airflow disorder in the mine ventilation system due to the ascensional airflow fire and to investigate the effect of different air supply capacities on the fire resistance of the mine during the period of the fire. The loading voltages of the microfan were set to 4.5, 6, 7.5, and 9 V.

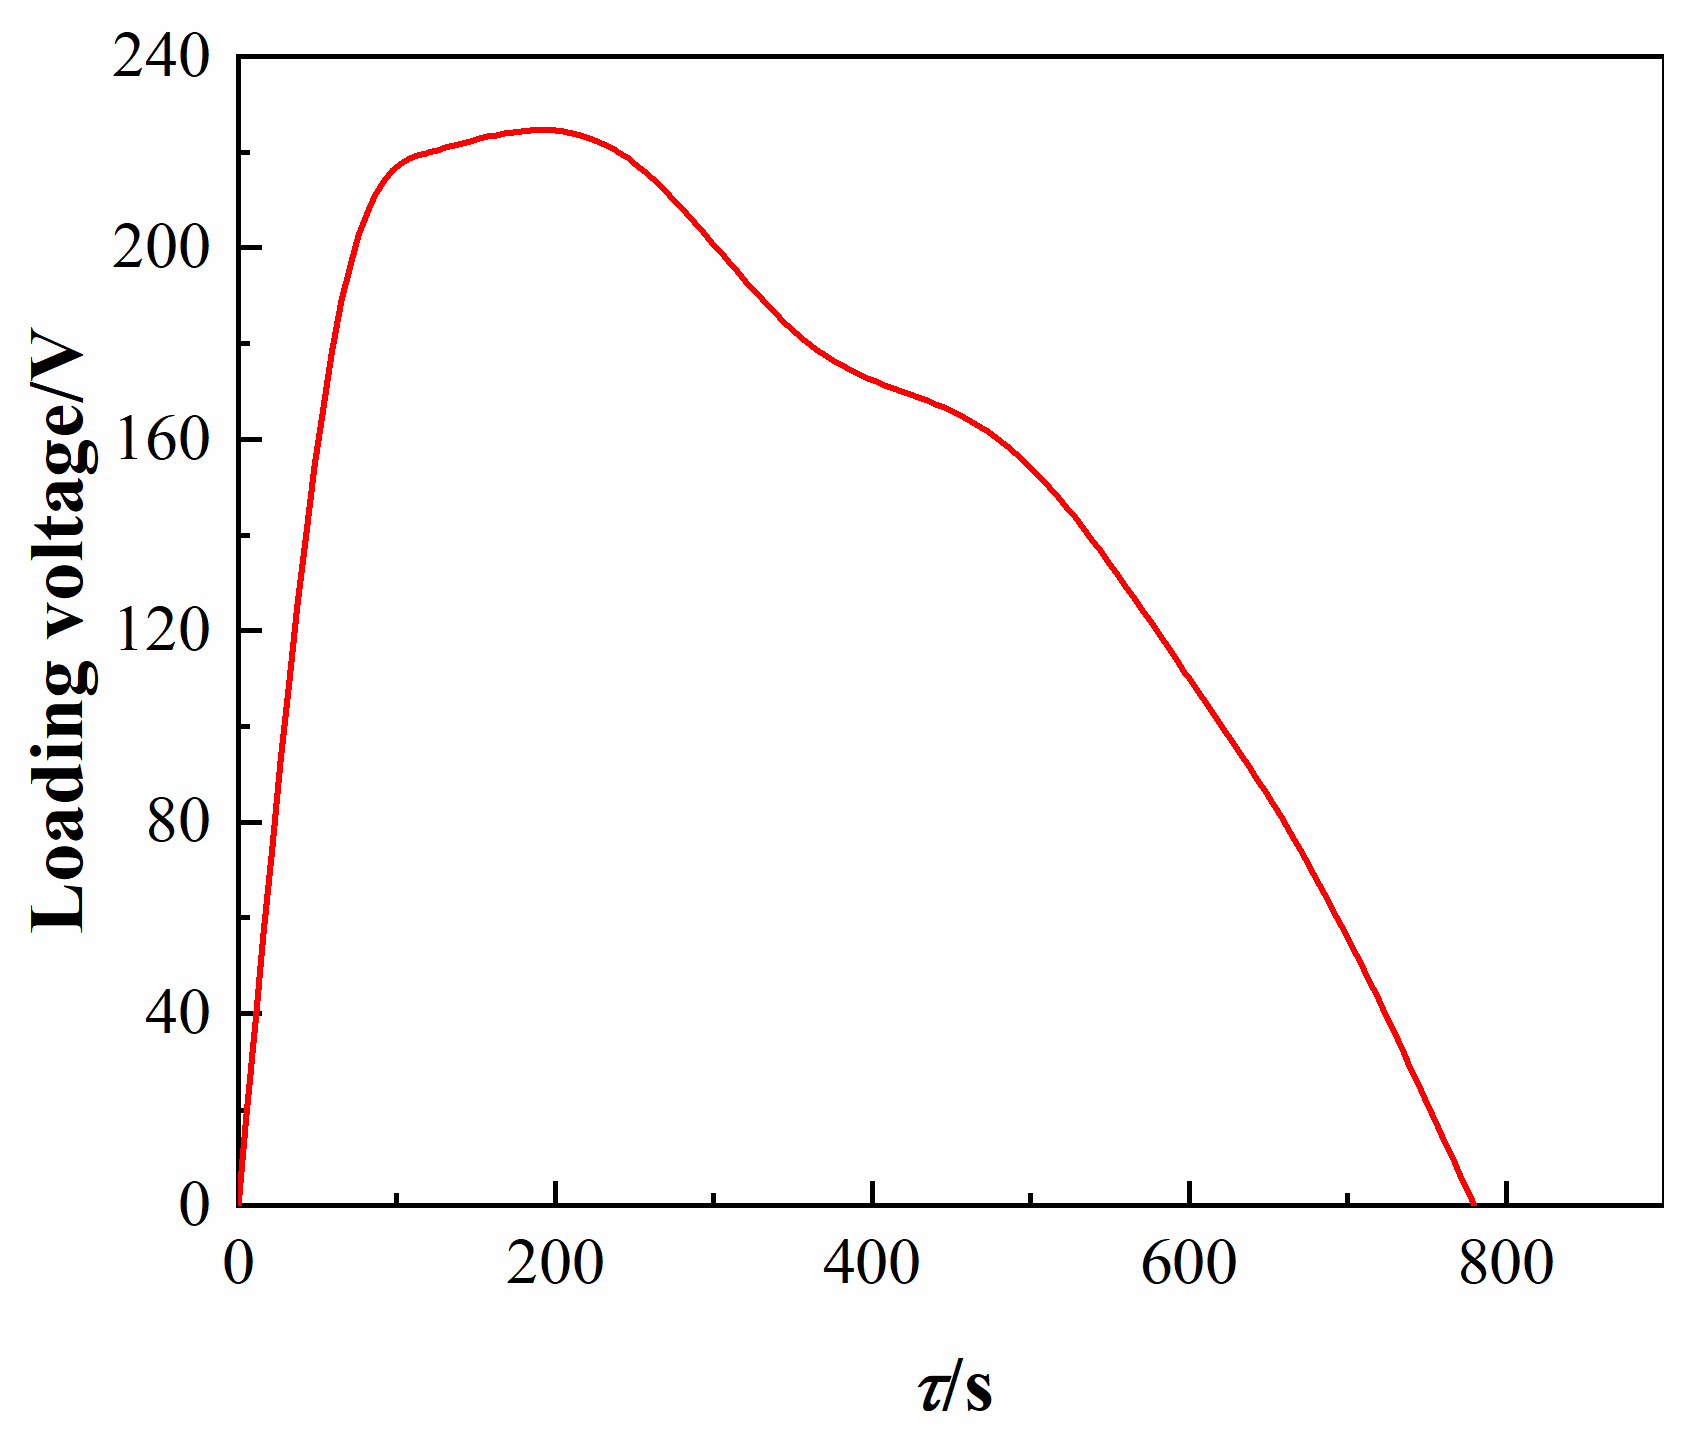
4. Experimental Results and Analysis

4.1. Airflow Disorder Characteristics in Ventilation System during Ascensional Airflow Fire

Figure 3 shows the variation in the speed of the air ducts in the ventilation system in each group of experiments. For the ascensional airflow fire, the wind speed v1 of the main air ducts increased as the fire intensified, with a maximum value of v1-max corresponding to v1-max values of 2.05, 1.68, 1.74, and 1.73 m·s−1, the fan loading voltages were 4.5, 6, 7.5, and 9 V, respectively. At the end of the burn, v1 returned to its original value. The wind speed vl of the side branch decreased as the fire intensified. vl decayed quickly at fan loading voltages of 4.5 and 6 V until the wind flow stagnated; thereafter, vl appeared negative, and the wind flow reversed, and vl weakened but did not stagnate or exhibit reverse flow at fan loading voltages of 7.5 and 9 V. The minimum values of vl in each group of experiments vl-min were −0.32, −0.14, 0.02, and 0.2 m·s−1; when the fan voltages were 4.5 and 6 V, the total wind speed v0 increased at the beginning of the experiments, as the fire weakened, v0 gradually returned to its initial value, and when the ventilator voltages were 7.5 and 9 V, v0 changed gradually to overcome airflow reversal in the side branch.

4.2. Variation Characteristics of Fire Heating Air Pressure and Ventilation Thermal Resistance

Figure 4 shows the variation in the temperature at each monitoring point during the experiment. The temperature at monitoring points 1#, 2#, and 3# during the period of the fire exhibited different degrees of increase, whereas the temperature at monitoring points 4# and 5# located in the main air duct and side branch end of the inlet side did not change. The temperature at each measurement point gradually returned to the original level after the fire source gradually disappeared. When the fan loading voltages were 4.5, 6, and 7.5 V, the temperature at monitoring point 1# increased, indicating that part of the main air with high temperature flowed into the side branch. When the fan loading voltage was 9 V, the temperature changes were evident only at monitoring points 2# and 3#, while there was no change in the temperature at monitoring points 1#, 4#, and 5#, indicating that the high-temperature air in the main air duct did not flow into the side branch but directly exhausted from the total air duct.
As shown in Figure 5a, the trend in the fire heating air pressure in the main air duct during the period of fire can be broadly divided into three stages as follows: initial accelerated growth, peak slow growth, and slow decay. The increase in the fire-heating air pressure decreased with the increase in the ventilator capacity, and the peak fire-heating air pressure decreased from 5.51 Pa at 4.5 V to 5.26 Pa at 9 V.
The experimental results showed that the main influence range of the high-temperature smoke was among temperature monitoring points 1#, 2#, and 3#, and the average temperature change from the 2# to 3# section was used to approximate the change in the ventilation thermal resistance of the main air duct. The average temperature change from the 1# to 2# section was used to characterize the average temperature change in the fire side branch and the change characteristics of the ventilation resistance of the side branch. As shown in Figure 5b,c, the average temperature T1-2 of Section 1# to 2# and the average temperature T3-2 of Section 2# to 3# during the period of the fire exhibit an accelerated growth at the beginning, slow growth at the peak, and slow decay with the development of the fire. In the four groups of experiments conducted under fan loading voltages ranging from 4.5 to 9 V, the T1-2 peaks were 101.35, 98.00, 79.90, and 77.95 °C, and the T1-2 peaks were 164.85, 169.60, 166.60, and 166.60 °C. The thermal resistance of ventilation within the ventilation system increased due to fire heating. The ventilation thermal resistance of the side branch diminished with the increase in the fan supply capacity, and in the two experimental groups (fan loading voltages of 4.5 and 6 V), in which airflow reversal occurred in the side branch, the growth rate of the ventilation thermal resistance in the main air duct increased with the increase in the fan capacity. In comparison, in the experimental groups (fan loading voltages of 7.5 and 9 V), in which airflow reversal did not occur in the side branch, the increment in the ventilation thermal resistance in the main air duct was between those observed at voltages of 4.5 and 6 V.
As the fire source burning intensity increased, the fire heating air pressure and ventilation thermal resistance in the system increased, the pressure difference between the two ends of the main air duct increased, and v1 increased. When the fire developed strongly, the fire-heating air pressure increased, the pressure difference between the two ends of the side branch decreased, and there was even a circulating airflow in the circuit. When the ventilator capacity increased, the increase in the fire heating air pressure decreased, the average temperature of the main wind duct T3-2 increased, and the ventilation resistance increased; when the increase in the fire heating air pressure decreased, resulting in a decrease in the ventilation pressure in the side branch, the average temperature T1-2 growth intensity decreased, and the ventilation resistance increment decreased. This was conducive to maintaining the original direction of the airflow, i.e., to improve the stability of the ventilation system.

5. Simulation Analysis of the Disaster Evolution during the Period of Ascensional Airflow Fire in a Mine

5.1. Analysis of the Disaster Evolution during the Period of Ascensional Airflow Fire in a Mine

The experimental device described above can only reflect the disorder phenomenon of a simple topological pipeline system. In comparison, the fire smoke flow transport and airflow disorder in an entire area mine network are more complex, which requires a disaster ventilation simulation platform. In this study, TF1M3D software developed by the author was used to describe this process. For specific software information, see reference [24].
As shown in Figure 6, the example mine has three coal mining faces, namely, 401, 402, and 403, and ascensional ventilation is applied to all these faces. During the period of normal ventilation, the fan speed was n = 540 r/min. Before the fire, the air volumes at the 401, 402, and 403 working faces were 11.23, 9.09, and 10.01 m3/s, respectively, and the total mine air volume was 58.66 m3/s. The total resistance was 1192.6 Pa, and the natural air pressure was 441.79 Pa. The total mine system air resistance was 0.35 N·s2/m8. Figure 7 shows the node diagram of the mine model.
The height difference of the working face 401 was 60 m, and the fire source point was set near the air inlet end of this face, which was an ascensional airflow fire. Figure 8 shows the preset fire source model of the TF1M3D software simulation. The fire source combustion mode contained the initial accelerated combustion, peak period, and slow attenuation (a fire model). The total combustion time was 5946 s, and the maximum temperature of the fire source center was 1058 °C.
During its initial period, the fire was weak, and the smoke flowed into the 401 working face air return roadway with the incoming airflow; as the fire intensified, the air volume in the 401 air return roadway increased under the action of the fire heating air pressure, and the air volume in the 402 working face decreased and stagnated. The airflow reversal phenomenon appeared, and a part of the high-temperature smoke flow in the 401 air return roadway invaded the 402 air return roadway. The high-temperature smoke flow reversed to the 402 working face at 2055 s. At 2910 s, the 402 working face was completely invaded. The high-temperature smoke from the main air route invaded the side branch, consistent with the experimental results. In the other route, the high-temperature smoke flow in the return air uphill penetrated the belt uphill (side branch) through the regulating door of the mining substation 1# at 480 s, resulting in the reversal of the flue gas flowing in the tape uphill with a low airflow rate. The reversed smoke flow reached the intersection between the 401 and 402 air intake roadways at 1920 s and then invaded the 401 air intake roadway. The smoke flow reached the intake end of the 401 working face at 2070 s, causing a secondary smoke flow infringement at the 401 working face, also consistent with the experimental law. Similarly, at 3240 s, the high-temperature smoke flow spread to the 402 air intake roadway, arrived at the intake end of the 402 working face at 4575 s, and diffused into the entire 402 working face at 5115 s, causing a secondary attack at the 402 working face.
The TF1M3D software produced a total of 630 dynamic screens of the airflow, including the CO concentration in the smoke and the temperature distribution at different moments of the fire, as shown in Figure 9 and Figure 10.
When the fire strength was reduced (simulated extinguishment), the fire power disappeared, the reversal state could not be maintained, and the original ascensional airflow ventilation was restored at 5055 s. The fresh airflow gradually displaced the harmful fumes and was finally completely discharged from the return shaft opening. The arrival times of the prominent counter gas at each node are shown in Table 2.

5.2. Analysis of Wind Flow Disorder Change Process in the Side Branch (Belt Uphill)

The reversal of the smoke flow in the side branch of the ascensional airflow fire can be broadly divided into four processes as follows: initial wind reduction, airflow stagnation, wind flow reversal, and restoration of ventilation. Figure 11 shows the variation curve of the air volume on the belt uphill during the period of fire, which was obtained using the TF1M3D software. As shown, the air volume on the belt uphill decreased to zero when the fire occurred for 430 s. This phenomenon indicates that the airflow stagnation occurred under the combined action of the fire thermodynamic force, mine ventilator power, and thermal resistance, and the change is consistent with the experimental results. As the fire intensified, the fire-heating air pressure increased, resulting in a reverse flow up the belt uphill and a rapid increase in the air volume, reaching a maximum of 3.95 m3/s (at 825 s). The fire heating air pressure gradually decreased as the fire decayed. With the decrease in the reversal air volume, it returned to the original ventilation direction at 4950 s and to the original air volume value at 6915 s.
The airflow reversal process was related to the strength of the fire burned, and the airflow reversal and air volume varied with the fire heating air pressure. The air volume change law of the ascensional airflow fire on the side branch belt uphill, depicted in Figure 11, was consistent with the experimental results (Figure 3).

5.3. Emergency Planning Measures to Deal with the Reversal of Smoke Flow during Mine Fires

As shown in Figure 9 and Figure 10, under the condition that the ventilator rotation under normal ventilation is 540 r/min, the smoke flow of the ascensional airflow fire at the 401 working face spreads to the 402 working face and 401 intake roadway. To avoid this effect and ensure the reliability and stability of the mine ventilation system, preplanned measures to increase the capacity of the mine ventilator are required to enhance the fire resistance capability during the period of fire. Combined with the specific calculations for the studied mine, when the ventilator rotation was adjusted to 740 r/min, the smoke flow transport during the ascensional airflow fire period was simulated. Figure 12 shows the details. For the same fire location and fire source burning model, at 465 s of the mine fire burning, the smoke flowed up from the fire source point to node 20# (return air shaft entrance); at 660 s, due to the strong fire, a part of the smoke flow in the air return uphill roadway invaded the 21# node at the top of the belt roadway, and at 3660 s, the smoke that had invaded the belt roadway resumed its original direction when it diffused to the middle of the belt roadway and drifted while moving up the belt roadway; at 5520 s, the smoke from the belt uphill was completely discharged into the air return uphill; and at 6735 s, the smoke was completely discharged into the air return uphill roadway after the fire source had burned out. Improving the ventilator capacity could help ensure that the wind flow at the 402 working face, which was located in the side branch, is not reversed during the entire fire process. This also prevented the 401 air intake roadway from being infiltrated by the smoke flow and created favorable conditions for fire extinguishing at the intake side of the 401 working face.

6. Conclusions

(1)
The experiments conducted in this study showed that, under the thermodynamic effect of fire and ascensional airflow fire period, the main wind duct air volume increased, the side branch air volume decreased, the airflow stagnated, and a reverse flow phenomenon occurred. When the fire development was strong, the fire heating air pressure caused the circulation of the airflow in the ventilation circuit, while the pipeline ventilation thermal resistance increased. Improving the air supply capacity of the ventilator could help overcome the retrograde of the wind flow of the fire side branch of the ascensional airflow and mitigate the disaster. The simulation results were in good agreement with previous experimental results, which were completely consistent with the airflow change law.
(2)
Increasing the ventilation fan speed was beneficial to divert the smoke from the mine fire. Using the TF1M3D platform simulation, the calculation mine ventilation fan was set at a speed of 540 r/min. After the occurrence of an ascensional airflow fire for 430 s, the airflow reversed in the side branch, and smoke flow circulation threatened the 401 intake roadway. After 4950 s, the fire strength was reduced, and the smoke flow caused a secondary attack at the side branch 402 working face. After increasing the fan speed to 740 r/min, the fire smoke diversion and disaster control were more favorable.
(3)
The TF1M3D software was found to be suitable for complex mine ventilation systems and can help simulate fires under real conditions in specific mines, providing auxiliary decision support for gaining disaster experience and developing fire emergency management plans. In future work, we will deeply study the ventilation law during the period of a mine disaster.

Author Contributions

M.Z.: conceptualization, original draft writing; Z.L.: review and editing, funding acquisition. All authors have read and agreed to the published version of the manuscript.

Funding

This research was funded by the Key Laboratory of Xinjiang Coal Resources Green Mining, Ministry of Education, (KLXGY-Z2405) and the National Natural Science Foundation of China (Grant No. 51774170).

Data Availability Statement

The data required for this study are contained in the manuscript and are always available without limitation. Further inquiries can be directed to the corresponding author.

Conflicts of Interest

The authors declare no conflicts of interest.

References

  1. Zhou, F.-B.; Shi, B.-B.; Cheng, J.-W.; Ma, L.-J. A New Approach to Control a Serious Mine Fire with Using Liquid Nitrogen as Extinguishing Media. Fire Technol. 2013, 51, 325–334. [Google Scholar] [CrossRef]
  2. Dimitriadis, C.; Gao, C.X.; Ikin, J.F.; Wolfe, R.; Gabbe, B.J.; Sim, M.R.; Abramson, M.J.; Guo, Y. Exposure to mine fire related particulate matter and mortality: A time series analysis from the Hazelwood Health Study. Chemosphere 2021, 285, 131351. [Google Scholar] [CrossRef] [PubMed]
  3. Roy, D.; Singh, G.; Seo, Y.-C. Coal mine fire effects on carcinogenicity and non-carcinogenicity human health risks. Environ. Pollut. 2019, 254, 113091. [Google Scholar] [CrossRef]
  4. Lei, B.; He, B.; Xiao, B.; Du, P.; Wu, B. Comparative study of single inert gas in confined space inhibiting open flame coal combustion. Fuel 2020, 265, 116976. [Google Scholar] [CrossRef]
  5. Zhang, Y.; Wu, B.; Liu, S.-H.; Lei, B.; Zhao, J.; Zhao, Y. Thermal kinetics of nitrogen inhibiting spontaneous combustion of secondary oxidation coal and extinguishing effects. Fuel 2020, 278, 118223. [Google Scholar] [CrossRef]
  6. Yuan, L.; Zhou, L.; Smith, A.C. Modeling carbon monoxide spread in underground mine fires. Appl. Therm. Eng. 2016, 100, 1319–1326. [Google Scholar] [CrossRef]
  7. Li, Y.; Lei, B.; Ingason, H. Study of critical velocity and backlayering length in longitudinally ventilated tunnel fires. Fire Saf. J. 2010, 45, 361–370. [Google Scholar] [CrossRef]
  8. Wang, H. Numerical and theoretical evaluations of the propagation of smoke and fire in a full-scale tunnel. Fire Saf. J. 2012, 49, 10–21. [Google Scholar] [CrossRef]
  9. Litton, C.D.; Perera, I.E. Evaluation of criteria for the detection of fires in underground conveyor belt haulageways. Fire Saf. J. 2012, 51, 110–119. [Google Scholar] [CrossRef]
  10. Wan, H.; Gao, Z.; Ji, J.; Li, K.; Sun, J.; Zhang, Y. Experimental study on ceiling gas temperature and flame performances of two buoyancy-controlled propane burners located in a tunnel. Appl. Energy 2017, 185, 573–581. [Google Scholar] [CrossRef]
  11. Wang, J.; Fang, Z.; Tang, Z.; Yuan, J. Influence of longitudinal ventilation on the mass flow rate distribution of fire smoke flow in tunnels. Tunn. Undergr. Space Technol. 2021, 112, 103938. [Google Scholar] [CrossRef]
  12. Yuan, L.; Mainiero, R.J.; Rowland, J.H.; Thomas, R.A.; Smith, A.C. Numerical and experimental study on flame spread over conveyor belts in a large-scale tunnel. J. Loss Prev. Process Ind. 2014, 30, 55–62. [Google Scholar] [CrossRef]
  13. Huang, L.-L.; Zhu, G.-Q.; Zhang, G.-W.; Yin, F. Research the Occupants Safe Egress of Underground Pedestrian Street based on the Analysis of Fire Smoke Movement. Procedia Eng. 2013, 52, 158–164. [Google Scholar] [CrossRef]
  14. Hansen, R. Modelling temperature distributions and flow conditions of fires in an underground mine drift. Geosyst. Eng. 2020, 23, 299–314. [Google Scholar] [CrossRef]
  15. Kalech, B.; Bouterra, M.; ElCafsi, A. Numerical analysis of smoke flow under the effect of longitudinal airflow in a tunnel fire. Fire Mater. 2020, 44, 1033–1043. [Google Scholar] [CrossRef]
  16. Kun, L.; Cui, D.; Changfu, Y. Influence of Ventilation Tube Rupture from Fires on Gas Distribution in Tunnel. Procedia Eng. 2011, 26, 1440–1446. [Google Scholar] [CrossRef]
  17. Hu, L.; Fong, N.; Yang, L.; Chow, W.; Li, Y.; Huo, R. Modeling fire-induced smoke spread and carbon monoxide transportation in a long channel: Fire Dynamics Simulator comparisons with measured data. J. Hazard. Mater. 2006, 140, 293–298. [Google Scholar] [CrossRef] [PubMed]
  18. Chen, P.; Guo, S.; Wang, Y. Human evacuation affected by smoke movement in mine fires. Int. J. Coal Sci. Technol. 2016, 3, 28–34. [Google Scholar] [CrossRef]
  19. Ji, J.; Zhang, J.; Chen, J.; Wu, S. Computer simulation of evacuation in underground coal mines. Min. Sci. Technol. China 2010, 20, 677–681. [Google Scholar] [CrossRef]
  20. Wang, K.; Jiang, S.; Ma, X.; Wu, Z.; Shao, H.; Zhang, W.; Cui, C. Information fusion of plume control and personnel escape during the emergency rescue of external-caused fire in a coal mine. Process Saf. Environ. Prot. 2016, 103, 46–59. [Google Scholar] [CrossRef]
  21. Adjiski, V.; Mirakovski, D.; Despodov, Z.; Mijalkovski, S. Simulation and optimization of evacuation routes in case of fire in underground mines. J. Sustain. Min. 2015, 14, 133–143. [Google Scholar] [CrossRef]
  22. Li, Z. Containing the source ventilation network model and its application. J. China Coal Soc. 2010, 35, 118–122. [Google Scholar] [CrossRef]
  23. Lei, B.; He, B.; Zhao, Z.; Xu, G.; Wu, B. A method for identifying the fire status through ventilation systems using tracer gas for improved rescue effectiveness in roadway drivage of coal mines. Process Saf. Environ. Prot. 2021, 151, 151–157. [Google Scholar] [CrossRef]
  24. Hu, D.; Li, Z.; Wang, H.; Xu, H.; Miao, C. Smoke dispersion test and emergency control plan of fire in mine roadway during downward ventilation. Sci. Rep. 2023, 13, 1–11. [Google Scholar] [CrossRef]
Figure 1. Experimental device for airflow system disorder in the event of a mine fire. A is the air velocity transducer, B is the micro fan, C is the electric heating wire, and D is the J-type thermocouple.
Fire 07 00223 g001
Figure 2. Real-time voltage regulation curve of electric heating wire.
Fire 07 00223 g002
Figure 3. Variation in the wind speed in each branch under different fan loading voltages.
Fire 07 00223 g003
Figure 4. Variation in the temperature at each monitoring point.
Fire 07 00223 g004
Figure 5. Fire-heating air pressure and variation in the average temperature in ventilation ducts. (a) Fire-heating air pressure between 3# and 2#, (b) variation in the average temperature between 2# and 3#, and (c) variation in the average temperature between 1# and 2#.
Fire 07 00223 g005
Figure 6. Three–dimensional view of a mine ventilation system during the normal ventilation period (before the onset of fire). In the TF1M3D ventilation system and the state of wind flow movement, the identification is shown in Figure 6, in which the first value of the wind volume label (magenta numbers) is the wind volume, m3/s; the second value is the speed of the wind, m/s; green individual numbers are the regulating wind window labels; in the side branch, “F” represents the local fan.
Fire 07 00223 g006
Figure 7. Node diagram of mine model.
Fire 07 00223 g007
Figure 8. Fire source combustion model.
Fire 07 00223 g008
Figure 9. Smoke concentration distribution in a mine system under ascensional airflow fire.
Fire 07 00223 g009
Figure 10. Results of the smoke temperature simulation of a ventilation system during mine fire.
Fire 07 00223 g010
Figure 11. Variation in the air volume with time (belt uphill on side branch) as the fire intensifies.
Fire 07 00223 g011
Figure 12. Smoke concentration in the ventilation system when the fan speed is increased to 740 r/min.
Fire 07 00223 g012
Table 1. Parameters of experimental platform.
Platform ElementMaterialSize (Inner Diameters × Length)/mm
Total air inlet ductStainless steel50 × 700
Main air ductQuartz50 × 4800
Side branch air ductStainless steel50 × 4800
Total air outlet ductQuartz50 × 400
Table 2. Arrival times of the prominent counter gas at each node.
OrderTime/sLocation NodeOrderTime/sLocation Node
1457920558
2195171020705
3300811129106
4330111245756
54802113505537
655020 (Return air shaft entrance)1451158
716353715538526
819204
Disclaimer/Publisher’s Note: The statements, opinions and data contained in all publications are solely those of the individual author(s) and contributor(s) and not of MDPI and/or the editor(s). MDPI and/or the editor(s) disclaim responsibility for any injury to people or property resulting from any ideas, methods, instructions or products referred to in the content.

