Article

Study on Liquid Hydrogen Leakage and Diffusion Behavior in a Hydrogen Production Station

1
School of Automotive Engineering, Wuhan University of Technology, Wuhan 430070, China
2
Refrigeration Industry Department, Haier Smart Home Co., Ltd., Qingdao 266103, China
3
Comprehensive Smart Energy Business Division, Shandong Electric Power Engineering Consulting Institute Co., Ltd., Jinan 250013, China
*
Authors to whom correspondence should be addressed.
Fire 2024, 7(7), 217; https://doi.org/10.3390/fire7070217
Submission received: 2 June 2024 / Revised: 20 June 2024 / Accepted: 22 June 2024 / Published: 26 June 2024
(This article belongs to the Special Issue Hydrogen Safety: Challenges and Opportunities)

Abstract

:
Liquid hydrogen storage is an important way of hydrogen storage and transportation, which greatly improves the storage and transportation efficiency due to the high energy density but at the same time brings new safety hazards. In this study, the liquid hydrogen leakage in the storage area of a hydrogen production station is numerically simulated. The effects of ambient wind direction, wind speed, leakage mass flow rate, and the mass fraction of gas phase at the leakage port on the diffusion behavior of the liquid hydrogen leakage were investigated. The results show that the ambient wind direction directly determines the direction of liquid hydrogen leakage diffusion. The wind speed significantly affects the diffusion distance. When the wind speed is 6 m/s, the diffusion distance of the flammable hydrogen cloud reaches 40.08 m, which is 2.63 times that under windless conditions. The liquid hydrogen leakage mass flow rate and the mass fraction of the gas phase have a greater effect on the volume of the flammable hydrogen cloud. As the leakage mass flow rate increased from 5.15 kg/s to 10 kg/s, the flammable hydrogen cloud volume increased from 5734.31 m3 to 10,305.5 m3. The installation of a barrier wall in front of the leakage port can limit the horizontal diffusion of the flammable hydrogen cloud, elevate the diffusion height, and effectively reduce the volume of the flammable hydrogen cloud. This study can provide theoretical support for the construction and operation of hydrogen production stations.

1. Introduction

In recent years, with population growth and economic development, the demand for energy has been increasing, and the development of renewable energy has become a common development direction for Governments in terms of resource utilization [1]. Among the many renewable energy sources, hydrogen energy, which helps to reduce carbon emissions, has received much attention. Hydrogen has the advantages of being clean, non-polluting, storable, and versatile, and liquid hydrogen is an efficient energy carrier. However, once liquid hydrogen leaks, it will evaporate and mix with air to form a cloud of flammable hydrogen, with a high risk of combustion and explosion. Therefore, dealing with safety issues is a necessary precondition for the utilization of hydrogen. A hydrogen production station is a place for hydrogen production, purification, and transport; as an emerging energy infrastructure, its safety is a matter of great concern to society and the public, and safety design and reasonable siting and arrangement are the primary prerequisites for the safety of hydrogen production station.
Numerous organizations have conducted liquid hydrogen leakage experiments. In 1981, the National Aeronautics and Space Administration (NASA) of the USA [2] conducted a liquid hydrogen leakage test at the White Sands Proving Ground in New Mexico, leaking a total of 5.7 cubic meters of liquid hydrogen to the ground for a total duration of 35 s. In 2012, the Health and Safety Laboratory of the United Kingdom [3] conducted an experimental study of liquid hydrogen release based on the typical conditions of pipeline failure during hydrogen delivery from a hydrogen storage tank, during which a hydrogen vapor cloud was visible due to the condensation of water within the hydrogen cloud. In 2019, the Norwegian Defense Research Establishment [4] conducted a series of liquid hydrogen leakage experiments in open and confined spaces, respectively. In 2021, the German Federal Institute for Materials Research and Testing [5] conducted an experimental study of the leakage of liquid hydrogen into water, and it was found that leakage under all conditions formed a very chaotic liquid hydrogen–water mixing region and considerable evaporation.
With the continuous advancement of computer technology, numerical simulation has become a widely adopted research method. Sun et al. [6] used the ANSYS FLUENT software to investigate the effects of storage pressure, leak source height, and leak direction on the distribution of combustible regions. Holborn et al. [7] used the FLACS software to build a computational fluid dynamics (CFD) model of a large liquid hydrogen leak and simulated the diffusion of liquid hydrogen leakage behavior. Jin et al. [8] established a three-dimensional transient CFD model of cryogenic liquid hydrogen and analyzed the evaporation of cryogenic hydrogen and the diffusion of gaseous hydrogen as well as the influence of environmental factors on the leakage–diffusion behavior of liquid hydrogen. Wu et al. [9] investigated the leakage–diffusion behavior of liquid hydrogen under different working conditions using a CFD model, and Pu et al. [10] conducted numerical simulation studies on the leakage–diffusion behavior of liquid hydrogen containers in open space. Yuan et al. [11] modeled China’s first liquid hydrogen refueling station in Pinghu using FLACS to simulate liquid hydrogen leakage.
Statharas et al. [12] developed a 3D CFD model to simulate the complex diffusion behavior of liquid hydrogen between buildings. Liu et al. [13] examined the effect of solid obstacles on the trajectory of the gas cloud generated by a liquid hydrogen leak. Tang [14] used three different physical models to simulate, respectively, the evaporation of liquid hydrogen as a vehicle fuel in an open-air area, a garage, and a tunnel, and the evaporation and diffusion processes. Wang et al. [15] developed a numerical model of liquid hydrogen leakage diffusion and obtained the motion law of the hydrogen cloud by simulating the diffusion process of the hydrogen cloud at different locations of the obstacles. Busini et al. [16,17] investigated how the wall’s presence affects the diffusion of cryogenic heavy gases, and found that the size and height of the wall have a significant effect on the starting diffusion. Rong et al. [18] conducted a simulation of liquid hydrogen leakage to provide a comprehensive assessment of the leakage from a liquid hydrogen refueling station and proposed a method to stop the diffusion of liquid hydrogen leakage by using an air curtain.
In this study, based on the actual scenario and safety requirements of a proposed hydrogen production station in Weihai, China, a CFD model of liquid hydrogen leakage and diffusion in the hydrogen production station was established using the ANSYS FLUENT 2024 R1 software. The simulation of liquid hydrogen leakage and diffusion behaviors in the hydrogen storage area was carried out, and the impacts of factors such as ambient wind speed, wind direction, leakage mass flow rate, and leakage gas phase mass fraction on the leakage and diffusion of liquid hydrogen were investigated. The setup of a barrier wall was considered, and the impacts of the barrier wall distance and height on the liquid hydrogen leakage and diffusion behaviors were investigated. This study could provide technical support for the construction of the proposed hydrogen production station.

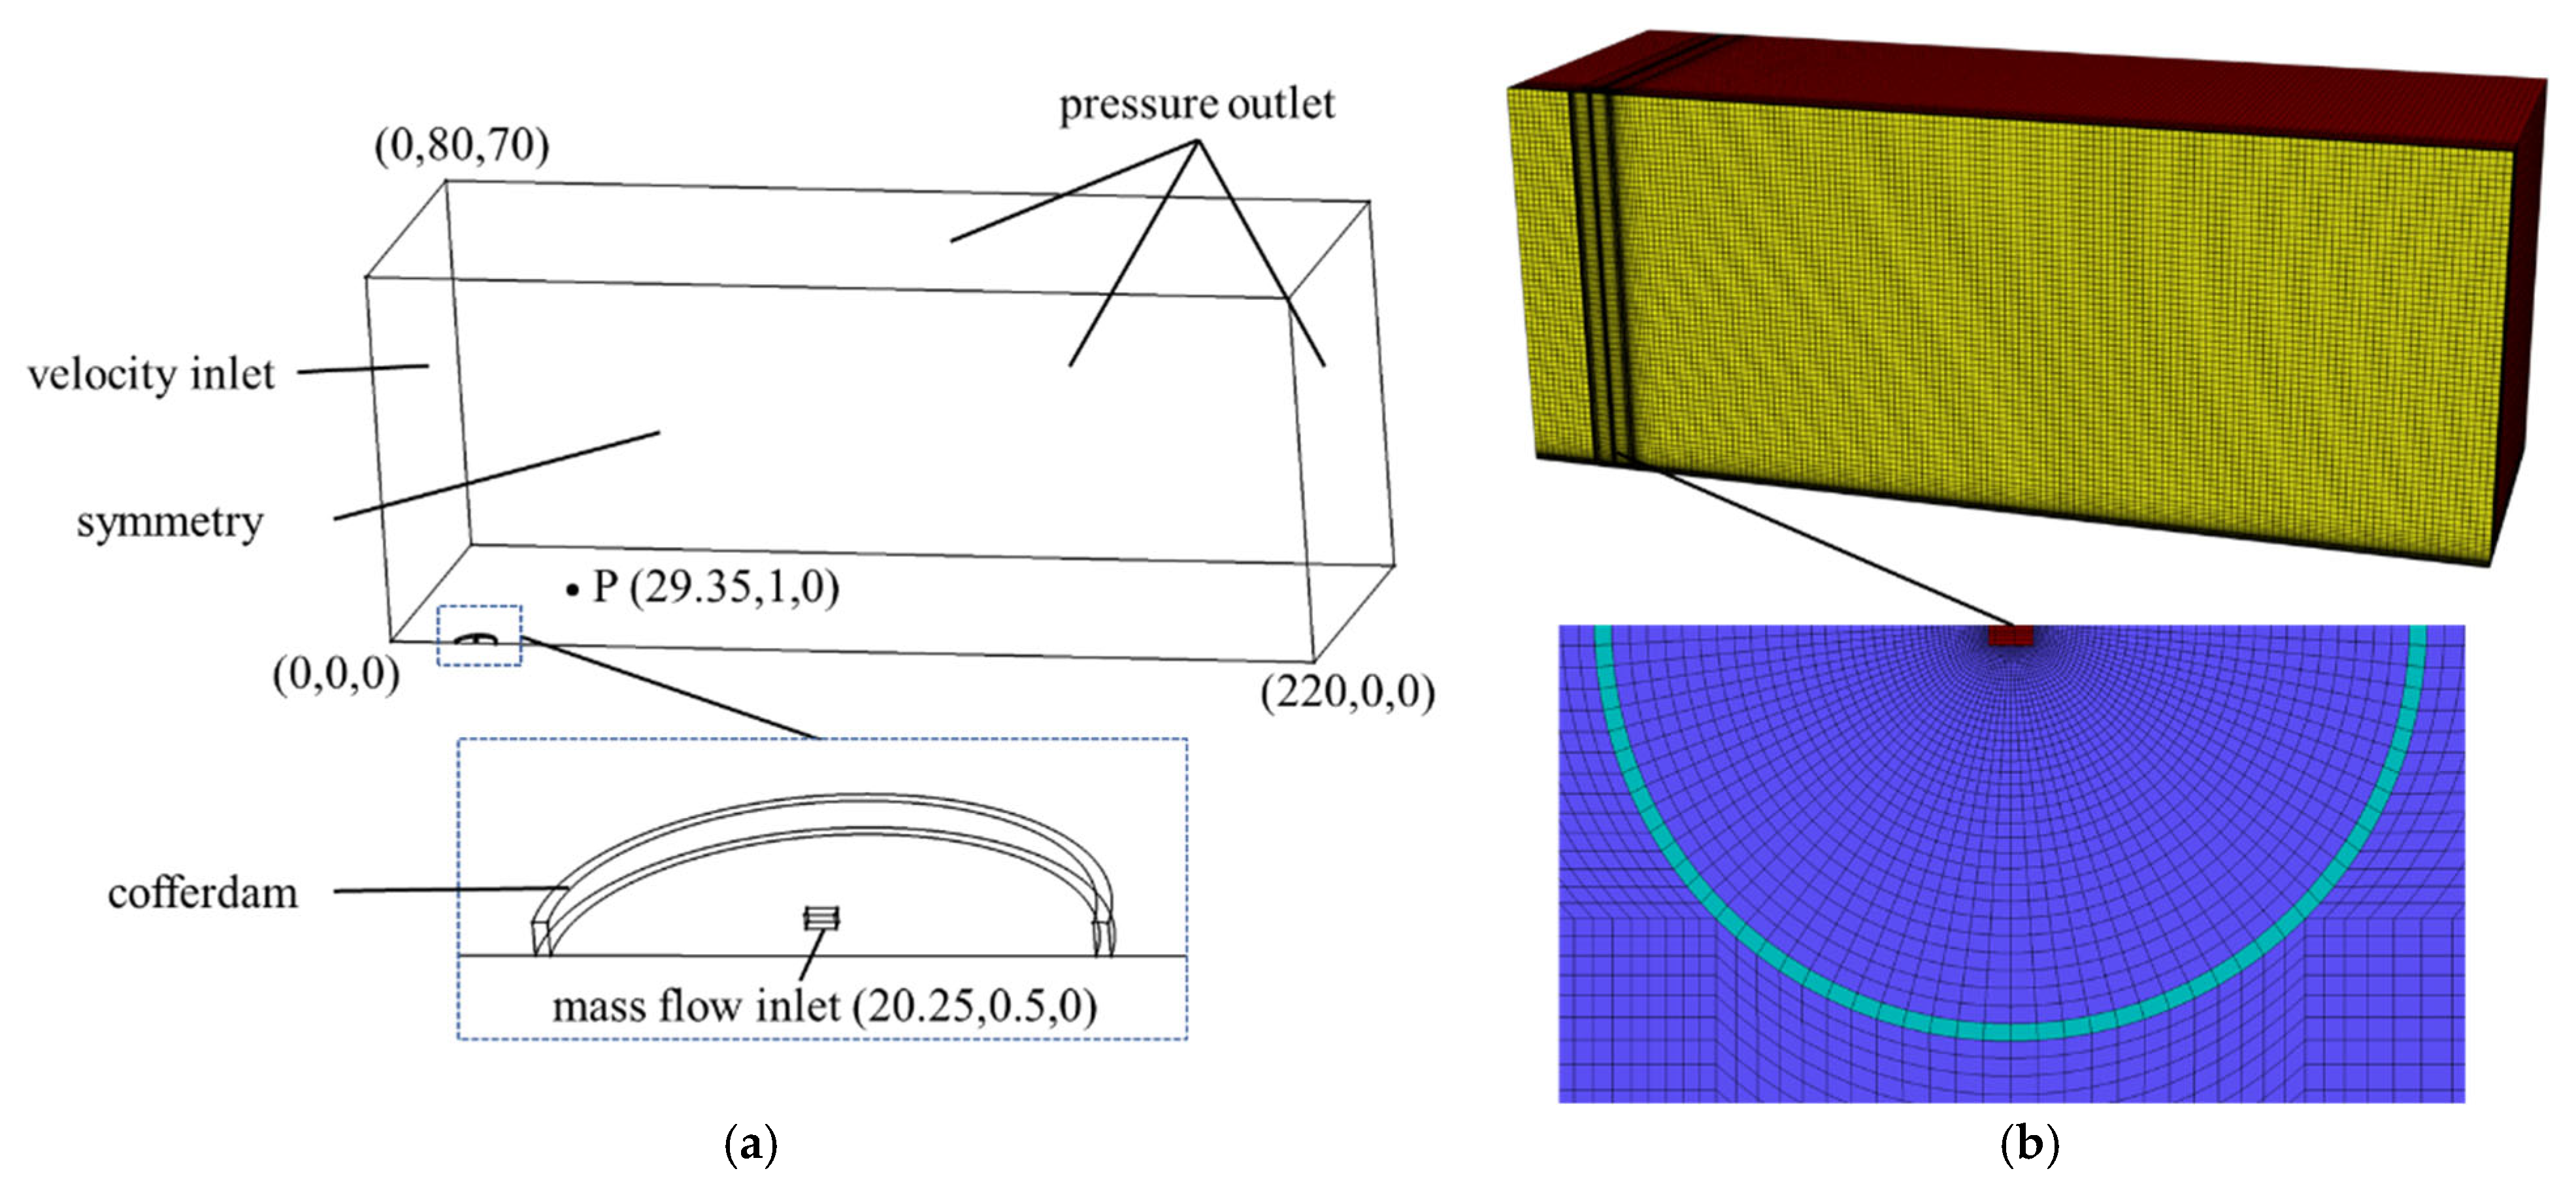
2. Modeling and Validation

2.1. Governing Equations

2.1.1. Fluid Flow Model

After liquid hydrogen leaks from the leakage port, a pool of liquid hydrogen will form on the ground, and the liquid hydrogen evaporates into gaseous hydrogen by heat exchange with air and ground, and diffuses in the atmosphere. Therefore, this study involves a two-phase flow problem, where the gas phase is a mixture of air and hydrogen, and the liquid phase is liquid hydrogen, for which we use the mixture model. The mass conservation equation and momentum conservation equation [19] are as follows:
ρ m t + ρ m v m = 0
t ρ m v m + ρ m v m v m = k = 1 2 α k ρ k v d r , k v d r , k +   μ m v m + v m T p + ρ m g
ρ m = α l ρ g + α g ρ l
v m = α l ρ g v l + α g ρ l v l ρ m
μ m = α l μ l + α g μ g
where ρ is the density, kg/m3; v is the velocity, m/s; α is the volume fraction; μ is the kinetic viscosity, N·s/m3; T is the temperature, K; p is the pressure, Pa; v d r is the drift velocity, m/s; the subscript m is the mixture and k is the gas phase g or the liquid phase l.
The energy conservation equation is as follows:
t k = 1 2 ( α k ρ k E k ) + k = 1 2 [ α k v k ( ρ k E k + p ) = ( k eff T ) + S E
where k eff is the effective thermal conductivity, W/(m·K); E k is the enthalpy of phase k, J.

2.1.2. Phase Transition Model

The volume fraction equation for the liquid phase is as follows:
t ρ l α l + ρ l α l v m = ρ l α l v d r , l + i = 1 N s g m ˙ g i l m ˙ l g i
where α l is the volume fraction of the liquid phase; N s g is the number of substance species in the gas phase; m ˙ g i l is the mass transfer from substance i in the gas phase to the liquid phase and m ˙ l g i is the mass transfer from the liquid phase to substance i in the gas phase, kg/s.
Since the leakage of liquid hydrogen is accompanied by evaporation, the widely used Lee model [20] is chosen in this study for the mass transfer between the liquid and gas phases. The mass flow rates between the phases in Equation (7) can be described as follows:
m ˙ l g = γ e v a α l ρ l T l T s a t T s a t ,   i f   T l > T s a t m ˙ g l = γ c o n α g ρ g T g T s a t T s a t ,   i f   T g < T s a t
where T s a t is the saturation temperature of liquid hydrogen; γ e v a   is the evaporation coefficient; γ c o n   is the condensation coefficient.
The slip velocity between the two phases is calculated by the following equation [21]:
v l g = τ l f d r a g ρ l ρ m ρ l a
where τ is the relaxation time, s; a is the acceleration vector, m/s2; and f d r a g is the trailing force, which is calculated by the following equation:
f drag = 1 + 0.15 R e 0.687 R e 1000 0.0183 R e R e > 1000
where R e is the Reynolds number.

2.1.3. Turbulence Model

During liquid hydrogen leakage, there are complex turbulent disturbances in the vicinity of the leakage port, which are investigated in this study using the Realizable k-ε turbulence model, in which the equations for k and ε are calculated as follows:
t ρ k + x j ρ k u j = x j μ + μ t σ k k x j + G k + G b ρ ε
t ρ ε + x j ρ ε u j = x j μ + μ t σ ε ε x j + ρ C 1 ε E ε   ρ C 2 ε ε 2 k + v ε + C 1 ε ε k C 3 ε G b
where μ is the dynamic viscosity, N·s/m3; k is the turbulent kinetic energy, m2/s2; μ t is the turbulent viscosity coefficient, which is related to the flow state and is calculated by ρ C μ k 2 ε ; σ k is the Prandtl number of the k equation, which takes the value of 1.0; σ ε is the Prandtl number of the ε equation, which takes the value of 1.3; G k is the turbulence kinetic energy affected by the laminar velocity gradient; G b is the turbulence kinetic energy affected by buoyancy force kinetic energy; C 1 ε = max 0.43 , η η + 5 , η = E k ε ; C 2 ε = 1.92 ; and C 3 ε is the effect of buoyancy on the dissipation rate, which takes the value of 0 when the direction of the simulated main flow is perpendicular to the direction of gravity.

2.1.4. Component Transport Model

In this study, the component transport model in the FLUENT 2024 R1 software was chosen to simulate the mixing and migration behavior of each substance in liquid hydrogen leakage:
t ( ρ Y i ) + d i ν ( ρ ν ˙ Y i ) = d i ν J i + R i + S i
where R i is the net production rate of the ith component; Y i is the mass fraction of the ith component; ρ is the gas density in units; S i is the production rate provided by the source phase; ν ˙ is the diffusion velocity vector; and J i is the diffusive flux of the ith component, and J i is computed by the following equation:
J i = ( ρ D i , m + μ i S c t ) Y i
where S c t is the turbulent Schmidt number, taking the value of 0.7; D i , m is the diffusion coefficient of the ith component in the mixture.

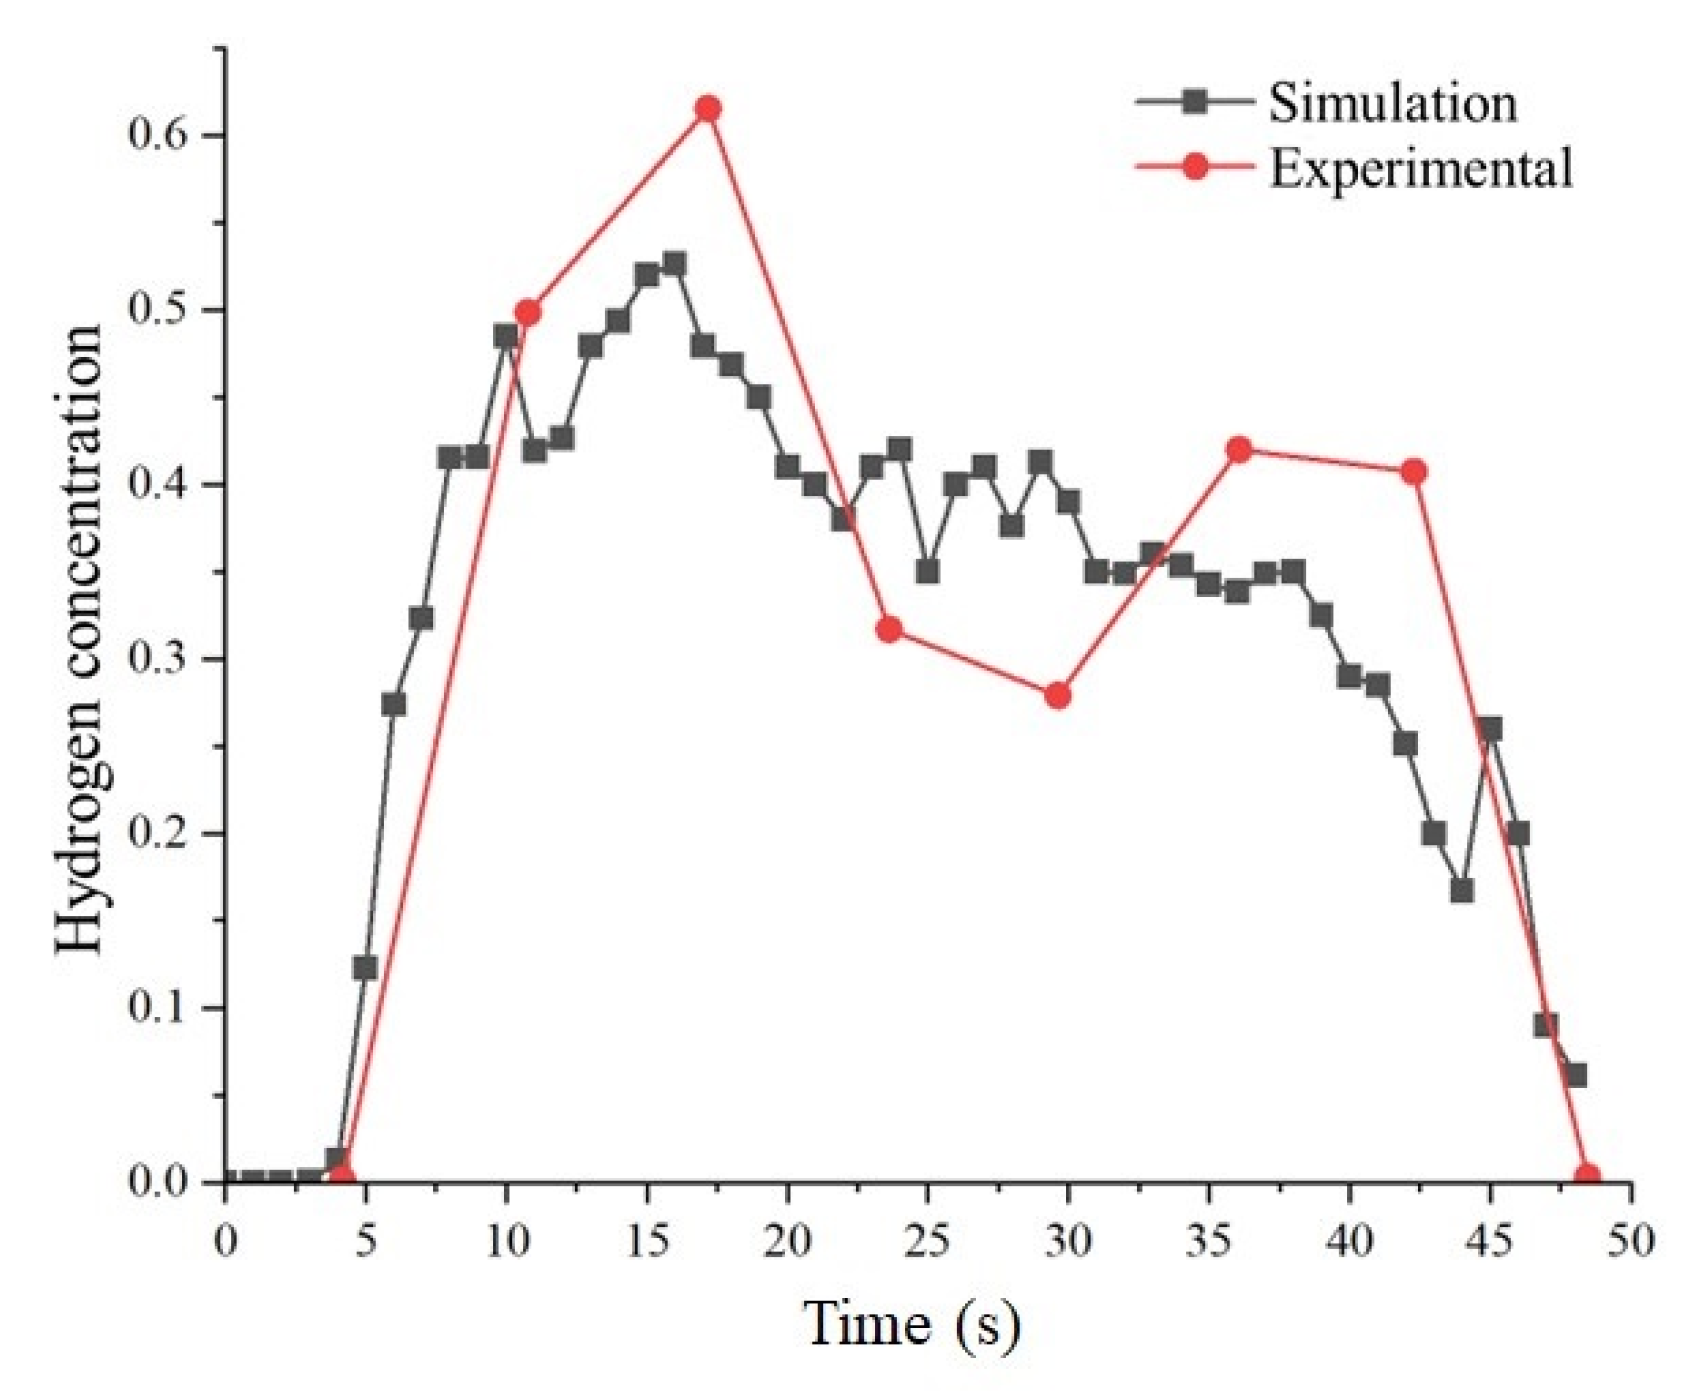
2.2. Model Validation

In this study, the liquid hydrogen leakage model is validated using the results of the NASA experiment [2]. The experiment leaked 5.7 m3 of liquid hydrogen into a liquid hydrogen pool, and the mass flow rate of the leakage was 9.52 kg/s. The geometrical model and its mesh division are shown in Figure 1. In consideration of the symmetry of the scene, we set up one-half of the model, with the vertical plane where the center of the leakage port is located as the symmetry plane. The overall length of the computational area is 220 m, the width is 70 m, and the height of the computational area is 80 m. The side close to the leakage location is set as the velocity inlet boundary, the wind speed is 2.2 m/s, the ambient pressure is one atmosphere, and the temperature is 288 K. According to the experimental conditions, the liquid hydrogen release source was simplified to a square with 0.5 m sides, 0.5 m above the ground and leaking vertically downwards. The outlet temperature is 20 K, the outlet pressure is 0.7 MPa, and the weir is 9.14 m in diameter. The cofferdam is a circle with a diameter of 9.14 m and a height of 0.61 m. In order to compare with the experimental values, a monitoring point P (29.35,1,0) is set near the leakage port.
The distribution of hydrogen cloud concentration on the symmetry plane at the moment of liquid hydrogen leakage for 20.94 s is compared, as shown in Figure 2. It is found that the trend of the hydrogen cloud motion at the lower 4% concentration limit of the CFD simulation results is basically consistent with that measured by the NASA experiment, indicating that the CFD model can simulate the liquid hydrogen leakage well.
As shown in Table 1, the simulation results match the experimental values in terms of hydrogen cloud height and horizontal diffusion distance with the relative errors of 5.5% and 5.7%, respectively. As shown in Figure 3, the overall trend of hydrogen concentration with time at the monitoring point P is consistent with the experimental data.

3. Results and Analysis

3.1. Grid-Independent Verification

The layout of the hydrogen production station is shown in Figure 4. The total length of the station is 390 m, and the width is 250 m. It includes areas such as the hydrogen production area, purification area, methanol area, hydrogen storage area, power distribution area, and control area. This study focuses on the accidental leakage of liquid hydrogen in the hydrogen storage area. The hydrogen storage area contains five 300 m3 hydrogen storage tanks with a length of 23.5 m, a diameter of 4.8 m, an inside pressure of 0.7 MPa, and a leakage location at the connection between the tank and pipeline. Figure 5 shows the geometric model and meshing of hydrogen production station.
The leakage port is a square with a side length of 0.133 m and a height of 2.6 m. A grid-independence analysis of the above model was conducted to compare the volume of the flammable hydrogen cloud at the time of the leakage for 20 s. Figure 6 shows that when the number of meshes was elevated to 2 million, the simulation result was basically the same as that with 1.77 million meshes, and 1.77 million meshes were chosen in this study to carry out subsequent simulation studies, taking into account the time cost and the accuracy.

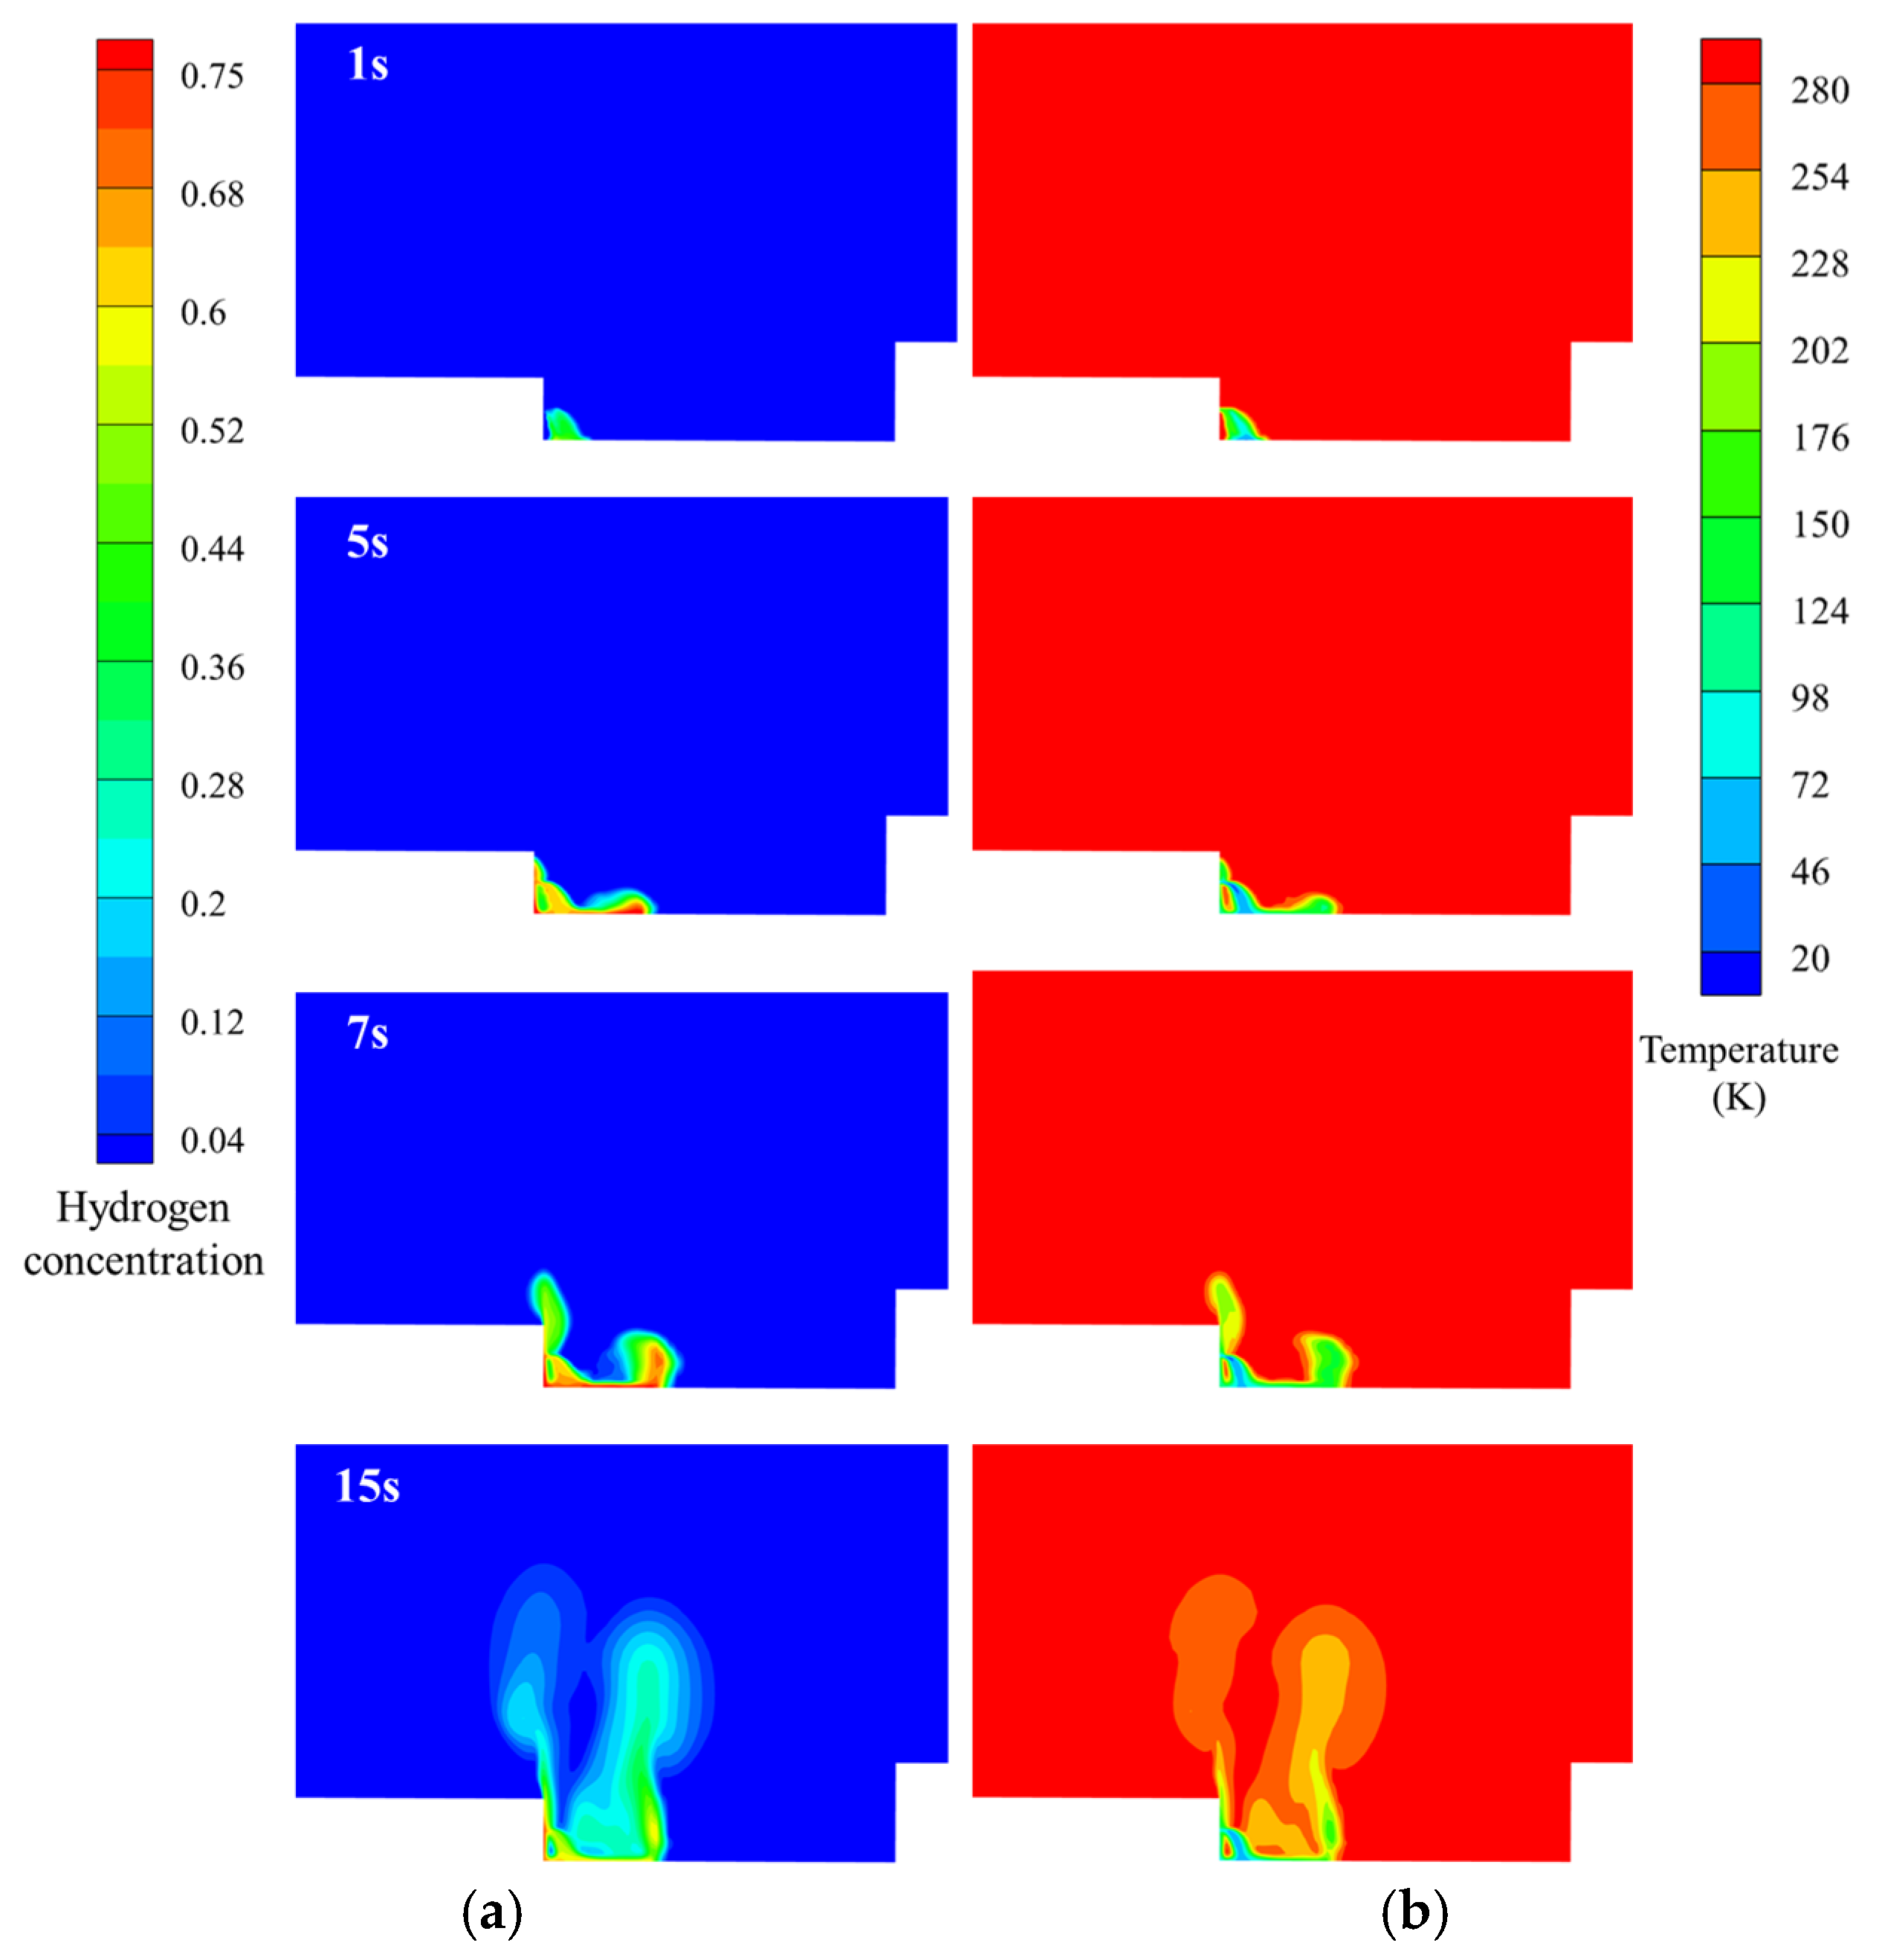
3.2. Hydrogen Leakage and Diffusion Behavior in Windless Environments

This section focuses on the case of a windless environment with an ambient temperature of 288.15 K and a leakage mass flow rate of 5.15 kg/s. As shown in Figure 7, the liquid hydrogen is ejected from the leakage port, and the flow direction of the liquid hydrogen is shifted downward under the influence of gravity. At about 1 s, the liquid hydrogen contacts the ground to form a liquid hydrogen pool on the ground and disperses to the surrounding area.
As the liquid hydrogen continues to leak and vaporize, the gas phase hydrogen near the leakage port will continue to increase. Figure 8 shows the variation in hydrogen concentration and temperature with time. It can be found that the distribution of the hydrogen concentration is essentially the same as the distribution of the surrounding temperature. The lower the temperature, the higher the hydrogen concentration. The concentration at the edge of the hydrogen cloud is lower, and the temperature is higher than that at the center of the cloud. This indicates that low-temperature hydrogen gas continuously absorbs ambient heat in the diffusion process, the temperature gradually increases and the density gradually decreases, and it gradually diffuses into the air. An additional reason for the increase in hydrogen temperature towards lower concentration is given by the mixing with ambient temperature air.
Figure 9 shows the area where the concentration of flammable hydrogen is greater than 4% of its lower flammable limit. It can be seen that a large amount of low-temperature hydrogen has gathered on the ground near the leakage port. With heat exchange and diffusion, the hydrogen gradually detaches from the ground, floats into the air, and expands continuously, forming a large-scale flammable hydrogen cloud, which, if an explosion occurs in the process, will cause serious injury to the person, equipment, and buildings near the leak.

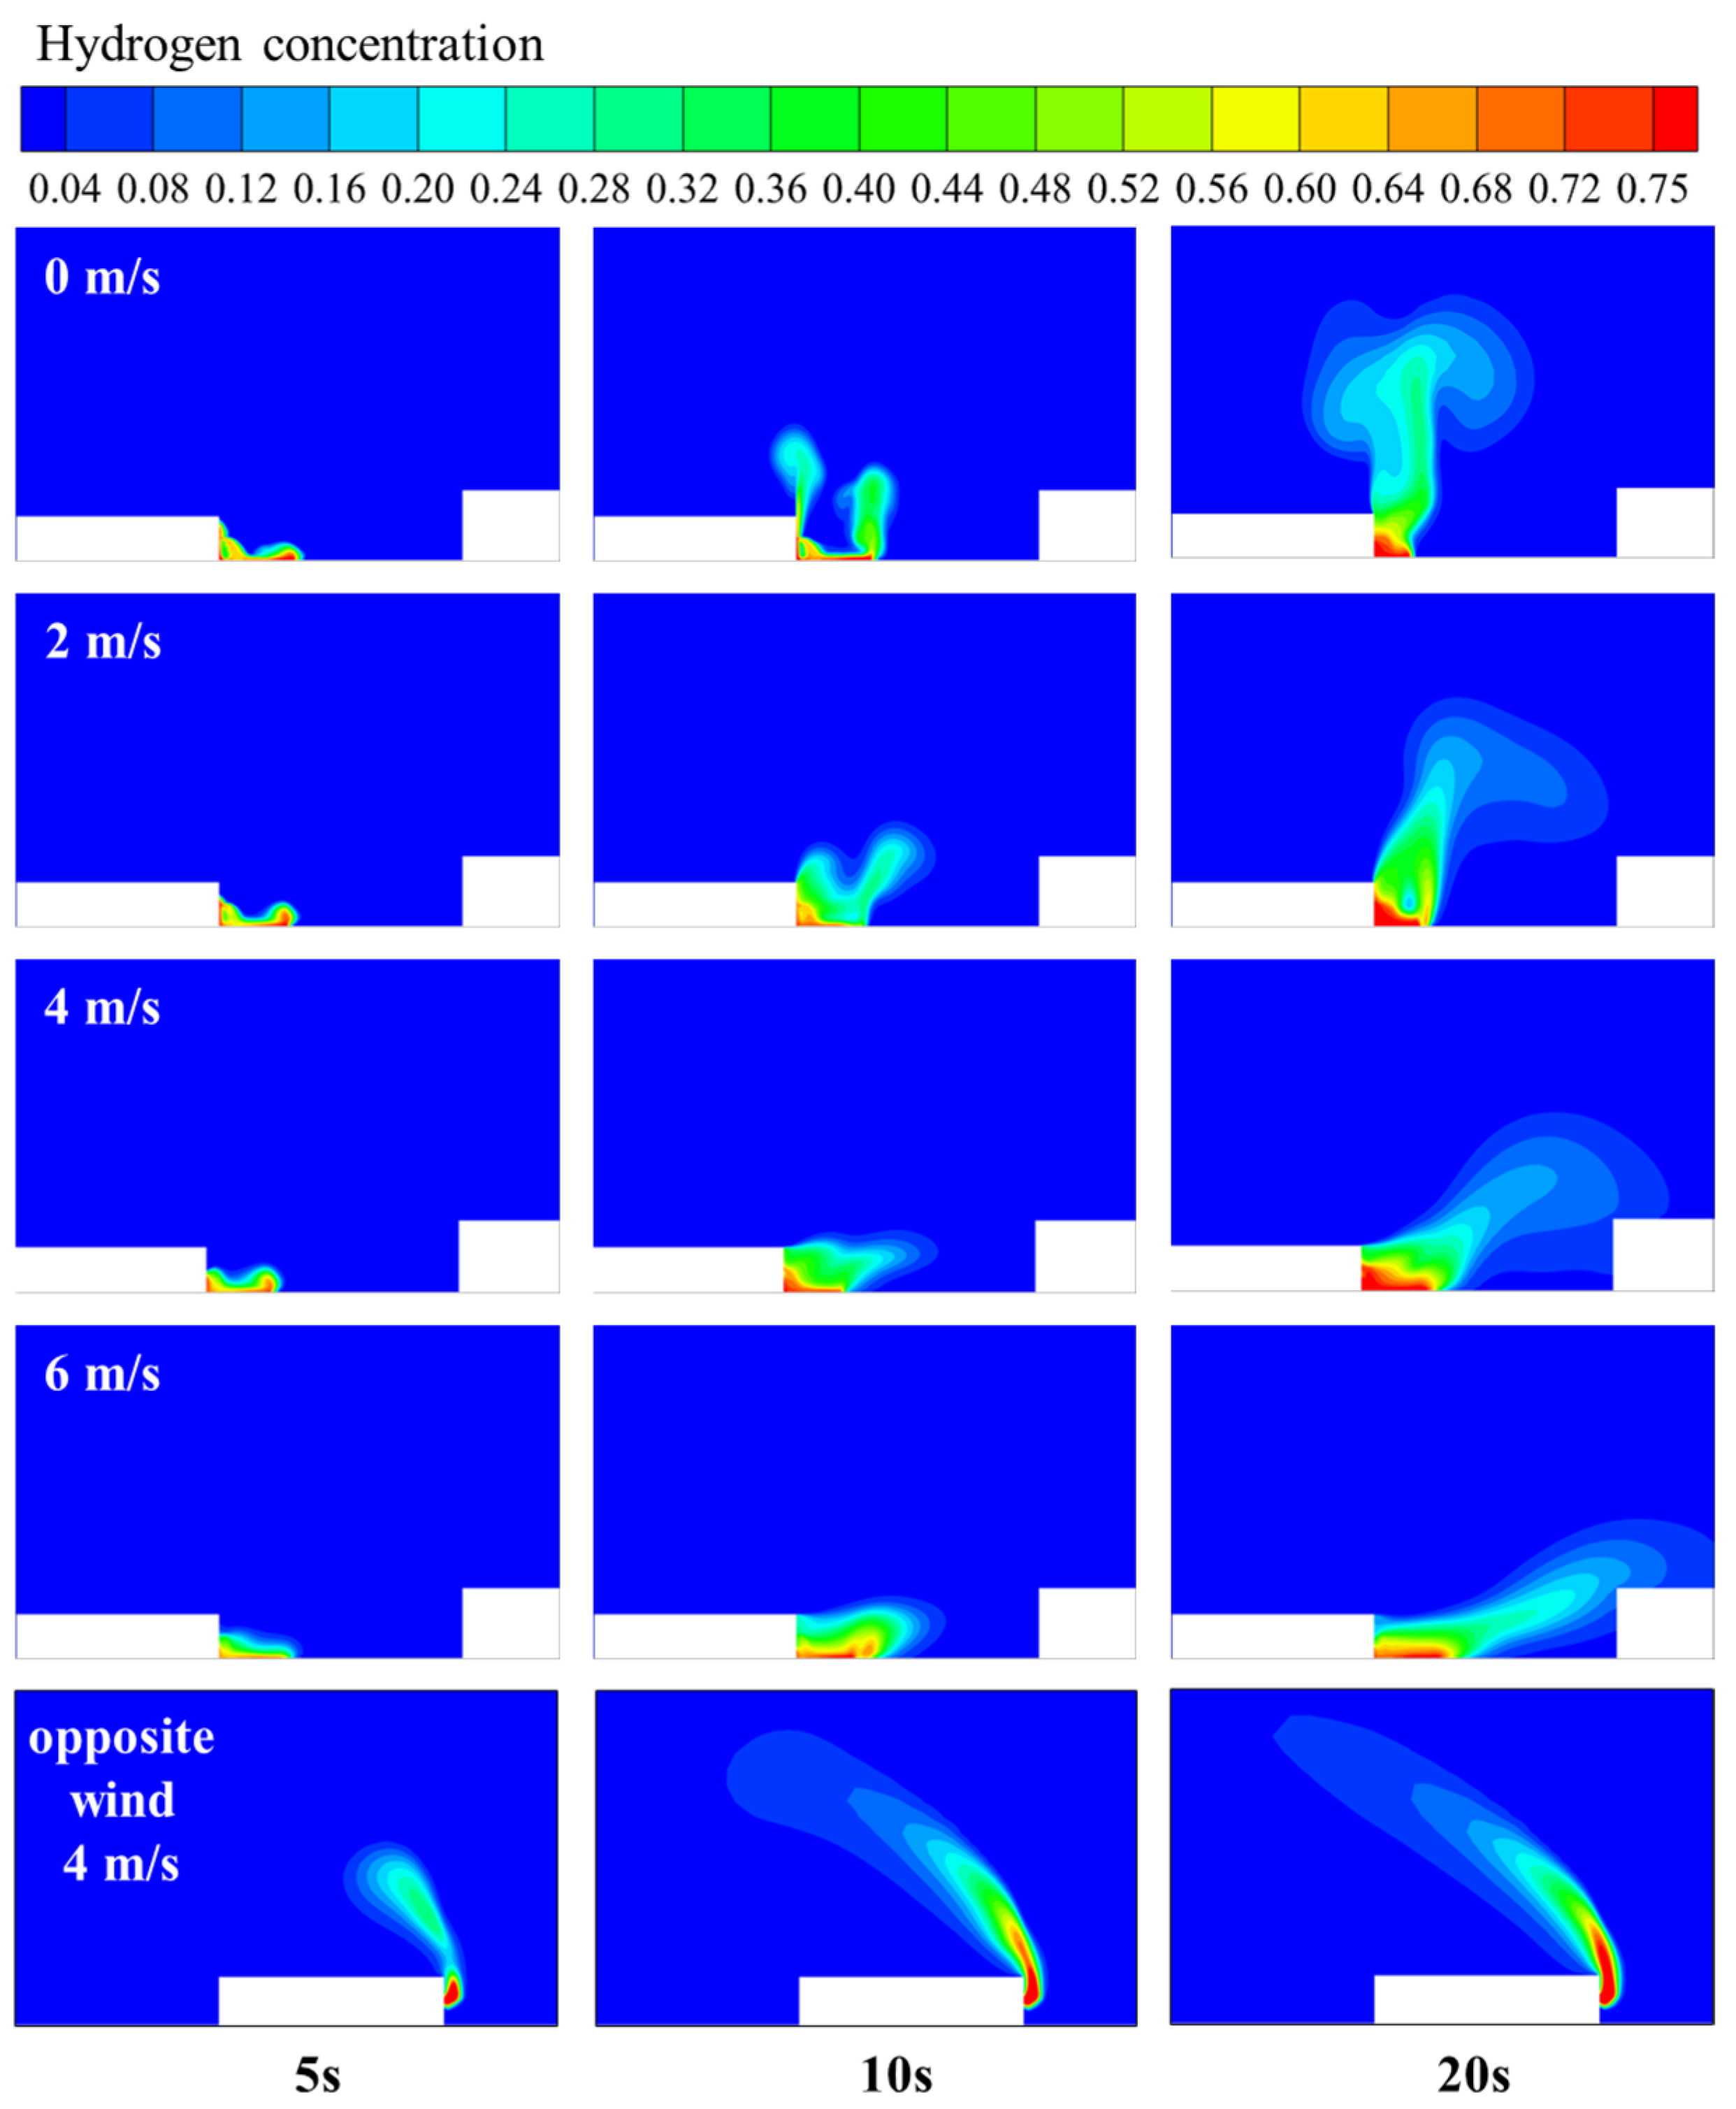
3.3. Influence of Wind Direction and Speed on Hydrogen Leakage and Diffusion Behavior

In this section, the leakage and diffusion behavior are investigated for the ambient wind speeds of 4 m/s upwind and 2 m/s, 4 m/s, and 6 m/s downwind, and compared with the situation in the windless condition. Figure 10 shows the variation in flammable hydrogen concentration with time in the cross-section where the center of the leakage port is located under different wind speed conditions.
As shown in Figure 11, the volume of the flammable hydrogen cloud decreases dramatically with the increase in wind speed, then remains stable, and finally decreases dramatically again. The volume of the flammable hydrogen cloud was 5734.31 m3 when the liquid hydrogen was leaked for 20 s under windless conditions, and the volume decreased to 4658.02 m3 when the ambient wind speed increased to 6 m/s. The horizontal diffusion distance of the flammable hydrogen cloud when there was no wind was 15.24 m. When the wind speed was increased to 6 m/s, the flammable hydrogen cloud basically covered the downwind building, and its horizontal diffusion distance reached 40.08 m, which was 2.63 times that under windless conditions. The diffusion height of the flammable hydrogen cloud under the windless condition is 29.17 m, while the diffusion height is only 16.4 m when the wind speed is 6 m/s.
It can be seen that the diffusion height and horizontal diffusion distance of the flammable hydrogen cloud produced by liquid hydrogen evaporation are affected to some extent when ambient wind exists. On the one hand, the ambient wind will limit the height of the hydrogen cloud, and the higher the wind speed, the less likely the flammable hydrogen cloud will diffuse to high altitudes. On the other hand, as the wind speed increases, the hydrogen cloud spreads farther downwind. The direction of hydrogen diffusion changes directly when the wind direction is opposite to the direction of the leak.

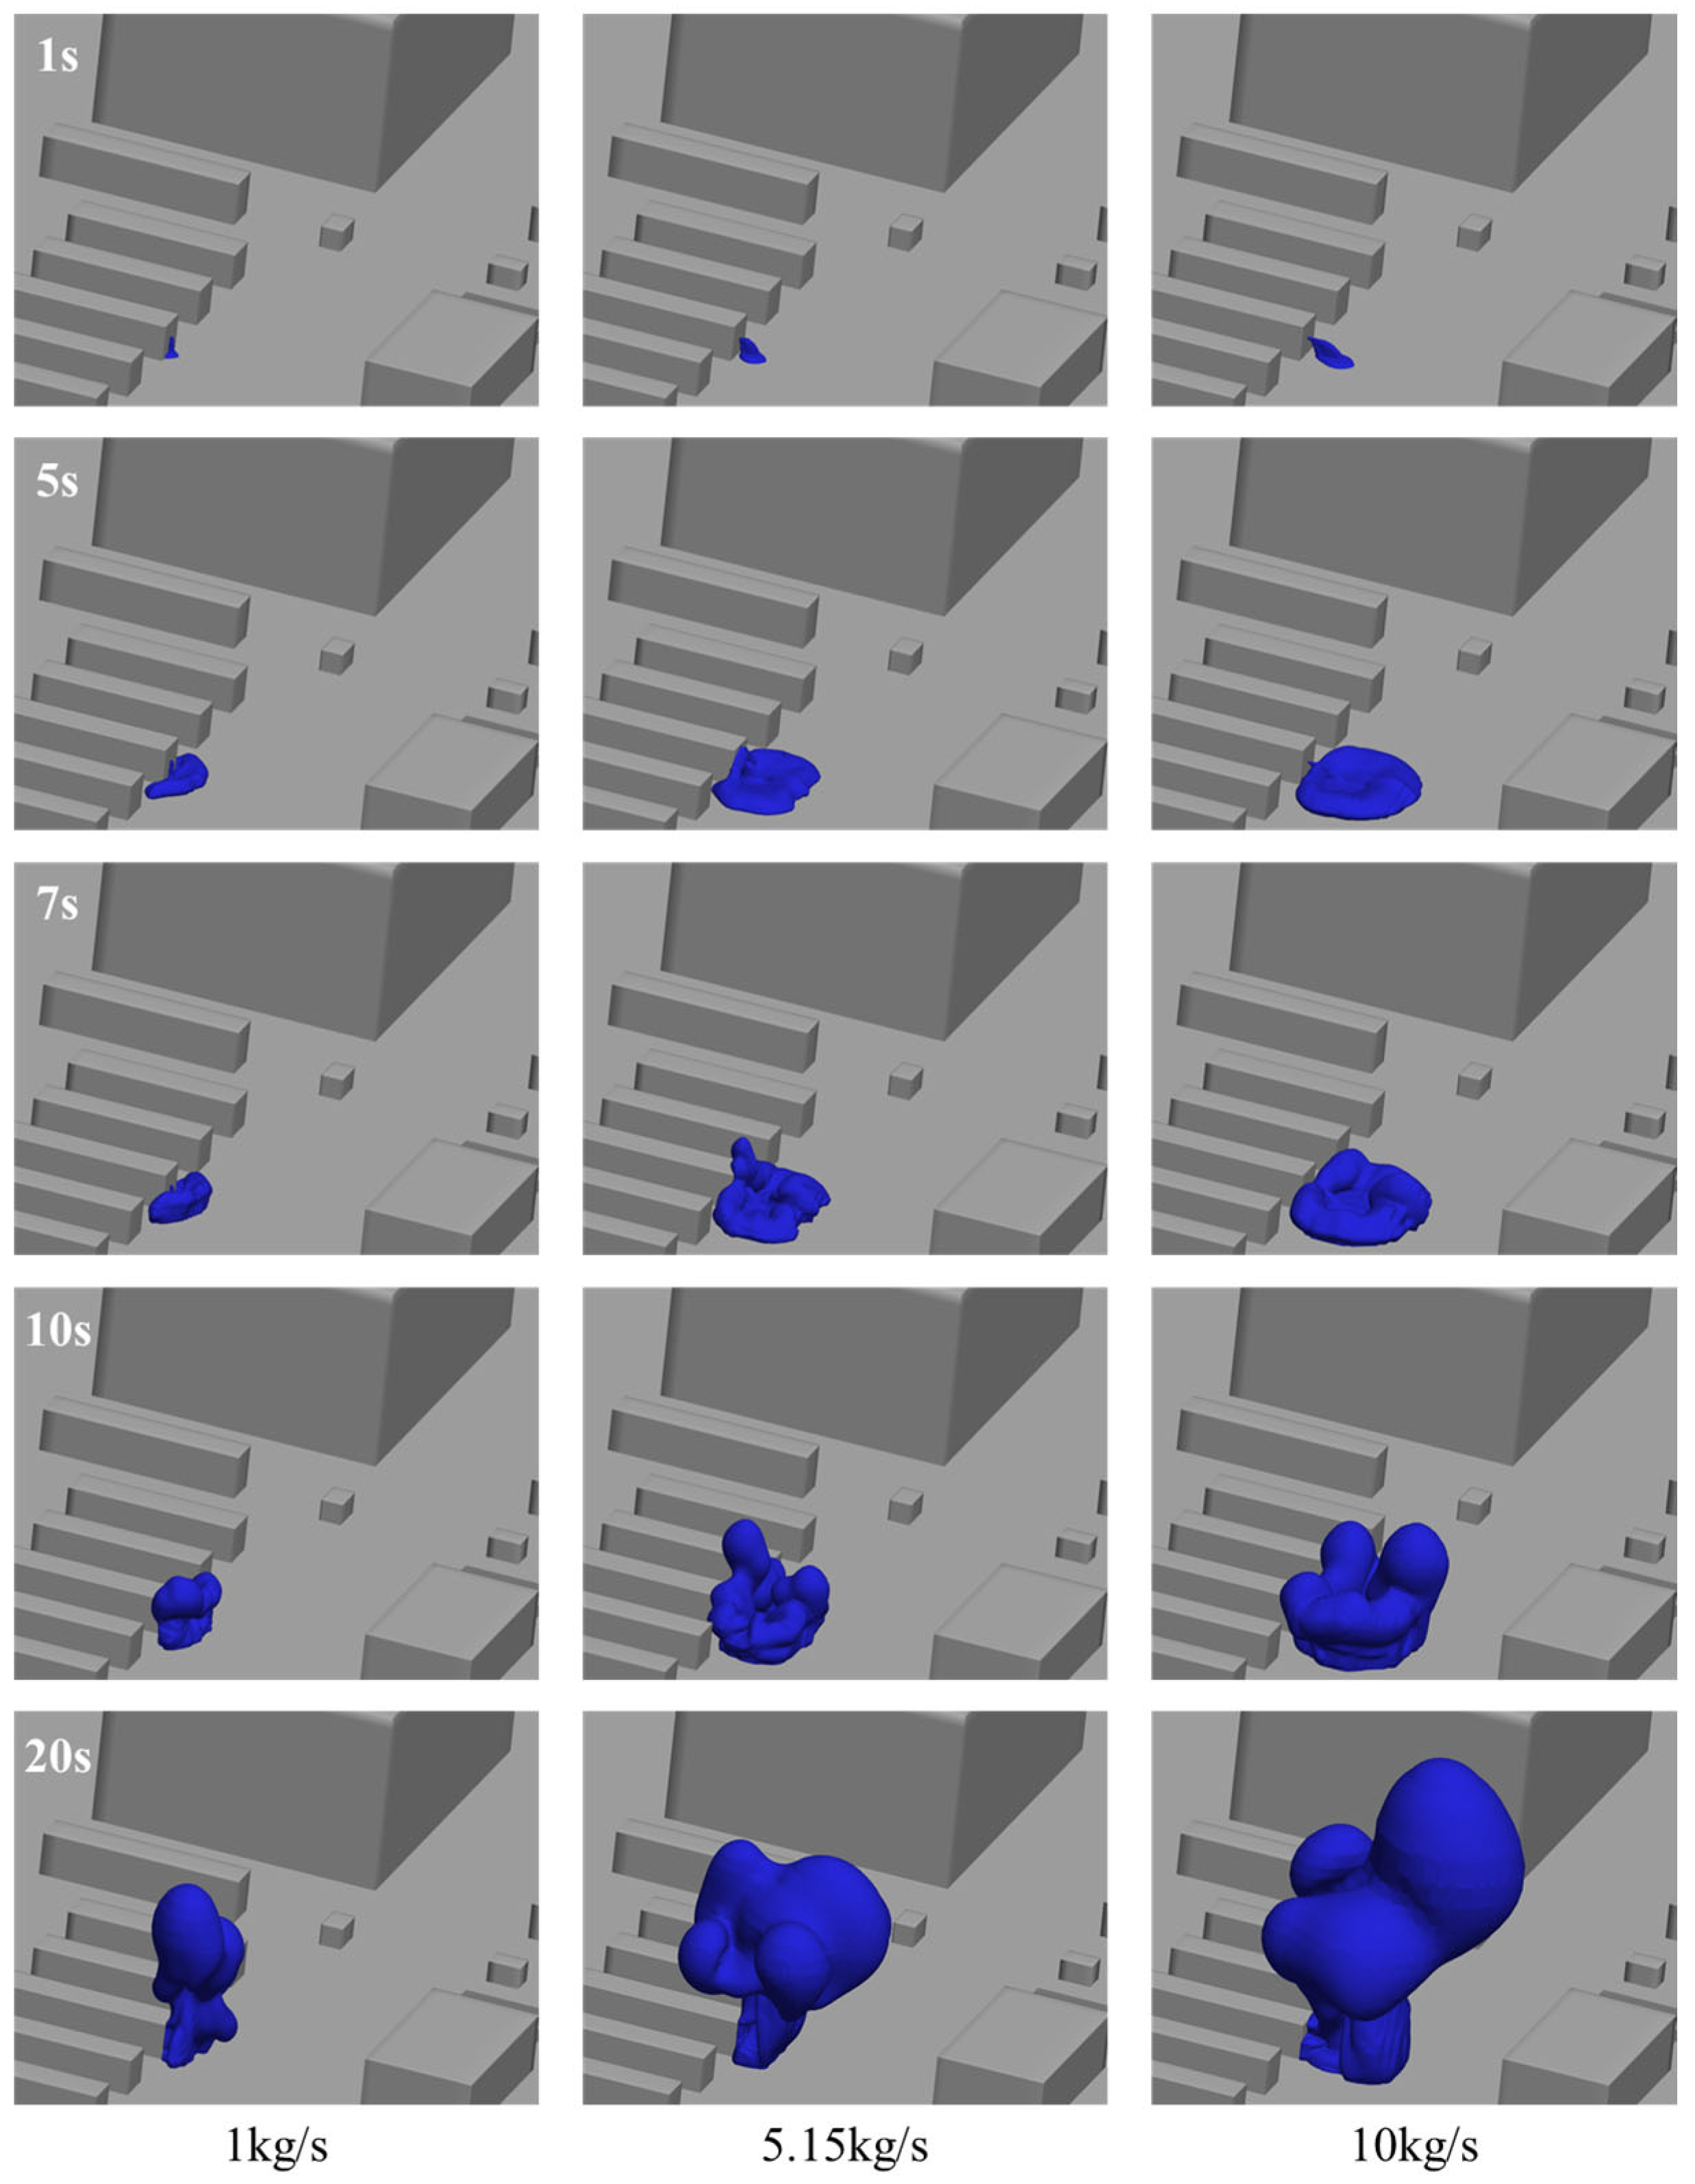
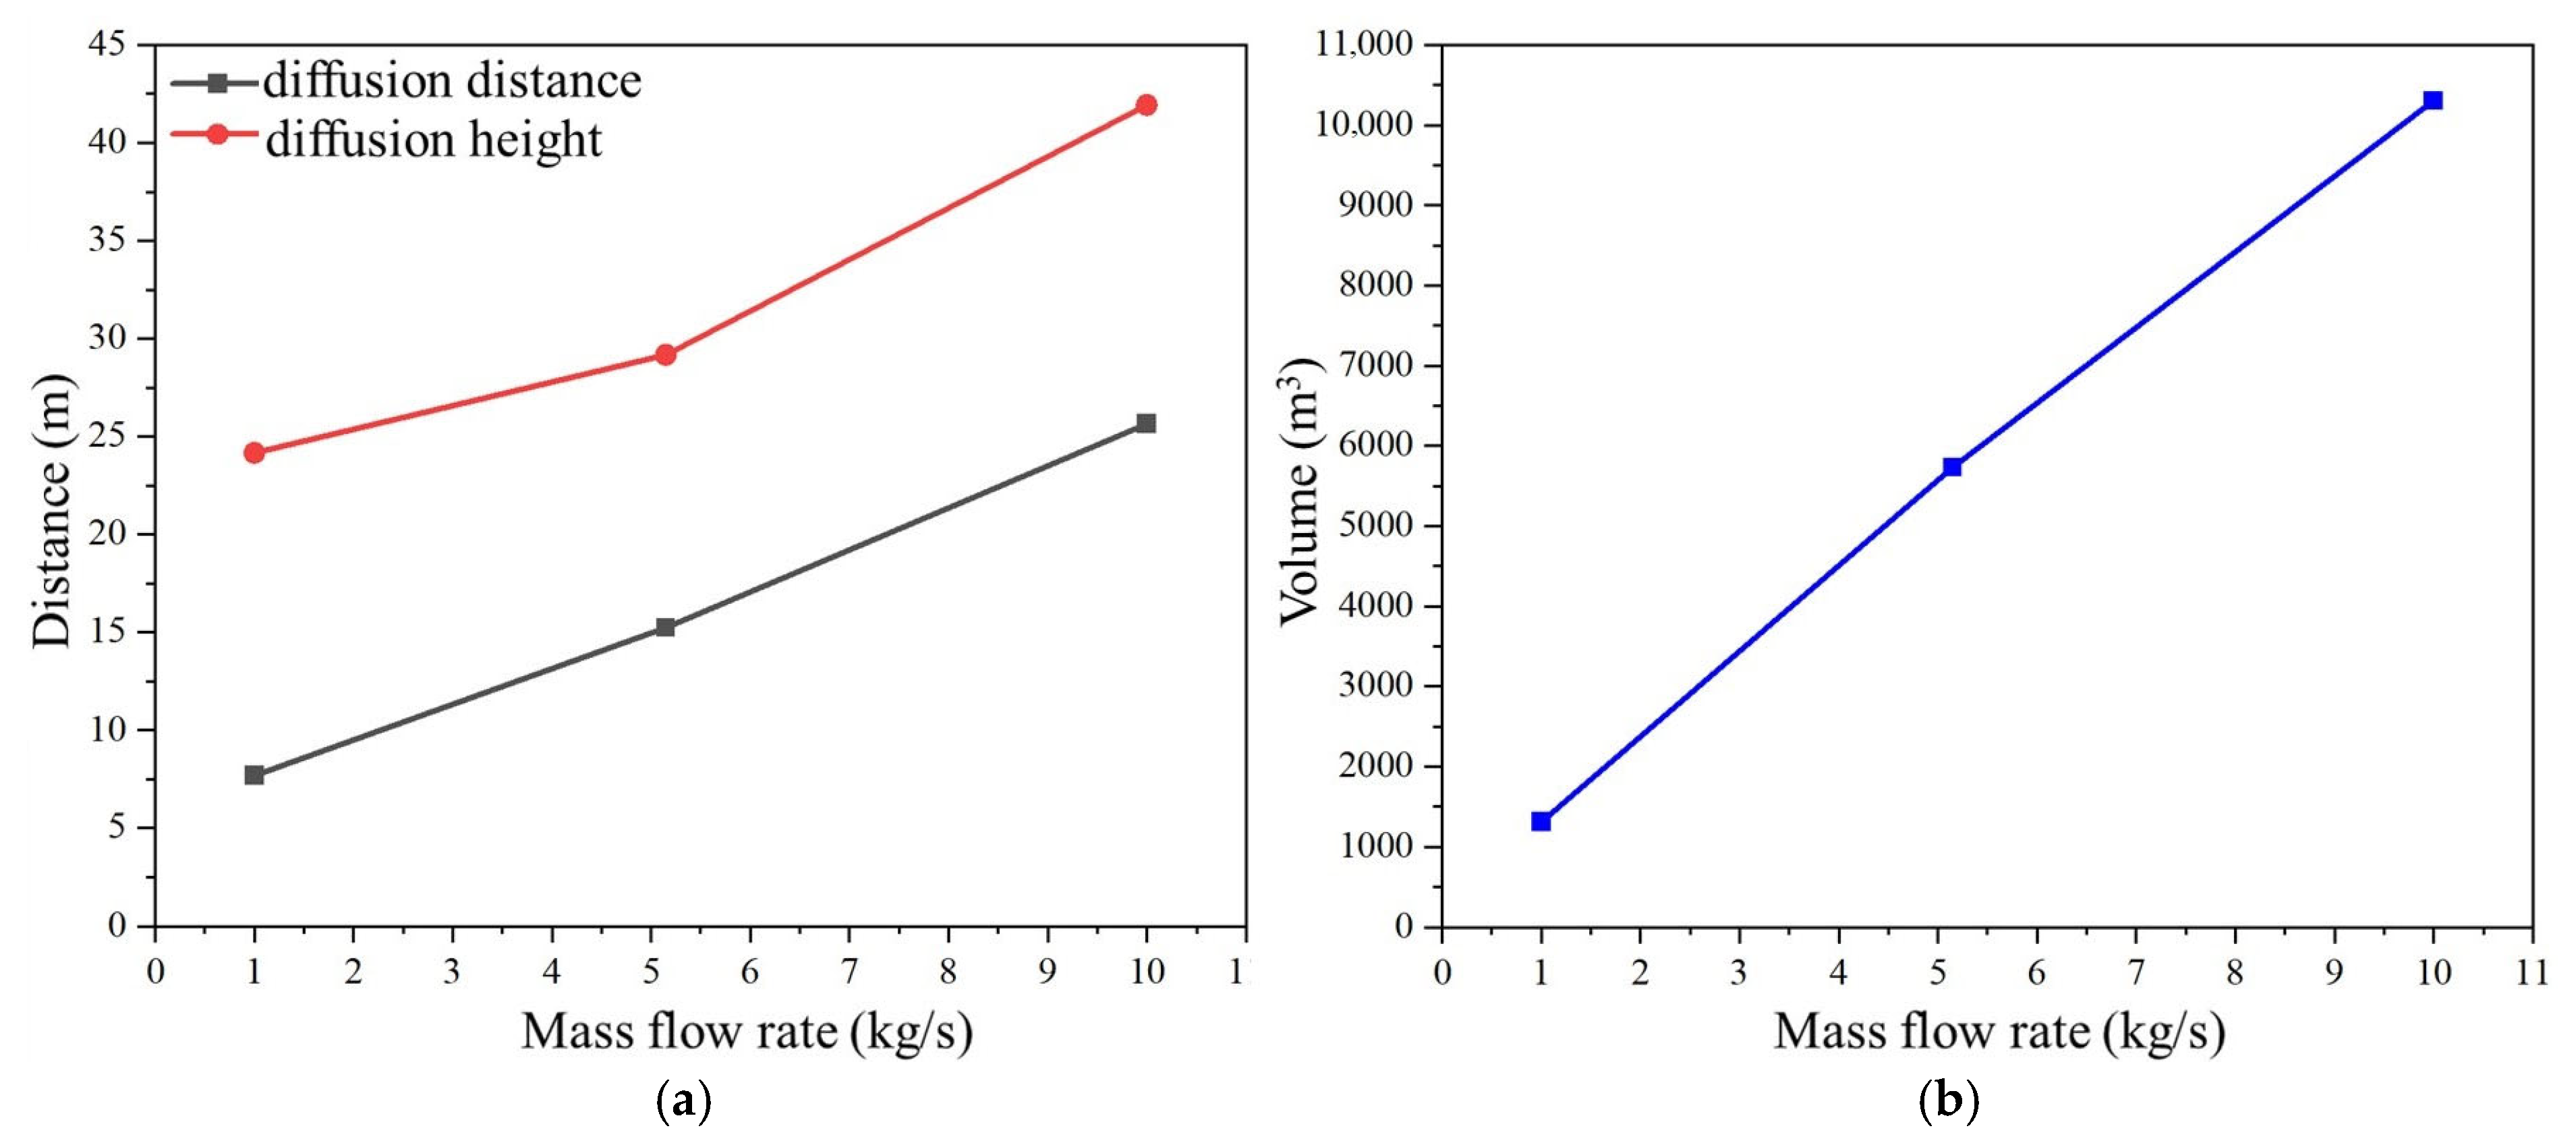
3.4. Influence of Leakage Mass Flow Rate on Hydrogen Leakage and Diffusion Behavior

In this section, the leakage mass flow rates of 1 kg/s, 5.15 kg/s, and 10 kg/s were selected to compare hazard ranges. As shown in Figure 12, when the leakage mass flow rate is 1 kg/s, the spray distance of liquid hydrogen is short, and less liquid hydrogen can flow to the ground. When the leakage mass flow rate is 5.15 kg/s and 10 kg/s, the leaked liquid hydrogen has an obvious parabolic shape. The larger the leakage mass flow rate is, the larger the opening of the parabola is, and the farther the liquid hydrogen is ejected. Figure 13 shows the morphology of the flammable hydrogen cloud as a function of time for different leakage mass flow rates.
Figure 14 compares the horizontal diffusion distance, diffusion height, and volume of the flammable hydrogen cloud for 20 s of liquid hydrogen leakage at different mass flow rates. The horizontal diffusion distance, diffusion height, and volume of the flammable hydrogen cloud increase with the increase in mass flow rate because the increase in mass flow rate leads to the increase in the mass of the liquid hydrogen leaked into the environment, which increases hydrogen produced by the evaporation of the liquid hydrogen. The horizontal diffusion distance, diffusion height, and volume of the flammable hydrogen cloud were 7.69 m, 24.17 m, and 1311.82 m3, respectively, when the mass flow rate was 1 kg/s. When the leakage mass flow rate increased to 10 kg/s, the horizontal diffusion distance, diffusion height, and volume of the flammable hydrogen cloud increased to 25.65 m, 41.93 m, and 10,305.5 m3, respectively. The shape of the flammable hydrogen cloud is not regular, so the diffusion distance and diffusion height do not increase proportionally as the volume of the flammable hydrogen cloud increases.

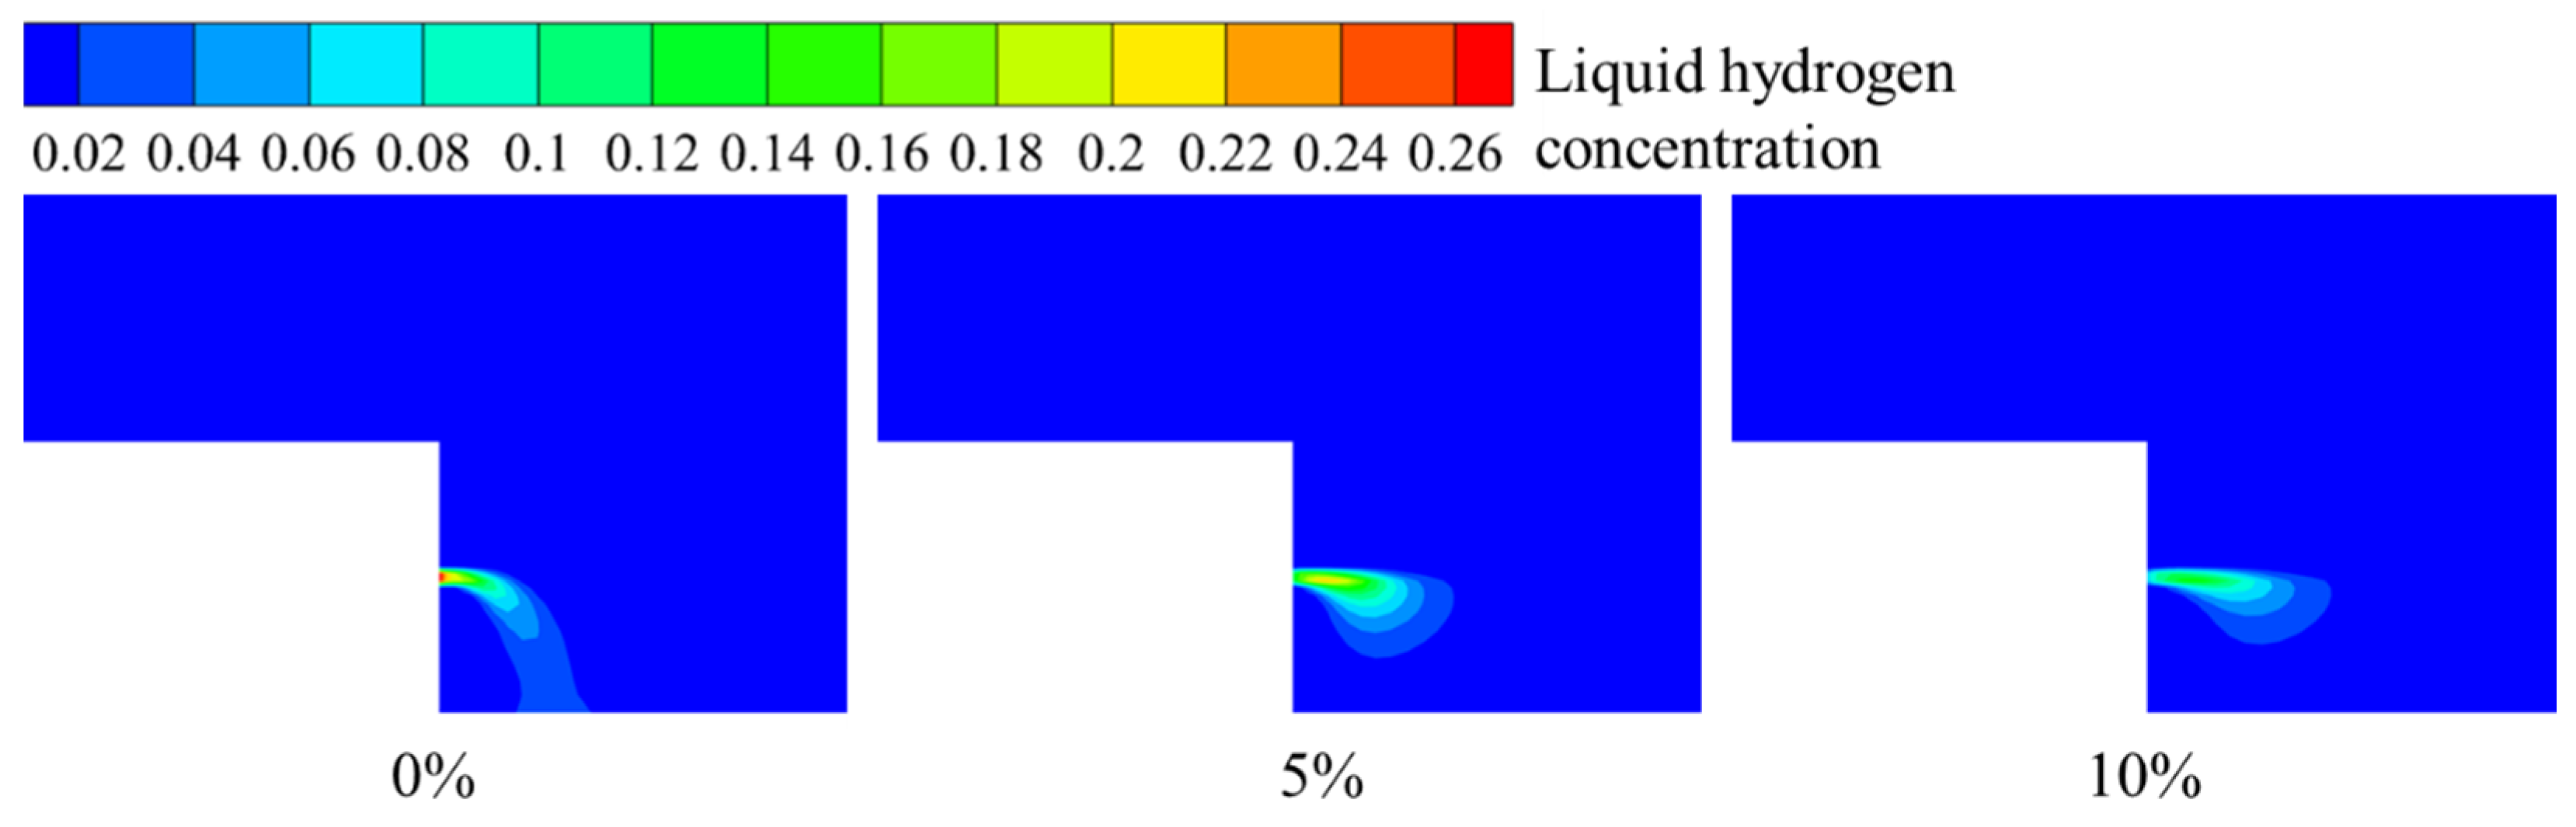
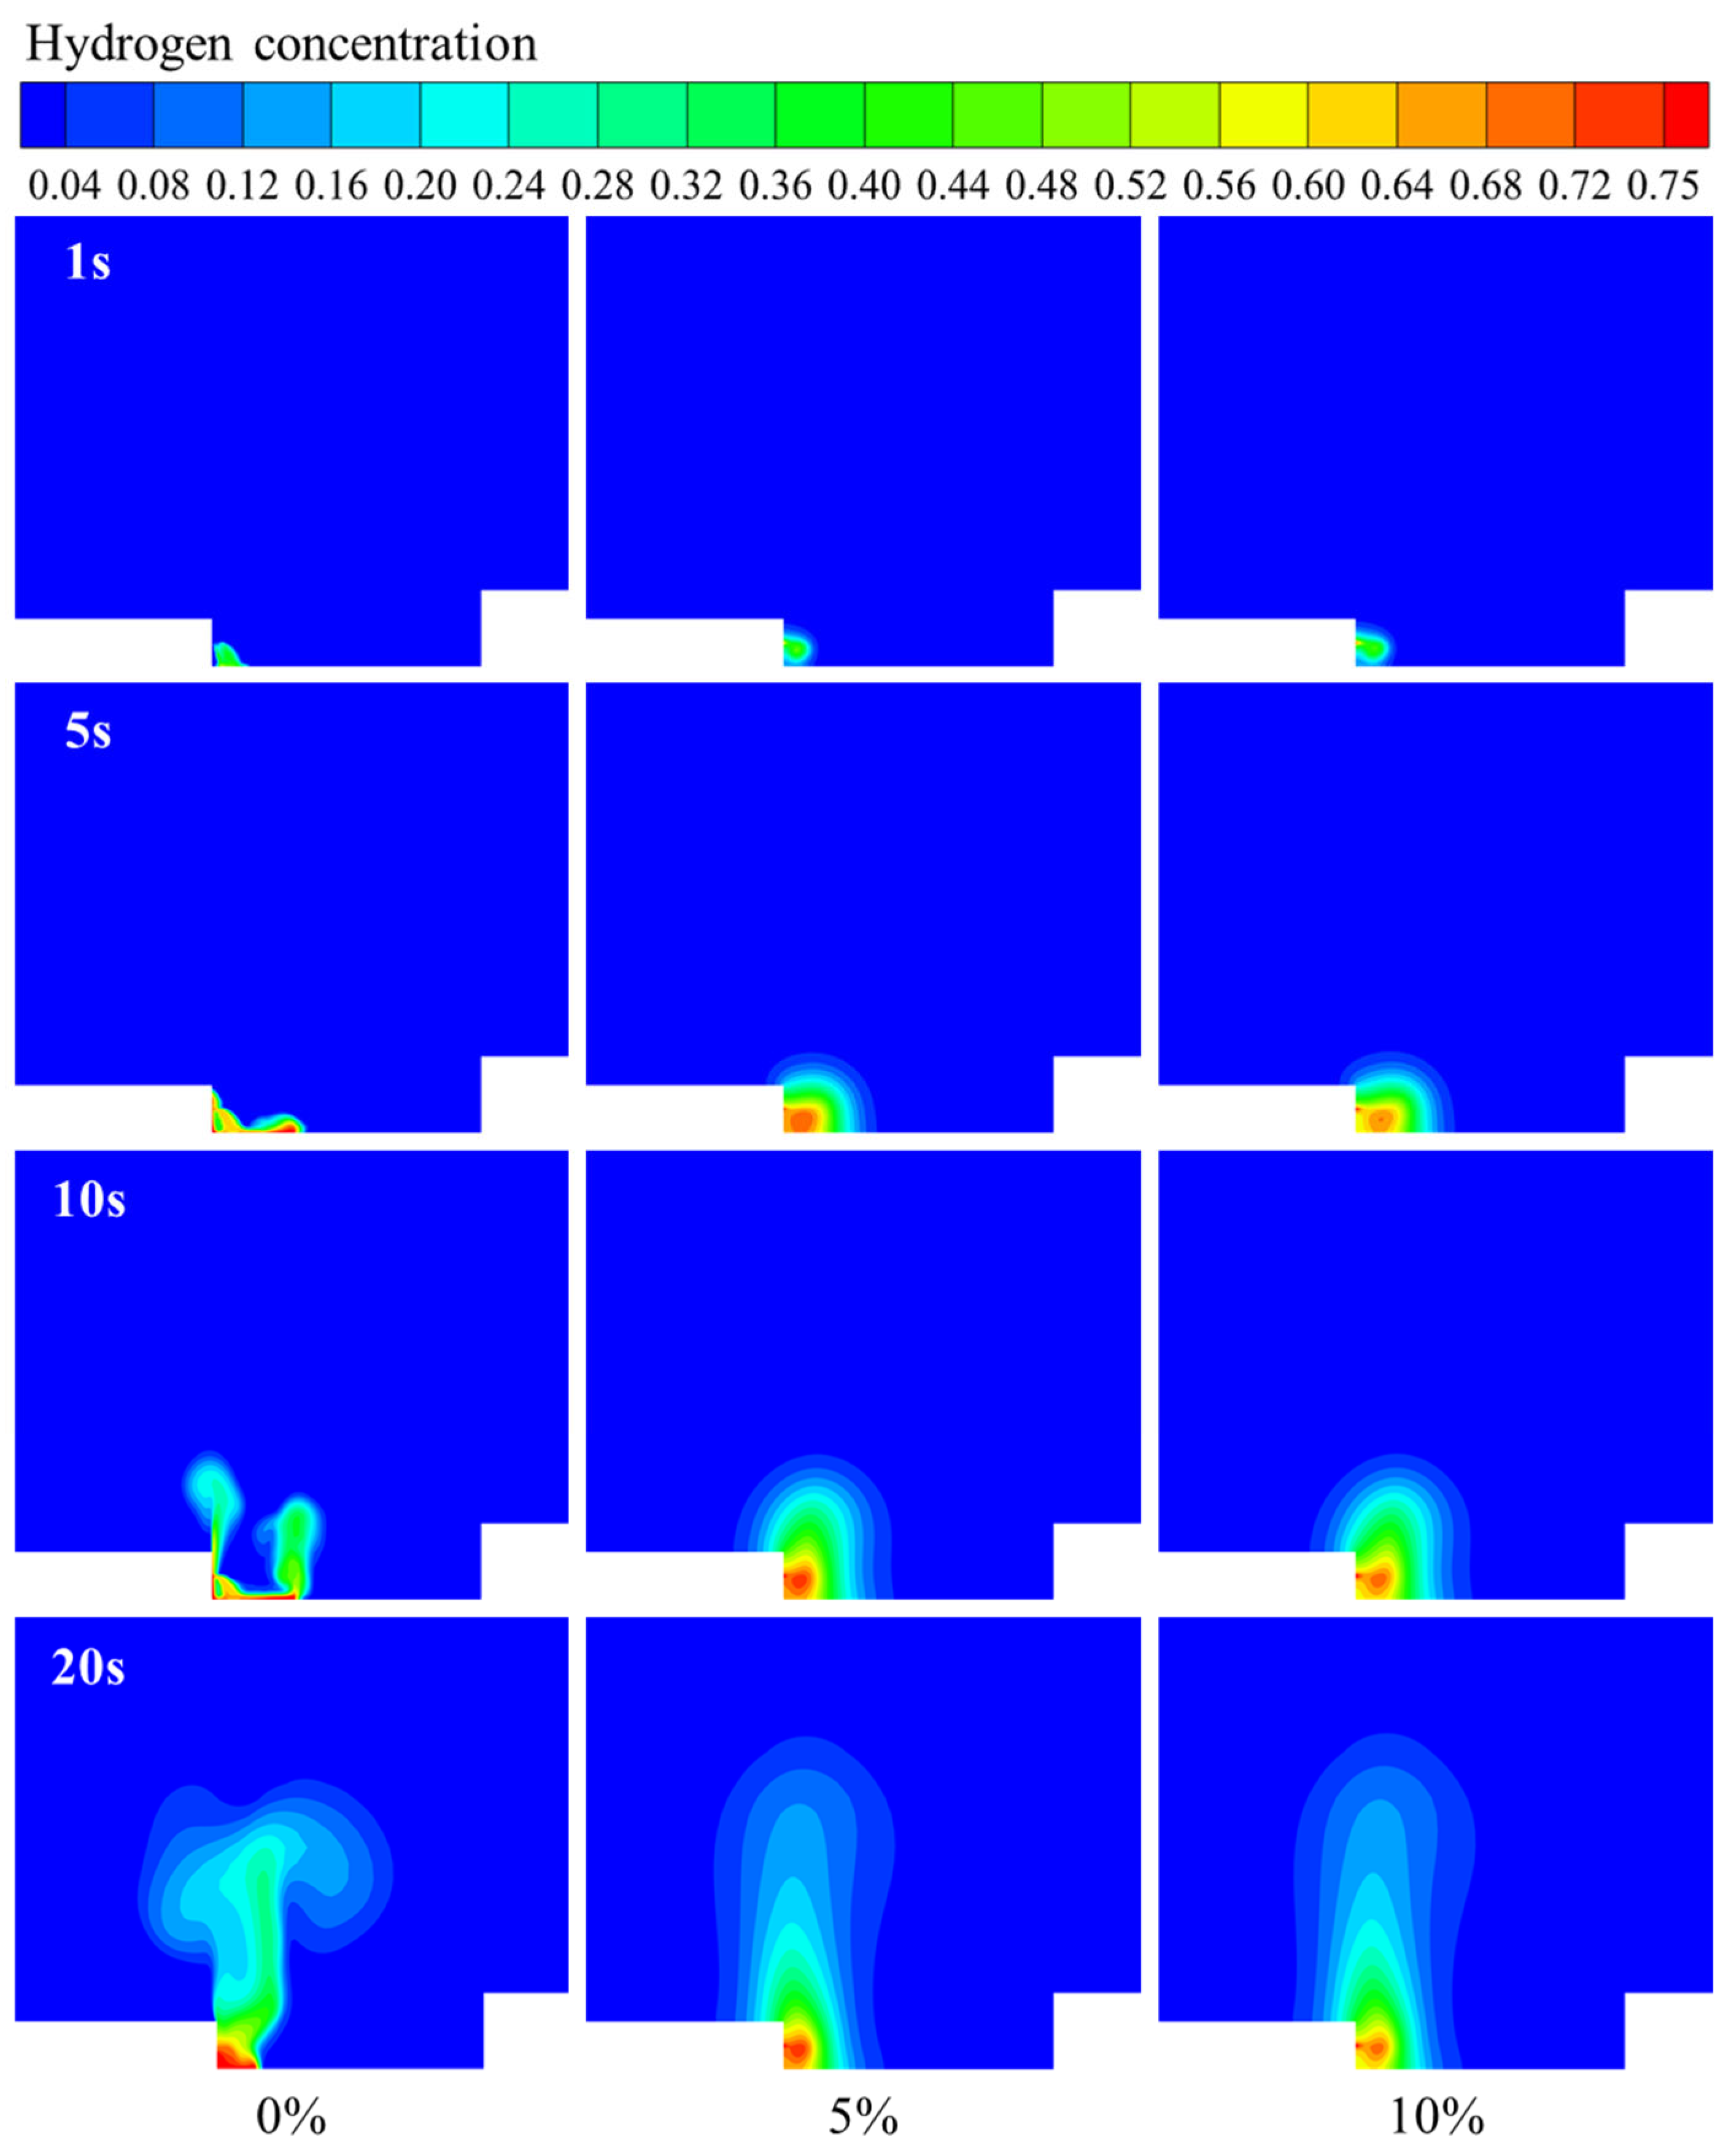
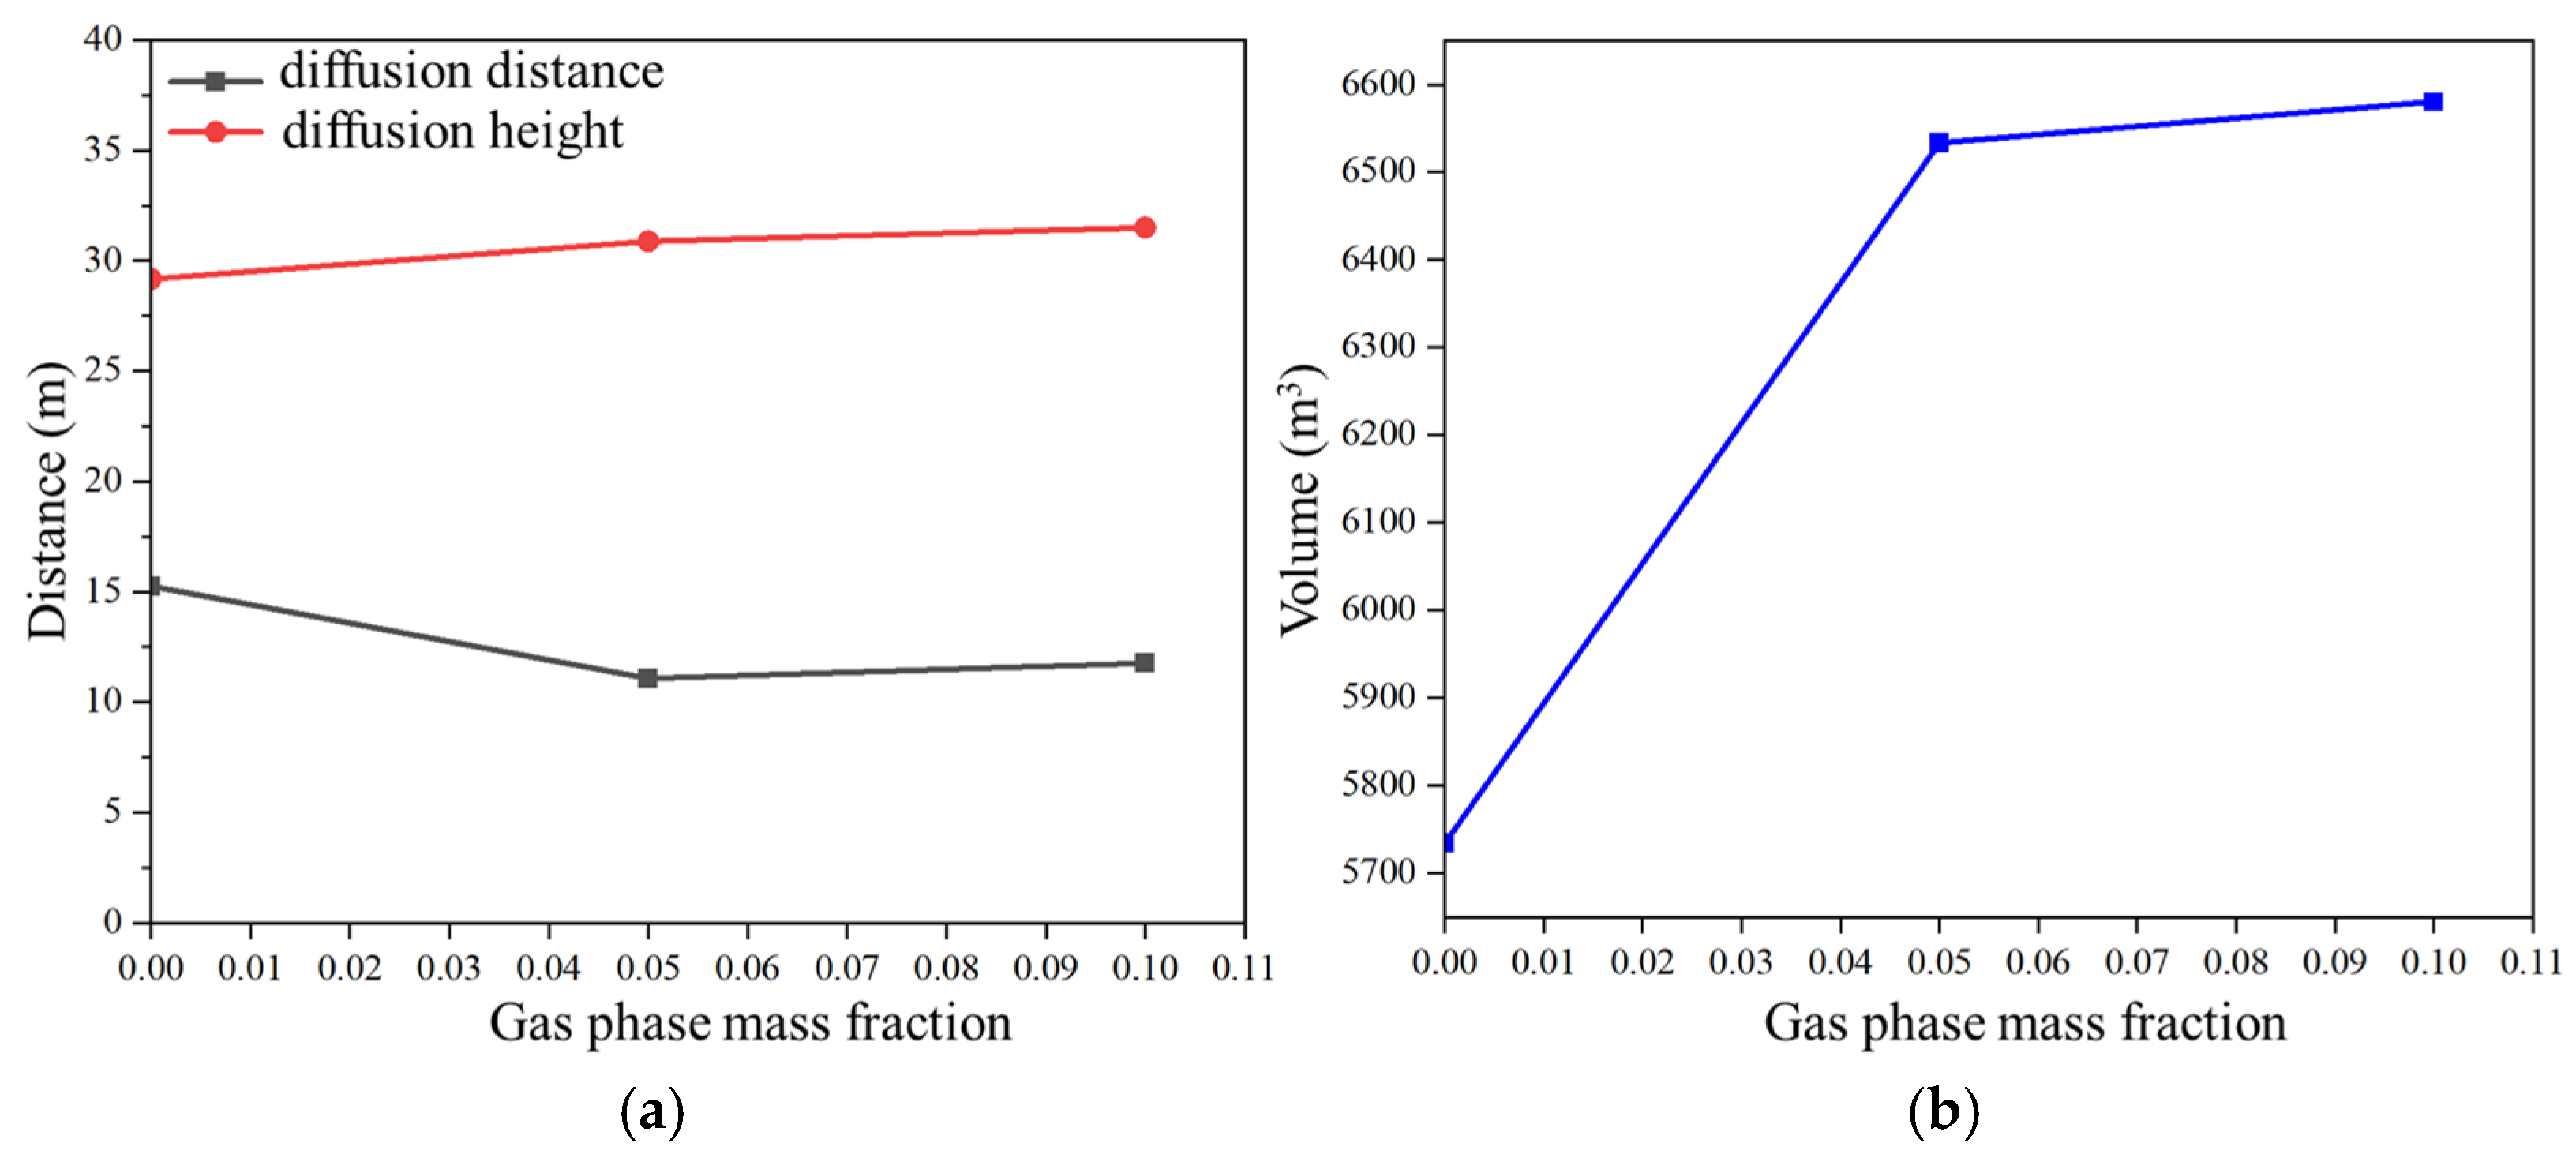
3.5. Influence of Leakage Gas Phase Mass Fraction on Hydrogen Leakage and Diffusion Behavior

During the leakage of liquid hydrogen from the storage tank, flash vaporization occurs due to pressure drop on one hand, and evaporation occurs due to heat absorption on the other hand, both of which produce gaseous hydrogen. So, what actually comes out of the leakage port is a mixture of liquid hydrogen and gaseous hydrogen. Considering that the leakage amount and the leakage port are large and the leakage channel is short, the amount of liquid hydrogen flash vaporization and evaporation before leaking out is very small, and we investigated the behavior of liquid hydrogen leakage and diffusion when the leakage gas phase mass fraction is 5% and 10%.
Figure 15 shows that when there is no flash vaporization and evaporation before the leakage, the leaked liquid hydrogen flows to the ground in a parabolic shape, while when the leakage gas phase mass fraction reaches 10%, the concentration of the liquid hydrogen undergoes a significant decrease. Overall, the leakage gas phase mass fraction has a greater influence on the shape and concentration of the liquid hydrogen leakage. The higher the gas phase mass fraction, the lower the concentration of the liquid hydrogen, and the more obvious the effect of the liquid hydrogen flow being lifted.
As shown in Figure 16, the leakage gas phase mass fraction also has a large effect on the flammable hydrogen cloud. When the gas phase mass fraction is 0, due to the large amount of liquid hydrogen flowing to the ground to form a liquid hydrogen pool, its evaporation is more random, and the flammable hydrogen cloud generated by it is irregular in shape. With the increase in the gas phase mass fraction, the liquid hydrogen content decreases, the liquid hydrogen pool formed has a smaller area, and the flammable hydrogen cloud produced by its evaporation has a regular cylindrical shape.
The diffusion distance and volume of the flammable hydrogen cloud at different leakage gas phase mass fractions are shown in Figure 17. When the gas phase mass fraction increases, the diffusion height of the flammable hydrogen cloud slightly increases, while the horizontal diffusion distance tends to decrease. In addition, the volume of the flammable hydrogen cloud increased with the gas phase mass fraction, reaching 6533.29 m3 and 6580.41 m3 at the gas phase mass fractions of 5% and 10%, respectively.

3.6. Influence of Barrier Walls on Hydrogen Leakage and Diffusion Behavior

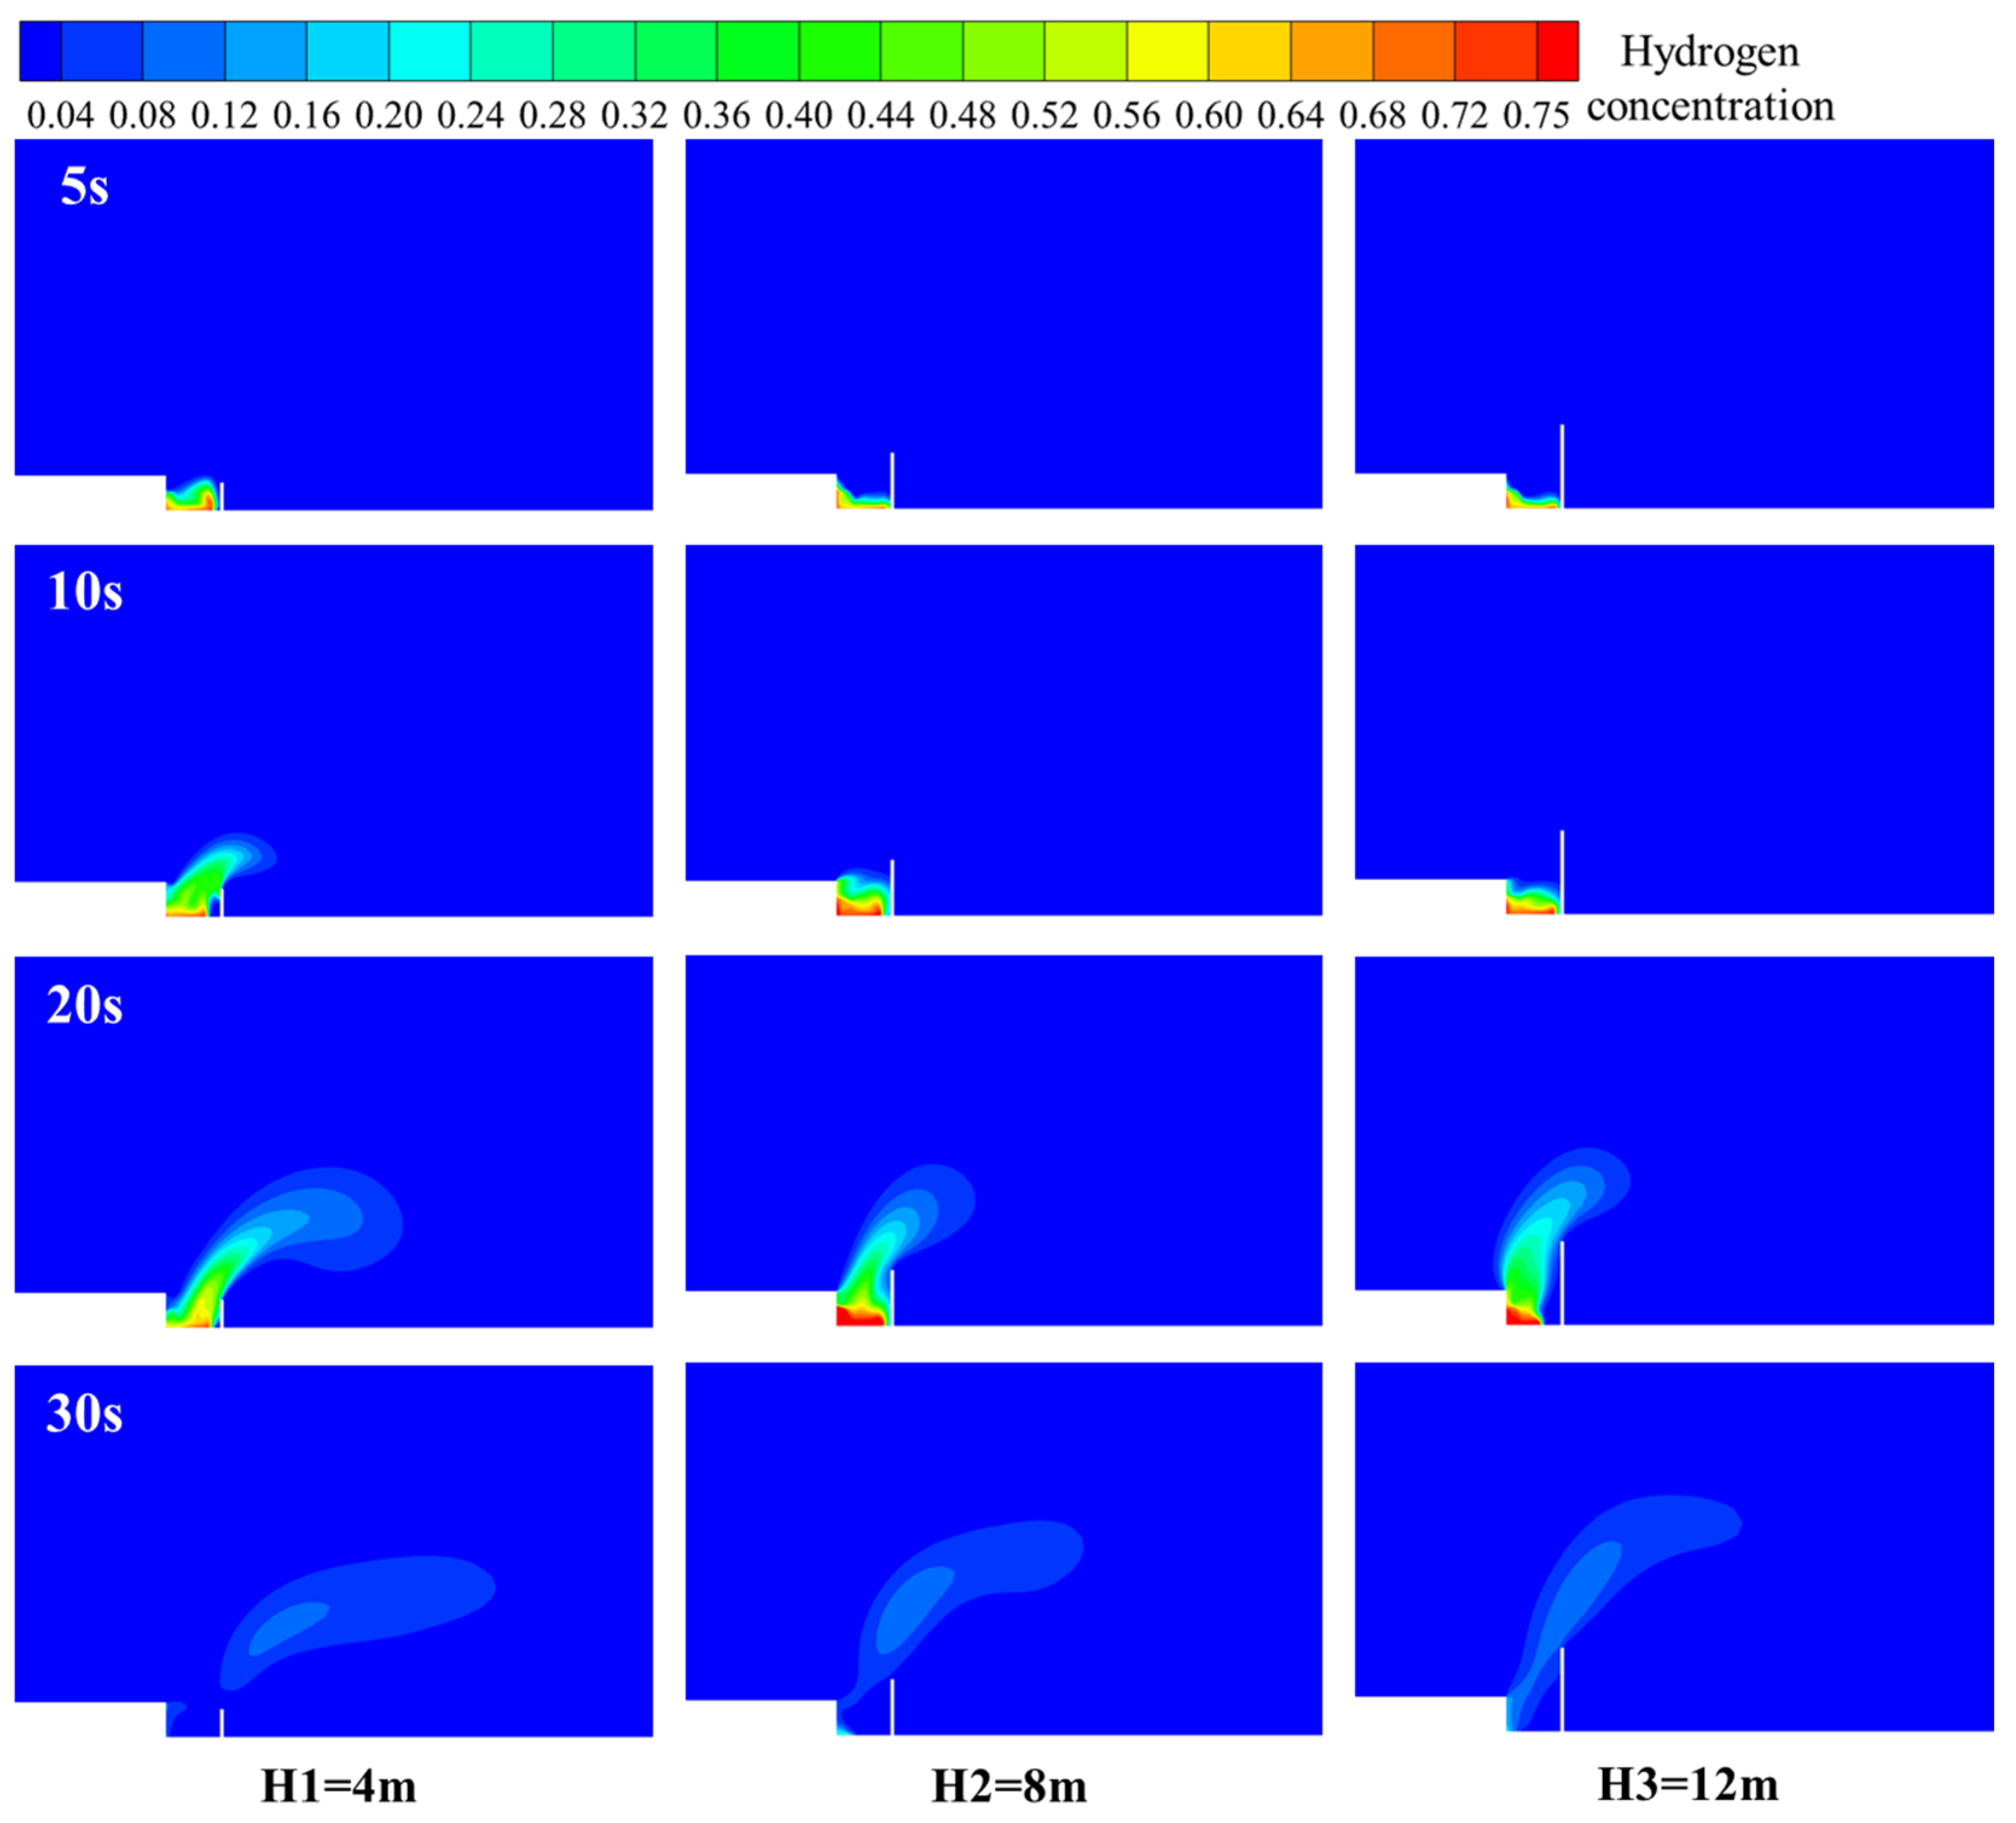
3.6.1. Barrier Wall Distance

The diffusion behavior of liquid hydrogen leaks can be influenced by placing barrier walls near possible leak points. In this section, barrier walls were set up at three locations, 4 m, 8 m, and 12 m, in front of the leakage point, and their effects on the diffusion behavior of the flammable hydrogen cloud were analyzed. The height of the barrier wall was 8 m, and the thickness was 0.5 m. Its location is shown in Figure 18. The leakage mass flow rate was 5.15 kg/s, the leakage time was 20 s, the wind speed was 4 m/s, and the wind direction was the same as the leakage direction.
Figure 19 compares the variation in hydrogen concentration distribution for different barrier wall locations. As can be seen from the figure, the setting of the barrier wall has a greater influence on the diffusion behavior of the flammable hydrogen cloud. On the one hand, the barrier wall can effectively increase the diffusion height of the hydrogen cloud. On the other hand, the barrier wall can effectively inhibit the horizontal diffusion of the hydrogen cloud, and the closer the barrier wall is to the leakage port, the stronger the inhibition of the horizontal diffusion of the hydrogen cloud. Figure 20 shows the maximum volume of the flammable hydrogen cloud is strongly influenced by the distance of the barrier wall. When there is no barrier wall, the maximum volume of the flammable hydrogen cloud is 7335.02 m3. The maximum volume of the flammable hydrogen cloud is 5584.69 m3, 5379.69 m3, and 5393.41 m3 when the barrier wall distance is 4 m, 8 m, and 12 m, respectively, which shows that the barrier wall distance of 8 m is relatively better.

3.6.2. Barrier Wall Height

Adjusting the height of the barrier wall can also affect the diffusion behavior of the liquid hydrogen leakage. In this section, on the basis of the barrier wall at the 8 m position, barrier walls with the heights of 4 m, 8 m, and 12 m were set up, and their effects on the diffusion behavior of the flammable hydrogen clouds were analyzed.
Figure 21 compares the variation in hydrogen concentration distribution for different barrier wall heights. As can be seen from the figure, the height of the barrier wall has a large influence on the diffusion behavior of the flammable hydrogen cloud. As the height of the barrier wall increases, the horizontal diffusion distance of the flammable hydrogen cloud decreases while the diffusion height increases. At the same time, the height of the barrier wall also directly affects the volume of the flammable hydrogen cloud. It can be seen from Figure 22 that the effect is relatively better when the height of the barrier wall is 8 m. The maximum volume of the flammable hydrogen cloud is 6122.72 m3, 5379.69 m3, and 5478.59 m3 when the height of the barrier wall is 4 m, 8 m, and 12 m, respectively. A barrier wall of appropriate height at an appropriate distance can effectively inhibit the horizontal diffusion of the flammable hydrogen cloud, increase its diffusion height, and significantly reduce the volume of the flammable hydrogen cloud, thereby improving the safety of the hydrogen production station.

4. Conclusions

In this study, the liquid hydrogen leakage accident in the hydrogen storage area of a proposed hydrogen production station located in Weihai, China, was simulated. A CFD model of the liquid hydrogen leakage and diffusion in the station was established, and the diffusion behavior of the liquid hydrogen in the hydrogen storage area was investigated. The environmental factors and barrier wall parameters affecting the liquid hydrogen leakage and diffusion behavior were considered, and the effects of the different environmental factors and barrier wall parameters on the liquid hydrogen leakage and diffusion at the hydrogen production station were investigated.
Comparison with the leakage behavior under initial conditions reveals that the liquid hydrogen leakage behavior in the hydrogen storage area is strongly influenced by wind, leakage mass flow rate, and gas phase mass fraction. An increase in wind speed increases the diffusion of the flammable hydrogen cloud in the wind direction. The leakage mass flow rate has a great influence on both the morphology of the liquid hydrogen flow and the volume of the flammable hydrogen cloud formed by its evaporation, which increases significantly when the leakage mass flow rate increases. The surface shape of the flammable hydrogen cloud is more regular and larger when the leakage gas phase mass fraction increases.
The diffusion of the flammable hydrogen cloud along the horizontal direction is weakened and its height is enhanced after a barrier wall was placed in front of the leak direction. The distance of the barrier wall from the leakage port and the height of the barrier wall have a greater effect on the horizontal diffusion distance, diffusion height, and maximum volume of the flammable hydrogen cloud. The installation of a suitable height barrier wall at a suitable distance can effectively inhibit the horizontal diffusion of the flammable hydrogen cloud, increase its diffusion height, and significantly reduce the volume of the flammable hydrogen cloud, thus improving the safety of the hydrogen production station. This paper focuses on the liquid hydrogen leakage and diffusion behavior at one leak location, and multiple leak locations will be considered in future studies.

Author Contributions

Conceptualization, T.Y. and J.X.; methodology, X.F. and G.L.; software, G.L. and Z.X.; validation, Z.X. and H.L.; formal analysis, J.W.; investigation, J.W.; resources, X.F.; data curation, H.L.; writing—original draft preparation, X.F. and G.L.; writing—review and editing, T.Y. and J.X.; visualization, N.X.; supervision, T.Y. and N.X.; project administration, S.C. and C.S.; funding acquisition, S.C. and C.S. All authors have read and agreed to the published version of the manuscript.

Funding

This research was funded by the Shandong Electric Power Engineering Consulting Institute Co., Ltd., “Study on hydrogen dispersion, fire thermal radiation, and overall layout optimization for new skid-mounted hydrogen production systems and hydrogen refueling stations” (042300007948), the National Key R&D Program of China (2022YFC3006005 and 2023YFB2504300), and the Key R&D Program of Hubei Province of China (2023BCB046).

Data Availability Statement

The data are contained within the article.

Conflicts of Interest

Author Guodong Li was employed by the company Haier Smart Home Co., Ltd., and Authors Shiyu Chen and Chunyan Song were employed by the company Shandong Electric Power Engineering Consulting Institute Co., Ltd. The remaining authors declare that the research was conducted in the absence of any commercial or financial relationships that could be construed as a potential conflict of interest. The authors declare that this study received funding from the company Shandong Electric Power Engineering Consulting Institute Co., Ltd. The funder was not involved in the study design, collection, analysis, interpretation of data, the writing of this article or the decision to submit it for publication.

Nomenclature

ρ Density, kg/m3
v Velocity, m/s
μ Kinetic viscosity, N·s/m3
T Temperature, K
p Pressure, Pa
v d r Drift velocity, m/s
k eff Effective thermal conductivity, W/(m·K)
E k Enthalpy of phase k, J
α Volume fraction
N s g Number of substance species in the g phase
m ˙ g i l Mass transfer from substance i in the gas phase to the liquid phase, kg/s
m ˙ l g i Mass transfer from the liquid phase to substance i in the gas phase, kg/s
τ Relaxation time, s
a Acceleration vector, m/s2
f d r a g Trailing force
T s a t Saturation temperature of liquid hydrogen, K
k Turbulent kinetic energy, m2/s2
μ t Turbulent viscosity coefficient
σ k Prandtl number of the k equation
σ ε Prandtl number of the ε equation
G k Turbulence kinetic energy affected by the laminar velocity gradient
G b Turbulence kinetic energy affected by buoyancy force kinetic energy
R i Net production rate of the ith component
Y i Mass fraction of the ith component
S i Production rate provided by the source phase
ν ˙ Diffusion velocity vector
J i Diffusive flux of the ith component
S c t Turbulent Schmidt number
D i , m Diffusion coefficient of the ith component in the mixture

References

  1. Zhao, J.; Dong, K.; Dong, X.; Shahbaz, M. How renewable energy alleviate energy poverty? A global analysis. Renew. Energy 2022, 186, 299–311. [Google Scholar] [CrossRef]
  2. Witcofski, R.D.; Chirivella, J.E. Experimental and analytical analyses of the mechanisms governing the dispersion of flammable clouds formed by liquid hydrogen spills. Int. J. Hydrogen Energy 1984, 9, 425–435. [Google Scholar] [CrossRef]
  3. Hooker, P.; Willoughby, D.B.; Royle, M. Experimental releases of liquid hydrogen. In Proceedings of the International Conference on Hydrogen Safety, Southport, UK, 12–15 November 2012; Institution of Chemical Engineers Symposium Series: Warwickshire, UK, 2012; pp. 496–504. [Google Scholar]
  4. Anaeby, J.; Gjesdal, T.; Voie, Ø. Large scale leakage of liquid hydrogen (LH2)-Tests related to bunkering and maritime use of liquid hydrogen. Nor. Def. Res. Establ. Rep. 2021, 20/03101. Available online: https://www.ffi.no/en/publications-archive/large-scale-leakage-of-liquid-hydrogen-lh2-tests-related-to-bunkering-and-maritime-use-of-liquid-hydrogen (accessed on 1 June 2024).
  5. Van Wingerden, K.; Kluge, M.; Habib, A.K.; Skarsvåg, H.L.; Ustolin, F.; Paltrinieri, N.; Odsæter, L.H. Experimental Investigation into the Consequences of Release of Liquified Hydrogen onto and under Water. Chem. Eng. Trans. 2022, 90, 541–546. [Google Scholar]
  6. Sun, R.; Pu, L.; Yu, H.; Dai, M.; Li, Y. Modeling the diffusion of flammable hydrogen cloud under different liquid hydrogen leakage conditions in a hydrogen refueling station. Int. J. Hydrogen Energy 2022, 47, 25849–25863. [Google Scholar] [CrossRef]
  7. Holborn, P.G.; Benson, C.M.; Ingram, J.M. Modelling hazardous distances for large-scale liquid hydrogen pool releases. Int. J. Hydrogen Energy 2020, 45, 23851–23871. [Google Scholar] [CrossRef]
  8. Jin, T.; Wu, M.; Liu, Y.; Lei, G.; Chen, H.; Lan, Y. CFD modeling and analysis of the influence factors of liquid hydrogen spills in open environment. Int. J. Hydrogen Energy 2017, 42, 732–739. [Google Scholar] [CrossRef]
  9. Wu, N.-N.; Duan, C.-D.; Jiang, Y.-C.; Lian, J. Simulation and safety analysis of the leakage of liquefied hydrogen from high-pressure container. Therm. Sci. 2019, 23 (Suppl. S3), 829–836. [Google Scholar] [CrossRef]
  10. Pu, L.; Shao, X.; Zhang, S.; Lei, G.; Li, Y. Plume dispersion behaviour and hazard identification for large quantities of liquid hydrogen leakage. Asia-Pac. J. Chem. Eng. 2019, 14, e2299. [Google Scholar] [CrossRef]
  11. Yuan, W.; Li, J.; Zhang, R.; Li, X.; Xie, J.; Chen, J. Numerical investigation of the leakage and explosion scenarios in China’s first liquid hydrogen refueling station. Int. J. Hydrogen Energy 2022, 47, 18786–18798. [Google Scholar] [CrossRef]
  12. Statharas, J.; Venetsanos, A.; Bartzis, J.; Würtz, J.; Schmidtchen, U. Analysis of data from spilling experiments performed with liquid hydrogen. J. Hazard. Mater. 2000, 77, 57–75. [Google Scholar] [CrossRef] [PubMed]
  13. Liu, Y.; Wei, J.; Lei, G.; Lan, Y.; Chen, H.; Gao, X.; Wang, T.; Jin, T. Numerical investigation on the effects of dike around liquid hydrogen source on vapor cloud dispersion. Int. J. Hydrogen Energy 2019, 44, 5063–5071. [Google Scholar] [CrossRef]
  14. Tang, X.; Pu, L.; Shao, X.; Lei, G.; Li, Y.; Wang, X. Dispersion behavior and safety study of liquid hydrogen leakage under different application situations. Int. J. Hydrogen Energy 2020, 45, 31278–31288. [Google Scholar] [CrossRef]
  15. Wang, Y.; Chen, Y.; Zhao, H.; Xiong, Y. Study on the influence of barriers in the diffusion process of liquid hydrogen leakage. IOP Conf. Ser. Earth Environ. Sci. 2020, 546, 042048. [Google Scholar] [CrossRef]
  16. Busini, V.; Lino, M.; Rota, R. Influence of Large Obstacles and Mitigation Barriers on Heavy Gas Cloud Dispersion: A Liquefied Natural Gas Case-Study. Ind. Eng. Chem. Res. 2012, 51, 7643–7650. [Google Scholar] [CrossRef]
  17. Busini, V.; Rota, R. Influence of the shape of mitigation barriers on heavy gas dispersion. J. Loss Prev. Process Ind. 2014, 29, 13–21. [Google Scholar] [CrossRef]
  18. Rong, Y.; Peng, J.; Gao, J.; Zhang, X.; Li, X.; Pan, X.; Chen, J.; Chen, S. Numerical Investigation on the Liquid Hydrogen Leakage and Protection Strategy. Processes 2023, 11, 1173. [Google Scholar] [CrossRef]
  19. Xiao, J.; He, P.; Li, X.; Bénard, P.; Yang, T.; Chahine, R. Computational fluid dynamics model based artificial neural network prediction of flammable vapor clouds formed by liquid hydrogen releases. Int. J. Energy Res. 2022, 46, 11011–11026. [Google Scholar] [CrossRef]
  20. Lee, M.S.; Lee, H.; Hwang, Y.; Radermacher, R.; Jeong, H.M. Optimization of two-phase R600a ejector geometries using a non-equilibrium CFD model. Appl. Therm. Eng. 2016, 109, 272–282. [Google Scholar] [CrossRef]
  21. Manninen, M.; Taivassalo, V.; Kallio, S. On the Mixture Model for Multiphase Flow. VTT Publ. 1996, 288. Available online: http://www.vtt.fi/inf/pdf/publications/1996/P288.pdf (accessed on 1 June 2024).
Figure 1. Modeling (a) and meshing (b) for validation.
Fire 07 00217 g001
Figure 2. Hydrogen concentration distribution at 20.94 s of leakage in experiment [2] (a) and simulation (b).
Fire 07 00217 g002
Figure 3. Experimental [2] and simulated values of hydrogen concentration at monitoring point.
Fire 07 00217 g003
Figure 4. Hydrogen production station layout.
Fire 07 00217 g004
Figure 5. Geometric model (a) and meshing (b) of hydrogen production station.
Fire 07 00217 g005
Figure 6. Volume of flammable hydrogen cloud with different numbers of meshes.
Fire 07 00217 g006
Figure 7. Liquid hydrogen distribution at different moments.
Fire 07 00217 g007
Figure 8. Hydrogen concentration (a) and temperature distribution (b) at different moments.
Fire 07 00217 g008
Figure 9. Flammable hydrogen clouds at different moments during the leakage process.
Fire 07 00217 g009
Figure 10. Variation in flammable hydrogen clouds with time for different wind speeds.
Fire 07 00217 g010
Figure 11. Volume (a) and diffusion distance (b) of flammable hydrogen clouds under different wind speed conditions.
Fire 07 00217 g011
Figure 12. Liquid hydrogen flow with different leakage mass flow rates.
Fire 07 00217 g012
Figure 13. Variation in flammable hydrogen clouds with time under different leakage mass flow rate conditions.
Fire 07 00217 g013
Figure 14. Diffusion distance (a) and volume (b) of flammable hydrogen clouds at different leakage mass flow rates.
Fire 07 00217 g014
Figure 15. Liquid hydrogen flow at different leakage gas phase mass fractions.
Fire 07 00217 g015
Figure 16. Hydrogen concentration distribution at different leakage gas phase mass fractions.
Fire 07 00217 g016
Figure 17. Diffusion distances (a) and volumes (b) of flammable hydrogen clouds for different leakage gas phase mass fractions.
Fire 07 00217 g017
Figure 18. Barrier walls at different locations.
Fire 07 00217 g018
Figure 19. Hydrogen concentration distribution with time at different barrier wall locations.
Fire 07 00217 g019
Figure 20. Volume of flammable hydrogen cloud at different barrier wall locations.
Fire 07 00217 g020
Figure 21. Hydrogen concentration distribution with time for different barrier wall heights.
Fire 07 00217 g021
Figure 22. Volume of flammable hydrogen cloud at different barrier wall heights.
Fire 07 00217 g022
Table 1. Comparison of simulation results with experimental results.
ParametersSimulation ValuesExperimental Values [2]Relative Error
Diffusion height18.9 m20 m−5.5%
Horizontal diffusion distance39.1 m37 m+5.7%
Disclaimer/Publisher’s Note: The statements, opinions and data contained in all publications are solely those of the individual author(s) and contributor(s) and not of MDPI and/or the editor(s). MDPI and/or the editor(s) disclaim responsibility for any injury to people or property resulting from any ideas, methods, instructions or products referred to in the content.

