Abstract
In Colombia’s Orinoco, wildfires have a profound impact on ecosystem dynamics, particularly affecting savannas and forest–savanna transitions. Human activities have disrupted the natural fire regime, leading to increased wildfire frequency due to changes in land use, deforestation, and climate change. Despite extensive research on fire monitoring and prediction, the quantification of fuel accumulation, a critical factor in fire incidence, remains inadequately explored. This study addresses this gap by quantifying dead organic material (detritus) accumulation and identifying influencing factors. Using Brown transects across forests with varying fire intensities, we assessed fuel loads and characterized variables related to detritus accumulation over time. Employing factor analysis, principal components analysis, and a generalized linear mixed model, we determined the effects of various factors. Our findings reveal significant variations in biomass accumulation patterns influenced by factors such as thickness, wet and dry mass, density, gravity, porosity, and moisture content. Additionally, a decrease in fuel load over time was attributed to increased precipitation from three La Niña events. These insights enable more accurate fire predictions and inform targeted forest management strategies for fire prevention and mitigation, thereby enhancing our understanding of fire ecology in the Orinoco basin and guiding effective conservation practices.
1. Introduction
The Colombian Orinoquía, spanning an area of 1,080,000 km2, is divided between Venezuela (71%) and Colombia (29%) [1]. Dominated by gallery forest and savannas [2], fire as a natural disturbance has been documented to spread well in herbaceous vegetation, occasionally entering the standing forests [3,4]. This region plays a vital role in Colombia’s agriculture and forestry sectors, serving as a crucial source of rice, soybeans, corn, beans, biofuels, and timber [5]. However, the accelerated land use changes derived from activities such as mining, illicit crop cultivation, and agriculture have led to significant alterations in land cover and land use, thereby impacting the region’s fire regimes. These changes are particularly consequential for the savannas, which play a key role in regulating water and carbon dynamics. Through the tree–grass dynamic, savannas contribute to organic matter storage and facilitate seasonal burns that mitigate CO2 accumulation in the atmosphere, curbing greenhouse gas increases and the resultant temperature rises [6,7].
Gallery forests, another ecosystem affected by fire-related issues, have evolved a symbiotic relationship with fires in adjacent savannas, developing differential functional responses and resilience to these events [1,8]. However, the expansion of agricultural frontiers and deforestation driven by climate change and logging have altered fire patterns. This alteration is partly due to increased wind speeds, resulting from the removal of trees that previously functioned as natural wind barriers [9]. Consequently, there has been a loss of biodiversity and soil degradation, reducing soil moisture and intensifying fires [10]. These ecological changes adversely affect human populations, leading to public health concerns about diminished air quality [11].
Understanding fire dynamics fundamentally involves the role of fuels, defined as biological materials that facilitate the propagation and dispersion of fire in natural systems. The combustion and emissions from forest fires are significantly influenced by the type, quantity, characteristics, and condition of these wildland fuels. Despite the development of various methodologies, accurately quantifying these factors remains challenging due to complex variables like vegetation type, moisture, and terrain slope [12]. Fuels are critical in determining fire behavior through three main components: ignition (how easily they catch fire), combustibility (how readily they burn), and sustainability (how long they burn) [13]. Fuels are classified based on their shape, size, arrangement, and morphology, with morphology offering the best insight into fire behavior [14]. They are classified as fine and coarse fuels, the former comprising leaves, bark, and branches with a diameter of less than 6 mm and fine stems with a thickness of less than 3 mm. This combustible material is consumed quickly and is easily ignited [15]. Coarse fuels, on the other hand, correspond to branches and trunks with diameters greater than 6 mm. The time it takes for them to burn allows them to be divided into 10 h and 100 h, constituting fuels with a delayed response to fire [15].
The measurement of fuel load presents significant challenges across different ecosystem types, with notable differences between forest systems and open areas, such as savannas, which are the predominant systems in the Orinoco basin. The complexity in measurement arises from the diverse and structurally variable vegetation, particularly native grasses, complicating accurate fuel load estimation [16]. Precise fuel load measurements are crucial for developing various management strategies for these ecosystems, such as the controlled burning of biological material and minimizing escaped fire incidents [17].
This research focused on understanding fuel load characteristics and identifying variables influencing fire occurrence and persistence. We employed statistical methods such as K prototypes, factor analysis of mixed data, and generalized linear mixed models to analyze multitemporal changes in fuel accumulation. These methods were selected for their efficacy in handling mixed data types, offering a detailed insight into fuel load patterns [18]. We hypothesized that fuel load varies over time and is influenced by the morphological and microclimatic conditions of each area under study. This research’s goal was to aid in the future development of targeted fuel management practices, aiming to reduce both the frequency and intensity of forest fires in the Orinoco by understanding the dynamics of fuel load variation and its predictors.
2. Materials and Methods
2.1. Area of Study
Within Colombia, the Orinoquia region is the largest biogeographical region in terms of extension, covering 310,000 km2. Its origin dates back to the Quaternary period after a geological, geomorphological, and edaphic evolution, resulting from a structural depression that generated a geosyncline located between the Andes mountains, the coast, and the Guiana Shield [19]. Its ecological importance lies in its role as a zone of exchange of diversity between the Amazon and the Andes [20]. Within this zone, two ecosystems primarily stand out: gallery forests and savannas, with the latter being the ecosystems with the greatest dominance and importance at the structural level due to their extension and resilience to the periodic fires that generate changes in the composition of species [21].
Our study was conducted in the Orinoco River basin, in two Departments, Vichada and Arauca, most of the evaluated forests are secondary, in which their composition varies according to their disturbance, with burned forests presenting a lower species composition with 61 species and 37 genera, while unburned forests are represented by 59 and 77 species [4], respectively. Regarding their structure, systems without burns have an average basal area of 3.0 m2/0.1 ha (±1.31), a height of 16 m (±1.81), and a density of 613.3 density/ha (±129.77); for burned areas, the basal area is 1.68 m2/0.1 ha (±0.60), a height of 13.4 m (±3.31), and a density of 271.9 (±164.76), with sampling plots and transects established in the evergreen floodplain forests. In Vichada, the study was conducted in three civil society natural reserves: Bonjonawi, comprising 4680 ha; Los Robles, with 155.68 ha; and Doña Ana, with 1200 ha. We also included sampling plots at the National Natural Park, a protected area covering 548,000 ha, and a forest plantation (Forest First) composed of stands of Eucalyptus pellita and Acacia mangium whose purpose is the acquisition of wood and paper pulp, primarily by the Forest First reforestation company; Forest First encompasses 31,758 ha. Each system has been affected by fires to varying degrees and comprises natural systems such as gallery forests, savannas, and Moriche (Mauritia flexuosa) palm swamps (Figure 1a). This area experiences an average temperature of 26.9 °C and receives an average annual precipitation of 2366 mm. The predominant soils are acidic oxisols with low water retention capacity [22].
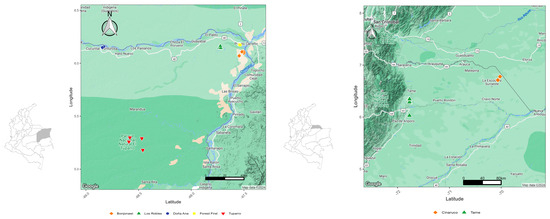
Figure 1.
Collection sites for dead fuel (left) Vichada, (right) Arauca.
Additionally, sampling efforts extended to the Department of Arauca in the Cinaruco Management District spanning 331,448 ha, and to a group of farms (Altamira and La Fortuna) in the municipality of Tame, totaling 367 hectares. This zone is characterized by a variety of natural systems including savannas, gallery forests, where Moriche (Mauritia flexuosa L. f.) palm swamps, Saladillo (Caraipa llanorum Cuatrec) marshes, and Congrio (Acosmium niten Vogel) palm forests dominate, and the area has an average annual temperature of 32.3 °C and an annual precipitation of 1881 mm [23] (Figure 1b). The savannas feature herbaceous species, dicotyledons (e.g., Polygala spp., Chamaecrista spp., and Drosera sessilifloria), and trees (e.g., Byrsonima spp., Bowdichia virgilioides, Curatella americana). Gallery forests, on the other hand, are mainly composed of species from the Lauraceae, Chrysobalanaceae, and Melastomataceae families [24]. For both departments, unimodal behaviors are presented in which there are two rainy periods corresponding to the wet and dry seasons, with the months from January to March having the least precipitation for Vichada and Arauca, and the periods from May to July having the highest amount of rainfall, with the dry season being when the highest number of fires occur in the region [25].
2.2. Categorization of Fire Intensity and Severity
The degree of impact on each forest differed, so three conditions were defined based on the traces left in forests with diameters greater than 10 (DAP > 10), using parameters proposed by Keeley [26] and Pausas and Keeley [27] for changes in vegetation after a fire. The proposed classification includes trees with diameters greater than 10 that have burned crowns, completely burned detritus, and a canopy opening greater than 70%. This condition is classified as a burned forest of high severity and intensity (BQ). Finally, non-burned forests (BNQ) were considered; these are natural areas where there have been no fires, logging, or grazing in the last 30 years [23].
The selection of samples for the measurement of fuel load was made for the three forest conditions, establishing six (6) subplots of 0.1 ha, with a horizontal area of 10 m, at a vertical distance of 100 m, with up to a total of 18 plots, specifically for the department of Vichada; in Arauca, we examined only two types of conditions: burned forest and unburned forest. For each experimental unit, it was guaranteed that they were separated by 400 m. Fuel measurements were conducted in the years 2017, 2019, 2021, and 2023, and a total of 5426 transects were evaluated, with 5012 for Vichada, corresponding to 3944 for burned areas and 1068 for unburned areas, while for Arauca, 404 were taken into account, distributed in 202 unburned zones and 212 burned zones. The areas experienced fires in different years. In Bonjonawi and Doña Ana, the fires occurred in 2015, while in Los Robles, it occurred in 2018. On the other hand, in Tuparro and Forest First, the fires affected the properties in 2021. In the case of Tame, the burned areas were recorded in 2019, and in Cinaruco, the fires took place in 2018.
2.3. Woody Detritus Sampling
For the measurement of dead material, the previously established plots were used and two 20 m Brown linear transects were constructed [15]. In each of them, two variables were taken for the dead woody fuel: fine woody detritus (FWD) and coarse woody detritus (CWD). These detritus were classified according to their size class, considering their diameter and the time it takes to burn 0–0.6 cm (1 h to burn), 0.6–2.5 cm (10 h), 2.5–8 cm (100 h), and 8 cm (1000 h)
For the collection of dead biomass, samples were taken from the first 2 m of fuels with ignition times of 1 and 10 h. Subsequently, detritus with ignition times of 100 h were collected from the next five meters, and fuels with ignition times of 1000 h were collected along the entire Brown transect. For each sample, a 3 cm thick cylindrical wood segment was obtained, and measurements of wet weight, dry weight, and density were conducted following the method proposed in [28]. Additionally, for wood pieces with diameters ranging from 2.5 cm to 8 cm, the azimuth, inclination, weight, thickness, and hardness (penetration) were determined. The values for the penetration variable were obtained using a penetrometer, with 20 blows applied to the piece under a constant force of 400 kg. This allowed the classification of detritus as either healthy or rotten, with the latter being those that did not withstand more than 20 blows, after the collection of the debris, they were classified according to their shape, type, and morphology.
2.4. Data Analysis
A total of 26 variables were evaluated, including the zone, indicating the specific locations of fuel load measurement; year, representing the period of measurement; condition, denoting the category of fire events; plot, which signifies the experimental sampling unit; and subplot, delineating subgroups within the experimental unit. Additionally, there were categorical variables like diameter class (cm) for the diameter class of the detritus; fuel class (h), indicating the combustion time of the fuel; and shape, representing the shape of the detritus. Other variables, specifically those of a numerical nature, included diameter detritus (cm) for the diameter of the detritus; azimuth degrees (°) representing the degree of detritus position; inclination (°) indicating the position of the detritus; and others like wet mass (g) for the wet weight of the detritus, volume (m3) denoting the volume of the detritus, and fuel load (kg/m2) representing the fuel load of the detritus. These variables collectively provided a comprehensive understanding of the fuel load characteristics in the study area and were crucial for analyzing the dynamics and variations in fuel accumulation over time. For the above, 5426 observations were considered.
The analyses presented were entirely developed using R version 4.2.3. Prior to the data analysis, data imputation was performed using the MICE algorithm, using the predictive mean matching (PMM) on numerical variables, which was performed due to the high percentage of missing values and to obtain a precise estimation of patterns and changes in load fuel. A multiple imputation was conducted with a maximum of 10 interactions [29]. Subsequently, boxplots and a Kruskal–Wallis test were constructed to identify differences and changes in fuel load based on the different categorical variables collected during the estimation of this variable.
To identify groups among all variables, a unsupervised technique k-prototypes similar to k-means determined groups in the adjacent data, where the analysis was conducted using the Gower distance, taking into account the mixed types of categorical and continuous variables. Additionally, to determine the number of clusters, we implemented the method of Mclaine and Silhouette, and then, using the elbow criterion, the optimal number of groups was selected using the mixed data taken in the forests with different degrees of fire intensity [30]. These procedures were performed using the clustMixType package version 1.0 [31].
To detect trends and relationships between the proposed variables to explain fuel load, a factor analysis of mixed data extension with MCA (multiple correspondence analysis) and generalization PCA (principal components analysis) was performed, implemented in the Factomine R package [32]. Finally, to determine the effect of the variables recorded on the fuel load, a generalized linear mixed model (GLMM). These are versatile statistical tools that excel in various modeling scenarios. First and foremost, they are particularly suitable for data with a hierarchical or correlated structure, such as those involving repeated measurements over time or data collected from multiple sites. In such cases, GLMMs can capture the structure more accurately than generalized linear models (GLMs), allowing for a more precise analysis that is better suited to the nature of the data [33]. Model adjustment to an inverse Gaussian distribution was performed using the lme4 package [34]. After verification using a likelihood ratio test [35], a model that showed significance variables was reported, and the marginal and conditional R-squared was calculated using the Mumin package [36]. Additionally, the climatic values of precipitation and temperature for each year of fuel measurement were obtained from information collected through the Meteostat website.
3. Results
The fuel load found in each of the evaluated areas indicated that the highest amount for this component was found in the Tuparro National Natural Park with 24.9 (±0.24) tons per hectare, followed by Tame with 22.8 (±5.96), Bonjonawi 19.8 (±1.31), Cinaruco 17.7 (±4.26), followed by Los Robles 12.3 (±2.24), Forest First 11.9 (±3.24), and Doña Ana with 11.1 (±1.30), respectively. Within the most common classes, fine fuels accounted for 87.5% of the total evaluated, while coarse fuels represented 12.5%. Likewise, the most frequently observed shape in the transects was cylindrical, with 5353 records. Finally, the debris most present in the evaluated transects were those whose ignition took at least 10 h. The reported fuel values specifically for areas with water tributaries such as the Arauca and Orinoco rivers reached an average value of 20.5 tons per hectare (±0.19), while the areas adjacent to the Vichada, Bita, and Orinoco rivers presented a fuel load of 17.4 (±0.01) tons per hectare.
Our comparative analysis revealed significant differences in median fuel loads across the study areas (χ2(1) = 21.82, p ≤ 0.0001, n = 5426), with Vichada department demonstrating notably higher levels. This variation was due to a more uniform distribution of fuel in Vichada, leading to greater measurement variability (Figure 2a). The zones exhibited significant differences (χ2(6) = 302.5, p ≤ 0.0001, n = 5426); specifically, Bonjonawi area in Vichada department recorded the highest fuel load, accounting for 50% of the records, surpassing those in Tame and Cinaruco. The data from Bojonawi and Cinaruco exhibited a similar pattern, whereas Tame showed a more constricted distribution, highlighting significant variability and outliers indicating high fuel load (Figure 2b).
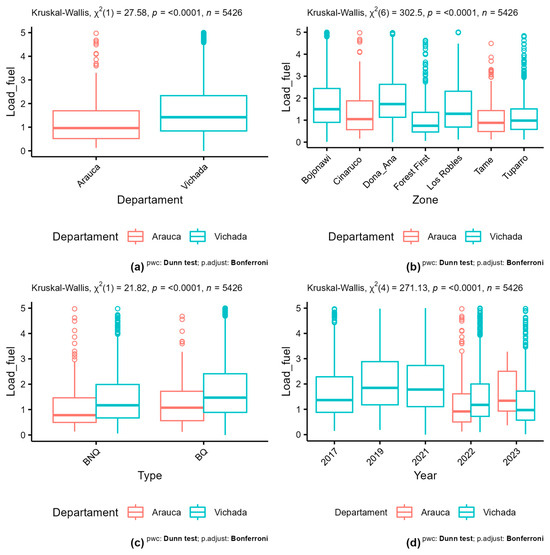
Figure 2.
Boxplot of fuel load showing four categories of variables, (a) department, (b) zone, (c) condition, and (d) year.
Regarding the conditions assessed—unburned and burned forests—a pronounced variation was observed, particularly due to the distribution narrowness (Figure 2c). Over the evaluation period, median fuel loads showed consistency for the initial two years, while the values for 2022 and 2023 were notably lower. The distribution of fuel load exhibited a strong trend of extreme data for 2017, 2022, and 2023, while 2019 showed a positive skewness behavior, with constant values and slight variation (Figure 2d).
A cluster analysis based on the sum of squares indicated an optimal number of two clusters, as determined by the elbow criterion, with a Maclain value of −0.23 and silhouette value of 0.12. (Figure 3a). When using specific gravity as the reference variable, the analysis revealed distinct separation between the clusters, with one group characterized by lower fuel loads and specific gravity of detritus (Figure 3b). Regarding distance, one cluster was notably associated with higher fuel loads and greater distances. This analysis also highlighted variations in the debris arrangement across transects (Figure 3c). Lastly, regarding porosity, the highest clustering was observed towards high porosity values; in contrast, there was a group with fewer records with low porosity values and fuel loads (Figure 3d).
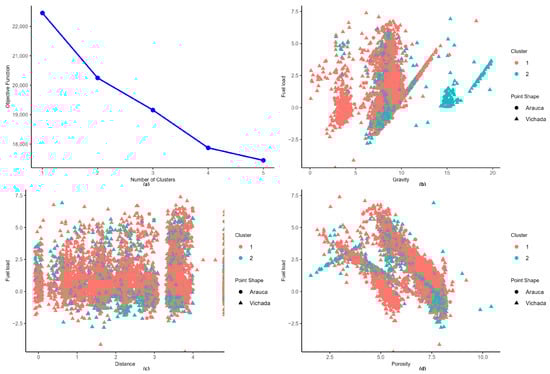
Figure 3.
K prototypes of the class finding with all variables, (a) number of clusters, (b) groups to fuel load and diameter, (c) groups to fuel load and distance, and (d) groups to fuel load and porosity.
The factor analysis of mixed data revealed that the first two components accounted for 23.2% of the variation, with 14.3% attributed to the first component and 8.9% to the second, with no relevant information about variation. This led to the selection of two components based on their ability to retain the most significant information regarding fuel load variables (Figure 4a). A quantitative analysis showed a strong correlation between weight-related variables and fuel loads, whereas porosity demonstrated an inverse relationship with dasometric variables and fuel load, alongside a notable correlation with density. Some variables, however, poorly explained the variation, indicating potential exclusion from further analysis (Figure 4b). Categorical variable analysis identified two distinct groups, differentiated by the shape, type of detritus, and distance, as well as by sampling zones (Figure 4c).
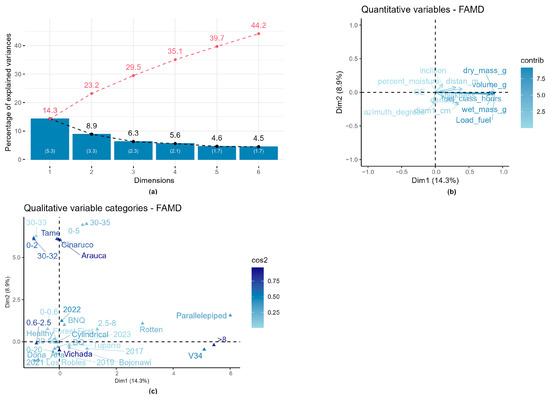
Figure 4.
FAMD—Factor analysis of mixed data, (a) proportion of variance explained by each dimension, the dashed line red represents the variation explained by each component and the dashed black line eigen values, (b) biplot quantitative variables, (c) biplot qualitative variables.
The generalized linear mixed model (GLMM) analysis, utilizing an inverse Gaussian distribution, provided insights into fuel load variations in the Orinoco River basin, specifically within Vichada. The model demonstrated a marginal R-squared of 59.4% and a conditional R-squared of 64.4%, with an Akaike information criterion (AIC) of 23,396, Bayesian information criterion (BIC) of 23,471, and a log-likelihood of −11,686. Within the model, variables such as precipitation, percent moisture, and porosity had a significant negative effect on fuel loads. In contrast, thickness, diameter, and azimuth degrees had a significant positive effect on the response variable (Table 1).

Table 1.
Results of generalized linear mixed model (GLMM) for fuel load.
In the model, the variables precipitation, porosity, and percent moisture, given an increase of one unit, tended to decrease the fuel load by 0.152, 0.401, and 0.086, respectively, in terms of kilograms per hectare. In contrast, the variables thickness, azimuth degrees, inclination, and diameter, given an increase of one unit, tended to increase the fuel load by 0.565, 0.053, 0.542, and 0.425 kg per hectare, respectively. As for the intercept, it was observed that when the variables had zero values (for interpretation purposes), they tended to take a value of 2.542 tons per hectare.
yij∼Inverse Gaussian(μij)
log(μij) = β0 + β1 × 1ij − Precipitation + β2 × 2ij − Percent moisture + β3 × 3ij − Thickness + β4 × 4ij − Porosity + β5 × 5ij − Inclination + β6 × 6ij − Diameter+ β7 × 7ij − Azimuth degrees + b0i + b1j
log(μij) = β0 + β1 × 1ij − Precipitation + β2 × 2ij − Percent moisture + β3 × 3ij − Thickness + β4 × 4ij − Porosity + β5 × 5ij − Inclination + β6 × 6ij − Diameter+ β7 × 7ij − Azimuth degrees + b0i + b1j
The mixed-effects generalized model, employing an inverse Gaussian distribution for Arauca, yielded a marginal R-squared of 76.4% and a conditional R-squared of 76.8%, effectively elucidating the variation in fuel loads within systems situated at the base of the Orinoco River. Furthermore, the model exhibited favorable values for the Akaike criterion (1891), Bayesian criterion (1927.3), and likelihood (−936.6). Notably, variables such as thickness and diameter exerted a positive influence on fuel loads, while the percent moisture and porosity demonstrated a significant negative impact on the response variable (Table 2).
Table 2.
Results of generalized linear mixed model (GLMM) for fuel load in Arauca.
In the model, when the variables porosity and percent moisture were increase by one unit, the fuel load tended to decrease by 0.922 and 0.28 kg per hectare, respectively. Conversely, when the variables thickness and diameter were increased by one unit, the fuel load tended to increase by 0.568 and 0.335 kg per hectare, respectively. Regarding the intercept, it was observed that when the variables had zero values (for interpretation purposes), it tended to be 1.481 tons per hectare.
yij∼Inverse Gaussian(μij)
log(μij) = β0 + β1 × 1ij − Thickness + β2 × 2ij − Diameter + β3 × 3ij − Percent moisture + β4 × 4ij − Porosity + b0i + b1j
log(μij) = β0 + β1 × 1ij − Thickness + β2 × 2ij − Diameter + β3 × 3ij − Percent moisture + β4 × 4ij − Porosity + b0i + b1j
4. Discussion
This study presents a comprehensive analysis of multitemporal changes in fuel accumulation in forest systems within the Colombian Orinoco River basin. Our findings revealed significant variations in fuel load across different departments, zones, conditions, and years, with notable implications for forest management and conservation strategies in this region. Our results indicated a higher median fuel load (χ2(1) = 21.82, p ≤ 0.0001, n = 5426) in the Vichada department compared to the others, with the Bonjonawi area exhibiting the highest fuel loads. This variability can be attributed to several factors, including differences in vegetation types, forest management practices, and climatic conditions. Understanding these differences is crucial for developing targeted strategies for fire risk management and conservation. Although they are used in forest plantations, the use of silvicultural practices such as pruning and thinning in natural forests, as a management tool for fuel, is a feasible and practical alternative that can reduce the incidence of fires [37]. However, certain limitations have to be considered, since these treatments are conducted in homogeneous forests with dominant species such as pines and eucalyptus [38]. Additionally, in this study, we did not directly measure parameters such as fuel bed depth, and fuel moisture content within the examined ecosystems. Future research could benefit from incorporating these variables to provide a more comprehensive understanding of fire dynamics across different ecological settings.
The use of an inverse Gaussian distribution in our mixed-effects model was instrumental in capturing the skewness and kurtosis typical of ecological data, particularly in fuel load measurements. This approach provided a more accurate representation of the underlying data distribution, enhancing the reliability of our findings. Furthermore, the multiple correspondence analysis highlighted the complex interactions between numerous factors influencing fuel loads. The decision to potentially remove certain variables from the analysis was based on their low explanatory power, which suggests that they might not significantly contribute to fuel load variations. Many studies related to fuel load have made inferences according to normal or gamma-adjusted distributions [39,40,41]. Although these assumptions are adequate with an optimal number of samples, they justify the results very well. However, the use of an appropriate distribution, as in this case, allows for improved prediction and avoidance of erroneous interpretations regarding type one and two errors in the information on detritus quantity.
The decrease in fuel load over the past few years may be attributed to climate variability events, including three La Niña events in the years 2017, 2020, and 2021. Their impact was associated with increased precipitation, a factor that served as one of the main drivers for the reduction e in fuel load. This phenomenon was evident in the Orinoco River basin, due to the fluctuation of water levels causing a displacement of debris, which was evident in Doña Ana and Bonjonawi, areas that reached an average distance of 1001 km. This proximity conditioned the temporary quantity of debris, in addition to increasing decomposition rates due to increased humidity and consequent biological activity. This highlighted a self-management system of fuels by natural systems in the Vichada department [42].
The presence of outliers, especially in areas like Tame, raises important questions about the factors contributing to these anomalies. These could range from microclimatic conditions to specific forest management practices. Future studies should aim to investigate these outliers in more detail, to understand their causes and implications. One of the main factors that has attracted interest and generated anomalous behaviors in fuel estimation is climate change, which has induced a reduction in the humidity of detritus [43]. This is of interest because forest fires are one of the main causes of air pollution, and changes in climatic conditions can affect this behavior, generating health problems [44].
Our results suggest an increase in fuel load across the transect distance, which is associated with edge-type behaviors, where the transition between forests and savannas plays a functional role in the dynamics and formation of open systems with low vegetation cover. Taking this into account, although savannas experience the highest frequency of fires, forests present a higher amount of biomass, due to their greater production of plant material by trees, as well as the effect of the functional diversity of these systems, specifically in the production of resins and the flammability of these materials, as reported by Valencia et al. [3]. On the other hand, as highlighted by Armenteras et al. [4], there is lower species diversity at the edge, caused by the frequency of fires at the forest fringe, which limits the growth of species stems and biomass generation by trees located in this segment.
In future work, the adaptation and selection of machine learning models for land cover and risk classification could efficiently determine the amount of fuel in an area, as well as the speed of fire spread and its impact on natural systems. Additionally, it is essential to integrate different environmental variables to improve model accuracy. Among these variables, precipitation, wind speed, and temperature stand out as sources of variation. This integration will enable the development of dynamic rather than static models, enhancing fire prediction based on fuel load [45,46].
5. Conclusions
This study provided valuable insights into the dynamics of fuel accumulation in the Colombian Orinoco River basin’s forest systems. Fuel load variability over time is influenced by several factors, primarily the morphological characteristics of detritus such as density and thickness. These variables tend to affect the accumulation of fuels, which in turn conditions the speed of propagation and ignition of the fuels. Other characteristics of detritus include the amount of moisture that it can retain, which is specifically associated with the speed and ability to spread in forests. Therefore, the monitoring of environmental variables can be one of the main tools for the management and control of fires in natural systems. While the current management of fuels is specific to plantations, strategies such as prescribed burning or manual removal of dead biomass may be eventually implemented in natural systems. These strategies have demonstrated a reduction in the frequency of fires and an improvement in soil biodiversity. Therefore, correct implementation of these strategies would enhance fire management in the studied areas, promoting conservation of these natural areas and reducing the impact on the diversity of these forests.
The observed variations in fuel load underscore the need for region-specific management strategies, reflecting the unique ecological characteristics of each area. The insights gained from this study are vital for informing forest management practices in the Colombian Orinoco River basin. By understanding the spatial and temporal patterns of fuel accumulation, forest managers can better predict areas at higher risk of wildfires and implement more effective fire prevention and control measures. Additionally, our findings can guide reforestation and conservation efforts, ensuring that they are tailored to the specific conditions of each area. Our findings can contribute to a deeper understanding of these systems, offering a foundation for future research and practical applications in forest management and conservation.
These insights enable more accurate fire risk predictions and can inform targeted forest management strategies for fire prevention and mitigation. This research enhances our understanding of fire ecology in the Orinoco basin, guiding effective conservation and potential fuel management practices.
Author Contributions
Conceptualization, W.G.-S. and D.A.; methodology, D.A.; software, W.G.-S.; validation, W.G.-S., M.J.P. and D.A.; formal analysis, W.G.-S. and M.J.P.; investigation, W.G.-S. and M.J.P.; resources, W.G.-S.; data curation, W.G.-S. and M.J.P.; writing—original draft preparation, W.G.-S., M.J.P. and D.A.; writing—review and editing, W.G.-S., M.J.P. and D.A.; visualization, W.G.-S.; supervision, D.A.; project administration, D.A.; funding acquisition, D.A. All authors have read and agreed to the published version of the manuscript.
Funding
The data analyzed in this paper were collected over the years with funding provided by the United States Agency for International Development—Partnership for Enhanced Engagement in Research (PEER) and the US National Academies of Science (Subaward 2000007526PEER Cycle 5) through the project ‘Degradation of Tropical Forest in Colombia: Impacts of Fire’. Additional support came from the Colombian Administrative Department of Science, Technology and Innovation (COLCIENCIAS) project No 110180863738 (CT-247-2019) and the project ‘Participatory Design of Strategies for Reducing Forest Fires, Conserving Biodiversity, and Regional Development in Multifunctional Landscapes of Vichada (Ministry of Science and the General System of Royalties of Colombia, BPIN 2020000100456), and finally the project funded by Universidad Nacional de Colombia Ecological and Social Characteristics that Influence the Dynamics of Forest Fires in the Cinaruco National Integrated Management District all awarded to DAP.
Institutional Review Board Statement
Not applicable.
Informed Consent Statement
Not applicable.
Data Availability Statement
All of the data for this study have been archived at the Universidad Nacional de Colombia. Bogotá, Colombia.
Acknowledgments
We would like to thank the Ecolmod team, particularly Maria Meza and Alejandra Reyes, as well as Jose Luis Camargo and Nathalia Moreno, who processed part of the material collected in the latest campaigns.
Conflicts of Interest
The authors declare no conflicts of interest.
References
- Gassón, R.A. Orinoquia: The archaeology of the Orinoco River Basin. J. World Prehist. 2002, 16, 237–311. [Google Scholar] [CrossRef]
- Rangel-Ch, J.O.; Sánchez-C, H.; Lowy-C, P.; Aguilar-P, M.; Castillo-G, A. Región de la Orinoquia. Colombia, Diversidad Biótica I; Instituto de Ciencias Naturales, Convenio Inderena-Universidad Nacional de Colombia: Bogotá, Colombia, 1995; pp. 239–254. [Google Scholar]
- Valencia, S.; Salazar, J.F.; Hoyos, N.; Armenteras, D.; Villegas, J.C. Current Forest–Savanna Transition in Northern South America Departs from Typical Climatic Thresholds. Ecosystem 2024, 27, 61–76. [Google Scholar] [CrossRef]
- Armenteras, D.; Meza, M.C.; González, T.M.; Oliveras, I.; Balch, J.K.; Retana, J. Fire threatens the diversity and structure of tropical gallery forests. Ecosphere 2021, 12, e03347. [Google Scholar] [CrossRef]
- Lavelle, P.; Rodríguez, N.; Arguello, O.; Bernal, J.; Botero, C.; Chaparro, P.; Fonte, S.J. Soil ecosystem services and land use in the rapidly changing Orinoco River Basin of Colombia. Agr. Ecosyst. Environ. 2014, 185, 106–117. [Google Scholar] [CrossRef]
- Armenteras, D.; Cabrera, E.; Rodríguez, N.; Retana, J. National and regional determinants of tropical deforestation in Colombia. Reg. Environ. Change 2013, 13, 1181–1193. [Google Scholar] [CrossRef]
- Romero-Ruiz, M.; Etter, A.; Sarmiento, A.; Tansey, K. Spatial and temporal variability of fires in relation to ecosystems, land tenure and rainfall in savannas of northern South America. Glob. Change Biol. 2010, 16, 2013–2023. [Google Scholar] [CrossRef]
- Hoffmann, W.A.; Geiger, E.L.; Gotsch, S.G.; Rossatto, D.R.; Silva, L.C.; Lau, O.L.; Franco, A.C. Ecological thresholds at the savanna-forest boundary: How plant traits, resources and fire govern the distribution of tropical biomes. Ecol. Lett. 2012, 15, 759–768. [Google Scholar] [CrossRef] [PubMed]
- Brando, P.M.; Nepstad, D.C.; Balch, J.K.; Bolker, B.; Christman, M.C.; Coe, M.; Putz, F.E. Fire-induced tree mortality in a neotropical forest: The roles of bark traits, tree size, wood density and fire behavior. Glob. Change Biol. 2012, 18, 630–641. [Google Scholar] [CrossRef]
- Etter, A.; Sarmiento, A.; Romero, M.H. Land use changes (1970–2020) and carbon emissions in the Colombian Llanos. In Ecosystem Function in Savannas: Measurement and Modeling at Landscape to Global Scales, 1st ed.; Hill, M.J., Hanan, N.P., Eds.; CRC Press: Boca Raton, FL, USA, 2010; pp. 383–402. [Google Scholar]
- Mendez-Espinosa, J.F.; Belalcazar, L.C.; Betancourt, R.M. Regional air quality impact of northern South America biomass burning emissions. Atmos. Environ. 2019, 203, 131–140. [Google Scholar] [CrossRef]
- Weise, D.R.; Wright, C.S. Wildland fire emissions, carbon, and climate: Characterizing wildland fuels. For. Ecol. Manag. 2014, 317, 26–40. [Google Scholar] [CrossRef]
- Gill, A.M.; Zylstra, P. Flammability of Australian forests. Aust. For. 2005, 68, 87–93. [Google Scholar] [CrossRef]
- Pyne, S.J.; Andrews, P.; Laven, R.D. Introduction to wildland fire. In Fire Management in the United States; John Wiley & Sons: Hoboken, NJ, USA, 1996. [Google Scholar]
- Brown, J.K. Handbook for Inventorying Surface Fuels and Biomass in the Interior West; US Department of Agriculture, Forest Service, Intermountain Forest, and Range Experiment Station: Washington, DC, USA, 1981; Volume 129.
- Russell-Smith, J.; Cook, G.D.; Cooke, P.M.; Edwards, A.C.; Lendrum, M.; Meyer, C.P.; Whitehead, P.J. Managing fire regimes in north Australian savannas: Applying Aboriginal approaches to contemporary global problems. Front. Ecol. Environ. 2013, 11, 55–63. [Google Scholar] [CrossRef]
- Keane, R.E.; Agee, J.K.; Fule, P.; Keeley, J.E.; Key, C.; Kitchen, S.G.; Schulte, L.A. Ecological effects of large fires on US landscapes: Benefit or catastrophe? Int. J. Wildland Fire 2008, 17, 696–712. [Google Scholar] [CrossRef]
- Nelson, K.N.; Turner, M.G.; Romme, W.H.; Tinker, D.B. Landscape variation in tree regeneration and snag fall drive fuel loads in 24-year-old post-fire lodgepole pine forests. Ecol. Appl. 2016, 26, 2424–2438. [Google Scholar] [CrossRef]
- Rangel-Ch, J.O.; Andrade-C, M.G.; Jarro-F, C.; Santos-C, G. (Eds.) Colombia Diversidad Biótica XX. Territorio Sabanas y Humedales de Arauca (Colombia); Universidad Nacional de Colombia-Instituto de Ciencias Naturales, Parques Nacionales Naturales de Colombia: Bogotá, Colombia, 2019; p. 852. [Google Scholar]
- Rippstein, G.; Escobar, G.; Motta, F. Agroecología y Biodiversidad de las Sábanas en los Llanos Orientales de Colombia; Publicación CIAT no 322; CIAT: Cali, Colombia, 2001; p. 302. [Google Scholar]
- Lasso, C.; Usma, J.; Trujillo, F.; Rial, A. Biodiversidad de la Cuenca del Orinoco: Bases Científicas para la Identificación de áreas Prioritarias para la Conservación y uso Sostenible de la Biodiversidad; Instituto de Investigación de Recursos Biológicos Alexander von Humboldt: Bogotá, Colombia, 2010; ISBN 978-958-8554-13-6. [Google Scholar]
- Pacheco, M.; Peñuela, L.; Solano, C.; Galan, S. Manejo Forestal Sostenible en Plantaciones en la Cuenca del rio Bita, Vichada, Colombia, Proyecto: “Fortalecimiento institucional y de política para incrementar la conservación de la biodiversidad en predios privados en Colombia”; WWF, Fundación Natura, Resnatur: Bogotá, Colombia, 2014; Volume 1. [Google Scholar]
- Meza, M.C.; Espelta, J.M.; González, T.M.; Armenteras, D. Fire reduces taxonomic and functional diversity in Neotropical moist seasonally flooded forests. Perspect. Ecol. Conserv. 2023, 21, 101–111. [Google Scholar] [CrossRef]
- Parra, C. Estudio general de la vegetación nativa de Puerto Carreño (Vichada, Colombia). Caldasia 2006, 28, 165–177. [Google Scholar]
- Armenteras-Pascual, D.; Retana-Alumbreros, J.; Molowny-Horas, R.; Roman-Cuesta, R.M.; Gonzalez-Alonso, F.; Morales-Rivas, M. Characterising fire spatial pattern interactions with climate and vegetation in Colombia. Agric. For. Meteorol. 2011, 151, 279–289. [Google Scholar] [CrossRef]
- Keeley, J.E. Fire intensity, fire severity and burn severity: A brief review and suggested usage. Int. J. Wildland Fire 2009, 18, 116–126. [Google Scholar] [CrossRef]
- Pausas, J.G.; Keeley, J.E. Epicormic Resprouting in Fire-Prone Ecosystems. Trends Plant Sci. 2017, 22, 1008–1015. [Google Scholar] [CrossRef]
- Lutes, D.C.; Keane, R.E.; Caratti, J.F.; Key, C.H.; Benson, N.C.; Sutherland, S.; Gangi, L.J. Fuel Load (FL) Sampling Method; Forest Service General Technology Report; USDA Forest Service: Washington, DC, USA, 2006; 27p.
- Van Buuren, S.; Groothuis-Oudshoorn, K. mice: Multivariate imputation by chained equations in R. J. Stat. Softw. 2011, 45, 1–67. [Google Scholar] [CrossRef]
- Huang, Z. Extensions to the k-means algorithm for clustering large data sets with categorical values. Data Min. Knowl. Discov. 1998, 2, 283–304. [Google Scholar] [CrossRef]
- Szepannek, G.; Aschenbruck, R.; Szepannek, M.G. clustMixType: Clustering Mixed-Type Data in R. R Package Version 1.0. Available online: https://cran.r-project.org/package=clustMixType (accessed on 14 January 2024).
- Pagès, J. Analyse factorielle de donnees mixtes: Principe et exemple d’application. Rev. Stat. Appl. 2004, 52, 93–111. [Google Scholar]
- Bates, D.; Maechler, M.; Bolker, B.; Walker, S.; Christensen, R.H.B.; Singmann, H.; Green, P. Package ‘lme4’. 2009. Available online: http://lme4.r-forge.r-project.org (accessed on 17 December 2023).
- Correa Morales, J.C.; Salazar Uribe, J.C. Introducción a los Modelos Mixtos; Universidad Nacional de Colombia: Bogotá, Colombia, 2016; pp. 30–50. [Google Scholar]
- Davis, A.S. Use of the likelihood ratio test on the inverse Gaussian distribution. Amer. Stat. 1980, 34, 108–110. [Google Scholar] [CrossRef]
- Barton, K.; Barton, M.K. MuMIn: Multi-Model Inference. R Package Version 1.10.0. Available online: http://cran.r-project.org/package=MuMIn (accessed on 14 January 2024).
- Cohan, D.; Haas, S.; Roussopoulos, P.J. Decision analysis of silvicultural prescriptions and fuel management practices on an intensively managed commercial forest. For. Sci. 1983, 29, 858–870. [Google Scholar]
- Pimont, F.; Dupuy, J.L.; Linn, R.R.; Parsons, R.; Martin-StPaul, N. Representativeness of wind measurements in fire experiments: Lessons learned from large-eddy simulations in a homogeneous forest. Agric. For. Meteorol. 2017, 232, 479–488. [Google Scholar] [CrossRef]
- Storey, M.A.; Bedward, M.; Price, O.F.; Bradstock, R.A.; Sharples, J.J. Derivation of a Bayesian fire spread model using large-scale wildfire observations. Environ. Model. Softw. 2021, 144, 105–127. [Google Scholar] [CrossRef]
- Kennedy, M.C.; Prichard, S.J.; McKenzie, D.; French, N.H. Quantifying how sources of uncertainty in combustible biomass propagate to prediction of wildland fire emissions. Int. J. Wildland Fire 2020, 29, 793–806. [Google Scholar] [CrossRef]
- Skowronski, N.S.; Clark, K.L.; Duveneck, M.; Hom, J. Three-dimensional canopy fuel loading predicted using upward and downward sensing LiDAR systems. Remote Sens. Environ. 2011, 115, 703–714. [Google Scholar] [CrossRef]
- Bastianoni, A.; Chacón, N.; Méndez, C.L.; Flores, S. Decomposition dynamics of mixed litter in a seasonally flooded forest near the Orinoco River. Acta. Oecol. 2015, 64, 21–28. [Google Scholar] [CrossRef]
- Matthews, S.; Sullivan, A.L.; Watson, P.; Williams, R.J. Climate change, fuel, and fire behavior in a eucalypt forest. Glob. Change Biol. 2012, 18, 3212–3223. [Google Scholar] [CrossRef]
- Liu, Y.; Liu, Y.; Fu, J.; Yang, C.E.; Dong, X.; Tian, H.; Ke, Z. Projection of future wildfire emissions in western USA under climate change: Contributions from changes in wildfire, fuel loading and fuel moisture. Int. J. Wildland Fire 2021, 31, 1–13. [Google Scholar] [CrossRef]
- Aragoneses, E.; Chuvieco, E. Generation and mapping of fuel types for fire risk assessment. Fire 2021, 4, 59. [Google Scholar] [CrossRef]
- Woodall, C.W.; Charney, J.; Liknes, G.; Potter, B. Linking Fuel Inventories with Atmospheric Data for Assessment of Fire Danger. In Proceedings of the Sixth Annual Forest Inventory and Analysis Symposium, Denver, CO, USA, 21–24 September 2004. [Google Scholar]
Disclaimer/Publisher’s Note: The statements, opinions and data contained in all publications are solely those of the individual author(s) and contributor(s) and not of MDPI and/or the editor(s). MDPI and/or the editor(s) disclaim responsibility for any injury to people or property resulting from any ideas, methods, instructions or products referred to in the content. |
© 2024 by the authors. Licensee MDPI, Basel, Switzerland. This article is an open access article distributed under the terms and conditions of the Creative Commons Attribution (CC BY) license (https://creativecommons.org/licenses/by/4.0/).