Article

Climatic Indicators and Their Variation Trends as Conditions for Forest Flammability Hazard in the South of Tyumen Oblast

School of Natural Sciences, Tyumen State University, 625003 Tyumen, Russia
*
Author to whom correspondence should be addressed.
Fire 2024, 7(12), 466; https://doi.org/10.3390/fire7120466
Submission received: 6 November 2024 / Revised: 29 November 2024 / Accepted: 3 December 2024 / Published: 6 December 2024

Abstract

This study analyzes the forest flammability hazard in the south of Tyumen Oblast (Western Siberia, Russia) and identifies variation patterns in fire areas depending on weather and climate characteristics in 2008–2023. Using correlation analysis, we proved that the area of forest fires is primarily affected by maximum temperature, relative air humidity, and the amount of precipitation, as well as by global climate change associated with an increase in carbon dioxide in the atmosphere and the maximum height of snow cover. As a rule, a year before the period of severe forest fires in the south of Tyumen Oblast, the height of snow cover is insignificant, which leads to insufficient soil moisture in the following spring, less or no time for the vegetation to enter the vegetative phase, and the forest leaf floor remaining dry and easily flammable, which contributes to an increase in the fire area. According to the estimates of the CMIP6 project climate models under the SSP2-4.5 scenario, by the end of the 21st century, a gradual increase in the number of summer temperatures above 35 °C is expected, whereas the extreme SSP5-8.5 scenario forecasts the tripling in the number of such hot days. The forecast shows an increase of fire hazardous conditions in the south of Tyumen Oblast by the late 21st century, which should be taken into account in the territory’s economic development.

1. Introduction

Modern climate changes caused by natural and anthropogenic factors are reflected in many biosphere components [1] and human economic activity. These changes are registered both at the global and regional levels [1,2,3,4]. Climate transformation affects natural processes, such as river water content [5,6,7,8,9], vegetation periods [10,11], and the development of infectious disease threats [12,13], as well as various socio–economic processes, including the development of agricultural systems [14,15,16,17], forestry [18,19,20], the transition from traditional fuels to alternative sources [21,22], etc.
Climate change is closely linked to the greenhouse effect. One of the main greenhouse gases is carbon dioxide. Over the past 100 years, the content of carbon dioxide in the atmosphere has increased by 40% [4].
One significant consequence of climate change is the increasing prevalence of forest fires. The science dealing with the nature of forest fires, their consequences, and methods of forest fire fighting was founded by academician I.S. Melekhov in the 19th century and defined as forest pyrology [23].
Landscape, or natural, fire is an uncontrolled combustion process spontaneously occurring and spreading in the natural environment and affecting various components of the natural landscape. Forest fire is a type of landscape (natural) fire spreading through a forest [24]. In recent decades, the scale of global forest fires has increased due to climate change, in particular due to the increase in the duration of the fire-hazardous period [25].
The number of forest fires has increased over the past 20 years, especially in forested regions [26,27,28]. Their economic losses reach millions of dollars and cause premature deaths as a result of air pollution [29]. Many researchers cite climate change, as well as soil and vegetation characteristics, as the causes of forest fires [30,31]. The forest area in Russia reaches more than 800 million hectares [32].
An increase in the frequency and area of forest fires has been observed in Russia, especially in the extremely hot years of 2012, 2016, 2018, and 2019 [33]. The threats of forest loss caused by fires and other adverse factors, amplified by the effects of climate change, are growing [34]. In particular, it is noted that the higher number of forest fires leads to more carbon loss during fire and post-fire emissions, making forests lose their ability to absorb additional carbon or sustain the existing carbon reserves [35]. A.M. Tarko looked into the world dynamics of forest fires and observed that their total area had increased in the 2001–2019 period, while the area of large fires had decreased [36]. The models based on the detected patterns take into account climate change forecasts under different scenarios and show a close correlation between forest fire frequency and scale and the global warming parameters. A.M. Tarko noted that only the growing total areas and frequency of forest fires were associated with an increase in CO2 concentration. Another researcher, B.G. Sherstyukov [37], analyzed fire statistics provided by the Russian Federal State Statistics Service (hereinafter referred to as Rosstat) and showed that the number of forest fires had decreased over the past two to three years, while the area of burned forests had increased by 4–5 times. B.G. Sherstyukov’s study [37] found a close correlation between the number of fire-hazardous days and the number of forest fires in the European part of Russia, in the south of Western Siberia, and in some more western areas according to the Nesterov index, while the Pedya aridity index was a more universal indicator of changes in forest fire hazard throughout Russia, contributing 30 to 60% to the description of long-term changes in the number of forest fires in Russia [37]. The impact of climate change on the state of forest areas in Western Siberia, including Tyumen Oblast, characterized by the heterogeneity of climatic trends and diversity of forest cover, still remains the least studied issue [38,39].
Forest fires in Western Siberia are a significant and challenging issue affecting the preservation of taiga forests. Despite the fact that the Federal Forestry Agency (hereinafter referred to as Rosleskhoz) reported a decrease in forest fires in 2022, in 2023, fires engulfed 4 million hectares (compared to 3.5 million hectares in 2022). In 2023, the period of forest fires started earlier due to abnormal spring heat, which could not be forecast in advance. According to the data by Rosleskhoz, the increase in forest fire levels was mainly caused by the local residents’ actions, such as grass burning to prepare the land for cultivation [40]. The south of Tyumen Oblast was severely damaged, with the peak of fires covering over 5200 hectares [41]. As a result, at least 120 buildings were destroyed, residents of seven towns were evacuated, and one volunteer died helping extinguish the fires [41].
This study is aimed at analyzing the main climatic indicators as the conditions for the forest flammability hazard in the south of Tyumen Oblast and at determining their variation trends. To achieve the aim, we set the following objectives: (1) to generalize the fire statistics based on the data from the Tyumen Ministry of Emergency Situations; (2) to analyze climate change trends in the south of Tyumen Oblast from 1988 to 2023; (3) to perform a cross-correlation and regression analysis of the number and area of fires with the main meteorological characteristics in Tyumen and Ishim; and (4) to assess possible climate change by the end of the 21st century according to two general socio-economic pathways—SSP5-8.5 (extreme) and SSP2-4.5 (optimal)—using CMIP6 models.

2. Materials and Methods

2.1. Data Sets and Basic Statistical Methods

Tyumen Oblast is one of the regions most endowed with forest land. According to registration data, as of 1 January 2023 [42], forest land covers 6.87 million hectares (42.9% of the total forest land area of Tyumen Oblast). Thirty-seven percent of this is represented by valuable coniferous species, and 63% by soft-leaved trees. The Tyumen Oblast ecoregions include southern taiga, sub-taiga, and forest-steppe. This present study focuses on sub-taiga and forest-steppe. The data for these regions were taken from weather stations in Tyumen (sub-taiga) and Ishim (forest-steppe).
To analyze the main climatic indicators as the conditions for the forest flammability hazard in the south of Tyumen Oblast and to determine their trends in the present and future, big datasets were used in this study, including satellite information, data from weather stations, data from Tyumen Ministry of Emergency Situations, and global climate models. The general scheme of the stages of the analysis is presented in Figure 1.
Remote sensing methods allow for obtaining objective information on the state of forests and assessing the spatiotemporal dynamics of disturbed areas. Archives of space photography data of the Earth’s surface allow for determining the area of burned forest and assessing post-pyrogenic processes. Images were obtained with TM, ETM+, and OLI cameras (Landsat series satellites, NASA, Washington, DC, USA), as well as MODIS camera images (Terra and Aqua satellites, NASA), which were widely used to monitor fires [43].
The number and area of fires in the south of Tyumen Oblast were determined based on the analysis of multi-temporal multispectral space images Landsat-5/TM and Landsat-8/OLI, using the QGIS software package. The space images were taken with a spatial resolution of 30 m with minimal cloud cover and atmospheric haze during the summer periods from 1998 to 2023.
Landsat satellites have found wide application in studying fire dynamics. Data from the TM (Thematic Mapper, NASA) instrument, which has a spatial resolution of 30 m, have been available since 1982 [43]. The instrument has six spectral channels, including those needed to assess the effects of fires, as well as one thermal channel. In 2012, the Landsat-5 satellite was decommissioned.
The Landsat-8 satellite with the Operational Land Imager (multi-channel scanning radiometer) and Thermal Infrared Sensor (scanning dual-channel IR radiometer) instruments was launched into orbit in 2013. These instruments made it possible to continue receiving data for the Landsat program, maintaining the characteristics and quality of the data at the level of previous satellites in the program. Table 1 presents the main technical characteristics of Landsat space images.
To identify the correlation between climatic parameters and the number and area of forest fires in the south of Tyumen Oblast, we analyzed the average annual series of meteorological parameters, such as air temperature (average T, average maximum T, absolute maximum T, and average T during the fire hazard period from April to October), wind speed (average V), relative air humidity (average f), amount of precipitation (P), and maximum snow depth (h) according to weather stations in Tyumen (57.12° N, 65.43° E) and Ishim (56.10° N, 69.43° E) for the period from 1988 to 2023. We carried out an analysis of long-term meteorological parameter series using weather archives and climatic research data from the Russian Research Institute of Hydrometeorological Information [44,45]. The results obtained throughout the study allow us to determine specific climatic features particular to the south of Tyumen Oblast.
In order to predict climate change in Tyumen Oblast by the late 21st century, under two scenarios, SSP2-4.5 (optimal) and SSP5-8.5 (extreme), we took the data from the IPCC AR6 interactive atlas [46]. The atlas contains all the CMIP6 project models interpolated into one common grid with a step of 1°. All characteristics related to air temperature and solid precipitation were extracted from the data, namely:
  • Monthly average daily air temperatures (in °C, code “t”, 34 models in both scenarios);
  • Monthly average maximum daily air temperatures (in °C, code “tx”, 27 models in both scenarios);
  • Monthly average values of daily snow precipitation (in mm, code “prsn”, 29 models in both scenarios);
  • Number of consecutive dry days by year (in days, code “cdd”, 31 models for SSP2-4.5 scenario and 32 models for SSP5-8.5 scenario);
  • Number of days with temperatures above 35 °C by month (in days, code “tx35”, 27 models in both scenarios).
This study used standard statistical methods such as linear trend analysis, cross-correlation analysis, linear and multiple regression, etc. All weather station data sets were tested for normal distribution (Figure A1). The obtained linear trends and correlations passed the significant test.
To evaluate the linear trend for significance, Student’s criterion was used. The trend is considered significant if Student’s criterion estimates exceed its critical value at a given significance level, i.e.:
t > t κ p ( φ , ν n 2 )
where φ is the significance level (in hydrometeorology 0.95), and ν is the degree of freedom. The empirical criterion t can be calculated using the formula:
t = r n 2 1 r 2
where r is the correlation coefficient between x and y . In the case of a linear trend, the coefficient of determination is equal to the square of the correlation coefficient, i.e., R 2 = r x y 2 .

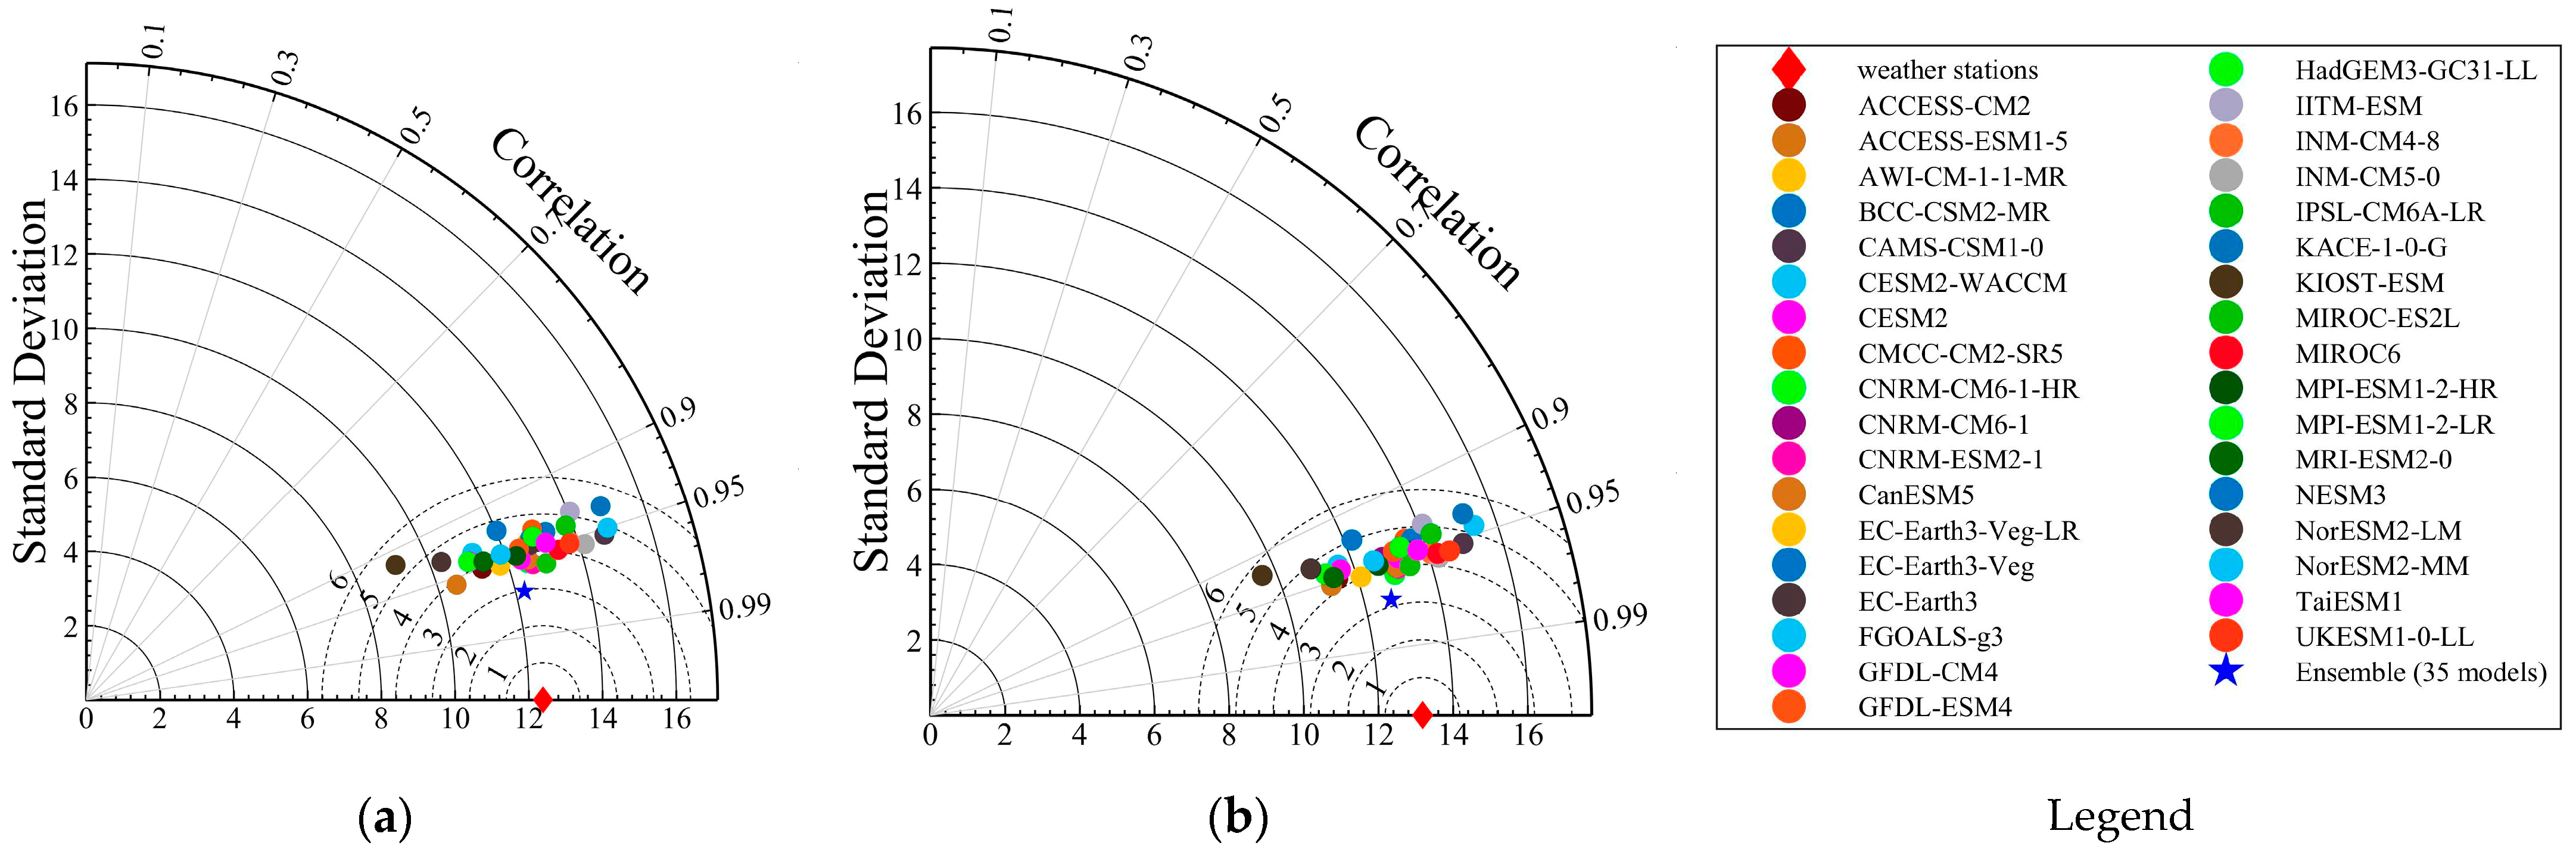
2.2. Verification of CMIP6 Models

The sixth IPCC Assessment Report (IPCC AR6) contains numerical calculations of sixth-generation CMIP climate models. CMIP is a forecast project contributing to the understanding of past, present, and future climate changes [47]. Researchers have developed new scenarios of carbon dioxide concentration variations (CO2) for the sixth-generation models (CMIP6), with an account for various socio–economic development paths [48,49]. By using these scenarios, various educational and scientific organizations all over the world have developed five climate change variations called Shared Socioeconomic Pathways (SSP) [47]. Two scenarios, namely SSP5-8.5 and SSP2-4.5, are most commonly considered by researchers. SSP5-8.5 is an extremely negative scenario, with high consumption of fossil fuels, solar radiation reaching 8.5 W/m2 by 2100, and the concentration of CO2 growing up to 1100 ppm (0.11%) [48]. SSP2-4.5 provides for climate protection measures, solar radiation of 4.5 W/m2, and the concentration of CO2 reaching 600 ppm (0.06%) by 2100. This scenario is a median of all possible global social development paths [48].
The CMIP6 models from the IPCC AR6 interactive atlas [46] were verified with monthly average air temperatures from Tyumen (57.12° N, 65.43° E) and Ishim (56.10° N, 69.43° E) weather stations using the calculating RMSE (root mean square errors) and correlation coefficients (a statistical measure of the strength of a linear relationship between two variables). All 35 models included in the IPCC AR6 interactive atlas were selected for testing. In order to obtain time series at Tyumen and Ishim, the model data were interpolated onto a finer-scale grid with a 0.25° step using the “nearest neighbor” method. By the resulting fine-scale grid the model time series of air temperature were obtained for two points (Tyumen and Ishim) using “spline interpolation” with taking into account the underlying surface. The result of verification is demonstrated using Taylor Diagrams (Figure 2). The diagrams show the differences between CMIP6 models and their ensembles relative to the observation data in Tyumen (Figure 2a or Figure A2 in high resolution) and Ishim (Figure 2b or Figure A3 in high resolution).
All 35 models have a high significant correlation (r > 0.9) with the observational data of average monthly air temperatures, but the RMSE values fluctuate from 3.5 to 5.5 °C. But if we look at the ensembles of 35 models for Tyumen and Ishim, the correlation indices improve (r = 0.97), and the RMSE decreases to 3.2 °C (Figure 2). Thus, it is better to take an ensemble of models and use them for the SSP5-8.5 and SSP2-4.5 scenarios to obtain possible estimates of the long-term climate forecast in the south of Tyumen Oblast by the end of the 21st century.

3. Results

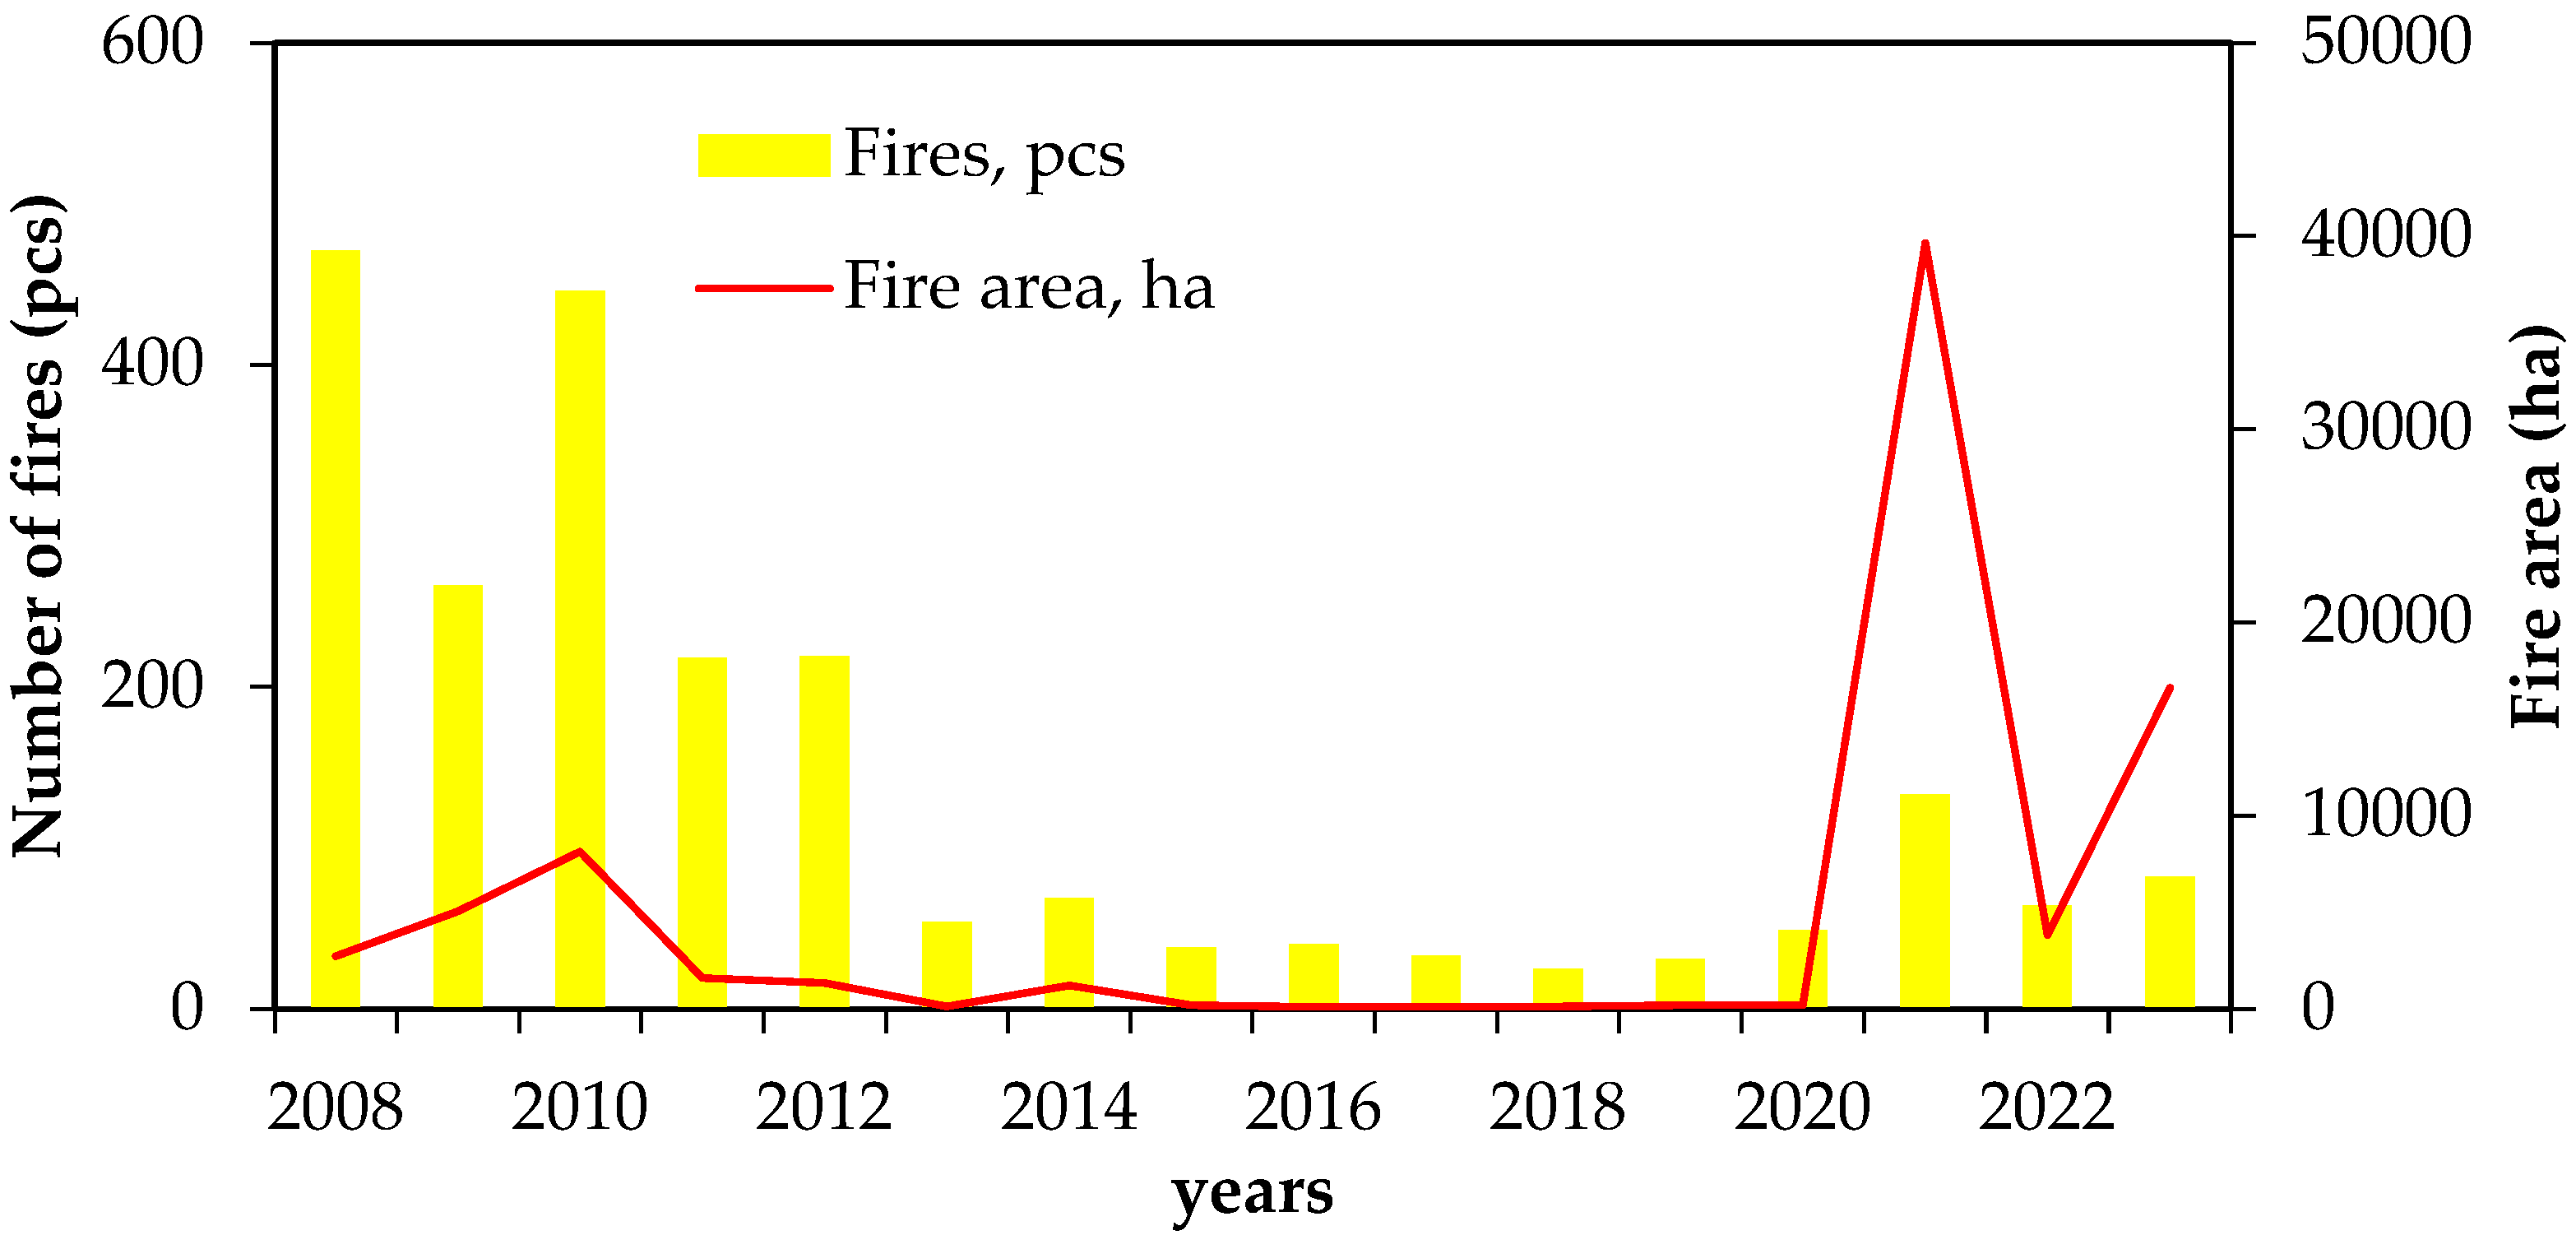
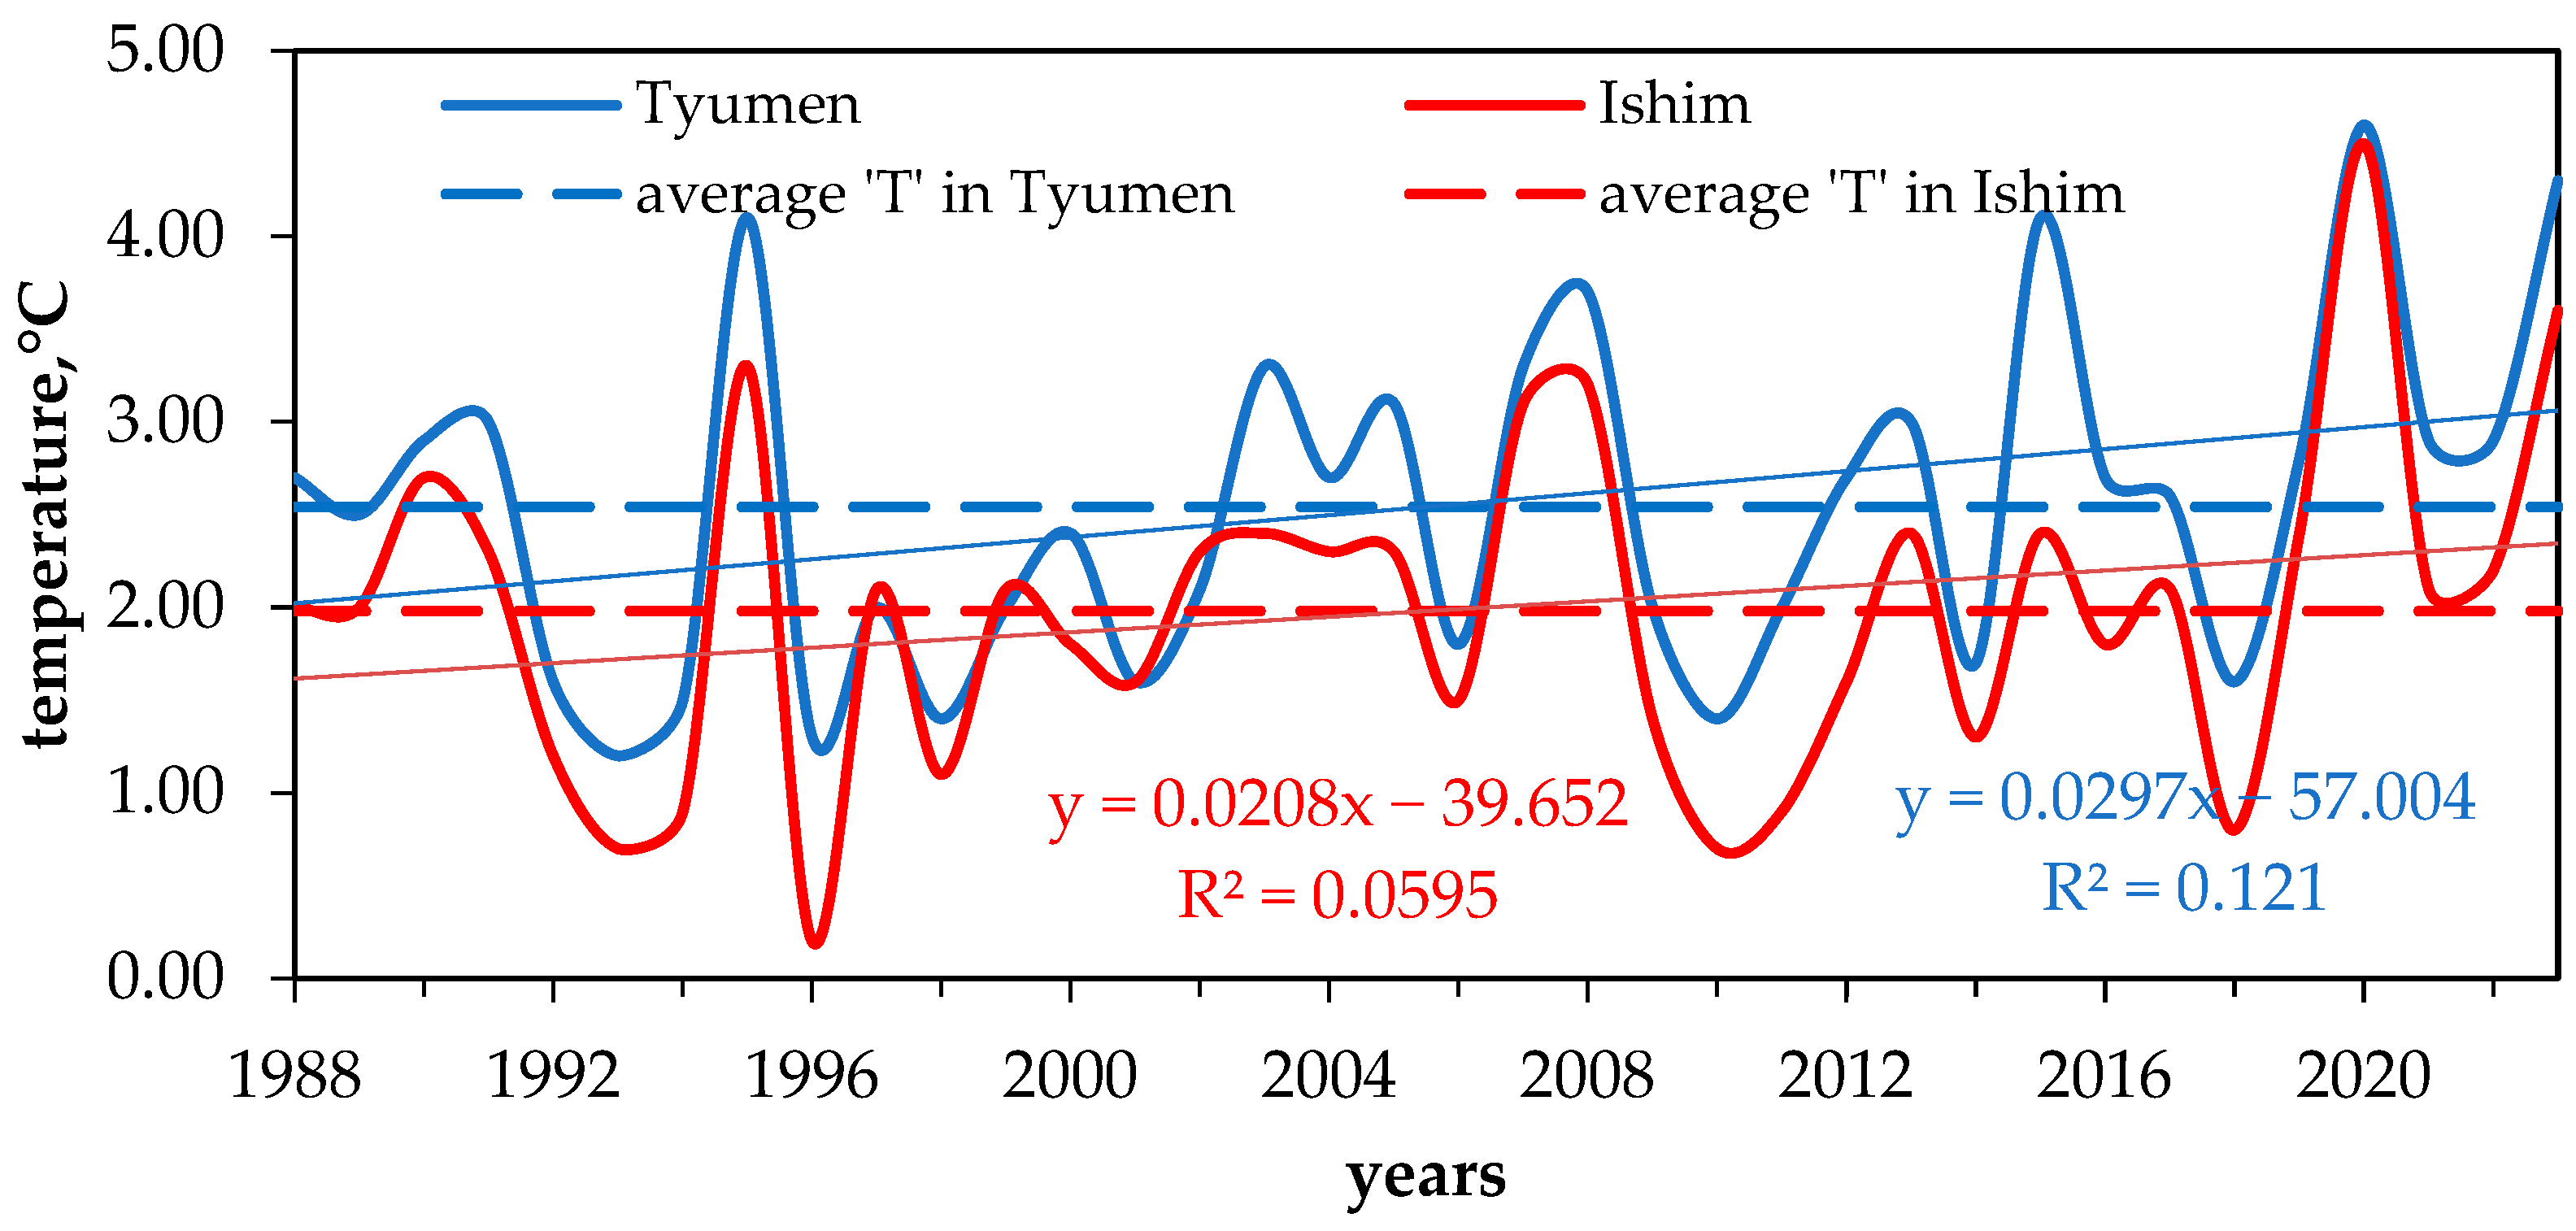
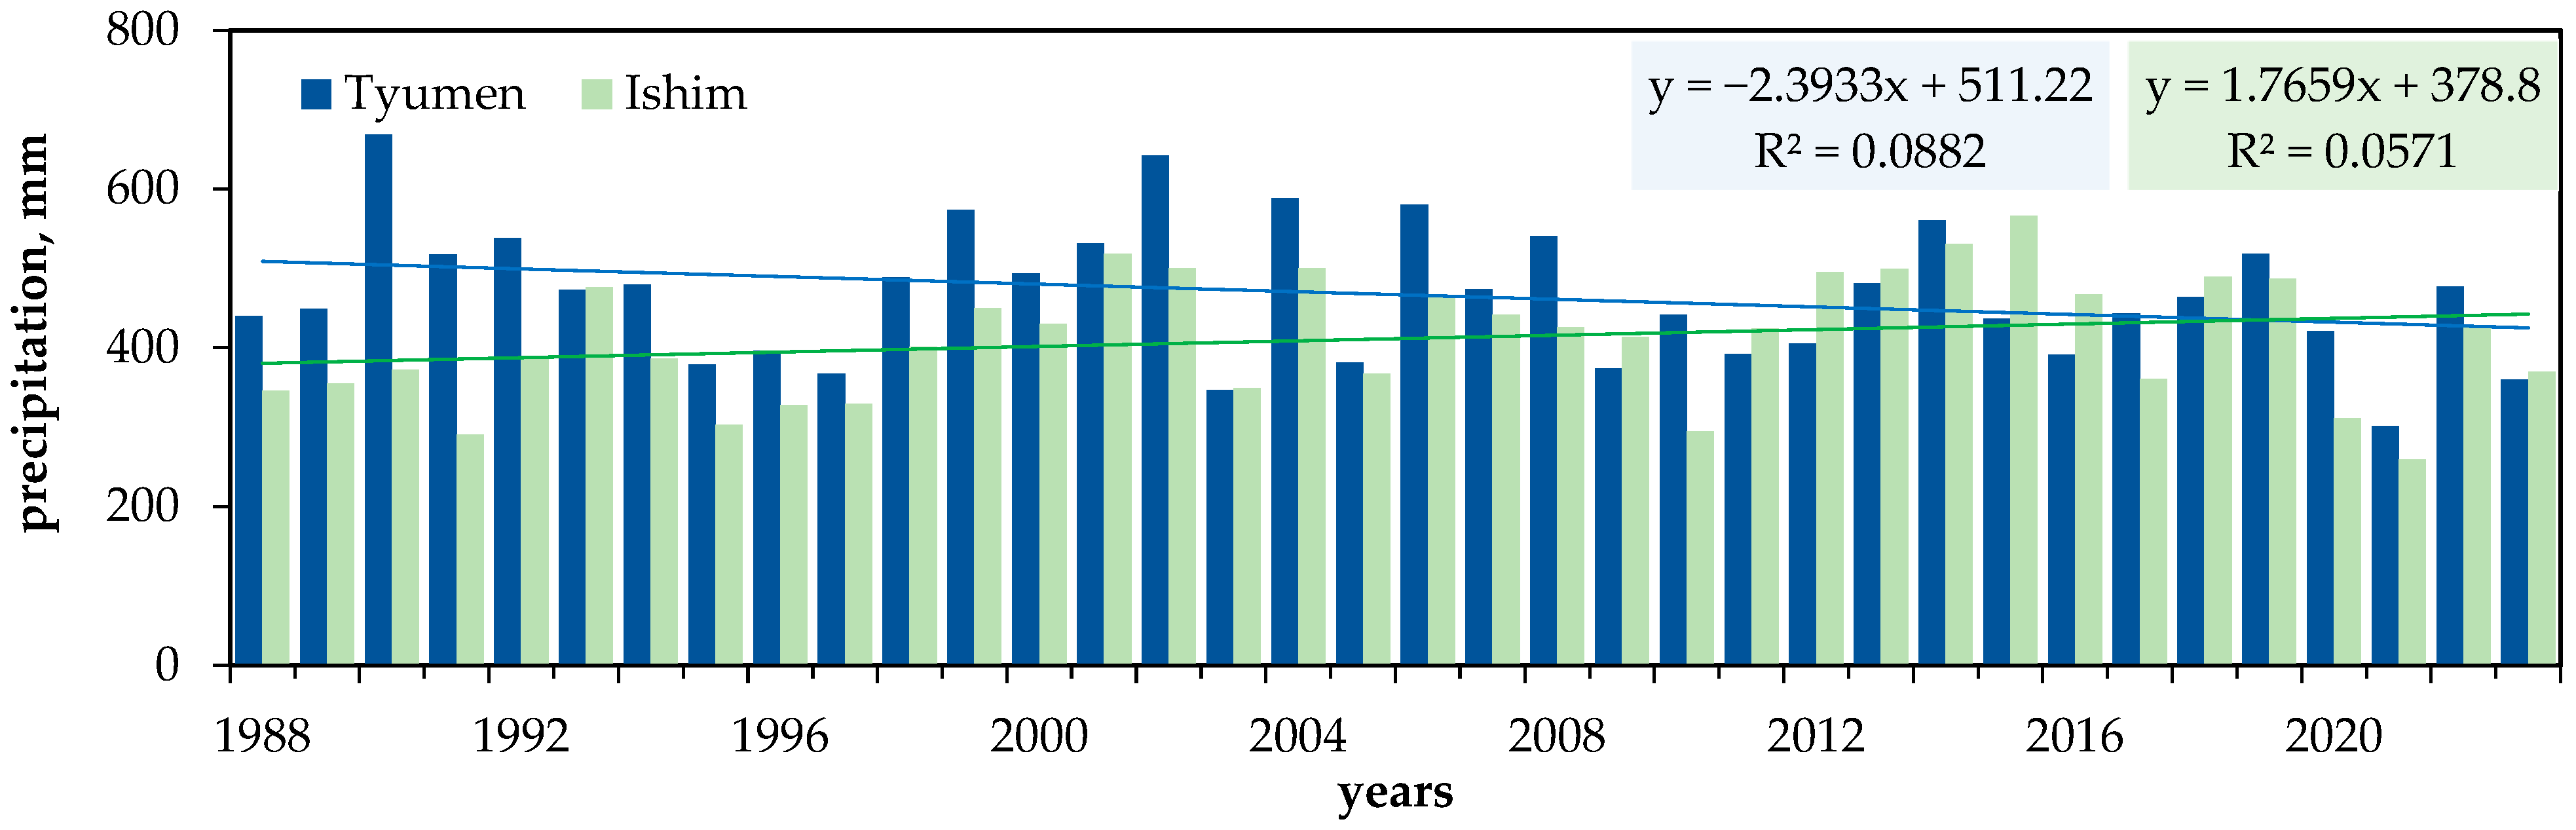
3.1. Climate Indicators, Their Trends, and Correlation with Wildfires

In space images of Tyumen District (Figure 3), with combinations of channels 7-4-2 for LANDSAT-5/TM and 7-5-3 for LANDSAT-8/OLI, areas that were subject to fires in certain years are clearly visible and differ from the territory untouched by fire; the burnt area stands out as a red-brown area against the background of preserved vegetation.
Forest vegetation areas affected by fires are characterized by reduced spectral brightness in the near-infrared zone (NIR). This is explained by a decrease in the chlorophyll content in the vegetative organs of drying trees. Burnt areas are also characterized by an increase in spectral brightness in the middle infrared zone (SWIR). This, in turn, is explained by a decrease in the moisture content in leaves or needles. In the visible zone of the spectrum, burnt areas are characterized by a higher spectral brightness than healthy vegetation. This is also explained by a decrease in chlorophyll content, which is externally manifested in the defoliation and discoloration of leaves when trees dry out.
After analyzing the dynamics of wildfires within the period from 2008 to 2023 in the south of Tyumen Oblast, we concluded that the years 2008, 2009, and 2010 were the most fire-hazardous in terms of the frequency of fires, with 471 fires, 263 fires, and 446 fires, respectively (Figure 4). Judging by the area of fire spread, the year 2021 stands out, with 39,644.47 hectares of forests destroyed by fire, in addition to 8133.77 hectares in 2010 and 16,617.24 hectares in 2023.
The city of Tyumen is located on the Tura River, in the southwestern part of the West Siberian Lowland, at 57°09’ N, 65°32’ E. Ishim is a city in the south of Tyumen Oblast located on the left bank of the Ishim River at 56°06’ N and 69°30’ E. After analyzing long-term air temperature series based on meteorological data, we discovered a trend towards an increase in the average annual air temperature in 1988–2023 in both cities in the south of Tyumen Oblast (Figure 5). According to meteorological indicators in Tyumen, the average air temperature in 1988–2023 was 2.5 °C, with a warming rate of 1.1 °C over 36 years (statistically significant trend at 95% confidence level). As for Ishim, the air temperature increased by 0.7 °C during the period under study, with an average annual value of 2.0 °C (statistically significant trend at 90% confidence level). Moreover, the average air temperatures in the sub-taiga zone of Tyumen are higher than those in the forest–steppe zone of Ishim, which means that the warming trend in the north of Tyumen is higher than the one in the south of Ishim. Also, we observed a trend of increasing average monthly temperatures during the fire hazard period (Table 2), which also lengthens (by 22 days over the past 5 years) when high air temperatures are recorded for 2–3 days in April. During the study period, we recorded the highest average air temperatures in 1995, 2008, 2020, and 2023. The minimum values of the average annual air temperature typical for Ishim and Tyumen were noted in 1993, 2010, and 2018. The years 1996 (with +0.2 °C) and 2016 (with the lowest value of −0.1 °C recorded) were exceptional for Ishim.
It is worth noting that average air temperatures increase due to high spring and autumn indicators, with the rate of temperature growth in spring almost three times higher than in autumn. The results obtained are consistent with the latest 2022 report [53] made by the Federal Service of Russia on Hydrometeorology and Monitoring of the Environment (hereinafter referred to as Roshydromet). For Western Siberia, within the boundaries of Tyumen Oblast, the report records the most intense warming in spring (+0.78 °C/10 years). As a result, May and October become warmer.
The average annual precipitation in Tyumen was 470.5 mm, with a significant decrease trend (Tr = −23.9 mm/10 years, p < 0.1, R2 = 0.09) in 1988–2023 according to the data collected by Tyumen Meteorological Station. The highest level of precipitation in Tyumen was recorded in 1990 (667.8 mm, the maximum value for the entire study period in the south of Tyumen Oblast) and in 2002 (642 mm). The minimum annual precipitation was recorded in 1997 (367 mm), 2003 (347 mm), 2021 (295.7 mm), and 2023 (310.1 mm) (Figure 6). As for Ishim, over the period of study, the average long-term annual precipitation was 412.7 mm, with an increasing trend (Tr = 17.7 mm/10 years, non-significant value). The maximum precipitation was recorded in 2015 (566.3 mm), while the minimum value was recorded in 2021 (with 262.8 mm being the lowest annual precipitation level for the period of 1988–2023 for the south of Tyumen Oblast) (Figure 6).
Air humidity is a significant pyrogenic indicator reflecting the amount of water vapor in the air at a given temperature [54]. According to the data collected by the Tyumen Meteorological Station, in 1988–2023, the average long-term annual relative air humidity was 72%, with a non-significant decrease trend (Tr = −0.4%/10 years) (Figure 7). Over the period under study, the minimum average annual relative air humidity in Tyumen was observed in 1988 (69%), 2021 (67%), and 2023 (69%), whereas the maximum average annual values of relative air humidity were recorded in 1990 (75%), 2000 (76%), and 2002 (76%) (Figure 7). As for Ishim, according to the meteorological station in the city, the average long-term relative air humidity differed slightly from the values in Tyumen and was 73%, with an insignificant downward trend (Tr = −0.3%/10 years). Over the period of 1988–2023, the maximum relative air humidity in Ishim was observed in 2015 and 2016 (77%), while the minimum levels were in 2021 (66%) and 2023 (68%) (Figure 7).
Another indirect climate indicator of the flammability hazard on a particular territory is snow cover determining the soaking depth of the forest floor. In Tyumen, the maximum snow cover was recorded in 1999 (72 cm) and 2001 (75 cm), while the minimum values were observed in 2004 (37 cm), 2006 (32 cm), and 2009 (37 cm) (Figure 8). The average maximum snow depth was 50 cm, with an insignificant decrease trend (Tr = −0.13 cm/10 years).
The changes in the maximum snow depth in Ishim are more ambiguous (Figure 8) in comparison with Tyumen, and the tendency for snow depth to decrease is higher here (Tr = −0.13 cm/10 years, non-significant value). The maximum values were observed in 1994 (115 cm), 2001 (74 cm), and 2001 (82 cm). The minimum snow depth values were recorded in 2004 (33 cm), 2006 (29 cm), 2008 (32 cm), and 2022 (31 cm). The average snow cover level was 50 cm.
In order to identify the correlation between the number of forest fires and their area, we conducted a cross-correlation analysis considering the statistical significance of the major annual meteorological parameters in the south of Tyumen Oblast with and without a one-year shift (Table 3). The analysis showed a significant direct association between the area of fires, the absolute maximum annual temperature (r = 0.72), and the average temperature during a fire hazard period (r = 0.49), as well as a significant inverse association between the area of fires and relative humidity (r = −0.82) and precipitation (r = −0.62). Following these observations, we conclude that, in the south of Tyumen Oblast, the area of fires will increase regardless of the number of fire outbreaks in the year when maximum temperature indicators are recorded together with a decrease in the amount of precipitation and relative air humidity. The regression model showing the changes in the fire area can describe 52% dispersion depending on the absolute temperature maximum, 66% dispersion depending on the specific humidity, 39% dispersion depending on the amount of precipitation, and 24% dispersion depending on the temperature during a fire hazard period. The multiple regression model of the dependence of the fire area on four climatic conditions, with which a significant high correlation was obtained, has a high multiple correlation (r = 0.85, strong relationship) and can describe 72% of the fire area variability in the south of Tyumen Oblast. The resulting multiple regression equation is:
Fire area = 230,158.24 + 540.5∙Tabs_max  − 3302.96∙f − 29.56∙P + 536.24∙Tfire_hazard_period
where the only statistically significant coefficient is relative air humidity.
The correlation with a one-year shift shows that the fire area is directly associated with the average temperature (r = 0.56) and average maximum air temperature (r = 0.50) (Table 3). As has been determined, the air temperature in the south of Tyumen Oblast is increasing due to climate change, which, as we assume, will be associated with the growing area of forest fires in the coming years. An insignificant weak inverse association between the area of forest fires and the maximum snow depth (r = −0.37) is also recorded. Indeed, we can trace a connection in a situation when little snow falls a year before severe fires, leading to insufficient soil moisture in the following spring. In case high air temperatures are recorded for a short period (1–2 weeks in April and May), with no precipitation, this leads to low humidity, little or no time for vegetation to reach the vegetation phase (there are no green shoots in the soil), and the forest floor remains dry and easily flammable, which contribute to an increase in the fire area in the south of Tyumen Oblast. The regression model showing the changes in the fire area with a one-year shift can describe 31% dispersion depending on the average annual air temperature, 24% dispersion depending on the average maximum air temperature, and 13% dispersion depending on the snow depth.

3.2. Forecast Assessments of Climate Indicators by Models

Based on 34 global climate models of the sixth-generation CMIP project, under the optimal scenario SSP2-4.5, a continued increase of surface air temperature in Tyumen Oblast is expected (Figure 9a). Within the period starting from 2024 to the end of 2100, the average warming rate will be 0.39 °C/10 years, and the average value of the series will shift to 3.98 °C (currently, the average value has been 1.90 °C in 1988–2023). In spatial differentiation, the SSP2-4.5 scenario shows that the warming will be slightly faster in the north and south of Tyumen Oblast and will amount to 0.46 °C/10 years on average (Figure 9a). Under the optimal development scenario, by the late 21st century, the average warming rate will not exceed 0.4 °C/10 years over 80% of the territory.
Under the extreme SSP5-8.5 scenario, with the increase of carbon dioxide in the atmosphere, the warming in the south of Tyumen Oblast is expected to double. By the end of the 21st century, the average rate of surface air temperature increase will be 0.9 °C/10 years (Figure 10b) and the average series value will increase by almost four degrees (up to 5.59 °C) in relation to the previous period. If we consider the distribution of air temperature trend values, by the late 21st century, the warming rate in the north and the south of Tyumen Oblast will be 1 °C every 10 years.
Similar to the average monthly temperatures in Tyumen Oblast, by the end of the 21st century, the average maximum temperatures will also increase under two development scenarios. Over 85% of the region’s territory, the average increase rate of the maximum daytime temperatures will be 0.4 °C/10 years under SSP2-4.5 and 0.9 °C/10 years under SSP5-8.5 (Figure 10).
As stated in Section 3.1, the maximum snow depth will be one of the determining climatic factors of fire hazard conditions for the next year. The IPCC AR6 interactive atlas only contained data on the average monthly values of average daily snow precipitation (mm), which were used to calculate the trend values for two SSP development scenarios. In both cases, the trends are negative, i.e., the amount of snow precipitation is expected to be less. However, under SSP2-4.5, the decrease rate of the average daily snow accumulation will be −0.01 mm/10 years in the north of Tyumen Oblast (Figure 11a), and with SSP5-8.5, it is expected to be −0.02 mm/10 years in the south and in the center of Tyumen Oblast (Figure 11b).
We chose the number of hot days with temperatures above 35 °C by month and the number of consecutive dry days by year as extreme characteristics for obtaining a relatively reliable long-term climate forecast by the late 21st century for the south of Tyumen Oblast, as both parameters are important when assessing fire hazard conditions.
According to the CMIP6 climate models, under the optimal SSP2-4.5 scenario, a gradual increase in the number of summer temperatures above 35 °C is expected in the region. By the end of 2050, the forecast expects 79 hot days on average, 93 such days by 2075, and 119 such days by 2100 (Figure 12a). Under the extreme scenario, with an increase in carbon dioxide, the picture will change dramatically. Firstly, by the late 21st century, the number of days with temperatures above 35 °C will increase threefold. Secondly, extremely hot days may now occur in May and September, which has almost never happened before throughout the entire history of observations. The total average number of days with air temperatures above 35 °C will be 96 by 2050, 160 by 2075, and 320 by 2100 in the south of Tyumen Oblast (Figure 12b).
As for the dry days forecast, we also assessed it using 25-year time periods. Under the optimal SSP2-4.5 scenario for the region, by the end of 2050, the total annual number of consecutive dry days on average will reach 577 days over 25 years, 580 consecutive dry days by 2075, and 583 consecutive dry days by 2100. Under the extremely unfavorable SSP5-8.5 scenario, the total annual number of consecutive dry days on average will be 591 days by the end of 2050, 584 days by 2075, and 600 days by 2100 (Figure 13). As we see, the general trend is positive in both scenarios, but not as critical as in the case of a total increase in temperatures above 35 °C.
The results obtained in this study can be used to develop an adaptation strategy with an account for future climate change and increased pyrogenic hazard in the south of Tyumen Oblast.

4. Discussion and Conclusions

This study assesses the forest flammability hazard in the south of Tyumen Oblast (a region in Western Siberia, Russia) based on the analysis of alternation patterns in weather and climate characteristics. Within the period of 2008 to 2023, 2235 fire outbreaks were registered in the study area, while the total burnt area amounted to 81,162.63 hectares. It is important to note that the number of arson attacks does not depend on meteorological characteristics, unlike the fire spread area. From 2008 to 2012, there were four times more fires recorded in the south of Tyumen Oblast than in the period from 2013 to 2019, although the area of forest fires has increased sharply in recent years. Similar fire dynamics were recorded in the USA [55], but this was associated with the suppression costs in certain periods. According to the forest plan of Tyumen Oblast dated 16 May 2023 [56], from 2009 to 2019, funding for extinguishing forest fires was higher than for the period from 2019 to 2023. This may indirectly explain the decrease in the number of fires from 2013 to 2019. In the current decade, however, the dynamics of the fire area in the south of Tyumen Oblast have been adjusted by climate change.
This work concludes that the fire spread area will be primarily affected by the temperature maximum, the average temperature during the fire-hazardous period from April to October, relative air humidity, and the amount of precipitation. This study found a statistically significant direct association between the fire area in the south of Tyumen Oblast and the absolute maximum temperature (r = 0.72), temperatures during a fire hazard period (r = 0.49), relative air humidity (r = −0.82), and precipitation (r = −0.62). The obtained multiple regression model of the dependence of the fire area on four climatic conditions has a higher multiple correlation (r = 0.85) and can describe 72% of the fire area variability. Based on the obtained correlations, we concluded that the forest fire areas in the south of Tyumen Oblast will increase regardless of the number of fire outbreaks in the year when maximum air temperatures are recorded in combination with decreased precipitation and relative humidity. Similar conclusions about the climate change impact on fire areas were found in many other regions; for example, in the USA [57], Iran [32], China [30], Argentina [58], etc. As studies [59,60,61] have shown for other global regions, the lack of a reliable connection between the number of fires and climate indicators is associated with anthropogenic causes of fires. The number of fires can be affected by the distance to populated areas, roads, infrastructure facilities, and recreation areas. Natural causes (for example, thunderstorms and unspecified causes) make up no more than 25% in Tyumen Oblast [50,51,52], and the remaining 75% are caused by humans and their activities. In addition, fires caused by human activity can occur in more humid and windy conditions than fires caused by natural factors [60]. Our work once again confirms that climate is a significant factor influencing forest fire occurrences, which inevitably take place under certain climatic and meteorological conditions.
In addition, the area of forest fires is affected by climate change associated with an increase in carbon dioxide in the atmosphere and the maximum height of snow cover. A year before severe fires in the south of Tyumen Oblast, little snowfall, resulting in less soil moisture in the following spring; less or no time for vegetation to enter the vegetation phase; and the forest floor remaining dry and easily flammable contribute to the increased area of forest fires.
According to the estimates made in the CMIP6 project climate models, the optimal SSP2-4.5 scenario forecasts a gradual increase in the number of summer temperatures above 35 °C in the south of the study area. Under the extreme SSP5-8.5 scenario, by the late 21st century, the number of days with temperatures above 35 °C will increase threefold, and, more importantly, such days are expected not only in summer but also in May and September. At the moment, such temperatures have never been recorded in the south of Tyumen Oblast before except for the summer period. The tendency towards the increasing number of dry days is positive under both scenarios, but not as critical as in the case of a total increase in temperatures above 35 °C. We may assume that fire-hazardous climatic conditions in the south of Tyumen Oblast will increase by the late 21st century, but the atmospheric circulation and heavy precipitation may also intensify.
Determining the development patterns not only presents certain scientific interest but also great practical importance, as it can assist local authorities in planning measures to preserve the ecological potential of Western Siberian forests, the development of a climate passport for the territory, adapting to climate change, and reducing the risk of fire hazard in the region. The obtained estimates of possible future climate changes based on the CMIP6 models can provide effective reference and information support for the Tyumen Ministry of Emergency Situations in forecasting future cases of forest fires, their prevention, and their mitigation, as well as the development of sustainable forest management. The limitation of this work is the lack of the mechanism of the climate change impact on the fire area, which is not explained and which is a common omission of many authors [62]. Monthly fire statistics would help the study to identify more detailed relationships between the fire numbers and the fire area with intra-seasonal and inter-annual climate variations. Future research may consider monthly fire statistics to identify a more detailed correlation between the number and the area of fires with intra-seasonal and inter-annual climate variations. A limitation of this study may be the period of data collection from 1988 to 2023, which is due to the lack of quality space images for this area. Another limitation is the lack of indicators on the area and number of forest fires for the period earlier than 2008. Moreover, Tyumen Oblast has a limited number of meteorological stations with a long series of observations of climatic indicators. These limitations can be removed in future studies by using additional materials from archival sources.

Author Contributions

Conceptualization, E.K. and O.M.; methodology, O.M., V.K. and A.P.; software, O.M.; validation, O.M., N.Z. and N.M.; formal analysis, E.K., O.M., V.K., A.P., N.Z. and N.M.; investigation, E.K., O.M. and V.K.; resources, E.K.; data curation, E.K., O.M., V.K. and A.P.; writing—original draft preparation, E.K., O.M., V.K., A.P., N.Z. and N.M.; writing—review and editing, E.K. and O.M.; visualization, O.M.; supervision, E.K.; project administration, E.K.; funding acquisition, E.K. All authors have read and agreed to the published version of the manuscript.

Funding

This study was supported by the Russian Science Foundation, RSF 24-27-00354, https://rscf.ru/project/24-27-00354/ (accessed on 1 June 2024).

Data Availability Statement

The datasets generated and/or analyzed during the current study are available from the corresponding author upon reasonable request. CMIP6 main variables were taken from Copernicus Climate Change Service (C3S) (2023) (Gridded monthly climate projection dataset underpinning the IPCC AR6 Interactive Atlas. Copernicus Climate Change Service (C3S) Climate Data Store (CDS). DOI: 10.24381/cds.5292a2b0). https://cds.climate.copernicus.eu/datasets/projections-climate-atlas?tab=overview (accessed on 1 December 2024).

Acknowledgments

The team of authors would like to thank the Impulse Academic Writing Center of Tyumen State University for professional language editing of the article.

Conflicts of Interest

The authors declare no conflicts of interest.

Appendix A

Figure A1. Empirical distribution functions (blue columns) and their normal distributions (red line) of four annual meteorological characteristics in Tyumen and Ishim from 1988 to 2023.
Fire 07 00466 g0a1
Figure A2. Taylor diagrams comparing the CMIP6 models and their ensembles with observed data of the air temperature at the Tyumen weather stations during 1988–2023.
Fire 07 00466 g0a2
Figure A3. Taylor diagrams comparing the CMIP6 models and their ensembles with observed data of the air temperature at the Ishim weather stations during 1988–2023.
Fire 07 00466 g0a3

References

  1. IPCC. Climate Change 2021: The Physical Science Basis. Contribution of Working Group I to the Sixth Assessment Report of the Intergovernmental Panel on Climate Change; Masson-Delmotte, V., Zhai, P., Pirani, A., Connors, S.L., Péan, C., Berger, S., Caud, N., Chen, Y., Goldfarb, L., Gomis, M.I., et al., Eds.; Cambridge University Press: New York, NY, USA, 2021. [Google Scholar]
  2. Noskova, E.V.; Vakhnina, I.L. Analysis of modern spatio-temporal changes in air temperature in the Trans-Baikal Territory. Geogr. Bull. 2023, 1, 116–126. [Google Scholar] [CrossRef]
  3. Yasyukevich, V.; Govorkova, V. (Eds.) The Second Assessment Report of Roshydromet on Climate Change and Its Consequences on the Territory of the Russian Federation; Roshydromet: Moscow, Russia, 2014; Available online: https://cc.voeikovmgo.ru/images/dokumenty/2016/od2/od2full.pdf (accessed on 8 April 2024). (In Russian)
  4. IPCC. Climate Change 2023: Synthesis Report. Contribution of Working Groups I, II and III to the Sixth Assessment Report of the Intergovernmental Panel on Climate Change; Lee, H., Romero, J., Eds.; IPCC: Geneva, Switzerland, 2023; p. 184. [Google Scholar] [CrossRef]
  5. Shaidyldaeva, N.M.; Usubaliev, R.A.; Mandychev, A.N. Climate change on the water content of the Chichkan and Ba-la-Chychkan rivers of the Ketmen-Tyube basin. Sci. New Technol. Innov. Kyrg. 2022, 3, 87–92. [Google Scholar] [CrossRef]
  6. Zhaparkulova, E.D.; Bazhanova, L.V.; Kalieva, K.E.; Nabiollina, M.S. Trend of climate change at the present stage, forecast for the period up to 2050 and its impact on the water content of rivers fed by glaciers and snow (using the example of the trans-boundary Kurkureu-Suu river, Talas basin). Hydrometeorol. Ecol. 2019, 4, 70–83. Available online: https://cyberleninka.ru/article/n/tendentsiya-izmeneniya-klimata-na-sovremennom-etape-prognoz-na-period-do-2050-g-i-ego-vliyanie-na-vodnost-rek-lednikovo-snegovogo/viewer (accessed on 8 April 2024). (In Russian).
  7. Semenova, A.A.; Goncharov, A.V. The influence of climate change on the water content and hydrochemical regime of the Pakhra River in winter. Problems of ecology of the Volga basin. In Proceedings of the 7th All-Russian Scientific Conference, Nizhny Novgorod, Russia, 27–29 November 2022; Volume V, p. 49. Available online: https://elibrary.ru/download/elibrary_53745862_69746072.pdf (accessed on 8 April 2024). (In Russian).
  8. Saipov, B.S.; Beyshekeev, K.K.; Kalybek, U.M. Climate change and its impact on river water content. News Univ. 2015, 1, 13–14. Available online: https://elibrary.ru/download/elibrary_23931918_76703164.pdf (accessed on 1 December 2024). (In Russian).
  9. Kuznetsova, V.; Kuznetsova, E.; Kushanova, A. Geographic information mapping of flood zones for sustainable development and urban landscape planning. In Proceedings of the International Multidisciplinary Scientific GeoConference SGEM 2018, Albena, Bulgaria, 30 June–9 July 2018; pp. 393–400. [Google Scholar] [CrossRef]
  10. Wurihan, B.; Bayarsaikhan, S.; Yuhai, B.; Siqin, T.; Hugejiletu, J.; Xueliang, Y. Spatiotemporal variations of vegetation change and its response to climate change in Mongolia during 1982–2015. Nat. Inn. Asia 2022, 2–3, 37–51. (In Russian) [Google Scholar] [CrossRef]
  11. Lysenko, S.A. Climate-related changes in the bioproductivity of terrestrial ecosystems in Belarus. Explor. Earth Space 2019, 6, 77–88. Available online: https://elibrary.ru/download/elibrary_41525080_79297311.pdf (accessed on 8 April 2024). (In Russian).
  12. Bogatov, V.V.; Baklanov, P.Y.; Lozovskaya, S.A.; Shtets, M.B. Climate change and health in the Russian Far East. Vestn. Far East Branch Russ. Acad. Sci. 2021, 1, 5–21. [Google Scholar] [CrossRef]
  13. Barinova, G.M.; Krasnov, E.V.; Gaeva, D.V.; Romanchuk, A.Y.; Ushakova, L.O. The spread of tick-borne infections in conditions of climate change and the problem of adaptation to them by the population of the Kaliningrad region. Probl. Reg. Ecol. 2022, 4, 63–67. (In Russian) [Google Scholar] [CrossRef]
  14. Povarnitsyna, A.V.; Savin, M.I. Impact of climate change on global agriculture. Trends Dev. Sci. Educ. 2022, 84, 152–157. (In Russian) [Google Scholar] [CrossRef]
  15. Galkin, D.G. Directions for adaptation of agriculture to the consequences of global climate change. Vestn. Plekhanov Russ. Univ. Econ. 2021, 18, 13–20. (In Russian) [Google Scholar] [CrossRef]
  16. Kireycheva, L.V.; Glazunova, I.V. Development and placement of agricultural reclamation in changing climatic conditions. Nat. Manag. 2017, 4, 80–87. (In Russian) [Google Scholar] [CrossRef]
  17. Valentini, R. The global agricultural system and climate change: Challenges and opportunities for the Russian Federation. Financ. Theory Pract. 2017, 21, 70–79. (In Russian) [Google Scholar] [CrossRef]
  18. Chugunkova, A.V. Modeling of logging industry dynamics under the global climate change: The evidence from Siberian regions. J. Sib. Fed. Univ. Humanit. Soc. Sci. 2020, 13, 1870–1879. [Google Scholar] [CrossRef]
  19. Neverov, A.V.; Ravino, A.V.; Malashevich, D.G.; Yushkevich, N.T. Climate-oriented strategy for sustainable development of forestry: General content and problems of formation. Proc. BSTU Ser. 5 Econ. Manag. 2018, 1, 28–33. Available online: https://elar.urfu.ru/bitstream/10995/65024/1/978-5-8295-0567-7_2018-072.pdf (accessed on 8 April 2024). (In Russian).
  20. Stepanova, Y.N.; Shcherbin, A.O. Stimulating sustainable development of the forest ecosystem in the fight against climate change. Curr. Dir. Sci. Res. XXI Century Theory Pract. 2023, 11, 94–106. (In Russian) [Google Scholar] [CrossRef]
  21. Khlopov, O.A. Global warming and climate change as real theats to sustanable development. Colloq.-J. 2020, 63, 30–34. [Google Scholar] [CrossRef]
  22. Degtyarev, K.S. Geographical basis of renewable energy. Environ. Energy Sci. 2021, 3, 25–42. (In Russian) [Google Scholar] [CrossRef]
  23. Tsvetkov, P.A. Essay on the history of Russian forest pyrology. Sib. Lesn. Zurnal (Sib. J. For. Sci.) 2015, 5, 3–25. (In Russian) [Google Scholar] [CrossRef]
  24. Federal Law of 22 December 2020 N 454-FZ “On Amendments to Certain Legislative Acts of the Russian Federation in Terms of Improving Activities in the Field of Fire Safety”. Available online: https://rg.ru/documents/2020/12/28/bezopasnost-dok.html (accessed on 8 April 2024). (In Russian).
  25. Flannigan, M.; Cantin, A.S.; de Groot, W.J.; Wotton, M.; Newbery, A.; Gowman, L.M. Global wildland fire season severity in the 21st century. For. Ecol. Manag. 2013, 294, 54–61. [Google Scholar] [CrossRef]
  26. Cunningham, C.X.; Williamson, G.J.; Bowman, D.M.J.S. Increasing frequency and intensity of the most extreme wildfires on Earth. Nat. Ecol. Evol. 2024, 8, 1420–1425. [Google Scholar] [CrossRef]
  27. Parisien, M.A.; Barber, Q.E.; Bourbonnais, M.L.; Daniels, L.D.; Flannigan, M.D.; Gray, R.W.; Hoffman, K.M.; Jain, P.; Stephens, S.L.; Taylor, S.W.; et al. Abrupt, climate-induced increase in wildfires in British Columbia since the mid-2000s. Commun. Earth Environ. 2023, 4, 309. [Google Scholar] [CrossRef]
  28. Silveira, M.V.F.; Silva-Junior, C.H.L.; Anderson, L.O.; Aragão, L.E.O. Amazon fires in the 21st century: The year of 2020 in evidence. Glob. Ecol. Biogeogr. 2022, 31, 2026–2040. [Google Scholar] [CrossRef]
  29. As Wildfires Increase, Integrated Strategies for Forests, Climate and Sustainability Are Ever More Urgent. Available online: https://www.un.org/en/un-chronicle/wildfires-increase-integrated-strategies-forests-climate-and-sustainability-are-ever-0 (accessed on 1 December 2024).
  30. Shao, Y.; Fan, G.; Feng, Z.; Sun, L.; Yang, X.; Ma, T.; Li, X.; Fu, H.; Wang, A. Prediction of forest fire occurrence in China under climate change scenarios. J. For. Res. 2023, 34, 1217–1228. [Google Scholar] [CrossRef]
  31. Ten Countries with the Largest Forest Area in 2021. Available online: https://www.statista.com/statistics/238893/ten-countries-with-most-forest-area/ (accessed on 8 April 2024).
  32. Shojaeizadeh, K.; Ahmadi, M.; Dadashi-Roudbari, A. Contribution of biophysical and climate variables to the spatial distribution of wildfires in Iran. J. For. Res. 2023, 34, 1763–1775. [Google Scholar] [CrossRef]
  33. Bartalev, S.A. Large-scale changes in Russian forests in the 21st century according to satellite observations (IKI RAS, Moscow, Russia). In Proceedings of the 18th All-Russian Open Conference “Modern Problems of Remote Sensing of the Earth from space”: Electronic Collection of Conference Materials, Moscow, Russia, 16–20 November 2020; Available online: http://conf.rse.geosmis.ru/files/pdf/18/8465_Bartalev_YSS_2020_Eng.pdf (accessed on 8 April 2024).
  34. Kattsova, V.M. (Ed.) Third Assessment Report on Climate Change and Its Consequences on the Territory of the Russian Federation; High technology; Roshydromet: St. Petersburg, Russia, 2022; p. 126. Available online: https://www.meteorf.gov.ru/upload/pdf_download/compressed.pdf (accessed on 8 April 2024). (In Russian)
  35. Zamolodchikov, D.; Shmatkov, N. Forests of Russia and climate change: Can we preserve our forests against a new threat? Sustain. For. Manag. 2011, 4, 12–14. Available online: https://www.elibrary.ru/download/elibrary_22517666_75467202.pdf (accessed on 1 December 2024). (In Russian).
  36. Tarko, A. Analysis of forest fires in the world and their relationship with the global carbon dioxide cycle. Nor. J. Dev. Int. Sci. 2020, 50, 34–44. Available online: https://www.elibrary.ru/download/elibrary_44319432_57212045.pdf (accessed on 1 December 2024). (In Russian).
  37. Sherstyukov, B.G. Forest fires in Russia in a changing climate. Proc. All-Russ. Sci. Res. Inst. Hydrometeorol. Inf.-World Data Cent. 2021, 188, 30–40. Available online: https://www.elibrary.ru/download/elibrary_48549663_90620095.pdf (accessed on 1 December 2024). (In Russian).
  38. Kopysov, S.G.; Eliseev, A.O. Assessing Hydrological and Climate Conditional Productivity of Ecosystems in the Southeast of Western Siberia. Contemp. Probl. Ecol. 2024, 17, 337–344. [Google Scholar] [CrossRef]
  39. Sun, H.; Wang, X. High leaf area index expands the contrasting effect of climate warming on Western Siberia taiga forests activity before and after 2000. J. Geogr. Sci. 2024, 34, 131–145. [Google Scholar] [CrossRef]
  40. There Are 12 Forest Fires Burning in the Tyumen Region Covering an Area of over 5.2 Thousand Hectares. Available online: https://tass.ru/proisshestviya/17711329 (accessed on 8 April 2024). (In Russian).
  41. Russia Is Burning: What Is Known About Fires in the Urals, the Far East and Siberia. Available online: https://www.currenttime.tv/a/rossiya-goryaschaya-chto-izvestno-o-pozharah-na-urale-dalnem-vostoke-i-v-sibiri/32405352.html (accessed on 8 April 2024). (In Russian).
  42. Evtushkova, E.P.; Mezenina, O.B.; Soloshenko, A.I. State of forest resources of the Tyumen region. Int. Agric. J. 2024, 3, 870–896. Available online: https://iacj.eu/index.php/iacj/article/view/1042/1009 (accessed on 1 December 2024). (In Russian).
  43. USGS. EarthExplorer. Available online: https://earthexplorer.usgs.gov/ (accessed on 10 July 2024).
  44. All-Russian Research Institute of Hydrometeorological Information—World Data Center. Available online: http://meteo.ru/ (accessed on 8 April 2024).
  45. Weather Schedule 2004–2024. Available online: https://rp5.ru/ (accessed on 10 July 2024). (In Russian).
  46. Iturbide, M.; Fernández, J.; Gutiérrez, J.M.; Pirani, A.; Huard, D.; Al Khourdajie, A.; Baño-Medina, J.; Bedia, J.; Casanueva, A.; Cimadevilla, E.; et al. Implementation of FAIR principles in the IPCC: The WGI AR6 Atlas repository. Sci. Data 2022, 9, 629. [Google Scholar] [CrossRef]
  47. Riahi, K.; van Vuuren, D.P.; Kriegler, E.; Edmonds, J.; O’Neill, B.; Fujimori, S.; Bauer, N.; Calvin, K.; Dellink, R.; Fricko, O.; et al. The shared socioeconomic pathways and their energy, land use, and greenhouse gas emissions implications: An overview. Glob. Environ. Change 2017, 42, 153–168. [Google Scholar] [CrossRef]
  48. O’Neill, B.C.; Tebaldi, C.; van Vuuren, D.P.; Eyring, V.; Friedlingstein, P.; Hurtt, G.; Knutti, R.; Kriegler, E.; Lamarque, J.-F.; Lowe, J.; et al. The Scenario Model Intercomparison Project (ScenarioMIP) for CMIP6. Geosci. Model Dev. 2016, 9, 3461–3482. [Google Scholar] [CrossRef]
  49. Meinshausen, M.; Nicholls, Z.R.J.; Lewis, J.; Gidden, M.J.; Vogel, E.; Freund, M.; Beyerle, U.; Gessner, C.; Nauels, A.; Bauer, N.; et al. The shared socio-economic pathway (SSP) greenhouse gas concentrations and their extensions to 2500. Geosci. Model Dev. 2020, 13, 3571–3605. [Google Scholar] [CrossRef]
  50. Basurmatova, E.A.; Dronova, M.V.; Alexandroy, V.I.; Vinokurov, V.N.; Romanov, S.V. Analysis of the consequences of forest fires in the Tyumen region. Technosphere Saf. 2023, 1, 87–92. Available online: https://uigps.ru/userfls/ufiles/nauka/journals/ttb/TB%201%20(38)/9.pdf (accessed on 1 December 2024). (In Russian).
  51. In the Tyumen Region, the Results of the Fire Season of 2023 Were Summed Up. Available online: https://rayon72.ru/news/society/196877.html (accessed on 8 April 2024). (In Russian).
  52. Forecast of Emergencies Caused by Natural Fires in the Tyumen Region in 2023 (Information Prepared on the Basis of Statistical Data from the Main Directorate of the Ministry of Emergency Situations of Russia, the Tyumen Air Base, the Federal Budgetary Institution Avialesookhrana, the Hydrometeorological Center of Russia). Available online: https://rec.admtyumen.ru/OIGV/REC/actions/irections/more.htm?id=12011794%40cmsArticle (accessed on 8 April 2024). (In Russian).
  53. Report on Climate Features in the Russian Federation for 2022; Roshydromet: Moscow, Russia, 2023; p. 109. Available online: https://meteoinfo.ru/images/media/climate/rus-clim-annual-report.pdf (accessed on 8 April 2024). (In Russian)
  54. Konca-Kedzierska, K.; Pianko-Kluczynska, K. The influence of relative humidity on fires in forests of Central Poland. For. Res. Pap. 2018, 79, 269–279. [Google Scholar] [CrossRef]
  55. Doerr, S.H.; Santín, C. Global trends in wildfire and its impacts: Perceptions versus realities in a changing world. Phil. Trans. R. Soc. B 2016, 371, 20150345. [Google Scholar] [CrossRef]
  56. The Forest Plan of the Tyumen Oblast Dated 16 May 2023. Available online: https://admtyumen.ru/files/upload/OIV/D_Wood/%D0%9F%D1%80%D0%B8%D0%BB%D0%BE%D0%B6%D0%B5%D0%BD%D0%B8%D0%B5%20%D0%BF%D1%80%D0%B8%D0%BB%D0%BE%D0%B6%D0%B5%D0%BD%D0%B8%D0%B5%20%D0%BA%20%D0%BF%D1%80%D0%BE%D0%B5%D0%BA%D1%82%D1%83%20%D0%9B%D0%B5%D1%81%D0%BD%D0%BE%D0%B3%D0%BE%20%D0%BF%D0%BB%D0%B0%D0%BD%D0%B0%20%D0%BA%20%D0%BF%D0%9F%D0%90%20-%20029_23_%20%D0%94%D0%9B%D0%9A%20-%20%D0%9F%D0%93%20%D0%A2%D0%9E%20%D0%9F%D0%BE%D1%81%D1%82%D0%B0%D0%BD%D0%BE%D0%B2%D0%BB%D0%B5%D0%BD%D0%B8%D0%B5%20%D0%93%D1%83%D0%B1_(12433829v3).pdf (accessed on 5 November 2024). (In Russian).
  57. Abatzoglou, J.T.; Kolden, C.A.; Williams, A.P.; Lutz, J.A.; Smith, A.M.S. Climatic influences on interannual variability in regional burn severity across western US forests. Int. J. Wildland Fire 2017, 26, 269. [Google Scholar] [CrossRef]
  58. Villagra, P.E.; Cesca, E.; Alvarez, L.M.; Delgado, S.; Villalba, R. Spatial and temporal patterns of forest fires in the Central Monte: Relationships with regional climate. Ecol. Process. 2024, 13, 5. [Google Scholar] [CrossRef]
  59. Anderson, S.A.; Doherty, J.J.; Pearce, H.G. Wildfires in New Zealand from 1991 to 2007. N. Z. J. For. 2008, 53, 19–22. Available online: https://www.researchgate.net/publication/297477998_Wildfires_in_New_Zealand_from_1991_to_2007 (accessed on 1 December 2024).
  60. Nagy, R.C.; Fusco, E.; Bradley, B.; Abatzoglou, J.T.; Balch, J. Human-related ignitions increase the number of large wildfires across US ecoregions. Fire 2018, 1, 4. [Google Scholar] [CrossRef]
  61. Cardille, J.A.; Ventura, S.J.; Turner, M.G. Environmental and social factors influencing wildfires in the Upper Midwest, United States. Ecol. Appl. 2001, 11, 111–127. [Google Scholar] [CrossRef]
  62. Zhang, Y.; Lim, H.S.; Hu, C.; Zhang, R. Spatiotemporal dynamics of forest fires in the context of climate change: A review. Environ. Sci. Pollut. Res. 2024, 31, 1–15. [Google Scholar] [CrossRef] [PubMed]
Figure 1. Stages of analyzing climatic indicators and determining their variation trends as conditions for forest flammability hazard in the south of Tyumen Oblast.
Fire 07 00466 g001
Figure 2. Taylor diagrams comparing the CMIP6 models and their ensembles with observed data of the air temperature at Tyumen (a) and Ishim (b) weather stations during 1988–2023.
Fire 07 00466 g002
Figure 3. Visualized Landsat images of the territory of Tyumen District: fires in 1998 (Landsat-5/TM in the synthesis of SWIR-NIR-GREEN channels) (a), fires in 2008 (Landsat-5/TM in the synthesis of SWIR-NIR-GREEN channels) (b), fires in 2017 (Landsat-8/OLI in the synthesis of SWIR-NIR-GREEN channels) (c), and fires in 2023 (Landsat-8/OLI in the synthesis of SWIR-NIR-GREEN channels) (d).
Fire 07 00466 g003
Figure 4. Number and area of forest fires in the south of Tyumen Oblast in 2008–2023.
Fire 07 00466 g004
Figure 5. Average annual air temperature (°C) for the period of 1988–2023, according to meteorological stations in Tyumen (blue line) and Ishim (red line), and linear trends.
Fire 07 00466 g005
Figure 6. Total annual precipitation (mm) in 1988–2023 according to meteorological stations in Tyumen (blue columns) and Ishim (light green columns), and linear trends.
Fire 07 00466 g006
Figure 7. Average annual relative air humidity (%) in 1988–2023, according to meteorological stations in Tyumen (blue columns) and Ishim (light green columns), and linear trends.
Fire 07 00466 g007
Figure 8. Maximum snow depth per year (cm) in 1988–2023, according to meteorological stations in Tyumen (blue columns) and Ishim (light green columns), and linear trends.
Fire 07 00466 g008
Figure 9. Spatial distribution of trend values in average monthly air temperature for the set of 34 CMIP6 project models for SSP2-4.5 (a) and SSP5-8.5 (b) scenarios for the period from 2024 to 2100.
Fire 07 00466 g009
Figure 10. Spatial distribution of trend values in monthly temperatures for the set of 32 CMIP6 project models for SSP2-4.5 (a) and SSP5-8.5 (b) scenarios for the period from 2024 to 2100.
Fire 07 00466 g010
Figure 11. Spatial distribution of trend values of the average monthly values of the average daily precipitation accumulation in the form of snow (mm) for the set of 29 CMIP6 project models for SSP2-4.5 (a) and SSP5-8.5 (b) scenarios for the period from 2024 to 2100.
Fire 07 00466 g011
Figure 12. Total number of days with temperatures above 35 °C averaged for the south of Tyumen Oblast for the set of 27 CMIP6 project models for SSP2-4.5 (a) and SSP5-8.5 (b) scenarios for 2026–2050, 2051–2075, and 2076–2100.
Fire 07 00466 g012
Figure 13. Total annual number of consecutive dry days for the south of Tyumen Oblast for the set of 31 CMIP6 project models for SSP2-4.5 and SSP5-8.5 scenarios for 2026–2050, 2051–2075, and 2076–2100.
Fire 07 00466 g013
Table 1. Main technical characteristics of Landsat space images.
Satellite ImagesSpectral ChannelWavelengths, mkmResolution, m/pix.
Landsat-5/TMBand 1—Blue0.450–0.52030
Band 2—Green0.520–0.60030
Band 3—Red0.630–0.69030
Band 4—Near-Infrared (NIR)0.760–09030
Band 5—Shortwave Infrared (SWIR-1)1.550–1.75030
Band 6—Thermal10.40–12.50120*(30)
Band 7—Shortwave Infrared (SWIR-2)2.080–2.35030
Landsat-8/OLIBand 1—Coastal/Aerosol, New Deep (Blue)0.433–0.45330
Band 2—Blue0.450–0.51530
Band 3—Green0.525–0.60030
Band 4—Red0.630–0.68030
Band 5—Near-Infrared (NIR)0.845–0.88530
Band 6—Shortwave Infrared (SWIR 1)1.560–1.66030
Band 7—Shortwave Infrared (SWIR 2)2.100–2.30030
Band 8—Panchromatic (PAN)0.500–0.68030
Band 9—Cirrus1.360–1.39030
Ranges TIRS (Thermal Infrared Sensor)
Band 10—Thermal Infrared (TIR1)10.30–11.30100
Table 2. Duration of the fire hazard period (based on data) [50,51,52].
IndicatorsYears
20192020202120222023
The beginning of the fire-hazardous period23 April21 April20 April12 April3 April
The end of the fire-hazardous period25 October22 October26 October10 November27 October
Total number of days of
the fire-hazardous period
186198203213208
Table 3. Correlation between the number and area of fires and the major meteorological characteristics in 2008–2023 in the south of Tyumen Oblast.
Without ShiftWith One-Year Shift
Number of FiresFire Area (ha)Number of FiresFire Area (ha)
T mean (°C)−0.220.09−0.140.56 *
T mean max (°C)0.010.190.050.50 *
T abs max (°C) 0.060.72 *0.030.22
T fire hazard period (°C)0.170.49 *0.010.36
V mean (m/s)−0.390.00−0.20−0.02
f mean (%)0.02−0.82 *0.21−0.05
P (mm)0.03−0.62 *−0.16−0.09
max h snow (cm)−0.07−0.34−0.22−0.37
* Indicates the statistical significance of the correlation coefficient at a 95% confidence level.
Disclaimer/Publisher’s Note: The statements, opinions and data contained in all publications are solely those of the individual author(s) and contributor(s) and not of MDPI and/or the editor(s). MDPI and/or the editor(s) disclaim responsibility for any injury to people or property resulting from any ideas, methods, instructions or products referred to in the content.

