3.1. Smoke Spreading Pattern
In an environment with natural ventilation,
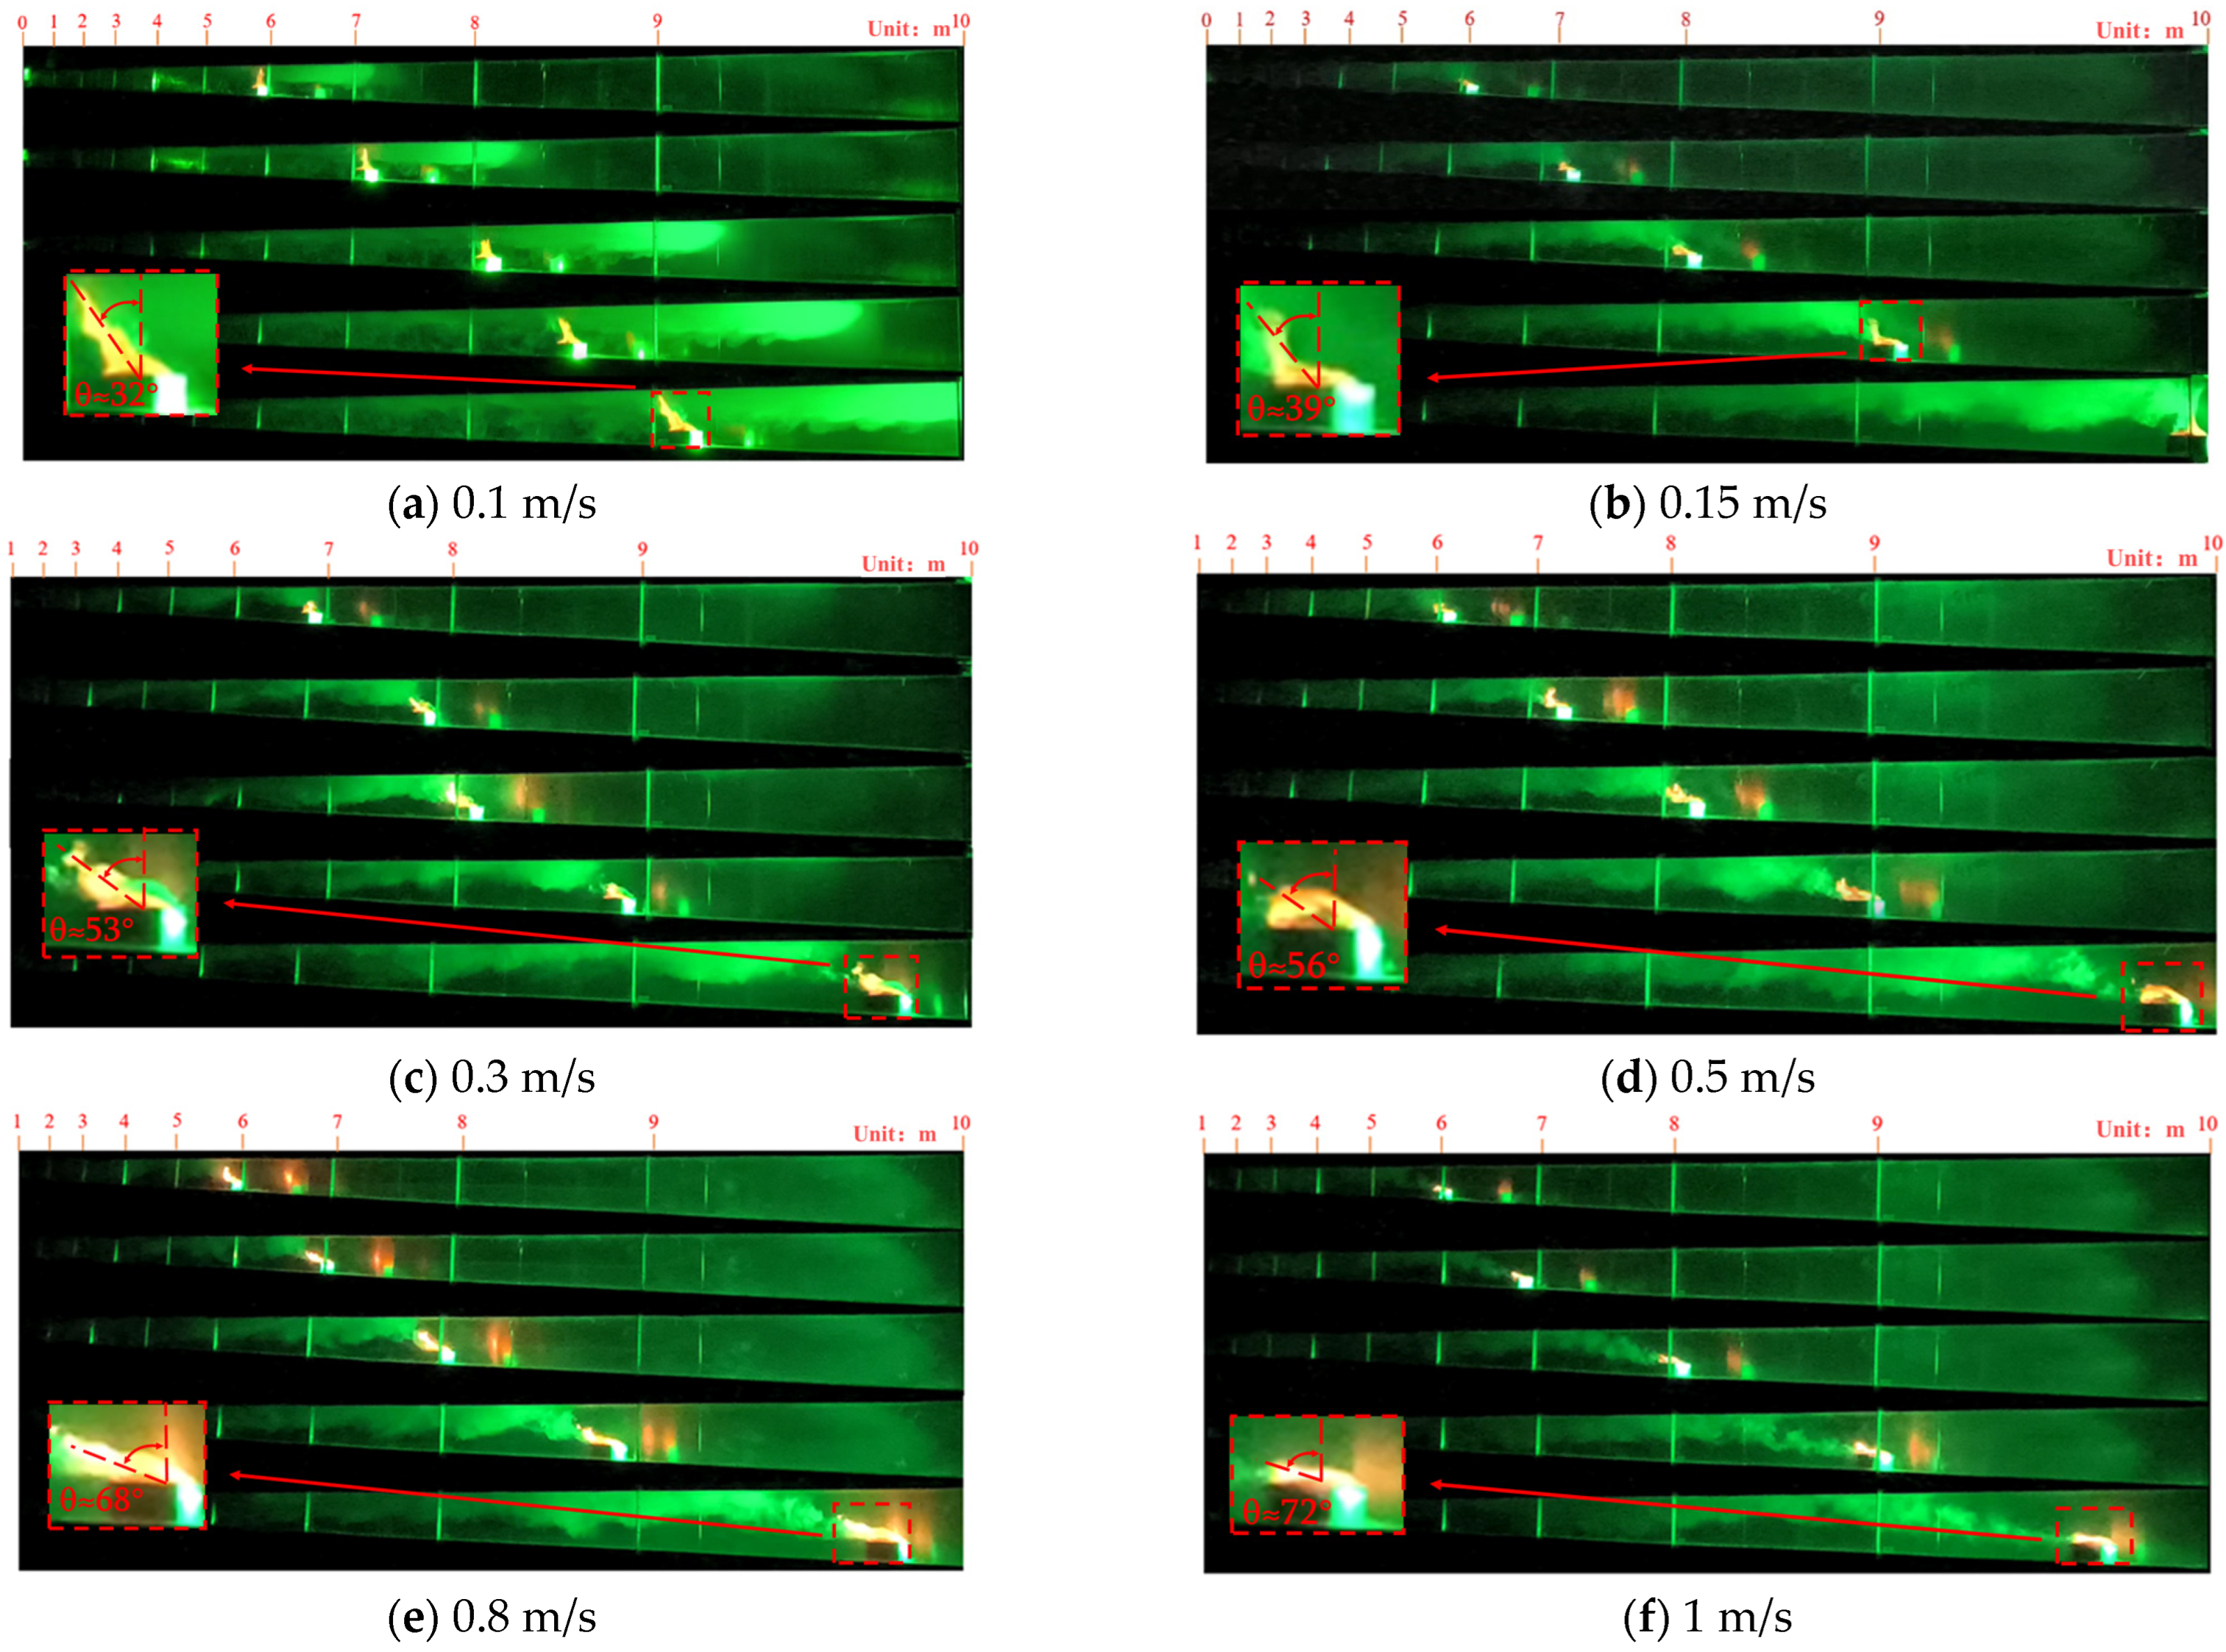
Figure 4 illustrates the smoke dispersion process at varying fire source speeds of 0.1 m/s, 0.15 m/s, 0.3 m/s, 0.5 m/s, 0.8 m/s, and 1.0 m/s.
As depicted in
Figure 4, when the fire source moves at a speed of 0.1 m/s, a large amount of smoke in the tunnel spreads to the rear of the fire source, and a small amount of smoke spreads to the front of the fire source. At this time, the corresponding smoke countercurrent length is 1.2 m, and there is a jagged return flow of smoke in front of the fire source. The warmer smoke above draws in cooler air from below. At the interface where these air masses meet, increased velocity shear enhances vortex formation at the boundary between the hot smoke and cold air. Consequently, this interaction fosters the emergence of a jagged smoke reflux beneath the smoke layer. Upon accelerating the fire source’s movement speed to 0.15 m/s, the speed of smoke spreading forward is slightly lower than the speed of fire advancing, and the phenomenon of smoke countercurrent disappears. In the process of smoke movement, the stability of the smoke layer is better.
The fire source was traveling at a speed of 0.3 m/s, at which point the smoke was tilted towards the rear of the moving fire source. At 0.3 m behind the fire source, the rising smoke impacted the tunnel ceiling. This led to an obvious change in the stability of the smoke layer, and the smoke behind the fire source was distributed in the longitudinal direction in a concave–convex shape, showing the phenomenon of hydraulic jump. Hydraulic jump is the up-and-down smoke spreading that occurs when it is subjected to the influence of air swirling and sucking. The hot smoke rises to the ceiling of the tunnel, and then, impacted by the ceiling, a ceiling jet occurs. The smoke is affected by the upward thermal buoyancy and piston winds, and the smoke bifurcates at the point of impact with the ceiling, which results in an upward depression of the smoke layer behind the fire source. Later, when the smoke spreads from the center of the tunnel ceiling in all directions and hits the side walls of the tunnel, the smoke spreads downward, driven by the reverse force. During this process, the hot smoke sucks up a large amount of fresh air, resulting in a sudden increase in the smoke mass flow. This is shown in
Figure 4 as a downward projection of the flue gas layer; however, as the flue gas temperature is still high, the flue gas will still rise due to its thermal buoyancy until it hits the ceiling. As the fire travels further up to 0.8 m/s, stronger piston winds are generated. This causes the flow field in the tunnel to change more drastically, increasing the instability of the smoke. When the fire source moves up to 1 m/s, the plume ceiling impact point offset distance reaches about 0.5 m. The fire source moves up to 1 m/s, and the plume ceiling impact point offset distance reaches about 0.5 m. The range of the smoke water jump also increases, the thickness of the smoke layer increases, and ground-hugging smoke gradually forms 2.5 m behind the fire source.
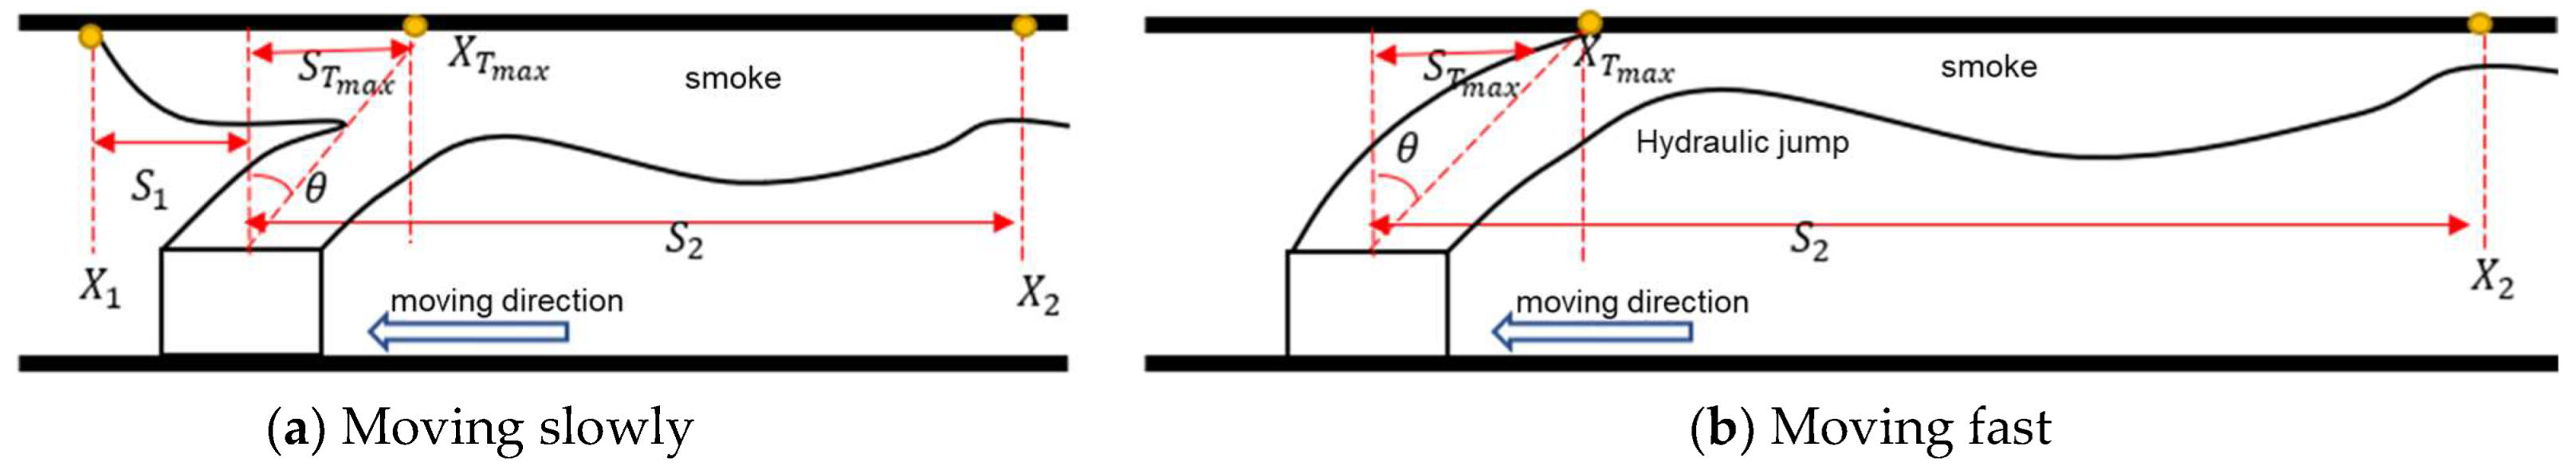
There is an obvious difference in the longitudinal smoke spreading process when the fire source moves at different speeds, as shown in the schematic diagram of smoke spreading from a moving fire source in
Figure 5. In
Figure 5, X
1 and X
2 are the positions of smoke spreading front and back, S
1 and S
2 are the distances from the smoke spreading front (smoke countercurrent) and back to the center of the fire source; X
Tmax is the position of the plume impact point, S
Tmax is the distance from the plume impact point to the center of the fire source, and θ is the plume deflection angle.
When the fire source burns at a lower displacement speed, the hot smoke above the fire source mainly spreads to the front of the fire source under the combined effect of inertial force, buoyancy, and piston wind, and smoke countercurrent occurs. A small portion of the smoke spreads to the rear front of the fire source when the smoke layer is better in stability and still forms a ceiling jet phenomenon, as shown in
Figure 5a. However, when the moving speed of the fire source increases to a certain degree, the hot smoke mainly spreads to the front side behind the fire source, and the smoke spreading to the front of the tunnel disappears. At the same time, the smoke layer changes in stability, the smoke plume bifurcates in the process of rising, and a more obvious water jump phenomenon is formed, as shown in
Figure 5b.
To study in more depth the change rule of smoke characteristic length of a moving fire source, the relationship equation between the characteristic length of smoke and the moving speed of the fire source is obtained by introducing the results in previous research through a dimensionless analysis [
26]. The relationship between smoke characteristic length, fire source power, and fire source moving speed is shown in Equation (2).
H is the height of the tunnel, L is the characteristic length of the smoke, Q* is the dimensionless heat release power of the ignition source, and v* is the dimensionless speed of the ignition source movement.
Figure 6 shows the relationship between the water jump distance and the dimensionless ignition source power and ignition source shift velocity for different operating conditions. Based on the fitting results, Equation (3) can be derived for the relationship between the length of the smokeless zone, the heat release rate of the dimensionless ignition source, and the shift velocity of the dimensionless ignition source:
Based on experimental results, when the heat release rate of the fire source is given, the water jump distance is positively correlated with the moving speed of the fire source. As the moving speed of the fire source increases, which corresponds to a reduction in the overall size, the water jump distance of the smoke behind the fire source also increases.
3.2. Analysis of the Change in Flame Tilt Angle as the Fire Source Moves
In a tunnel fire scenario, the angle of the flame inclination not only determines the spatial distribution of the heat release rate but also has a significant impact on the ascent and diffusion path of the smoke. Changes in flame inclination can reflect the degree of mixing between the fire source and the surrounding air, as well as the complex flow patterns in front of the fire source due to thermal buoyancy and piston wind effects.
Flame inclination is the flame in the fire source movement process, the flame by the fire source movement, and the role of piston wind relative to the windless environment when the angle of offset, that is, the flame centerline (the center of the oil pool center of the flame center of the line) and the angle between the vertical direction [
27].
Figure 7 shows the change in flame morphology with the movement of the fire source. It is obvious that the flame tilts and stretches behind the moving fire source, and the flame angle and flame length change with the change in speed. When the moving speed of the fire source is 0.1 m/s, the flame appears slightly offset; the flame angle is about 32°, the flame front appears wrinkled and twisted, and the flame is elongated. When the flame speed reaches 0.15 m/s, the flame tilt angle increases to 39°. The folds and distortions of the flame are reduced, while the length of the flame is reduced. When the flame moving speed increases to 0.3 m/s, the flame angle increases to 53°. The flame is increased under the influence of piston wind, and the stability of the flame is decreased. This causes bifurcation at the end of the flame, while folds and twists are more pronounced. When the flame moving speed increases to 0.5 m/s, the flame angle increases to 56°. When the flame moving speed is 0.8 m/s, the flame angle is about 68°. Meanwhile, the flame area is significantly reduced, the flame becomes flat, and the flame length is significantly reduced.
Figure 7 delineates the relationship between flame inclination and various speeds of the moving fire source. Notably, the inclination in the flame heightens with an increase in the fire source’s velocity, and it is particularly pronounced when the speed escalates from 0.1 m/s to 0.5 m/s. This trend underscores a two-fold effect at speeds below 0.5 m/s: first, the motion of the fire source enhances its interaction with ambient air. The vapors are produced to mix with fresh air, thereby hastening combustion. Second, this movement induces a pronounced piston wind effect, drawing a significant flow of air from the fire source’s front to its rear and consequently increasing flame inclination because of the wind’s pull; however, as the fire source moves at a speed greater than 0.5 m/s, the increase in flame inclination is relatively slow, and strong piston winds are generated in the tunnel. The strong air disturbance makes it difficult for fuel vapor to accumulate in the combustion area. Heat dissipation from the fire source is accelerated, and a large amount of heat from the fuel reaction is taken away, thus weakening the combustion reaction of the fuel and inhibiting the combustion of the fire source.
3.3. Analysis of Smoke Entrainment Process During Fire Movement
According to the previous section, the moving fire source experiment, when the moving fire source tunnel fire accident occurred, the flame tilts backward, and the moving fire source sucks the cold air into the combustion reaction zone. Part of the air sucked involves in the reaction, while the rest of the air is heated and mixed with combustion products. The whole tilts up to the tunnel ceiling under the thermal buoyancy. Due to the impact of the ceiling, a part of the smoke spreads to the front side of the fire source while the other part of the smoke spreads to the back of the fire source, which results in the phenomenon of water jump. The smoke layer is concave, and the high-temperature smoke gradually cools down after sucking a large amount of cold air. The smoke will sink due to the loss of heat Buoyancy effect and gradually transform into a one-dimensional movement. It can be seen that in the whole process, the moving fire source air suction affects the temperature distribution and smoke flow state in the tunnel.
Chen et al. [
28] carried out a qualitative analysis of air convolution in the tunnel. Smoke is regarded as a viscous incompressible fluid, and the fire plume or smoke in a fluid microcluster is the object of this study. The momentum equation is as follows:
where
denotes the full pressure, Pa;
denotes the viscous force due to the velocity gradient.
Since gravity has potential energy, we obtain Equation (5) by taking the degree of rotation for Equation (4):
where the first term to the right of the equal sign indicates the diagonal pressure generation of the vortex,
and
inconsistent orientation causes the flue gas microclusters to rotate; the second term indicates the vortex generated by the velocity shear under the condition of viscous force.
The mechanism of vortex generation during the fire plume and smoke spread of a moving fire source is different from that of a stationary fire source, as shown in
Figure 8. The red line represents the outline of the flame and the black line represents the outline of the smoke spread. For the fire plume, the center flow velocity is larger, and the flow velocity at two sides is smaller. The smoke shows a water jump phenomenon. At the same time, under the influence of the velocity gradient, a certain size of the vortex will be produced. As the fire source moves, the tail of the fire source forms a negative pressure zone. Pressure above the fire source is larger, and the gradient of the pressure is vertically downward; the air around the fire source is densely packed, and the gradient of the density is horizontally outward; vortex volume is formed because of inconsistencies in the direction. When the fire source moves at a low speed, the fluid microgroups rotate clockwise at the junction of hot smoke and cold air on the right side of the fire source and rotate counterclockwise on the left side of the fire source. As a result, the fire plume flows to the left and right sides of the fire source bifurcation when there is a fire source moving in the same direction as the smoke and airflow; however, with the moving speed of the fire source increasing, the piston wind speed in the tunnel augments accordingly. It leads to strengthened velocity shear between the cold air and the hot smoke layer and also an increase in the vortex at the interface between the hot smoke and the cold air. Due to the increase in vorticity, the strength of air entrainment augments, which gradually destabilizes the smoke layer. The fluid micro-cluster on the left side of the fire source rotates counterclockwise, and smoke flows, and the fire source moves in the opposite direction.
3.4. Ceiling Temperature Distribution Pattern
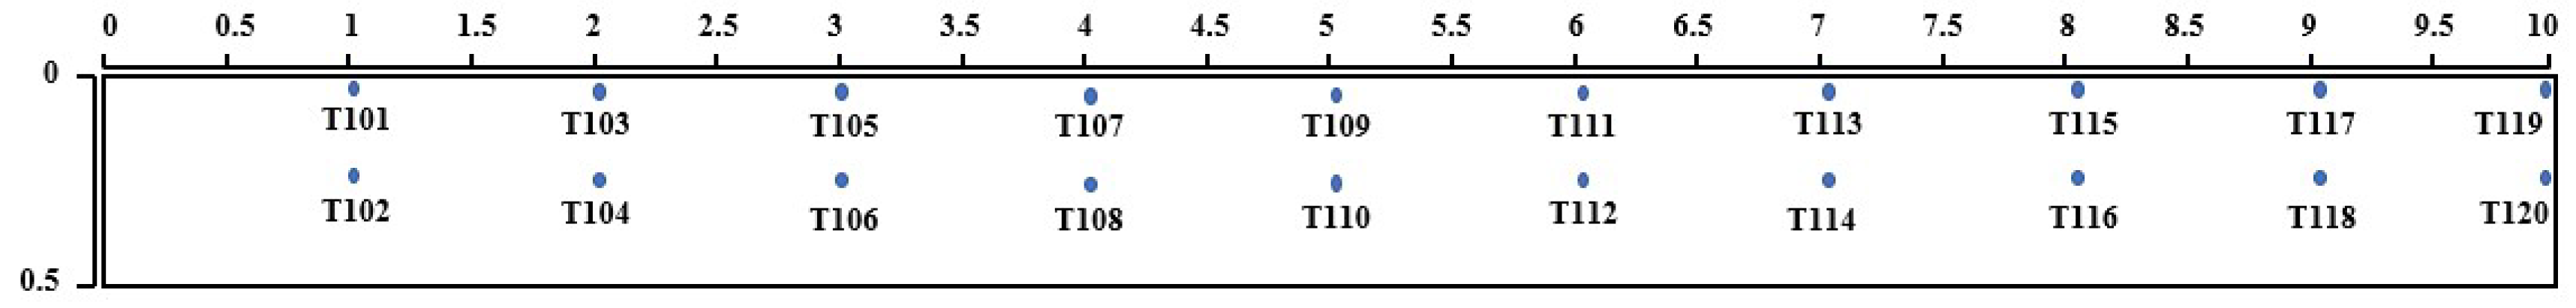
The flue gas flow inside the tunnel is complex and is influenced by a variety of factors, among which the variation of the ceiling temperature has a significant relationship with the flue gas flow pattern. The distribution of ceiling temperature not only reflects the thermal characteristics of the flue gas but also directly relates to the stability of the flue gas layer and the rate of flue gas spreading. To comprehensively analyze temperature changes in the tunnel, temperature sensors at points 105, 106, 111, 112, 117, and 118. They are positioned at the front, middle, and rear sections of the tunnel, as shown in
Figure 9.
The peak temperatures recorded at the various measurement points exhibited significant disparities across different fire source travel speeds. Specifically, at a moving speed of 0.1 m/s, the highest temperature peaks are observed at each measurement point within the tunnel, compared with the other speeds. This can be attributed to the slower movement of the fire source through the tunnel, which prolongs the duration of fuel combustion inside the tunnel. The slow fire source allows for the release of more heat during its passage, as opposed to a faster source. The heat generated by the combustion of the moving fire source causes the surrounding gases to expand. The heat is more likely to accumulate behind the fire source when the fire source moves at a lower speed; however, with an increase in the fire source’s travel speed, the air disturbance within the tunnel intensifies, fostering more frequent heat exchange between the hot smoke and the cooler ambient air. This dynamic results in generally lower measured temperatures, reflecting the complex interplay between the fire source’s speed, air disturbance, and thermal exchange within the tunnel environment.
As the travel speed increases, a general downtrend in temperatures at the tunnel’s measurement points is observed. Notably, the transition from a fire source moving speed of 0.15 m/s to 0.3 m/s marks a significant phase where the internal tunnel temperature begins to climb, with peak temperatures at each measurement point rising by approximately 10 °C. This phenomenon can be attributed to a couple of factors. First, at speeds of 0.15 m/s and 0.3 m/s, the piston wind effect generated is comparatively weaker. It allows hot smoke to accumulate behind the fire source without significantly altering the tunnel’s overall heat loss. Second, at a movement speed of 0.3 m/s, the fire source’s fuel mixes more thoroughly with fresh air, leading to more complete combustion and greater heat release.
As the fire source’s speed exceeds 0.3 m/s, temperatures at the tunnel ceiling tend to be lower. This trend occurs because the fire spreads faster through the tunnel, reducing heat accumulation. Moreover, the rapid movement creates a more pronounced piston wind effect, which further disrupts the airflow within the tunnel. This intensified disruption promotes greater convection between the hot smoke and the cooler surrounding air. As a result, heat is prevented from accumulating, leading to relatively lower temperatures at the tunnel’s ceiling.
Deng et al. conducted a study on the temperature field of the tunnel ceiling in the presence of a stationary fire source, revealing that temperatures on the tunnel ceiling escalated as proximity to the fire source increased [
18]. Building upon this finding, the present study undertakes a comparative analysis between the temperature at the tunnel’s central detection point and that along the tunnel wall, aiming to elucidate variations within the tunnel ceiling’s temperature field. It is observed that temperatures tend to be significantly higher in the front section of the tunnel compared with those in the middle and rear sections. Moreover, it was discovered that the temperature of the tunnel’s ceiling varies in tandem with the fire source’s moving speed, indicating that the temperature changes are directly influenced by the fire source’s velocity. With an increase in the moving speed of the fire source, the temperature of the tunnel ceiling will be changed. A central low-temperature area will gradually appear.
Figure 10 illustrates the maximum temperatures at various measurement points across the tunnel ceiling, observed under distinct fire source velocities. Notably, at a velocity of 0.1 m/s, the central measurement points on the tunnel ceiling register temperatures significantly higher than those near the sidewalls. The average temperature difference between the two locations is 20 °C. This observation underscores the pronounced thermal gradient influenced by the slow movement of the fire source. Upon accelerating the fire source to 0.15 m/s, a remarkable decrease in the temperature difference to 5 °C between the central and sidewall measurement points is documented. The temperature distribution throughout the tunnel became more uniform. The maximum temperature of each measurement point decreases to about 40 °C with an increase in the moving distance of the fire source. The graphical representation further reveals that when the velocity of the fire source exceeds 0.15 m/s, temperatures at the forefront measurement points stabilize around 60 °C, while those in the mid and rear sections average at 40 °C. The temperature in the front section of the tunnel is significantly higher than that in the middle and rear sections of the tunnel. The enhanced convective movement of smoke and air is attributable to the fire source’s mobility. This facilitates thermal exchange between the heated smoke and the cooler ambient air, thereby expediting the reduction in interior temperatures. Consequently, the temperature distribution of the ceiling in the middle and rear sections of the tunnel is relatively uniform.
When the fire source traversed at a velocity of 0.3 m/s, the observed temperature discrepancy between the central zone of the tunnel ceiling and its sidewalls remained minimal, with the maximum temperature variance recorded at approximately 10 °C. At this point, the thermal distribution at the top of the tunnel showed a significant change, revealing a low-temperature zone that is approximately 1 m long. Within this zone, the peak temperatures near the tunnel sidewalls are notably higher than those at the center. This phenomenon is attributable to the piston-like airflow induced by the fire source’s movement at 0.3 m/s, which disrupts the stability of the overhead smoke layer, leading to its bifurcation. This results in a dilution of smoke concentration at the tunnel’s center. At the same time, the high-temperature smoke continues its lateral dispersion until it rebounds off the tunnel sidewalls so that the tunnel center temperature is lower than that at the sidewall. As a result, the smoke-free zone is formed at the center.
As shown in
Figure 10, when the velocity of the fire source accelerates to 0.5 m/s, the extent of the central low-temperature zone broadens from 1 m to 2 m. Furthermore, with the progressive increase in the fire source’s velocity, the expanse of this central low-temperature domain correspondingly augments. At a velocity of 1 m/s, the length of this zone extends to 4 m. This analysis of causes is dual-faceted: first, the elevation in the fire source’s velocity exacerbates the instability of the smoke layer, solidifying the bifurcation of smoke. Second, the swifter movement of the fire source not only accentuates the temperature differential within the central smoke-free zone but also intensifies the turbulent interactions between the hot smoke and ambient cold air. That makes the heat exchange more adequate and leads to an increase in temperature difference in the central smoke-free zone.


