Article

Experimental and Numerical Studies on the Explosion Characteristics of Ethanol–Air Mixtures under Aviation Conditions

State Key Laboratory of Fire Science, University of Science and Technology of China, Hefei 230026, China
*
Authors to whom correspondence should be addressed.
Fire 2023, 6(9), 349; https://doi.org/10.3390/fire6090349
Submission received: 10 August 2023 / Revised: 31 August 2023 / Accepted: 3 September 2023 / Published: 6 September 2023

Abstract

:
As a representative renewable biofuel, ethanol can reduce mankind’s dependence on petroleum resources and the emission of greenhouse gases and other pollutants. In recent years, the application of ethanol in the aviation field has begun to be a concern of scholars. As ethanol is a flammable liquid, it is significant to study its explosion characteristics in aviation conditions from a safety perspective. In this work, at 20 kPa, the explosion characteristics of ethanol–air mixtures (concentration 6~12%) were experimentally and numerically studied under an initial temperature range of 303 K~363 K. The effects of the initial temperature and concentration on the maximum explosion pressure, maximum rate of pressure rise, explosion time, and fast burning time were analyzed. In addition, the heat loss fraction and sensitivity analysis were examined and discussed. The main conclusions are as follows: A linear relationship exists between the maximum explosion pressure and the reciprocal of the initial temperature. The maximum rate of a pressure rise appears to decrease or at least approach a constant value as the initial temperature increases. The explosion time is significantly dependent on the concentration. At a constant concentration, the proportions of heat loss are approximately constant except for 12%. In our sensitivity analysis, R1 (H + O2 <=> O + OH) was the dominant elementary reaction.

1. Introduction

Oil security has always been an important issue in the energy field. In recent years, the reserves of traditional fossil fuels have decreased, and it is imperative to vigorously produce and use renewable energy. The development and use of renewable energy can not only effectively alleviate the energy crisis, but also reduce the emission of greenhouse gases and reduce their impact on the global climate. As a representative renewable biofuel, ethanol has been widely used in medical and food industries as well as other fields. It can reduce mankind’s dependence on petroleum resources and the emission of greenhouse gases and other pollutants. Therefore, ethanol has great potential as an alternative fuel or as an additive to gasoline and diesel. As spark-ignition or compression-ignition engine fuels, the research and application of ethanol or its blend with gasoline and diesel have received extensive attention [1,2,3,4,5], and the results of such studies have proven that ethanol has great application potential as an important renewable fuel.
In recent years, the application of ethanol in the aviation field has begun to be a concern of scholars. For example, in Brazil, ethanol has been used as a land transportation fuel for more than 30 years, and in the near future, the government is expected to approve ethanol as an aviation fuel [6]. In China, Liu et al. [7] studied ethanol/RP-3 aviation kerosene blended fuel and focused on the effect of ethanol addition on the laminar burning velocity (LBV) of RP-3. What is more, they point out that the use of ethanol or ethanol/kerosene blends in aero-engines is still rare at present. However, while studying the combustion characteristics of ethanol/aviation kerosene blends, safety problems regarding the use of ethanol cannot be neglected, especially in the prevention of ethanol explosion accidents. Otherwise, it is easy for it to cause casualties and the loss of property. For example, in 2018, an ethanol explosion occurred in the workshop of a pharmaceutical company in Tianjin city, resulting in three deaths, two serious injuries, and a direct economic loss of about 17.408 million yuan [8]. If an explosion occurs on a plane, the consequences could be even more severe. Therefore, it is significant to study the explosion characteristics of ethanol in aviation conditions. In terms of ethanol explosion characteristics, researchers are mainly concerned with two aspects: the flammability limits and the explosion parameters. For flammability limits, the influences of pressure and temperature on the flammability limits and the prediction methods of flammability limits are the main interests of scholars [6,9,10,11,12]. For example, Coronado et al. [6] investigated the flammability limit of ethanol for aeronautical applications and found that temperature, pressure, and water content all affect the flammability limit of ethanol. Velasquez et al. [12] developed a model that can predict flammability limits for ethanol–air blends in various ambient environments, taking into account the influence of temperature, pressure, and moisture concentration. For the explosion parameters, the main research contents include the maximum explosion pressure, maximum rate of pressure rise, deflagration index, explosion time, and burning velocity, and the influencing factors considered include the initial pressure, initial temperature, oxygen concentration, explosion vessel, diluent, explosion location, and so forth [13,14,15,16,17,18,19,20]. For example, Mitu et al. [16,17] investigated the influence of pressure, temperature, and vessel volume on the explosion characteristics of ethanol–air mixtures, and examined the mitigation effects of different diluents as well. Cammarota et al. [14] studied the effect of hydrogen addition on the explosion of ethanol–air mixtures. As can be seen from the above literature, although many scholars have studied the explosion characteristics of ethanol under different experimental conditions, due to the serious consequences of ethanol explosions on aircraft, it is still necessary to study the explosion characteristics of ethanol in the aviation environment.
Hence, in this study, experimental and numerical studies were carried out to study the explosion characteristics of ethanol–air gaseous mixtures in aviation conditions (initial temperature range: 303 K–363 K and initial pressure: 20 kPa). The volume concentration of ethanol varies from 6% to 12% for it can cover the range from the lean side to the rich side. The effects of the initial temperature and ethanol concentration on the maximum explosion pressure, maximum rate of pressure rise, explosion time, and fast burning time were analyzed. In addition, the heat loss fraction and sensitivity analysis were examined and discussed. The research results enrich the database of ethanol–air mixture explosion characteristics and could also be used as a basis for hazard assessment and safety design in aviation conditions.

2. Experiment

2.1. Experimental Setup

In this study, the experimental apparatus was built according to ASTM E681-04 “Standard Test Method for Concentration Limits of Flammability of Chemicals (Vapors and Gases)” [21]. A schematic diagram of the experimental system is shown in Figure 1. The main component of the system is a 5 L spherical vessel made of stainless steel. Four parts are equipped, including the ignition source, heater, detection unit, and gas distribution unit. The ignition source is an electric spark generator that can provide enough energy to ignite the fuel–air gaseous mixture. It can produce electric sparks between two electrodes through a 15 kV voltage and 20 mA current. The heater is used to raise the temperature inside the vessel by means of infrared radiation and hot air circulation. The detection unit is composed of a pressure sensor and temperature sensor, which are responsible for detecting the pressure and temperature data inside the vessel and transferring these data to the data acquisition unit, respectively. The measuring range of the pressure sensor is 0~2 MPa, with a resolution of 0.1 kPa, and the measuring range of the temperature sensor is 0~1350 °C, with a resolution of 0.1 °C. The gas distribution unit is composed of a magnetic stirrer, vacuum pump, fuel feed line, and gas feed line. This unit is responsible for preparing a homogeneous fuel–air gaseous mixture through the partial pressure method. In addition to the four parts, a data acquisition unit was used to record the pressure and temperature data and transmit them to a computer. It can record data every 0.2 ms, with an acquisition time of 2 s. A computer, as a controller, is used to operate the experiment and store the data.
Before the experiment, the airtightness of the vessel was strictly controlled at no more than 0.1 kPa/min. At the outset of each test, the vessel was heated to the test temperature. Then, the vacuum pump cleaned the gas in the vessel, making the pressure below 1.3 kPa. After the vessel was evacuated, the fuel was injected first, and then the air was filled into the vessel, forming the fuel–air gaseous mixture. Next, the stirrer was run for 5 min at a rotating speed of 400 r/min, ensuring that the fuel vapor and the air were mixed homogeneously. Finally, the ignition source was triggered, and the discharge time was set as 200 ms to release 12 J ignition energy. After each ignition, the pressure history was recorded and stored in the computer. At the end of each test, the pressure in the vessel was pumped below 2 kPa two consecutive times to remove the residual gas.

2.2. Experimental Conditions

In this paper, ethanol with purity greater than or equal to 99.7% was used as the experimental fuel without further purification. Generally, the cruising altitude of an aircraft can usually reach 10,000 m and above. At this altitude, the external atmospheric pressure can be reduced to 20 kPa or less. For the temperature, the internal temperature of the fuel tank rarely exceeds 90 °C. Therefore, all explosion experiments were carried out at the initial pressure of 20 kPa. The experimental temperatures varied from 303 K to 363 K, and the ethanol concentrations varied from 6% to 12%. The test conditions are listed in Table 1.

2.3. Experimental Data Processing

To guarantee the reliability of the data, tests for each condition were repeated at least three times. A test value with a large deviation was discarded. The mean of the remaining repeated tests was calculated as the final value of each parameter. The standard deviations in the measured maximum explosion pressures were <2.5% in all conditions.
To obtain smooth first derivative curves from the pressure-time curves, the Savitzky–Golay smoothing method was adopted based on least squares quartic polynomial fitting across a moving window within the data [22].

3. Numerical Simulations

The numerical simulations were performed by the program Chemkin-Pro 18.0, which is a powerful tool for solving complex chemical reaction problems and is often used to simulate combustion processes and other chemical reactions. According to different simulation requirements, the software provides a variety of reaction models, which can be directly invoked by users. In this work, the maximum adiabatic explosion pressures were calculated using the “chemical and phase equilibrium calculations” model, which can calculate the physical state of the system at phase equilibrium under adiabatic conditions based on the input initial conditions, regardless of the reaction path. Due to the experiment being conducted in a closed vessel, the problem type of the calculation was selected as “constant volume energy”. The flow rate sensitivity coefficient can represent the influence of an elementary reaction on laminar burning velocity, so it can be used for sensitivity analysis. It was calculated using the “premixed laminar flame-speed calculation” model, which can calculate the laminar burning velocity and flow rate sensitivity coefficient of a premixed flame. The GRAD and CURV were set as 0.03 and 0.05, respectively, in the calculation domain of 0–10.6 cm. The numbers of the grid points were all above 495 to ensure grid independence. The detailed chemical mechanism of ethanol combustion proposed by Mittal et al. [23] was adopted for the simulation. The mechanism consists of 113 species and 710 reactions. Using this chemical mechanism, the calculated LBV of the stoichiometric mixture (φ = 1) at 453 K and 0.1 MPa was 86.0 cm/s, consistent with the experimental data of Egolfopoulos et al. [24]. Therefore, the accuracy and reliability of the simulation results can be ensured.

4. Results and Discussion

A typical explosion pressure curve in blue against time and its first derivative curve in red (after smoothing) are drawn in Figure 2. After ignition via an electric spark, the flammable mixture starts burning and releasing heat. At first, the heat generation rate of the system is greater than the heat dissipation rate, resulting in a rapid increase in system pressure. The pressure rises to the maximum when the rate of heat production is equal to the rate of heat dissipation. Finally, once the rate of heat production is less than the rate of heat dissipation, the pressure begins to decrease. The definitions of the maximum explosion pressure pmax, the explosion time θmax, the maximum rate of pressure rise (dp/dt)max, and the fast burning time θf are illustrated in the graph.

4.1. Maximum Explosion Pressures

The correlation between the initial temperature and pmax has been studied and discussed in many works, such as methane–air mixtures [25], synthetic biogas–air mixtures [26], LPG–air mixtures [27], and propane–air mixtures [28]. All of the studies found that there is a linear relationship between pmax and the reciprocal of the initial temperature. Based on a study on the heat balance of the gaseous fuel–air mixture in constant volume combustion [29], a correlation between pmax, p0, and T0 was proposed by Razus et al. [28]:
p max = ξ + r l ν l · Δ c U T 0 · C e , V ¯ p 0 q tr γ e 1 V 0 ,
The meaning of each physical quantity in Equation (1) is explained in detail in the nomenclature.
In Equation (1), the third term results from the heat dissipation of the system. By rearranging Equation (1), an intuitive equation for pmax and 1/T0 can be obtained:
p max = r l Δ c U p 0 ν l C e , V ¯ · 1 T 0 + ξ p 0 q tr γ e 1 V 0
Assuming a = r l Δ c U p 0 ν l C e , V ¯ and b = ξ p 0 q tr γ e 1 V 0 , Equation (2) can be expressed as:
p max = a 1 T 0 + b
It is obvious that a linear correlation exists between pmax and 1/T0.
Define φ as the equivalence ratio of the ethanol–air mixture, φ = ([fuel]/[O2])real/([fuel]/[O2])stoich, and x as the volume concentration of ethanol in the mixture. When fuel is the limiting component (φ ≤ 1), the reaction is located on the lean side. According to the chemical reaction equation of oxygen-rich combustion, r l = x and ν l = 1. Substitute them into Equation (2):
a = x Δ c U p 0 C e , V ¯
When oxygen is the limiting component (φ > 1), the reaction is located on the rich side. According to the chemical reaction equation of fuel-rich combustion, r l = 0.21 (1 − x) and ν l = 1. Since oxygen is the limiting component, according to the stoichiometric ratio of oxygen and ethanol in the combustion reaction, Δ c U is reduced to 1 3 Δ c U . Equation (4) can be written as:
a = 0.07 1 x Δ c U p 0 C e , V ¯
Comparing Equations (4) and (5), the value of a varies slightly because x varies from 0.06 to 0.12 in this paper.
Figure 3a shows the variation in pmax with 1/T0 at different ethanol concentrations, where the simulation data pmax,ad are illustrated by hollow points and the measured data pmax,exp are illustrated by solid points and error bars. Due to the heat loss in practical circumstances, pmax,ad is much greater than pmax,exp for all conditions. However, it has the same variation trend as the initial temperature.
The data in Figure 3a are fitted by Equation (3). The fitted lines of pmax,ad and pmax,exp are shown as solid lines and dashed lines, respectively. The slope, intercept, and coefficient of determination of all the fitted lines are listed in Table 2.
From the simulation data section in Table 2, pmax,ad for all concentrations agrees with Equation (3) perfectly. The R2 values and the slight changes in the slope imply the correctness of the aforementioned theoretical analysis. It is also verified by the values of R2 and the slight changes in the slope at 6%, 8%, and 10% in the experimental data section. However, the fluctuation in the experimental data at 12% results in a poor linear relationship, which is probably caused by the instability in flame propagation at concentrations far from the stoichiometric mixture. This is because when the concentration of ethanol is too high, the oxygen in the mixture is seriously insufficient. In this case, ethanol cannot be completely consumed by oxygen, resulting in insufficient combustion and the poor stability of flame propagation. The larger standard deviations in 12% compared to other concentrations support this viewpoint.
From Figure 3b, pmax,ad and pmax,exp both increase first and then decrease as the concentration increases, as determined by examining the simulation and experimental data. The peak values of them for all initial temperatures appear at 8~10% (φ = 1.24~1.59), which is higher than the stoichiometric mixture and consistent with other works, such as propane–air mixtures [28] and ethanol–air mixtures [16]. This is because due to the reversible reaction limit, oxygen cannot be completely consumed at φ = 1. In order to completely consume oxygen, an equivalent ratio slightly greater than 1 is needed.

4.2. Maximum Rates of Pressure Rise

For all concentrations in this work, the maximum rates of pressure rise appear to decrease or at least approach a constant value as the initial temperature increases, as seen in Figure 4a. Similar results were observed for an ethane–air mixture [30]. For a spherical flame with adiabatic propagation, the rate of pressure rise depends on both the laminar combustion velocity and the maximum explosion pressure [31,32,33]. With the increase in the initial temperature, the laminar combustion velocity increases and the maximum explosion pressure decreases. The balance of these two effects determines the overall effect of the initial temperature on the maximum rate of pressure rise [22,34,35].
The plots of (dp/dt)max at various T0 of ethanol–air mixtures with various concentrations are given in Figure 4b. A similar variation trend against concentration is observed for (dp/dt)max compared with pmax. At different T0, the (dp/dt)max reaches peak values, approximately at 8% concentration, slightly greater than the stoichiometric mixture. The obtained results of the maximum explosion pressures and the maximum rates of a pressure rise can both help in the design and safety prevention of a relevant pressure container for ethanol–air mixture explosions.

4.3. Explosion Times and Fast Burning Times

From Figure 5a, the variation trend of θmax against concentration is exactly contrary to that of pmax and (dp/dt)max. As observed in Figure 5a, θmax is significantly dependent on the initial concentration. It is almost unaffected by the variation in the initial temperature within the experimental temperature range. Higher explosion times can be measured in the near-limit mixtures due to the combined effect of lower burning velocities and enhanced heat losses at the vessel’s wall in these mixtures [28]. The minimums of θmax appear at approximately 8% concentration (φ = 1.24) for all initial temperatures, which is the same as (dp/dt)max.
The fast burning time θf is the time from ignition to (dp/dt)max. It is a useful index for designing explosion suppression measures because the difference between the heat generation rate and the heat dissipation rate reaches a maximum at this moment. The ratios from θmax to θf are listed in Figure 5b. At a constant concentration, θf/θmax varies slightly due to the variation in T0. At a constant temperature, θf/θmax varies notably with the concentration. It can be seen that the ratio is generally smaller at concentrations close to the stoichiometric mixture, which is caused by the combustion reaction being more intense at these concentrations. The minimum of θf/θmax is approximately 0.7, occurring at 8% concentration. The explosion times and fast burning times have practical implications for the timing of the release of the explosion suppressant.

4.4. Heat Loss

During the process of flame propagation from ignition to the end of an explosion in a practical case, part of the heat is transferred to the vessel wall rather than absorbed by the gas, which is defined as the heat loss in the explosion process. The proportion of heat loss for each condition can be calculated by the following equation [36]:
F loss = p max , ad p max , exp p max , ad p 0
Figure 6 shows the proportions of heat loss for all conditions. By comparing different concentrations, it was found that the proportions of heat loss at 12% were notably larger than those at other concentrations due to the longer explosion times at this concentration. At a constant concentration, the proportions of heat loss are approximately constant for the whole examined temperature range except for 12%, which may be attributed to the instability in the flame propagation at this concentration.

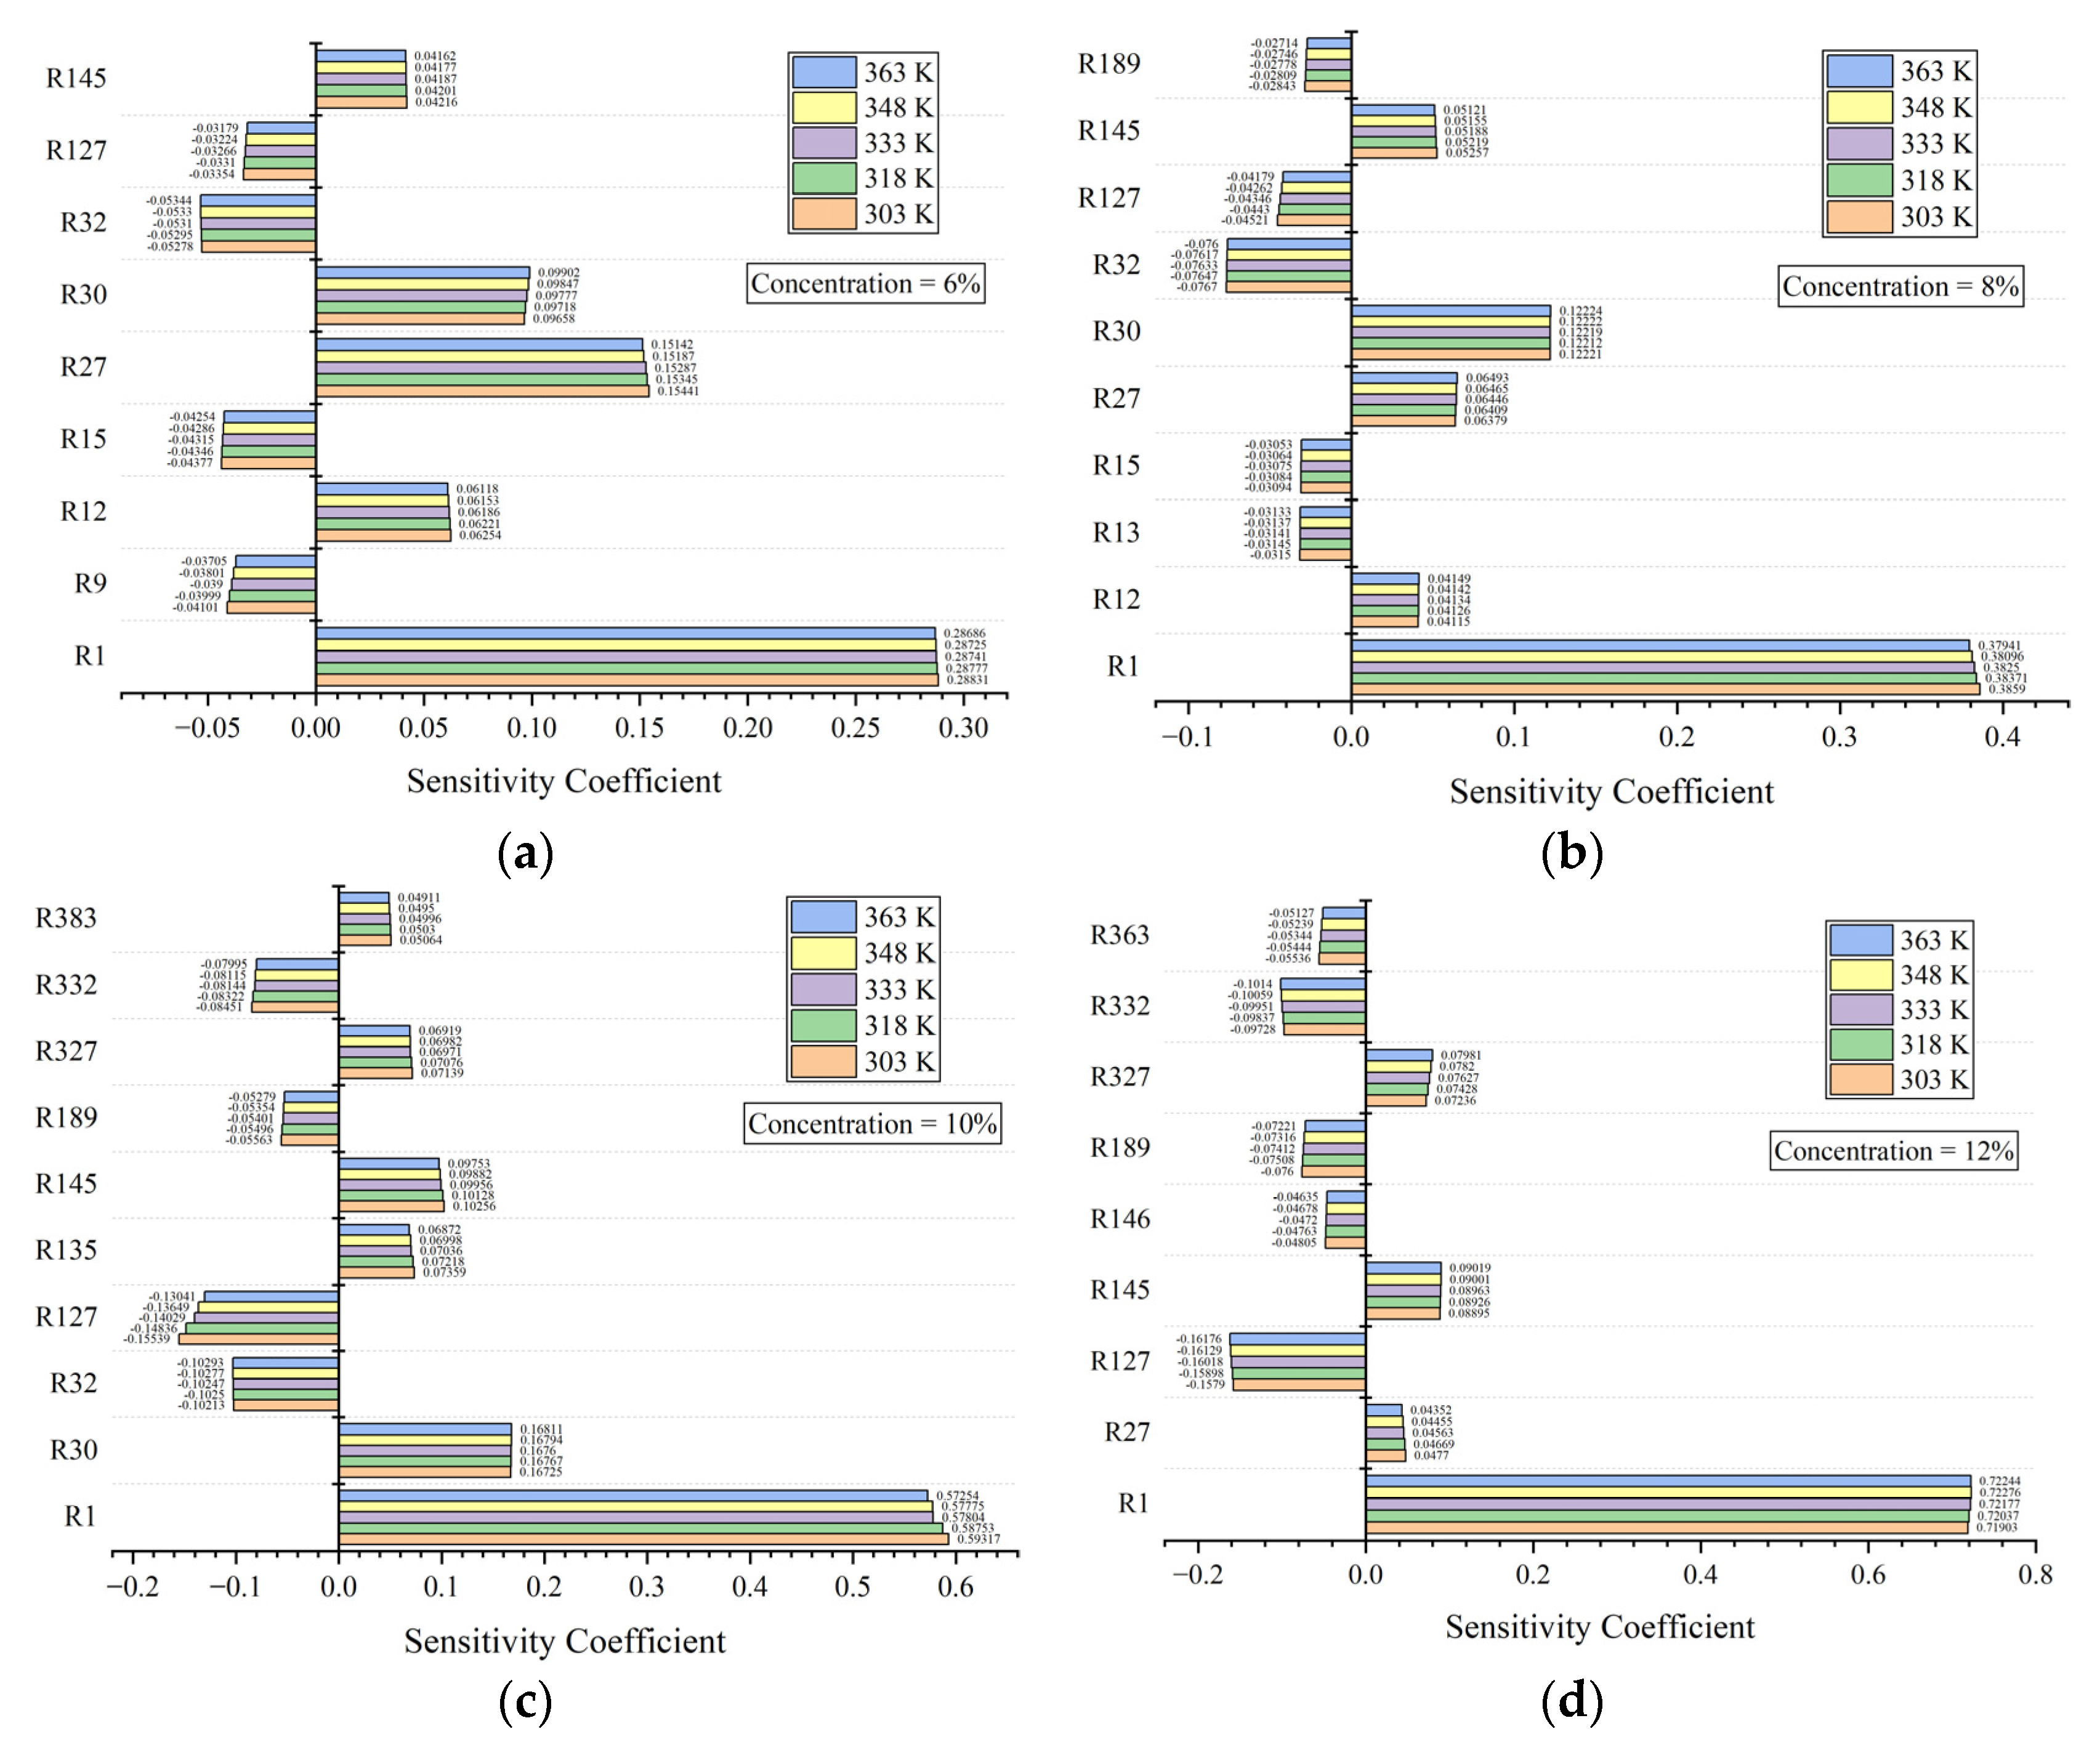
4.5. Sensitivity Analysis

Sensitivity analysis is used to find key elementary reactions and analyze their influence on the reactivity of a premixed flame [37]. The elementary reaction with a positive coefficient can enhance reactivity [38]. Table 3 summarizes the main reactions with the greatest influence on the LBVs for the whole examined concentration range.
Figure 7 shows the sensitivity coefficients of the main reactions for all concentrations. In Figure 7a–d, R1, R27, R30, R32, R127, R145, and R189 show the greatest influence on the LBVs for all examined concentrations. Among them, R1, R27, R30, and R145 have positive influences on the LBV because these elementary reactions are the primary sources of O, OH, and H radicals, and R27 is the main reaction with CO2 as the product. R32, R127, and R189 inhibit the LBV. In all the elementary reactions, R1 is the dominant reaction, and this position becomes more obvious as the concentration increases. For negative reactions, R32 is dominant at 6% and 8%, while R127 is dominant at 10% and 12%. Both of them are the primary consumers of H radicals. The above analysis can help to screen and analyze the main elementary reactions, find out the active free radicals that have the greatest influence on the combustion reaction, and conduct further research accordingly. As shown in Figure 7, the increasing temperature accelerates positive reactions and inhibits negative reactions. Therefore, the LBV increases with the increasing temperature.

5. Conclusions

In this paper, experimental and numerical studies were conducted to study the explosion characteristics of ethanol–air gaseous mixtures under aviation conditions. The initial temperature varied from 303 K to 363 K, the ethanol volume concentration varied from 6% to 12%, and the initial pressure was set at 20 kPa. The influences of the initial temperature and ethanol concentration on the maximum explosion pressure, maximum rate of pressure rise, explosion time, and fast burning time were analyzed. In addition, the heat loss fraction was examined and a sensitivity analysis was conducted.
According to theoretical derivation, a linear relationship exists between pmax and 1/T0 at a constant concentration, and the correctness of the above analysis was confirmed by the simulation and experimental data. At a constant initial temperature, pmax increases first and then decreases as the concentration increases, and the peak values for all initial temperatures appear at 8~10% (φ = 1.24~1.59), higher than the stoichiometric mixture. The pmax,ad is greater than the pmax,exp in all conditions due to the heat loss in practical circumstances.
For all concentrations in this paper, (dp/dt)max appears to decrease or at least approach a constant value as the initial temperature increases, which results from the overall influence of the initial temperature on (dp/dt)max. A similar variation trend against concentration is observed for (dp/dt)max compared with pmax.
θmax and θf/θmax are significantly dependent on the initial concentration and almost unaffected by the variation in the initial temperature. The variation trend of θmax against concentration is exactly contrary to that of pmax and (dp/dt)max. The minimum of θf/θmax is approximately 0.7, occurring at 8% concentration.
At a constant concentration, the proportions of heat loss are approximately constant except for 12%. Moreover, the proportions of heat loss at 12% are notably larger.
In the sensitivity analysis, R1, R27, R30, R32, R127, R145, and R189 showed the greatest influence on the LBVs. Among them, R1 is the dominant reaction in all the elementary reactions, and this position becomes more obvious as the concentration increases. R1, R27, R30, and R145 have positive influences on the LBV because these elementary reactions are the primary sources of O, OH, and H radicals. R32, R127, and R189 are the main negative reactions, in which R32 and R127 are the primary consumers of H radicals. Moreover, the LBV increases with the increasing temperature.
This work can enrich the test and simulation data for the study of ethanol explosion characteristics in the aviation environment and provide references for the safety design of ethanol–air explosion containers and the hazard assessment of explosion accidents. In view of the application prospect of ethanol in the aviation field, the study of the explosion characteristics of ethanol/aviation kerosene blended fuel in the aviation environment should be carried out systematically in the near future.

Author Contributions

Conceptualization, X.N.; Methodology, X.N.; Software, X.N.; Validation, Z.Z. and K.Z.; Formal analysis, X.N.; Investigation, X.N.; Resources, J.W.; Writing—original draft, X.N.; Writing—review & editing, X.W.; Supervision, X.W. and J.W.; Project administration, J.W.; Funding acquisition, X.W. and J.W. All authors have read and agreed to the published version of the manuscript.

Funding

This research was funded by the National Science and Technology Major Project, grant number J2019-VIII-0010-0171; the Science and Technology Program of Fire and Rescue Department Ministry of Emergency Management of China, grant number 2022XFZD03; and the Key Laboratory of Civil Aviation Thermal Hazards Prevention and Emergency Response, grant number RZH2021-KF-04.

Institutional Review Board Statement

Not applicable.

Informed Consent Statement

Not applicable.

Data Availability Statement

The data presented in this study are available on request from the corresponding author.

Conflicts of Interest

The authors declare no conflict of interest.

Nomenclature

p0initial pressure
pmaxmaximum explosion pressure, including pmax,ad and pmax,exp
pmax,admaximum explosion pressure in adiabatic conditions
pmax,expmaximum explosion pressure in experimental conditions
T0initial temperature
T e , V ¯ average flame temperature
V0explosion vessel volume
xethanol volume concentration in ethanol–air mixture
n0total mole number of the mixture before combustion
netotal mole number of the mixture after combustion
nlmole number of the limiting component in the mixture
ξ ne/n0
rlnl/n0
ν l the stoichiometric coefficient of the limiting component in the mixture
Δ c U the modified combustion heat (at constant volume and T0) after considering the endothermic process
C e , V ¯ the average molar heat capacity at constant volume of the gaseous mixture at the end of combustion, averaged for the temperature range T 0 to T e , V ¯
qtrthe heat amount transferred to the vessel wall and lost outside the system at the end of combustion
γ e the adiabatic coefficient of the gaseous mixture at the end of combustion
(dp/dt)maxmaximum rate of pressure rise
θmaxexplosion time
θffast burning time
F loss proportion of heat loss
aslope of the fitted line pmax − 1/T0
bintercept of the fitted line pmax − 1/T0
R2coefficient of determination of the fitted line pmax − 1/T0
φthe equivalence ratio of the ethanol–air mixture, φ = ([fuel]/[O2])real/([fuel]/[O2])stoich

References

  1. Agarwal, A.K. Biofuels (alcohols and biodiesel) applications as fuels for internal combustion engines. Prog. Energy Combust. 2007, 33, 233–271. [Google Scholar] [CrossRef]
  2. Geng, L.; Bi, L.; Li, Q.; Chen, H.; Xie, Y. Experimental study on spray characteristics, combustion stability, and emission performance of a CRDI diesel engine operated with biodiesel–ethanol blends. Energy Rep. 2021, 7, 904–915. [Google Scholar] [CrossRef]
  3. Mohammed, M.K.; Balla, H.H.; Al-Dulaimi, Z.M.H.; Kareem, Z.S.; Al-Zuhairy, M.S. Effect of ethanol-gasoline blends on SI engine performance and emissions. Case Stud. Therm. Eng. 2021, 25, 100891. [Google Scholar] [CrossRef]
  4. Prasath, K.; Manivannan, S.; Marimuthu, S.; Kannan, C.R.; Das, A.D. Experimental investigation of ethanol blended diesel fuel in single cylinder CI engine. Mater. Today Proc. 2021, in press. [Google Scholar] [CrossRef]
  5. Prathipati, R.; Aditya Harshavardhan, K.H.; KarthikVarma, D.; Siddabathula, V.; Ramachandran, B. An empirical research on the investigation of DI diesel engine fuelled by ethanol. Mater. Today Proc. 2021, in press. [Google Scholar] [CrossRef]
  6. Coronado, C.J.; Carvalho, J.O., Jr.; Andrade, J.C.; Mendiburu, A.Z.; Cortez, E.V.; Carvalho, F.S.; Goncalves, B.; Quintero, J.C.; Velasquez, E.I.; Silva, M.H.; et al. Flammability limits of hydrated and anhydrous ethanol at reduced pressures in aeronautical applications. J. Hazard. Mater. 2014, 280, 174–184. [Google Scholar] [CrossRef] [PubMed]
  7. Liu, Y.; Gu, W.; Wang, J.; Rao, D.; Chen, X.; Ma, H.; Zeng, W. Study on the laminar burning velocity of ethanol/RP-3 aviation kerosene premixed flame. Combust. Flame 2022, 238, 111921. [Google Scholar] [CrossRef]
  8. Xu, J. An explosion accident caused by the ethanol vapor vent pipe set in the room. Labour Prot. 2019, 3, 62–63. (In Chinese) [Google Scholar]
  9. Brooks, M.R.; Crowl, D.A. Flammability envelopes for methanol, ethanol, acetonitrile and toluene. J. Loss Prev. Process. 2007, 20, 144–150. [Google Scholar] [CrossRef]
  10. Coronado, C.J.; Carvalho, J.A., Jr.; Andrade, J.C.; Cortez, E.V.; Carvalho, F.S.; Santos, J.C.; Mendiburu, A.Z. Flammability limits: A review with emphasis on ethanol for aeronautical applications and description of the experimental procedure. J. Hazard. Mater. 2012, 241–242, 32–54. [Google Scholar] [CrossRef]
  11. Wan, X.; Zhang, Q. Numerical study of influence of initial pressures and temperatures on the lower flammability limits of oxygenated fuels in air. J. Loss Prev. Process. 2016, 41, 40–47. [Google Scholar] [CrossRef]
  12. Velasquez, E.I.G.; Coronado, C.J.R.; Cartagena, J.C.Q.; Carvalho, J.A.; Mendiburu, A.Z.; Andrade, J.C.; Cortez, E.V.; Santos, J.C. Prediction of flammability limits for ethanol-air blends by the Kriging regression model and response surfaces. Fuel 2017, 210, 410–424. [Google Scholar] [CrossRef]
  13. Bradley, D.; Lawes, M.; Mansour, M.S. Explosion bomb measurements of ethanol-air laminar gaseous flame characteristics at pressures up to 1.4 MPa. Combust. Flame 2009, 156, 1462–1470. [Google Scholar] [CrossRef]
  14. Cammarota, F.; Di Benedetto, A.; Di Sarli, V.; Salzano, E. The effect of hydrogen addition on the explosion of ethanol/air mixtures. Chem. Eng. Trans. 2012, 26, 405–410. [Google Scholar]
  15. Li, Q.; Cheng, Y.; Huang, Z. Comparative assessment of the explosion characteristics of alcohol-air mixtures. J. Loss Prev. Process. 2015, 37, 91–100. [Google Scholar] [CrossRef]
  16. Mitu, M.; Brandes, E. Influence of pressure, temperature and vessel volume on explosion characteristics of ethanol/air mixtures in closed spherical vessels. Fuel 2017, 203, 460–468. [Google Scholar] [CrossRef]
  17. Mitu, M.; Brandes, E.; Hirsch, W. Mitigation effects on the explosion safety characteristic data of ethanol/air mixtures in closed vessel. Process. Saf. Environ. 2018, 117, 190–199. [Google Scholar] [CrossRef]
  18. Zhao, X.; Chen, C.; Shi, C.; Zhao, D.; Chen, J.; Lei, P.; Zhang, Y. Experimental study on deflagration of ethanol vapor from pool with different location and area in tunnel. J. Loss Prev. Process. 2019, 60, 213–220. [Google Scholar] [CrossRef]
  19. Chen, C.; Zhang, Y.; Zhao, X.; Lei, P.; Nie, Y. Experimental study on the influence of obstacle aspect ratio on ethanol liquid vapor deflagration in a narrow channel. Int. J. Therm. Sci. 2020, 153, 106354. [Google Scholar] [CrossRef]
  20. Xu, C.; Wu, S.; Li, Y.; Chu, S.; Wang, C. Explosion characteristics of hydrous bio-ethanol in oxygen-enriched air. Fuel 2020, 271, 117604. [Google Scholar] [CrossRef]
  21. ASTM E681-04; Standard Test Method for Concentration Limits of Flammability of Chemicals (Vapors and Gases). American Society of Testing Materials: West Conshohocken, PA, USA, 2004.
  22. Razus, D.; Brinzea, V.; Mitu, M.; Movileanu, C.; Oancea, D. Temperature and pressure influence on maximum rates of pressure rise during explosions of propane-air mixtures in a spherical vessel. J. Hazard. Mater. 2011, 190, 891–896. [Google Scholar] [CrossRef] [PubMed]
  23. Mittal, G.; Burke, S.M.; Davies, V.A.; Parajuli, B.; Metcalfe, W.K.; Curran, H.J. Autoignition of ethanol in a rapid compression machine. Combust. Flame 2014, 161, 1164–1171. [Google Scholar] [CrossRef]
  24. Egolfopoulos, F.N.; Du, D.X.; Law, C.K. A study on ethanol oxidation kinetics in laminar premixed flames, flow reactors, and shock tubes. Symp. (Int.) Combust. 1992, 24, 833–841. [Google Scholar] [CrossRef]
  25. Pekalski, A.A.; Schildberg, H.P.; Smallegange, P.S.D.; Lemkowitz, S.M.; Zevenbergen, J.F.; Braithwaite, M.; Pasman, H.J. Determination of the Explosion Behaviour of Methane and Propene in Air or Oxygen at Standard and Elevated Conditions. Process. Saf. Environ. 2005, 83, 421–429. [Google Scholar] [CrossRef]
  26. Dupont, L.; Accorsi, A. Explosion characteristics of synthesised biogas at various temperatures. J. Hazard. Mater. 2006, 136, 520–525. [Google Scholar] [CrossRef]
  27. Huzayyin, A.S.; Moneib, H.A.; Shehatta, M.S.; Attia, A.M.A. Laminar burning velocity and explosion index of LPG–air and propane–air mixtures. Fuel 2008, 87, 39–57. [Google Scholar] [CrossRef]
  28. Razus, D.; Brinzea, V.; Mitu, M.; Oancea, D. Temperature and pressure influence on explosion pressures of closed vessel propane-air deflagrations. J. Hazard. Mater. 2010, 174, 548–555. [Google Scholar] [CrossRef]
  29. Oancea, D.; Gosa, V.; Ionescu, N.I.; Popescu, D. An experimental method for the measurement of adiabatic maximum pressure during an explosive gaseous combustion. Rev. Roum. Chim. 1985, 30, 767–776. [Google Scholar]
  30. Mitu, M.; Giurcan, V.; Razus, D.; Oancea, D. Temperature and Pressure Influence on Ethane–Air Deflagration Parameters in a Spherical Closed Vessel. Energy Fuels 2012, 26, 4840–4848. [Google Scholar] [CrossRef]
  31. Dahoe, A.E.; Zevenbergen, J.F.; Lemkowitz, S.M.; Scarlett, B. Dust explosions in spherical vessels: The role of flame thickness in the validity of the ‘cube-root law’. J. Loss Prev. Process. 1996, 9, 33–44. [Google Scholar] [CrossRef]
  32. Van den Bulck, E. Closed algebraic expressions for the adiabatic limit value of the explosion constant in closed volume combustion. J. Loss Prev. Process. 2005, 18, 35–42. [Google Scholar] [CrossRef]
  33. Cammarota, F.; Di Benedetto, A.; Russo, P.; Salzano, E. Experimental analysis of gas explosions at non-atmospheric initial conditions in cylindrical vessel. Process. Saf. Environ. 2010, 88, 341–349. [Google Scholar] [CrossRef]
  34. Gieras, M.; Klemens, R. Experimental Studies of Explosions of Methane-Air Mixtures in a Constant Volume Chamber. Combust. Sci. Technol. 2009, 181, 641–653. [Google Scholar] [CrossRef]
  35. Cammarota, F.; Di Benedetto, A.; Di Sarli, V.; Salzano, E. Influence of initial temperature and pressure on the explosion behavior of n-dodecane/air mixtures. J. Loss Prev. Process. 2019, 62, 103920. [Google Scholar] [CrossRef]
  36. Wang, T.; Luo, Z.; Wen, H.; Cheng, F.; Liu, L.; Su, Y.; Liu, C.; Zhao, J.; Deng, J.; Yu, M. The explosion enhancement of methane-air mixtures by ethylene in a confined chamber. Energy 2021, 214, 119042. [Google Scholar] [CrossRef]
  37. Mohammad, A.; Juhany, K.A. Laminar burning velocity and flame structure of DME/methane + air mixtures at elevated temperatures. Fuel 2019, 245, 105–114. [Google Scholar] [CrossRef]
  38. Zhou, J.; Lu, C.; Xu, C.; Yu, Z. Experimental and Numerical Study on the Effect of Hydrogen Addition on Laminar Burning Velocity of Ethanol–Air Mixtures. Energies 2022, 15, 3114. [Google Scholar] [CrossRef]
Figure 1. Schematic diagram of the experimental system.
Fire 06 00349 g001
Figure 2. Pressure and dp/dt curves of one test at 303 K and 8% concentration.
Fire 06 00349 g002
Figure 3. (a) Variation in pmax with 1/T0 at different ethanol concentrations; (b) variation in pmax with concentration at different T0.
Fire 06 00349 g003
Figure 4. (a) Variation in (dp/dt)max with T0 at different ethanol concentrations; (b) variation in (dp/dt)max with ethanol concentration at different T0.
Fire 06 00349 g004
Figure 5. (a) Variation in θmax with ethanol concentration at different T0; (b) ratios of θf/θmax in different T0 at different ethanol concentrations.
Fire 06 00349 g005
Figure 6. Proportions of heat loss in different T0 at different ethanol concentrations.
Fire 06 00349 g006
Figure 7. Sensitivity coefficients of the main reactions at four concentrations, (a) at 6%, (b) at 8%, (c) at 10% and (d) at 12%.
Fire 06 00349 g007
Table 1. Test conditions.
Initial PressureInitial TemperaturesConcentration (vol%)
20 kPa303 K, 318 K, 333 K, 348 K, 363 K6%, 8%, 10%, 12%
Table 2. Parameters of the fitted lines of pmax − 1/T0.
Equation p max = a 1 T 0 + b
Data SourceConcentrationSlope (a)Intercept (b)Coefficient of Determination (R2)
Simulation
(pmax,ad)
6%51.50 ± 0.015.80 ± 0.021
8%54.83 ± 0.007.62 ± 0.001
10%51.84 ± 0.0113.20 ± 0.021
12%48.53 ± 0.0215.73 ± 0.051
Experiment
(pmax,exp)
6%33.44 ± 1.2518.17 ± 3.670.9853
8%34.00 ± 2.2626.19 ± 6.700.9610
10%30.80 ± 1.1836.72 ± 3.540.9834
12%17.79 ± 4.8363.01 ± 14.690.5913
Table 3. Main reactions with the greatest influence on the LBVs.
R1H + O2 <=> O + OHR135CH3 + OH <=> CH2OH + H
R9H + O2(+M) <=> HO2(+M)R145CH3 + HO2 <=> CH3O + OH
R12HO2 + H <=> OH + OHR146CH3 + HO2 <=> CH4 + O2
R13H2 + O2 <=> H + HO2R189CH3 + CH3(+M) <=> C2H6(+M)
R15HO2 + OH <=> H2O + O2R327C2H2 + H(+M) <=> C2H3(+M)
R27CO + OH <=> CO2 + HR332C2H3 + H <=> C2H2 + H2
R30HCO + M <=> H + CO + MR363C2H5OH + H <=> SC2H4OH + H2
R32HCO + H <=> CO + H2R383SC2H4OH <=> CH3CHO + H
R127CH3 + H(+M) <=> CH4(+M)
Disclaimer/Publisher’s Note: The statements, opinions and data contained in all publications are solely those of the individual author(s) and contributor(s) and not of MDPI and/or the editor(s). MDPI and/or the editor(s) disclaim responsibility for any injury to people or property resulting from any ideas, methods, instructions or products referred to in the content.

