Article

Summer Compound Drought-Heat Extremes Amplify Fire-Weather Risk and Burned Area beyond Historical Thresholds in Chongqing Region, Subtropical China

1
School of Life Science and Engineering, Southwest University of Science and Technology, Mianyang 621010, China
2
Department of Crop and Forest Sciences & Agrotecnio Center, Universitat de Lleida, 25198 Leida, Spain
*
Author to whom correspondence should be addressed.
Fire 2023, 6(9), 346; https://doi.org/10.3390/fire6090346
Submission received: 16 June 2023 / Revised: 25 August 2023 / Accepted: 28 August 2023 / Published: 5 September 2023
(This article belongs to the Section Fire Science Models, Remote Sensing, and Data)

Abstract

:
Global warming is associated with an increase in compound drought-heat events (CDHEs), leading to larger and more extreme fire-weather risk in mesic forests. Wildfire activity in subtropical China, under the influence of monsoonal rainfall, was historically limited to dry winters and rare in rainy summers. Here, we seek to test whether this area is on the brink of a major change in its fire regime characterized by larger fire seasons, extending into the summer, leading to increases in fire activity (burned area). We analyze fire activity in Chongqing Municipality (46,890 km2), an important area of subtropical China hosting the Three Gorges Reservoir Area. We observed significant increases in summer forest fires under anomalous dry-hot summer conditions, where the total burned area was 3–6 times the historical annual mean (previously confined to the winter season). Vapor pressure deficit (VPD), an indicator of hot and dry weather conditions (i.e., fire-weather risk), was a strong predictor of fire activity, with larger wildfires occurring on days where VPD was higher than 3.5 kPa. Results indicate that a major wildfire activity expansion may occur in the area due to climate change and the widening time window of fire-weather risk, unless strong fire prevention and local adaptation policies are implemented.

1. Introduction

Anthropogenic climate change is actively increasing fire-weather risk, boosting fire activity in many biomes of the earth [1]. Climate change has already become a significant driver controlling fire seasonality in forest ecosystems [1]. For instance, the rise in mean temperatures (i.e., winter, summer, and year-round average temperatures) is causing the lengthening of the forest fire-weather season [1,2,3]. However, climate change involves more than the average trends; more frequent extreme weather events are gaining recognition among environmental scientists and the public—the phenomena of compound drought-heat extremes (CDHEs) that nowadays fuel the intense fire-weather days—putting new pressures on forest ecosystems worldwide [4].
The conjunction of both average/extreme factors is becoming increasingly evident in subtropical China [5,6], with serious implications for forest adaptation to climate change, including forest fire prevention. The impact of CDHEs can be especially severe in summer, disrupting the historical rainy monsoon; therefore, it may reduce precipitation significantly in China. And summer CDHEs can cause a quick decline in dead fuel moisture content (DFMC), which responds rapidly (i.e., from hours to 1 day) to vapor pressure deficit (VPD) [7]. Historical fire season in subtropical China had generally occurred during winter months [8], but CDHEs may lengthen fire weather further into the summer. An anomalous summer fire season might develop on top of the historical winter fire season, with dramatic consequences for human well-being and ecosystems. This hypothesis needs to be empirically tested in subtropical China. Empirical research indicates that CDHEs are increasing their frequencies, duration, and intensity, while model projections expect that these trends will accentuate in the future, particularly in summer [9,10].
As climate change and its related CDHEs accelerate, the scientific community is developing fast and efficient tools to adequately estimate drought-heat stress. A straightforward method consists of measuring VPD, a variable that parsimoniously describes evaporative demand as a function of temperature and relative humidity [11]: the higher temperature and lower humidity—the higher VPD—the higher physiological stress that the vegetation is subjected to [12], which terminates in plant mortality. This intensified eco-physiological stress, degradation, and mortality directly translate into DFMC and LFMC (live fuel moisture content) decreases [7,13], which—at the forest landscape—equate to higher likelihood of forest fire. In recent decades, climate change has been and is promoting a steady increase in VPD throughout the world environments and forest ecosystems [14], posing an imminent threat to global carbon sinks [15]. These studies have advanced our understanding of the role of VPD thresholds that—once crossed—play in triggering new states in vegetation flammability and forest fire activity [16]. In summary, VPD is a straightforward measure of fire-weather risk.
In this article, our aim is to gauge the effects of CDHEs on fire-weather risk (daily VPD) and fire activity (actual burned area) in Chongqing Administrative Region, subtropical China, for the last 22 years (2001–2022). This region is home to the Three Gorges Reservoir, where remnant patches of the native forests are present (see next section) [17]. Local forest ecosystems in Chongqing play a critical role in controlling soil erosion and preventing siltation in China’s long-term strategic energy project, i.e., the Three Gorges Hydropower plant.
We first proceed to identify the summer CDHEs and assess their effects on forest burned area by comparing summer burned areas with those recorded during the winter seasons for the period 2001–2022. Second, we compare fire-weather variables between the regular humid summer seasons (i.e., rainy and without fire), and the anomalous dry (CDHE) summer seasons (i.e., extremely dry and hot conditions), to identify critical weather thresholds, and analyze their relationship with forest burned area. Finally, we discuss the implications of increasing extreme CDHEs for forest burned area, fire-weather risk, and local ecosystem management in the context of climate change.

2. Study Region, Materials and Methods

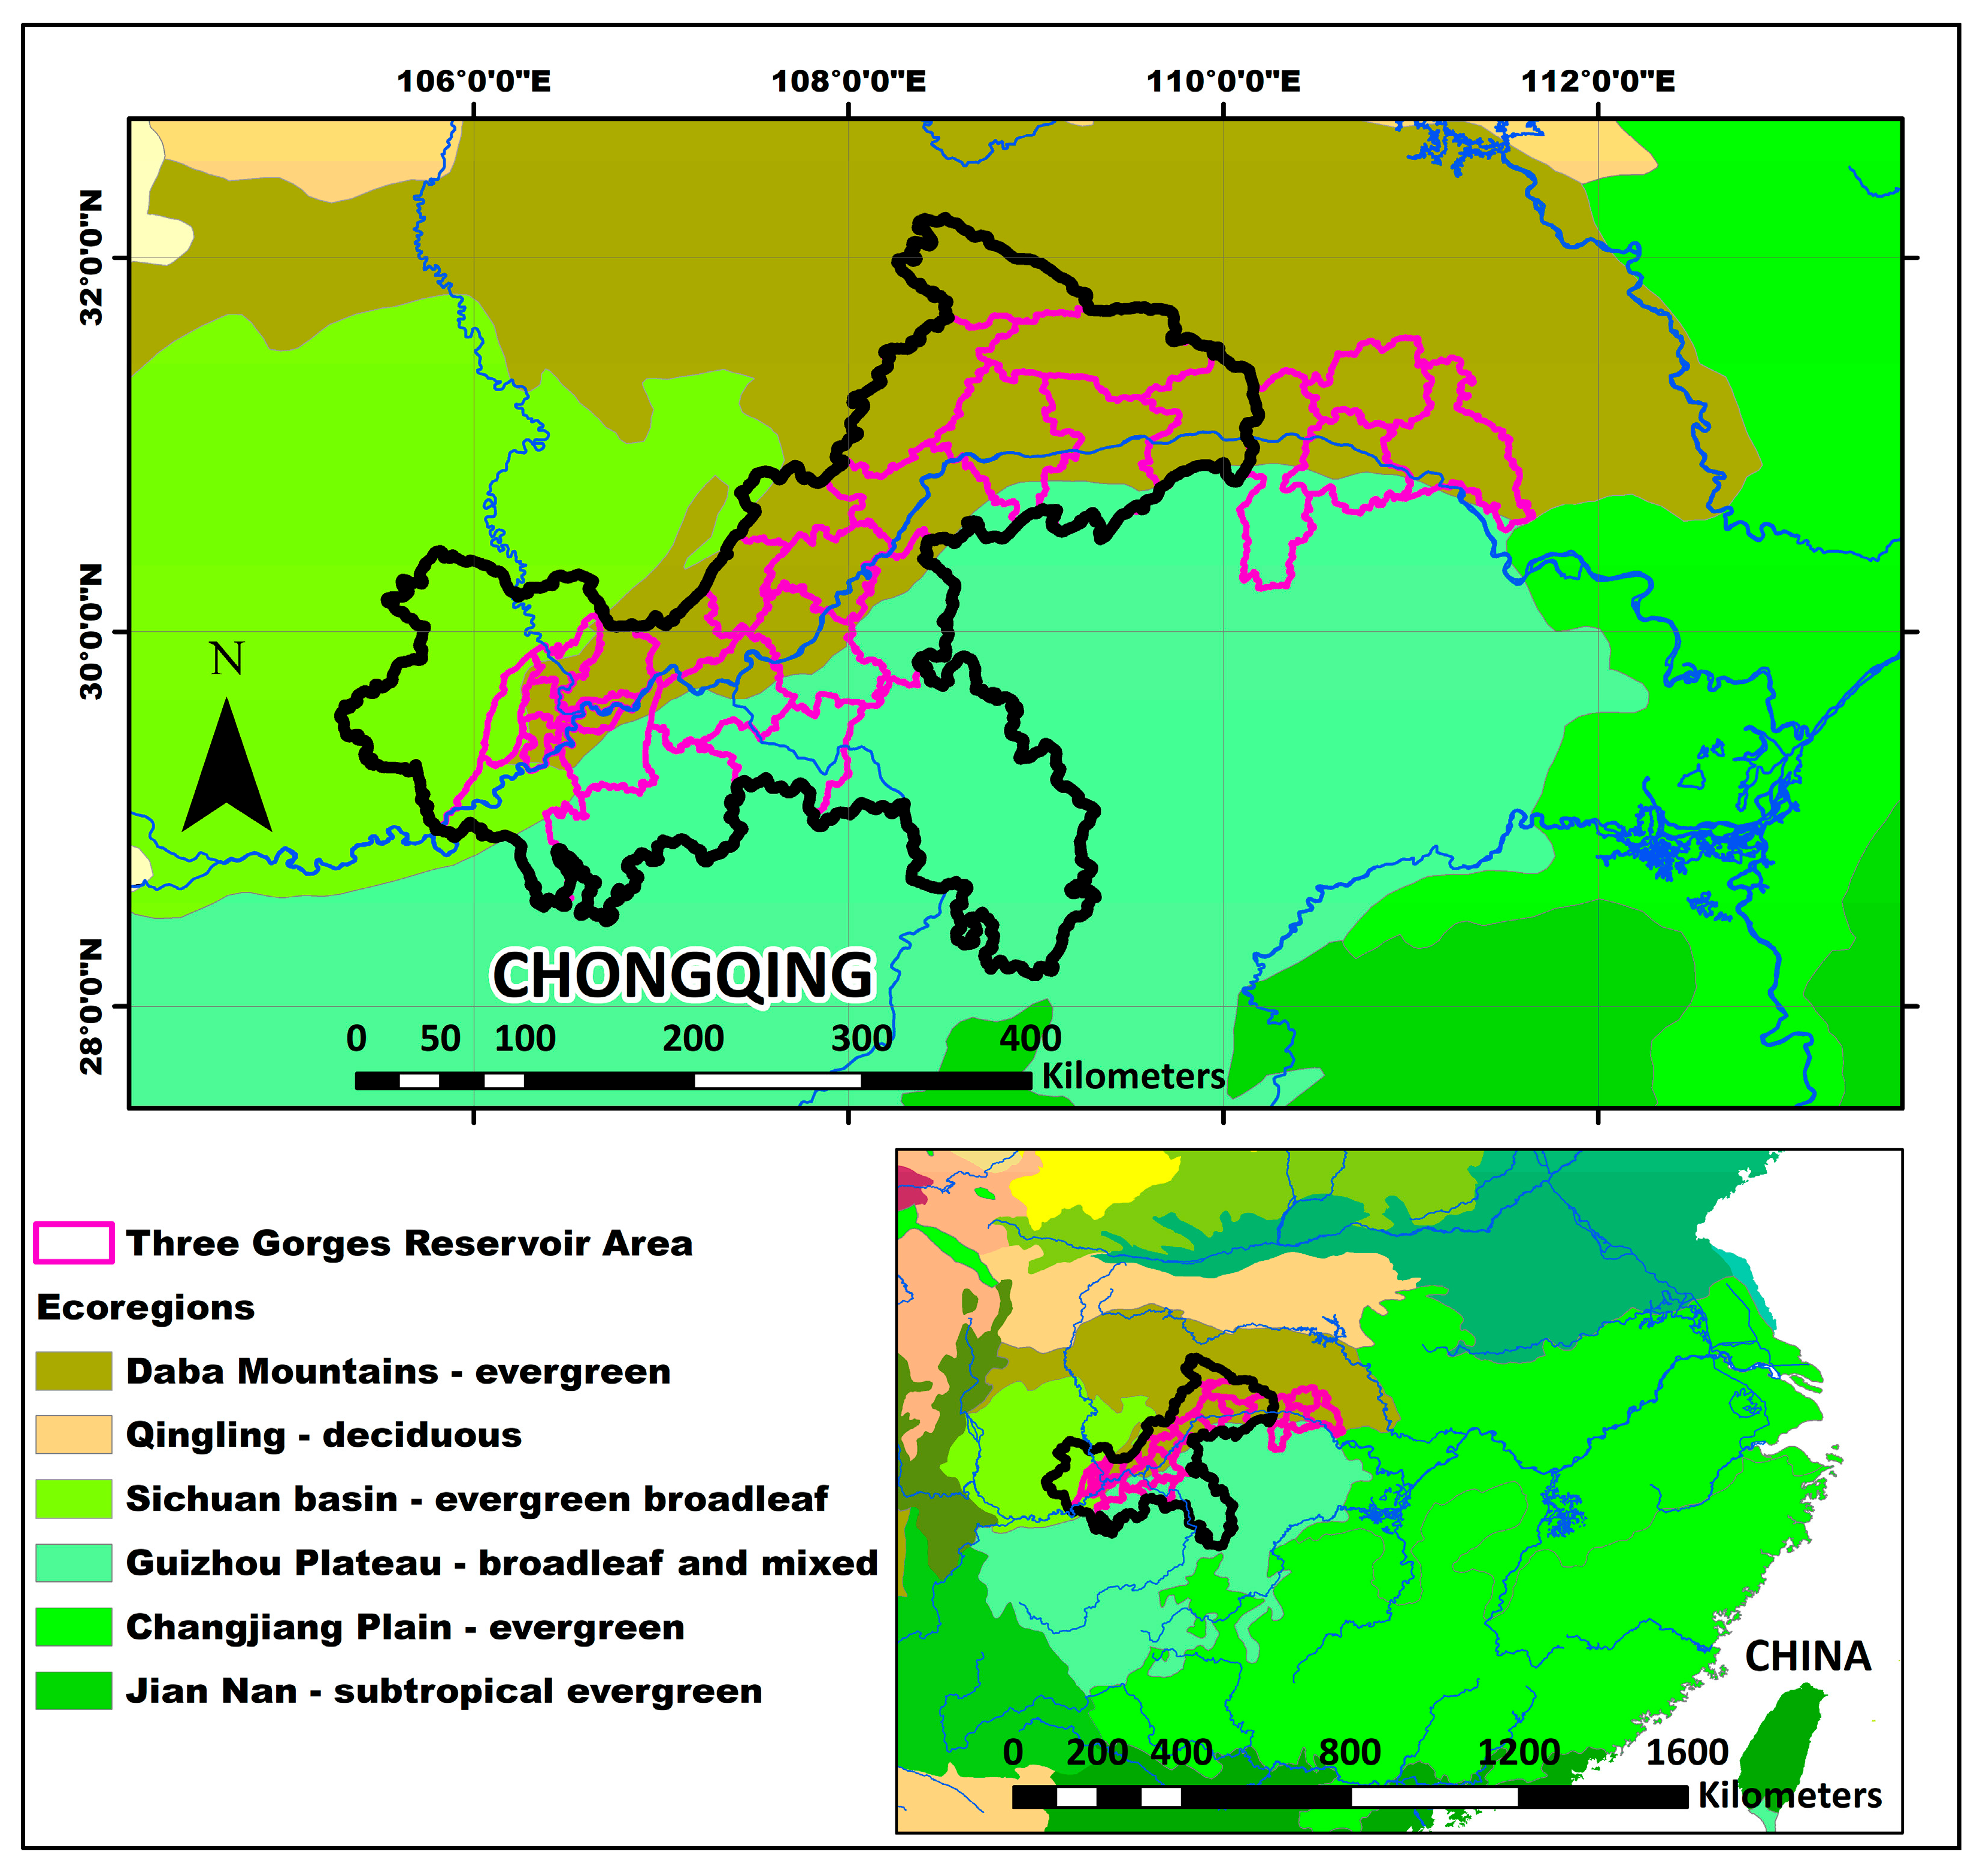
2.1. Study Region and Ecological Significance

Chongqing administrative region is in South Central China, containing most of the area of the Three Gorges Reservoir (Figure 1). Chongqing presents a subtropical vegetation with a historical subtropical summer monsoon humid climate, that includes the following three forest ecoregions:
(a)
Sichuan Basin evergreen broadleaf forests;
(b)
Daba Mountains evergreen forests;
(c)
Guizhou Plateau broadleaf and evergreen forests [17].
Most areas in Chongqing present 1000–1300 mm of annual rainfall, 70% of which falls normally between May and September. The evergreen broadleaf formations, highly representative of the vegetation in subtropical China, mainly include the Cyclobalanopsis spp. and Lithocarpus spp. (Fagaceae), Machilus spp. (Lauraceae), Schima spp. and Gordonia spp. (Theaceae) in the semi-natural forests of Chongqing [18]. According to recent local studies, forest vegetation in Chongqing has been recovering fast, with an average NDVI 4.4% increment per decade during the period 2000–2019 [19].
Chongqing administrative region holds the title of being the Key Ecological Protection Zone of the Upper Reaches of the Yangtze River Basin [20]. The local forest ecosystems prevent soil erosion, which is paramount to controlling water quality and avoiding downstream siltation, to guarantee the long-term viability of the Three Gorges Hydropower Station, with an important role in the sustainable development of the whole nation.
Regarding climate change, Chongqing has steadily become drier and hotter since the late 1990s onwards [21]. CDHEs are nowadays more frequent, intense, and long-lasting in the region [5,22,23,24]. In the years 2006 and 2022, Chongqing underwent two CDHEs, respectively, as stated by China’s meteorological agencies [25,26,27], with 2006 having an intense fire weather only second to the 2022, which has been the most serious CDHE since 1961.
In the next sections, we evaluate fire activity (burned area) and fire-weather risk (VPD) trends over the region, analyzing the summer CDHEs of 2006 and 2022, in addition to other meteorologically unusual years, 2011 and 2013, throughout the whole period of 2001–2022 [28]. We seek to test the general hypothesis that recent increasing frequencies in summer CDHEs are leading to a longer summer fire-weather season, with summer burned area surpassing in CDHE years that of the winter season, which contrasts with the historical fire season, with low fire activity in both winter and summer seasons.

2.2. Burned Area (2001–2022)

Chongqing region’s burned area data were retrieved from the forest fire statistics contained in the GLOBFIRE database (2001–2020) and downloaded raw satellite images from MODIS product MCD64A1 (2021–2022) (Table 1) [29]. In fact, forest fire records contained in GLOBFIRE are calculated from MCD64A1—the same data source—allowing for direct data comparability. We first analyzed annual (January–December) historical burned area trends between 2001 and 2022, with ArcGIS 10.7 and RStudio software (2023.03.0 Build 386).
For each year’s winter and summer, we measured fire activity based on actual burned area, including fire activity detected in both forest ecosystems and agricultural land. We compared total cumulative burned area (ha) between the historical winter and the summer fire seasons for the period 2001–2022.

2.3. Fire-Weather Variables (2001–2022)

We obtained the 2001–2022 meteorological data series from 35 local weather stations in Chongqing (between 1 July and 30 September), for the following variables: daily precipitation, daily maximum temperature, and daily mean relative humidity. We carried out kriging spatial interpolation, with data from the 35 weather stations, using the krige function of the gstat package developed by Pebesma and Graeler [34] and other R libraries (sf, sp., raster, rgdal, rasterVis) within the RStudio programming environment (RStudio 2023.03.0 Build 386). The spatial pixel resolution is longitude 0.201° (WGS84 geographic coordinates), i.e., equivalent to longitude 19.5 km and latitude 22.4 km (UTM Zone 48N) (Table 1). We decided to use this lower resolution, considering the spatial density of the 35 weather stations in our study area. The RMSE (Root Mean Square Error) of the kriging model was 0.342392, reaching an adequate goodness of fit (for details, see Supplementary Materials).
To complement the analysis of the previous interpolation, we also collected daily re-analysis meteorological data for the brunt of the summer period (July–August, 2001–2022) from the Copernicus ERA5 satellite collections (https://cds.climate.copernicus.eu/cdsapp#!/dataset/reanalysis-era5-single-levels?tab=overview; accessed on 27 October 2022). These data consisted of daily precipitation, maximum temperature (2 m above terrain surface), relative humidity at 3 pm (2 m above surface), and our own estimation of daily VPD (see Supplementary Information and Figure A1, Figure A2, Figure A3 and Figure A4). The spatial resolution of these data was 0.1°, which in the study area are equivalent to 9.84 km longitude × 11.25 km latitude (UTM Zone 48N).
In our analyses, we calculated central -estimation statistics (mean and median) over the whole territory of Chongqing: cumulative mean daily precipitation, median daily max temperature, median relative humidity, median VPD. VPD provides robust estimations of environmental drought-heat stress and environmental fire risk [35], being closely related with DFMC. For details, see the semi-mechanistic approach to the issue in Resco de Dios et al. [7]. Furthermore, the severity of fire weather was calculated by accumulating the number of days with VPD above 3.5 kPa within the summer season, since in our research region this is the threshold above which most large fires (>100 ha) tended to occur (Figure A5). This threshold is consistent with sensitive fire weather for subtropical forest ecosystems (2.7–3.6 kPa) at the global level [14,15].

2.4. Spatiotemporal Analyses

We represented the summer fire centroids of each year; 2006, 2011, 2013, and 2022 had the most relevant summer fire seasons in Chongqing (shown below). After analysis, we found no fires in the summers of the remaining group of years. For each year of the period 2001–2022, we estimated the daily VPD 85th percentile across the whole territory of Chongqing Municipality, to reveal the most extreme fire-weather risk. We then calculated, at each pixel of Chongqing Municipality, the total number of days under VPD > 3.5 kPa within the summer period for each year. Using the statistical base function density in RStudio, we calculated the Probability Density Function of the total number of days under VPD > 3.5 kPa. This method allowed us to estimate the likelihood and extent in ha affected by heat-drought stress, i.e., the percentage of the territory affected by different durations (number of days) under VPD > 3.5 kPa.

3. Results

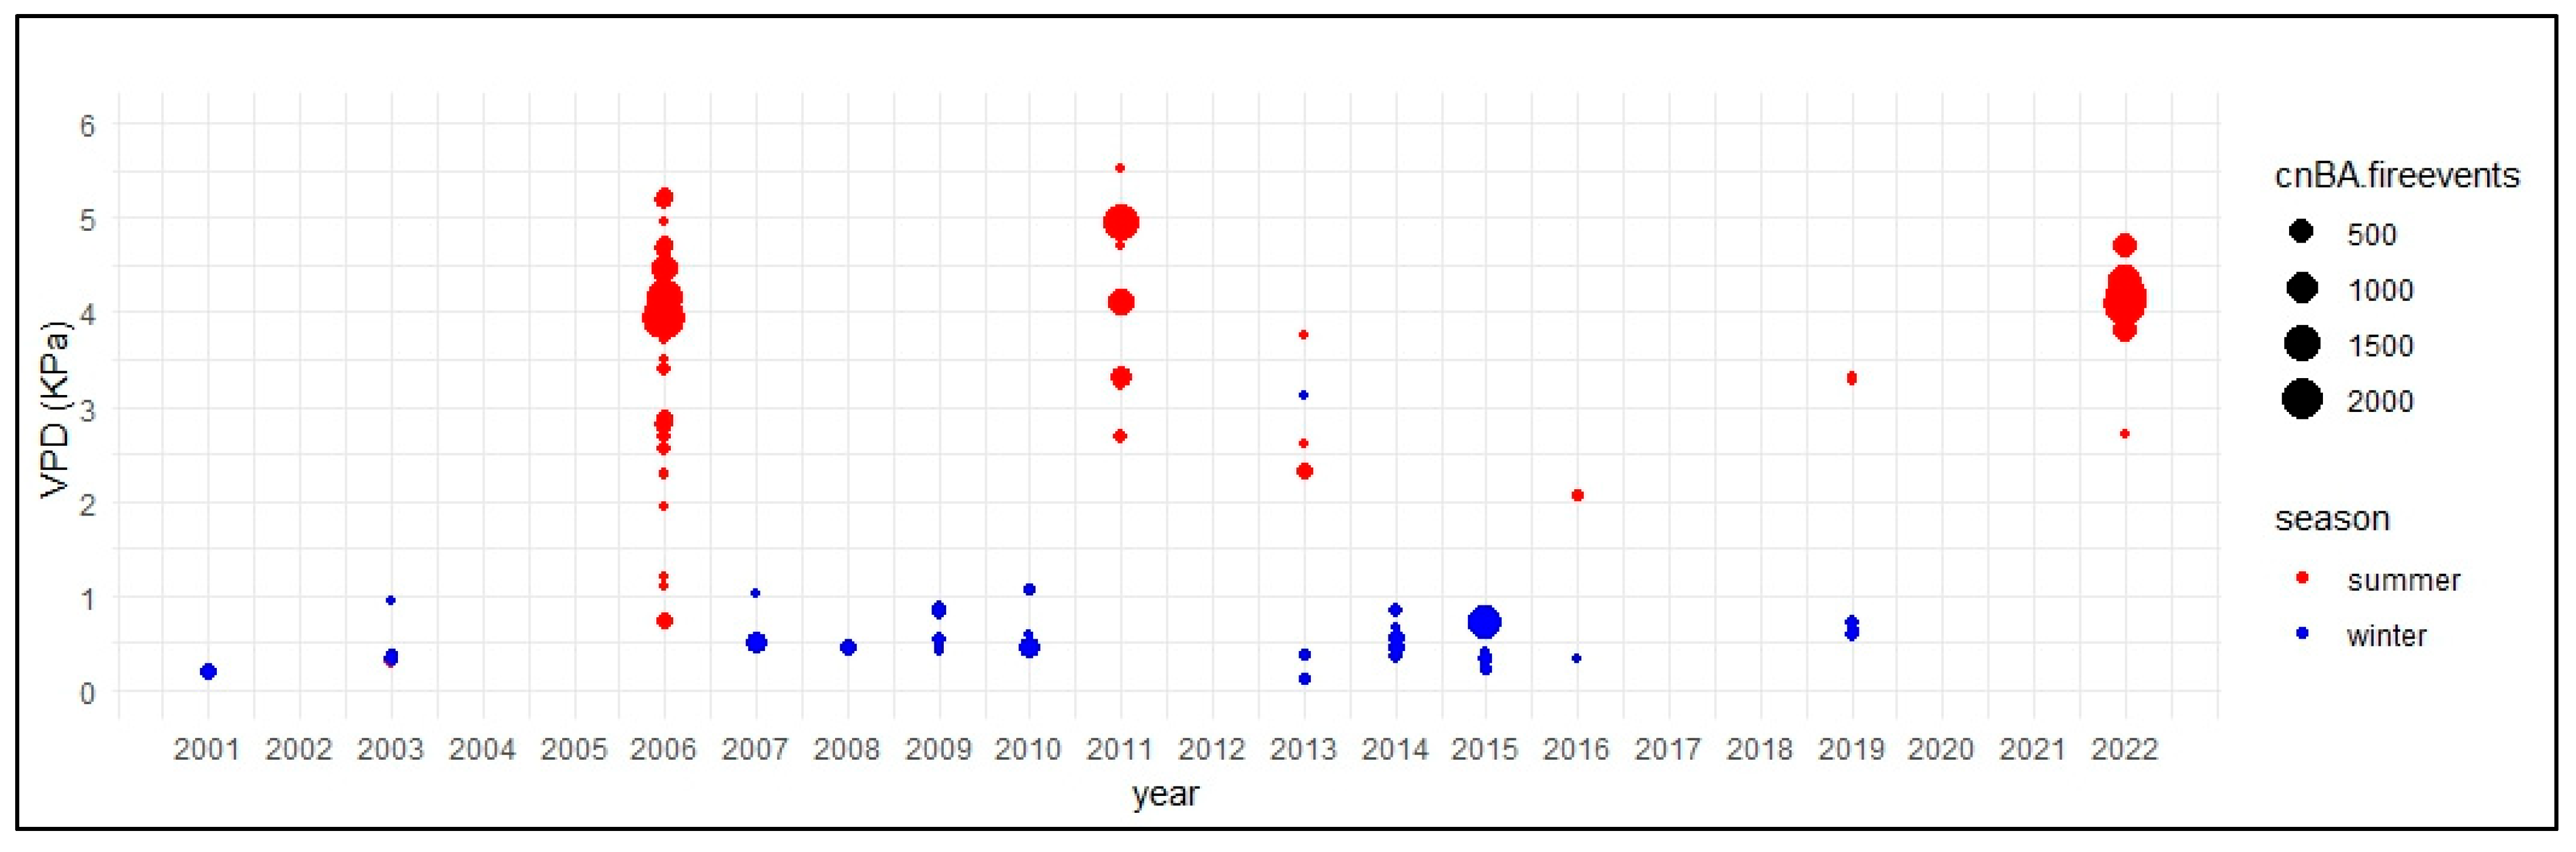
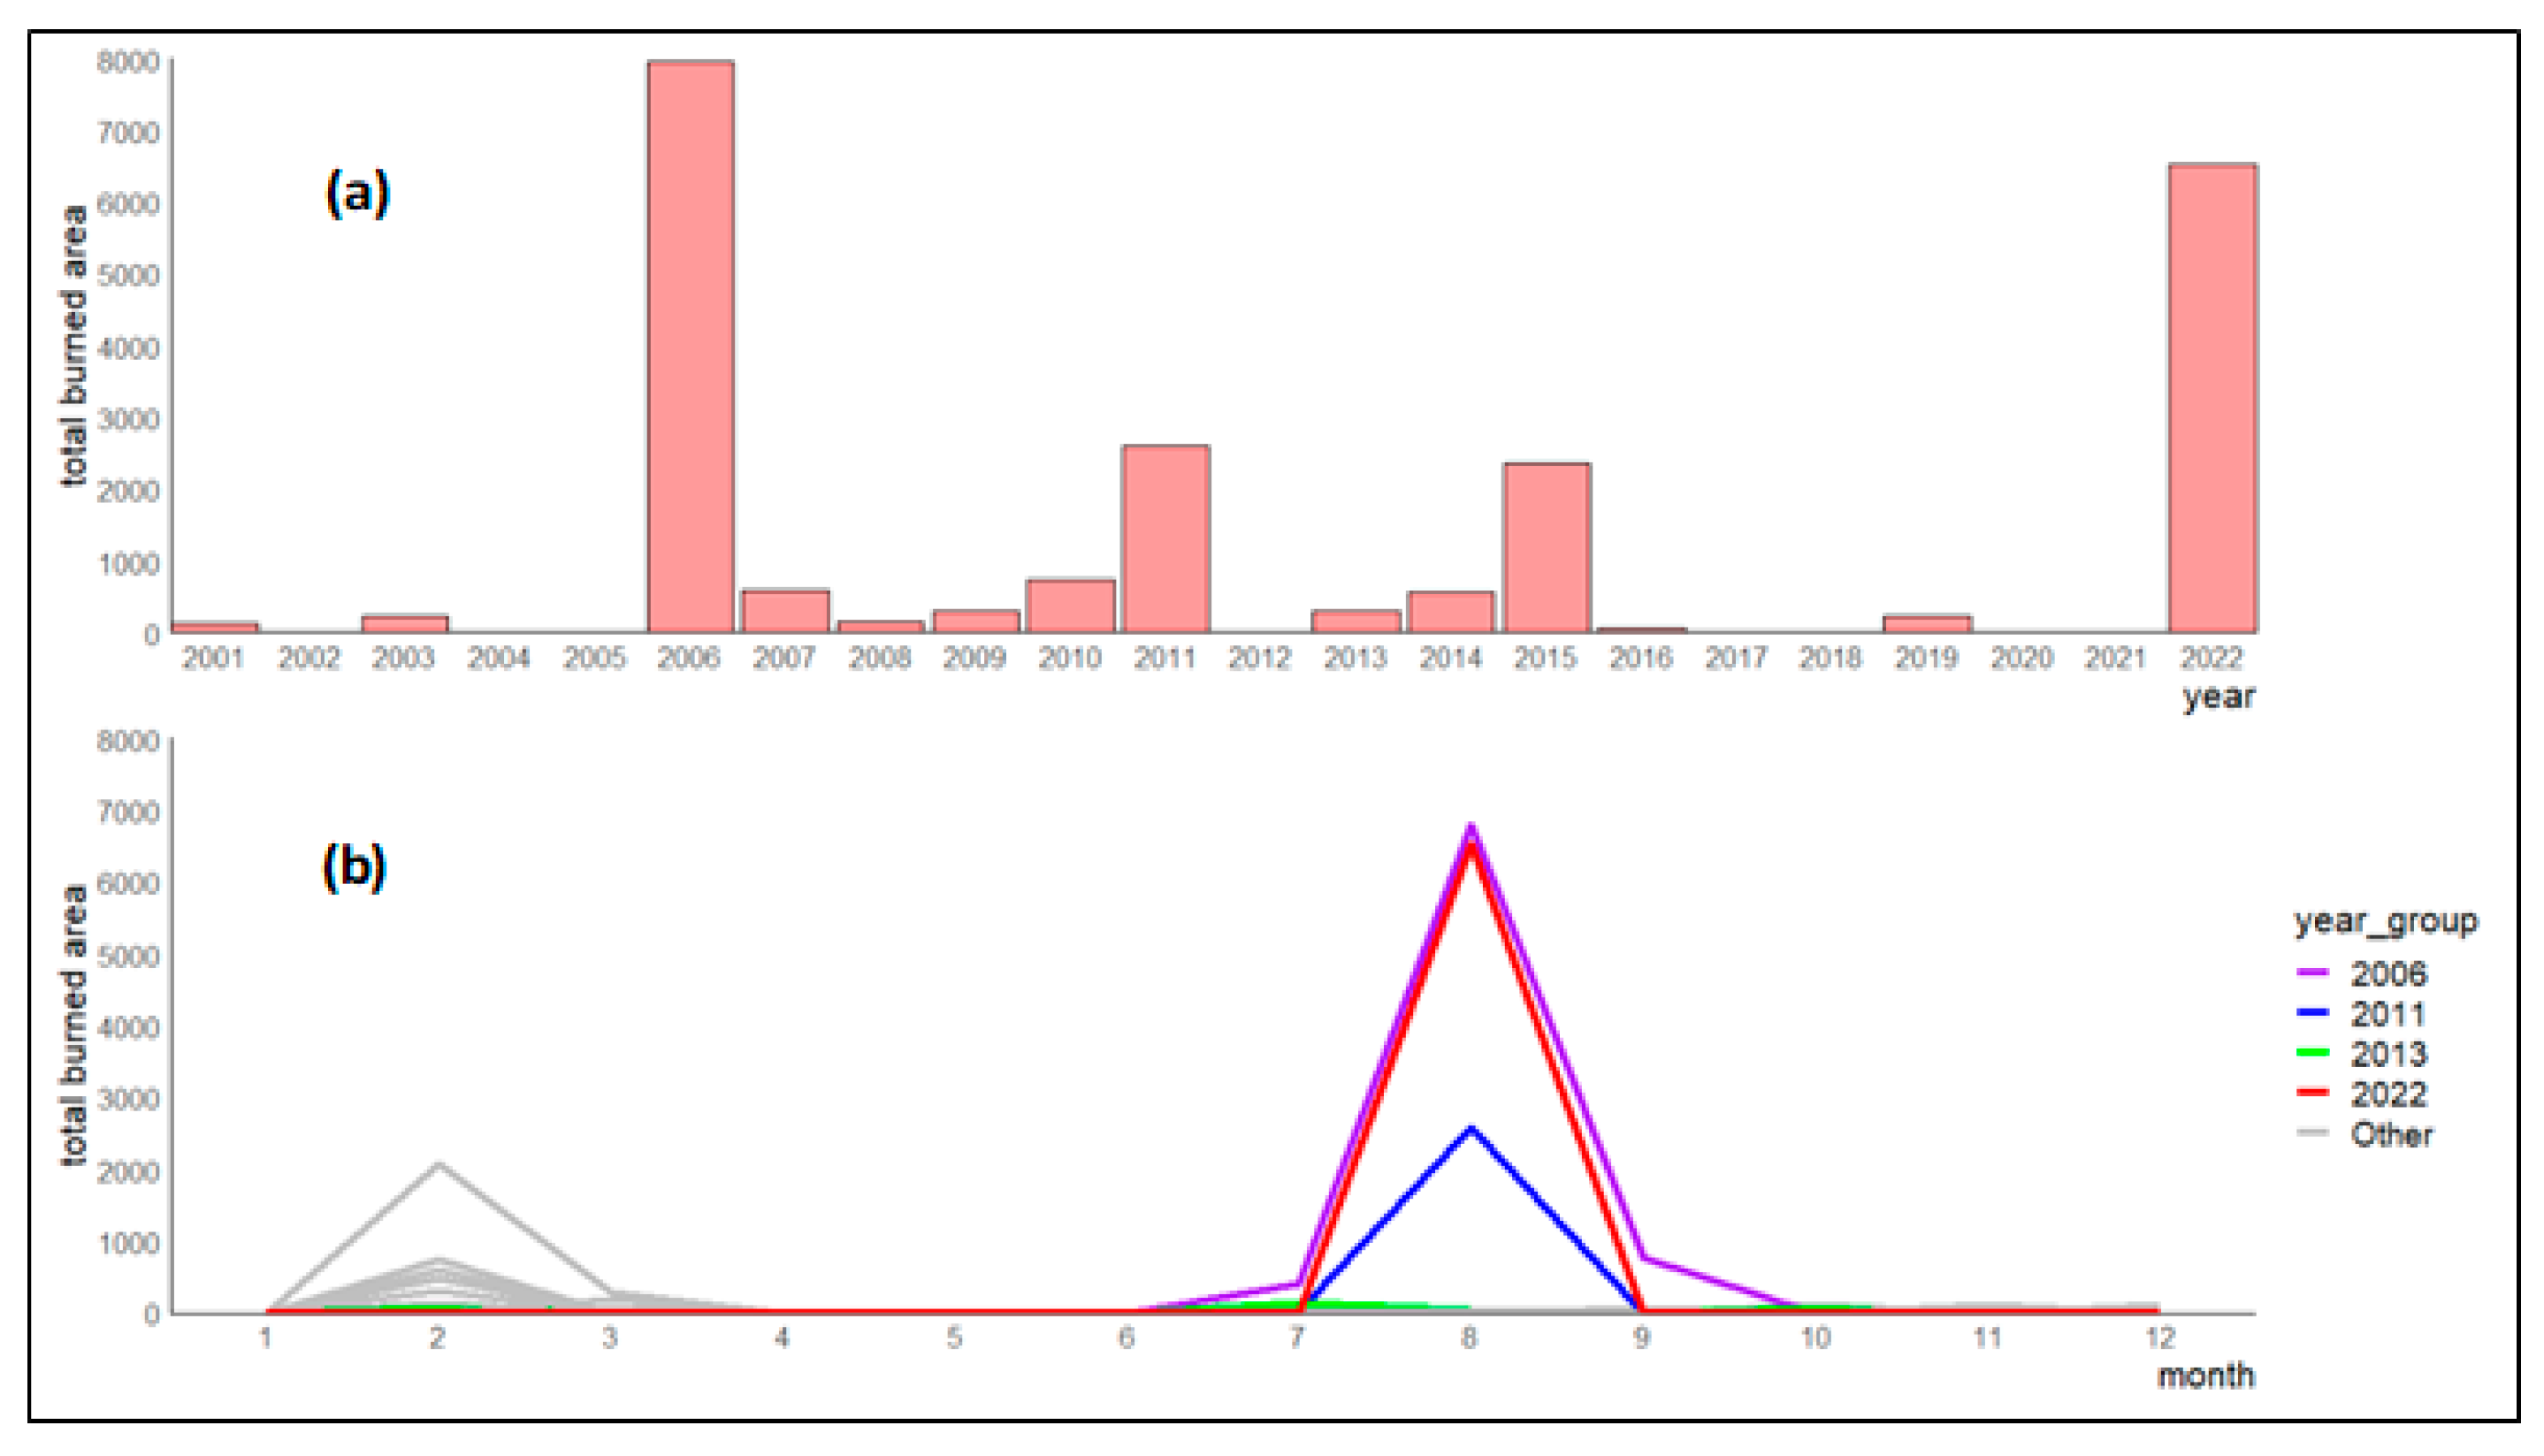
3.1. Cumulative Burned Area

We first analyzed the seasonal pattern of forest fires for the 2001–2022 historical period in the Chongqing Administrative Region (Figure 2), and we observed that: (1) There were two relevant fire seasons that could be clearly identified, i.e., a winter fire season (February-March, with 5360 ha burned during the whole period) and a summer fire season (July-September, with 17,915 ha burned also during the years 2001–2022). (2) The summer fire season was only active in a few years (2006, 2011, 2013, and 2022). The years 2006 and 2022 contained the summer seasons with the highest fire activity (with 8535 ha and 6480 ha burned, respectively), thereby affecting roughly 3–4 times the burned area of the winter season with highest fire activity: 2015, with 2360 ha burned. In addition, in the summer of 2011, 2595 ha were burned. Annual burned area ranged from 0% to 0.17% of the forested area in Chongqing Municipality (46,890 km2).

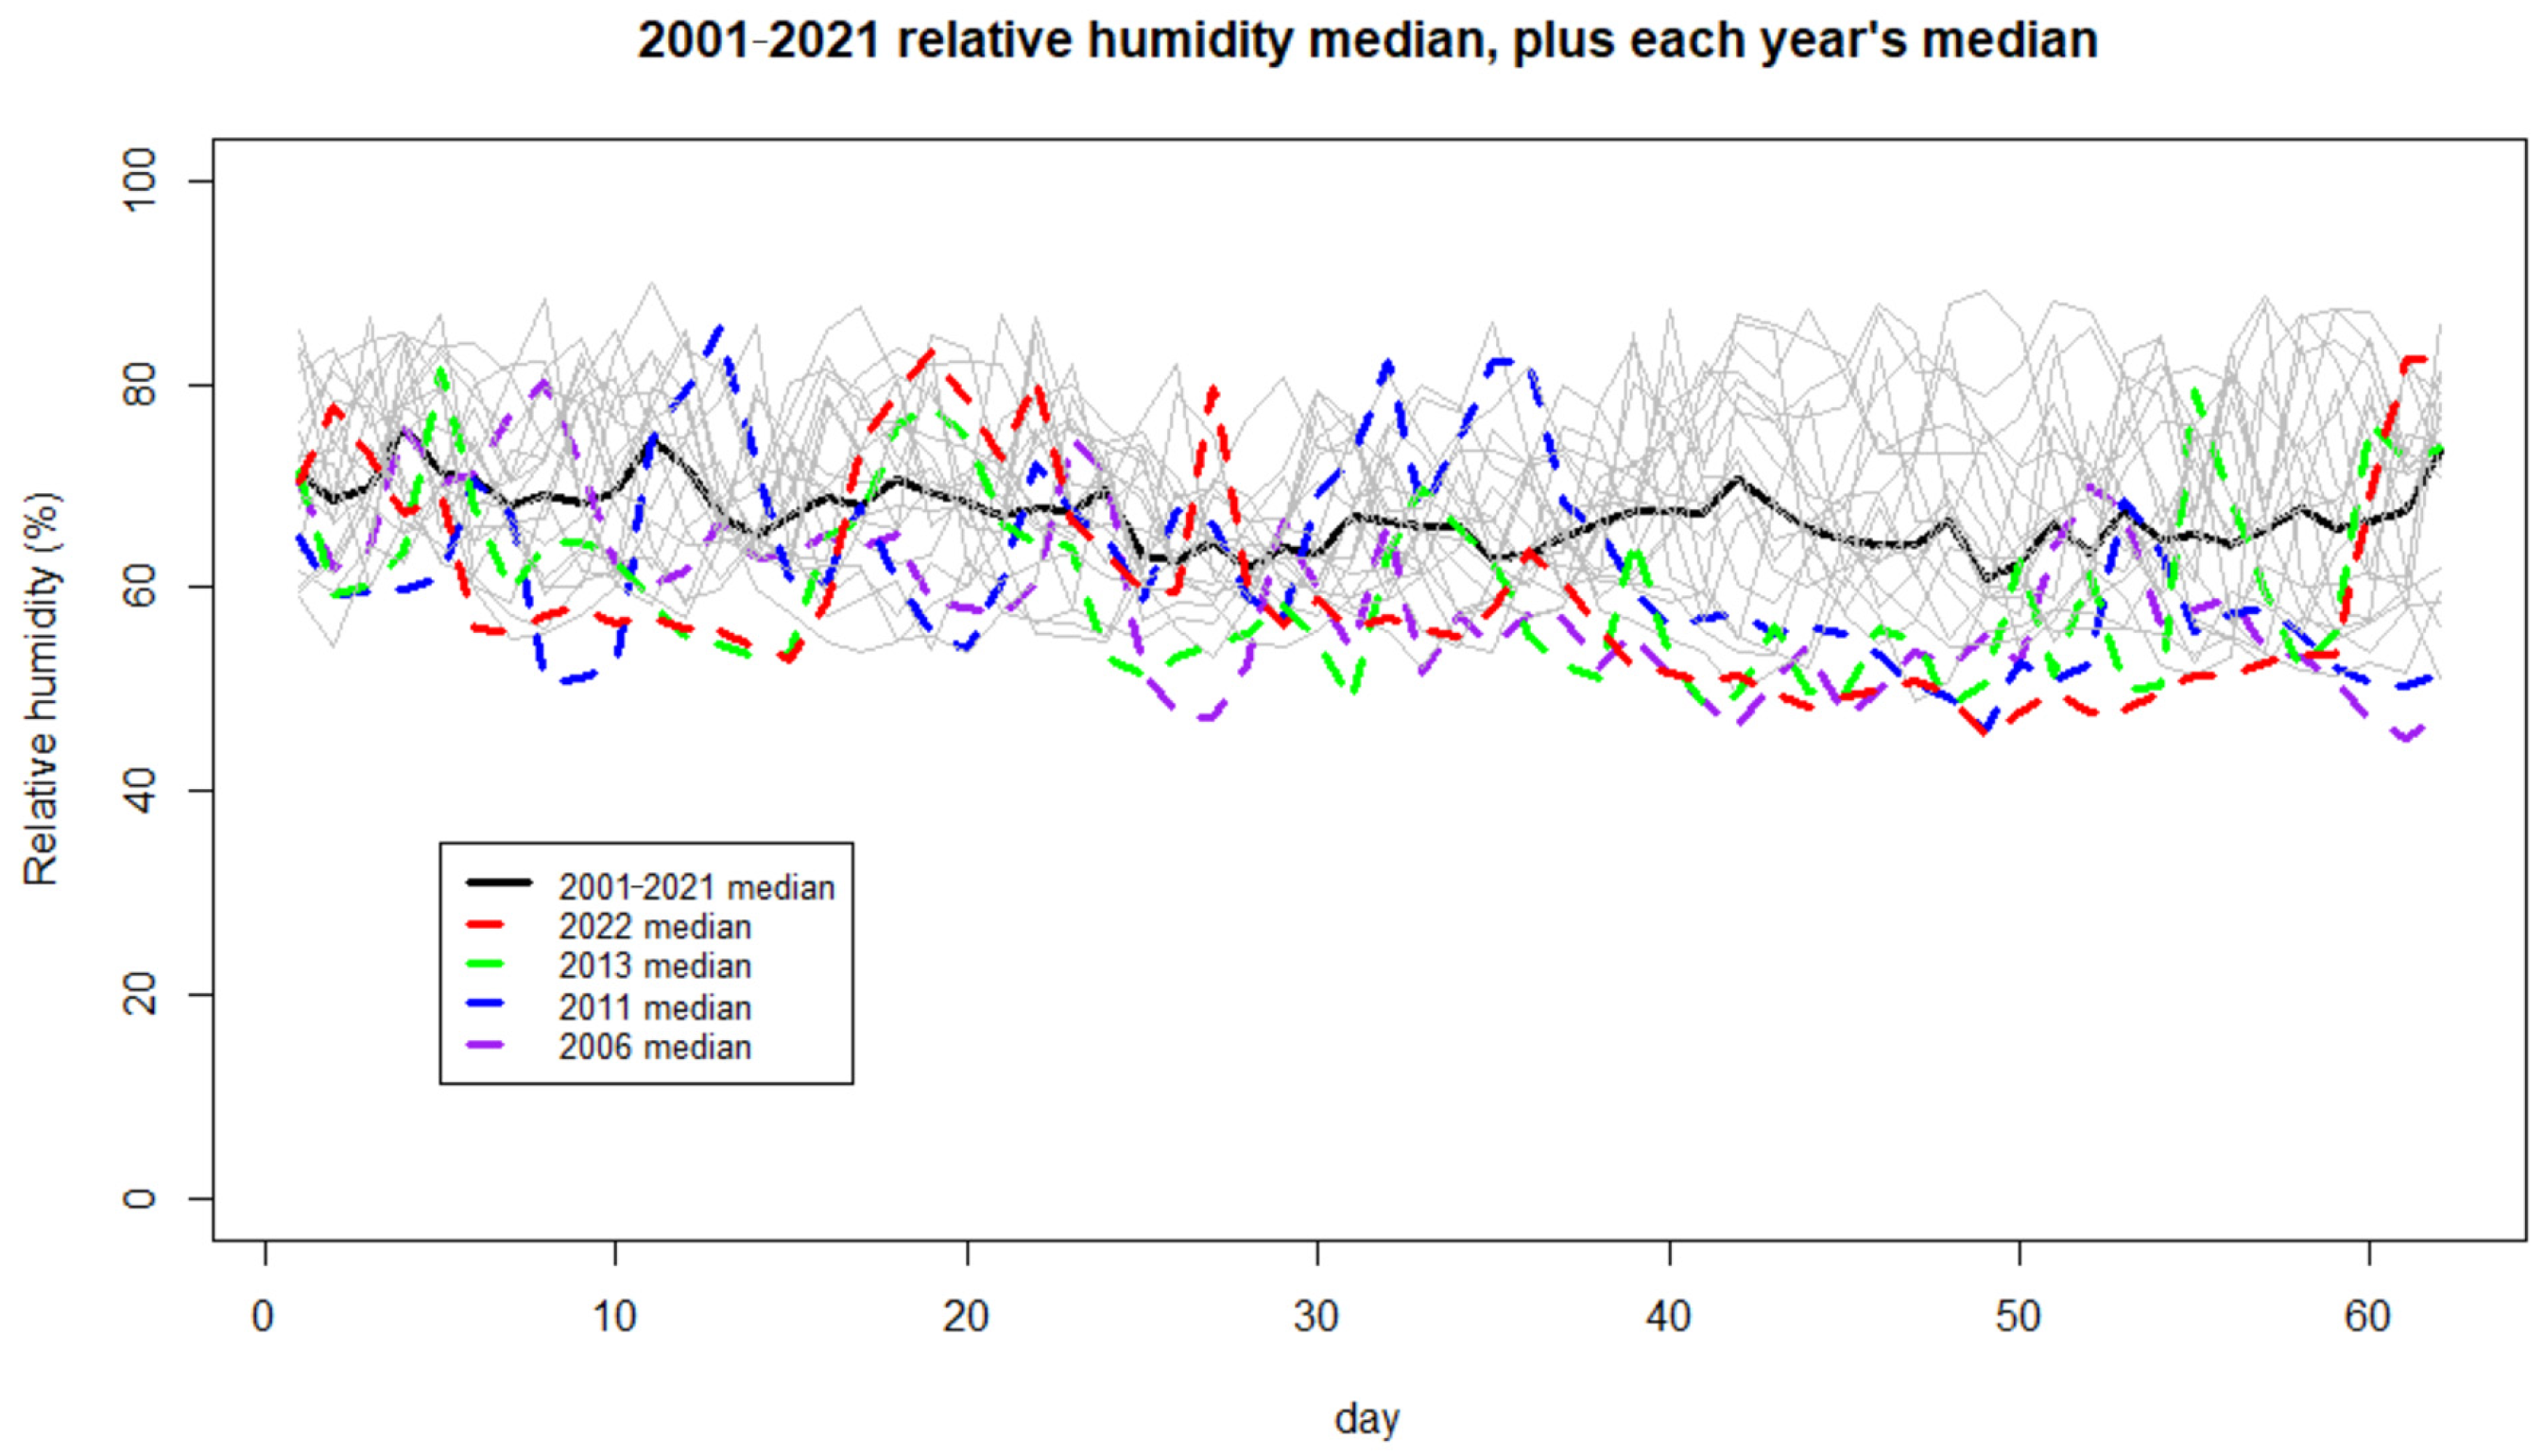
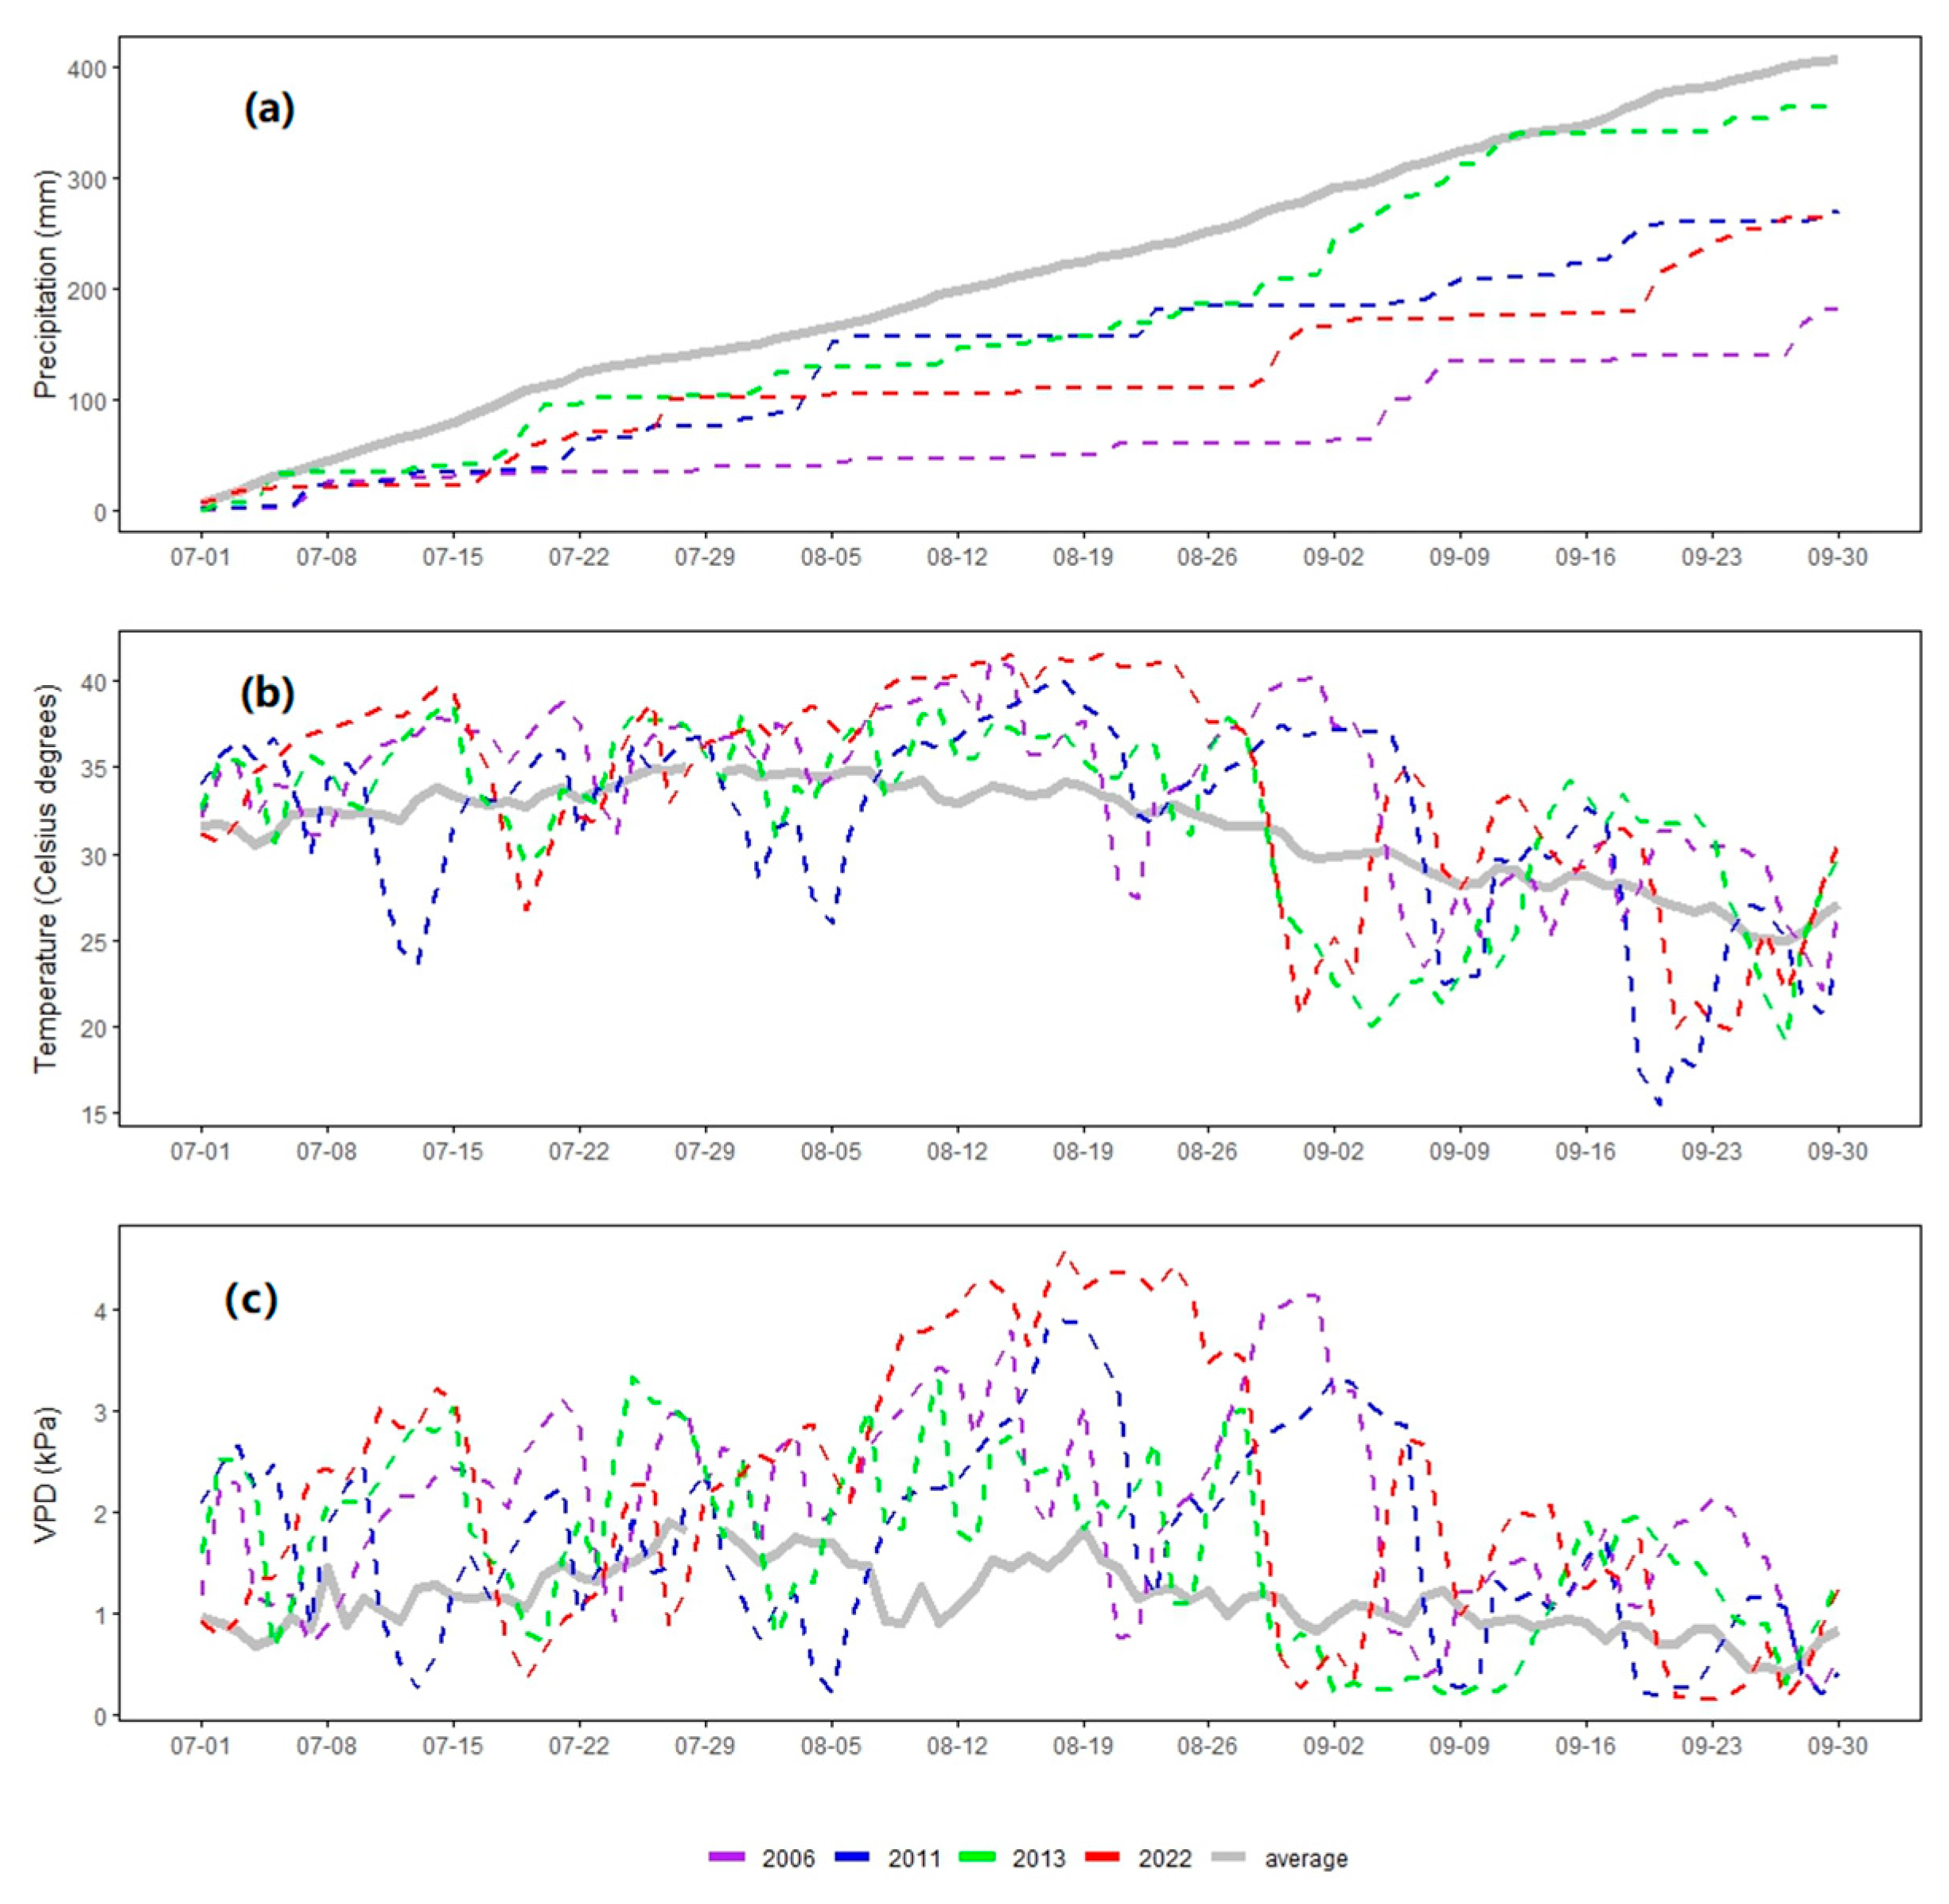
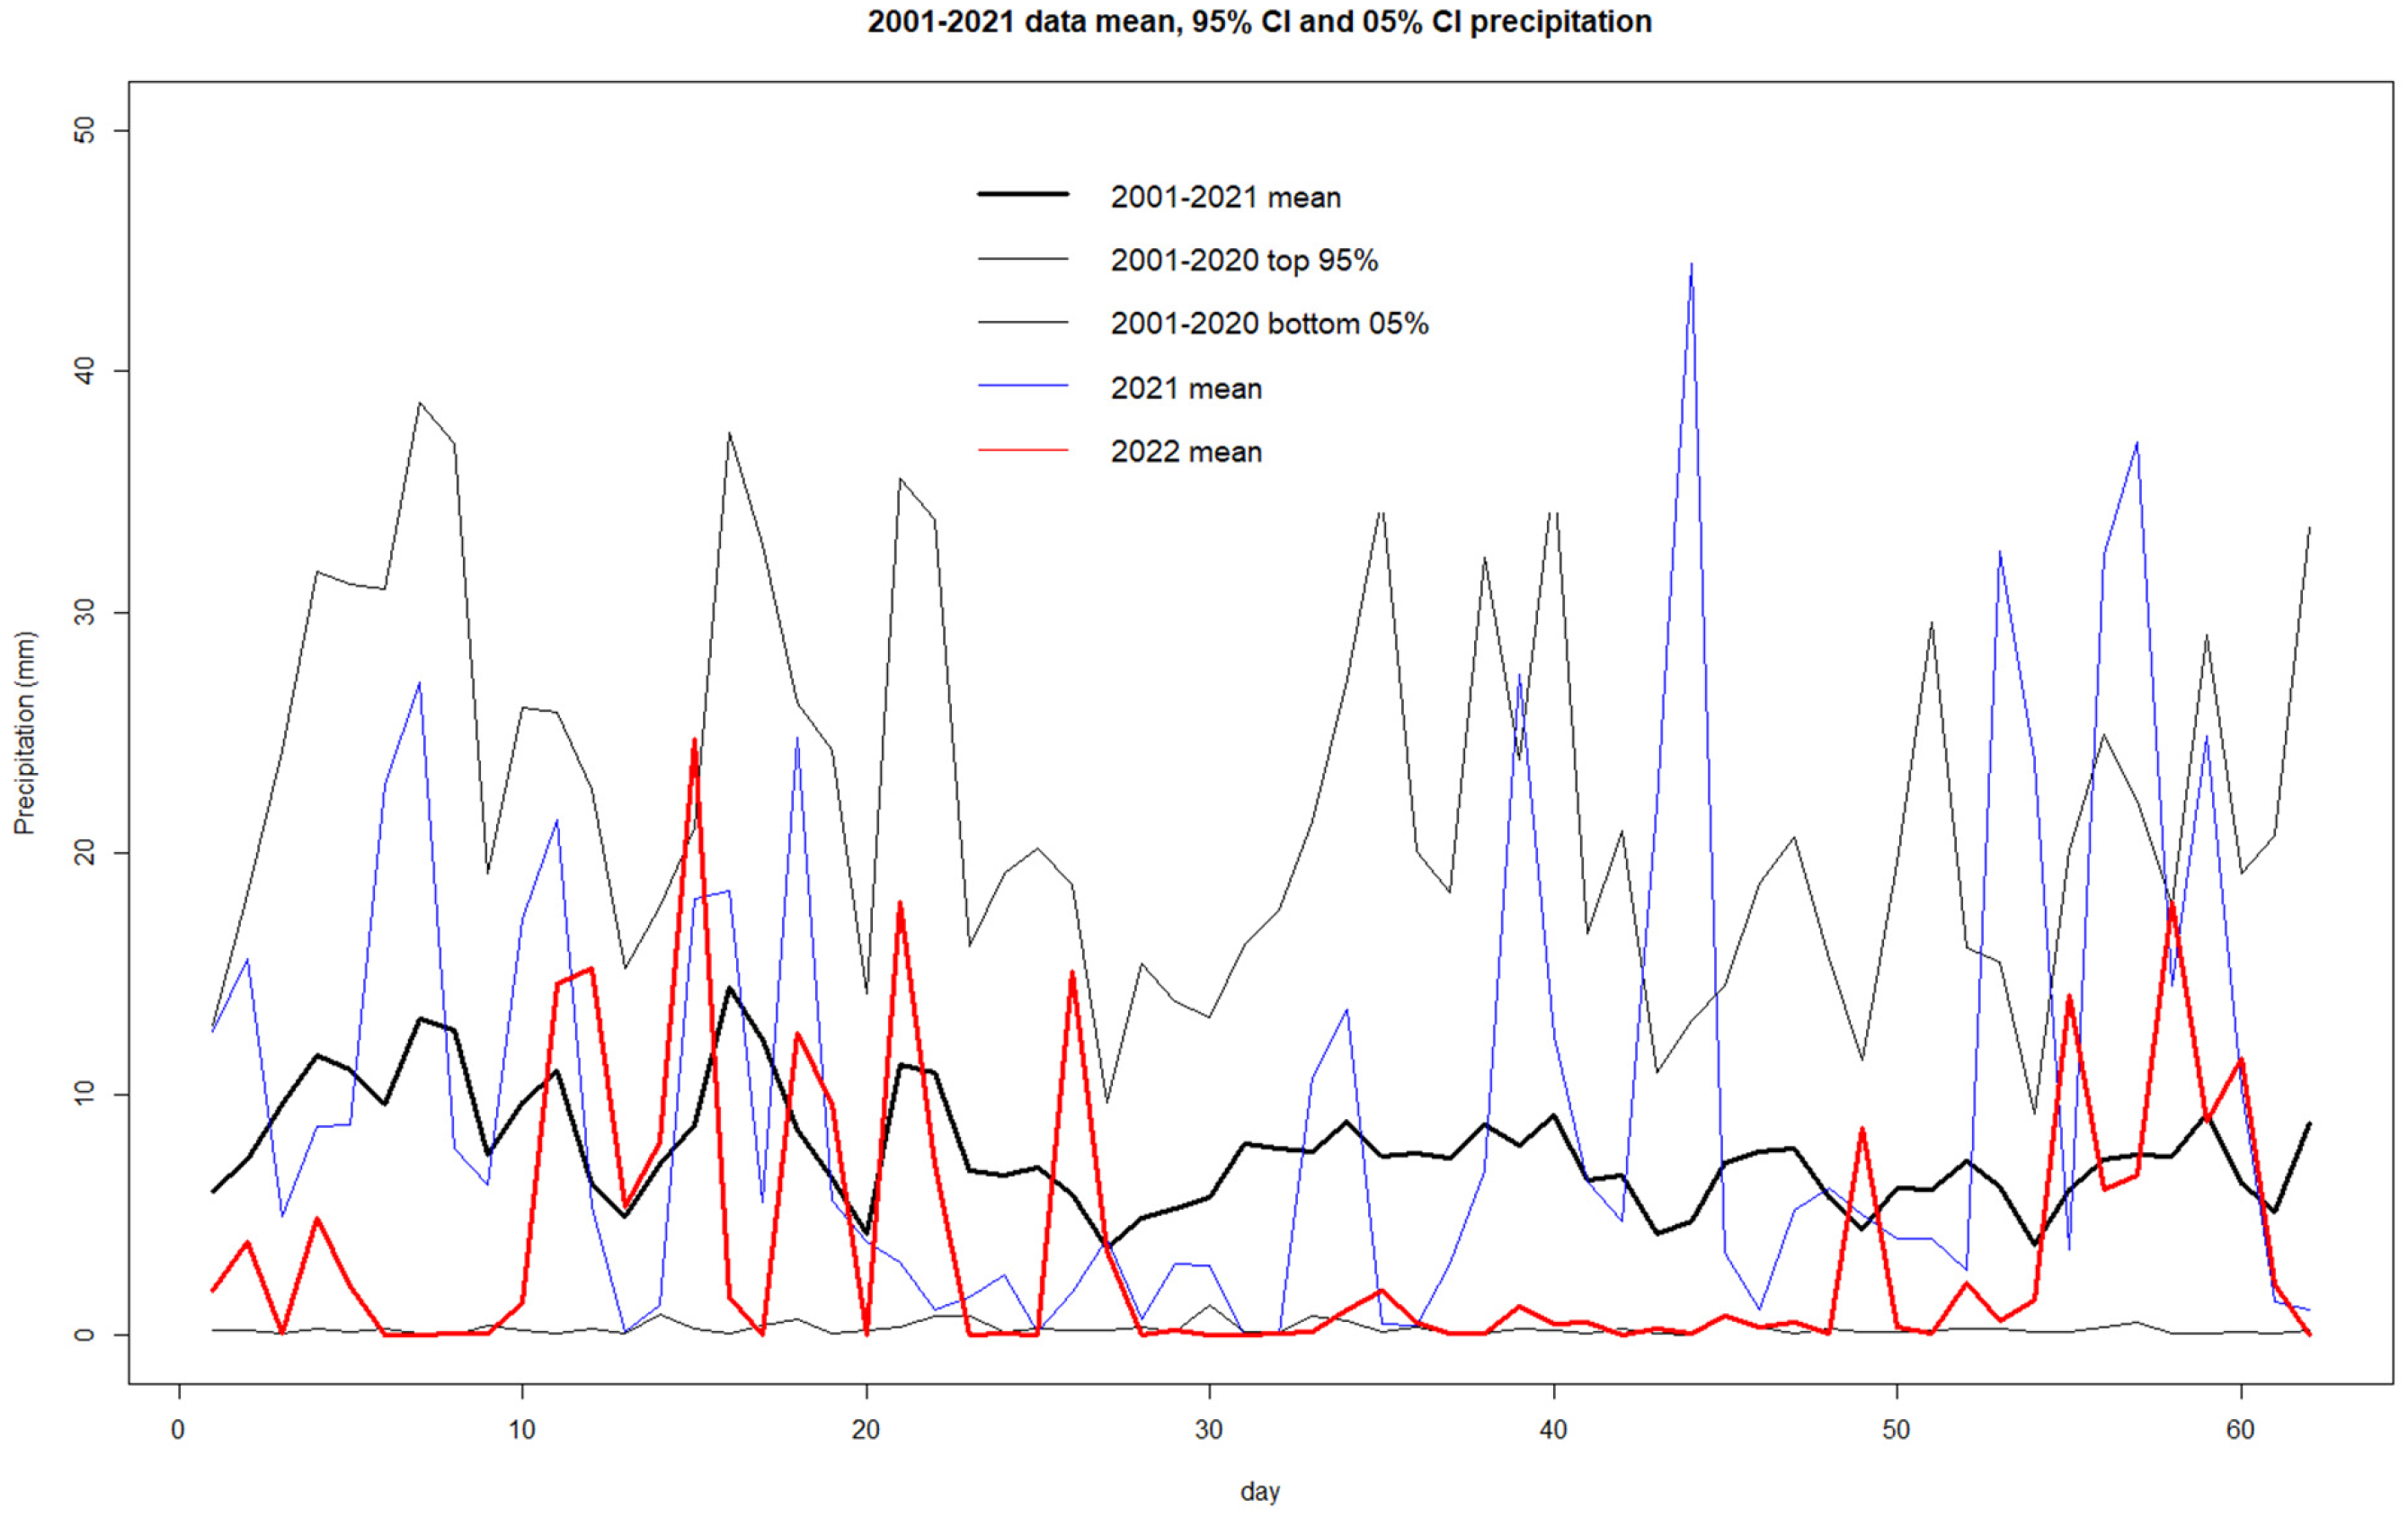
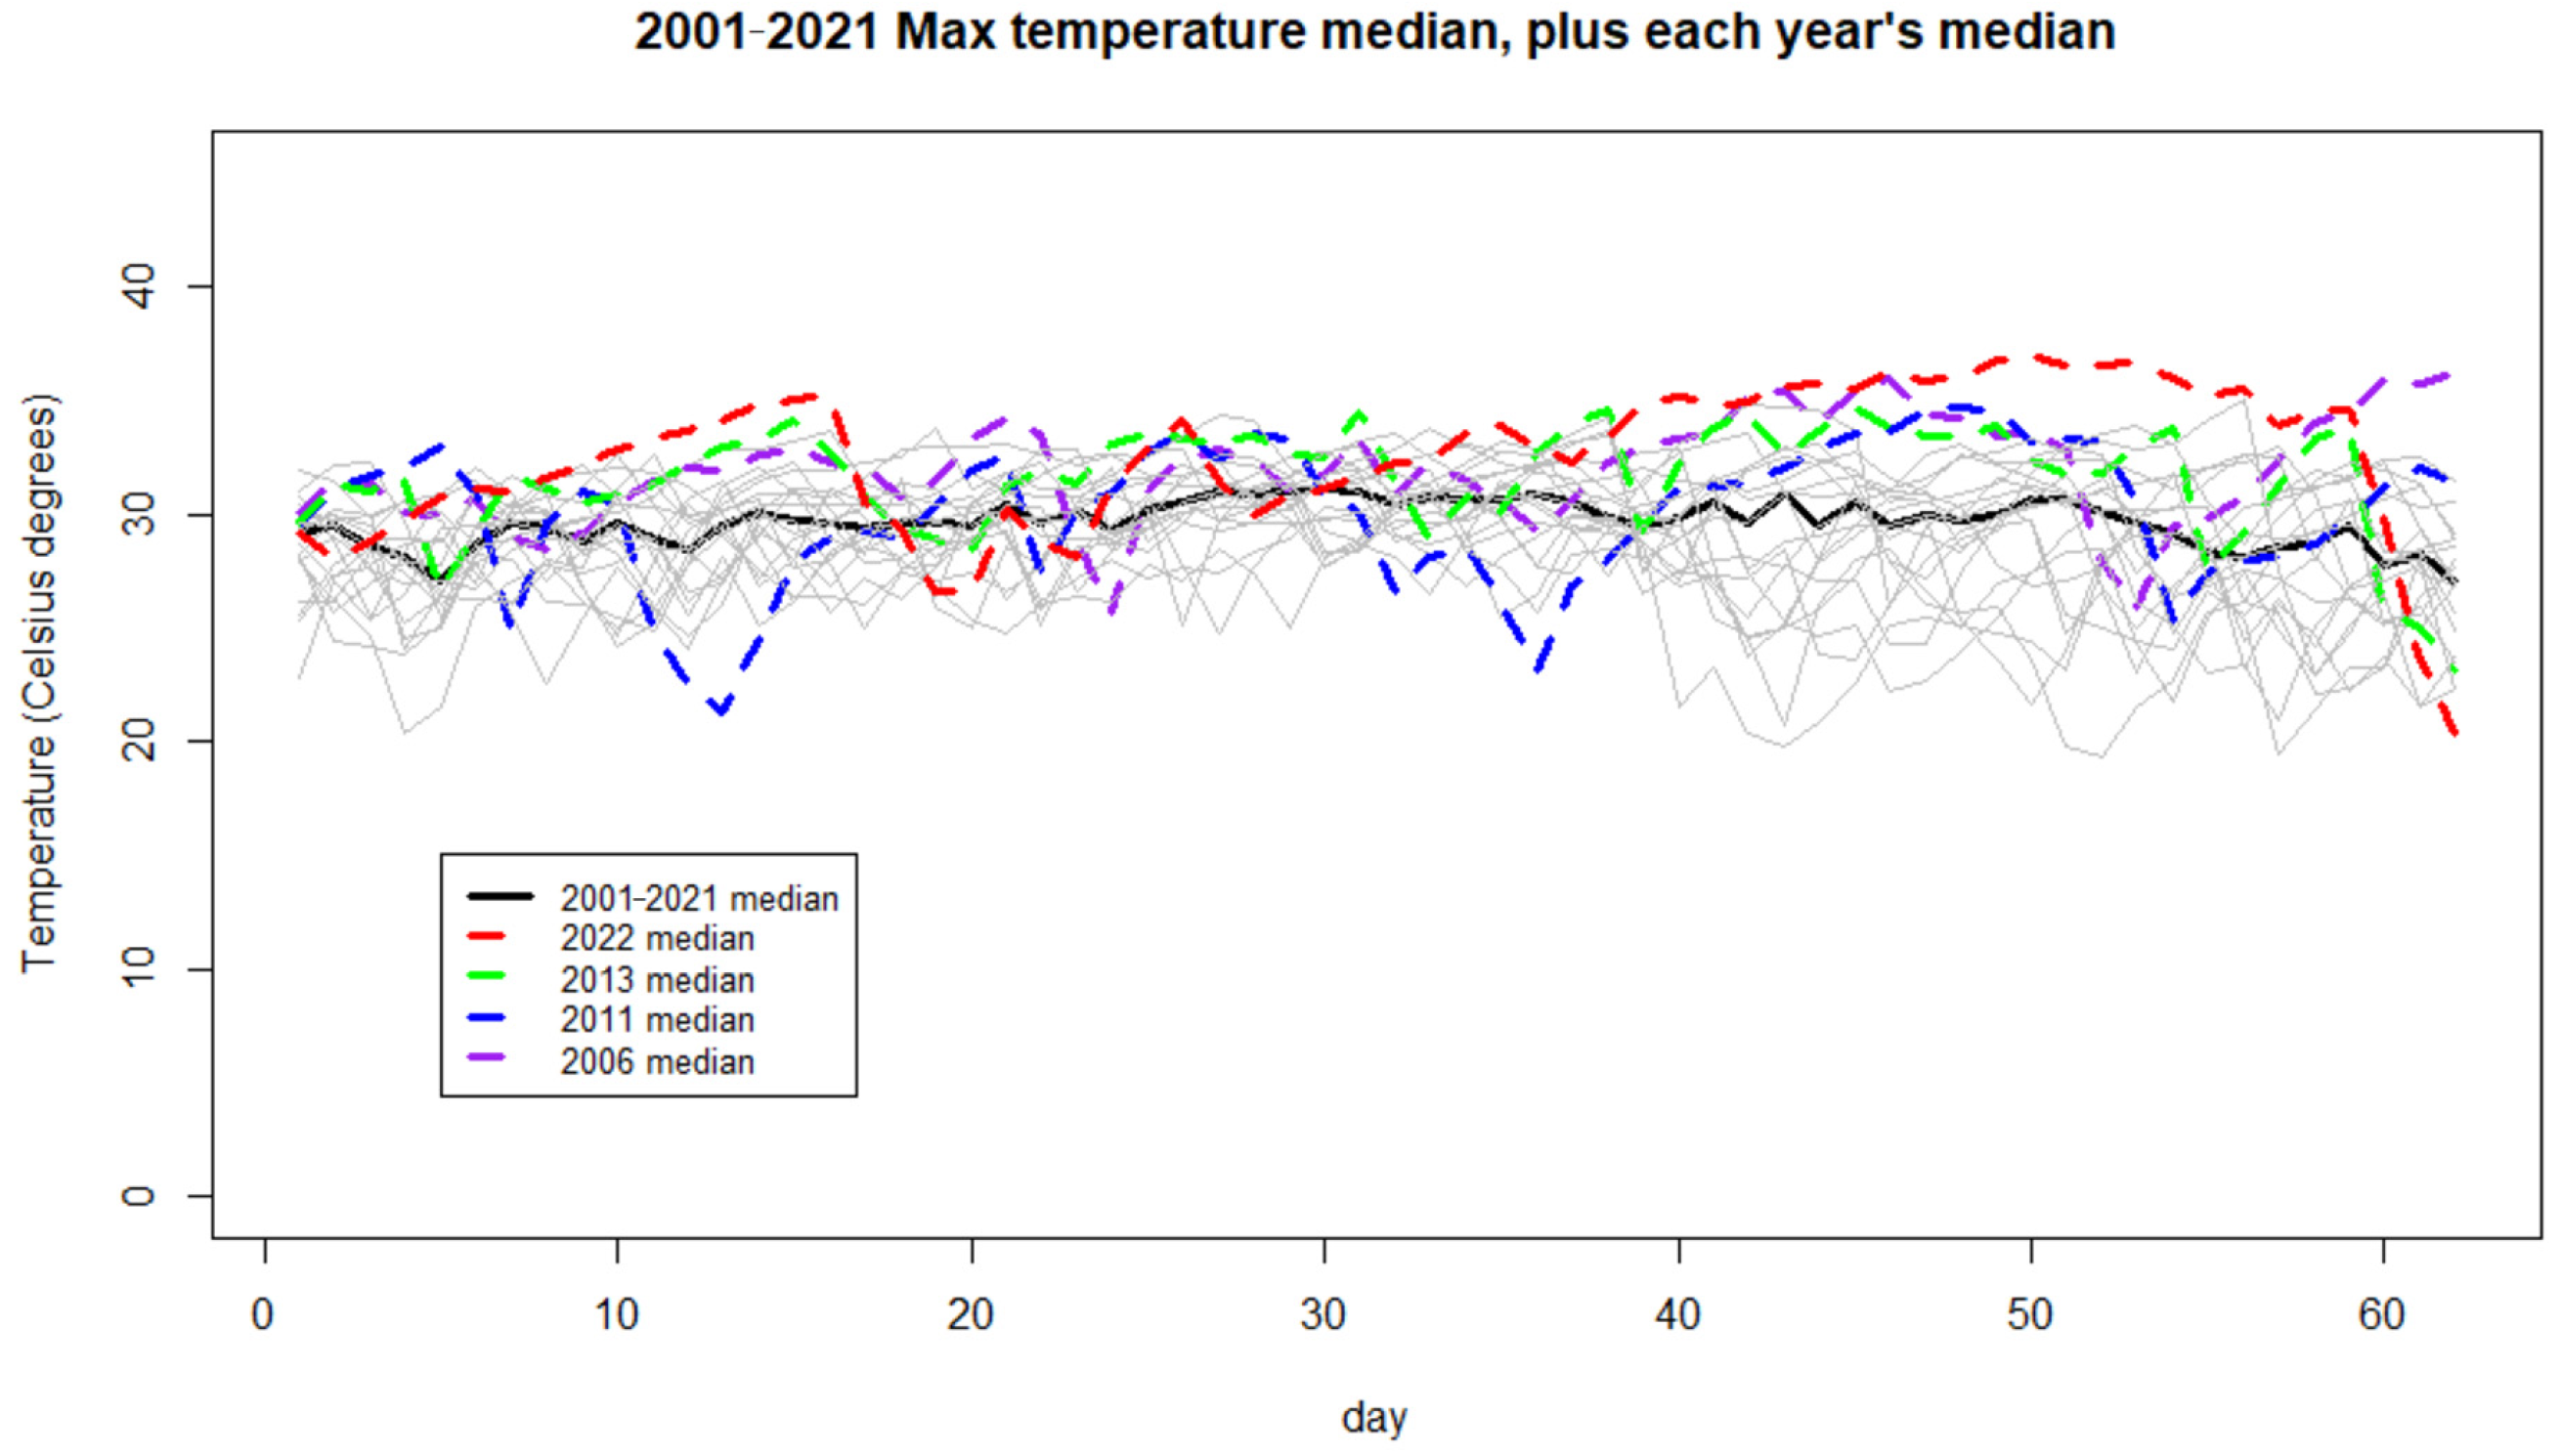
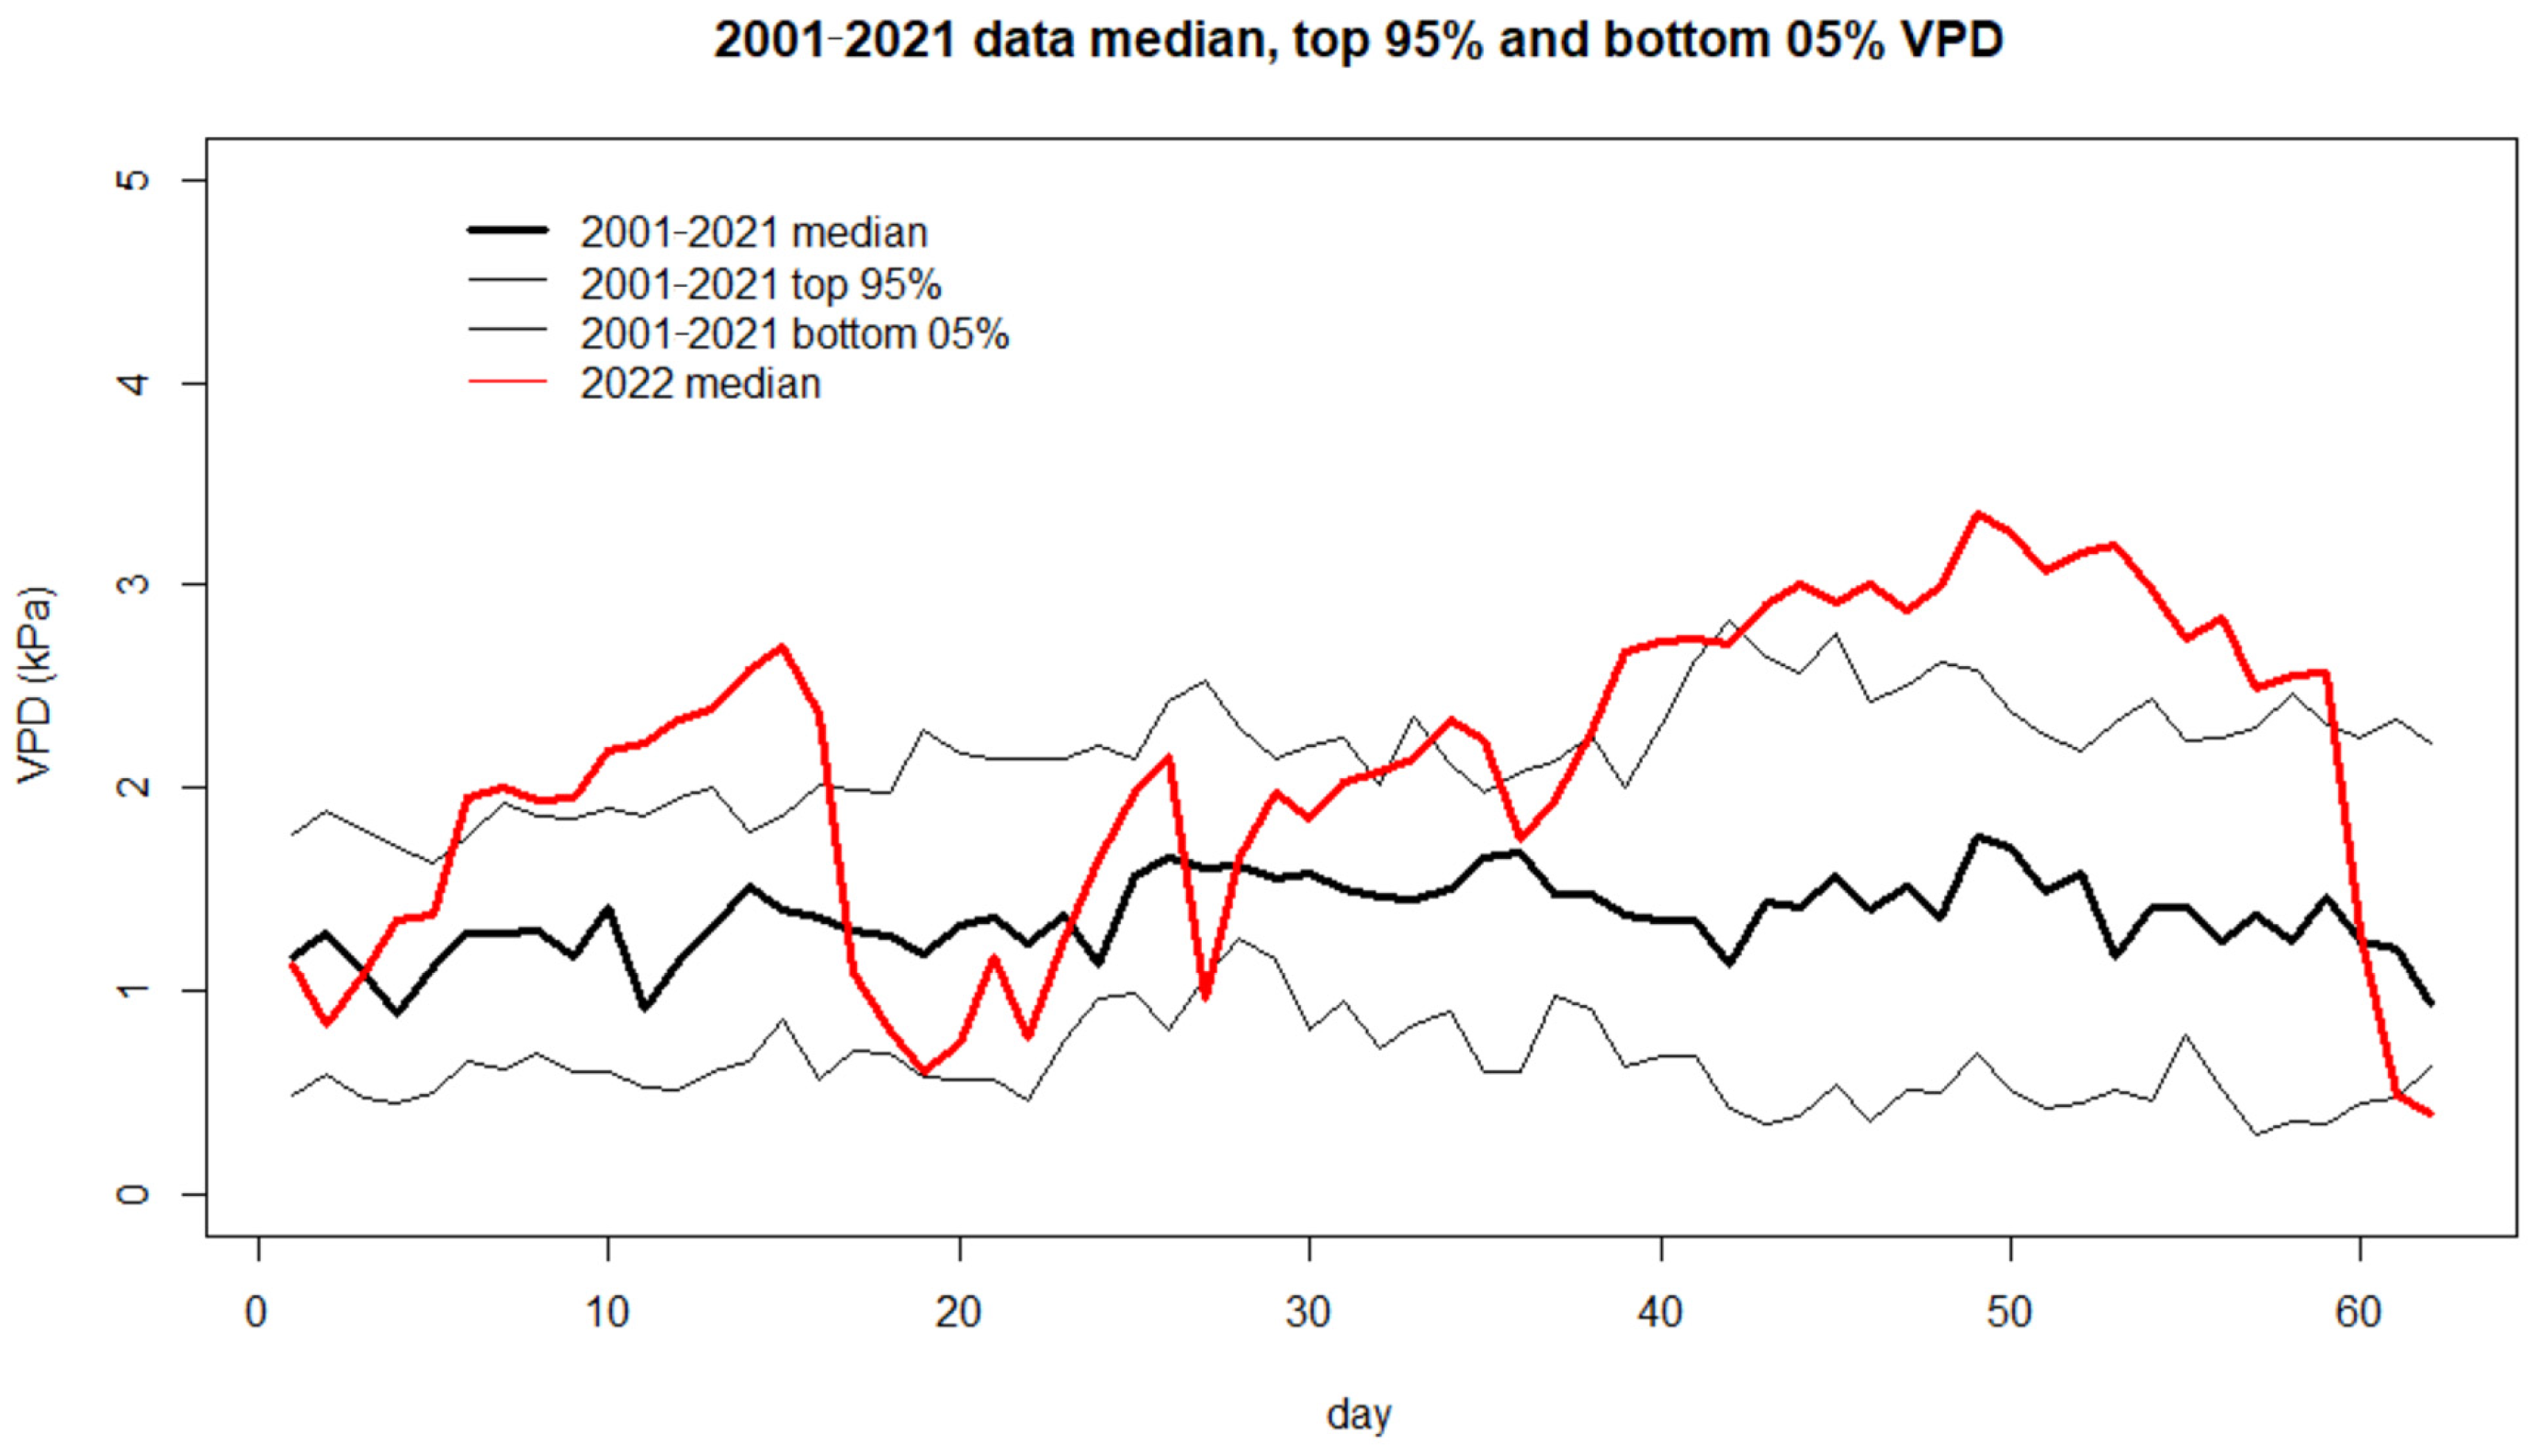
3.2. Fire-Weather Variables

The kriging interpolation from the 35 weather stations in Chongqing indicated that the hot-dry summers (July–August–September) of 2006, 2011, 2013, and 2022 were the most extreme, especially in the case of 2022 with the highest temperatures, lowest precipitation, and highest VPD (Figure 3). This pattern was also observed when analyzing the Copernicus ERA5 satellite image analysis of the same weather variables (See Appendix A, Figure A1, Figure A2, Figure A3 and Figure A4).
The month of August in 2022 was the driest in China for the last 61 years [28]. As expected, it was also the driest in Chongqing for the 22 years covered in our study: between the 28th of July and the 28th of August, precipitation levels were the lowest in Chongqing according to both ERA5 satellite products (Figure A1) and the kriging interpolation from 35 weather stations (Figure 3). The maximum cumulative precipitation recorded at locations of Chongqing during the 2 months of July and August of 2022 were below 300 mm, while most places only recorded between 160 and 200 mm. In an average year, precipitation levels are around 300 mm in these 2 months (Figure 3).
The highest VPD recorded in Chongqing—highest temperature and lowest relative humidity values—occurred in the summers of 2022 and 2006 (Figure 3, Figure A2 and Figure A3), followed by the summers of 2011 and 2013 (Figure 4), which was consistent with both the 35 weather stations-based interpolation and ERA5 data (Figure A4). In addition, the difference in VPD between dry summer and winter fire seasons (See Appendix A, Figure A5) is a key factor that explains why the largest burned area occurs in these recent anomalous summers with CDHEs (most fire VPD values > 3.5 kPa), and why winter burned area is much smaller (most fire VPD values well below 1 kPa) (see below the relation between VPD and burned area).

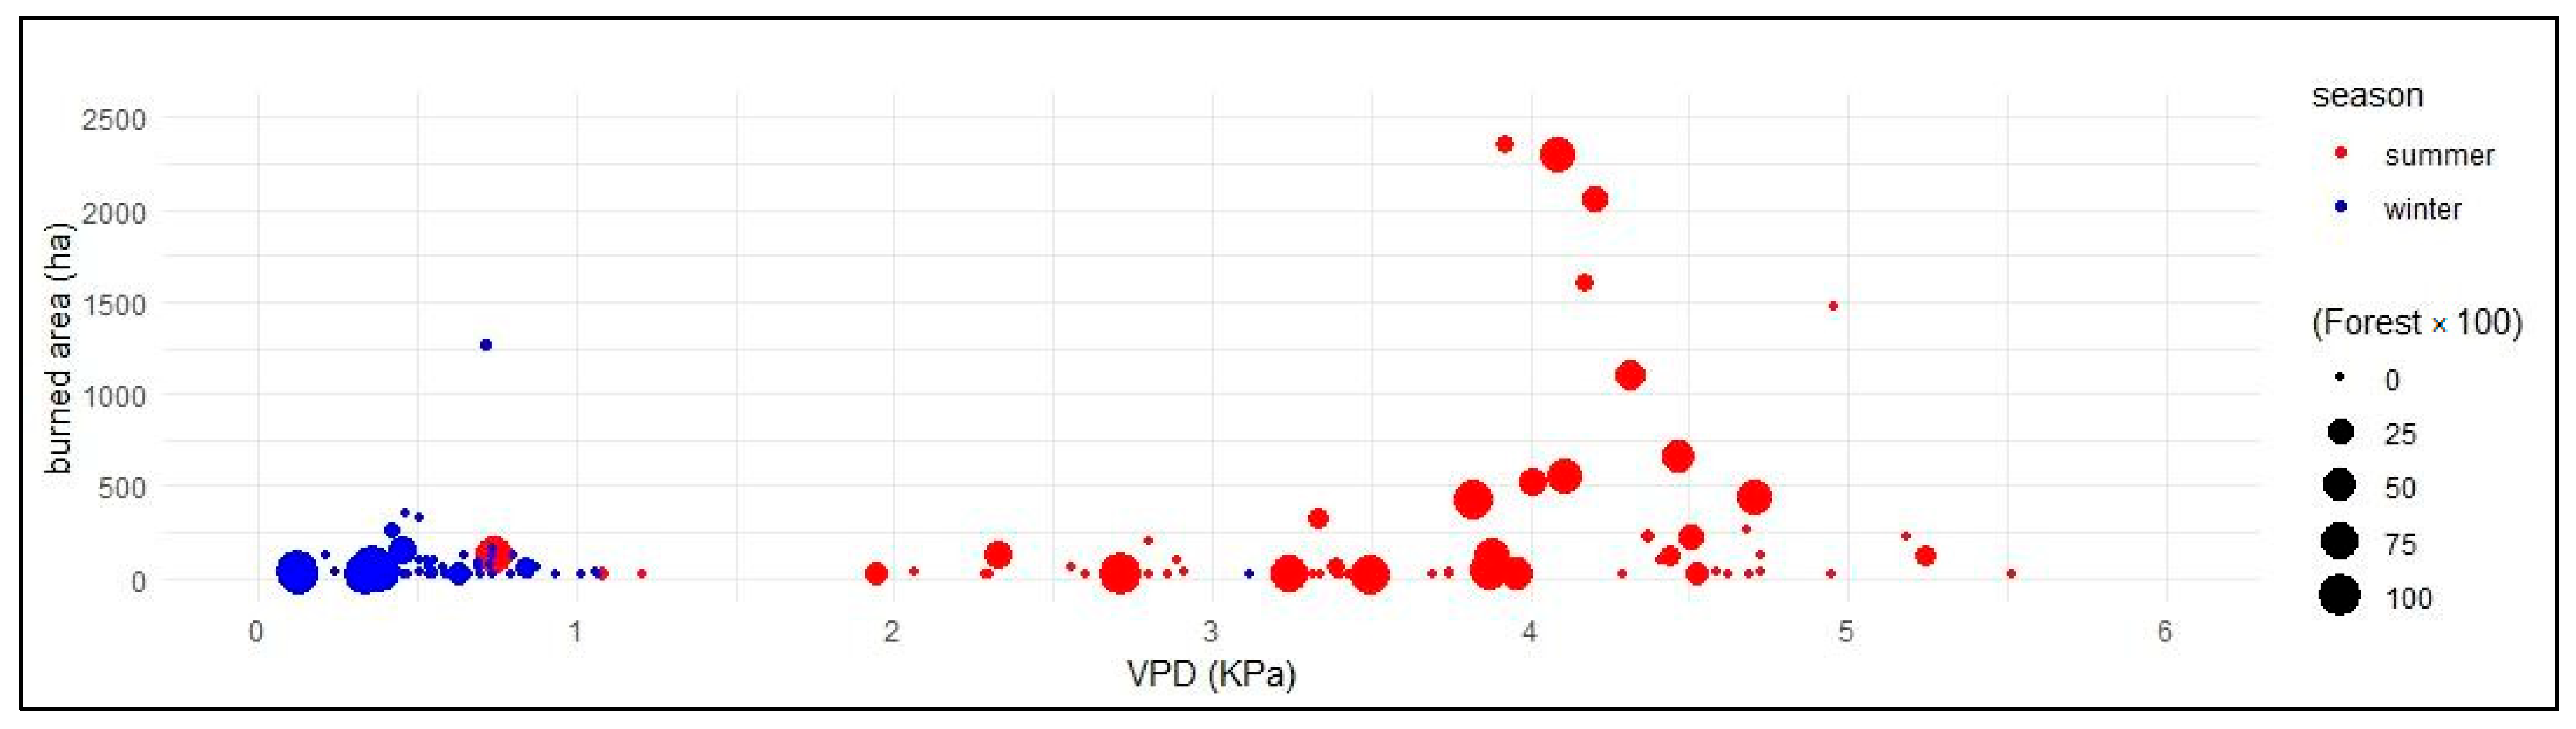
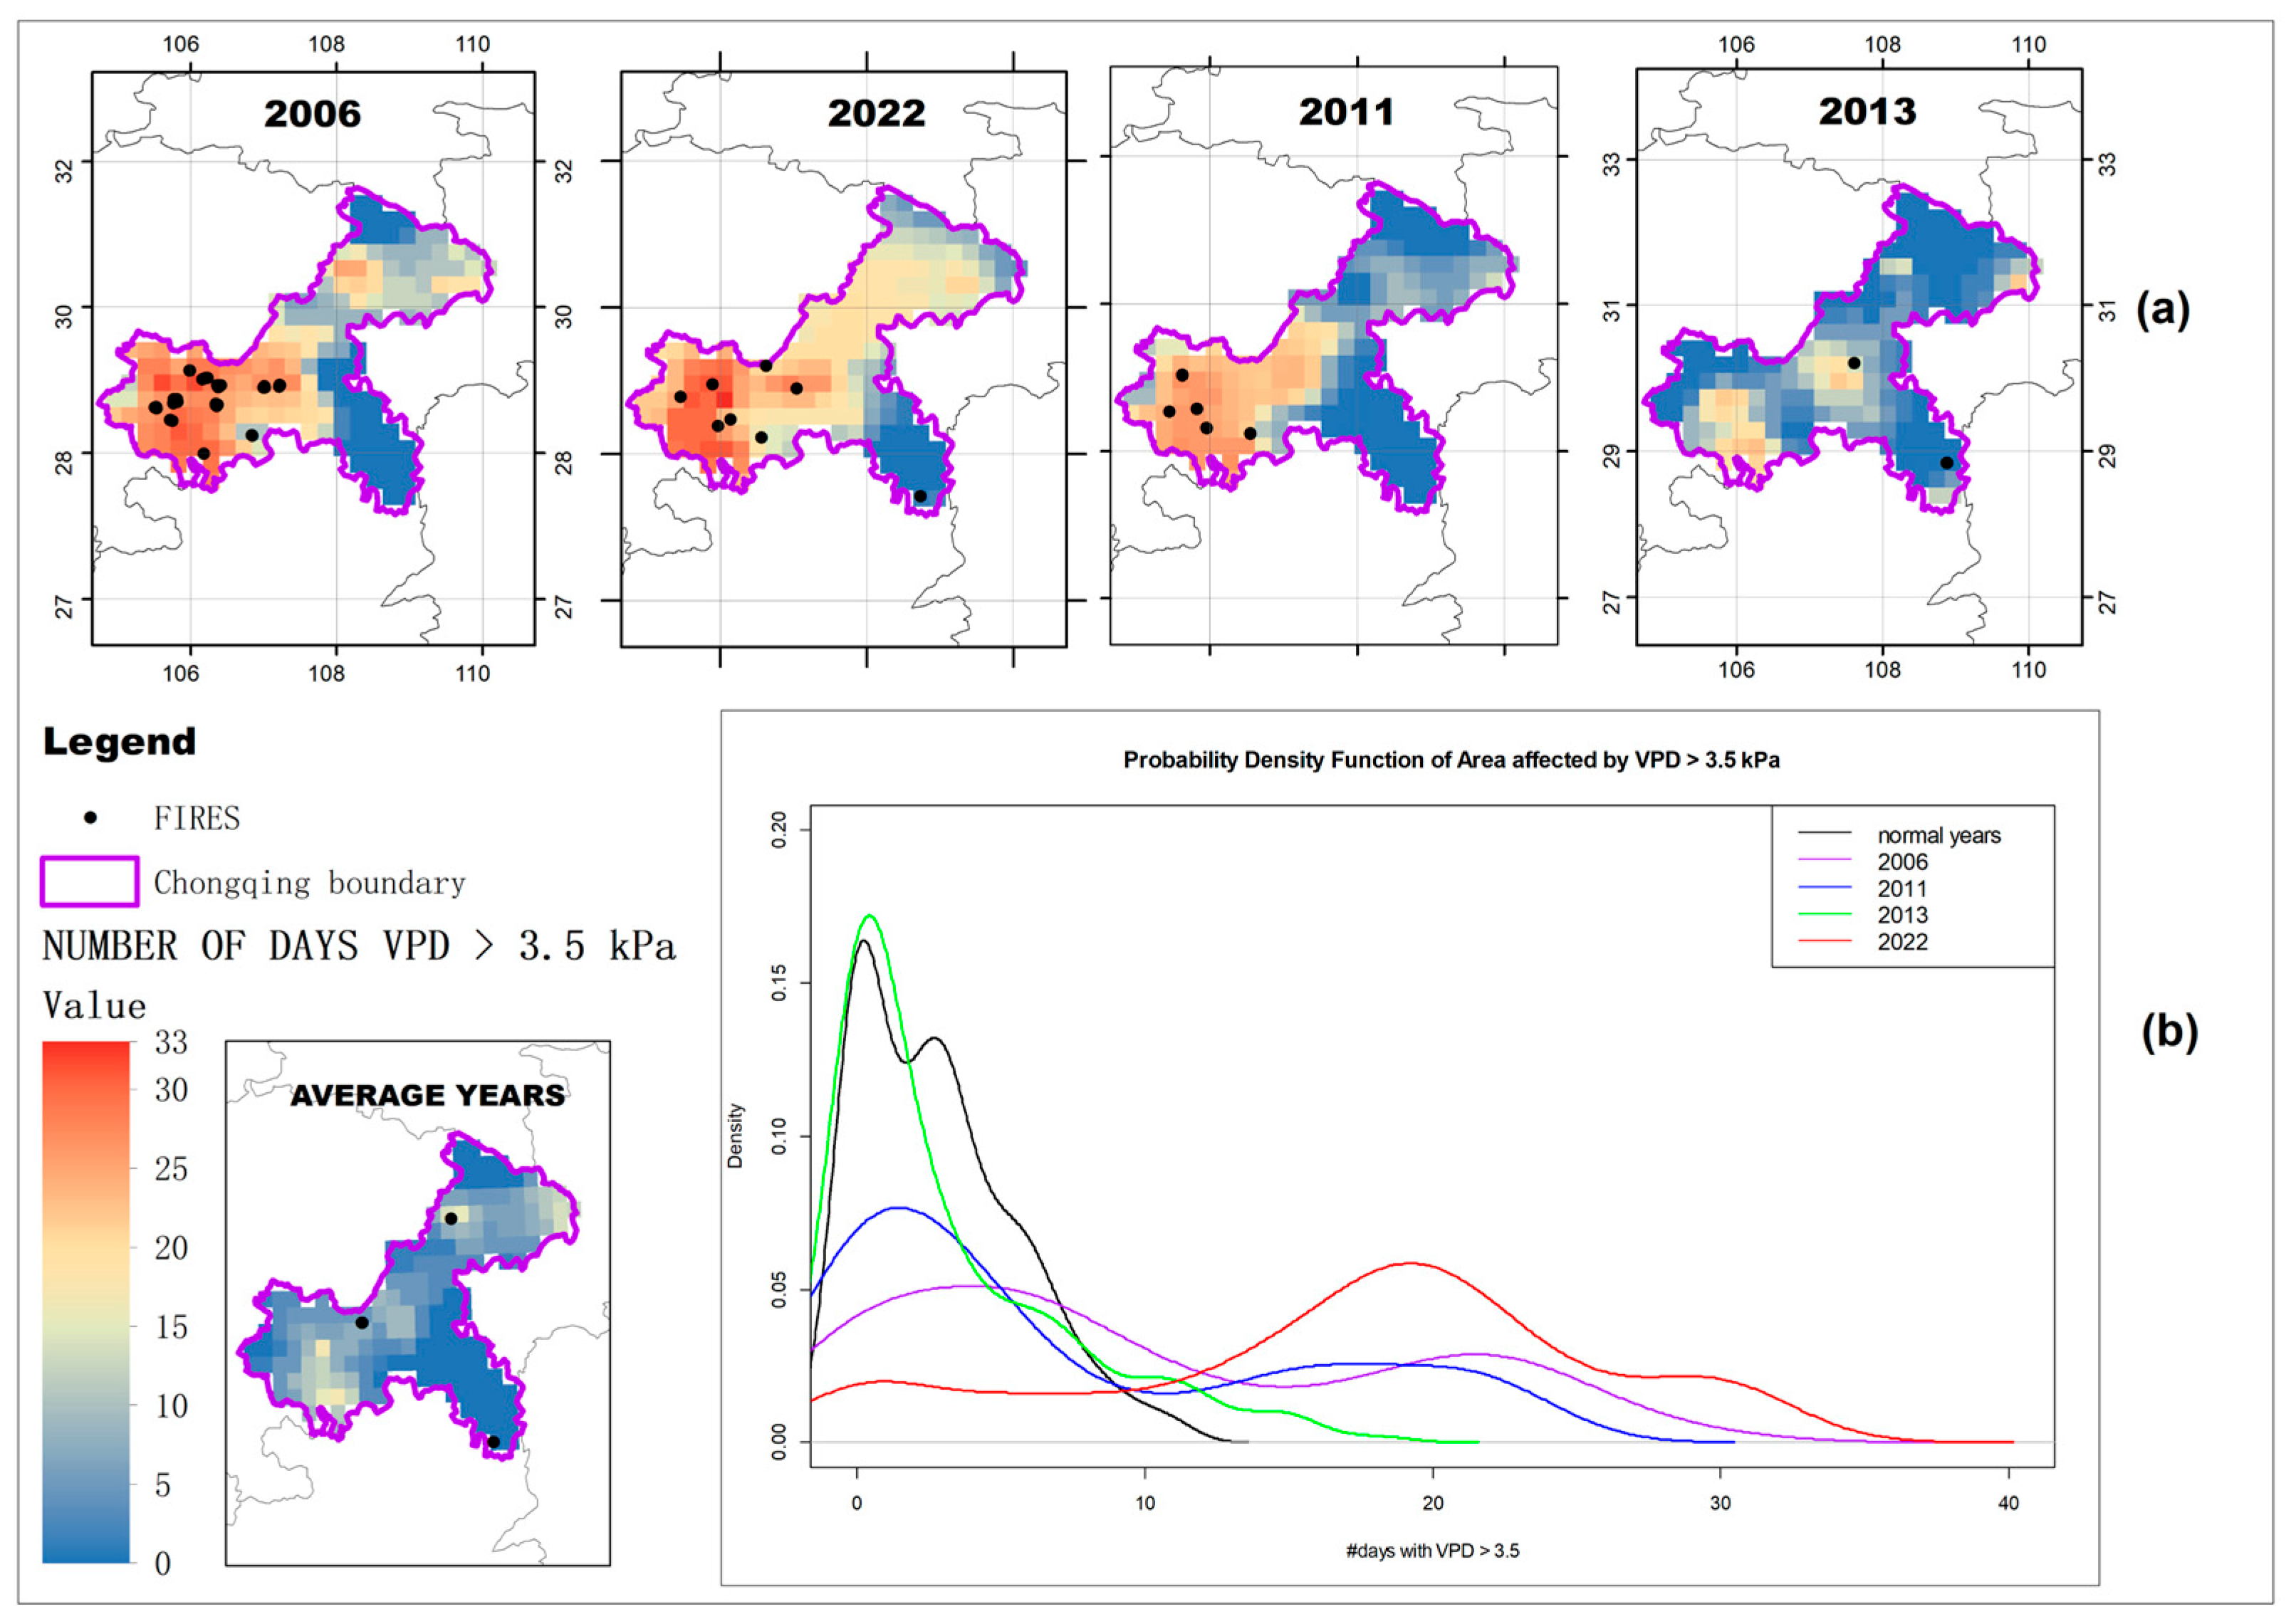
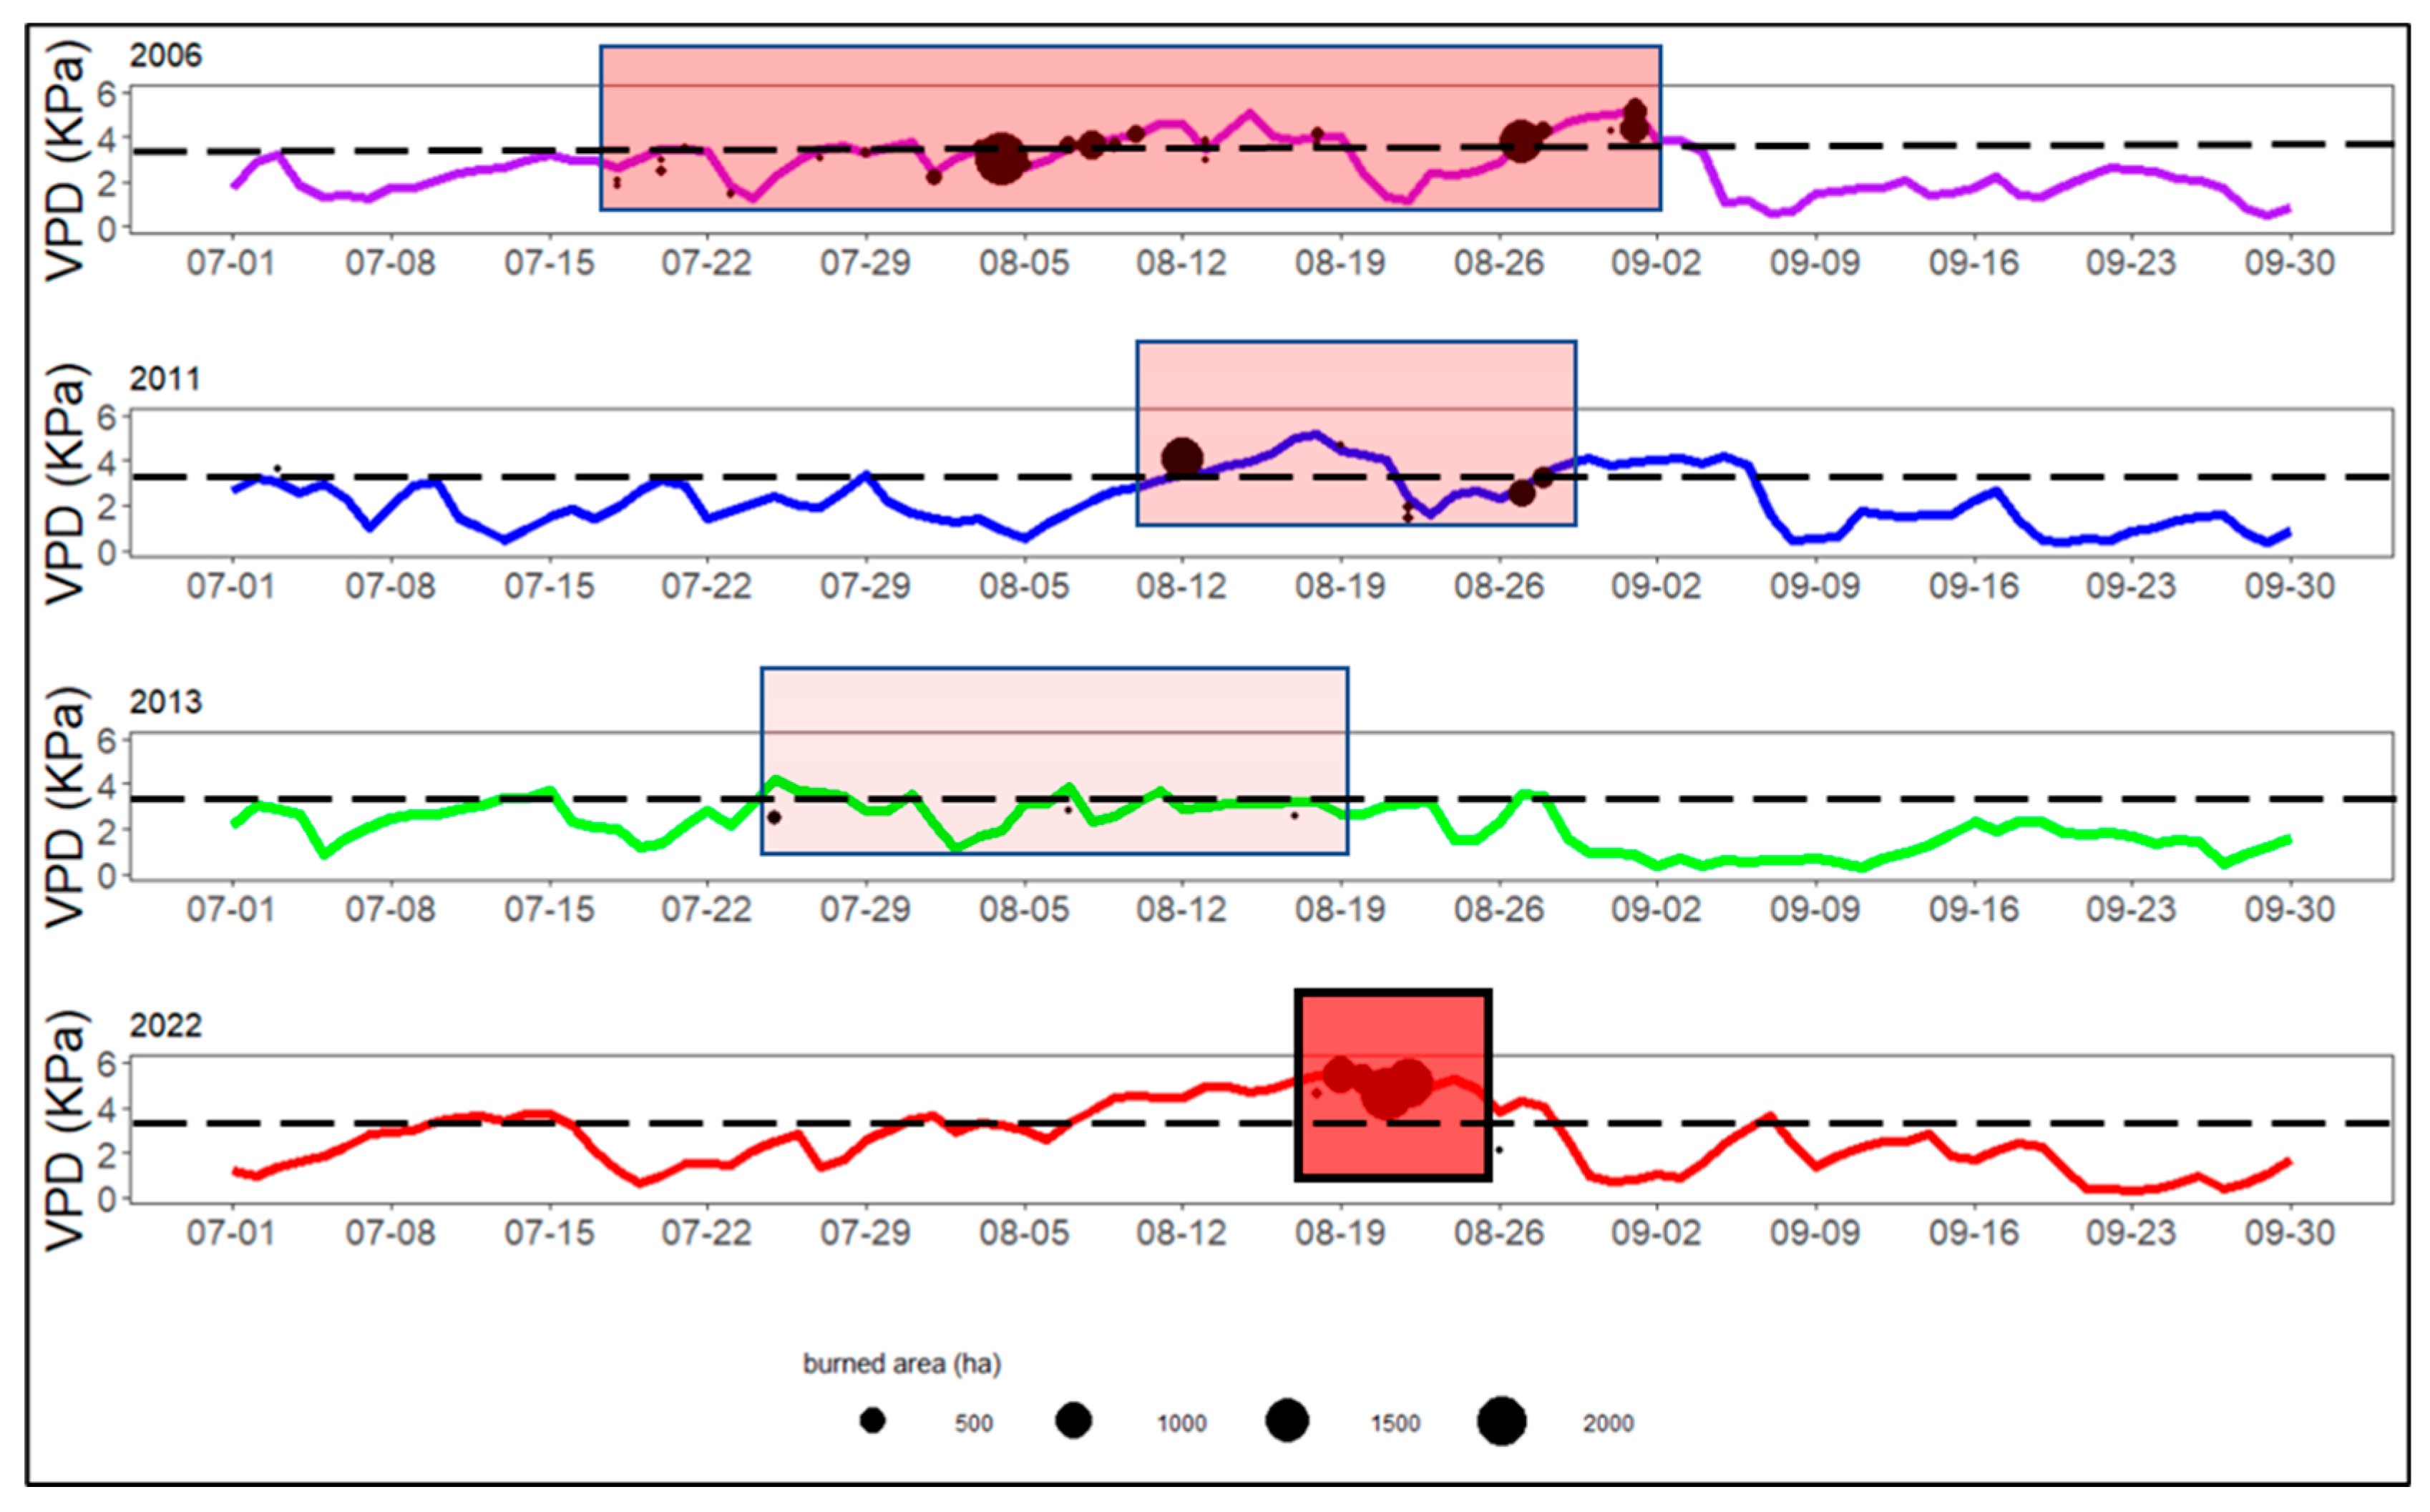
3.3. Spatiotemporal Patterns of Fire Weather (VPD) and Fire Activity (Burned Area)

A clear fire-weather pattern emerges (Figure 4): in the average humid summers, less than 10 days with VPD > 3.5 kPa occurred in 98% of the territory (i.e., only 2% of the total area [% of forested pixels] was affected by more than 10 days with VPD > 3.5 kPa). Conversely, in the summers of 2006, 2011, and 2022, we observed that 38%, 31%, and 77% of the total area were respectively affected by more than 10 days with VPD > 3.5 kPa (Figure 4). In the summer of 2013, 8% of the total territory of Chongqing was affected by more than 10 days with VPD > 3.5 kPa, which also indicates that 2013 was not among the extreme years in Chongqing. In summary, we can distinguish between three groups of years: (a) Drought-heat summers (2006 and 2022) with more than 10 days (across 100% of the forested region) with VPD > 3.5 kPa and more than 6000 ha burned. (b) An intermediate group with between 5 and 10 days (VPD > 3.5 kPa) and around 2500 ha burned. (c) A final group of summers with less than 5 days (VPD > 3.5 kPa) with negligible burned area (including the summer of 2013).
Finally, we observed a strong relationship between fire weather and burned area (Figure 5), where larger fires tended to occur at locations with highest VPD. Regarding the period of fire activity, the summer of 2006 shows a fire progression that escalates between the 3rd week of July and the 1st of September, i.e., more than 1 month of fire activity. In contrast, the summer of 2022 concentrates most fires during only 1 week (Figure 5). The summers of 2011 and 2013 had less burned area relative to the most extreme years of 2006 and 2022 (Figure 5). In terms of fire-weather risk, the years 2006 and 2022 both showed the summers with the largest area and the highest number of days with VPD above 3.5 kPa. The year 2022 had the most extreme fire weather in terms of drought-heat intensity (VPD maximum value), time duration, and area affected, e.g., with 30 days of VPD > 3.5 kPa at a considerable number of locations. Meanwhile, 2006 also registered a high number of peak locations, although the extension of the phenomenon was spatially/temporarily more constrained.

4. Discussion

4.1. Summer CDHEs Have Serious Implications for Fire Activity (Burned Area) and Fire-Weather (Risk); What Alters the Balance between Winter and Summer Burned Area

Historically, Chongqing had few forest fires—less than five fires per month in the fire-weather season—a bimodal fire season with April (four fires per year) and August (five fires per year) as peak months [36]. But the effects of climate change, especially after the increase in CDHEs since the late 1990s, are changing fire behavior in the region. According to local research, fire frequency has doubled in summer (August): from nearly five average fires per year between 1970 and 1998 to nearly ten average fires per year during the period 2000–2010 [37]. This average number obscures the fact that most summer fires between 2000 and 2010 occurred in the CDHE year of 2006, as shown in our analysis of the data provided by the MCD64A1 sensor.
The difference in burned area between CDHE summers and standard (historical) rainy summers is highly significant: the 2006 summer season recorded a burned area of 8535 ha and 2022 had 6480 ha, respectively, whereas in normal rainy summers there were practically no fires during the period 2001–2022. On the other hand, we identified a sharp contrast between the CDHE summer fire seasons and the historical winter fire seasons (Figure 2): summer seasons with CDHEs (2006 and 2022) were about six times the burned area of historical winter fire seasons (Figure 2). A potential consequence of climate change and its associated CDHEs in subtropical China—where summers had been historically rainy (i.e., burned area close to 0 ha)—is that, a longer, increasingly frequent, and more severe summer fire season might be added on top of the historical winter fire season.
In fact, these two temporally differentiated fire seasons in Chongqing are essentially represented by: (a) The historical dry winter season, when fires are generally featured by both low forest cover and lowest VPD values (Figure A5 and Figure A6), as they are most likely represented by agricultural fires related to human land management activities in the countryside. (b) The widening fire summer season (CDHE-driven), which affects a higher forest cover and poses the highest fire-weather risk (VPD values). Notwithstanding that both winter and summer fire seasons tend to appear quite time spaced (Figure A6), we cannot rule out the possibility that soon fires spread all year round (both in winter and summer), as fire season lengthening is being widely observed across different biomes of the world. This is consistent with the projections provided by climate change and ecological modeling, although that possibility is also co-dependent on available biomass fuel.
More importantly, the core of the issue lies in the increase in CDHEs as part of the ongoing process of climate change, which is widening further the time window of fire-weather risk (in the summer season), posing new challenges to fire prevention, terrestrial ecosystem managers, and the broad society. Compound drought and heat events (CDHEs) are becoming more exacerbated and persistent in Southern Australia, Western North America [38], and in China [5], threatening natural ecosystems and agriculture sustainability, having important socioeconomic impacts, and facilitating the spread of forest fires. The recent climate effects found in Chongqing are representative of the increase in global fire-weather risk, which poses a serious challenge to ecosystem sustainability and climate conditions across forest biomes of the world.
In our study area, summer fire-weather extremes in 2006 and 2022 were in many locations associated with more than 25 days above 3.5 kPa (VPD) (Figure 4), leading to the spread of forest fires. At this point, a clear distinction needs to be made between fire weather (i.e., VPD in this study) and fire activity (burned area). For example, the year of 2022 was potentially more dangerous (fire-weather risk)—with more area affected by weather with more than 20 days with VPD > 3.5 kPa (Figure 4)—than 2006. However, total burned area (fire activity) showed the opposite trend, with 2006 having the highest burned area in the environmentally sensitive region of the Three Gorges Reservoir for the whole period 2001–2022. As Figure 5 indicates, the 3.5 kPa VPD discontinuous line marks the division between high and moderate fire-weather risk, the summer 2022 with a wider and more continuous period above this line relative to 2006, 2011, and 2013; however, in terms of fire activity, forest fires in 2006 lasted for a maximum of 1.5 months (2006), whereas they were only concentrated in roughly 1 week in the summer of 2022 (Figure 5).
How can we interpret these two facts? A tentative explanation might be that the recent technical progress attained in fire prevention made 2022 less dramatic in terms of the total burned area (with about 2000 ha below that of 2006), avoiding fires during the most part of the summer (fire weather) season. Currently, fire prevention employs a wide range of technologies, such as remote sensing, drones, multiple early-detection techniques, and permanent ecological stations in forest ecosystems, etc. [39]. From another perspective, the higher fire-weather risk of 2022 made only 1 week enough to reach the highest toll in a very short time (burned area per week).
Despite the fact that we have more advanced technical means to control fire, climate change and its associated CDHEs are pushing fire weather far beyond the historical thresholds (i.e., VPD > 3.5 kPa in this study), which makes the landscape ecosystem potentially (and more rapidly) flammable. One of the lessons to be drawn is that firefighting and fire prevention are going to require new strategies and techniques to adapt to rapidly accelerating climate change. Even though 6480 ha (2022 summer) and 8535 ha (2006 summer) are relatively small areas when compared with the extent of forest fires in other biomes [40], this is important as it could indicate that fires in humid subtropical forests, where fire activity was putatively limited by high moisture, may be increasing due to climate change.

4.2. Ecological Considerations in the Era of Anthropogenic Global Warming

The pervasive influence of regional climate change in subtropical China (here understood as mean temperature increases in addition to CDHEs) can be tracked through the four-switches model [41] of forest fire activity. The extent of forest burned area essentially depends on the following four factors: (1) Fire weather, (2) fuel moisture content, (3) fuel-stock spatial continuity, (4) ignition [42]. According to several studies conducted in Chongqing forests, 80% of fires in Chongqing Municipality are originated in human factors [43,44]. In fact, this number is very similar to the national average in China, nearly 90% due to human factors (China Forest Statistics Yearbook, 2004–2016).
Firstly, climate change generally affects factors (1) and (2) (see four-switches model, above), and promotes (3)—via growing season extension, rising CO2 fertilization—resulting in higher biomass production (provided that minimum water requirements are met). Finally, climate change might even affect ignition via intensifying lighting frequencies [1]. Moreover, not only does forest fire activity (burned area) depend on biophysical factors; however, given the concurrent impacts of human demography and socioeconomic dynamics, forest fires can be best understood under the interaction of both bioclimatic (i.e., the interplay between climate and forest primary production) and human factors (including the technical advance in fire prevention/control and strong fire suppression policy). The latter human behavioral factors in fact exert a key influence on the local division between winter (agricultural) and summer (forest) fires.
Secondly, ecological landscape factors play a role whereby forest landscapes tend to be sparse, young (biomass limited), and fragmented stands in subtropical China—still undergoing a steady recovery process via forest community succession—hindering the occurrence of extensive and continuous area fires (factor 3).
Thirdly, forest fire prevention and extinction measures are promptly implemented at the county level in China—a strong fire suppression policy (factors 3 and 4), which is related to the fact that China still has an important population living in the countryside and the high security priorities prevalent in Chinese society. The strong fire suppression policy might also act as a cautionary warning preventing fires from occurring on successive seasons. In fact, these two latter ecological landscape and strong fire suppression factors may explain why subtropical forest fires in Chongqing Municipality are relatively small when compared with other world biomes.
Another key message to be taken from the 2022 extreme fire season is the importance of incorporating extreme weather events and their return period into forest fire early-detection systems, also in regional planning for ecological restoration programs. Attribution methods provide robust evidence linking climate change with an increasing frequency in extreme weather events [45], and new-generation climatic models predict this trend is going to accentuate under near-future higher emission scenarios [1]. More intense and longer heat waves, especially when combined with low precipitation, facilitate the spread of forest fires such as the devastating 2022 summer fire season in Southwestern Europe [35]. The extension and severity of forest fires in Australia [40,46,47,48,49], the Western USA [2,50,51], and the Mediterranean Region [13,52] have attracted the attention of both scientists and broader society. Forest fires may imply soil erosion impacts that need to be considered and thoroughly quantified to avoid siltation in the Three Gorges Reservoir.

4.3. Limitations and Future Work

In this study, we have based our analysis on two types of data: (a) China Meteorological Network’s weather stations with kriging interpolation, and Copernicus ERA5 for meteorological variables (precipitation, temperature, relative humidity, calculated VPD), and (b) MODIS product MCD64A1 for fire burned area (either from direct satellite images or extracting the data contained in the GLOBFIRE database).
We have used VPD as a proxy of dead fuel moisture content (DFMC), as abundant research evidence confirms the tight correlation between the two variables. Ideally, we would have also conducted field work to collect data on both DFMC and LFMC (live fuel moisture content); however, due to time limitations to conduct field work in Chongqing, we would rather use VPD as a proxy of DFMC.
We are aware of some technical limitations of MCD64A1 to detect small fires (below 30 ha); therefore, our analysis was mostly based on burned area. Despite developments in the more recent VIIRS sensor, whose products were available 2014 onwards [REF], MCD64A1 still provides the most adequate solution allowing for data consistency throughout the entire time frame of our study (2001–2022). In addition, we would have—ideally—used historical burned area (essentially, the periods 1970–1998, 2000–2010), although there were only fire frequency data available, recorded by Chongqing fire prevention administration (Discussion section). Nonetheless, the upward trend detected in the number of fires since the late 1990s demonstrates that climate change and its associated CDHEs are already acting on fire weather and fire activity.
With regard to the biomass limitation factor, the undergoing process of forest biomass recovery due to China’s forest conservation policy needs to be considered in fire prevention and prediction modeling: What kinds of forest community succession trajectories and ecosystem carbon balance dynamics are going to emerge in the context of global warming? What forest species will perform better under new warmer and likely drier conditions in terms of ecosystem functionality (e.g., soil erosion control, water provision, carbon storage, biodiversity protection)? These are relevant research questions, which need to be simultaneous and iteratively addressed in connection with forest fire dynamics. As mean temperature rises and weather extremes become the new normal, regional planning for ecological restoration programs needs to factor in these newly emergent conditions in the future community succession trajectories.

5. Conclusions

In this study, we have a strong indication that summer CDHEs are triggering an abrupt increase in fire-weather risk associated with higher likelihood of expanding fire activity (burned area) in Chongqing, subtropical China via increases in summer VPD (highly correlated with DFMC). Moreover, summer CDHE-driven VPD (most fires above 3.5 kPa) is much higher than the historical winter fire season VPD baselines (most winter fires below 1 kPa), resulting in larger burned areas in dry-hot summers than in the historical dry winters.
Nowadays, we are witnessing an amplification of the time window of high fire-weather risk in Chongqing—far beyond the historical summer thresholds—mainly driven by CDHEs, i.e., an important component of climate change. Higher fire-weather risk entails a higher likelihood of fire activity (burned area), although in a probability function fashion: the year of 2022 presented the highest risk and, despite it did not surpass the numbers of 2006, whereas high losses were accounted for in only 1 week time. The technical improvement in fire prevention, early detection, and firefighting—Chongqing and other regions are adopting the most advanced technologies to cope with climate change and weather extremes—is an important issue. Fire burned area in our study region is relatively low to other biomes such as the Mediterranean forests, which may be explained by both a strong fire suppression policy and ecological landscape (biomass limitation) factors. While CDHEs keep on pushing the fire weather forward toward unknown biophysical frontiers, more mitigation efforts need to contain climate change within secure thresholds. Meanwhile, local adaptation measures and environmental planning are going to play even a more important role in the coming years. The emerging trajectories of change need to be factored in regional ecosystem management and restoration.
As climate change unfolds, scenarios predict that more frequent and intense heat waves will follow, posing direct implications for fire weather in subtropical China and other locations of the country. It is important to continue research in the field of forest fire prediction, ecological modeling, and fire detection, which minimize the impacts of forest fires on human lives, wealth assets, and ecosystems.

Supplementary Materials

The following supporting information can be downloaded at: https://www.mdpi.com/article/10.3390/fire6090346/s1.

Author Contributions

Conceptualization, Y.Y. and V.R.d.D.; data curation, L.G.R., Y.H., M.S. and V.R.d.D.; formal analysis, L.G.R.; funding acquisition, V.R.d.D. and Y.Y; methodology, L.G.R. and V.R.d.D.; writing—original draft, L.G.R.; writing—review and editing, V.R.d.D. and Y.Y. All authors have read and agreed to the published version of the manuscript.

Funding

This research was funded by the National Natural Science Foundation of China (U20A20179, 31850410483), the Talent Proposals in Sichuan Province (2020JDRC0065), and by Southwest University of Science and Technology (18ZX7131).

Institutional Review Board Statement

Not applicable.

Informed Consent Statement

Not applicable.

Data Availability Statement

The data presented in this study are available on request from the corresponding author.

Conflicts of Interest

The authors declare no conflict of interest and the funders had no role in the design of the study, in the collection, analyses, or interpretation of data, in the writing of the manuscript, or in the decision to publish the results.

Appendix A

Figure A1, Figure A2, Figure A3 and Figure A4 are based on the analysis of Copernicus ERA5 satellite images.
Figure A1. Precipitation between 1 July and 31 August (period 2001–2022).
Fire 06 00346 g0a1
Figure A2. Maximum temperature between 1 July and 31 August (period 2001–2022).
Fire 06 00346 g0a2
Figure A3. Relative humidity between 1 July and 31 August (period 2001–2022).
Fire 06 00346 g0a3
Figure A4. Vapor pressure deficit (VPD) between 1 July and 31 August (period 2001–2022).
Fire 06 00346 g0a4
Figure A5. Winter fires tend to occur on lower forest cover (smaller circles in blue), whereas summer CDHE fires are occurring on landscapes (bigger circles in red). Burned area and VPD, controlled for each season (i.e., summer and winter). The radius of circles represents the forest cover (%).
Fire 06 00346 g0a5
Figure A6. Alternating fire seasons between the historical mild winter and the newly emerging virulent summer season, with higher VPD and burned area records. Scatter plot between VPD and year (of each individual fire), controlling for summer/winter season and burned area (individual fires’ point size).
Fire 06 00346 g0a6

References

  1. Jones, M.W.; Abatzoglou, J.T.; Veraverbeke, S.; Andela, N.; Lasslop, G.; Forkel, M.; Smith, A.J.P.; Burton, C.; Betts, R.A.; van der Werf, G.R.; et al. Global and Regional Trends and Drivers of Fire Under Climate Change. Rev. Geophys. 2022, 60, e2020RG000726. [Google Scholar] [CrossRef]
  2. Dong, C.; Williams, A.P.; Abatzoglou, J.T.; Lin, K.; Okin, G.S.; Gillespie, T.W.; Long, D.; Lin, Y.-H.; Hall, A. The season for large fires in Southern California is projected to lengthen in a changing climate. Commun. Earth Environ. 2022, 3, 22. [Google Scholar] [CrossRef]
  3. Arias, P.A.; Bellouin, N.; Coppola, E.; Jones, R.G.; Krinner, G.; Marotzke, J.; Naik, V.; Palmer, M.D.; Plattner, G.-K.; Rogelj, J.; et al. Technical Summary. In Climate Change 2021: The Physical Science Basis Contribution of Working Group I to the Sixth Assessment Report of the Intergovernmental Panel on Climate Change; Masson-Delmotte, V., Zhai, P., Pirani, A., Connors, S.L., Péan, C., Berger, S., Caud, N., Chen, Y., Goldfarb, L., Gomis, M.I., et al., Eds.; Cambridge University Press: Cambridge, UK; New York, NY, USA, 2021; pp. 33–144. [Google Scholar]
  4. Ridder, N.N.; Ukkola, A.M.; Pitman, A.J.; Perkins-Kirkpatrick, S.E. Increased occurrence of high impact compound events under climate change. Clim. Atmos. Sci. (Nat. Partn. J.) 2022, 5, 3. [Google Scholar] [CrossRef]
  5. Yu, R.; Zhai, P.M. More frequent and widespread persistent compound drought and heat event observed in China. Sci. Rep. 2020, 10, 14576. [Google Scholar] [CrossRef] [PubMed]
  6. Chen, W.; Dong, B.W. Projected near-term changes in temperature extremes over China in the mid-twenty-first century and underlying physical processes. Clim. Dyn. 2021, 56, 1879–1894. [Google Scholar] [CrossRef]
  7. de Dios, V.R.; Fellows, A.W.; Nolan, R.H.; Boer, M.M.; Bradstock, R.A.; Domingo, F.; Goulden, M.L. A semi-mechanistic model for predicting the moisture content of fine litter. Agric. For. Meteorol. 2015, 203, 64–73. [Google Scholar] [CrossRef]
  8. Resco-de-Dios, V.; Camprubí, A.C.; He, Y.P.; Han, Y.; Yao, Y.A. North-south antiphase of wildfire activity across the pyroregions of continental China driven by NAO and the Antarctic oscillation. Sci. Total Environ. 2023, 859, 160386. [Google Scholar] [CrossRef] [PubMed]
  9. Ma, F.; Yuan, X.; Li, H. Characteristics and circulation patterns for wet and dry compound day-night heat waves in mid-eastern China. Glob. Planet. Chang. 2022, 213, 103839. [Google Scholar] [CrossRef]
  10. Su, Q.; Dong, B.W. Recent Decadal Changes in Heat Waves over China: Drivers and Mechanisms. J. Clim. 2019, 32, 4215–4234. [Google Scholar] [CrossRef]
  11. Gamelin, B.L.; Feinstein, F.; Wang, J.L.; Bessac, J.; Yan, E.; Kotamarthi, V.R. Projected, U.S. drought extremes through the twenty-first century with vapor pressure deficit. Sci. Rep. 2022, 12, 8615. [Google Scholar] [CrossRef]
  12. Grossiord, C.; Buckley, T.N.; Cernusak, L.A.; Novick, K.A.; Poulter, B.; Siegwolf, R.T.W.; Sperry, J.S.; McDowell, N.G. Plant responses to rising vapor pressure deficit. New Phytol. Tansley Rev. 2020, 226, 1550–1566. [Google Scholar] [CrossRef] [PubMed]
  13. Resco-de-Dios, V.; Camprubí, À.C.; Pérez-Zanón, N.; Peña, J.C.; del Castillo, E.M.; Rodrigues, M.; Yao, Y.; Yebra, M.; Vega-García, C.; Boer, M.M. Convergence in critical fuel moisture and fire weather thresholds associated with fire activity in the pyroregions of Mediterranean Europe. Sci. Total Environ. 2022, 806, 151462. [Google Scholar] [CrossRef]
  14. Jain, P.; Castellanos-Acuna, D.; Coogan, S.C.P.; Abatzoglou, J.T.; Flannigan, M.D. Observed increases in extreme fire weather driven by atmospheric humidity and temperature. Nat. Clim. Chang. 2022, 12, 63–70. [Google Scholar] [CrossRef]
  15. Clarke, H.; Nolan, R.H.; Resco De Dios, V.; Bradstock, R.; Griebel, A.; Khanal, S.; Boer, M.M. Forest fire threatens global carbon sinks and population centres under rising atmospheric water demand. Nat. Commun. 2022, 13, 7161. [Google Scholar] [CrossRef] [PubMed]
  16. Balch, J.K.; Abatzoglou, J.T.; Joseph, M.B.; Koontz, M.J.; Mahood, A.L.; McGlinchy, J.; Cattau, M.E.; Williams, A.P. Warming weakens the night-time barrier to global fire. Nat. Vol. 2022, 602, 442–448. [Google Scholar] [CrossRef] [PubMed]
  17. Dinerstein, E.; Olson, D.; Joshi, A.; Vynne, C.; Burgess, N.D.; Wikramanayake, E.; Hahn, N.; Palminteri, S.; Hedao, P.; Noss, R.; et al. An Ecoregion-Based Approach to Protecting Half the Terrestrial Realm. Bioscience 2017, 67, 534–545. [Google Scholar] [CrossRef] [PubMed]
  18. Tang, C.Q. The Subtropical Vegetation of Southwestern China: Plan Distribution, Diversity and Ecology; Springer: Dordrecht, The Netherlands, 2015; p. 363. [Google Scholar]
  19. Qi, P.W.; Zhang, X. Spatiotemporal variation characteristics and driving factors of vegetation cover in Chongqing from 2000 to 2019. Acta Ecol. Sin. 2022, 42, 5427–5436. (In Chinese) [Google Scholar]
  20. Chongqing Municipal Government. Notice Issued by the Chongqing Municipal People’s Government on Chongqing’s 14th Five-Year Plan (2021–2025) for Building an Important Ecological Barrier in the Upper Reaches of the Yangtze River. 2021. Available online: http://www.cq.gov.cn/zwgk/zfxxgkml/szfwj/qtgw/202105/t20210526_9329658.html (accessed on 10 August 2023). (In Chinese)
  21. Bai, Y.Y.; Gao, Y.H.; Zhang, Y.L.; Li, Y.H.; Wang, Z. The impact of climate change on high temperature, drought, and flood disasters in Chongqing. Meteorol. Mon. 2010, 36, 47–54. (In Chinese) [Google Scholar]
  22. Mao, F.Y.; Li, X.H. Spatial and Temporal Distribution Characteristics of Drought in Southwest China in 56a Based on Daily MCI. Clim. Chang. Res. Lett. 2019, 8, 812–820. (In Chinese) [Google Scholar] [CrossRef]
  23. Yu, R.; Zhai, P.M. Changes in compound drought and hot extreme events in summer overpopulated eastern China. Weather. Clim. Extrem. 2020, 30, 100295. [Google Scholar] [CrossRef]
  24. Shi, Z.T.; Jia, G.S.; Zhou, Y.Y.; Xu, X.Y.; Jiang, Y. Amplified intensity and duration of heatwaves by concurrent droughts in China. Atmos. Res. 2021, 261, 105743. [Google Scholar] [CrossRef]
  25. China Central Government. In 2006, the Severe Drought in Chongqing Made the Average Annual Temperature 1.4 °C Higher. 2007. Available online: https://www.gov.cn/jrzg/2007-01/10/content_492376.htm (accessed on 10 August 2023). (In Chinese)
  26. China Meteorological Administration. Keep Improving, Effectively Deal with Super High Temperature and Drought. 2022. Available online: https://www.cma.gov.cn/ztbd/2022zt/20221028/2022102802/202210/t20221030_5155527.html (accessed on 10 August 2023). (In Chinese)
  27. China Meteorological Administration. Under the Extreme High Temperature, the Drought in the Yangtze River Basin Is Urgent—Six Questions about the Rare Drought in the Yangtze River Basin. 2022. Available online: https://www.cma.gov.cn/wmhd/2011wzbft/2011wftzb/202208/t20220819_5043860.html (accessed on 10 August 2023). (In Chinese)
  28. Wu, P. Under Extreme High Temperature, Understanding the Drought in the Yangtze River Basin Is Urgent. China Meteorological Newspaper, 19 August 2022. (In Chinese) [Google Scholar]
  29. Artés, T.; Oom, D.; de Rigo, D.; Durrant, T.H.; Maianti, P.; Libertà, G. A global wildfire dataset for the analysis of fire regimes and fire behaviour. Sci. Data 2019, 6, 286. [Google Scholar] [CrossRef] [PubMed]
  30. Giglio, L.; Justice, C.; Boschetti, L.; Roy, D. MODIS/Terra + Aqua Burned Area Monthly L3 Global 500 m SIN Grid V061 [Data Set]; NASA EOSDIS Land Processes Distributed Active Archive Center: Sioux Falls, SD, USA, 2021. [CrossRef]
  31. Giglio, L.; Schroeder, W.; Justice, C.O. The collection 6 MODIS active fire detection algorithm and fire products. Remote Sens. Environ. 2016, 178, 31–41. [Google Scholar] [CrossRef] [PubMed]
  32. Giglio, L.; Descloitres, J.; Justice, C.O.; Kaufman, Y.J. An Enhanced Contextual Fire Detection Algorithm for, M.O.D.I.S. Remote Sens. Environ. 2003, 87, 273–282. [Google Scholar] [CrossRef]
  33. Muñoz-Sabater, J.; Dutra, E.; Agustí-Panareda, A.; Albergel, C.; Arduini, G.; Balsamo, G.; Boussetta, S.; Choulga, M.; Harrigan, S.; Hersbach, H.; et al. ERA5-Land: A state-of-the-art global reanalysis dataset for land applications. Earth Syst. Sci. Data 2021, 13, 4349–4383. [Google Scholar] [CrossRef]
  34. Pebesma, E.; Graeler, B. Package ‘gstat’. Cran, 2014, pp. 1–79. Available online: http://52north.org/geostatistics (accessed on 15 June 2023).
  35. Rodrigues, M.; Camprubí, À.C.; Balaguer-Romano, R.; Megía, C.J.C.; Castañares, F.; Ruffault, J.; Fernandes, P.M.; de Dios, V.R. Drivers and implications of the extreme 2022 wildfire season in Southwest Europe. Sci. Total Environ. 2023, 859, 160320. [Google Scholar] [CrossRef] [PubMed]
  36. Liu, Y.; Li, Q.; Liu, D.; Chen, D.; Hu, C.M. Variation Characteristics of Forest Fire Danger and Analysis on Meteorological Conditions in Chongqing. J. Arid. Meteorol. 2014, 32, 744–750. (In Chinese) [Google Scholar]
  37. Chen, Y.Y.; You, Y.S.; He, Z.M.; Zeng, Y. Analysis on Temporal—Spatial Feature of Forest Fires in Chongqing. Chin. Agric. Sci. Bull. 2014, 30, 51–58. [Google Scholar]
  38. Richardson, D.; Black, A.S.; Irving, D.; Matear, R.J.; Monselesan, D.P.; Risbey, J.S.; Squire, D.T. Global increase in wildfire potential from compound fire weather and drought. Clim. Atmos. Sci. (Nat. Partn. J.) 2022, 5, 23. [Google Scholar] [CrossRef]
  39. Chongqing Municipal Government. Stabilize the Forest Fire Damage Rate to Less Than 0.3‰ Chongqing Set This Work Target in 2023. Available online: https://www.cq.gov.cn/ywdt/jrcq/202303/t20230309_11728354.html (accessed on 10 August 2023). (In Chinese)
  40. Boer, M.M.; Resco-de-Dios Bradstock, R.A. Unprecedented burn area of Australian mega forest fires. Nat. Clim. Chang. 2020, 10, 170. [Google Scholar] [CrossRef]
  41. Bradstock, R.A. A biogeographic model of fire regimes in Australia: Current and future implications. Glob. Ecol. Biogeogr. 2010, 19, 145–158. [Google Scholar] [CrossRef]
  42. Nolan, R.H.; Blackman, C.J.; de Dios, V.R.; Choat, B.; Medlyn, B.E.; Li, X.; Bradstock, R.A.; Boer, M.M. Linking Forest Flammability and Plant Vulnerability to Drought. Forests 2020, 11, 779. [Google Scholar] [CrossRef]
  43. Hou, D. Investigation on Existing Issues and Strategies Concerning the Protection of Forest Resources in Chongqing City. Master’s Thesis, Southwest University, Chongqing, China, 2022. (In Chinese). [Google Scholar]
  44. Yuan, J.; Jiang, H.; Xu, J. Analysis on Regularity and Trend of Forest Fire in Chongqing. J. Zhejiang For. Sci. Technol. 2013, 33, 74–78. [Google Scholar]
  45. Zhao, W.J. Extreme weather and climate events in China under changing climate. Natl. Sci. Rev. 2020, 7, 938–943. [Google Scholar] [CrossRef] [PubMed]
  46. Nolan, R.H.; Boer, M.M.; de Dios, V.R.; Caccamo, G.; Bradstock, R.A. Large-scale, dynamic transformations in fuel moisture drive wildfire activity across southeastern Australia. Geophys. Res. Lett. 2016, 43, 4229–4238. [Google Scholar] [CrossRef]
  47. Nolan, R.H.; Boer, M.M.; Collins, L.; de Dios, V.R.; Clarke, H.; Jenkins, M.; Kenny, B.; Bradstock, R.A. Causes and consequences of eastern Australia’s 2019–2020 season of mega-fires. Glob. Chang. Biol. 2020, 26, 1039–1041. [Google Scholar] [CrossRef] [PubMed]
  48. Abram, N.J.; Henley, B.J.; Gupta, A.S.; Lippmann, T.J.R.; Clarke, H.; Dowdy, A.J.; Sharples, J.J.; Nolan, R.H.; Zhang, T.; Wooster, M.J.; et al. Connections of climate change and variability to large and extreme forest fires in southeast Australia. Commun. Earth Environ. 2021, 2, 8. [Google Scholar] [CrossRef]
  49. Squire, D.T.; Richardson, D.; Risbey, J.S.; Black, A.S.; Kitsios, V.; Matear, R.J.; Monselesan, D.; Moore, T.S. Likelihood of unprecedented drought and fire weather during Australia’s 2019 megafires. Clim. Atmos. Sci. (Nat. Partn. J.) 2021, 4, 64. [Google Scholar] [CrossRef]
  50. Williams, A.P.; Abatzoglou, J.T.; Gershunov, A.; Guzman-Morales, J.; Bishop, D.A.; Balch, J.K.; Lettenmaier, D.P. Observed Impacts of Anthropogenic Climate Change on Wildfire in California. Earth’s Future 2019, 7, 892–910. [Google Scholar] [CrossRef]
  51. Khorshidi, M.S.; Dennison, P.E.; Nikoo, M.R.; AghaKouchak, A.; Luce, C.H.; Sadegh, M. Increasing concurrence of wildfire drivers tripled megafire critical danger days in Southern California between 1982 and 2018. Environ. Res. Lett. 2020, 15, 104002. [Google Scholar] [CrossRef]
  52. Ruffault, J.; Curt, T.; Moron, V.; Trigo, R.M.; Mouillot, F.; Koutsias, N.; Pimont, F.; Martin-StPaul, N.; Barbero, R.; Dupuy, J.-L.; et al. Increased likelihood of heat-induced large wildfires in the Mediterranean Basin. Sci. Rep. 2020, 10, 13790. [Google Scholar] [CrossRef]
Figure 1. Forest ecoregions in the study area of the Three Gorges Reservoir, located inside Chongqing Municipality and Hubei Province.
Fire 06 00346 g001
Figure 2. 2006, 2011, and 2022 summer fire seasons had the highest burned area. Total burned forest area (a) per year, and (b) per month for the period 2001–2022.
Fire 06 00346 g002
Figure 3. Daily weather variables during the summer season (July-August-September) for the period 2001–2022. The years 2006 (in purple), 2011 (blue), 2013 (green), and 2022 (red) had the summer seasons with (a) lowest mean precipitation, (b) highest median temperature, and (c) highest VPD. The statistics (medians and mean) were calculated across the whole territory contained within Chongqing Municipality.
Fire 06 00346 g003
Figure 4. The years 2006 and 2022 had the largest area affected by the longest duration under high vapor pressure deficit, as shown in: (a) The spatial representation of the number of days with VPD above 3.5 kPa, and (b) the probability density function of the area affected by VPD > 3.5 kPa.
Fire 06 00346 g004
Figure 5. The years 2006, 2011, 2013, and 2022 summer fire seasons show a significant association between fire frequency, burned area, and VPD. The discontinuous (black) line marks the VPD threshold of 3.5 kPa (fire-weather risk); the red colored boxes are placed at the time window of fire activity (burned area); the continuous (colored) lines represent daily dynamics of VPD 85th percentile plotted against each forest fire (black points); the position of each fire in the figure is determined by its specific VPD and specific day when each fire occurred; the size of each fire point is determined by each fire’s burned area.
Fire 06 00346 g005
Table 1. Summary of datasets employed to estimate burned area, fire-weather variables, and VPD.
ItemMODIS
GLOBFIRE Database
ERA5-Land (ECMWF *)Kriging Model
MethodMCD64A1 product **Reanalysis: combined model data with satellite observations.Spatial interpolation based on data collected from 35 weather stations.
Spatial resolution500 m0.1° pixel: equivalent to 9.8 km longitude and 11.2 km latitude.0.201° pixel: equivalent to 19.5 km longitude and 22.4 km longitude.
Spatial referenceWGS84 datum, UTM Zone 48N.WGS84 datum, UTM Zone 48N.WGS84 datum, UTM Zone 48N.
Temporal resolutionDaily extractionDaily reanalysisDaily interpolation
VariablesBurned area (date)Precipitation, maximum temperature, 3 pm relative humidity.
Vapor pressure deficit (VPD).
Precipitation
Temperature
Relative humidity
Vapor pressure deficit (VPD)
ReferencesGiglio, L., Justice, C., Boschetti, L., Roy, D. (2021) [30]
Giglio et al. (2016) [31]
Giglio et al. (2003) [32]
Muñoz-Sabater et al. (2021) [33]Graeler B. and Pebesma E. (2014) [34]
R libraries (gstat, sf, sp, raster, rgdal, rasterVis)
RStudio (2023.03.0 Build 386)
* European Centre for Medium-Range Weather Forecasts. ** MCD64A1: 1, 2, 7 bands (0.65, 0.86, and 2.1 μm, respectively) for sunlight and brightness; 21, 22 bands (4.0 and 4.0 μm) for active fire detection; 31 bands (11.0 μm) for fire detection, cloud masking and forest clearing rejection, and 32 bands (12.0 μm) for cloud masking [31,32,33].
Disclaimer/Publisher’s Note: The statements, opinions and data contained in all publications are solely those of the individual author(s) and contributor(s) and not of MDPI and/or the editor(s). MDPI and/or the editor(s) disclaim responsibility for any injury to people or property resulting from any ideas, methods, instructions or products referred to in the content.

