
Distance-Based Analysis of Early Fire Indicators on a New Indoor Laboratory Dataset with Distributed Multi-Sensor Nodes


Abstract
:1. Introduction
2. Related Work
3. Materials and Methods
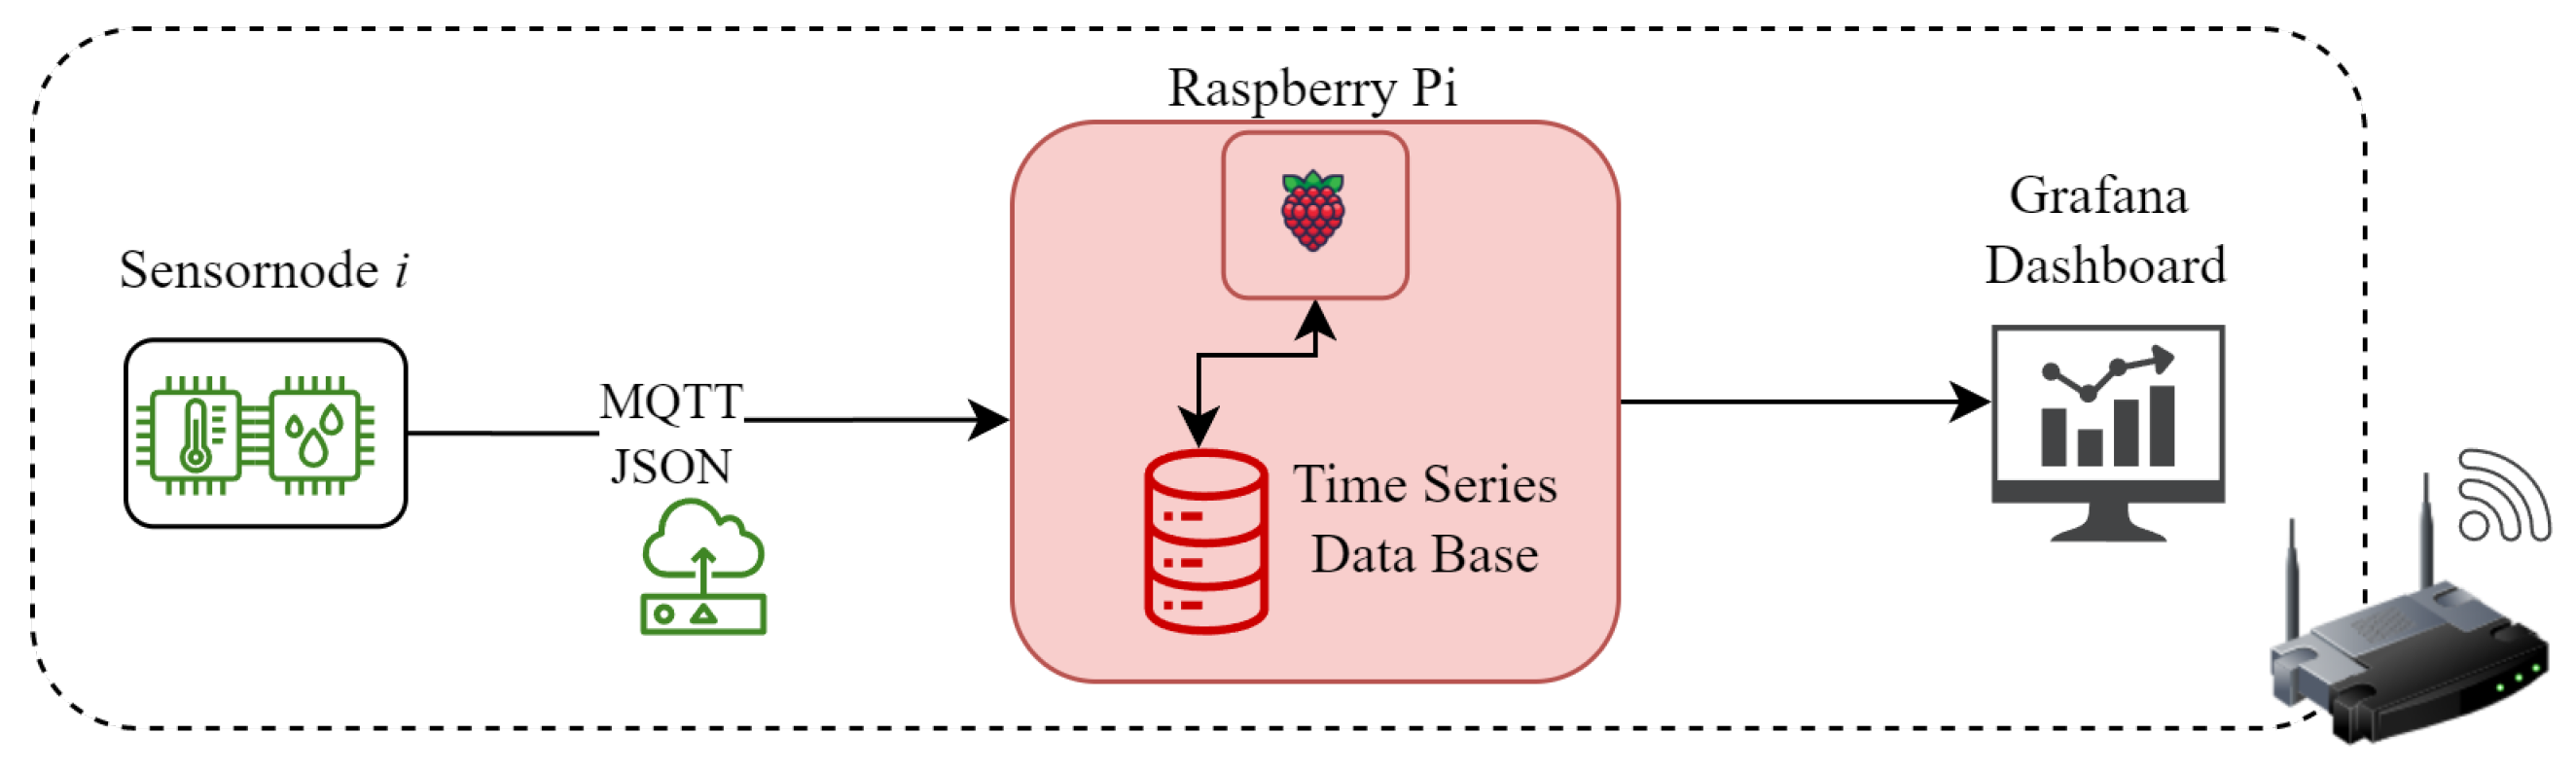
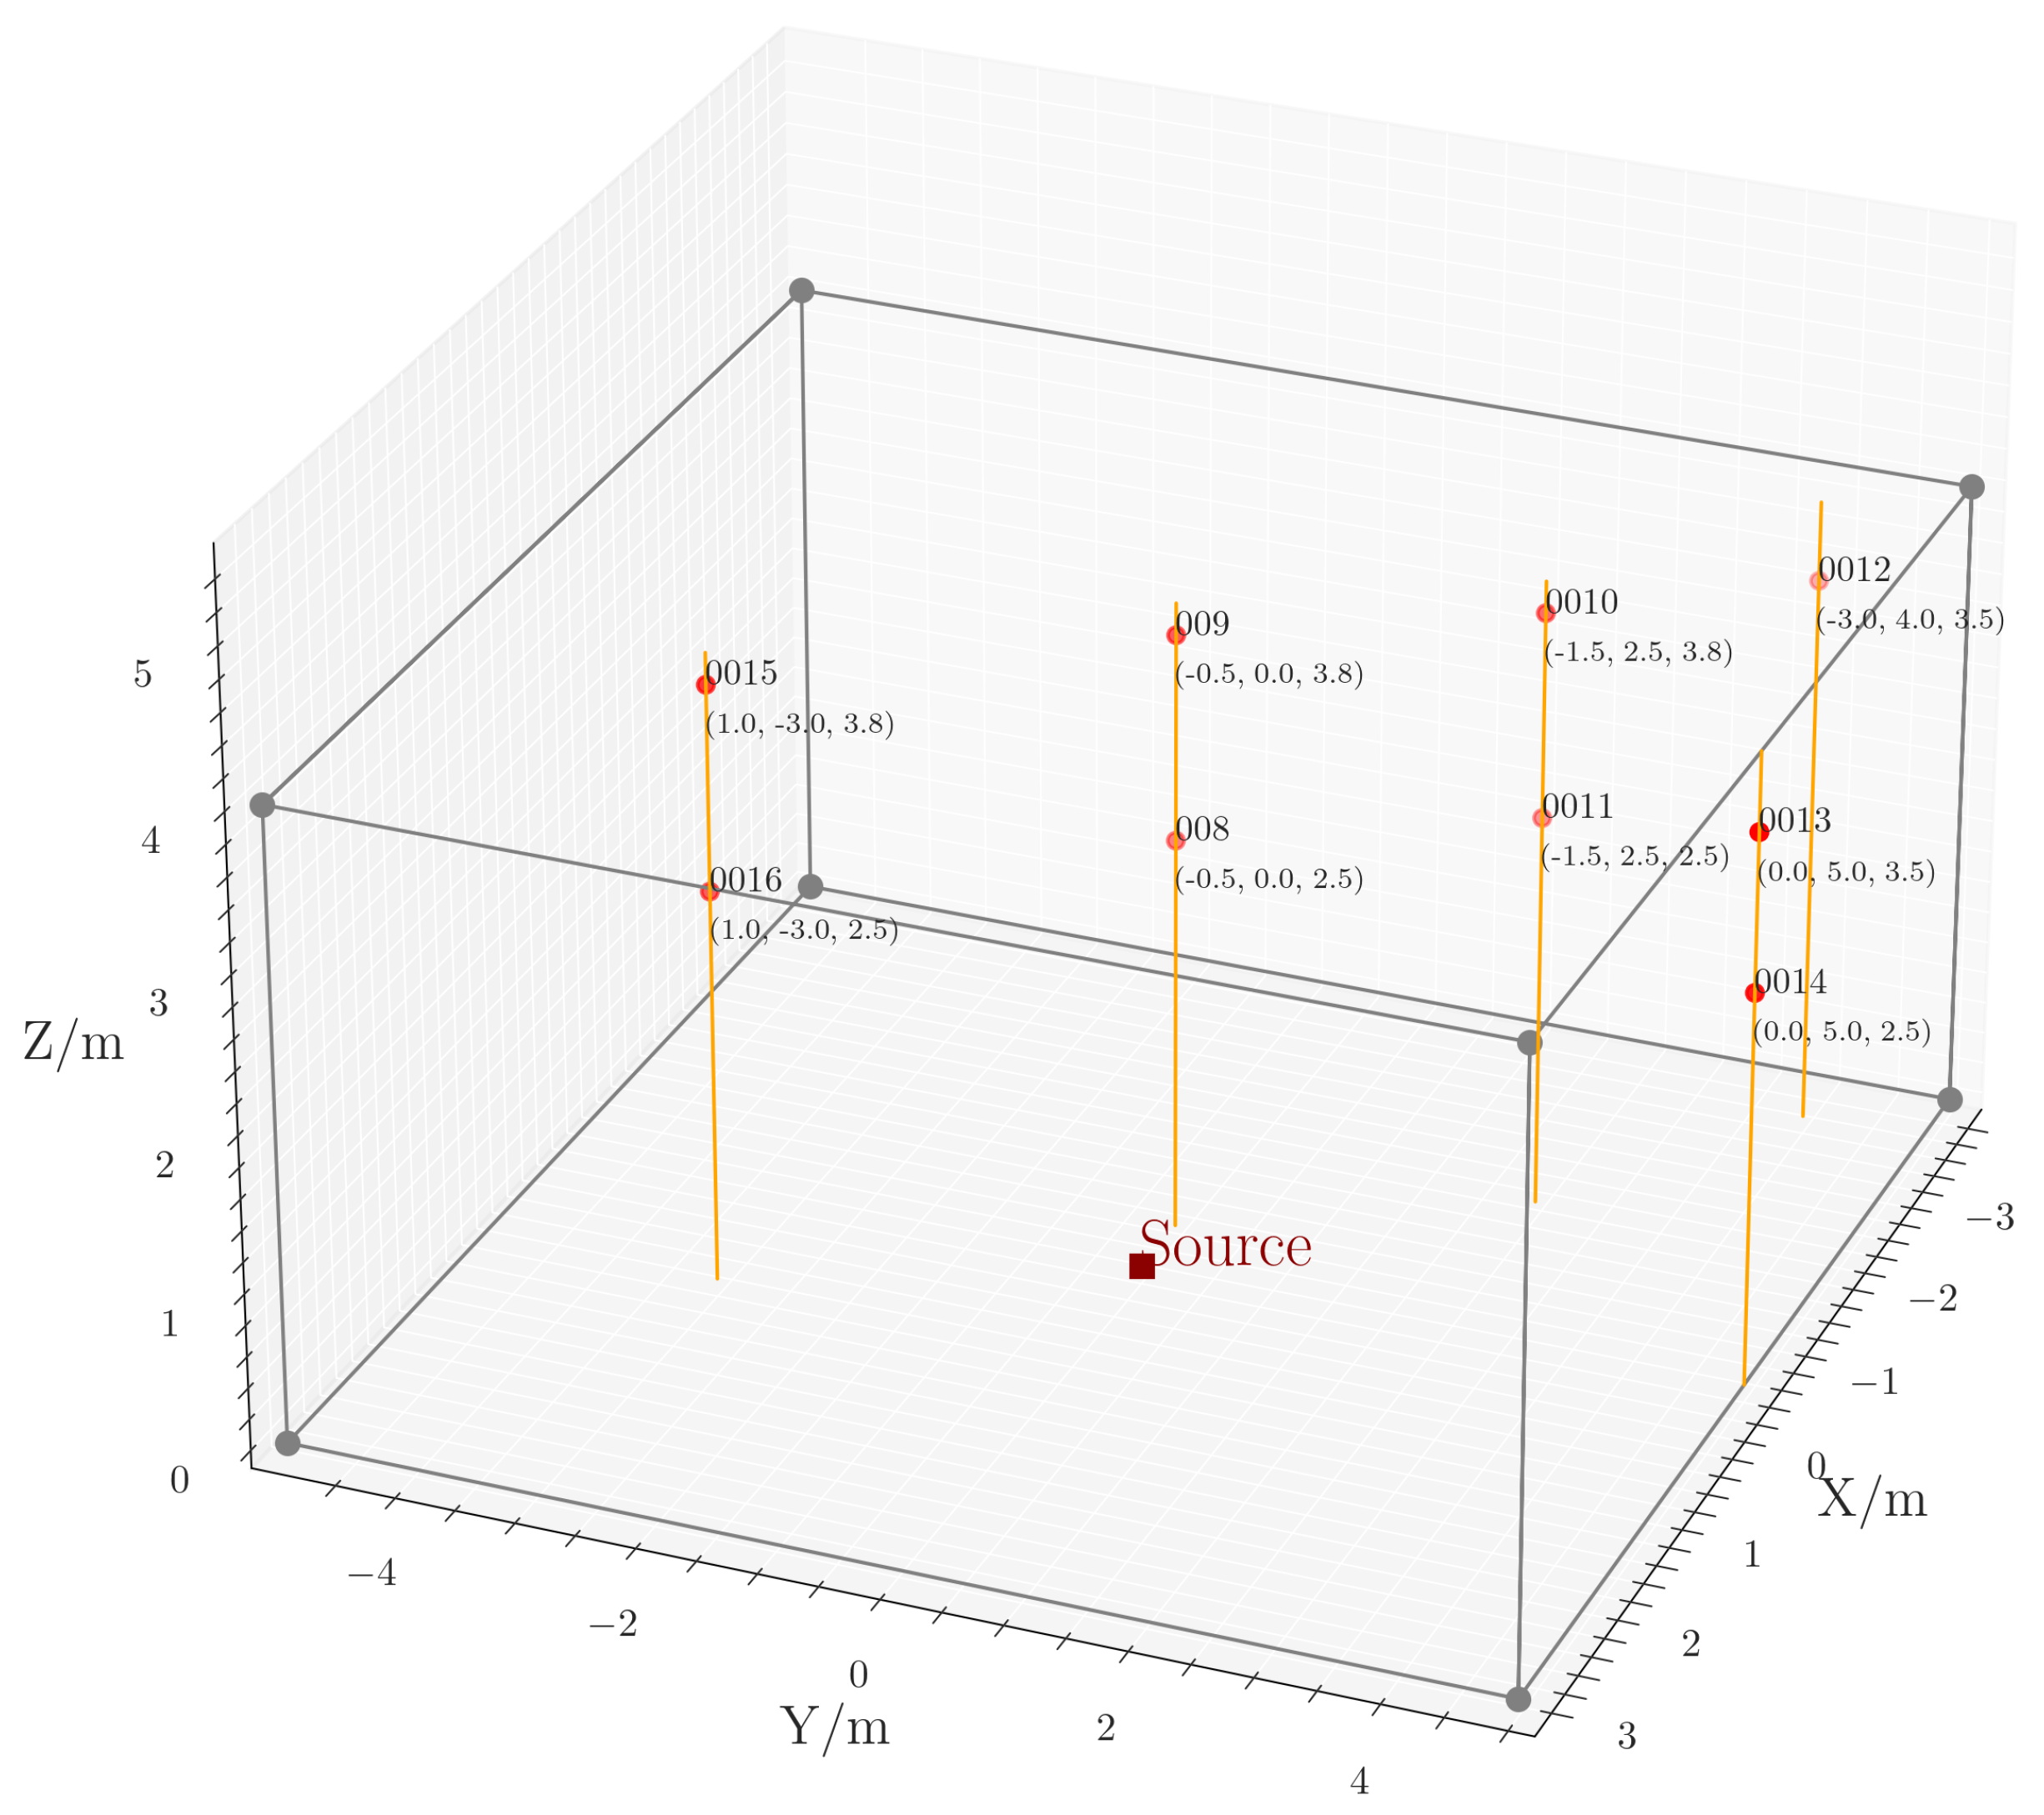
3.1. Sensor Network Setup
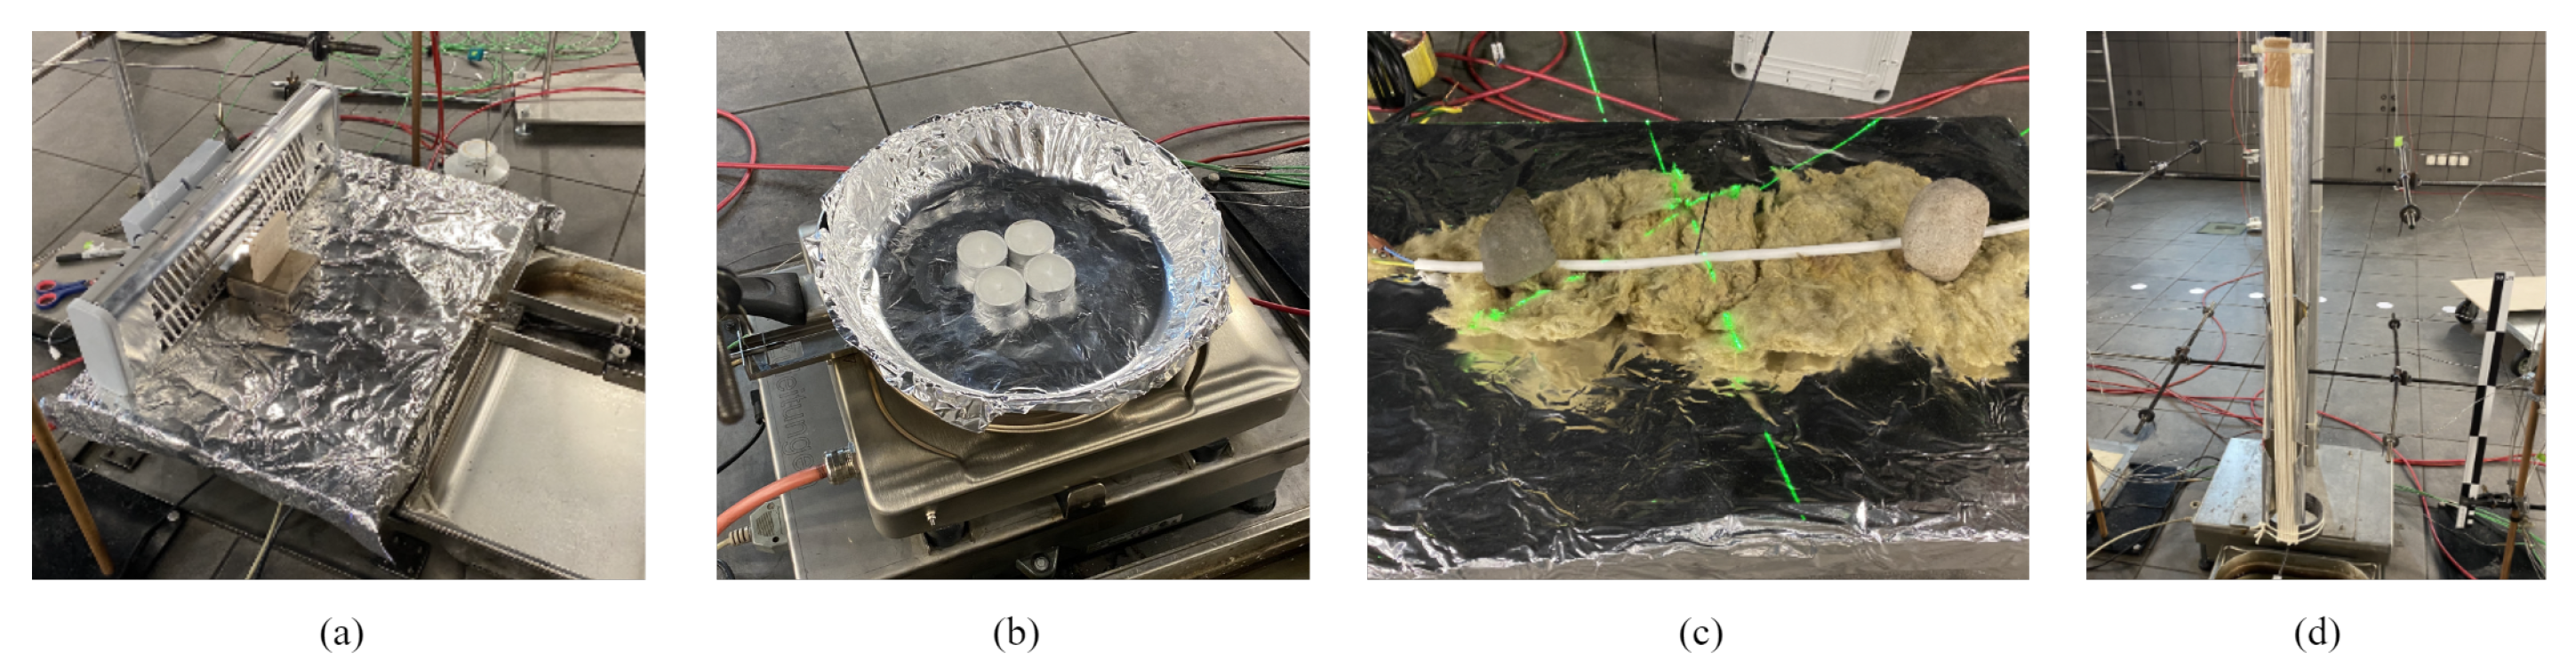
3.2. Experimental Procedure
3.3. Dataset
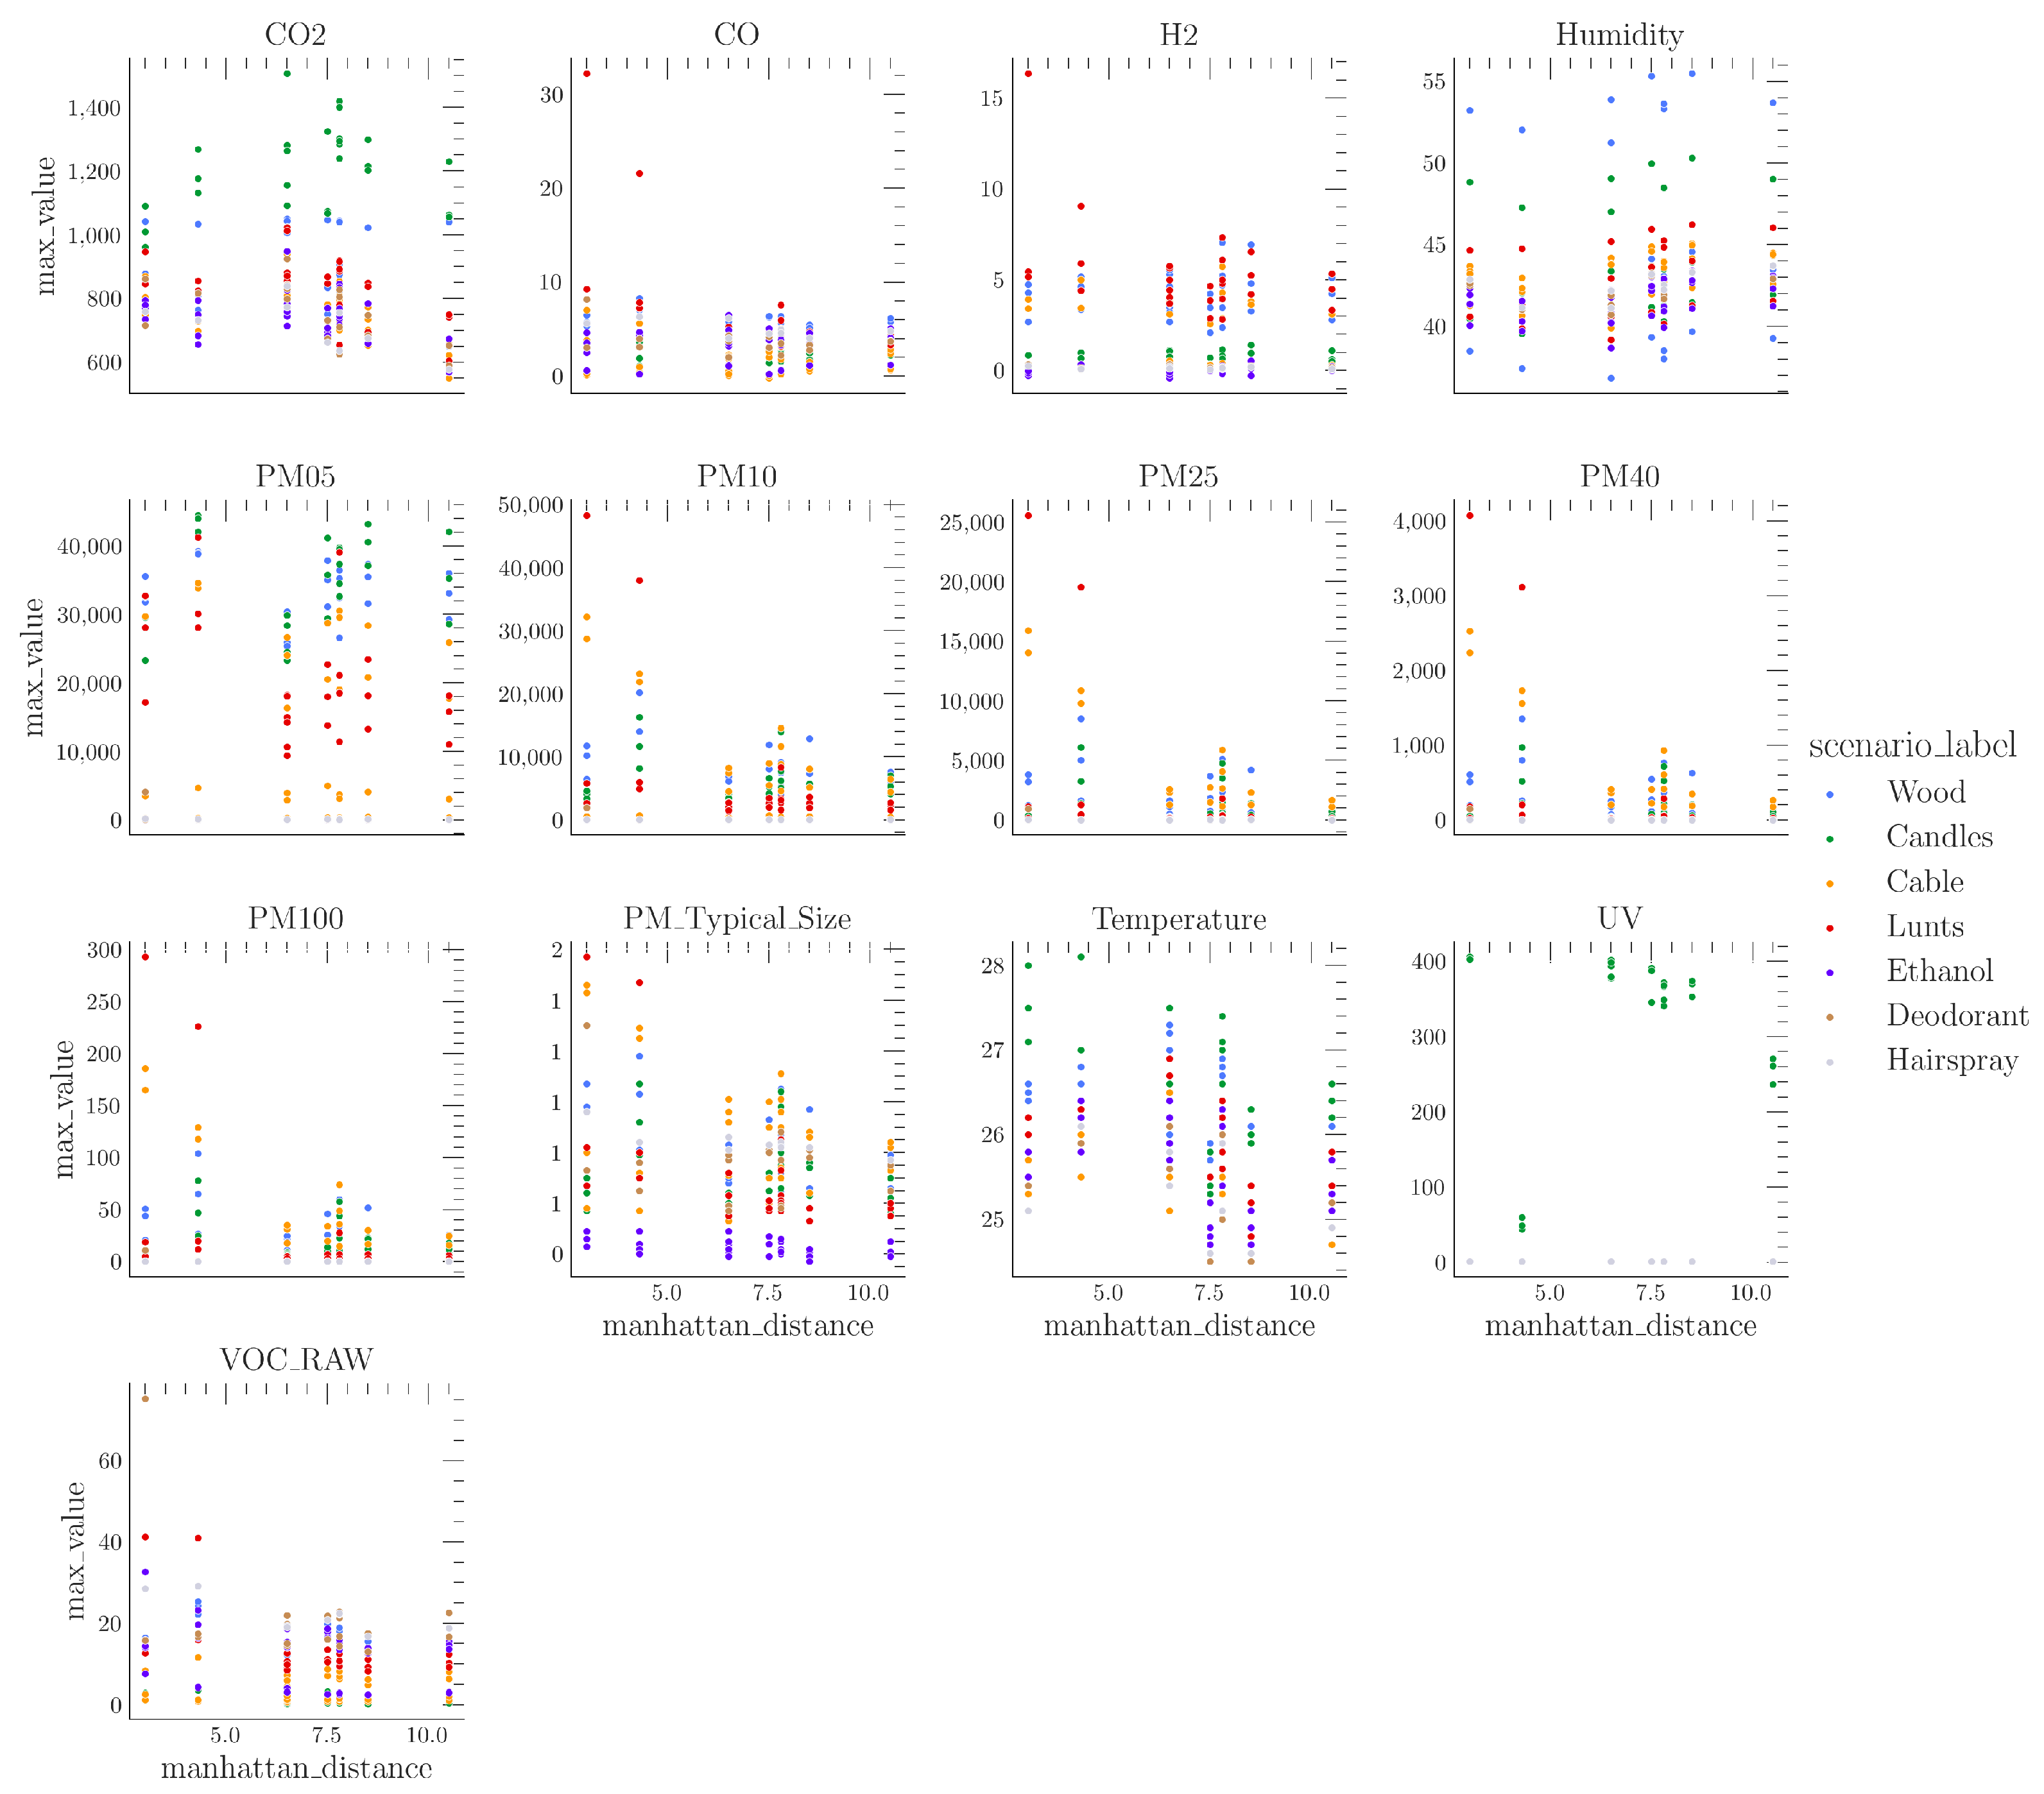
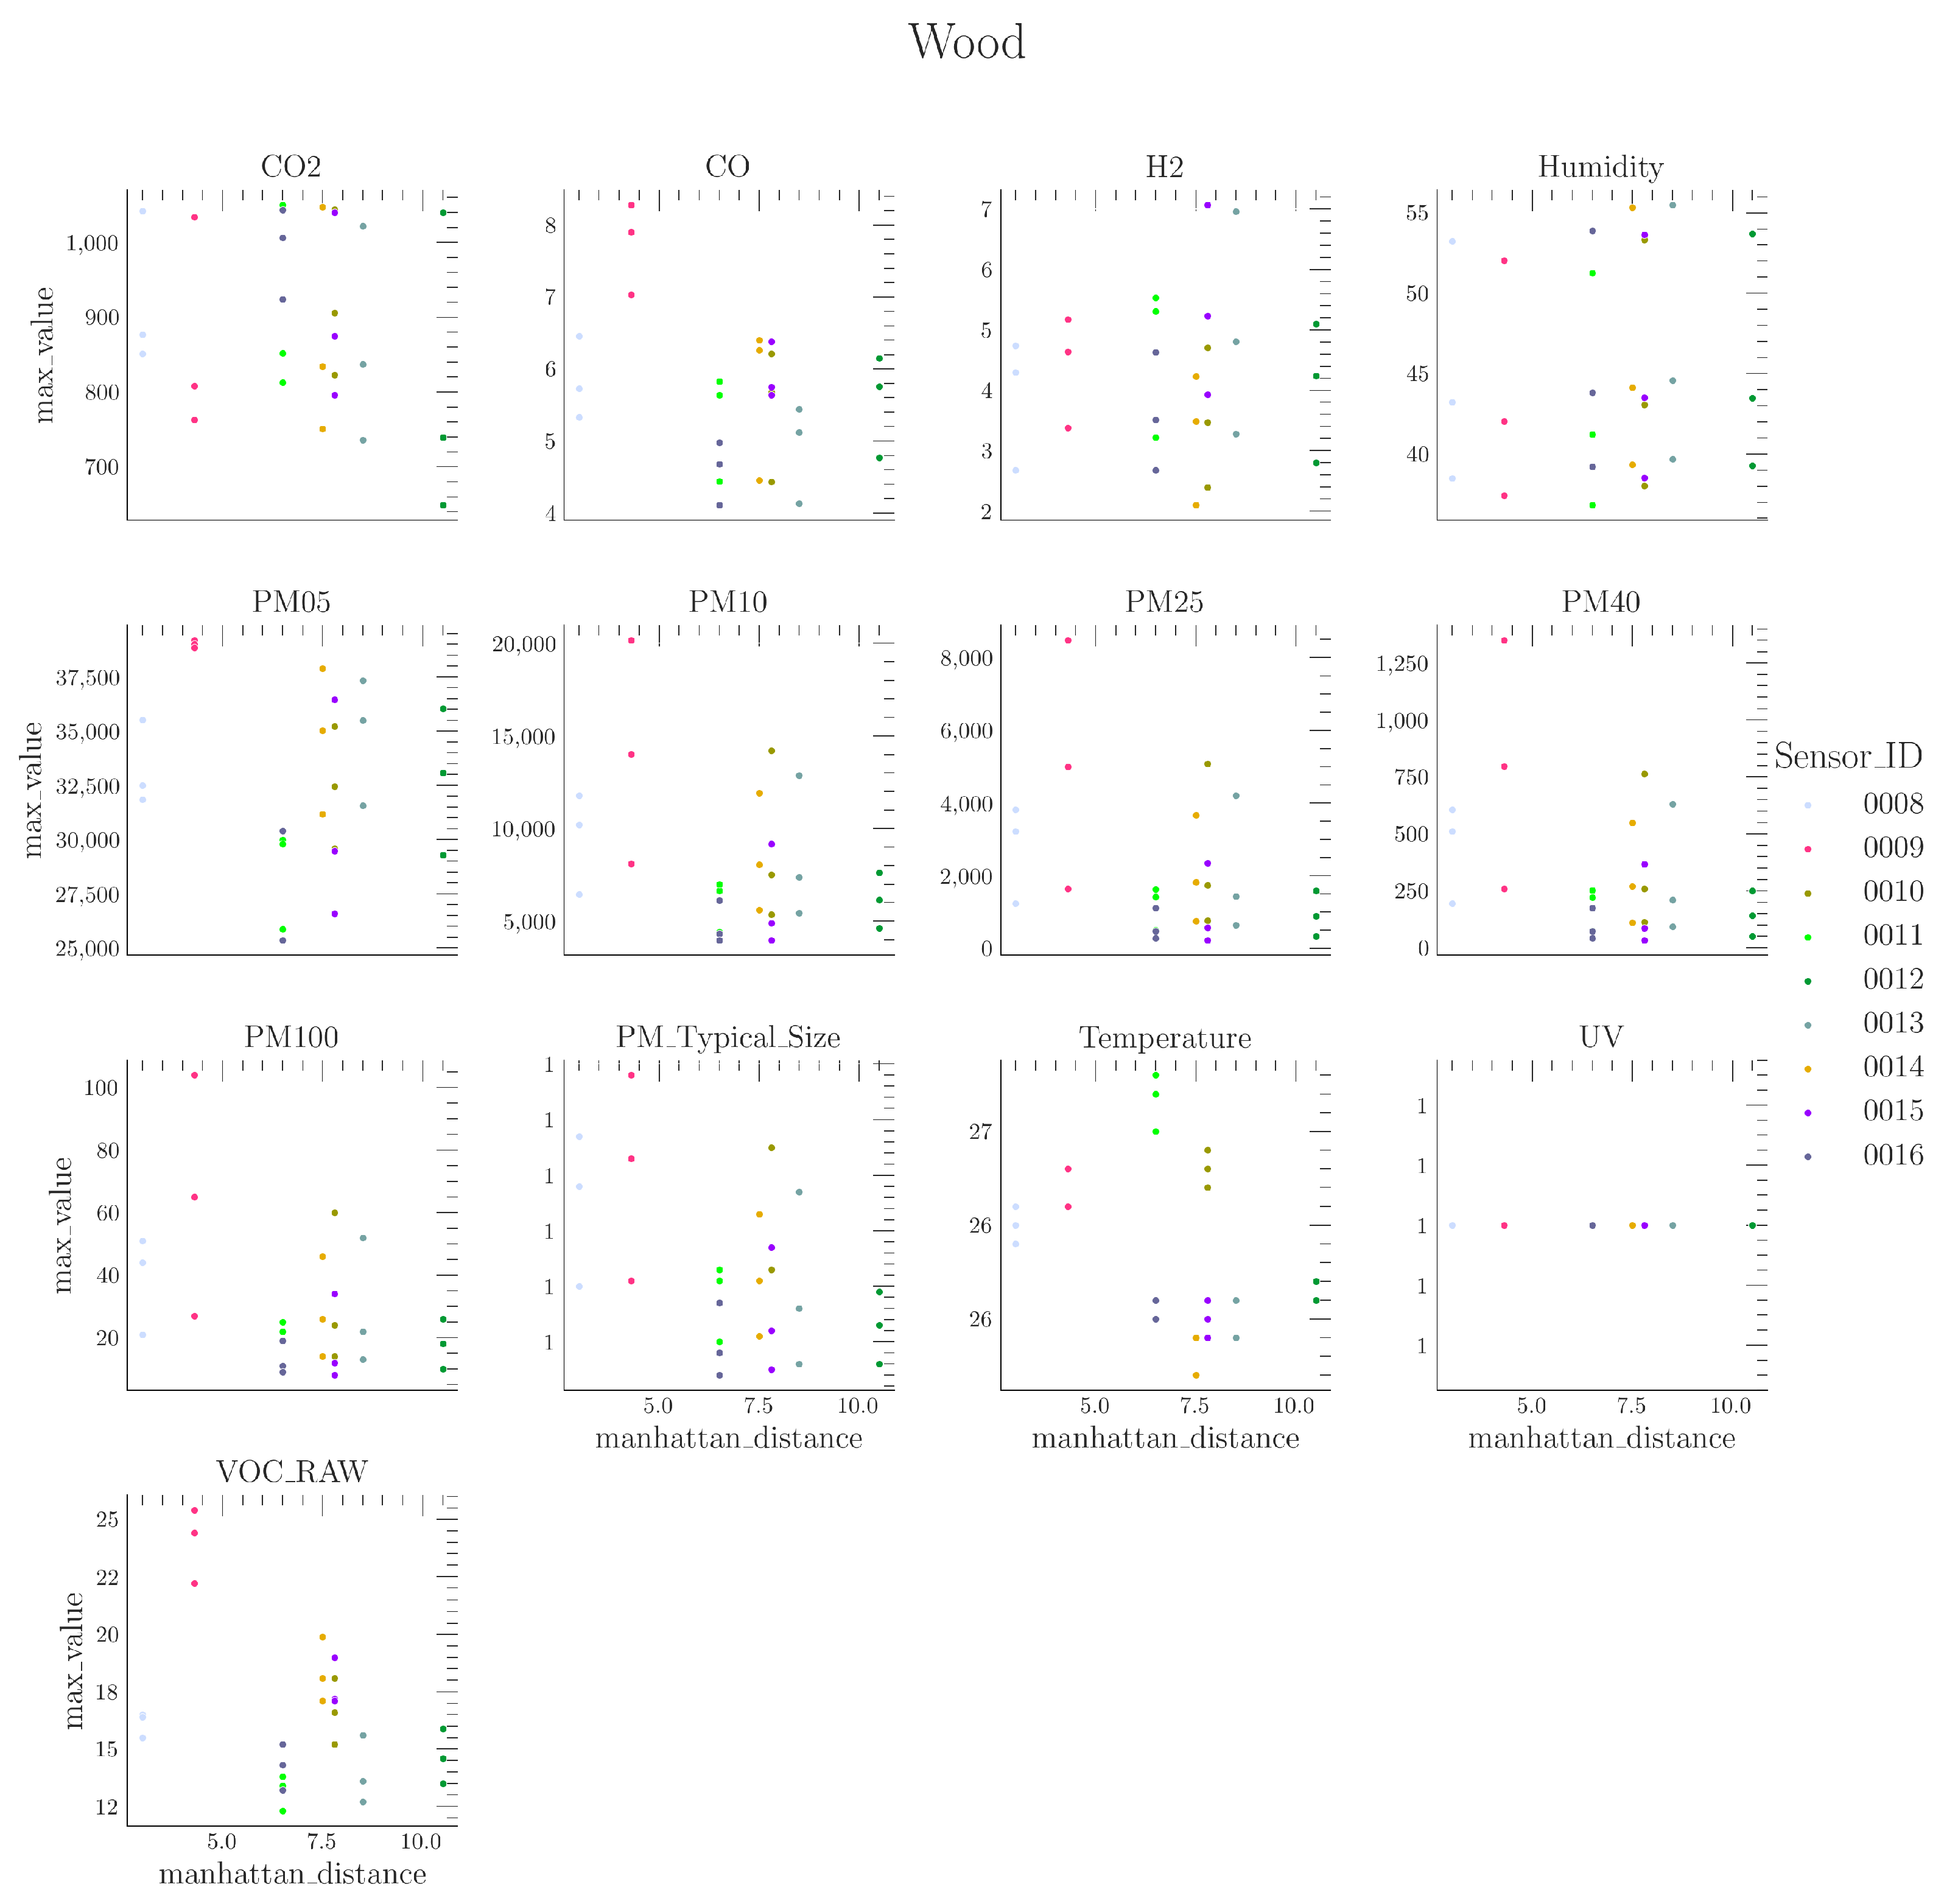
4. Results
4.1. Intensity Dependence
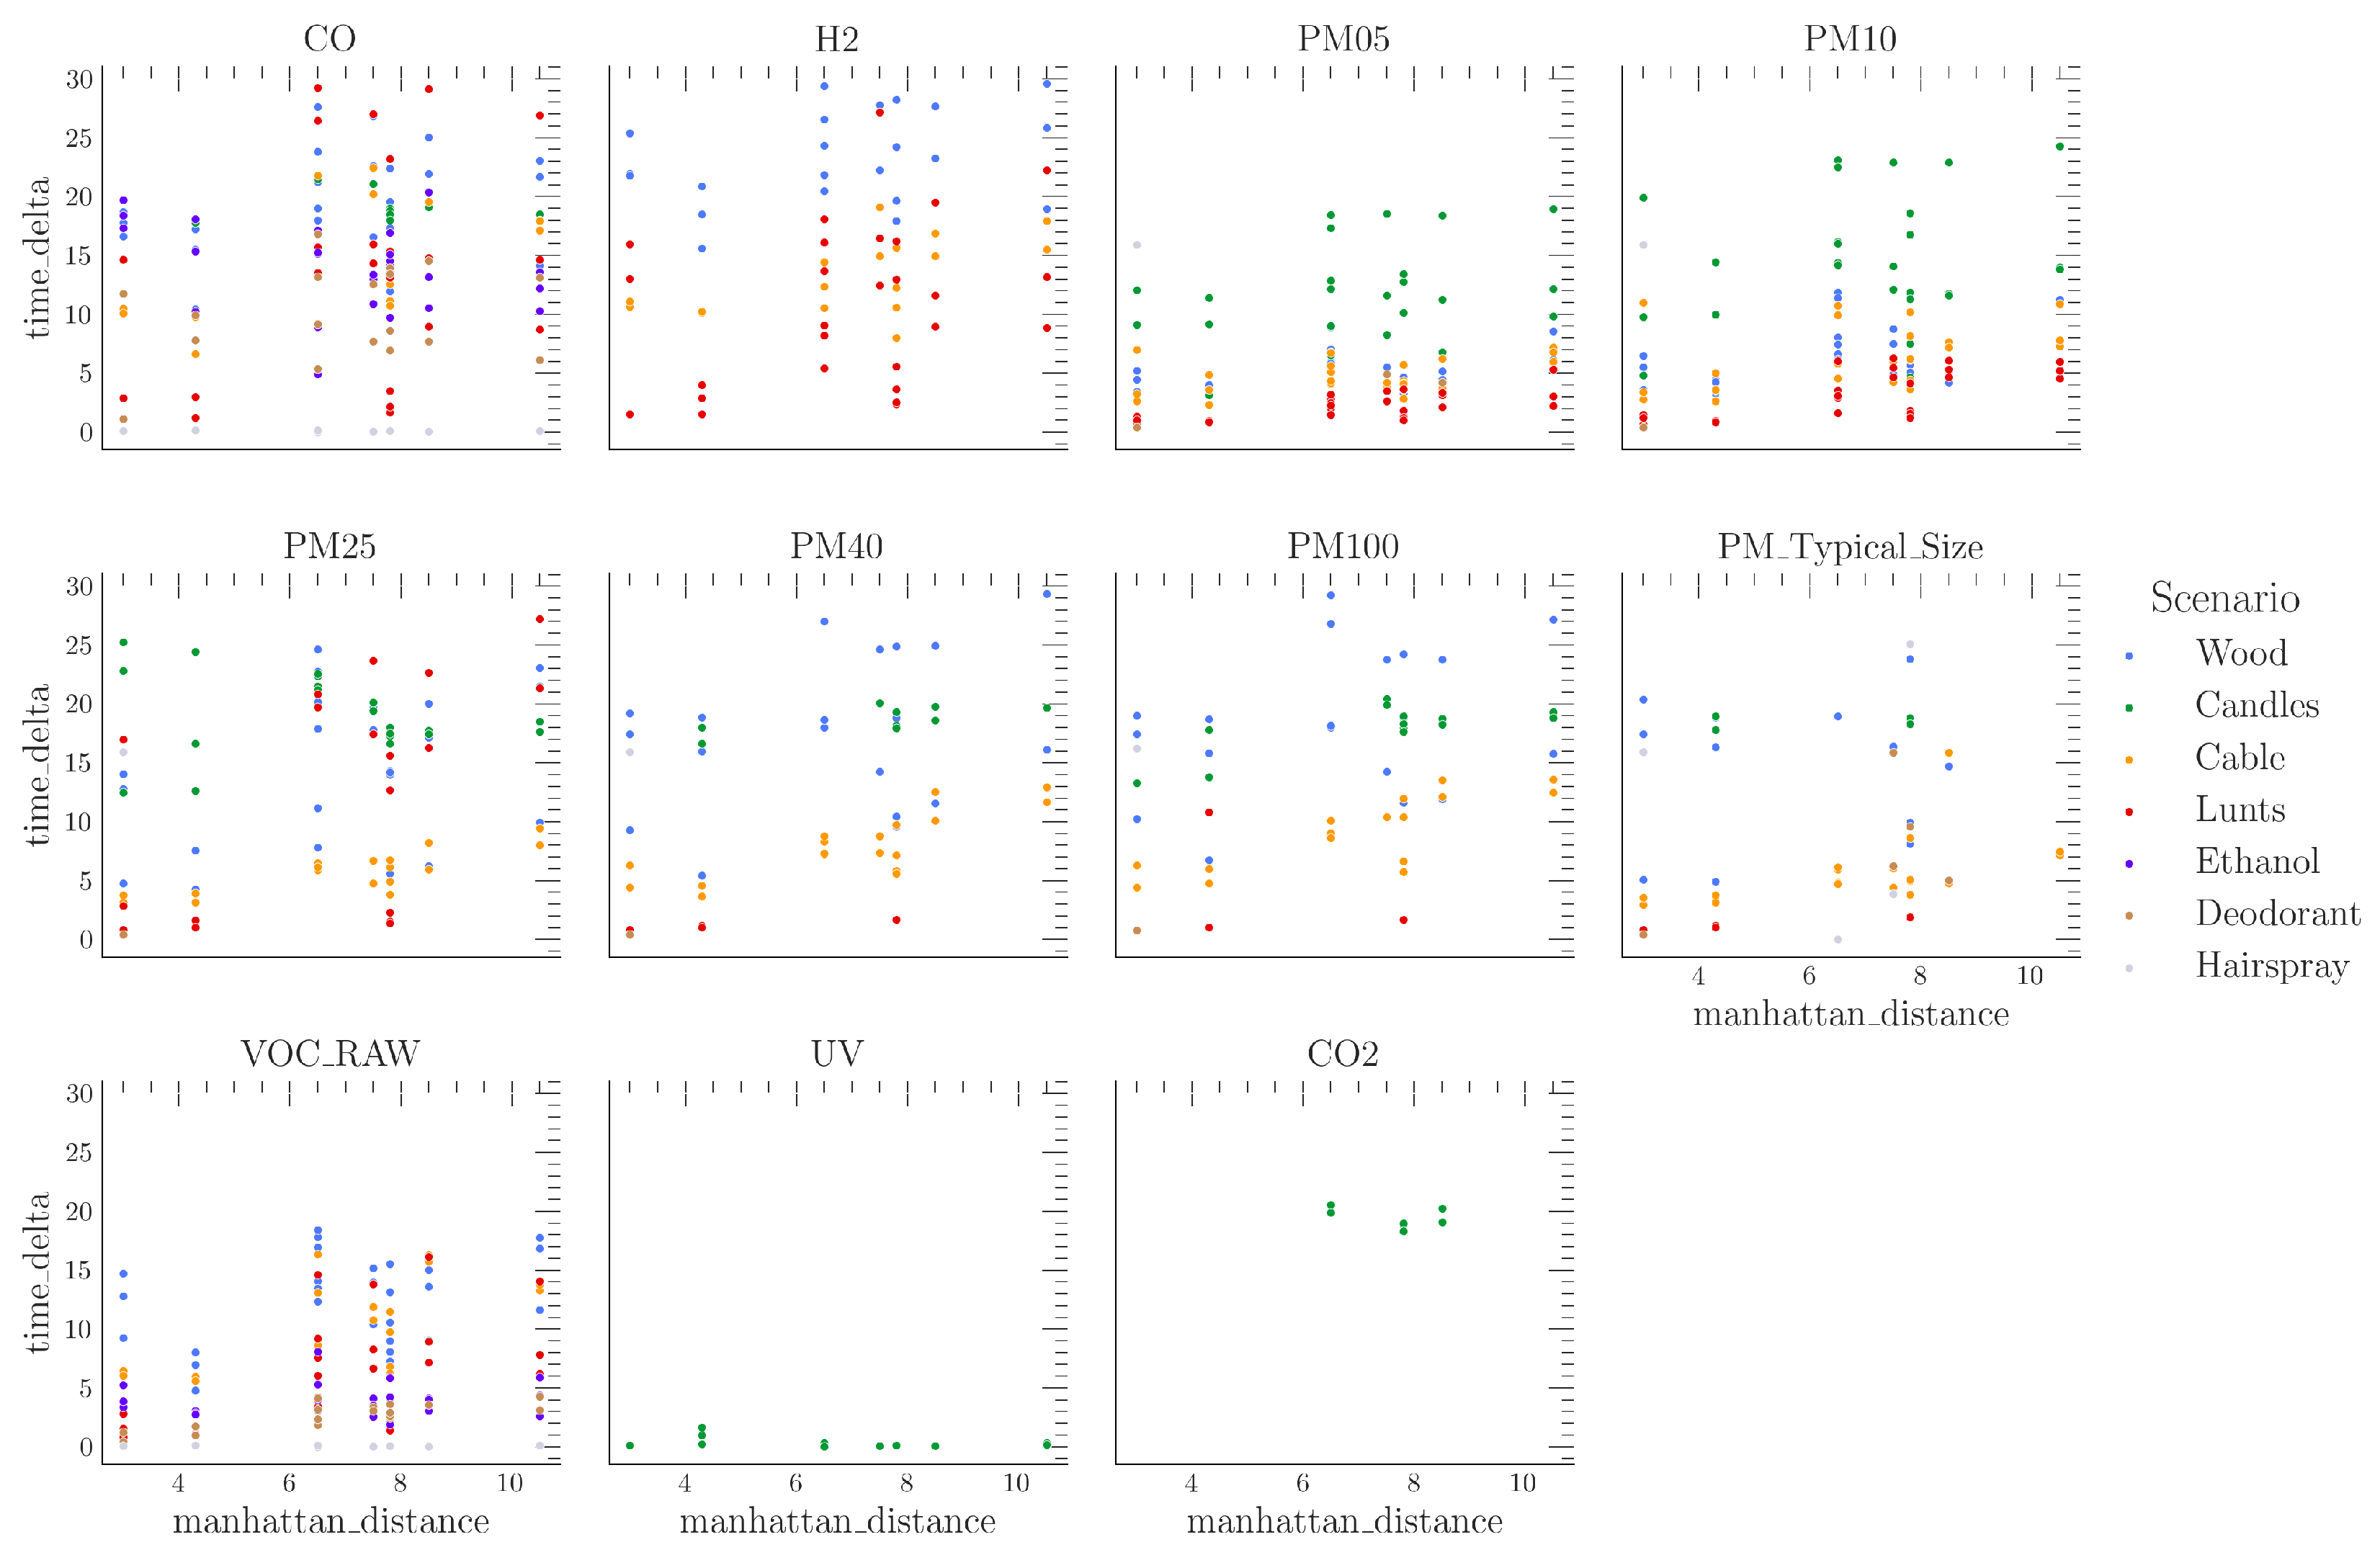
4.2. Time Dependence
5. Discussion
6. Conclusions and Outlook
Author Contributions
Funding
Institutional Review Board Statement
Informed Consent Statement
Data Availability Statement
Conflicts of Interest
Appendix A. Dataset Description

| Column | Description | Format | Unit |
|---|---|---|---|
| Date | Index column | DatetimeIndex | ‘YYYY-MM-DD hh:mm:ss’ |
| Sensor_ID | Unique sensor ID | string | [-] |
| CO2_Room | Concentration of carbon dioxide | float64 | ppm |
| CO_Room | Concentration of carbon monoxide | float64 | ppm |
| H2_Room | Concentration of hydrogen | float64 | ppm |
| Humidity_Room | float64 | % | |
| PM05_Room | Particles < 0.5 µm | float64 | cm |
| PM10_Room | Particles < 1.5 µm | float64 | cm |
| PM25_Room | Particles < 2.5 µm | float64 | cm |
| PM40_Room | Particles < 4.0 µm | float64 | cm |
| PM100_Room | Particles < 10.0 µm | float64 | cm |
| PM_Room_Typical_Size | Weighted mean of diameter | float64 | µm |
| Temperature_Room | Air temperature | float64 | °C |
| UV_Room | UV photon counts | float64 | # |
| VOC_Room_RAW | Volatile organic compounds (raw electrical data from sensor) | float64 | A.U. |
| scenario_label | experiment specific label | string | [-] |
| anomaly_label | distinguishes between “Anomaly” and “Normal” | string | [-] |
| ternary_label | distinguishes between “Nuisance”, “Fire”, and “Background” | string | [-] |
References
- Tsujita, W.; Yoshino, A.; Ishida, H.; Moriizumi, T. Gas sensor network for air-pollution monitoring. Sens. Actuators B Chem. 2005, 110, 304–311. [Google Scholar] [CrossRef]
- Fireteanu, V.V.; Tudor-Serban, A.; Sacala, I.S.; Moisescu, M.A. Avalanche Prediction Based on Snow Level Monitoring Using Wireless Sensor Networks. Appl. Mech. Mater. 2014, 656, 369–377. [Google Scholar] [CrossRef]
- Mesquita, E.; Arêde, A.; Pinto, N.; Antunes, P.; Varum, H. Long-term monitoring of a damaged historic structure using a wireless sensor network. Eng. Struct. 2018, 161, 108–117. [Google Scholar] [CrossRef]
- Dinh, T.L.; Hu, W.; Sikka, P.; Corke, P.; Overs, L.; Brosnan, S. Design and Deployment of a Remote Robust Sensor Network: Experiences from an Outdoor Water Quality Monitoring Network. In Proceedings of the 32nd IEEE Conference on Local Computer Networks (LCN 2007), Dublin, Ireland, 15–18 October 2007; pp. 799–806, ISSN 0742-1303. [Google Scholar] [CrossRef]
- Wu, L.; Chen, L.; Hao, X. Multi-Sensor Data Fusion Algorithm for Indoor Fire Early Warning Based on BP Neural Network. Information 2021, 12, 59. [Google Scholar] [CrossRef]
- Rachman, F.Z.; Hendrantoro, G.; Wirawan. A Fire Detection System Using Multi-Sensor Networks Based on Fuzzy Logic in Indoor Scenarios. In Proceedings of the 2020 8th International Conference on Information and Communication Technology (ICoICT), Yogyakarta, Indonesia, 24–26 June 2020; pp. 1–6. [Google Scholar] [CrossRef]
- Liang, Y.H.; Tian, W.M. Multi-sensor Fusion Approach for Fire Alarm Using BP Neural Network. In Proceedings of the 2016 International Conference on Intelligent Networking and Collaborative Systems (INCoS), Ostrava, Czech Republic, 7–9 September 2016; pp. 99–102. [Google Scholar] [CrossRef]
- Jana, S.; Shome, S.K. Hybrid Ensemble Based Machine Learning for Smart Building Fire Detection Using Multi Modal Sensor Data. Fire Technol. 2022, 59, 473–496. [Google Scholar] [CrossRef]
- Yu, M.; Yuan, H.; Li, K.; Wang, J. Research on multi-detector real-time fire alarm technology based on signal similarity. Fire Saf. J. 2022, 136, 103724. [Google Scholar] [CrossRef]
- Milke, J.A.; Mcavoy, T.J. Analysis of Fire And Non-fire Signatures For Discriminating Fire Detection. Fire Saf. Sci. 1997, 5, 819–828. [Google Scholar] [CrossRef]
- Solórzano, A.; Eichmann, J.; Fernández, L.; Ziems, B.; Jiménez-Soto, J.M.; Marco, S.; Fonollosa, J. Early fire detection based on gas sensor arrays: Multivariate calibration and validation. Sens. Actuators B Chem. 2022, 352, 130961. [Google Scholar] [CrossRef]
- Andrew, A.M.; Shakaff, A.; Zakaria, A.; Gunasagaran, R.; Kanagaraj, E.; Saad, S.M. Early Stage Fire Source Classification in Building using Artificial Intelligence. In Proceedings of the 2018 IEEE Conference on Systems, Process and Control (ICSPC), Melaka, Malaysia, 14–15 December 2018; pp. 165–169. [Google Scholar] [CrossRef]
- Bukowski, R.W.; Peacock, R.D.; Averill, J.D.; Cleary, T.G.; Bryner, N.P.; Reneke, P.A. Performance of Home Smoke Alarms, Analysis of the Response of Several Available Technologies in Residential Fire Settings; Technical Note 1455-1 (December 2007 Revision); NIST: Gaithersburg, MD, USA, 2003; pp. 5–8. [Google Scholar]
- Nazir, A.; Mosleh, H.; Takruri, M.; Jallad, A.H.; Alhebsi, H. Early Fire Detection: A New Indoor Laboratory Dataset and Data Distribution Analysis. Fire 2022, 5, 11. [Google Scholar] [CrossRef]
- Gottuk, D.T.; Peatross, M.J.; Roby, R.J.; Beyler, C.L. Advanced fire detection using multi-signature alarm algorithms. Fire Saf. J. 2002, 37, 381–394. [Google Scholar] [CrossRef]
- Nakıp, M.; Güzeliş, C. Multi-Sensor Fire Detector based on Trend Predictive Neural Network. In Proceedings of the 2019 11th International Conference on Electrical and Electronics Engineering (ELECO), Bursa, Turkey, 28–30 November 2019; pp. 600–604. [Google Scholar] [CrossRef]
- Chen, S.J.; Hovde, D.C.; Peterson, K.A.; Marshall, A.W. Fire detection using smoke and gas sensors. Fire Saf. J. 2007, 42, 507–515. [Google Scholar] [CrossRef]
- Gutmacher, D.; Hoefer, U.; Wöllenstein, J. Gas sensor technologies for fire detection. Sens. Actuators B Chem. 2012, 175, 40–45. [Google Scholar] [CrossRef]
- Guo, S.; Yang, R.; Zhang, H.; Zhang, X. New Inverse Model for Detecting Fire-Source Location and Intensity. J. Thermophys. Heat Transf. 2010, 24, 745–755. [Google Scholar] [CrossRef]
- Kou, L.; Wang, X.; Guo, X.; Zhu, J.; Zhang, H. Deep learning based inverse model for building fire source location and intensity estimation. Fire Saf. J. 2021, 121, 103310. [Google Scholar] [CrossRef]
- Fonollosa, J.; Solórzano, A.; Marco, S. Chemical Sensor Systems and Associated Algorithms for Fire Detection: A Review. Sensors 2018, 18, 553. [Google Scholar] [CrossRef] [PubMed]
- Alessandri, A.; Bagnerini, P.; Gaggero, M.; Mantelli, L. Parameter estimation of fire propagation models using level set methods. Appl. Math. Model. 2021, 92, 731–747. [Google Scholar] [CrossRef]
- Krüger, S.; Despinasse, M.C.; Raspe, T.; Nörthemann, K.; Moritz, W. Early fire detection: Are hydrogen sensors able to detect pyrolysis of house hold materials? Fire Saf. J. 2017, 91, 1059–1067. [Google Scholar] [CrossRef]
- Hayashi, Y.; Akimoto, Y.; Hiramatsu, N.; Masunishi, K.; Saito, T.; Yamazaki, H.; Nakamura, N.; Kojima, A. Smoldering Fire Detection Using Low-Power Capacitive MEMS Hydrogen Sensor for Future Fire Alarm. In Proceedings of the 2021 21st International Conference on Solid-State Sensors, Actuators and Microsystems (Transducers), Orlando, FL, USA, 20–24 June 2021; pp. 267–270, ISSN 2167-0021. [Google Scholar] [CrossRef]
- Gutmacher, D.; Foelmli, C.; Vollenweider, W.; Hoefer, U.; Wöllenstein, J. Comparison of gas sensor technologies for fire gas detection. Procedia Eng. 2011, 25, 1121–1124. [Google Scholar] [CrossRef]
- DataSheet-GGS-6530-T_Rev2203. 2023, pp. 1–2. Available online: https://www.umweltsensortechnik.de/fileadmin/assets/downloads/gassensoren/single/DataSheet-GGS-6530-T_Rev2203.pdf (accessed on 17 July 2023).
- Carbon-Monoxide-Gas-Sensor_Datasheet. 2023. Available online: https://www.membrapor.ch/sheet/Carbon-Monoxide-Gas-Sensor-CO-MF-1000.pdf (accessed on 17 July 2023).
- Mostafa, E.; Nannen, C.; Henseler, J.; Diekmann, B.; Gates, R.; Buescher, W. Physical properties of particulate matter from animal houses—Empirical studies to improve emission modelling. Environ. Sci. Pollut. Res. 2016, 23, 12253–12263. [Google Scholar] [CrossRef]
- Bin, H.; Yang, Y.; Cai, L.; Yuan, Z.; Roszak, S.; Yang, L. Experimental study on particles agglomeration by chemical and turbulent agglomeration before electrostatic precipitators. Powder Technol. 2018, 335, 186–194. [Google Scholar] [CrossRef]
- Evtyugina, M.; Alves, C.; Calvo, A.; Nunes, T.; Tarelho, L.; Duarte, M.; Prozil, S.O.; Evtuguin, D.V.; Pio, C. VOC emissions from residential combustion of Southern and mid-European woods. Atmos. Environ. 2014, 83, 90–98. [Google Scholar] [CrossRef]
- Kim Oanh, N.T.; Ly, B.T.; Tipayarom, D.; Manandhar, B.R.; Prapat, P.; Simpson, C.D.; Sally Liu, L.J. Characterization of particulate matter emission from open burning of rice straw. Atmos. Environ. 2011, 45, 493–502. [Google Scholar] [CrossRef]
- Cofer, W.R., III; Winstead, E.L.; Stocks, B.J.; Goldammer, J.G.; Cahoon, D.R. Crown fire emissions of CO2, CO, H2, CH4, and TNMHC from a dense Jack pine boreal forest fire. Geophys. Res. Lett. 1998, 25, 3919–3922. [Google Scholar] [CrossRef]
- Kohl, D.; Kelleter, J.; Petig, H. Detection of Fires by Gas Sensors. Sens. Update 2001, 9, 161–223. [Google Scholar] [CrossRef]
- Kropotova, S.S.; Kuznetsov, G.V.; Strizhak, P.A. Identifying products of pyrolysis and combustion of materials at incipient stages of fires. Fire Saf. J. 2022, 132, 103643. [Google Scholar] [CrossRef]
- Vasiliev, A.A.; Grigoriev, G.Y.; Lagutin, A.S.; Nabiev, S.S.; Pisliakov, A.V.; Samotaev, N.N.; Sokolov, A.V. Contemporary technologies of early detection of fire in space vehicles. Acta Astronaut. 2017, 135, 76–82. [Google Scholar] [CrossRef]


| Sensor | Manufacturer | Measurand | Unit |
|---|---|---|---|
| SPS30 | Sensirion | PM | cm |
| SVM40 | Sensirion | VOC | A.U. |
| CO/MF-1000 | MEMBRAPOR | CO | ppm |
| UST6xxx | UST | H | ppm |
| SCD40 | Sensirion | CO | ppm |
| UVTRON | HAMAMATSU | UV photon | # |
| SGP40 | Sensirion | Temperature, relative air humidity | °C, % |
| Sensor_ID | x | y | h | Euclidean | Manhattan |
|---|---|---|---|---|---|
| (m) | (m) | (m) | (m) | (m) | |
| 0008 | −0.5 | 0.0 | 2.5 | 2.5 | 3.0 |
| 0009 | −0.5 | 0.0 | 3.8 | 3.8 | 4.3 |
| 0010 | −1.5 | 2.5 | 3.8 | 4.8 | 7.8 |
| 0011 | −1.5 | 2.5 | 2.5 | 3.8 | 6.5 |
| 0012 | −3.0 | 4.0 | 3.5 | 6.1 | 10.5 |
| 0013 | 0.0 | 5.0 | 3.5 | 6.1 | 8.5 |
| 0014 | 0.0 | 5.0 | 2.5 | 5.6 | 7.5 |
| 0015 | 1.0 | −3.0 | 3.8 | 4.9 | 7.8 |
| 0016 | 1.0 | −3.0 | 2.5 | 4.0 | 6.5 |
| Scenario | Termination Criterion | Number of Experiments |
|---|---|---|
| Wood | Max. Duration of Experiment | 3 |
| Candles | Max. Duration of Experiment | 3 |
| Cable | Max. Duration of Experiment | 3 |
| Lunts | Max. Duration of Experiment | 3 |
| Ethanol | Sample Completely Evaporated | 3 |
| Deodorant | Two Sprays of 15 s | 2 |
| Hairspray | Two Sprays of 15 s | 1 |
| Background | - | - |
| Total: 18 |
| Measurand | Global Threshold | Unit |
|---|---|---|
| CO | 1200 | ppm |
| CO | 2 | ppm |
| H | 1.5 | ppm |
| Humidity | 75 | % |
| PM05 | 100 | cm |
| PM10 | 75 | cm |
| PM25 | 75 | cm |
| PM40 | 75 | cm |
| PM100 | 10 | cm |
| PM_Typical_Size | 0.55 | m |
| Temperature | 30 | °C |
| UV | 3 | # |
| VOC_RAW | 2.5 | A.U. |
Disclaimer/Publisher’s Note: The statements, opinions and data contained in all publications are solely those of the individual author(s) and contributor(s) and not of MDPI and/or the editor(s). MDPI and/or the editor(s) disclaim responsibility for any injury to people or property resulting from any ideas, methods, instructions or products referred to in the content. |
© 2023 by the authors. Licensee MDPI, Basel, Switzerland. This article is an open access article distributed under the terms and conditions of the Creative Commons Attribution (CC BY) license (https://creativecommons.org/licenses/by/4.0/).
Share and Cite
Vorwerk, P.; Kelleter, J.; Müller, S.; Krause, U. Distance-Based Analysis of Early Fire Indicators on a New Indoor Laboratory Dataset with Distributed Multi-Sensor Nodes. Fire 2023, 6, 323. https://doi.org/10.3390/fire6080323
Vorwerk P, Kelleter J, Müller S, Krause U. Distance-Based Analysis of Early Fire Indicators on a New Indoor Laboratory Dataset with Distributed Multi-Sensor Nodes. Fire. 2023; 6(8):323. https://doi.org/10.3390/fire6080323
Chicago/Turabian StyleVorwerk, Pascal, Jörg Kelleter, Steffen Müller, and Ulrich Krause. 2023. "Distance-Based Analysis of Early Fire Indicators on a New Indoor Laboratory Dataset with Distributed Multi-Sensor Nodes" Fire 6, no. 8: 323. https://doi.org/10.3390/fire6080323
APA StyleVorwerk, P., Kelleter, J., Müller, S., & Krause, U. (2023). Distance-Based Analysis of Early Fire Indicators on a New Indoor Laboratory Dataset with Distributed Multi-Sensor Nodes. Fire, 6(8), 323. https://doi.org/10.3390/fire6080323