The Influence of Socioeconomic Factors on Human Wildfire Ignitions in the Pacific Northwest, USA
Abstract
1. Introduction
| Study | Area | Dependent Variable | Socioeconomic Variables | Biophysical Variables | Analysis |
|---|---|---|---|---|---|
| [22] | U.S.: MN, WI, MI | All ignitions (most human-caused) | Seasonal housing units (−), Road density (+), Rail density (−), Ownership: state, Tribal, national forest (−), Population density (+), Distance to city (+), Distance to non-forest (−), Owner occupied units (−) | Mean march precipitation (+), Mean august max temperature (−), Land cover (sig. categorical var w/no sign), Lake density (−), Mean June precipitation (~) | Generalized linear regression (GLM) (negative binomial, Poisson regression, or logistic) |
| [23] | Spain | All ignitions (most human-caused) | Pop density (+), Rural exodus (+), Unemployment (+), Highway density (+), Rural road density(+), Conventional road density (+), WUI area (+), Dense built area (+) | Land cover type (all significant, relationships vary), Elevation (+), Slope range (−), Mean Temperature (+), Mean Precipitation (−) | GLM, negative binomial |
| [24] | Spain | All ignitions | Population over 64 years (+), Population density (−), Income per person (−), Ratio of men to women (+), Active population: ratio pop age 40–64 to age 15–39 (−), Livestock (~), Parcel value (−), Town debt (~), GDP (~), Foreign population (+) | N/A | Multiple linear regression |
| [25] | Argentina | All ignitions in the WUI | Population density (+), Unemployment (+), Unoccupied teens (+), Educational attainment (−), Age (+), Poverty (~) | Slope (−), Aspect (+) | Principal component analysis and quantile regression |
| [26] | U.S.: MS | Human ignitions (major causes modeled separately) | Distance to road, distance to railroad, distance to city Population density, Income, Poverty, Unemployment (sig. vars reported, relationships varied by ignition causes) | Spring, Fall/Winter | Logistic Regression |
| [27] | China | All ignitions (95% human caused) | Distance to nearest road (+), Distance to nearest river (+), Distance to nearest settlement (+), Population density (+), Per capita GDP (+) | Elevation (−), Slope (−), Aspect (+), Daily max temperature (+), Daily min temperature (−), Daily max wind (−), Daily precipitation (−), Sunshine hours (+), Relative Humidity (−) | Logistic regression |
| [28] | Italy | All fire occurrence | Road length in total municipal area (+), Average per-capita disposable income (−), Commuting workers (+), Unemployment (+), Built up area (−), Non-native resident (−), Tourism facilities (+), Natural protected land in total municipal area (+), Public-owned land in total agricultural area (−), Inequality in personal income (−) | Coefficient of variation in landscape patch size (+), Pielou’s evenness index of landscape diversification (+) | OLS, interval regression, quantile regression, GLM (Gaussian, inverse, negative binomial, Poisson distributions) |
| [29] | Spain | All ignitions | Rural exodus (+), Density of human, settlements (+), Density of roads (+), Density of agricultural machinery (+), Rural aging: owners of agrarian holdings >55 years (+), Urban/forest interface density (+) | Mean annual precipitation (+), Agricultural land fragmentation (+), Mean elevation (−), Percentage of wildland area (+) | Linear regression (OLS), logistic regression (both geographically weighted) |
| [30] | U.S.: FL | All ignitions | Housing density (−), Unemployment (−), Poverty (−), Population (+), Police (−), Past prescribed burns (−) | Sea surface temperature anomalies El Nino (−), North Atlantic Oscillation (+) | Fixed effects, Poisson panel model |
| [31] | U.S.: WA | Human/ lightning ignitions modeled separately | Paved road density (+), Gravel road density (+), Distance to WUI (−) | Slope (−), Elevation (−), Brush fuel model (−) | Logistic regression |
| [32] | Portugal, Spain, France, Italy, Greece | All ignitions | Unemployment (−), Livestock density (+), Density of local roads (+), Density of highways (+), Low urban density area (+), Average pop density (−), WUI land cover (−) | Pre fire season precipitation (+), During fire season precipitation (−), soil moisture (+), Max temperature (−), Aspect (+), Relative humidity (−), Max temp (−) | Multiple linear regression and Random Forest model |
| [33] | Chile | All fire occurrence (most human-caused) | Pop density (+), Indigenous population (+), Unemployed (+), Road density (+) | Agriculture land (+), Exotic plantation land (+), Native forests (+) | Generalized additive models with a Poisson error structure |
| [34] | U.S.: FL | Arson ignitions | Police per capita (−), Poverty rate (+), Unemployment (~), Retail wage (−), Population (−) | Previous years wildfire extent (−), Previous years fuel treatments (−) | Fixed-effects panel, Poisson model (among other models) |
| [35] | U.S.: CA | All ignitions (most human caused) | Distance to WUI (−), Level of WUI (+), Distance to roads (−), Distance to trails (−), Level of Development (+) | January temperature (−), Elevation (−), Slope (−), Southwestness (~), Vegetation type (results vary by cover type) | Logistic regression (fire ignitions) Poisson regression (fire frequency) |
| [36] | Australia | All ignitions | Distance to primary road (−), Distance to secondary road (−), Distance to railway (−), Distance to WUI (−) | Land cover (Forest, grassland, savannas, shrublands) (−), Permanent wetlands (~), Vegetation Index (+), Elevation (+), Northwestness (~) | Binary multiple logistic regression |
2. Materials and Methods
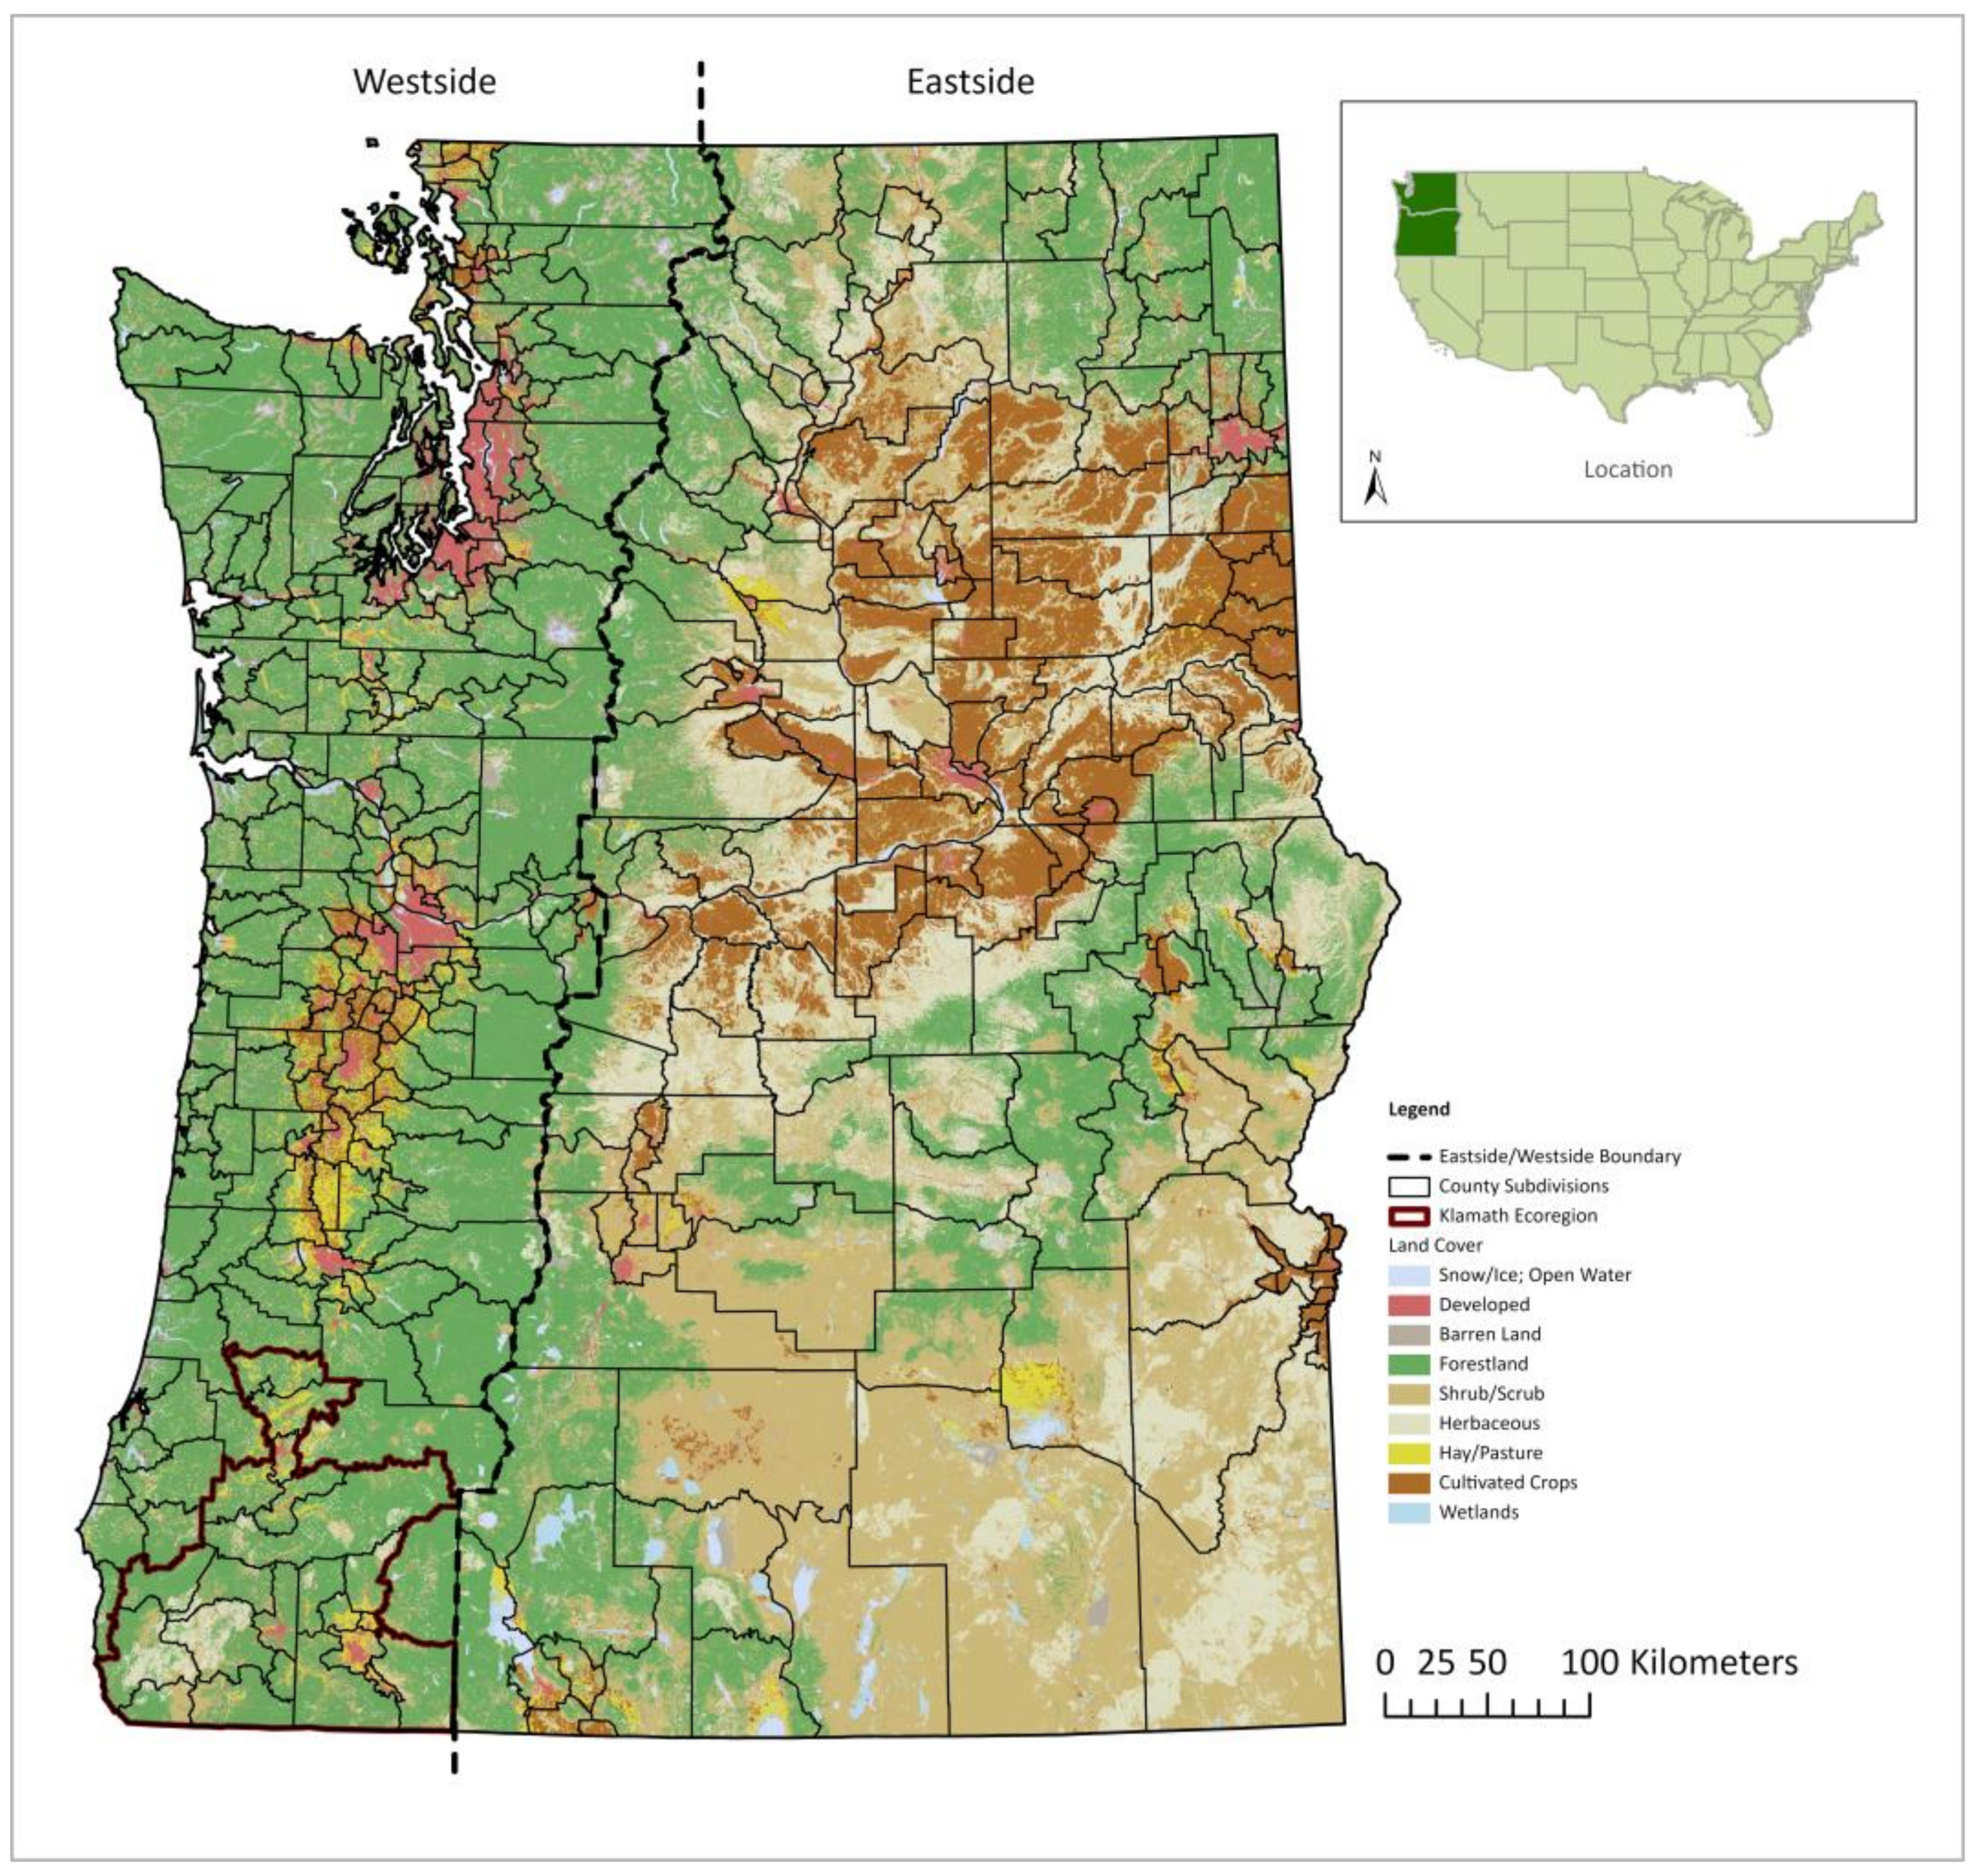
2.1. Study Area
2.2. Geographic Unit of Analysis
2.3. Data Collection
| Variable | Description | Hypothesized Relationship to Human Ignitions | Data |
|---|---|---|---|
| Poverty Rate | Population below the poverty level | Human ignitions have been linked to areas with difficult economic conditions including high poverty in other studies [34]. Greater wealth also provides more opportunity and access to fire prevention resources [46,47]. Income is also linked with more leisure time which can increase human activities that carry risk of fire (i.e., recreation) [48]. | [44] |
| Near Poor Rate | Population below 185% of the poverty level | ||
| Household Income | Median household income in previous year | ||
| Per Capita Income | Per capita income in previous year | ||
| Home Value | Median home value in previous year | Fire occurrence may decrease in areas with higher value homes as homeowners have more resources for fire prevention and fire wise activities (i.e., thinning and pruning). | [44] |
| Educational Attainment | Population over age 25 with at least a bachelor’s degree | Higher education is correlated with higher income, potentially influencing access to resources. Education may also be linked to awareness of fire risk and valuation of natural resources, overall reducing human-caused fire occurrence. | [44] |
| Unemployment Rate | Population over age 16 and under 65 in labor force and unemployed | Unemployment and labor force participation may be linked with social unrest and higher crime, which may increase arson fires but also may indicate high levels of idleness among members of the population, which could increase the number of human ignitions. | [44] |
| Labor Force Participation Rate | Population over age 16 and under 65 participating in the labor force. | ||
| Seasonal Housing | Vacant housing units that are designated for seasonal, recreational, or occasional use | Second homes are linked with both amenity communities, wildland urban interface areas, and the presence of human activity. Areas with high percentages of second homes may decrease fire occurrence due to the presumed wealth associated with second homeownership and less frequent human activity or it may increase human fires due to the potential links to the wildland urban interface and fuels rich environments. Vacant or abandoned land has been linked to increased wildfire occurrence [24]. | [44] |
| Elder (65+) | Population over 65 years | Age demographics influence patterns of development and land use and may be tied to certain types of human activities that carry a risk of fire (i.e., more youth may be associated with more misuse of fire or accidental fires related to risky behaviors and negligence, whereas more active adults may be associated with recreation activities or equipment use that may lead to accidental fire). | [44] |
| Youth (0–18) | Population under 18 years | ||
| Adults (18–24) | Population between 18–24 years | ||
| Adults (18–39) | Population between 18–39 years | ||
| Adults (40–64) | Population between 40–64 years | ||
| Rural Population | Population in US Census designated rural areas | Population density and urban/rural status can influence fire occurrence through fuel availability, presence of human activity, and through cultural activities associated with rural or urban areas (i.e., open burning of yard debris in rural areas with no organized garbage pick-up). | [44] |
| Rural Housing Units | Housing units in US Census designated rural areas | ||
| Population Density | Population per area of land | ||
| All Road Density | Kilometers of all public and private roads per area of land | Roads represent greater density of human settlements and regional access to forested areas. As in other studies, it is expected that more roads will increase human ignitions [22,31,33]. | [45] |
| Public Road Density | Kilometers of public access roads per area of land | ||
| Klamath Ecoregion | 1 indicates county subdivisions 30% or more contained in the EPA Klamath Mountains Ecoregion | The Klamath Ecoregion is a dummy variable accounting for the substantially different vegetation, climate, and fire regime in the southern portion of the “westside” of the study area. | [49] |
| Annual Precipitation | Mean annual precipitation | Annual and summer precipitation influence the amount of vegetation available for ignition during the fire season. Annual and summer temperatures and precipitation are also related to fuel moisture and thus influence the likelihood of ignition. | [43] |
| Summer Precipitation | Mean June–August precipitation | ||
| Summer Temperature | Mean June–August temperature | ||
| Annual Temperature | Mean annual temperature |
| Western Region (N = 7128) | Eastern Region (N = 4968) | |||||||
|---|---|---|---|---|---|---|---|---|
| Variable | Mean | St. Dev. | Min | Max | Mean | St. Dev. | Min | Max |
| Natural Ignition Density (10,000 km2) | 11.9 | 40.4 | 0.0 | 790.0 | 36.5 | 58.6 | 0.0 | 805.0 |
| Human Ignition Density (10,000 km2) | 91.8 | 137.3 | 0.0 | 1501.0 | 59.6 | 117.3 | 0.0 | 1872.0 |
| All Road Density (km/km2) | 2.3 | 2.0 | 0.2 | 13.0 | 0.5 | 0.8 | 0.0 | 6.8 |
| Public Road Density (km/km2) | 1.8 | 2.1 | 0.1 | 12.8 | 0.6 | 0.9 | 0.0 | 6.7 |
| Rural Housing Units (%) | 62.9 | 36.9 | 0.0 | 100.0 | 78.5 | 32.8 | 0.2 | 100.0 |
| Rural Population (%) | 62.7 | 36.8 | 0.0 | 100.0 | 77.6 | 33.2 | 0.1 | 100.0 |
| Youth (0–18 years) (%) | 23.5 | 4.7 | 0.0 | 41.3 | 25.2 | 5.6 | 0.0 | 44.0 |
| Young Adults (18–24 years) (%) | 11.7 | 3.0 | 0.0 | 32.3 | 12.3 | 4.9 | 0.0 | 50.6 |
| Young Adults2 (18–39 years) (%) | 25.2 | 6.0 | 0.0 | 63.4 | 24.8 | 7.0 | 0.0 | 68.3 |
| Adult (39–64 years) (%) | 35.3 | 5.2 | 0.0 | 55.9 | 34.0 | 6.0 | 0.0 | 55.3 |
| Elder (65+ years) (%) | 16.1 | 6.4 | 0.7 | 100.0 | 16.0 | 5.9 | 0.0 | 67.5 |
| Seasonal Housing (%) | 7.4 | 12.2 | 0.0 | 91.3 | 10.3 | 13.4 | 0.0 | 83.5 |
| Educational Attainment (%) | 21.0 | 10.4 | 0.0 | 70.5 | 18.4 | 9.0 | 0.0 | 85.7 |
| Unemployment (%) | 8.0 | 3.5 | 0.0 | 34.8 | 8.7 | 4.5 | 0.0 | 44.8 |
| Labor Force Participation (%) | 59.6 | 8.2 | 0.0 | 85.6 | 58.8 | 8.2 | 0.0 | 89.6 |
| Household Income ($) | 47,459.9 | 16,150.7 | 0.0 | 197,152.0 | 39,783.5 | 11,775.7 | 0.0 | 97,639.0 |
| Per Capita Income ($) | 23,159.0 | 8099.4 | 0.0 | 118,166.0 | 19,496.5 | 6431.8 | 0.0 | 68,229.0 |
| Poverty (%) | 12.3 | 5.2 | 0.0 | 44.4 | 15.5 | 7.1 | 0.0 | 53.7 |
| Near Poor (%) | 28.5 | 9.2 | 0.0 | 63.3 | 35.8 | 10.8 | 0.0 | 72.8 |
| Home Value ($) | 184,573.6 | 83,362.0 | 36,060.0 | 676,400.0 | 130,490.0 | 62,801.6 | 0.0 | 538,500.0 |
| Population Density (km2) | 132.4 | 352.2 | 0.0 | 4621.2 | 26.9 | 77.6 | 0.0 | 696.2 |
| Summer Temperature (°C) | 17.0 | 1.6 | 10.4 | 23.4 | 18.6 | 2.4 | 9.3 | 24.7 |
| Annual Temperature (°C) | 10.4 | 1.4 | 4.1 | 14.1 | 8.8 | 1.8 | 1.6 | 13.5 |
| Summer Precipitation (mm) | 103.5 | 65.1 | 1.5 | 550.4 | 54.1 | 39.1 | 0.0 | 326.9 |
| Annual Precipitation (mm) | 1641.5 | 738.1 | 283.5 | 5268.5 | 470.3 | 265.2 | 85.1 | 2008.2 |
2.4. Data Analysis
3. Results
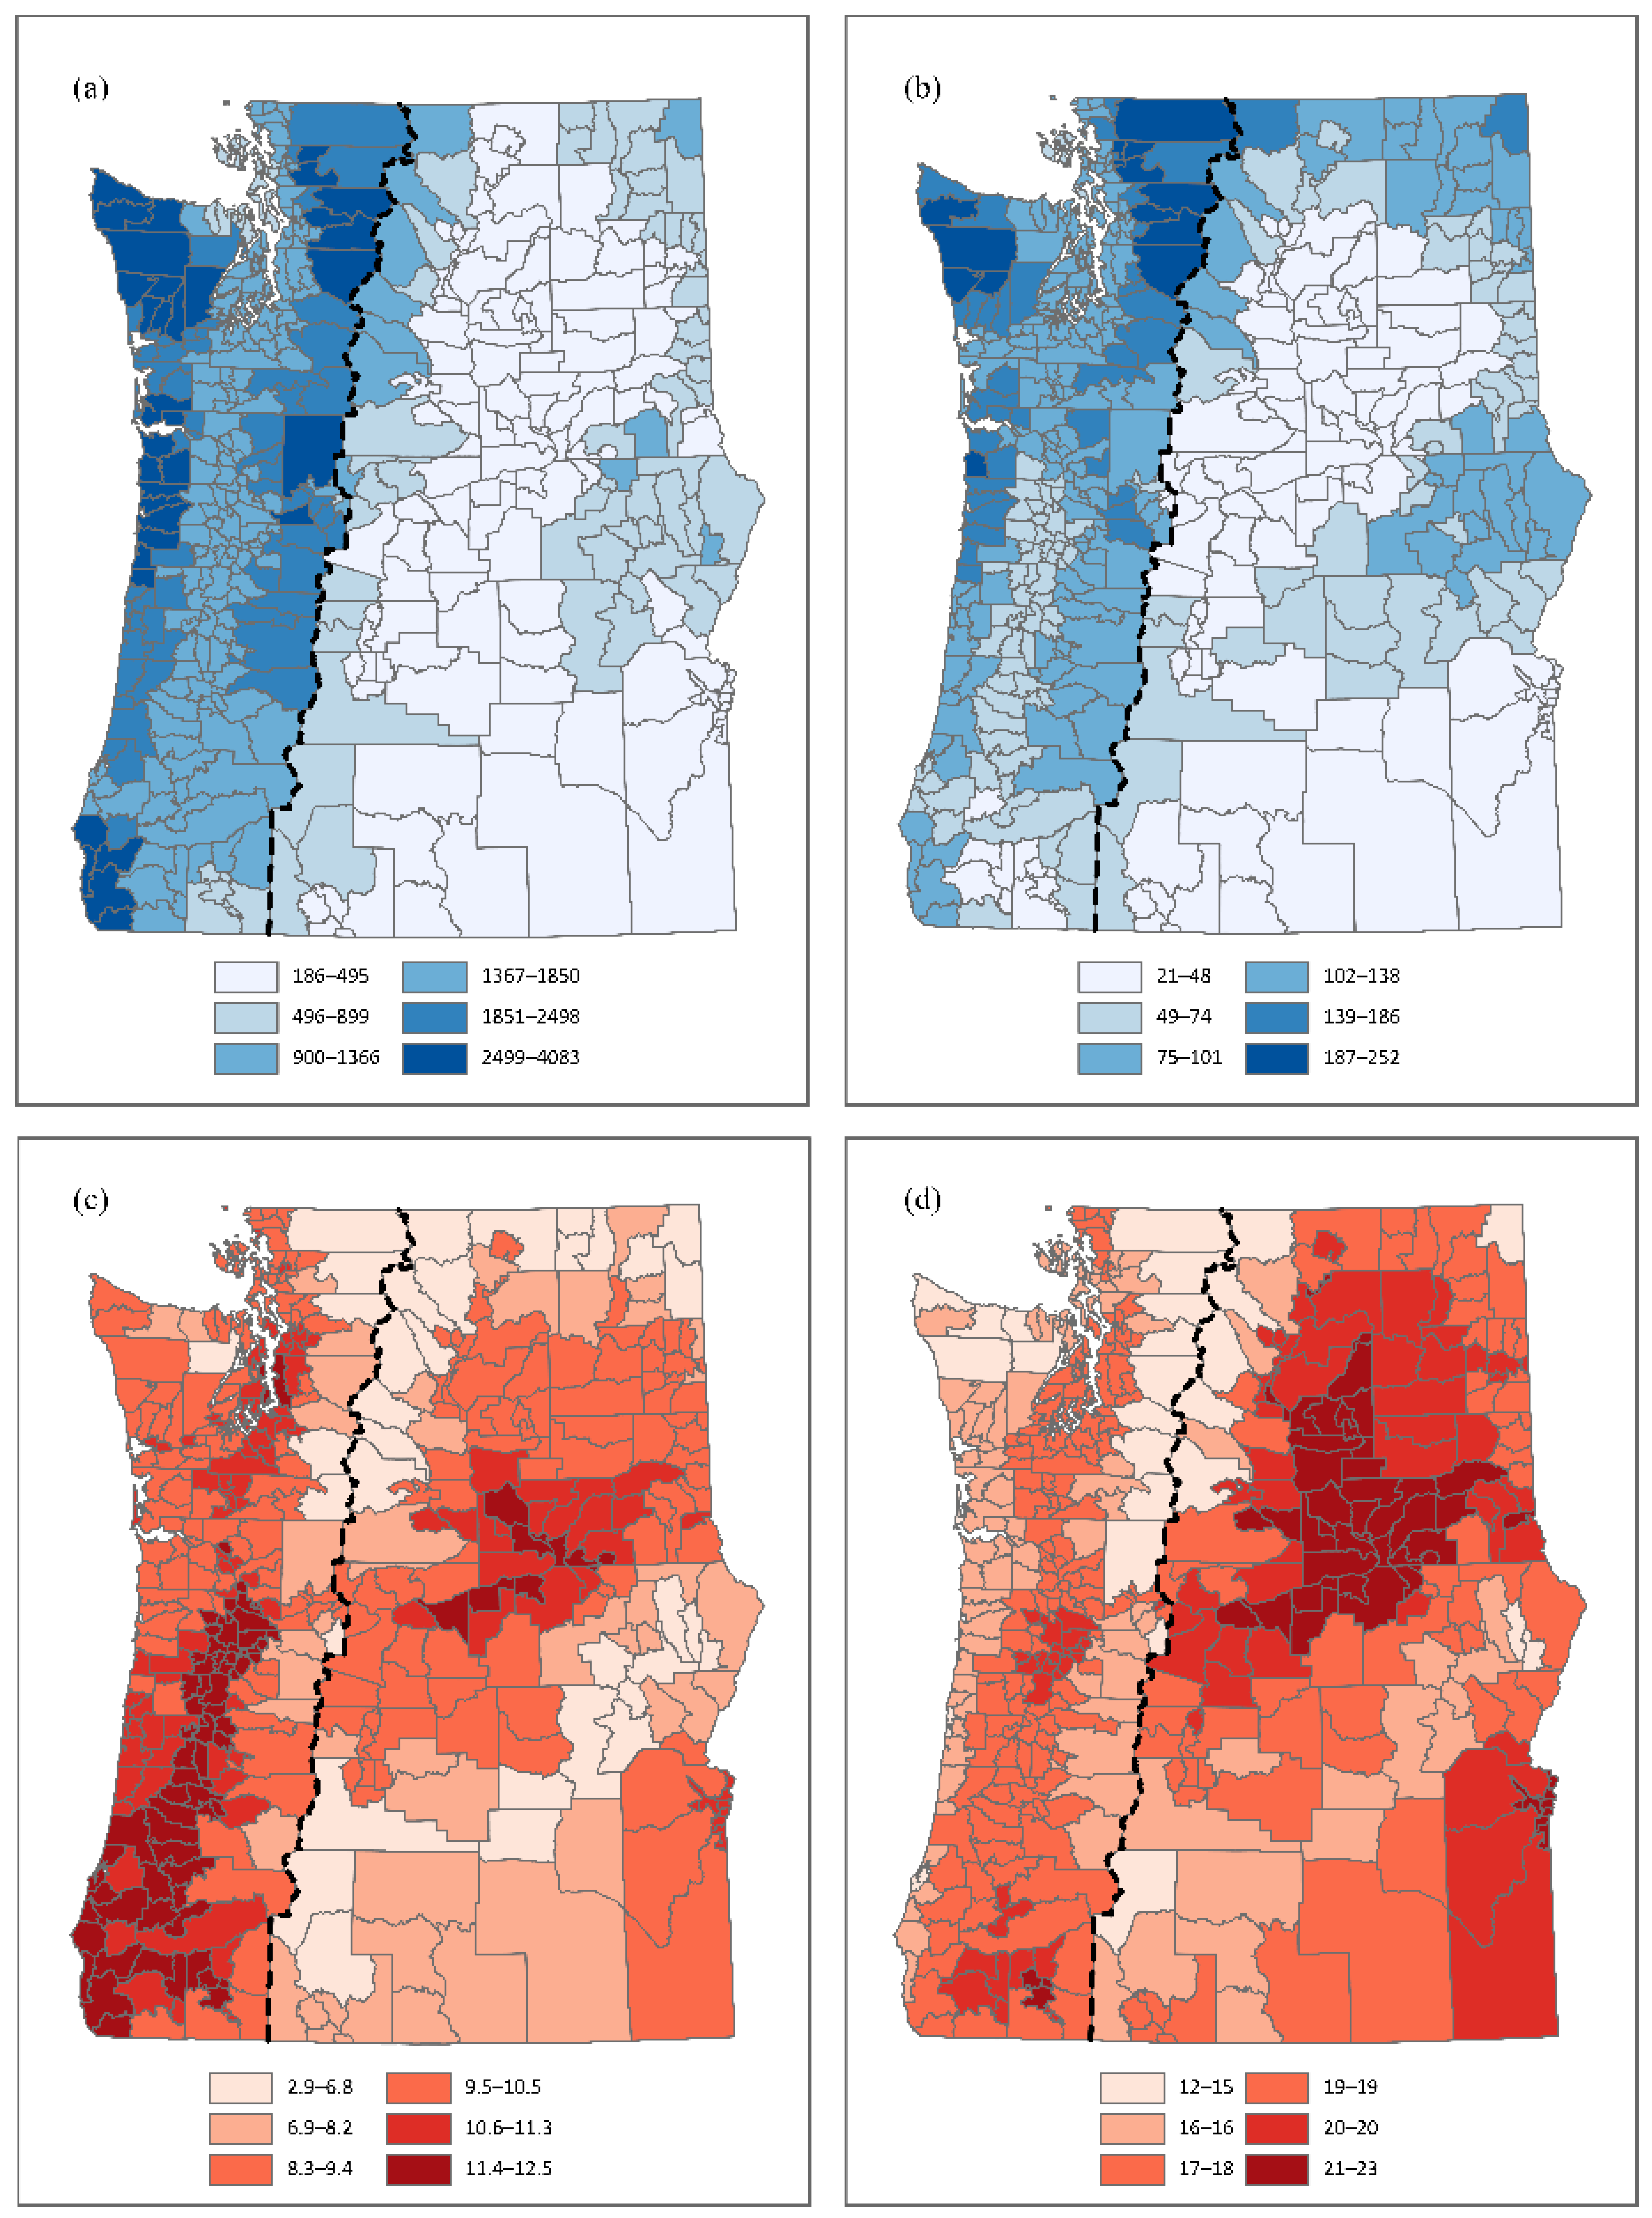
3.1. Question 1: What Are the Patterns of Ignition Causes across the Pacific Northwest?
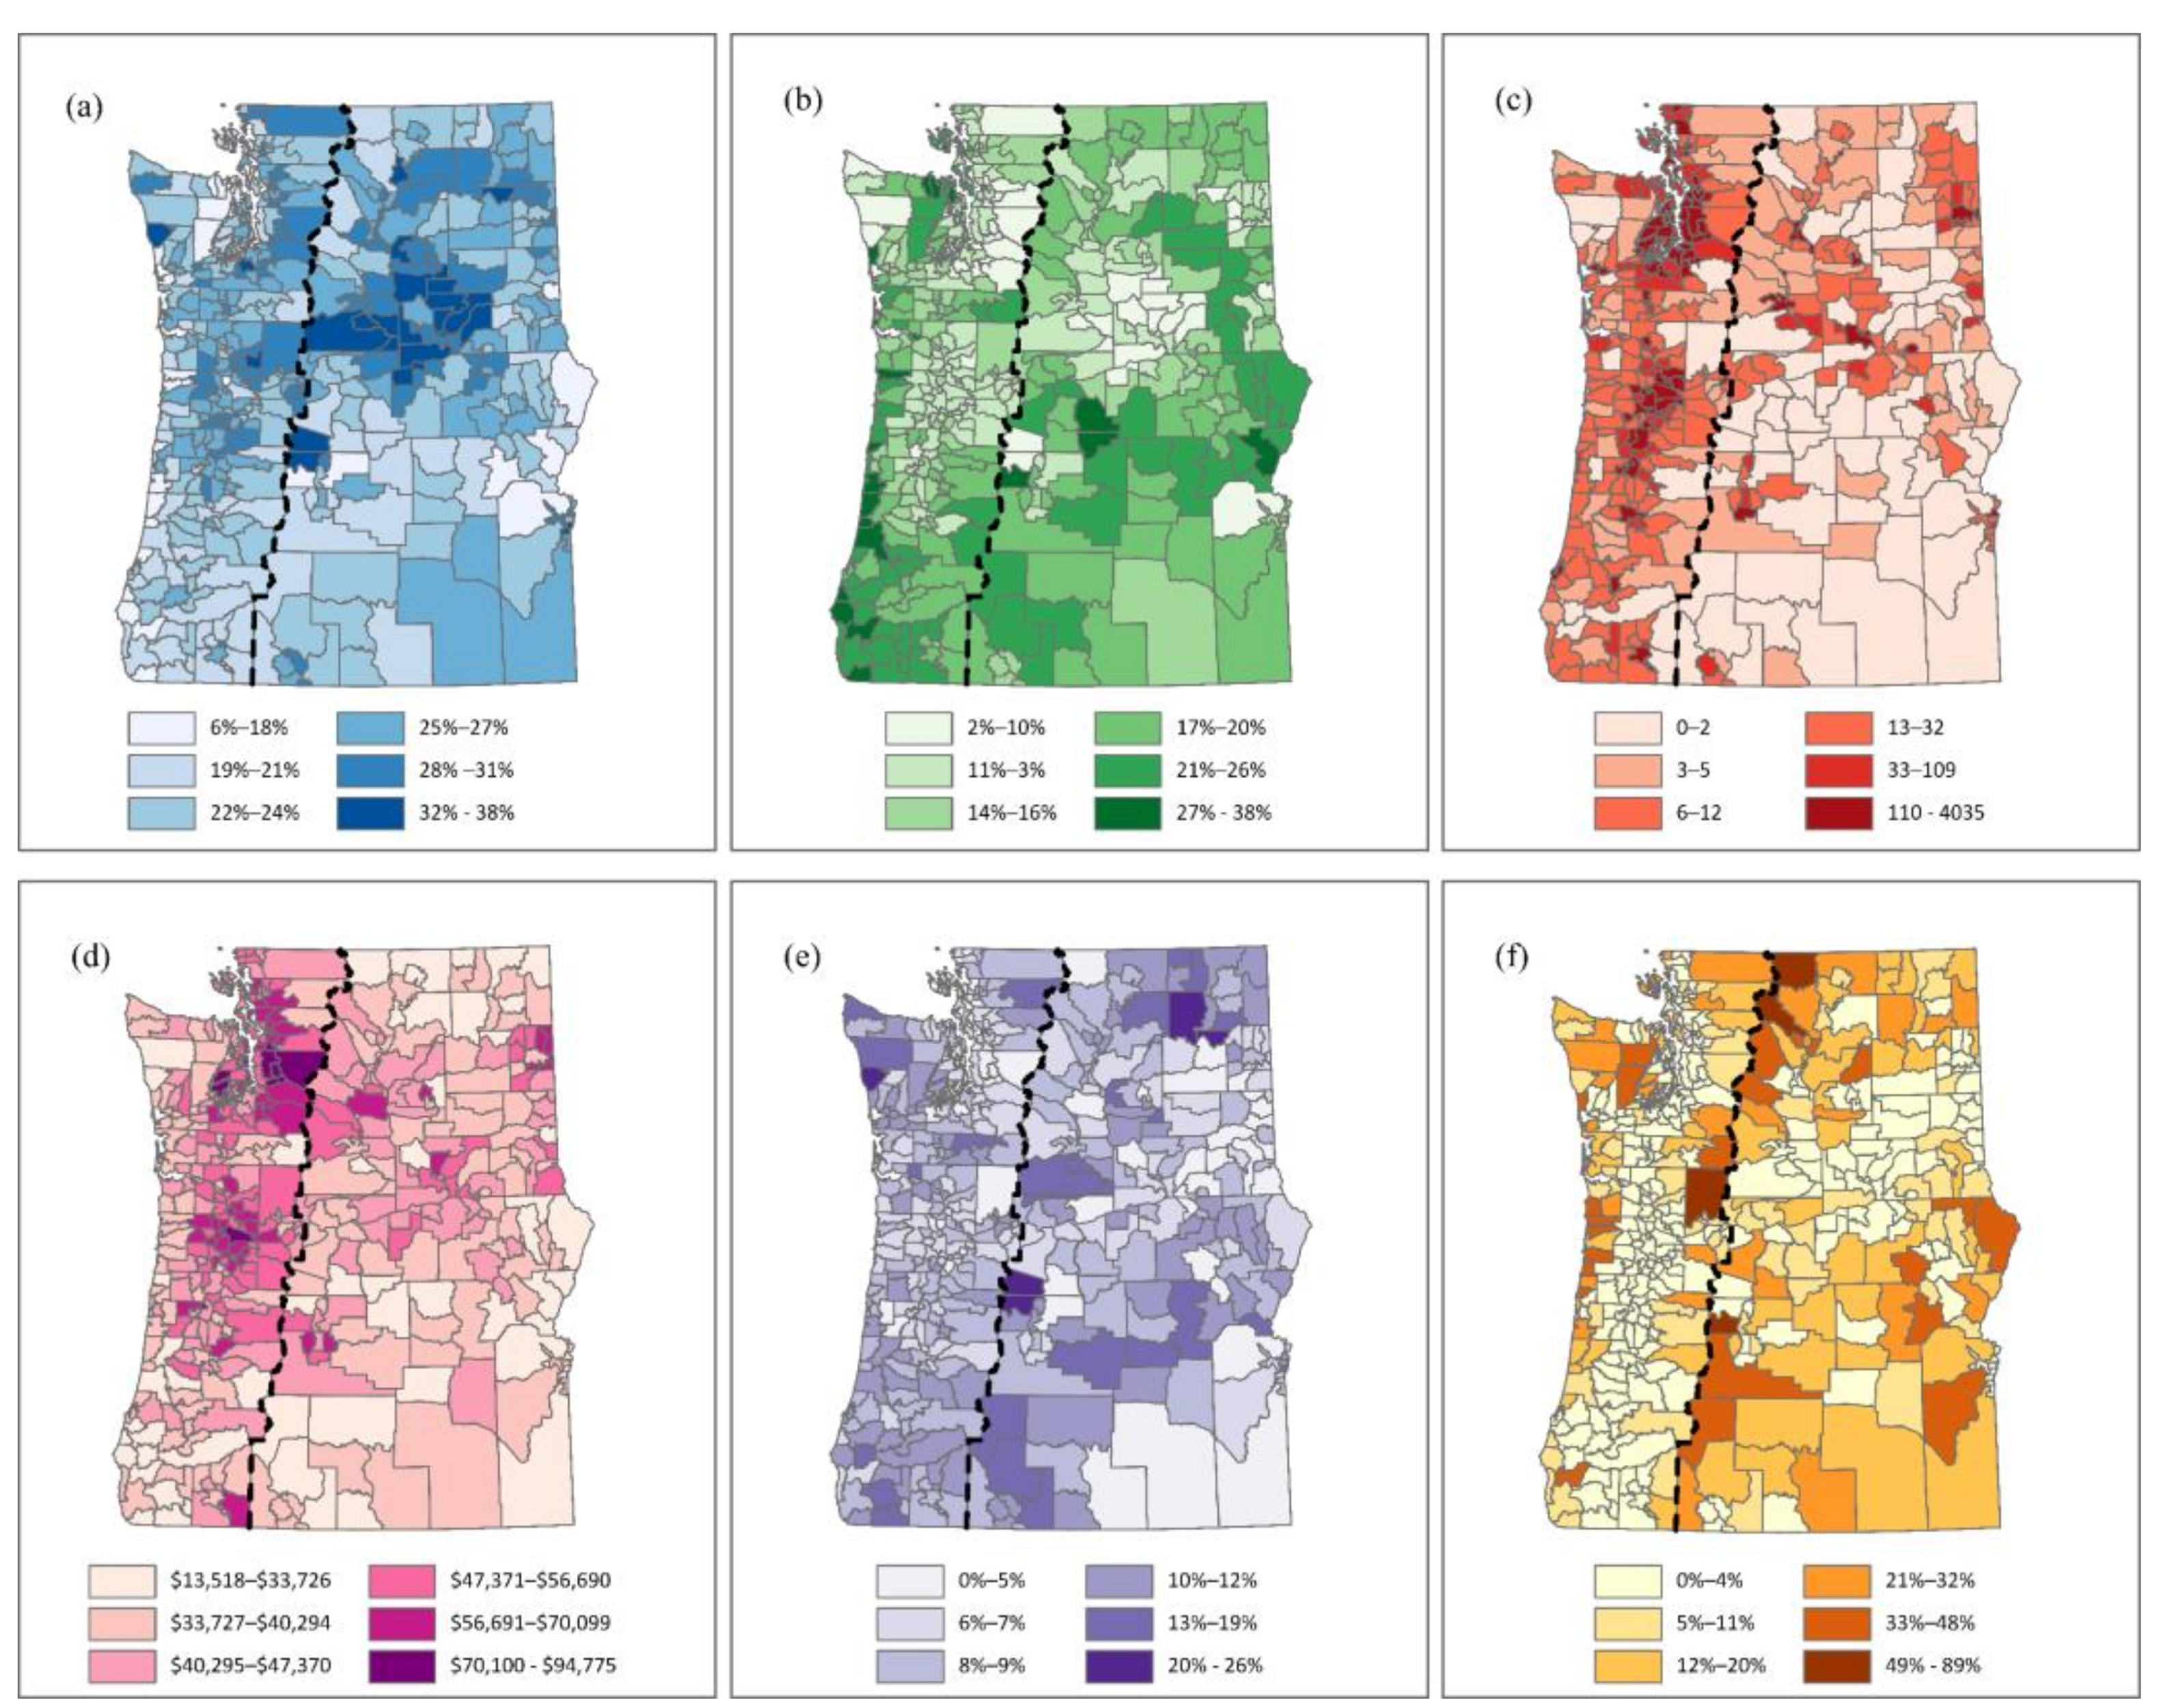
3.2. Question 2: How Might Socioeconomic and Biophsyical Factors Influence Wildfire Ignitions?
4. Discussion
Author Contributions
Funding
Institutional Review Board Statement
Informed Consent Statement
Data Availability Statement
Conflicts of Interest
Appendix A. Appendix Table
| FOD ID | State | NWCG General Cause | Fire Year | Notes |
|---|---|---|---|---|
| 400025889 | OR | Arson/incendiarism | 2017 | In OK not OR, point dropped |
| 400280014 | WA | Missing data/not specified/undetermined | 2010 | In CA not WA, point dropped |
| 400025885 | OR | Arson/incendiarism | 2017 | In OK not OR, point dropped |
| 1276308 | WA | Natural | 1994 | In ID not WA, point dropped |
| Westside (N = 7128) | Eastside (N = 4968) | |||||||||||||
|---|---|---|---|---|---|---|---|---|---|---|---|---|---|---|
| Explanatory Variables | 1 | 2 | 3 | 4 | 5 | 6 | 7 | 1 | 2 | 3 | 4 | 5 | 6 | 7 |
| 1. Summer Temperature | 1.0 | 1.0 | ||||||||||||
| 2. Summer Precipitation | −0.6 | 1.0 | −0.5 | 1.0 | ||||||||||
| 3. Elder (65+ years) | 0.0 | −0.2 | 1.0 | −0.2 | 0.1 | 1.0 | ||||||||
| 4. Vacant Seasonal Housing | −0.4 | 0.2 | 0.4 | 1.0 | −0.4 | 0.2 | 0.3 | 1.0 | ||||||
| 5. Unemployment rate | 0.0 | 0.0 | 0.1 | 0.0 | 1.0 | −0.2 | 0.1 | −0.1 | 0.0 | 1.0 | ||||
| 6. Household Income | 0.2 | −0.1 | −0.2 | −0.2 | −0.2 | 1.0 | 0.2 | −0.2 | 0.1 | 0.0 | −0.3 | 1.0 | ||
| 7. Population Density | 0.2 | −0.1 | −0.2 | −0.2 | −0.1 | 0.3 | 1.0 | 0.2 | −0.1 | −0.2 | −0.2 | 0.0 | 0.1 | 1.0 |
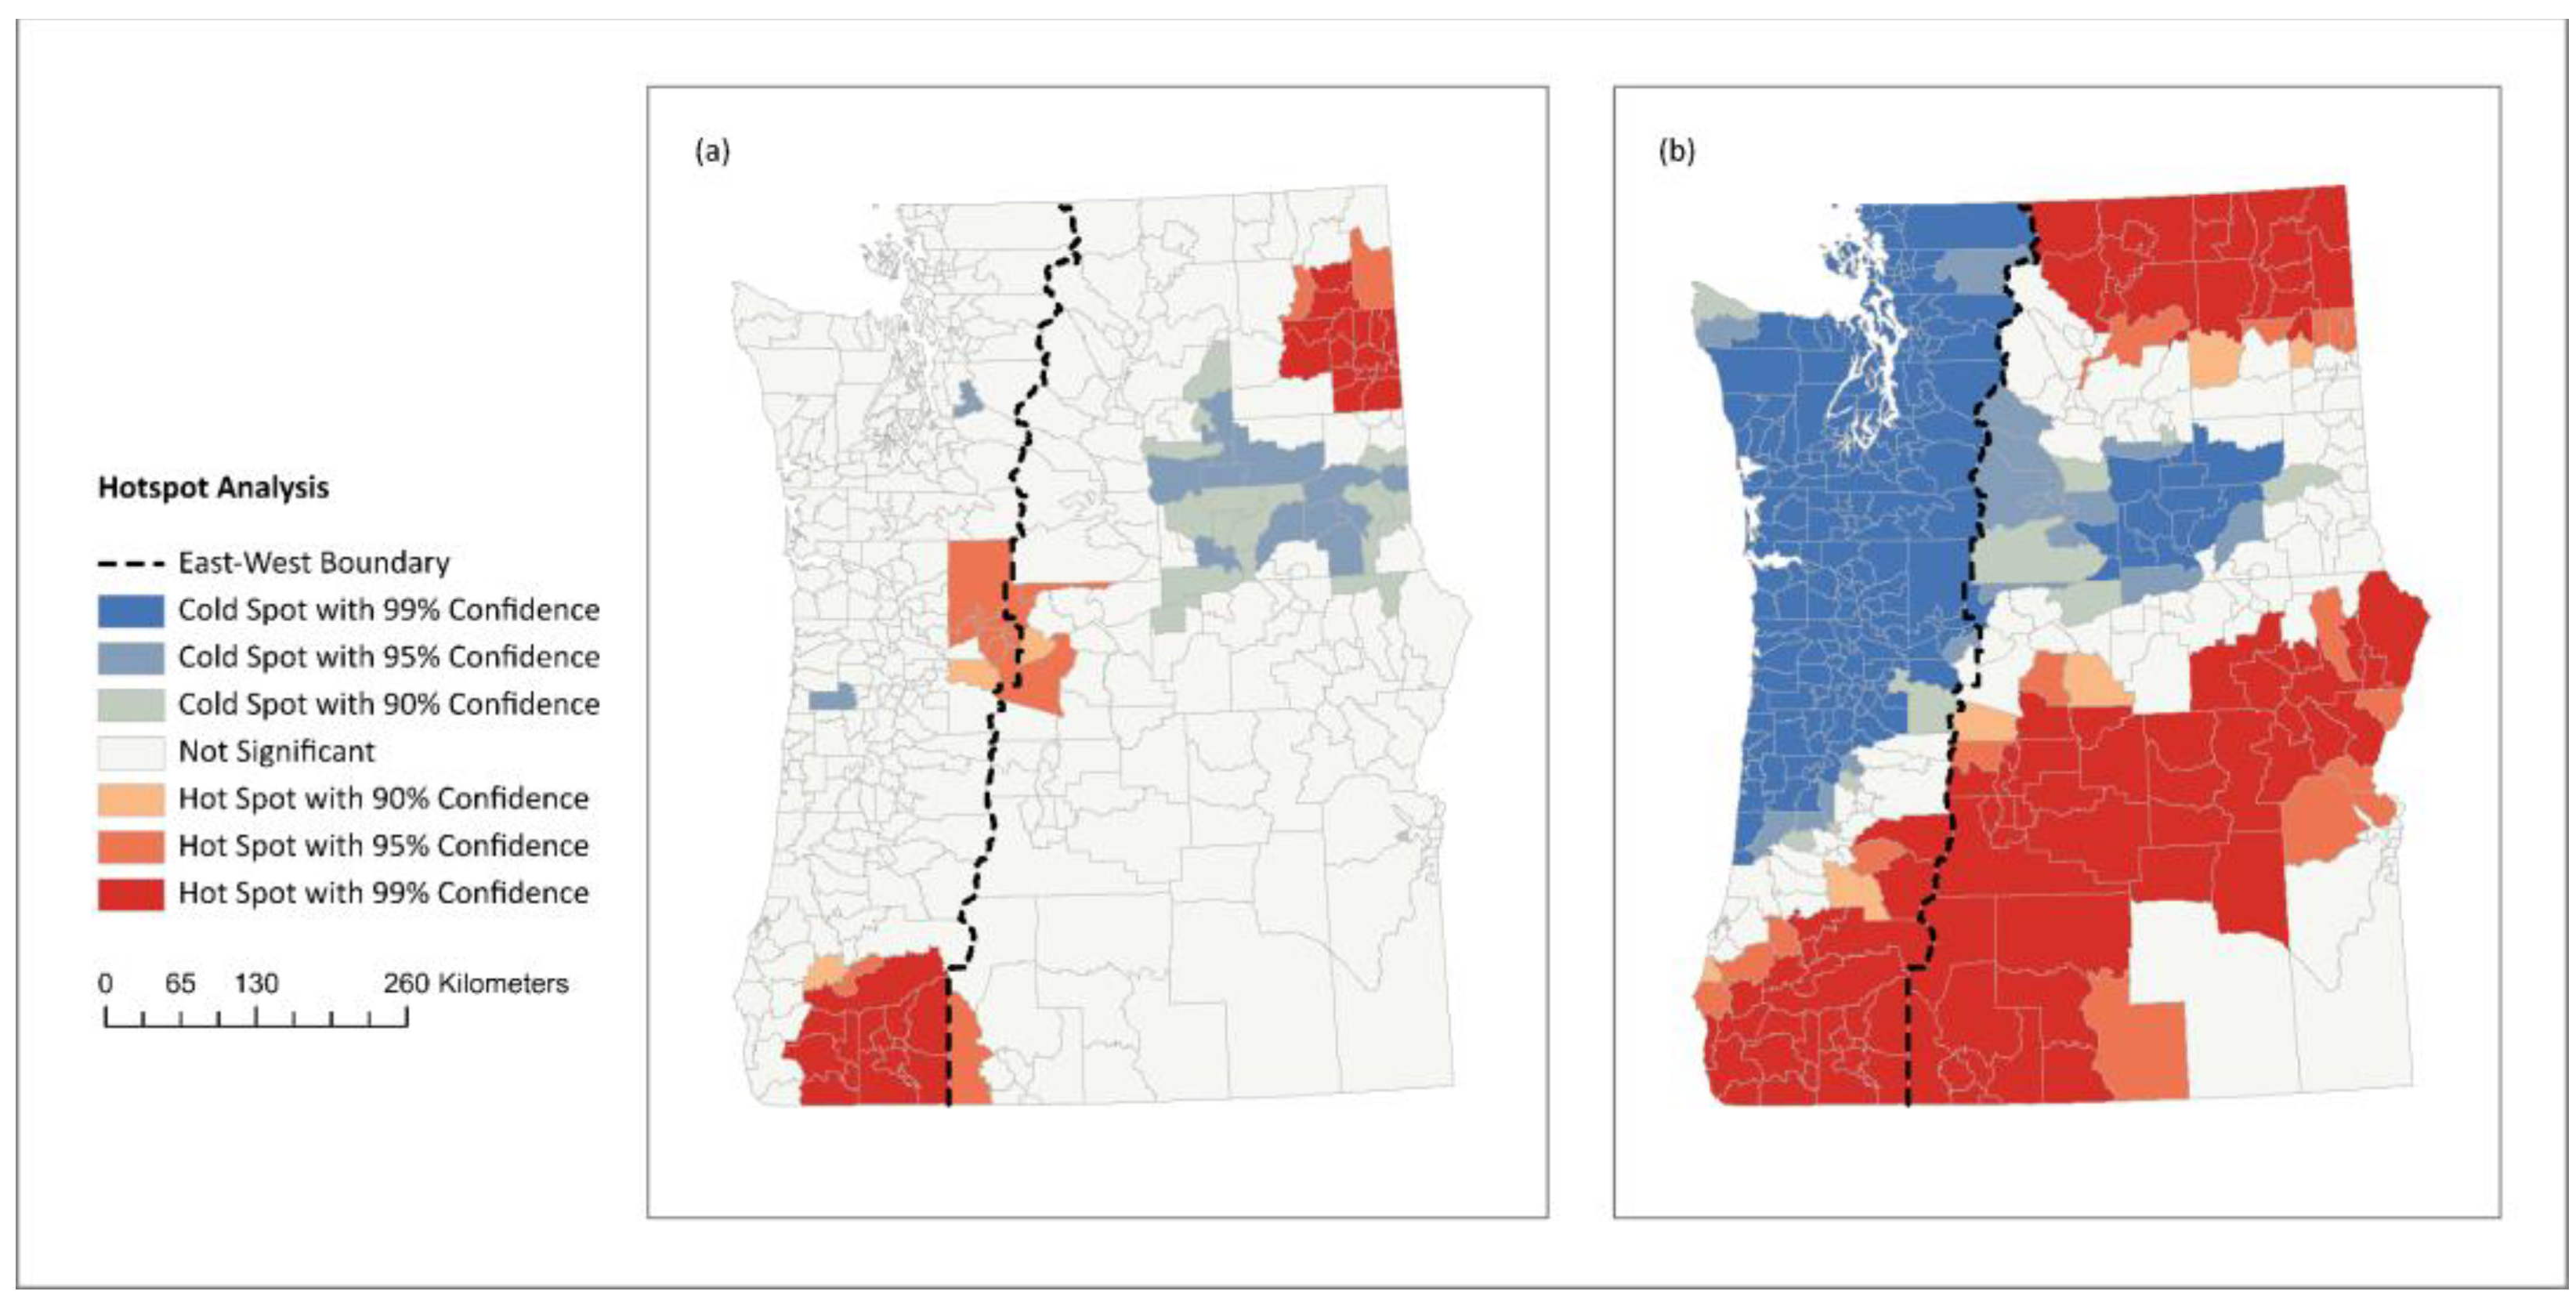
Appendix B. Hotspot Analysis

References
- Bond, W.J.; Keeley, J.E. Fire as a Global ‘Herbivore’: The Ecology and Evolution of Flammable Ecosystems. Trends Ecol. Evol. 2005, 20, 387–394. [Google Scholar] [CrossRef] [PubMed]
- Montegomery, C. Ch 11, Fire: An Agent and a Consequence of Land Use Change. In The Oxford Handbook of Land Economics; Duke, J.M., Wu, J., Eds.; Oxford University Press: Oxford, UK, 2014; pp. 281–301. [Google Scholar]
- Pyne, S.J. Fire: A Brief History, 2nd ed.; University of Washington Press: Seattle, WA, USA, 2019; ISBN 978-0295746180. [Google Scholar]
- Abatzoglou, J.T.; Williams, A.P. Impact of Anthropogenic Climate Change on Wildfire across Western US Forests. Proc. Natl. Acad. Sci. USA 2016, 113, 11770–11775. [Google Scholar] [CrossRef] [PubMed]
- Balch, J.K.; Bradley, B.A.; Abatzoglou, J.T.; Nagy, R.C.; Fusco, E.J.; Mahood, A.L. Human-Started Wildfires Expand the Fire Niche across the United States. Proc. Natl. Acad. Sci. USA 2017, 114, 2946–2951. [Google Scholar] [CrossRef] [PubMed]
- Cattau, M.E.; Wessman, C.; Mahood, A.; Balch, J.K. Anthropogenic and Lightning-started Fires Are Becoming Larger and More Frequent over a Longer Season Length in the U.S.A. Glob. Ecol. Biogeogr. 2020, 29, 668–681. [Google Scholar] [CrossRef]
- Evers, C.; Holz, A.; Busby, S.; Nielsen-Pincus, M. Extreme Winds Alter Influence of Fuels and Topography on Megafire Burn Severity in Seasonal Temperate Rainforests under Record Fuel Aridity. Fire 2022, 5, 41. [Google Scholar] [CrossRef]
- Parks, S.A.; Abatzoglou, J.T. Warmer and Drier Fire Seasons Contribute to Increases in Area Burned at High Severity in Western US Forests From 1985 to 2017. Geophys. Res. Lett. 2020, 47, e2020GL089858. [Google Scholar] [CrossRef]
- Radeloff, V.C.; Helmers, D.P.; Kramer, H.A.; Mockrin, M.H.; Alexandre, P.M.; Bar-Massada, A.; Butsic, V.; Hawbaker, T.J.; Martinuzzi, S.; Syphard, A.D.; et al. Rapid Growth of the US Wildland-Urban Interface Raises Wildfire Risk. Proc. Natl. Acad. Sci. USA 2018, 115, 3314–3319. [Google Scholar] [CrossRef]
- Food and Agriculture Organization of the United Nations. Fire Management Global Assessment: A Thematic Study Prepared in the Framework of the Global Forest Resources Assessment; Electronic Publishing Policy and Support Branch: Rome, Italy, 2007. [Google Scholar]
- National Science Analysis Team. The Science Analysis of The National Cohesive Wildland Fire Management Strategy. Available online: https://cohesivefire.nemac.org/challenges-opportunities (accessed on 22 August 2022).
- Prestemon, J.P.; Hawbaker, T.J.; Bowden, M.; Carpenter, J.; Brooks, M.T.; Abt, K.L.; Sutphen, R.; Scranton, S. Wildfire Ignitions: A Review of the Science and Recommendations for Empirical Modeling; U.S. Department of Agriculture, Forest Service, Southern Research Station: Asheville, NC, USA, 2013; p. SRS-GTR-171.
- Steelman, T.U.S. Wildfire Governance as Social-Ecological Problem. Ecol. Soc. 2016, 21. Available online: http://www.jstor.org/stable/26270036 (accessed on 15 July 2023). [CrossRef]
- Ager, A.A.; Kline, J.D.; Fischer, A.P. Coupling the Biophysical and Social Dimensions of Wildfire Risk to Improve Wildfire Mitigation Planning: Coupling the Biophysical and Social Dimensions of Wildfire Risk. Risk Anal. 2015, 35, 1393–1406. [Google Scholar] [CrossRef]
- McCaffrey, S.; Toman, E.; Stidham, M.; Shindler, B. Social Science Research Related to Wildfire Management: An Overview of Recent Findings and Future Research Needs. Int. J. Wildland Fire 2013, 22, 15. [Google Scholar] [CrossRef]
- Costafreda-Aumedes, S.; Comas, C.; Vega-Garcia, C.; Costafreda-Aumedes, S.; Comas, C.; Vega-Garcia, C. Human-Caused Fire Occurrence Modelling in Perspective: A Review. Int. J. Wildland Fire 2017, 26, 983–998. [Google Scholar] [CrossRef]
- Gillson, L.; Whitlock, C.; Humphrey, G. Greater Temperature and Precipitation Extremes Intensify Western U.S. Droughts, Wildfire Severity, and Sierra Nevada Tree Mortality. Ecol. Soc. 2019, 24, 14. [Google Scholar] [CrossRef]
- Hrozencik, A. Drought in the Western United States. Available online: https://www.ers.usda.gov/newsroom/trending-topics/drought-in-the-western-united-states/ (accessed on 3 April 2022).
- Halofsky, J.E.; Peterson, D.L.; Harvey, B.J. Changing Wildfire, Changing Forests: The Effects of Climate Change on Fire Regimes and Vegetation in the Pacific Northwest, USA. Fire Ecol. 2020, 16, 4. [Google Scholar] [CrossRef]
- Fischer, A.P.; Spies, T.A.; Steelman, T.A.; Moseley, C.; Johnson, B.R.; Bailey, J.D.; Ager, A.A.; Bourgeron, P.; Charnley, S.; Collins, B.M.; et al. Wildfire Risk as a Socioecological Pathology. Front. Ecol. Environ. 2016, 14, 276–284. [Google Scholar] [CrossRef]
- Kline, J.D.; White, E.M.; Fischer, A.P.; Steen-Adams, M.M.; Charnley, S.; Olsen, C.S.; Spies, T.A.; Bailey, J.D. Integrating Social Science into Empirical Models of Coupled Human and Natural Systems. Ecol. Soc. 2017, 22, art25. [Google Scholar] [CrossRef]
- Cardille, J.A.; Ventura, S.J.; Turner, M.G. Environmental and Social Factors Influencing Wildfires in the Upper Midwest, United States. Ecol. Appl. 2001, 11, 111–127. [Google Scholar] [CrossRef]
- Chas-Amil, M.L.; Prestemon, J.P.; McClean, C.J.; Touza, J. Human-Ignited Wildfire Patterns and Responses to Policy Shifts. Appl. Geogr. 2015, 56, 164–176. [Google Scholar] [CrossRef]
- de Diego, J.; Rúa, A.; Fernández, M. Designing a Model to Display the Relation between Social Vulnerability and Anthropogenic Risk of Wildfires in Galicia, Spain. Urban Sci. 2019, 3, 32. [Google Scholar] [CrossRef]
- Dondo Bühler, M.; de Torres Curth, M.; Garibaldi, L.A. Demography and Socioeconomic Vulnerability Influence Fire Occurrence in Bariloche (Argentina). Landsc. Urban Plan. 2013, 110, 64–73. [Google Scholar] [CrossRef]
- Grala, K.; Grala, R.K.; Hussain, A.; Cooke, W.H.; Varner, J.M. Impact of Human Factors on Wildfire Occurrence in Mississippi, United States. For. Policy Econ. 2017, 81, 38–47. [Google Scholar] [CrossRef]
- Guo, F.; Su, Z.; Wang, G.; Sun, L.; Lin, F.; Liu, A. Wildfire Ignition in the Forests of Southeast China: Identifying Drivers and Spatial Distribution to Predict Wildfire Likelihood. Appl. Geogr. 2016, 66, 12–21. [Google Scholar] [CrossRef]
- Mancini, L.D.; Corona, P.; Salvati, L. Ranking the Importance of Wildfires’ Human Drivers through a Multi-Model Regression Approach. Environ. Impact Assess. Rev. 2018, 72, 177–186. [Google Scholar] [CrossRef]
- Martínez-Fernández, J.; Chuvieco, E.; Koutsias, N. Modelling Long-Term Fire Occurrence Factors in Spain by Accounting for Local Variations with Geographically Weighted Regression. Nat. Hazards Earth Syst. Sci. 2013, 13, 311–327. [Google Scholar] [CrossRef]
- Mercer, D.E.; Prestemon, J.P. Comparing Production Function Models for Wildfire Risk Analysis in the Wildland–Urban Interface. For. Policy Econ. 2005, 7, 782–795. [Google Scholar] [CrossRef]
- Narayanaraj, G.; Wimberly, M.C. Influences of Forest Roads on the Spatial Patterns of Human- and Lightning-Caused Wildfire Ignitions. Appl. Geogr. 2012, 32, 878–888. [Google Scholar] [CrossRef]
- Oliveira, S.; Oehler, F.; San-Miguel-Ayanz, J.; Camia, A.; Pereira, J.M.C. Modeling Spatial Patterns of Fire Occurrence in Mediterranean Europe Using Multiple Regression and Random Forest. For. Ecol. Manag. 2012, 275, 117–129. [Google Scholar] [CrossRef]
- Pozo, R.A.; Galleguillos, M.; González, M.E.; Vásquez, F.; Arriagada, R. Assessing the Socio-Economic and Land-Cover Drivers of Wildfire Activity and Its Spatiotemporal Distribution in South-Central Chile. Sci. Total Environ. 2022, 810, 152002. [Google Scholar] [CrossRef]
- Prestemon, J.P.; Butry, D.T. Time to Burn: Modeling Wildland Arson as an Autoregressive Crime Function. Am. J. Agric. Econ. 2005, 87, 756–770. [Google Scholar] [CrossRef]
- Syphard, A.D.; Radeloff, V.C.; Keuler, N.S.; Taylor, R.S.; Hawbaker, T.J.; Stewart, S.I.; Clayton, M.K. Predicting Spatial Patterns of Fire on a Southern California Landscape. Int. J. Wildland Fire 2008, 17, 602. [Google Scholar] [CrossRef]
- Zhang, Y.; Lim, S.; Sharples, J.J. Modelling Spatial Patterns of Wildfire Occurrence in South-Eastern Australia. Geomat. Nat. Hazards Risk 2016, 7, 1800–1815. [Google Scholar] [CrossRef]
- Agee, J.K. Fire Ecology of Pacific Northwest Forests; Island Press: Washington, DC, USA, 1996; ISBN 978-1-55963-230-0. [Google Scholar]
- Haugo, R.D.; Kellogg, B.S.; Cansler, C.A.; Kolden, C.A.; Kemp, K.B.; Robertson, J.C.; Metlen, K.L.; Vaillant, N.M.; Restaino, C.M. The Missing Fire: Quantifying Human Exclusion of Wildfire in Pacific Northwest Forests, USA. Ecosphere 2019, 10, e02702. [Google Scholar] [CrossRef]
- Reilly, M.J.; Zuspan, A.; Halofsky, J.S.; Raymond, C.; McEvoy, A.; Dye, A.W.; Donato, D.C.; Kim, J.B.; Potter, B.E.; Walker, N.; et al. Cascadia Burning: The Historic, but Not Historically Unprecedented, 2020 Wildfires in the Pacific Northwest, USA. Ecosphere 2022, 13, e4070. [Google Scholar] [CrossRef]
- United States Census Bureau County Subdivisions, The Geographic Areas Reference Manual of the United States Census Bureau. Available online: https://www2.census.gov/geo/pdfs/reference/GARM/Ch8GARM.pdf (accessed on 18 July 2022).
- Short, K.C. Spatial Wildfire Occurrence Data for the United States, 1992–2018 [FPA_FOD_20210617], 5th ed.; USDA Forest Service Research Data Archive: Washington, DC, USA, 2021.
- Donoghue, L. Classifying Wildfire Causes in the USDA Forest Service: Problems and Alternatives; U.S. Department of Agriculture, Forest Service, North Central Forest Experiment Station: St. Paul, MN, USA, 1982.
- Daly, C.; Halbleib, M.; Smith, J.I.; Gibson, W.P.; Doggett, M.K.; Taylor, G.H.; Curtis, J.; Pasteris, P.P. Physiographically Sensitive Mapping of Climatological Temperature and Precipitation across the Conterminous United States. Int. J. Climatol. 2008, 28, 2031–2064. [Google Scholar] [CrossRef]
- Manson, S.; Schroeder, J.; Van Riper, D.; Kugler, T.; Ruggles, S. IPUMS National Historical Geographic Information System: Version 15.0; University of Minnesota: Minneapolis, MN, USA, 2020. [Google Scholar] [CrossRef]
- HERE Technologies; U.S. Department of Homeland Security Internal Road Layer from U.S. Forest Service. Internal dataset.
- Brenkert-Smith, H.; Champ, P.A.; Flores, N. Trying Not to Get Burned: Understanding Homeowners’ Wildfire Risk–Mitigation Behaviors. Environ. Manag. 2012, 50, 1139–1151. [Google Scholar] [CrossRef]
- Collins, T.W. What Influences Hazard Mitigation? Household Decision Making about Wildfire Risks in Arizona’s White Mountains. Prof. Geogr. 2008, 60, 508–526. [Google Scholar] [CrossRef]
- Winter, P.L.; Crano, W.D.; Basáñez, T.; Lamb, C.S. Equity in Access to Outdoor Recreation—Informing a Sustainable Future. Sustainability 2020, 12, 124. [Google Scholar] [CrossRef]
- Omernik, J.M.; Griffith, G.E. Ecoregions of the Conterminous United States: Evolution of a Hierarchical Spatial Framework. Environ. Manag. 2014, 54, 1249–1266. [Google Scholar] [CrossRef]
- Hu, M.-C.; Pavlicova, M.; Nunes, E.V. Zero-Inflated and Hurdle Models of Count Data with Extra Zeros: Examples from an HIV-Risk Reduction Intervention Trial. Am. J. Drug Alcohol Abuse 2011, 37, 367–375. [Google Scholar] [CrossRef]
- Su, Z.; Hu, H.; Tigabu, M.; Wang, G.; Zeng, A.; Guo, F. Geographically Weighted Negative Binomial Regression Model Predicts Wildfire Occurrence in the Great Xing’an Mountains Better than Negative Binomial Model. Forests 2019, 10, 377. [Google Scholar] [CrossRef]
- Jackman, S. Pscl: Classes and Methods for R Developed in the Political Science Computational Laboratory; United States Studies Centre, University of Sydney: Sydney, NSW, Australia, 2020. [Google Scholar]
- McWethy, D.B.; Pauchard, A.; García, R.A.; Holz, A.; González, M.E.; Veblen, T.T.; Stahl, J.; Currey, B. Landscape Drivers of Recent Fire Activity (2001–2017) in South-Central Chile. PLoS ONE 2018, 13, e0201195. [Google Scholar] [CrossRef]
- Chen, B.; Jin, Y. Spatial Patterns and Drivers for Wildfire Ignitions in California. Environ. Res. Lett. 2022, 17, 055004. [Google Scholar] [CrossRef]
- Dorph, A.; Marshall, E.; Parkins, K.A.; Penman, T.D. Modelling Ignition Probability for Human- and Lightning-Caused Wildfires in Victoria, Australia. Nat. Hazards Earth Syst. Sci. 2022, 22, 3487–3499. [Google Scholar] [CrossRef]
- Abatzoglou, J.T.; Kolden, C.A.; Balch, J.K.; Bradley, B.A. Controls on Interannual Variability in Lightning-Caused Fire Activity in the Western US. Environ. Res. Lett. 2016, 11, 045005. [Google Scholar] [CrossRef]
- Benefield, A.; Chen, J. Does Human Accessibility Affect Lightning-Caused Wildfires? A Case Study of the Southern Rocky Mountains. Fire Technol. 2023. [Google Scholar] [CrossRef]
- Environmental Systems Research Institute. Optimized Hot Spot Analysis (Spatial Statistics)—ArcGIS Pro|Documentation. Available online: https://pro.arcgis.com/en/pro-app/latest/tool-reference/spatial-statistics/optimized-hot-spot-analysis.htm (accessed on 25 July 2023).
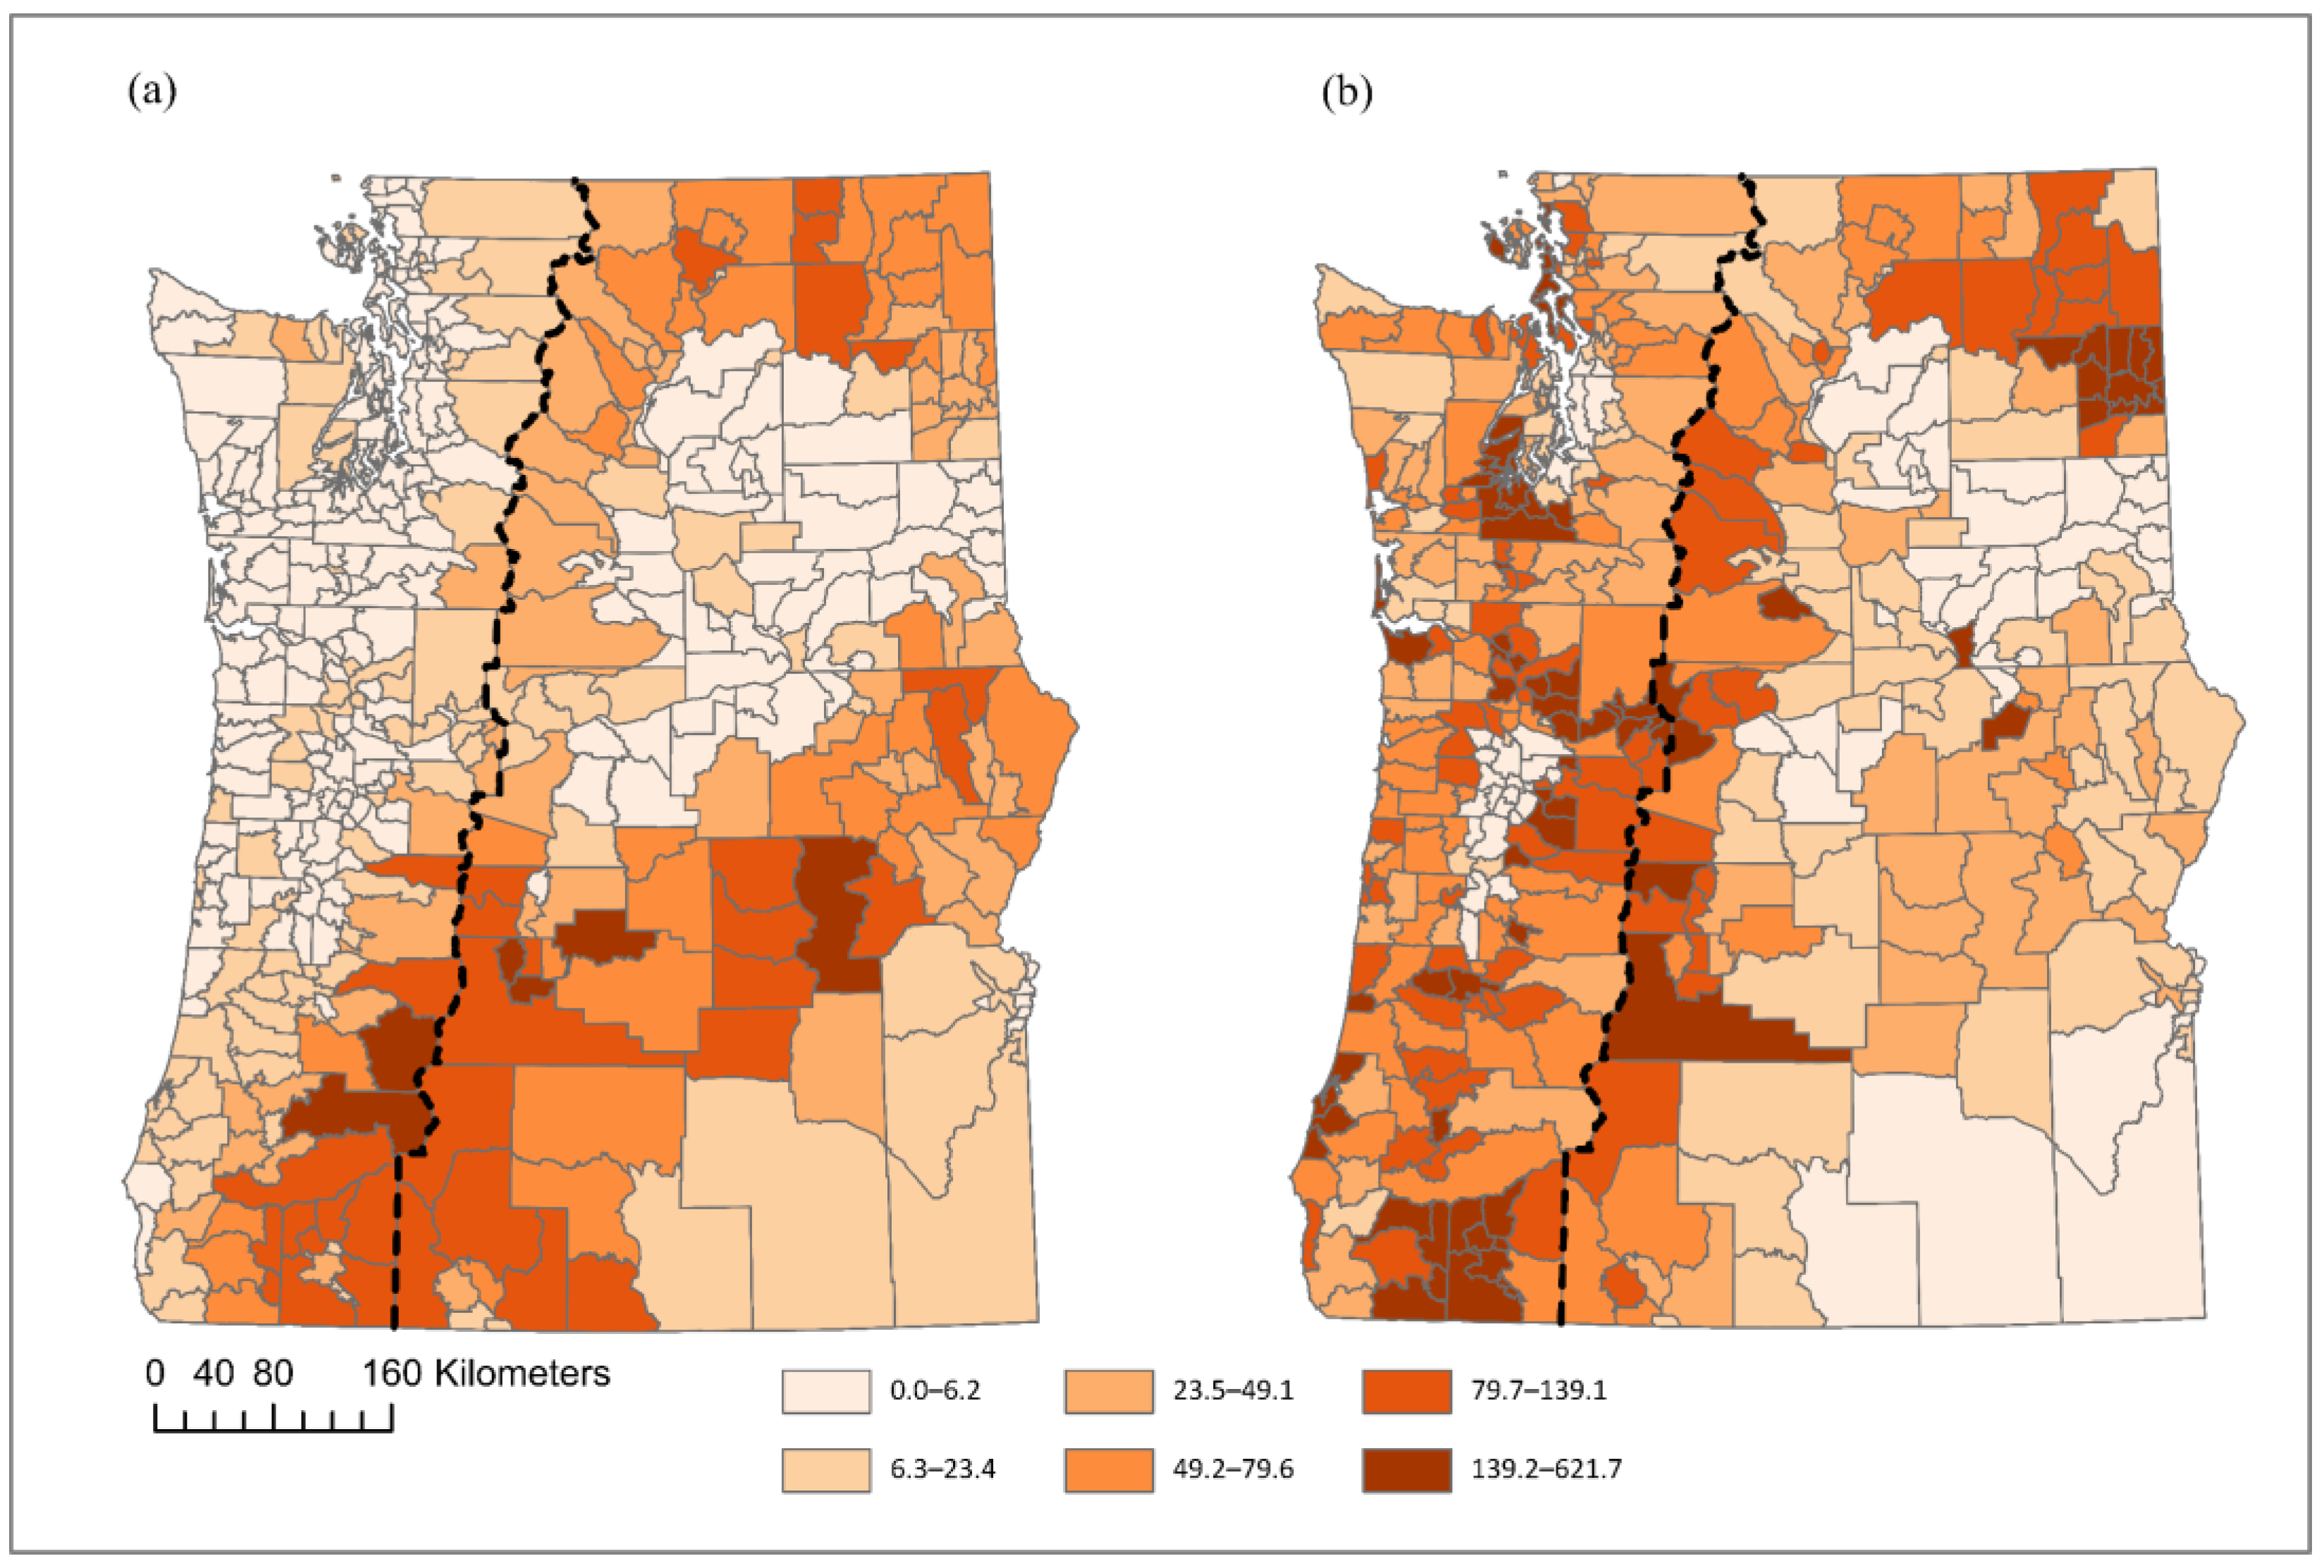
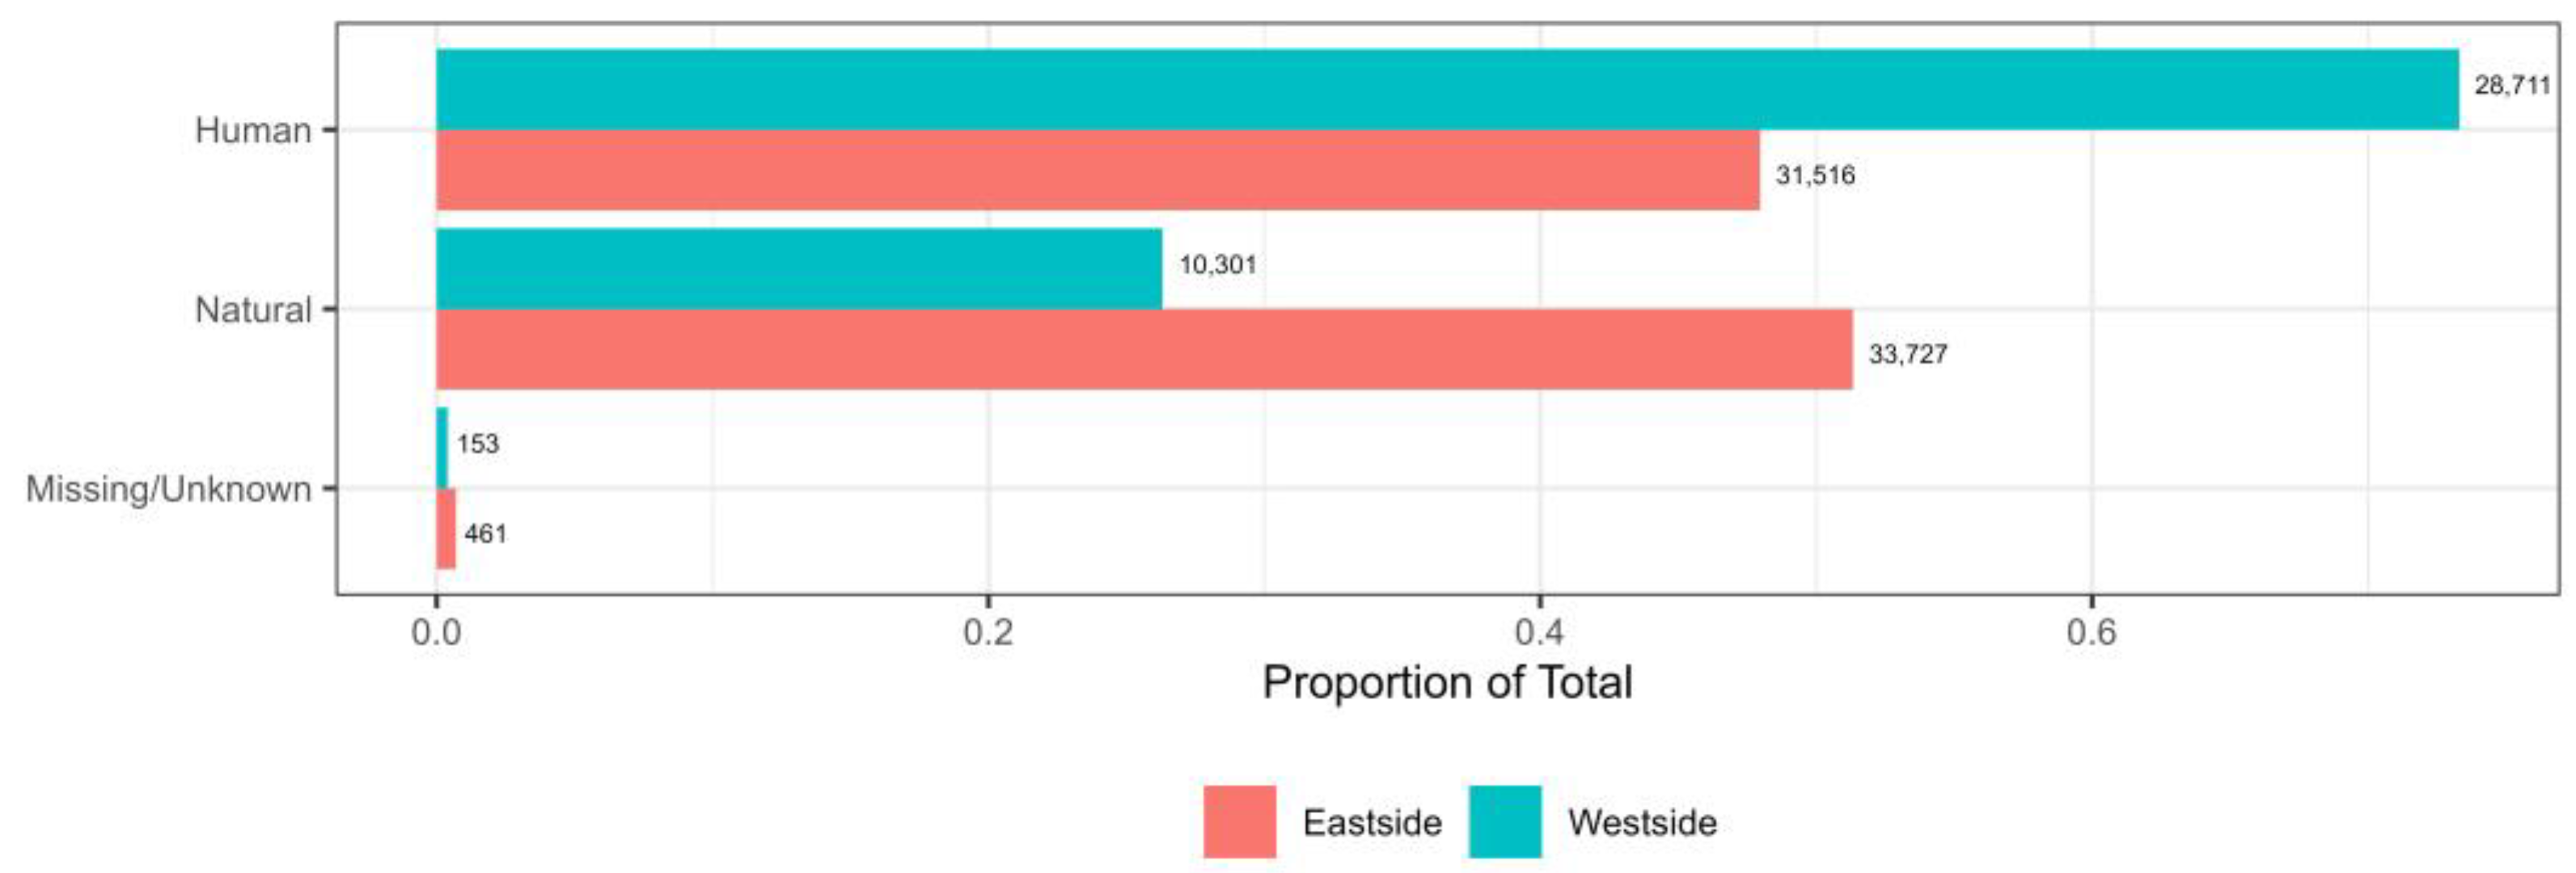
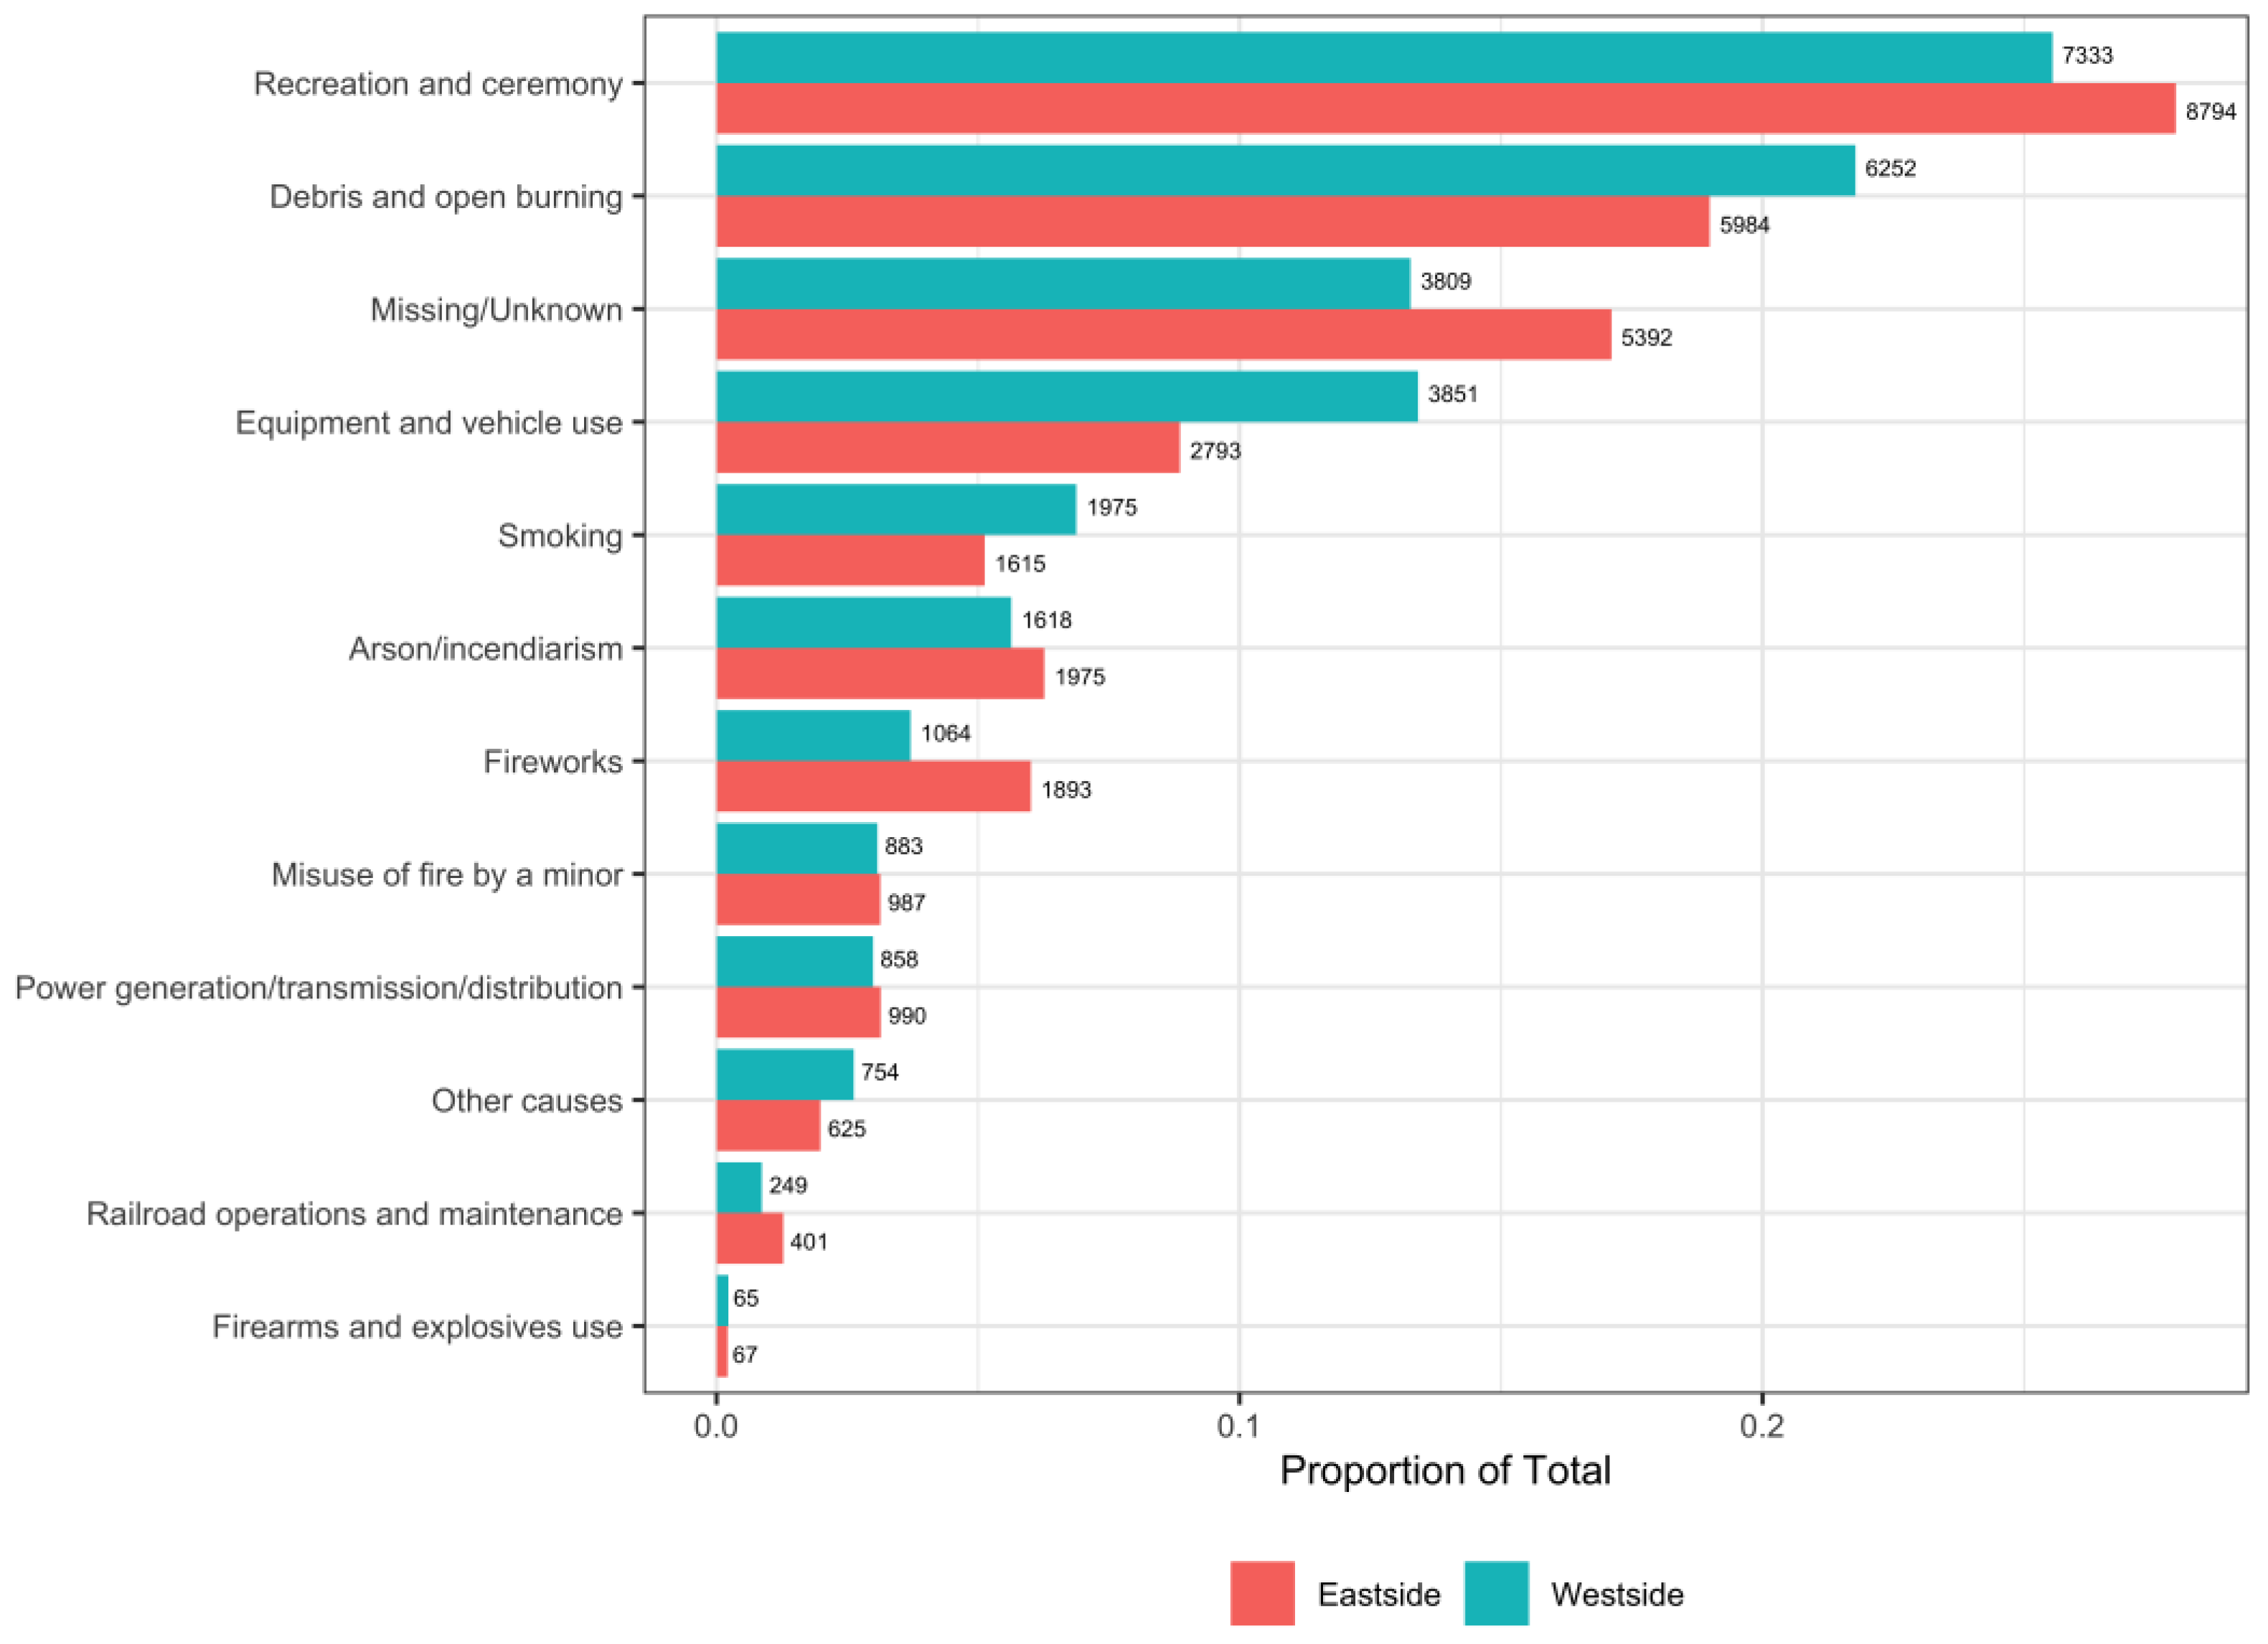
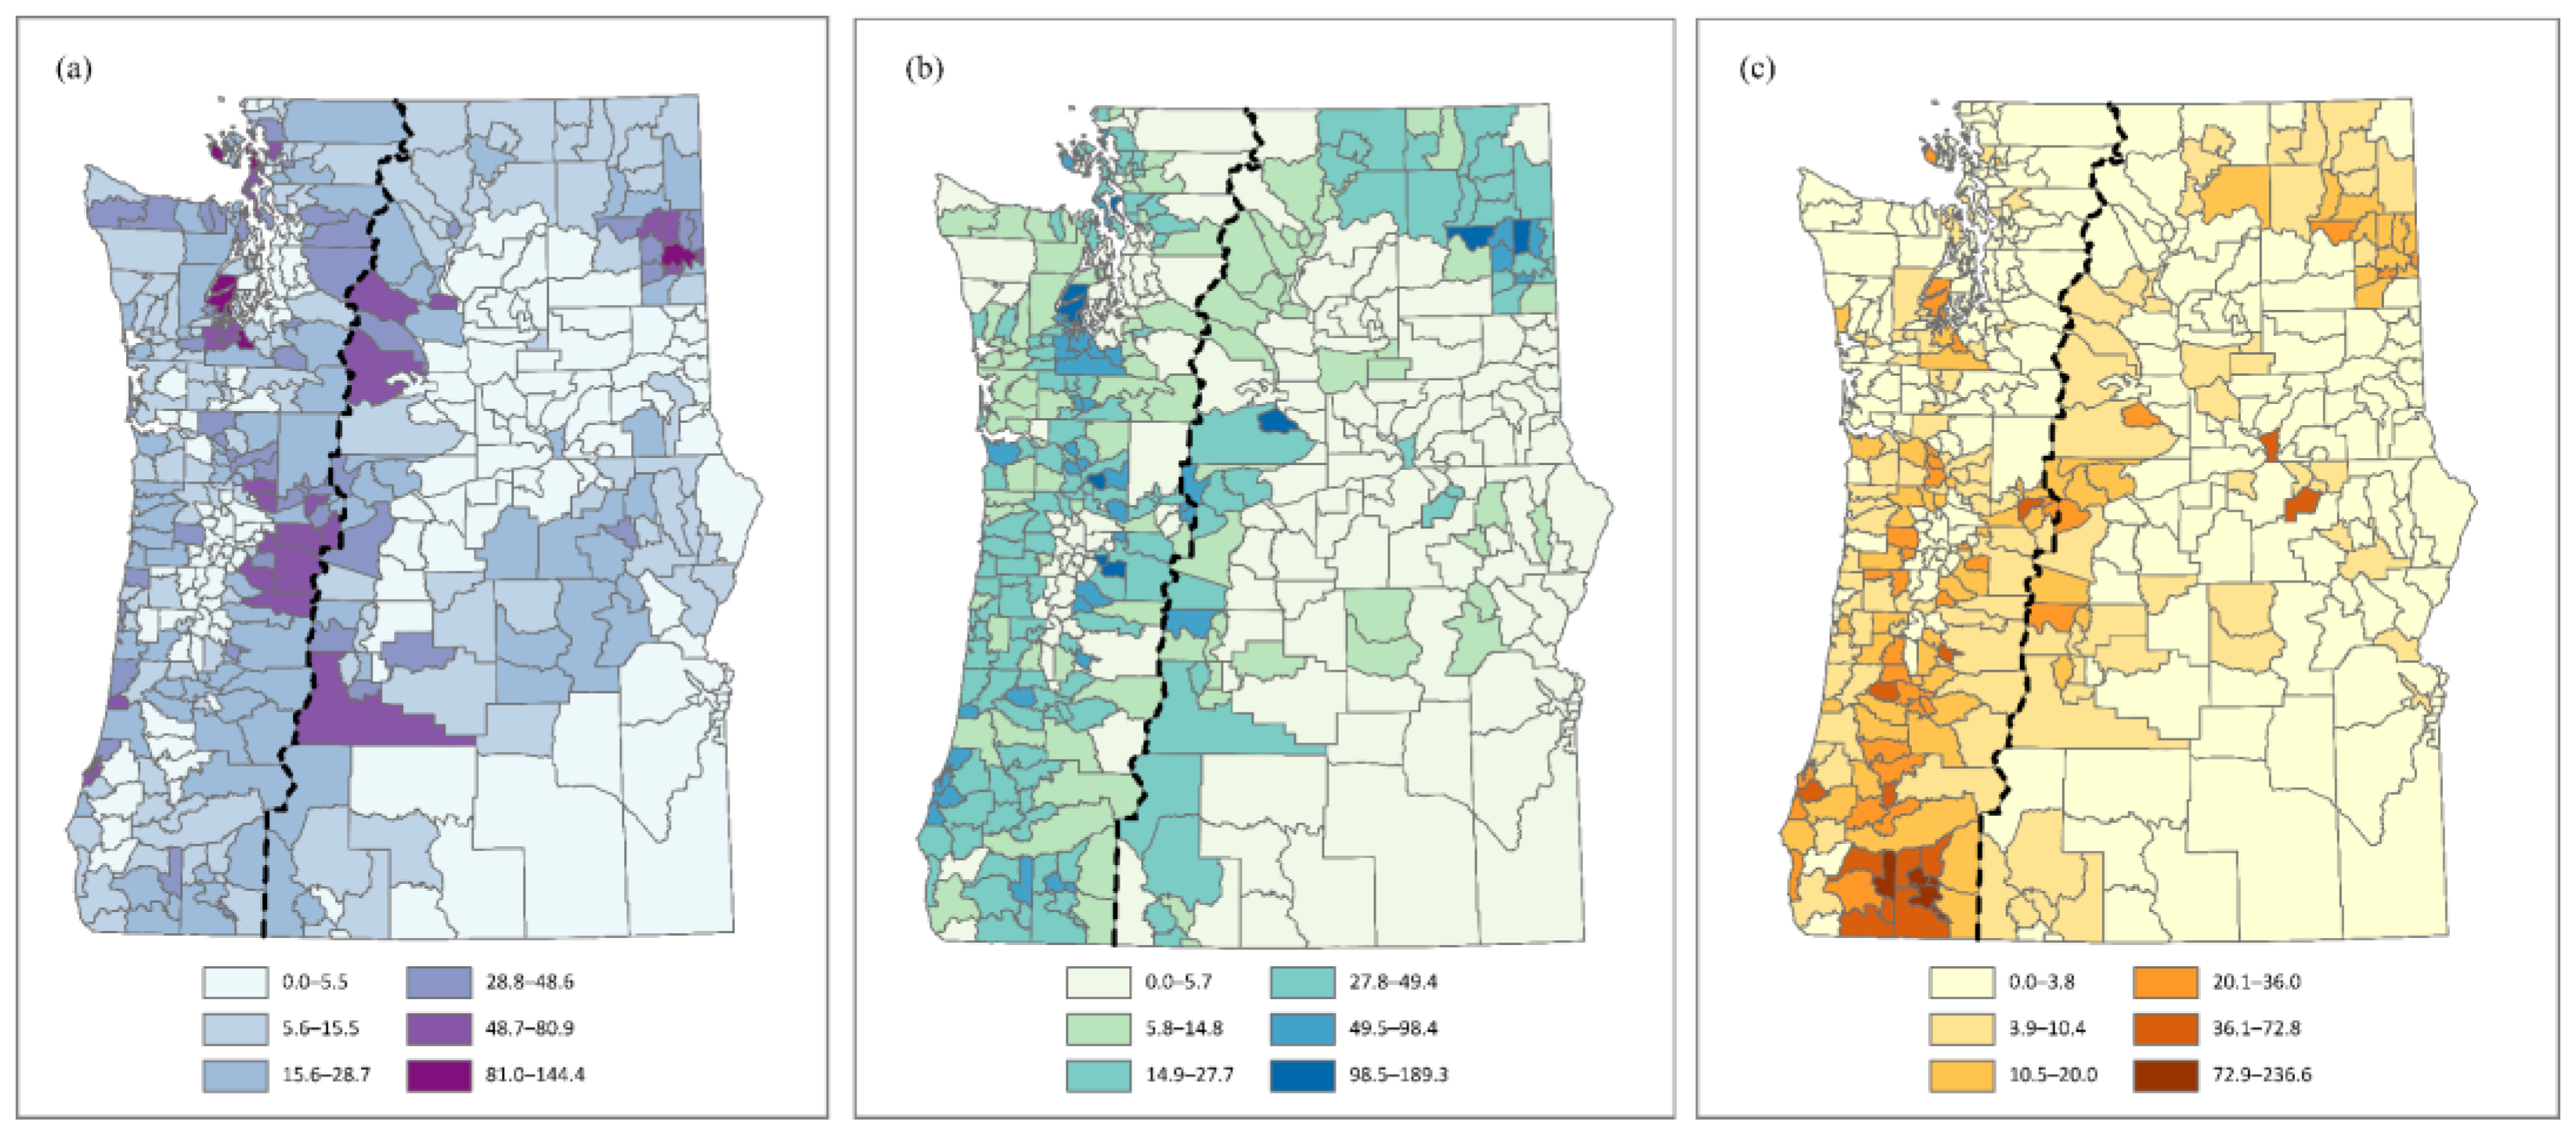

| Human Ignitions | Natural Ignitions | |||||||
|---|---|---|---|---|---|---|---|---|
| Westside | Eastside | Westside | Eastside | |||||
| Explanatory Variables | Estimated Coefficients | Odds | Estimated Coefficients | Odds | Estimated Coefficients | Odds | Estimated Coefficients | Odds |
| Intercept | 3.499 *** | 33.09 | 3.018 *** | 20.46 | 3.847 *** | 46.85 | 4.618 *** | 101.27 |
| Seasonal Housing | 0.212 * | 1.24 | −0.541 *** | 0.58 | −0.491 ** | 0.61 | 0.079 | 1.08 |
| Elder | −0.600 *** | 0.55 | −4.976 *** | 0.01 | 1.238 ** | 3.45 | 0.215 | 1.24 |
| Unemployment Rate | −1.041 *** | 0.35 | 6.708 *** | 818.54 | −0.321 | 0.73 | 4.237 *** | 69.23 |
| Household Income | 0.027 *** | 1.03 | 0.308 *** | 1.36 | −0.072 *** | 0.93 | 0.041 ** | 1.04 |
| Population Density | 0.001 *** | 1.00 | 0.004 *** | 1.00 | 0.000 | 1.00 | 0.002 *** | 1.00 |
| Summer Precipitation | −0.321 *** | 0.73 | 0.094 | 1.10 | −0.269 *** | 0.76 | 0.091 * | 1.09 |
| Summer Temperature | 0.095 *** | 1.10 | 0.008 * | 1.01 | 0.033 * | 1.03 | −0.067 *** | 0.93 |
| Klamath Ecoregion Dummy | 0.079 * | 1.08 | NA | NA | 0.177 ** | 1.19 | NA | NA |
| AIC Value | 64,727 | 40,561 | 20,131 | 33,445 | ||||
| Westside | Eastside | |||||||
|---|---|---|---|---|---|---|---|---|
| Explanatory Variables Held at: | Explanatory Variables Held at: | |||||||
| Explanatory Variables | Minimum | Mean | Maximum | Difference § | Minimum | Mean | Maximum | Difference § |
| Human Ignitions predicted values †: | ||||||||
| Seasonal Housing | 4.74 | 4.76 | 4.94 | 0.19 | 4.24 | 4.18 | 3.79 | 0.45 |
| Elder | 4.85 | 4.76 | 4.26 | 0.60 | 4.98 | 4.18 | 1.62 | 3.36 |
| Unemployment Rate | 4.84 | 4.76 | 4.48 | 0.36 | 3.60 | 4.18 | 6.60 | 3.00 |
| Median Household Income | 4.63 | 4.76 | 5.17 | 0.54 | 2.96 | 4.18 | 5.96 | 3.01 |
| Population Density | 4.76 | 4.76 | 4.77 | 0.01 | 4.18 | 4.18 | 4.18 | 0.00 |
| Mean Summer Precipitation | 5.09 | 4.76 | 3.33 | 1.76 | 5.00 | 4.18 | 4.44 | 0.56 |
| Mean Summer Temperature | 4.13 | 4.76 | 5.37 | 1.24 | 4.03 | 4.18 | 4.23 | 0.21 |
| Klamath Ecoregion Dummy | 4.75 | 4.76 | 4.83 | 0.08 | NA | NA | NA | NA |
| Natural Ignitions predicted values †: | ||||||||
| Seasonal Housing | 3.98 | 3.94 | 3.53 | 0.45 | 3.98 | 3.98 | 4.04 | 0.07 |
| Elder | 3.75 | 3.94 | 4.98 | 1.23 | 3.95 | 3.98 | 4.09 | 0.15 |
| Unemployment Rate | 3.97 | 3.94 | 3.85 | 0.11 | 3.62 | 3.98 | 5.51 | 1.90 |
| Median Household Income | 4.28 | 3.94 | 2.86 | 1.42 | 3.82 | 3.98 | 4.22 | 0.40 |
| Population Density | 3.94 | 3.94 | 3.94 | 0.00 | 3.98 | 3.98 | 3.99 | 0.00 |
| Mean Summer Precipitation | 4.21 | 3.94 | 2.74 | 1.48 | 4.78 | 3.98 | 4.23 | 0.54 |
| Mean Summer Temperature | 3.72 | 3.94 | 4.15 | 0.43 | 5.24 | 3.98 | 3.57 | 1.67 |
| Klamath Ecoregion Dummy | 3.92 | 3.94 | 4.10 | 0.18 | NA | NA | NA | NA |
| Global minimum, mean, maximum predicted values ‡: | ||||||||
| Human Ignition Density | 4.48 | 4.76 | 3.82 | −0.66 | 3.89 | 4.18 | 5.74 | 1.85 |
| Natural Ignition Density | 4.19 | 3.94 | 2.58 | 1.62 | 4.62 | 5.13 | 6.63 | 2.01 |
| Discretionary Direct Behavior | |
| Recreation and ceremony | 32% |
| Debris and open burning | 24% |
| Total | 56% |
| Discretionary Indirect Behavior | |
| Equipment and vehicle use | 13% |
| Firearms and explosives use | 0% |
| Fireworks | 6% |
| Misuse of fire by a minor | 4% |
| Smoking | 7% |
| Total | 30% |
| Institutional Behaviors | |
| Railroad operations and maintenance | 1% |
| Power generation/transmission/distribution | 4% |
| Total | 5% |
Disclaimer/Publisher’s Note: The statements, opinions and data contained in all publications are solely those of the individual author(s) and contributor(s) and not of MDPI and/or the editor(s). MDPI and/or the editor(s) disclaim responsibility for any injury to people or property resulting from any ideas, methods, instructions or products referred to in the content. |
© 2023 by the authors. Licensee MDPI, Basel, Switzerland. This article is an open access article distributed under the terms and conditions of the Creative Commons Attribution (CC BY) license (https://creativecommons.org/licenses/by/4.0/).
Share and Cite
Reilley, C.; Crandall, M.S.; Kline, J.D.; Kim, J.B.; de Diego, J. The Influence of Socioeconomic Factors on Human Wildfire Ignitions in the Pacific Northwest, USA. Fire 2023, 6, 300. https://doi.org/10.3390/fire6080300
Reilley C, Crandall MS, Kline JD, Kim JB, de Diego J. The Influence of Socioeconomic Factors on Human Wildfire Ignitions in the Pacific Northwest, USA. Fire. 2023; 6(8):300. https://doi.org/10.3390/fire6080300
Chicago/Turabian StyleReilley, Caitlyn, Mindy S. Crandall, Jeffrey D. Kline, John B. Kim, and Jaime de Diego. 2023. "The Influence of Socioeconomic Factors on Human Wildfire Ignitions in the Pacific Northwest, USA" Fire 6, no. 8: 300. https://doi.org/10.3390/fire6080300
APA StyleReilley, C., Crandall, M. S., Kline, J. D., Kim, J. B., & de Diego, J. (2023). The Influence of Socioeconomic Factors on Human Wildfire Ignitions in the Pacific Northwest, USA. Fire, 6(8), 300. https://doi.org/10.3390/fire6080300


