Article

Experimental Study on the Effect of Sub-Flash Point Fuel Temperature on the Spread Characteristics of Spill Fire

School of Environment and Energy Engineering, Anhui Jianzhu University, Hefei 230601, China
*
Authors to whom correspondence should be addressed.
Fire 2023, 6(8), 284; https://doi.org/10.3390/fire6080284
Submission received: 11 July 2023 / Revised: 23 July 2023 / Accepted: 24 July 2023 / Published: 27 July 2023

Abstract

:
The spill fires caused by liquid fuel leaks greatly threaten the safety of fuel transportation and storage. In this work, the effect of fuel temperature on the spread characteristics of flowing flames was investigated through n-butanol spilling fire experiments. The spill fire spread can be divided into three stages at different temperatures and leakage rates (I) full spread, (II) gradually extinguished spread, and (III) unable to spread. The oscillation of the flame is related to the fuel thickness and the discharge rate. As the discharge rate or temperature increases, the spread mode changes from pulsation to uniform. With an increase in temperature, the surface flow of the flame is reduced, leading to a decrease in both the preheating time and pulsation amplitude. However, the rate of liquid surface detachment from the flame increases with increasing temperature. The view factor of flame spread can be calculated by the solid flame model, and the flame influences the heat radiation spread state with stable phases or peaks. The research findings presented in this paper hold significant implications for the development of fire safety regulations pertaining to fuel leakage fires.

1. Introduction

Leakage and accidental ignition of liquid fuel during storage and transportation can easily lead to spilling fire, which is fast spreading, has a large combustion range, and is difficult to control during the spreading process. Fuel temperature during practical spilling accidents is typically lower than the flashpoint of liquid fuels [1]. Therefore, studying flame spread behaviors at different temperatures is not only helpful in predicting fire growth and reducing fire losses but also enriches our understanding of the fundamentals of fire sciences.
Many previous studies have been conducted on spilling fires. In order to investigate the combustion behavior of liquefied natural gas (LNG) spills, large-scale experiments on natural gas spill fires were conducted in the 1970s. Additionally, some analytical models of spill fires were proposed to characterize the experimental results [2,3]. However, spilling fire is a complex problem involving fluid dynamics; based on the force analysis of the flowing fuel leading edge, Chebbi and Webber [4,5,6] proposed the three-force balance of inertial force, gravity, and viscous friction in the process of liquid fuel spreading and established a liquid fuel diffusion model on land. When liquid fuel diffusion occurs on a smooth, impermeable solid surface, the steady-state fuel thickness is closely related to the amount of leakage, and the fuel diffusion process is bound to stop at some point [7]. These models focus on the performance of pool fires formed by transient spills. Actual oil spills include two types: transient spills and continuous spills [8]. In recent years, Pan et al. [9,10] systematically investigated continuous spill n-butanol fires under steady flow conditions. According to the magnitude of the leakage rate, the steady-state flow n-butanol overflow fire was divided into a low-leakage-rate heat-transfer master phase and a high-leakage-rate forced flow master phase. It also reveals the dynamic development process of the fire, such as the length of the subsurface flow and the rate of flame spread. Li et al. [11] developed a dynamic equilibrium model for a reverse overflow fire considering viscous friction, inertial forces, gravity, and surface tension. The critical leakage flow rate was calculated by hydrodynamic surface flow analysis.
Most of the current studies on the effect of the initial temperature of liquid fuels on flame propagation are directed at stationary liquids, Sirignano et al. [12] found that the fire propagation rate of liquid fuels changes dramatically when the initial temperature of the fuel reaches the flash point, and the initial temperature of the fuel is below the flash point temperature, which is dependent on the liquid phase convection preheating ahead of the liquid propagation that is the liquid-phase-controlled fire-propagation phase. Degroote and Garcia-Ybarra [13,14,15] divided ethanol with initial temperature from low to high into five regions such as stable low-speed region, pulsating region, high-speed stable region, gas-phase stable accelerated region, and stoichiometric ratio region. When the fuel is in the pulsating region, the flame spreads forward by pulsating.
In summary, the hydrodynamic analysis and flame propagation characteristics of spilling fires conducted at domestic and international levels are of great significance and application value. However, previous studies on spilling fires have mainly focused on the study of flame propagation characteristics by leakage scale, fuel leakage substrate, and environment, and the study of flame propagation characteristics for different temperatures are mostly in static fuel level conditions, while less consideration is given to the propagation characteristics of variable temperature under the coupling effect of spilling fuel layer and flame propagation heat transfer. Liquid fuels will be transported and stored below the flash point temperature. Therefore, a series of experiments were systematically conducted in this study to investigate the flame spread characteristics at different initial temperatures and leakage rates.

2. Experimental Setup

The experiments were conducted in a closed laboratory to avoid the influence of ambient airflow. The main part of the experimental setup is a custom-made 304M stainless steel fuel tank with an internal width of 4 cm, a length of 100 cm, and a depth of 1.5 cm. In order to simulate the spilling fire situation of fuel spillage, the interior of the fuel tank is divided into five zones from left to right, the fuel inlet zone (10 cm), the stable inflow zone (10 cm), the effective observation zone (60 cm), the stable outflow zone (10 cm), and the collector zone (10 cm). A porous flow stabilizer was installed at the inlet of the flow tank to stabilize the flow of n-butanol at the inlet. The n-butanol fuel was cooled or heated by a water bath before the experiment started. A peristaltic pump with six rollers was selected to provide power to ensure a stable fuel flow. A rotational speed from 30 to 600 rpm, interval 30 rpm was used to do a set. The fuel flows out of the overflow port into the recovery fuel drum, and a U-tube connects the backflow pipe to prevent the flame from flowing down into the recovery fuel drum. Two lifting platforms were installed at two ends of the tank to keep it horizontal by adjusting the height of the two brackets. The 0.5 mm-diameter K-type thermocouples are arranged as shown in Figure 1 to measure the temperature change above the liquid surface, the surface of the liquid layer, and the bottom of the fuel, respectively. Two groups of thermocouples are layout in the same way, and module is 8 HZ. The total heat flow meter and the radiation heat flow meter are fixed at the acquisition frequency of the acquisition the same level on the upper surface of the middle of the flow tank. Additionally, before ignition started, the peristaltic pump was turned on to let the fuel spill freely to the stable flow, and the velocity of the liquid surface was obtained by recording the tracer particle position in relation to time by the camera. N-butanol fuel with a flash point temperature of 38 °C cannot be ignited directly, and by adding two drops of n-heptane as an accelerant in the stable inflow zone when the flame spreads to the outflow area it is then extinguished through the fireproof heat insulation plate cover. The flame spread process is recorded by two cameras facing and looking down, and the flame front and flame height information can be obtained by Matlab program processing.

3. Results and Discussion

3.1. Fluid Dynamic Analysis of Continuously Spill Fuel

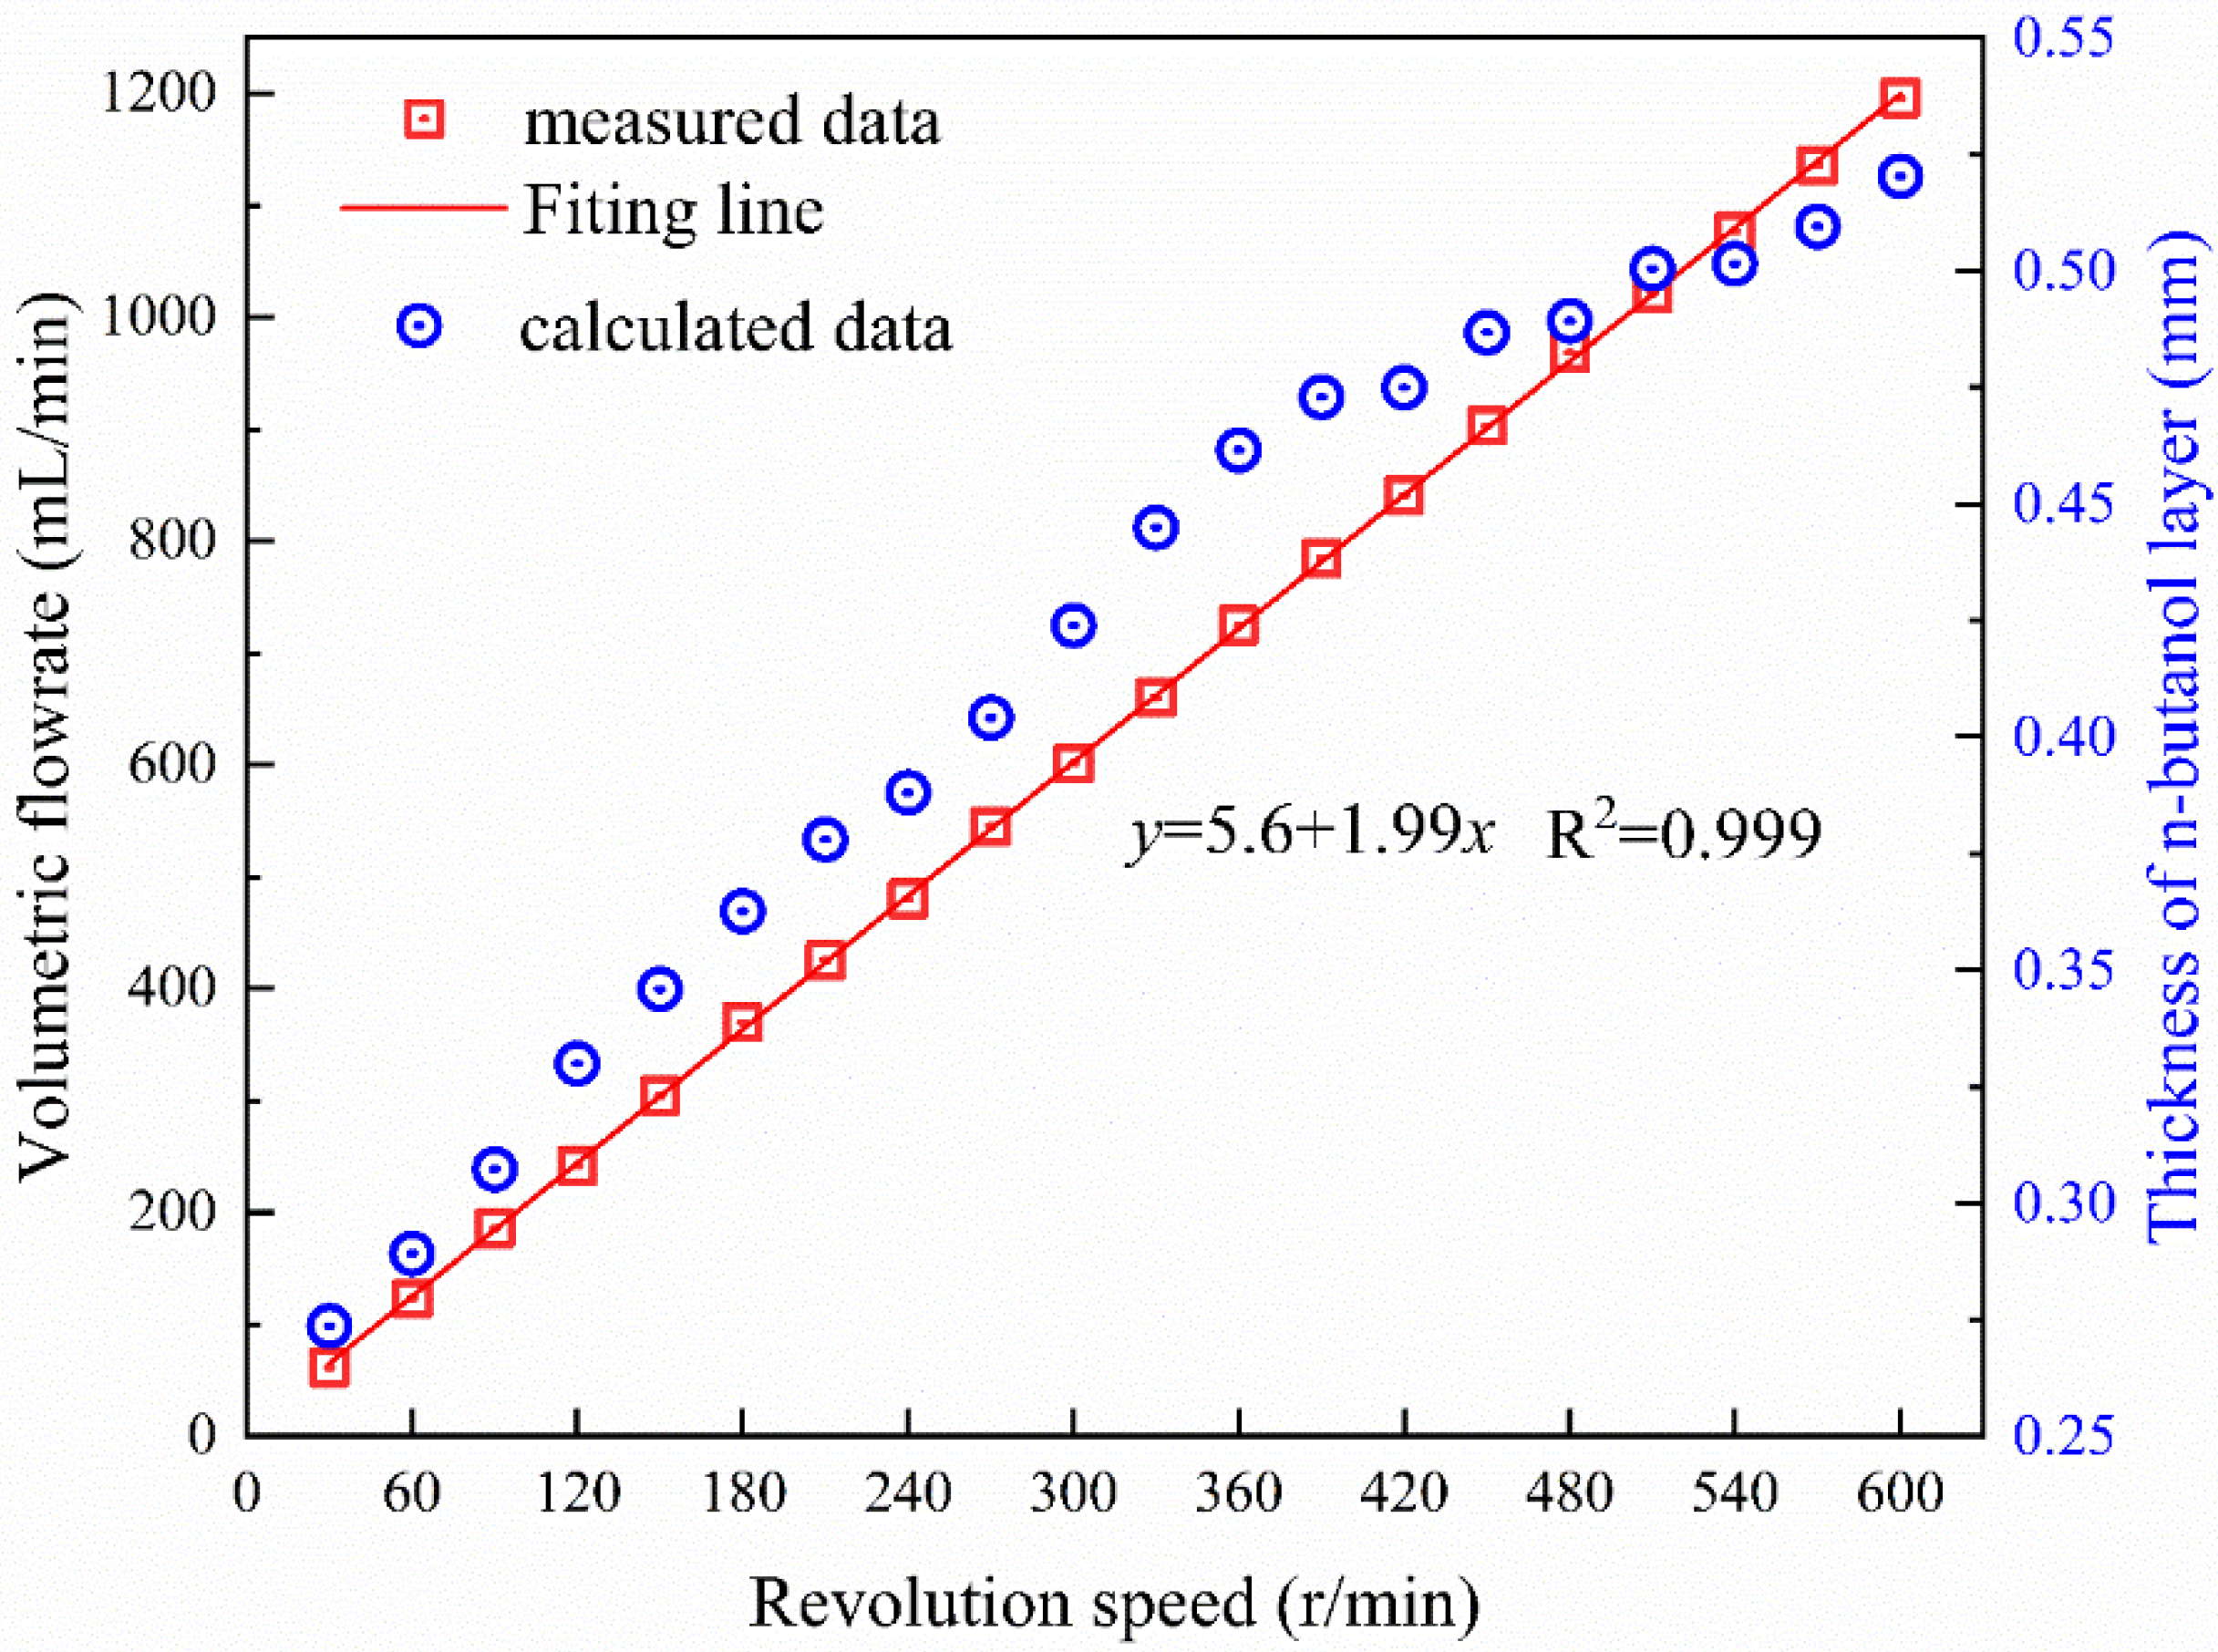
The relationship between peristaltic pump speed and the mass flow rate was obtained by electronic balance before the experiment. The n-butanol fuel temperature is 20 °C, n-butanol physical parameters are as shown in Table 1. The effect of bulk density does not exceed 1.25% when comparing n-butanol at 30 °C and 15 °C, so ignore the effect of temperature on the change with the volume. The speed of the peristaltic pump r and the discharge rate Q of n-butanol satisfy the relationship in Equation (1):
Q = 5.6 + 1.99 r
The flow state of the continuously spilling n-butanol fuel in the open trench is determined by the Reynolds number [9].
Re = ρ u d e μ
where μ is the liquid dynamic viscosity coefficient, d e is the equivalent diameter, ρ is density, and u is liquid surface spill flow velocity. Assuming that the flow of continuously leaking n-butanol is similar to the flow of liquid in the pipe, the equivalent diameter of the rectangular flow trough can be expressed as Equation (3)
d e = 4 A U
where A is the cross-sectional area, A = D × δ , U is the wet perimeter, U = D + 2 δ , D is the width of the tank, and δ is the height of the fuel layer. When the discharge rate is 1195 mL/min, considering the effect of the initial temperature of the fuel, the maximum Reynolds value is 698, far less than the critical Reynolds number 2300, so the flow state of the fuel in the rectangular flow tank is regarded as laminar flow. According to the one-dimensional flow model of fluid mechanics, the fuel layer thickness is calculated according to the volume conservation:
δ = Q v D
The laminar flow of fuel in the channel, which can be regarded as intra-tubular flow, and the average flow rate of the fuel layer cross-section can be expressed as υ = u / 2 [9]. The relationship between the thickness of the fuel layer and the variation of the leakage rate is shown in Figure 2, the minimum thickness of the fuel layer is 0.27 cm, and the maximum thickness is 0.52 cm; in contrast to the oil pool fires, which can be considered as an infinitely deep pool when the depth of the fuel layer exceeds 2.5 cm [16], the thickness has almost no influence on the flame spread. However, the fuel layer may not be able to ignite when it is too thin, so the power of the thickness on the flame spread in this experiment cannot be neglected.
Table 1 shows the physical parameters of n-butanol at different temperatures below the flash point. Although the temperature change has little influence on the thermal conductivity of n-butanol density, it has a greater effect on the change in vapor pressure: with the increase in temperature, the vapor pressure becomes larger, and the greater the vapor pressure, the more n-butanol is volatile. Additionally, the flame spread strongly depends on the fuel vapor concentration [17].
Table 1. Physical parameters of n-butanol [18].
Temperature
(°C)
Density
(g/cm3)
Surface Tension
(N/m)
Specific Heat Capacity
[J/(g·°C)]
Thermal Conductivity
[W/(m·°C)]
Vapor Pressure
(kPa)
150.813625.12.3450.16770.40
200.810024.72.3720.16700.56
250.862524.32.4040.16630.87
300.802523.92.4360.16561.19

3.2. Flame Spread Appearance

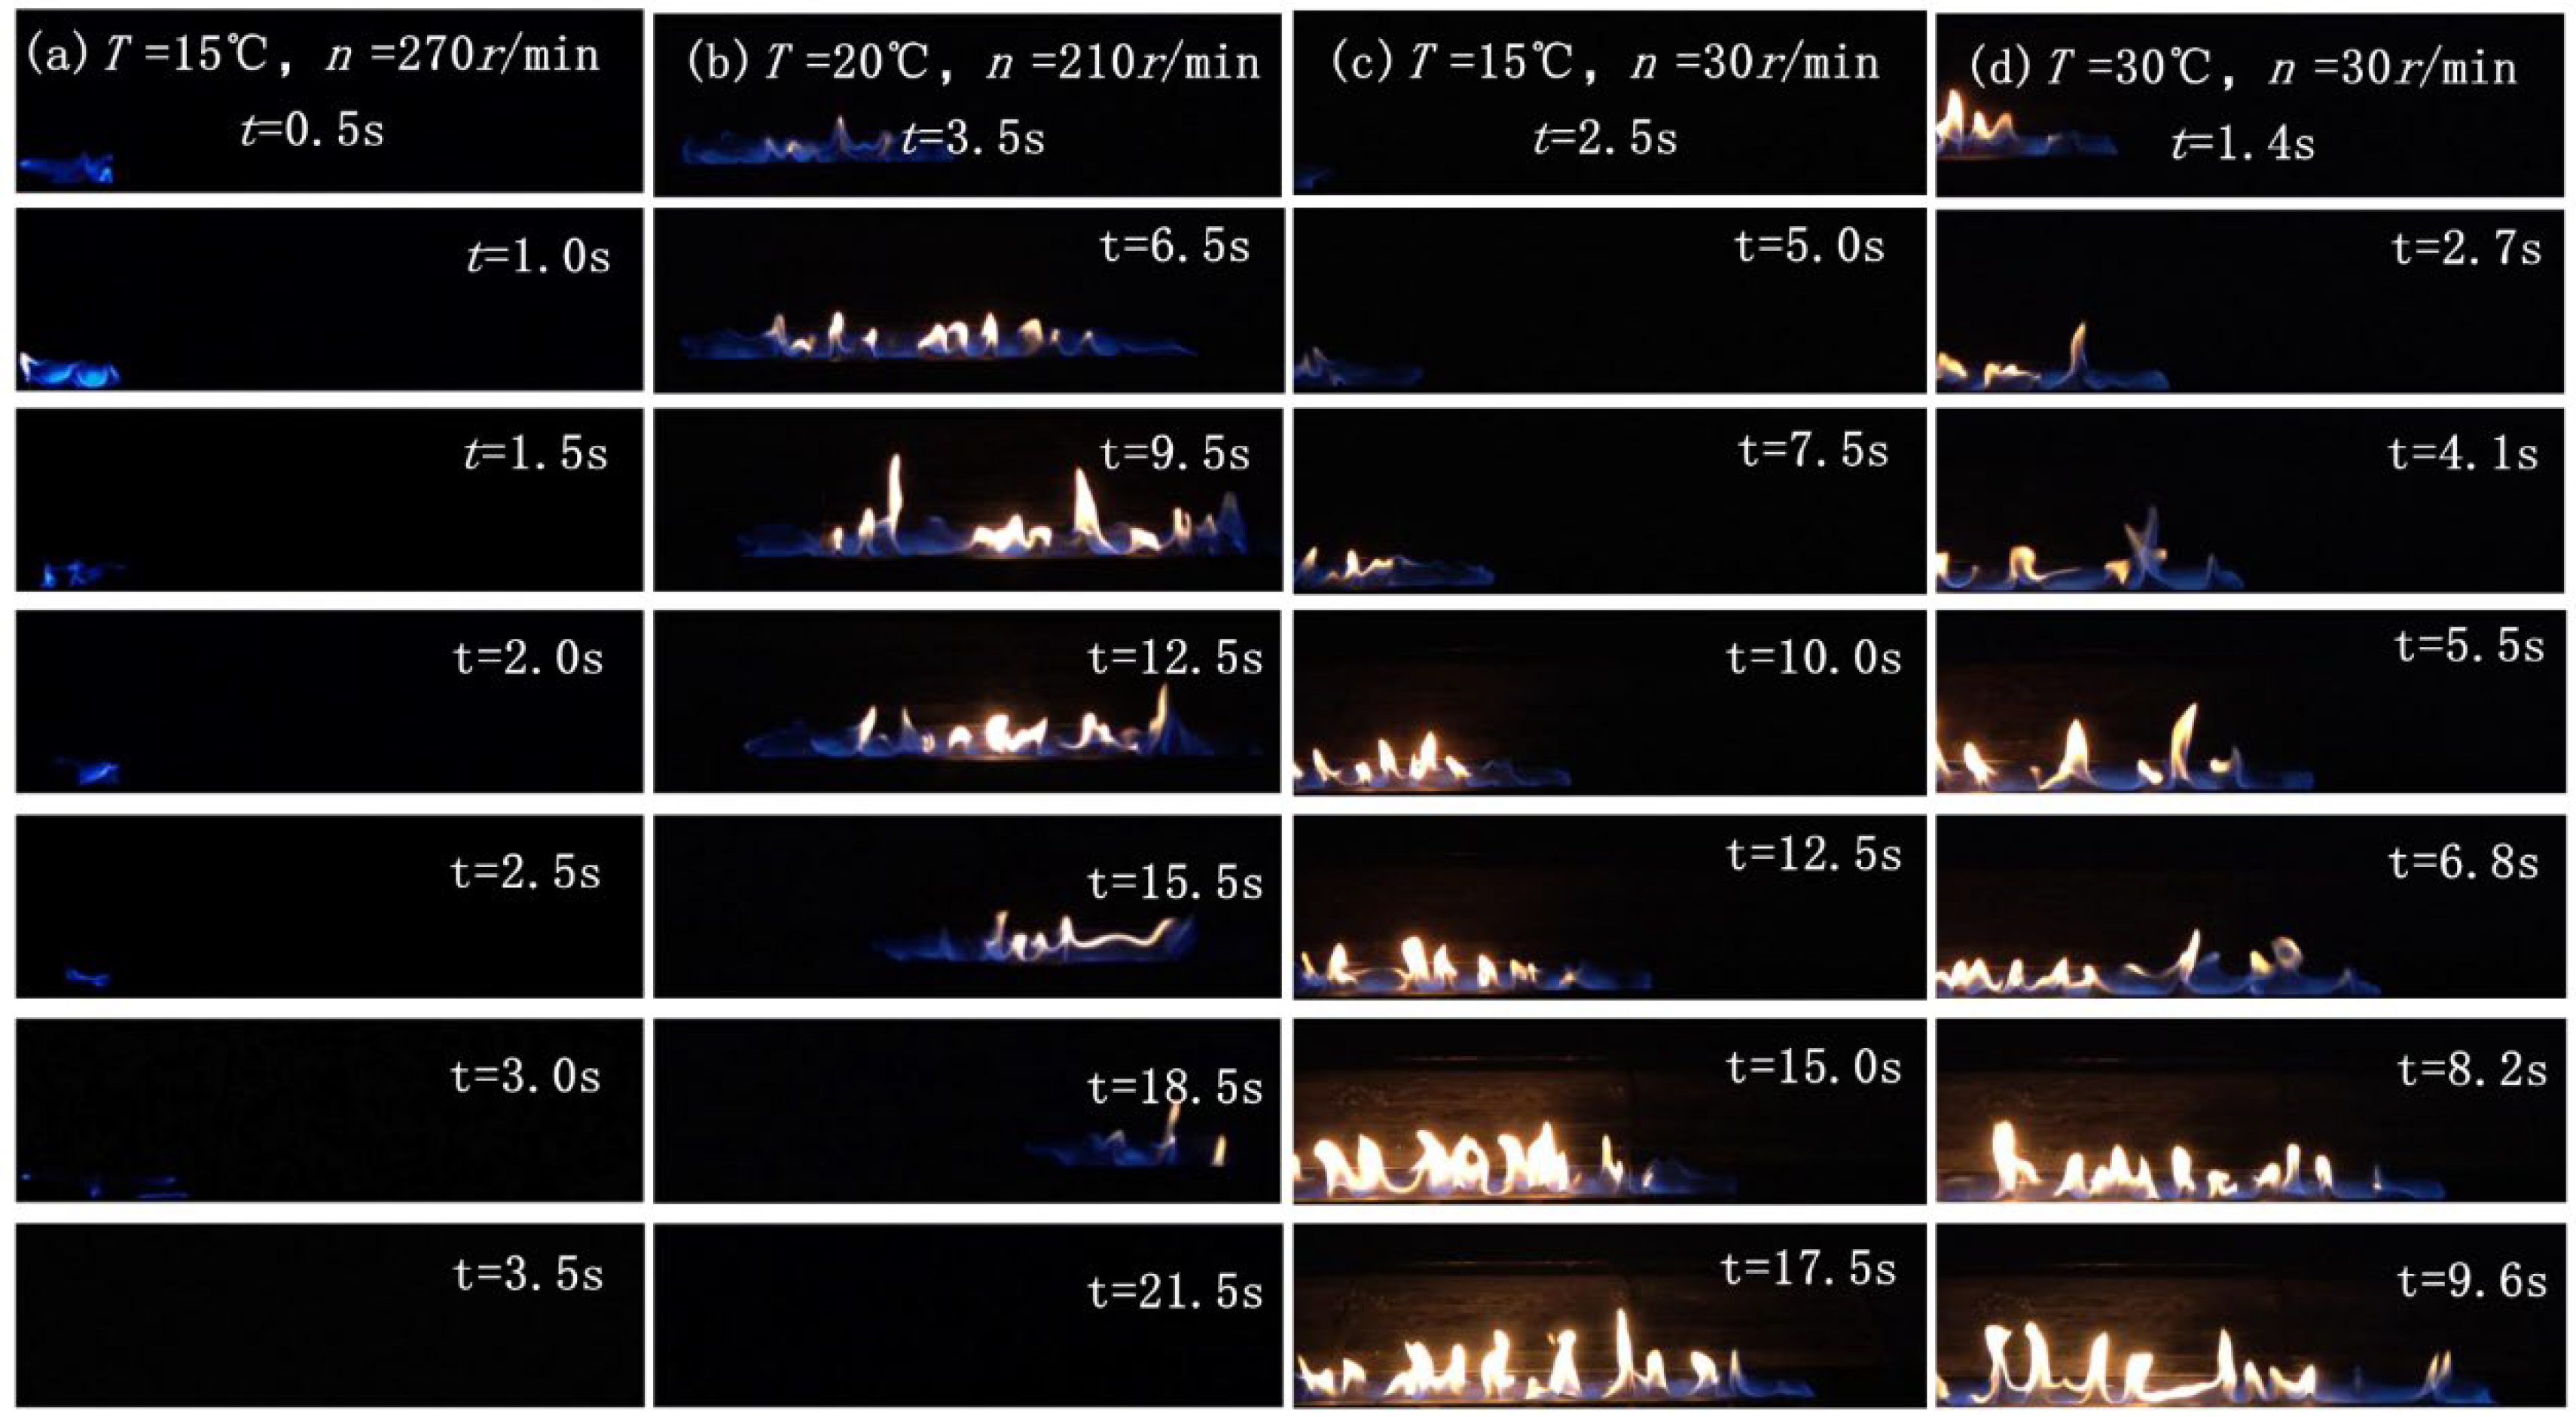
As shown in Figure 3, the flame spread appearance changes at different temperatures. In the same liquid surface velocity, the flame spread rate becomes faster with the increase in temperature. Taking rotational speed n = 30 r/min, T = 15 °C, and 30 °C as an example, the time of flame spreading to the end is 17.5 s and 9.6 s, respectively. The flame spread speeds were 3.4 cm/s and 5.1 cm/s. The flame front is a continuous blue flash flame, followed by a yellow main flame. The spread of the flame can be divided into three types; (I) full spread, (II) gradually extinguished spread, and (III) unable to spread.
In the case of higher temperatures or lower leakage rates, such as in Figure 3c,d, the flame-front blue flash flame gradually spreads forward, and the yellow flames gradually form in the rear, which eventually fills the entire flow tank. At n = 210 r/min, T = 20 °C, although the forward flash flame and the main flame spread forward, the main flame that began on the left side of the flame was extinguished while the flame spread, which eventually led to the flame spread gradually being extinguished, as shown in Figure 3b.
The flame cannot spread over the fuel surface as the temperature is 15 °C, and the discharge rate is 545 mL/min, even if it is ignited by n-heptane, a pulsating flash blue flame will appear on its surface, and the flame front will eventually extinguish after experiencing a large pulsation amplitude of the front pulsation as shown in Figure 3a. The states of flame spread at different temperatures and discharge rates are shown in Table 2.

3.3. Flame Spread Rate

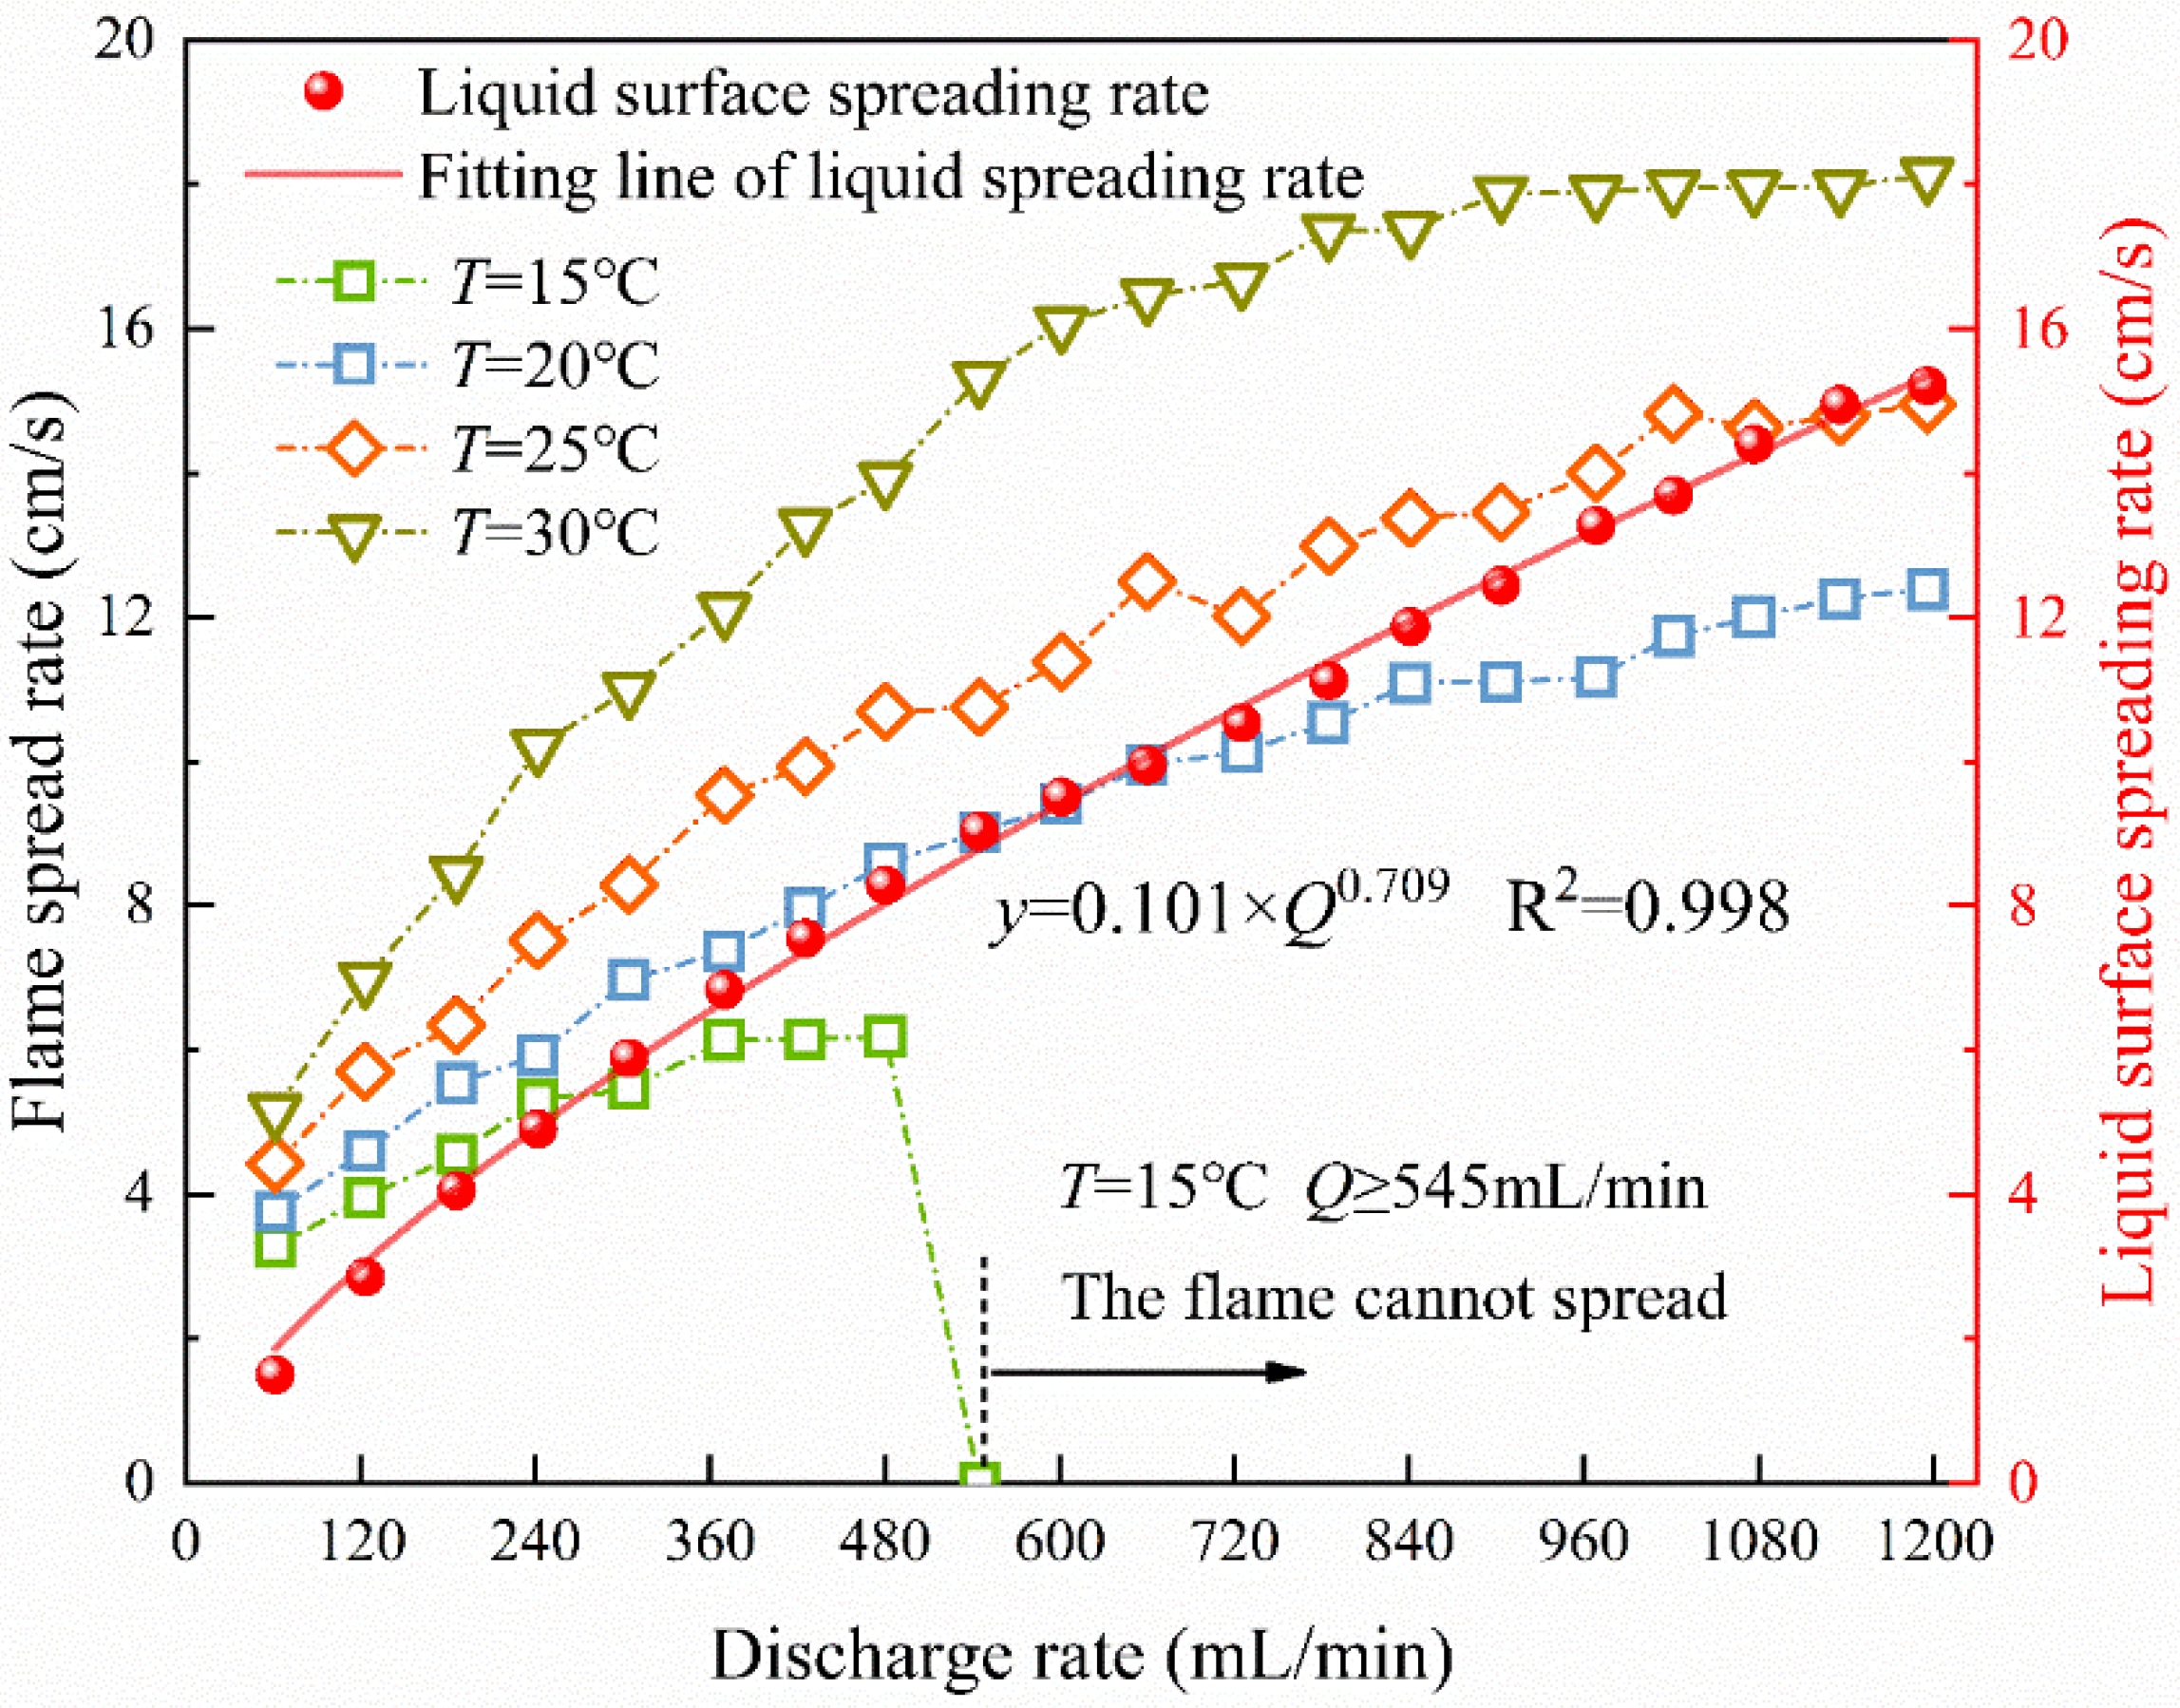
At a constant flow rate, the liquid fuel flow in the stainless-steel fuel tank can be considered a uniform flow, ignoring the small amount of fire consumption during the spreading process. There is a power function relationship between the discharge rate and the liquid surface spreading rate u [19]; the fitted function is shown in Figure 4.
For stationary liquid surface fire spread, when the initial temperature is below the flash point temperature, liquid-phase convection exists in front of the flame front [13], which convection heats the unburned fuel surface in front. The combustible vapor above the fuel exceeds the lower combustion limit when the initial temperature exceeds the flash point temperature, and the flame propagates forward in a premixed mode [14]. However, when the initial temperature of the fuel is greater than the flash point, pulsating fire spread does not occur, so this work focuses on the study of spilling fire under liquid phase spread. The flash point temperature of n-butanol is 38 °C, and the maximum experimental temperature is 30 °C. The rate of liquid phase spread of alcohol fuels is 10 cm/s [20]; however, in this work, the flame front spread rate is much greater than this value (maximum 18.13 cm/s), and the flame spread rate increases with the increase in the liquid flow speed, which is due to the no-slip drag effect of the liquid surface on the flame spread, promoting the flame spread rate [9].
The relationship between the flame spread rate and the discharge rate is shown in Figure 4. The flame spread rate increases with the increase in temperature at the same discharge rate. This is because as the initial temperature increases, the initial concentration of the fuel vapor and the energy required to heat the fuel to reach the evaporation temperature decrease, and the preheating time decreases. Moreover, the flame spread rate increases exponentially with the increase in temperature [21]. Therefore, the flame spread rate increases significantly when the initial temperature is 30 °C. As the initial temperature of the fuel is T = 15 °C, Q ≥ 545 mL/min, the flame cannot spread. However, whether the full spread or gradually extinguished spread, the flame front spread rate increases with the discharge rate, but the increase’s magnitude becomes smaller.
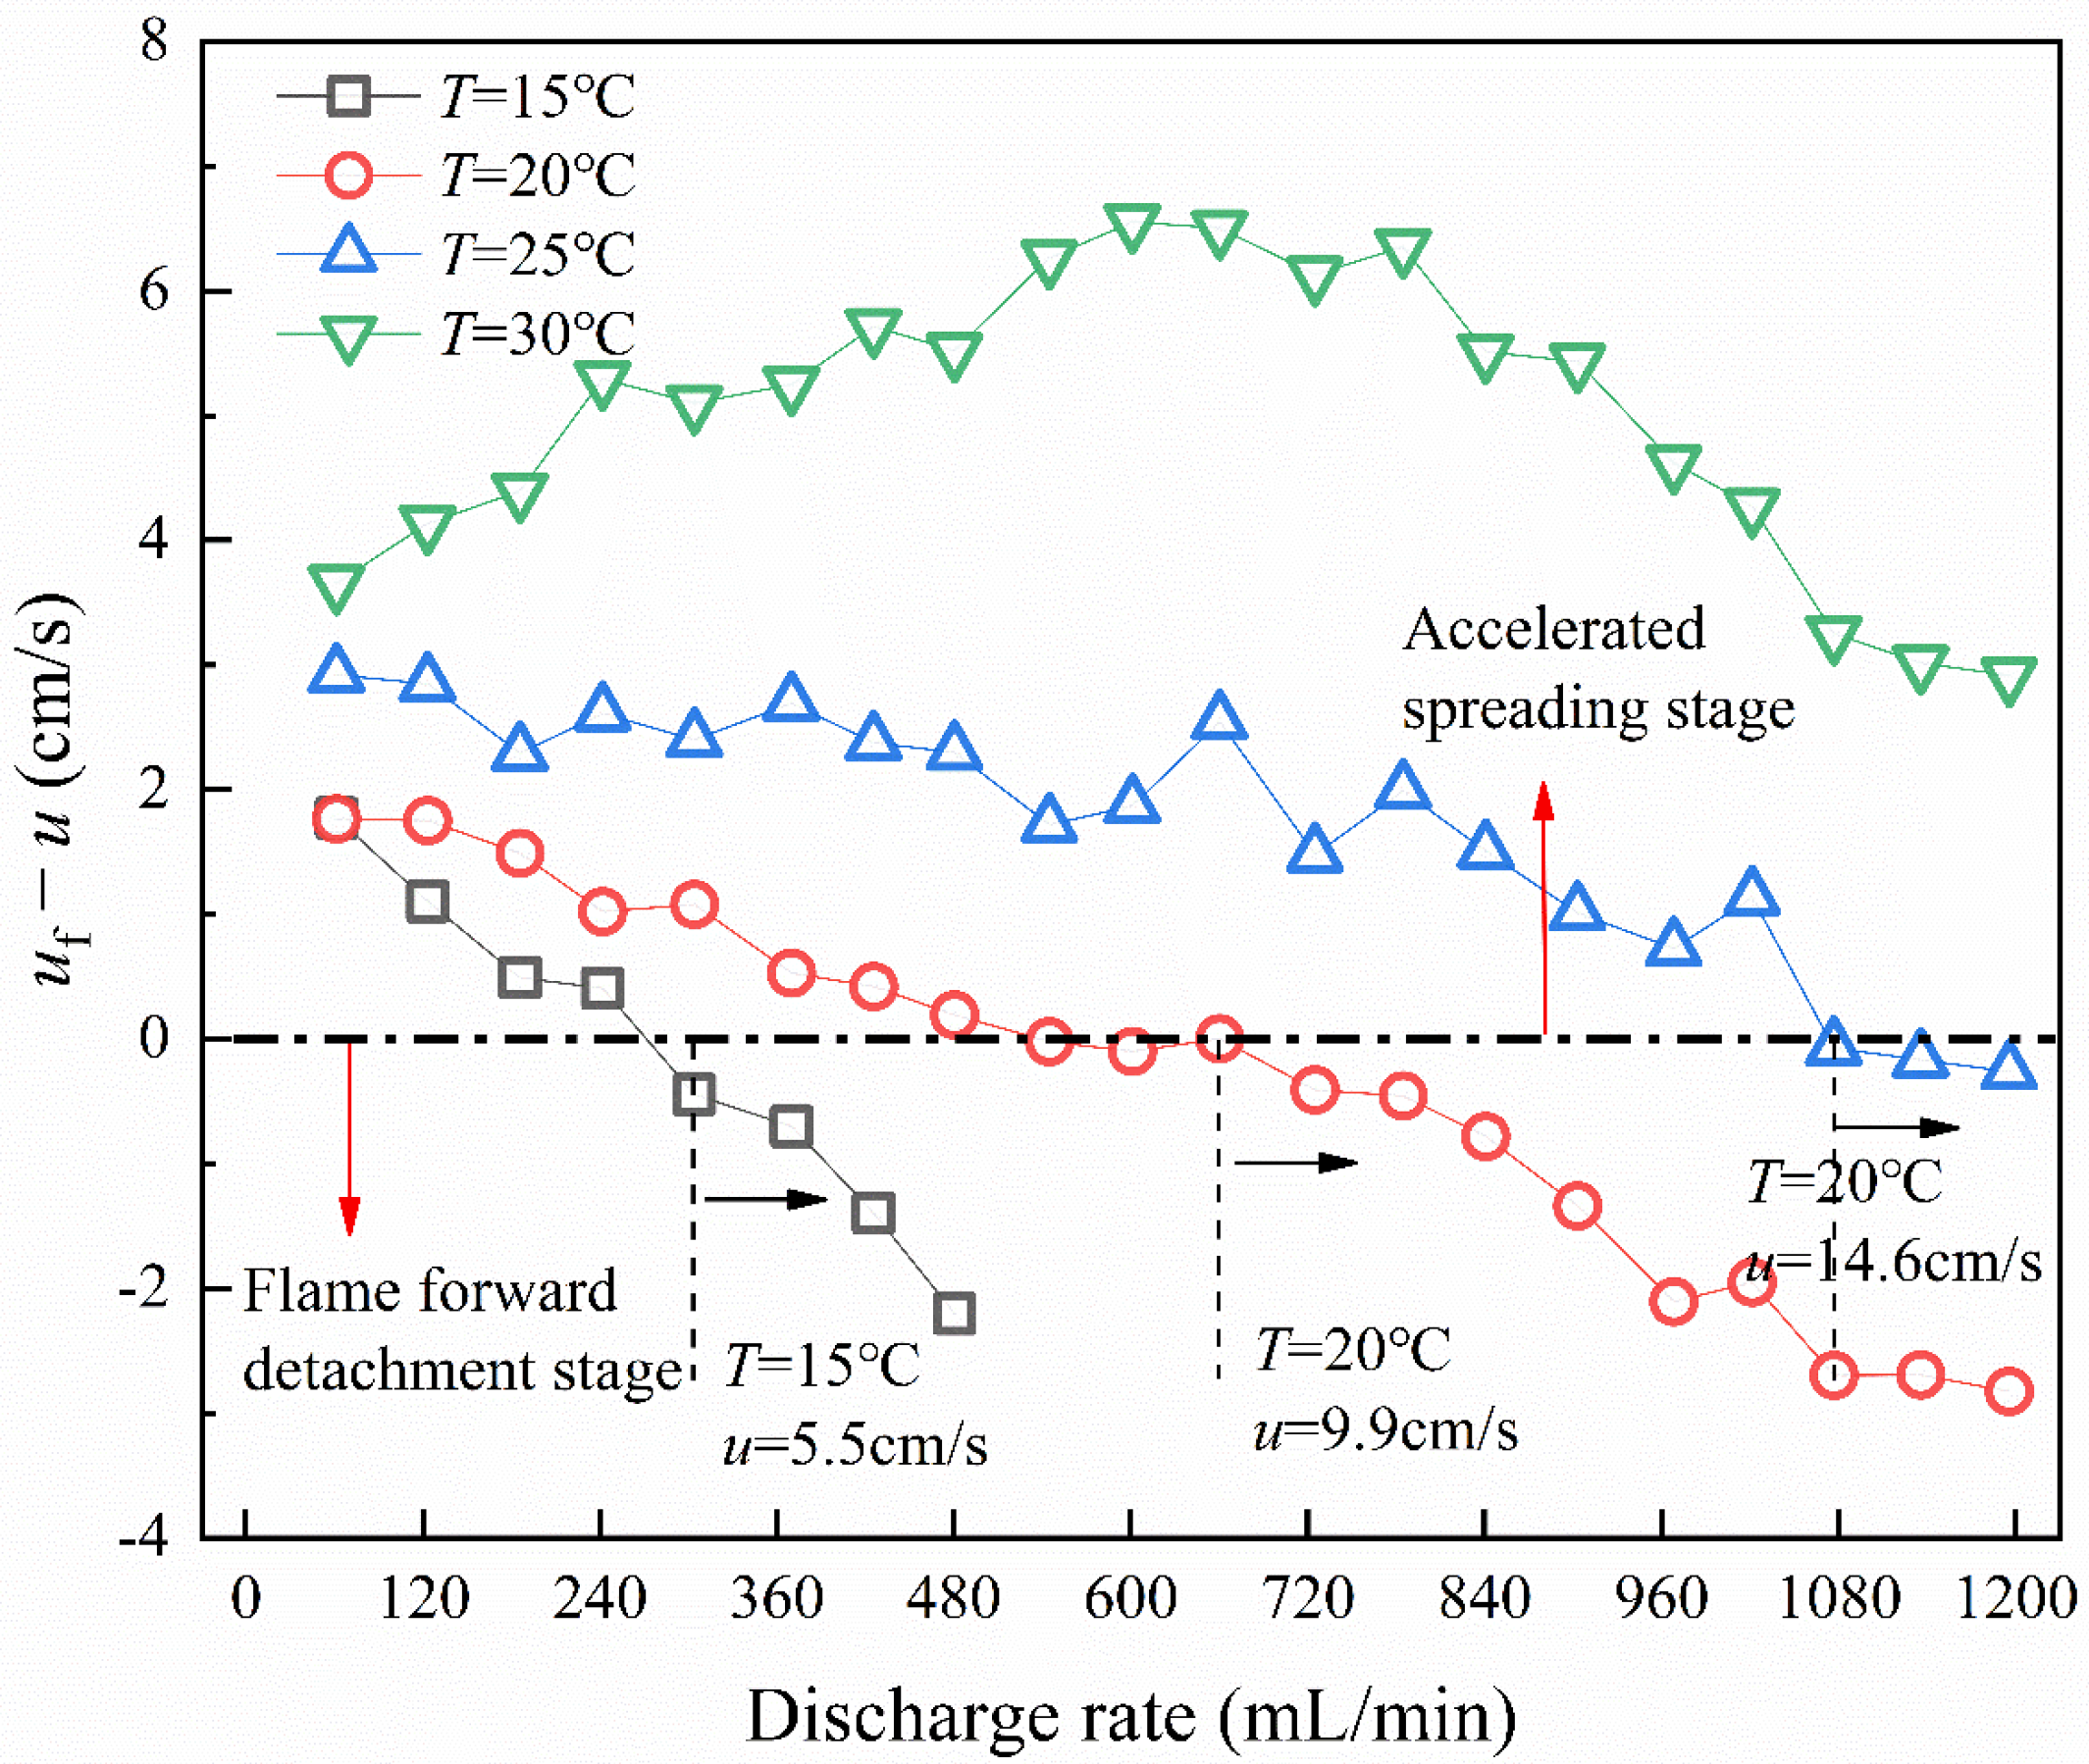
The relative velocity of flame spread and liquid surface velocity (ufu) is shown in Figure 5. The influence of different liquid surface velocities on the flame spread rate can be divided into the acceleration stage and the flame detachment stage [9]. In the acceleration stage, ufu > 0, the flame spread rate increases with the increase in the liquid spill flow velocity. This is because the flow of n-butanol accelerates the subsurface flow and thus promotes flow preheating. In the gas phase, the gas phase vapor on the fuel surface is dragged forward by the no-slip boundary of the liquid phase, causing the concentration of vapor at that location on the fuel surface in front of it to rise and promote the flame to spread forward [22]. Apparently, the fuel temperature is 30 °C, and the liquid spill flow velocity to the flame front is the acceleration stage.
In the flame detachment stage, ufu < 0, the liquid spill flow velocity is greater than the flame spread rate, and the detachment rate of the liquid surface velocity to the flame spread reduces with the decrease in temperature. Due to the fast flow rate at this time, the front surface flow cannot be preheated in time, in addition to the gas phase steam which has inertia force and lags behind when it is dragged by the liquid surface [23], so the flame front cannot keep up with the liquid surface. The lower the temperature, the more heat is needed to preheat the fuel front to reach the combustible vapor, and the flowing liquid removes a large amount of heat through convection heat transfer, so the flame spread reaches the detachment stage at a smaller liquid spill flow velocity.

3.4. Flame Front Pulsation

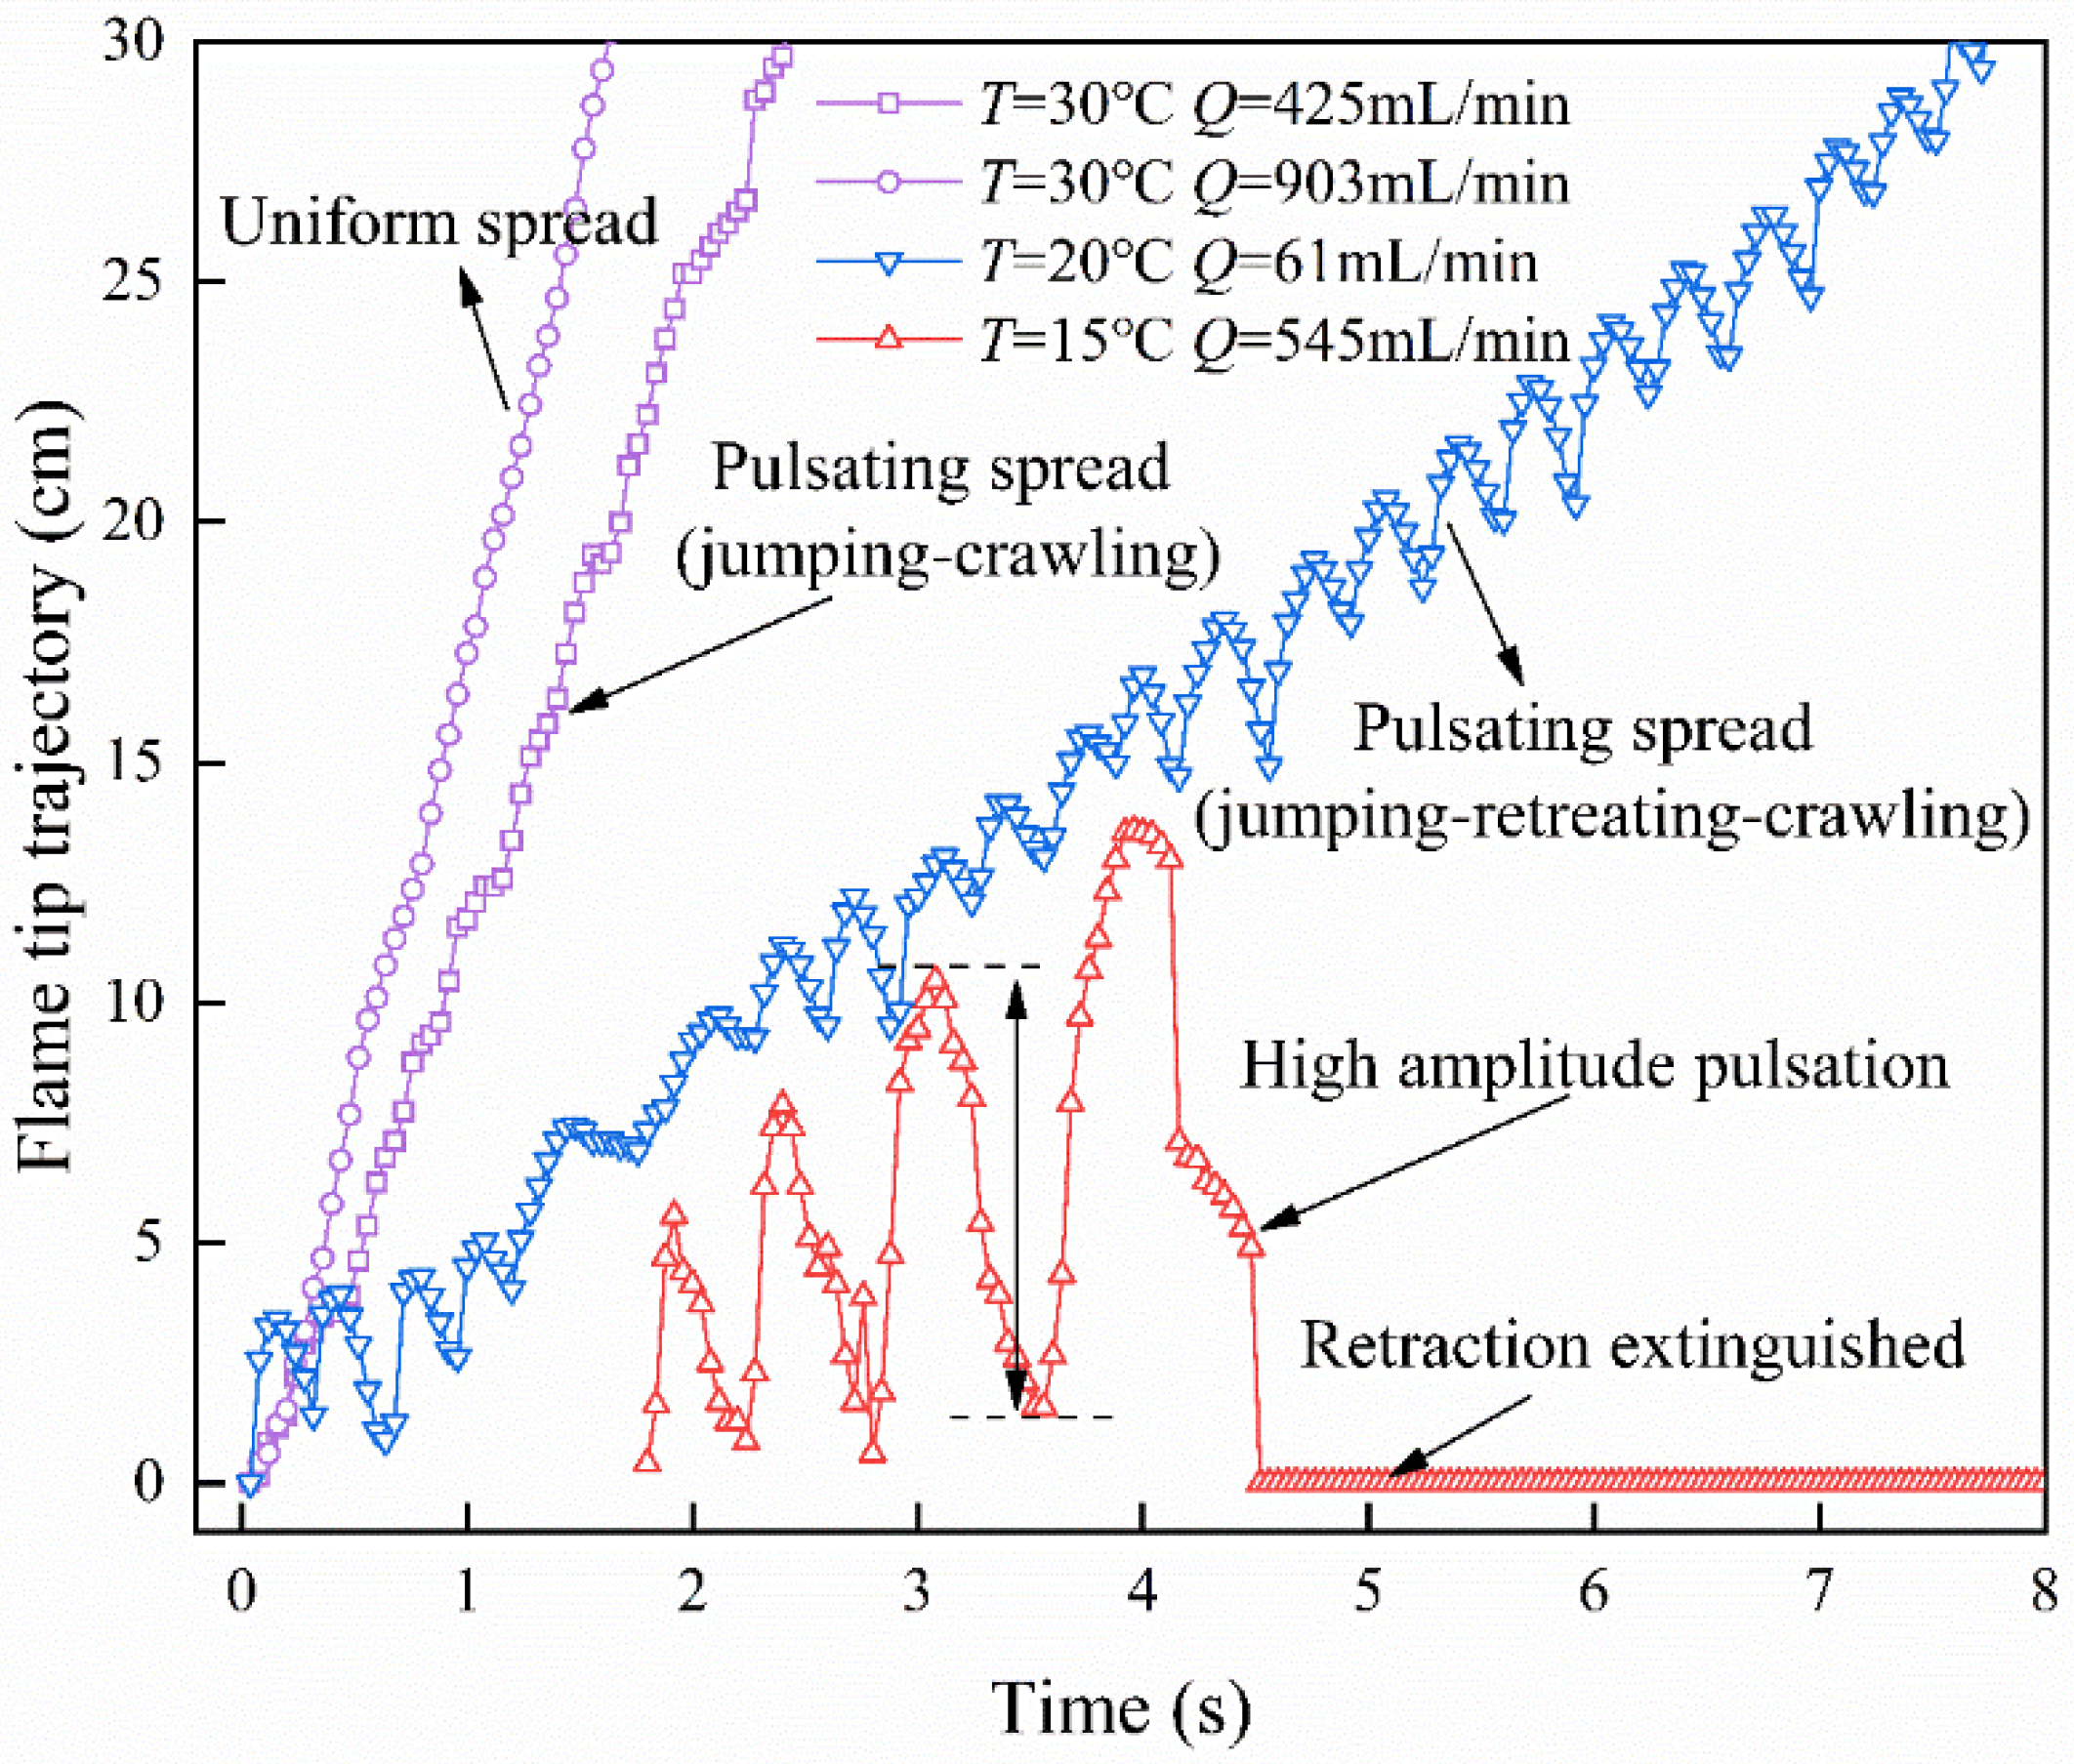
For the steady flow of n-butanol at a constant temperature of 20 °C, flame propagation can occur via “uniform spread”, “jump-crawl”, and “jump-retreat-crawl” spread modes [24]. Similarly, at different temperatures, flame propagation of spilling fire involves these three modes, as shown in Figure 6, and the flame spread mode transitions from pulsating spread to uniform spread with increasing discharge rate at different temperatures. At T = 15 °C, Q ≥ 545 mL/min, the flame cannot spread, and a blue flash flame is generated after ignition by n-heptane. The flash flame is extinguished after several large jump-retractions. This is due to the fuel liquid surface being ignited by n-heptane; the fuel surface vapor reaches the critical conditions for flash ignition, resulting in a flash flame. However, at this time, the fuel temperature is much lower than the flash point, the liquid spill flow velocity is large (9 cm/s), the front vapor is ignited, and the flame front quickly jumps to spread because the vapor is quickly consumed and unable to preheat the liquid surface in time, so it cannot continue to meet the conditions for the flame to spread forward. The flame front quickly retracts to a position where it can maintain combustion. However, after repeating several times, the heat to maintain the fuel vapor is taken away by the flowing liquid through convection [10] finally, the flame spread is extinguished.
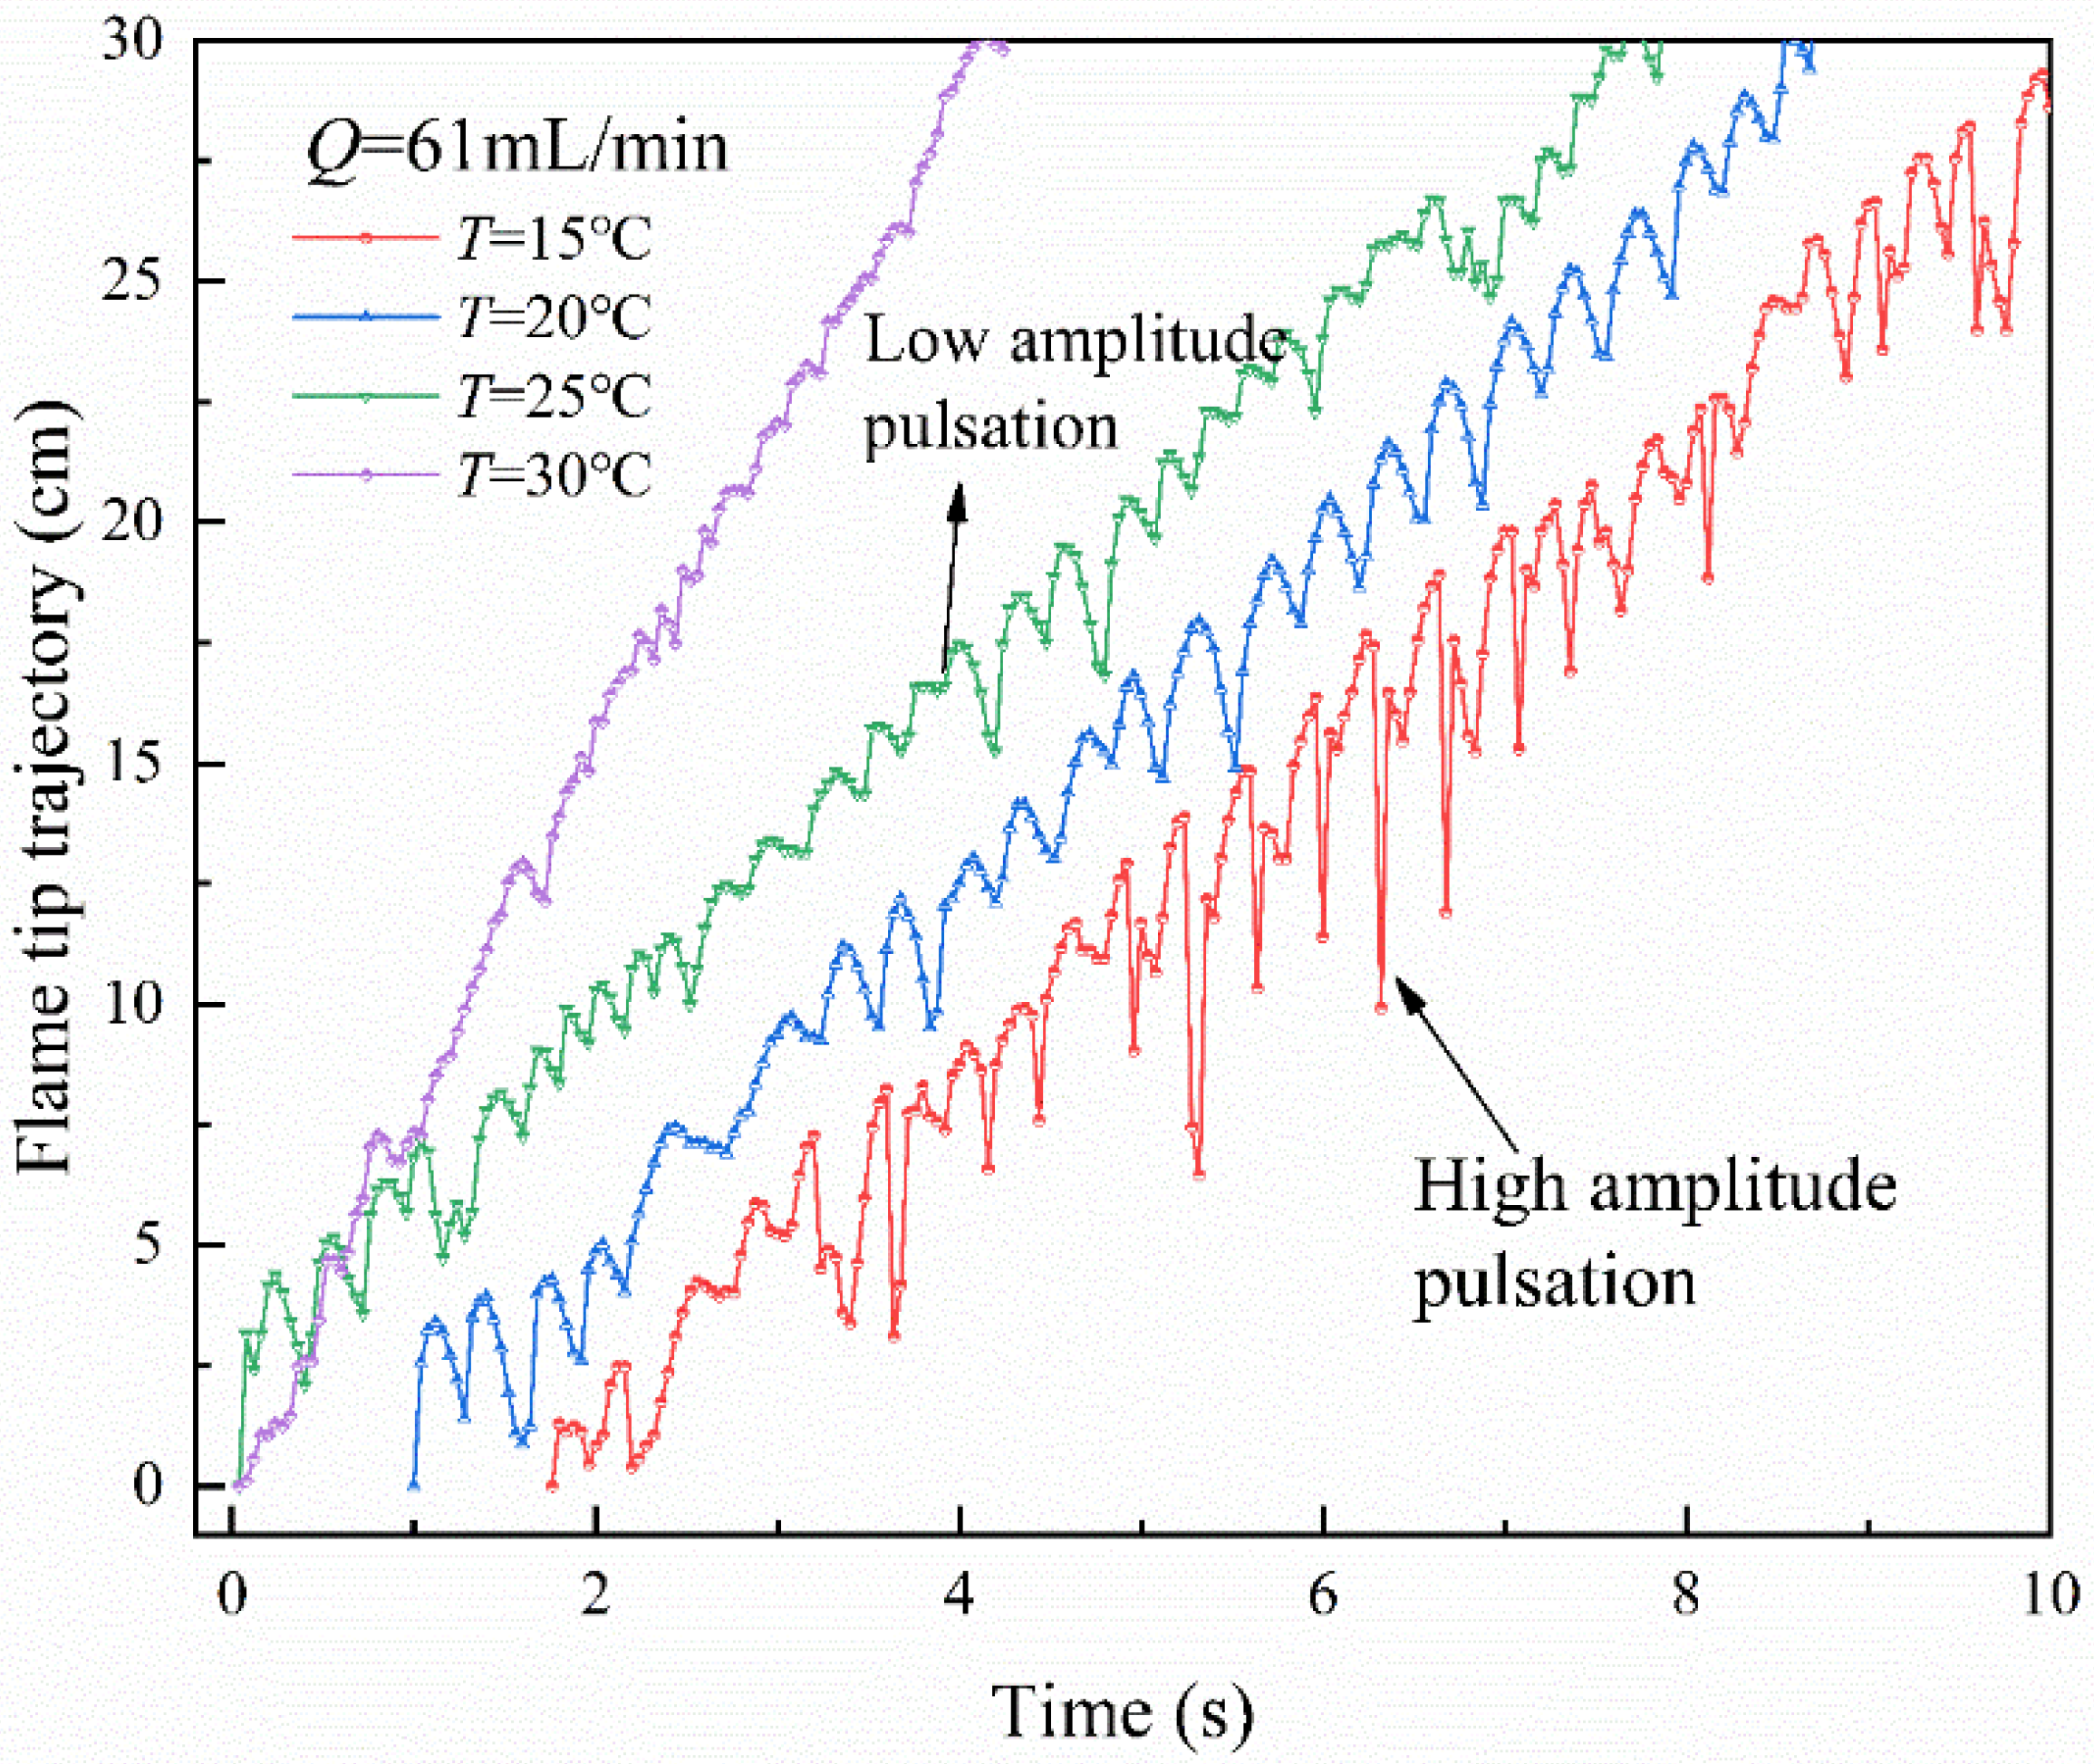
The trend of the pulsation trajectory of the flame front with temperature as shown in Figure 7. The pulsation amplitude of the flame front reduces with rising temperature. First, the retraction of the pulsation is because the rapid consumption of combustible vapor makes the liquid surface where it is located unable to meet the combustion conditions, and when the initial temperature of the liquid surface increases, the length of the surface flow reduces [25] and the preheating fuel time is shortened, so the retraction time and distance decrease. Second, for flame spread in thin fuel layers, the viscous effect of the bottom steel plate or the pool’s side wall will impede the movement of the liquid-phase convection, resulting in a smaller size of the liquid-phase vortex [26]. Thus, it is easier for the flame front to catch up with the subsurface flow front; meanwhile, more energy will stay near the flame front when the size of the liquid-phase vortex is attenuated, and therefore the magnitude of flame pulsation will be smaller.

3.5. Temperature Distribution

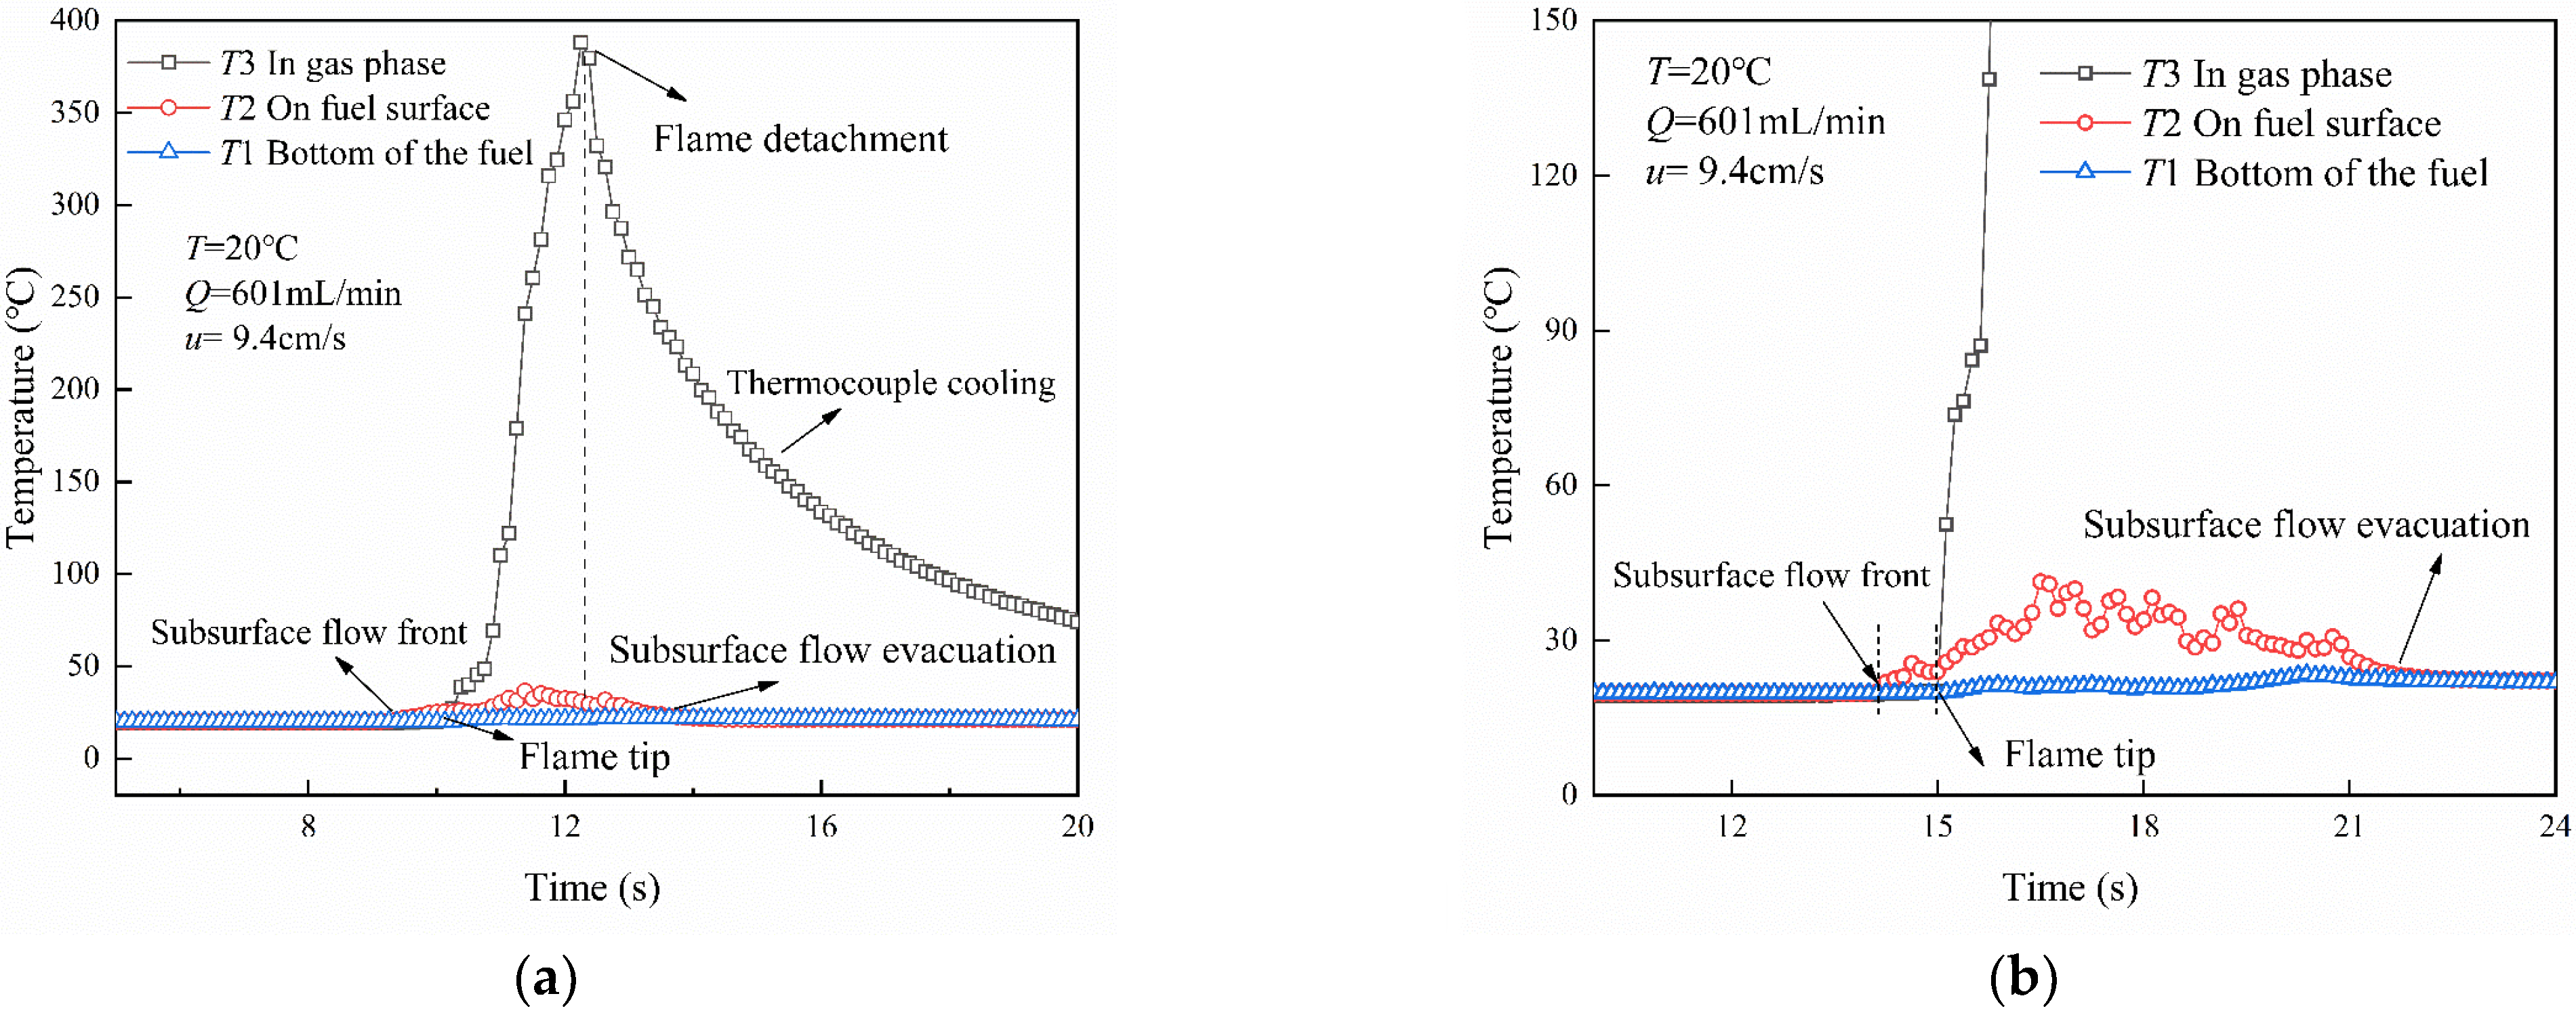
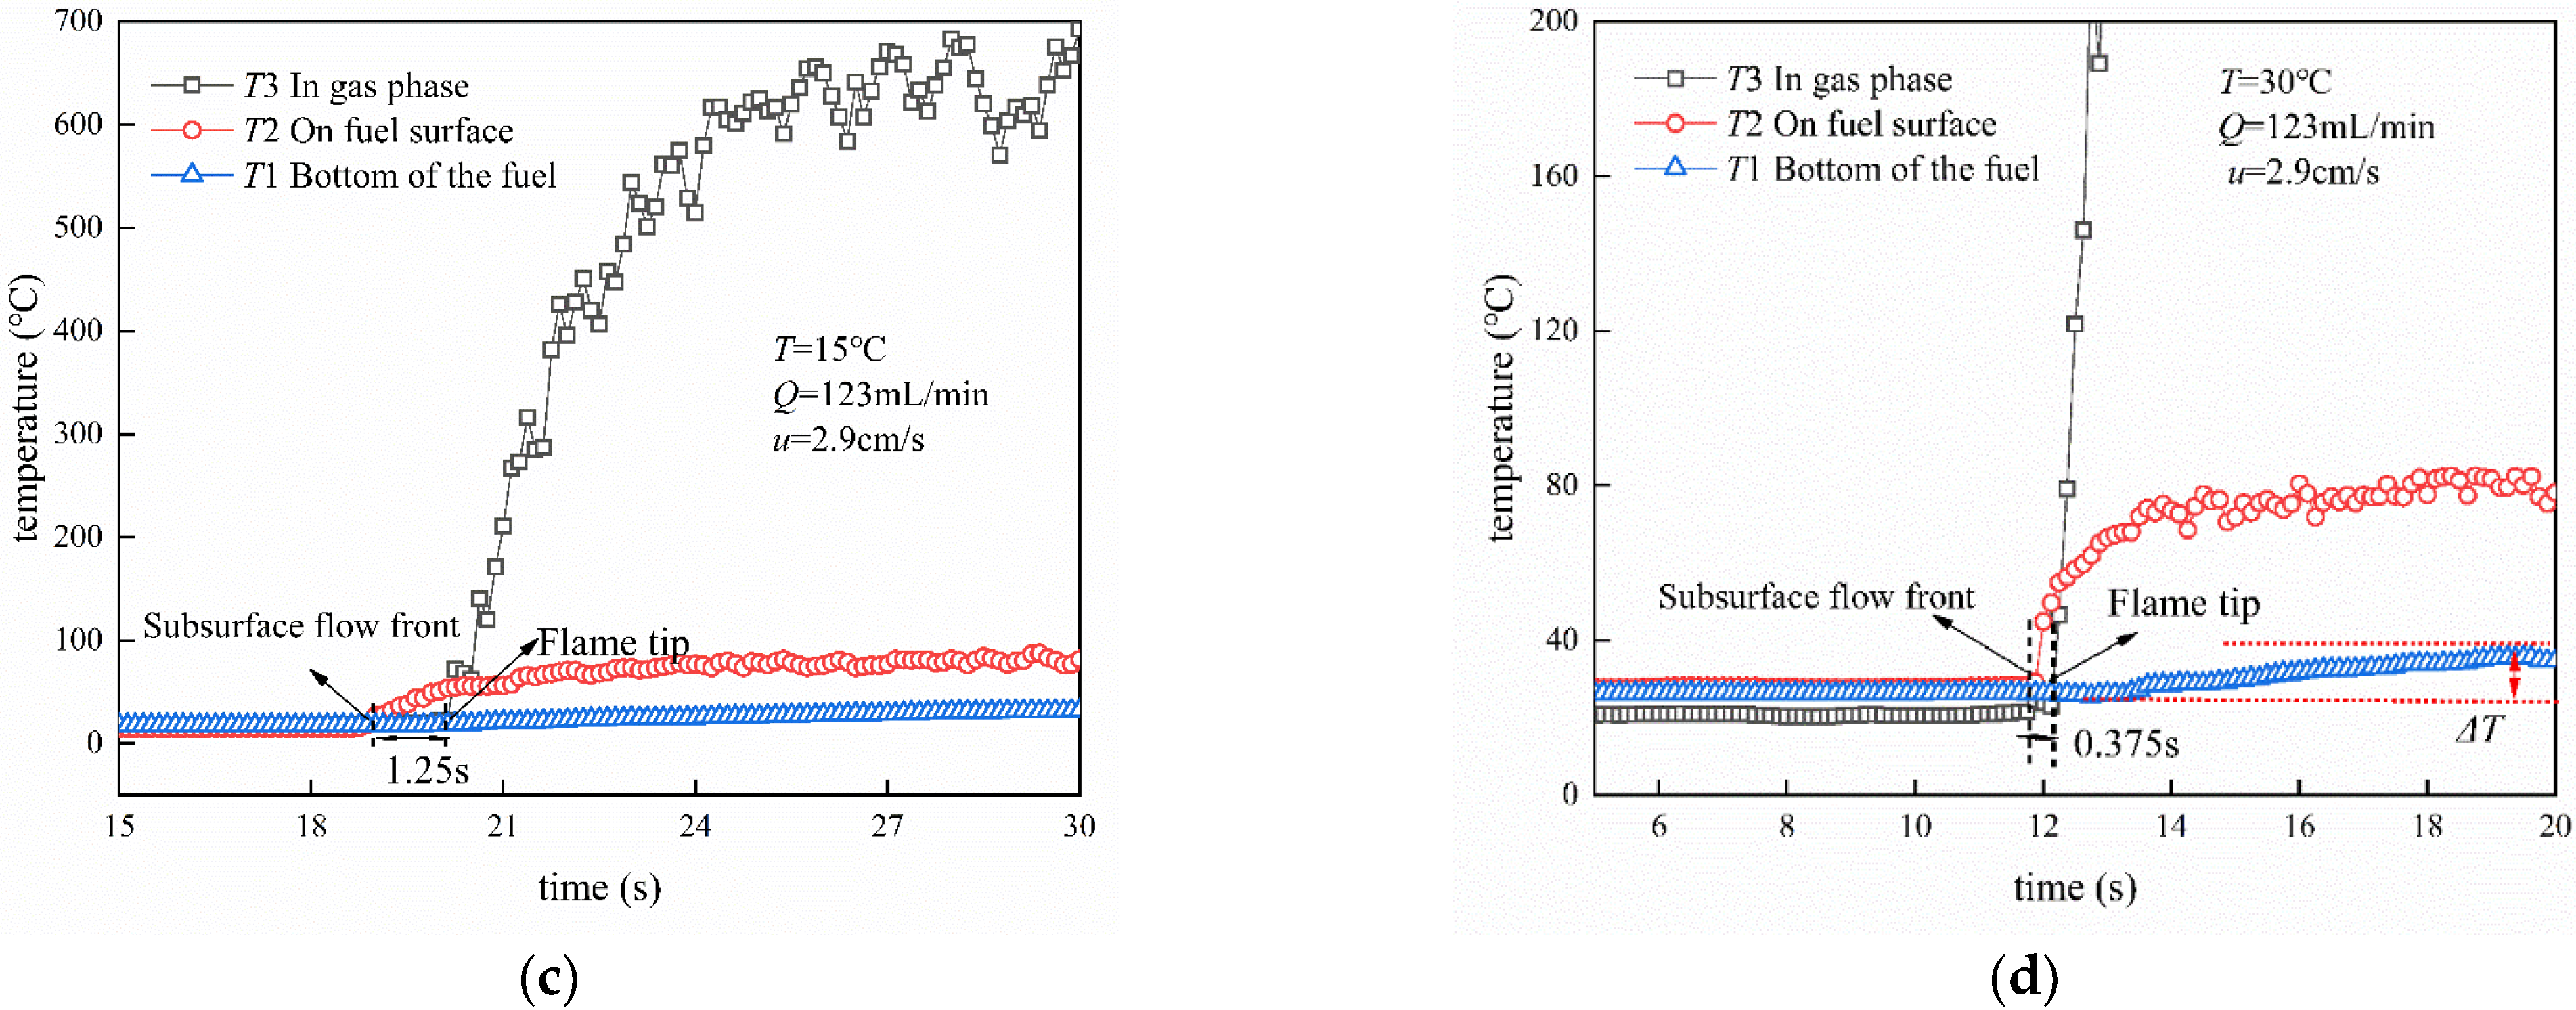
Three thermocouples on the same vertical plane, T1, T2, and T3, measure the temperature at the bottom of the liquid surface, the surface of the liquid layer, and 5 mm above the liquid layer, as shown in Figure 8. The subsurface flows ahead of the flame front as the flame spreads over the surface of the liquid fuel [27], so that the T2 temperature is the first to rise to about 90 °C, which is below the boiling temperature of n-butanol as shown in Figure 8c. Then, the flame reaches the T3 position, and the temperature increases rapidly. The difference between the temperature changes in T1 and T2 is defined as the preheating time of the subsurface flow. The preheating time decreases as the fuel temperature increases, as shown in Figure 8c,d. The preheating time of the subsurface flow decreases from 1.25 s to 0.375 s when the initial fuel temperature rises from 15 °C to 30 °C. This is because as the temperature increases, not only does the length of the subsurface flow reduce, but the flame spread rate also grows, both of which make the preheating time decrease. When the flame passes through, the heat is transferred downward longitudinally, and the temperature of the bottom fuel surface gradually increases. However, the temperature rise is less than that of the fuel surface, indicating that the fuel layer is smaller than the temperature boundary layer and the heat is dissipated through the bottom plate.
In the flame spread gradually extinguished state, the temperature distribution is shown in Figure 8a: T3 thermocouple temperature leaves the flame gradually cooled as the flame gradually retreats to the thermocouple position, and the temperature gradually decreased; the maximum temperature of the flame is less than the temperature of the full spread state. T2 measured at a temperature of 40 °C, approximately equal to the flash point temperature of n-butanol (38 °C); the liquid layer temperature did not quickly drop to the fuel temperature but slowly decreased at the thermocouple position after the flame extinguished. The flame is extinguished, but the subsurface flow still exists. The gradually extinguished flame can be regarded as a state of reverse spreading. The subsurface flow is formed as a result of buoyancy driven by temperature differences and surface tension [28], and it will spread in the direction of extinction, so the fuel layer temperature will be reduced with a certain lag time. By comparing Figure 8b,d, it can be seen that the temperature increase at the bottom of the fuel decreases with the increase in the discharge rate. On the one hand, the liquid layer thickness increases from 0.29 cm to 0.42 cm, and the heat conduction and convective heat transfer resistance of the flame to the bottom becomes larger. On the other hand, the fuel surface flow rate increases from 2.9 cm/s to 9.5 cm/s, and the heat carried away by the convective heat transfer process of the cold fluid increases.

3.6. Radiant Heat Flow

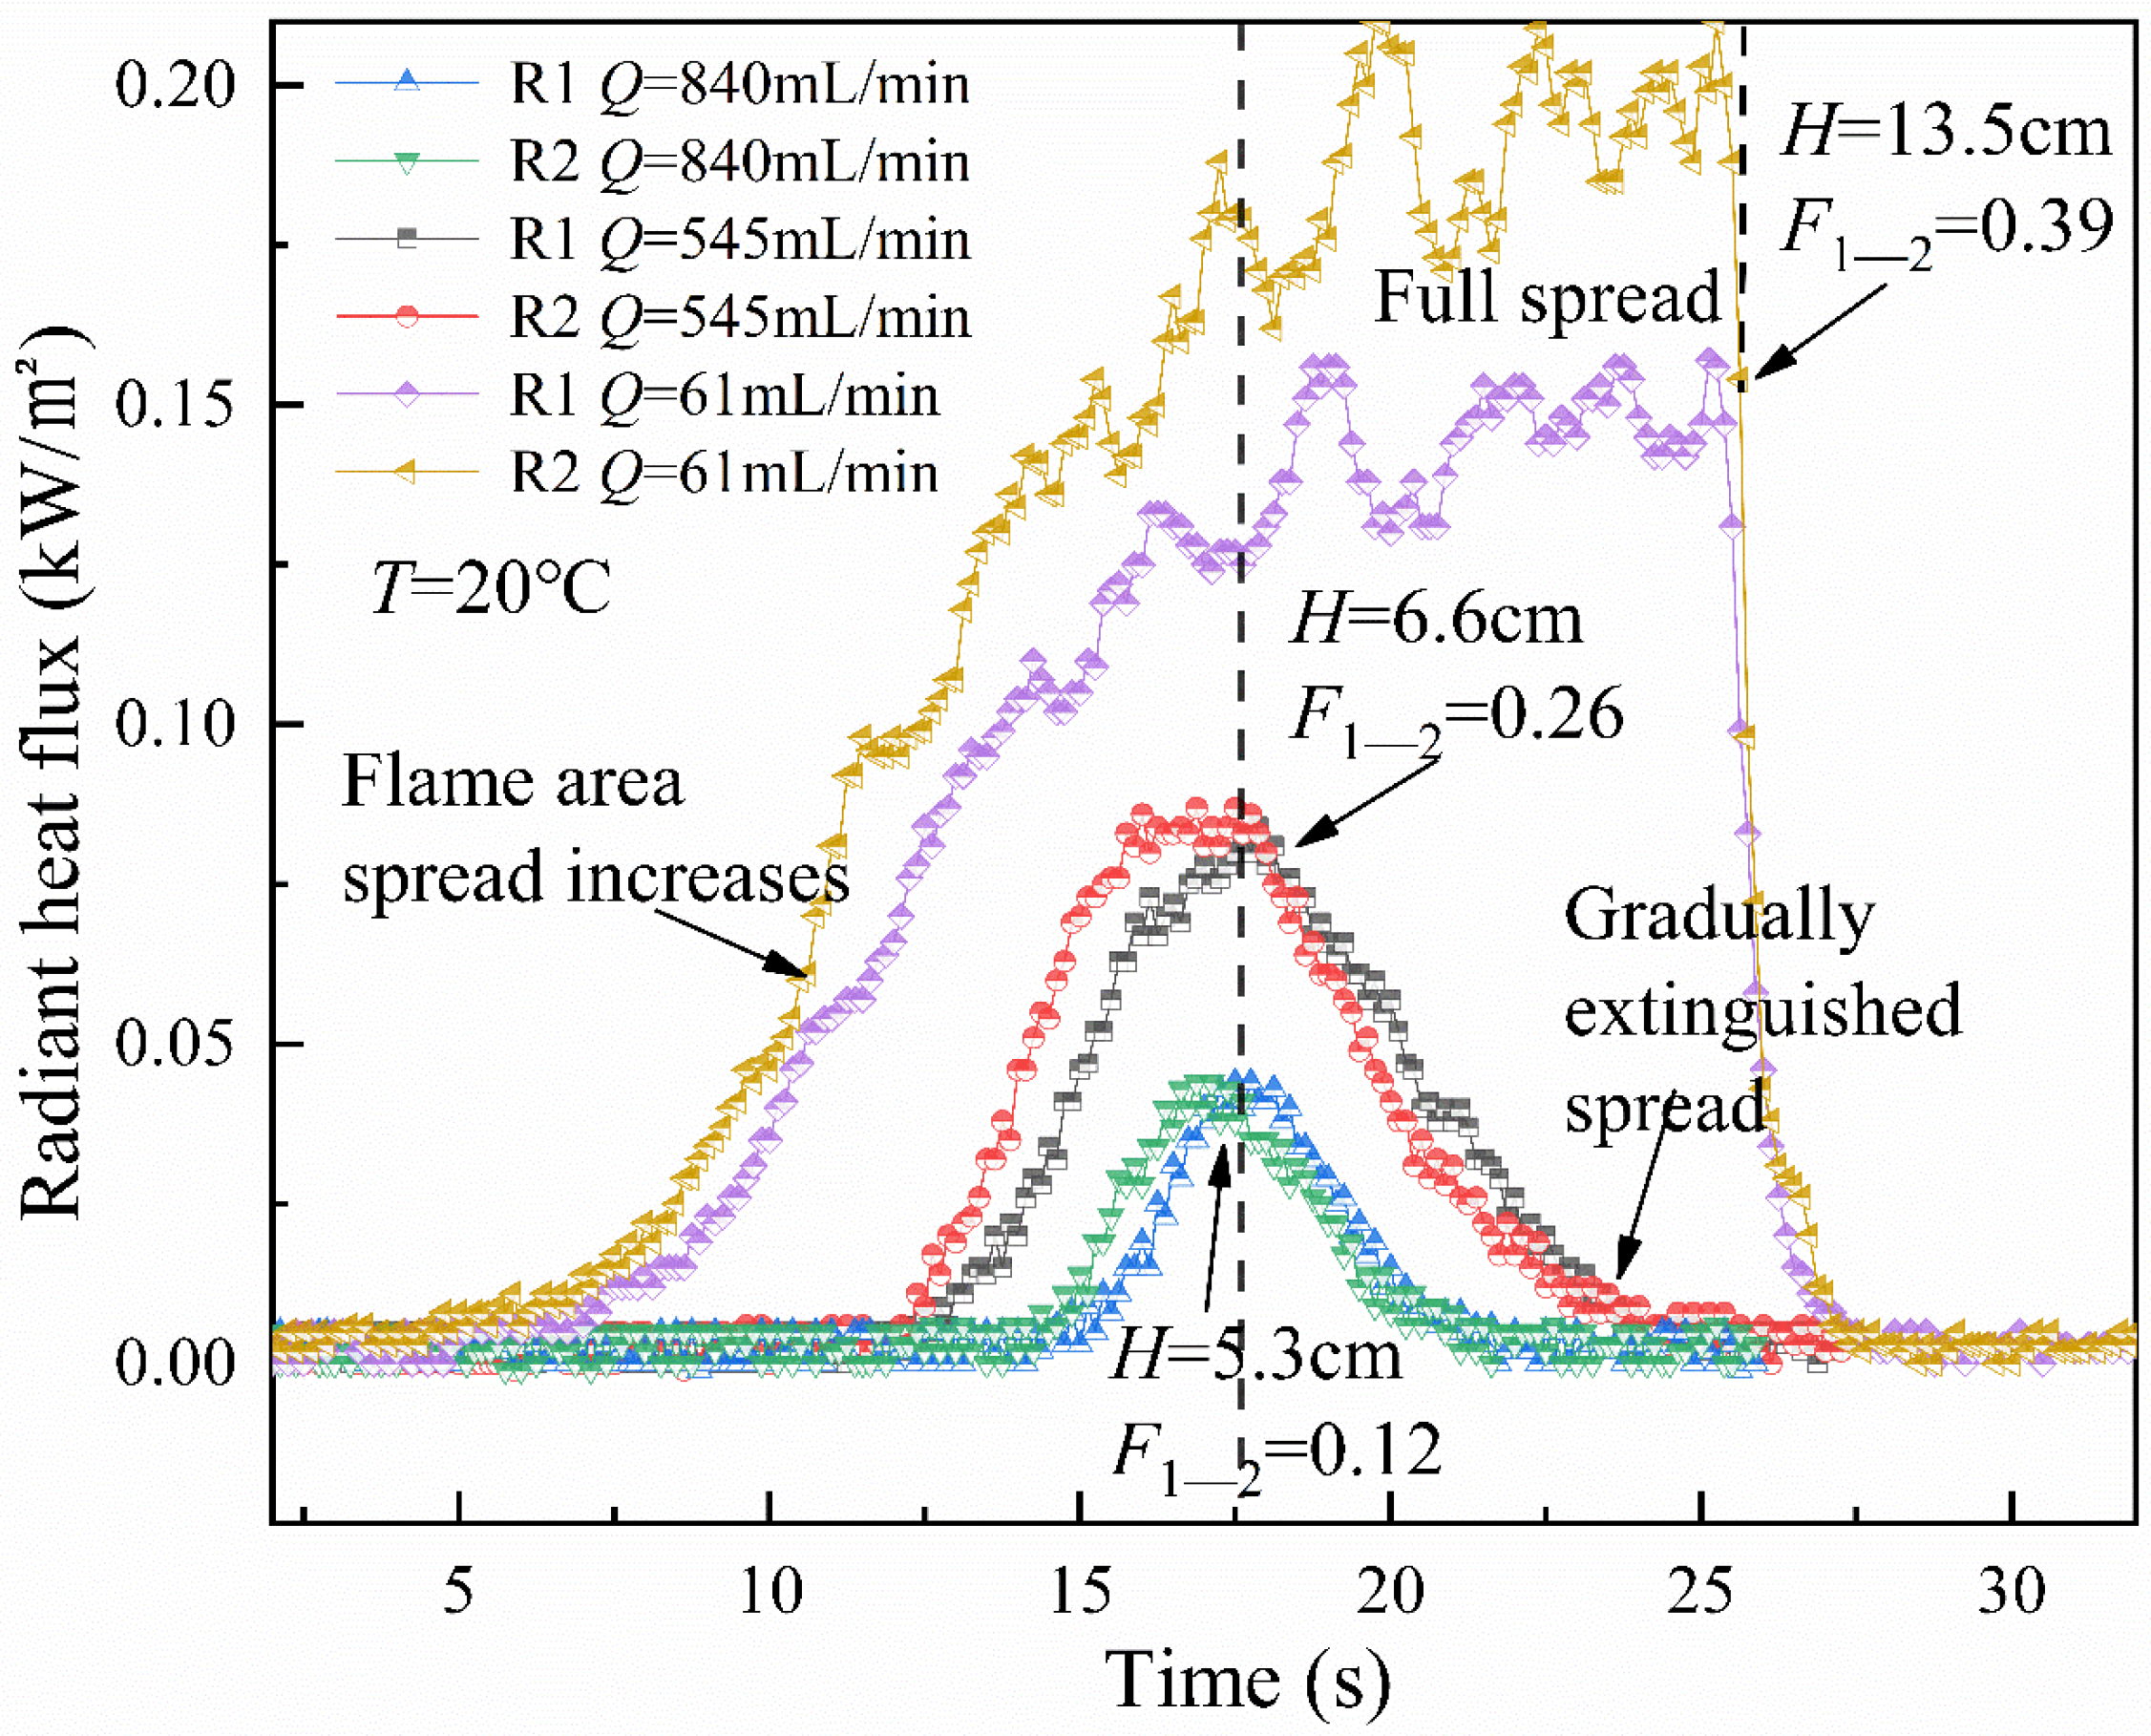
As shown in Figure 9, the trend of heat radiation with the flame-spreading process is measured at a fixed point. The change in radiation heat flow can be divided into two cases according to the flame-spreading state. As the flame spreading fully spread, the heat flow value gradually increased with the expansion of the flame spreading area, and the heat flow value gradually stabilized when the flame spread over the whole fuel tank. The total heat flow R2 is equal to the convection heat flow plus the radiation heat flow R1, and the total radiation heat flow average value is 0.19 kW/m2 at the full spread stabilization stage, which is 1.3 times the radiation heat flow.
However, a peak in the heat flow value occurs, and the curve shows a single-peaked trend in the gradually extinguished spreading state, reaching a maximum at some point in the flame spreading. The radiant heat flow received by a point outside the flame can be expressed as
q = E F 1 2 τ
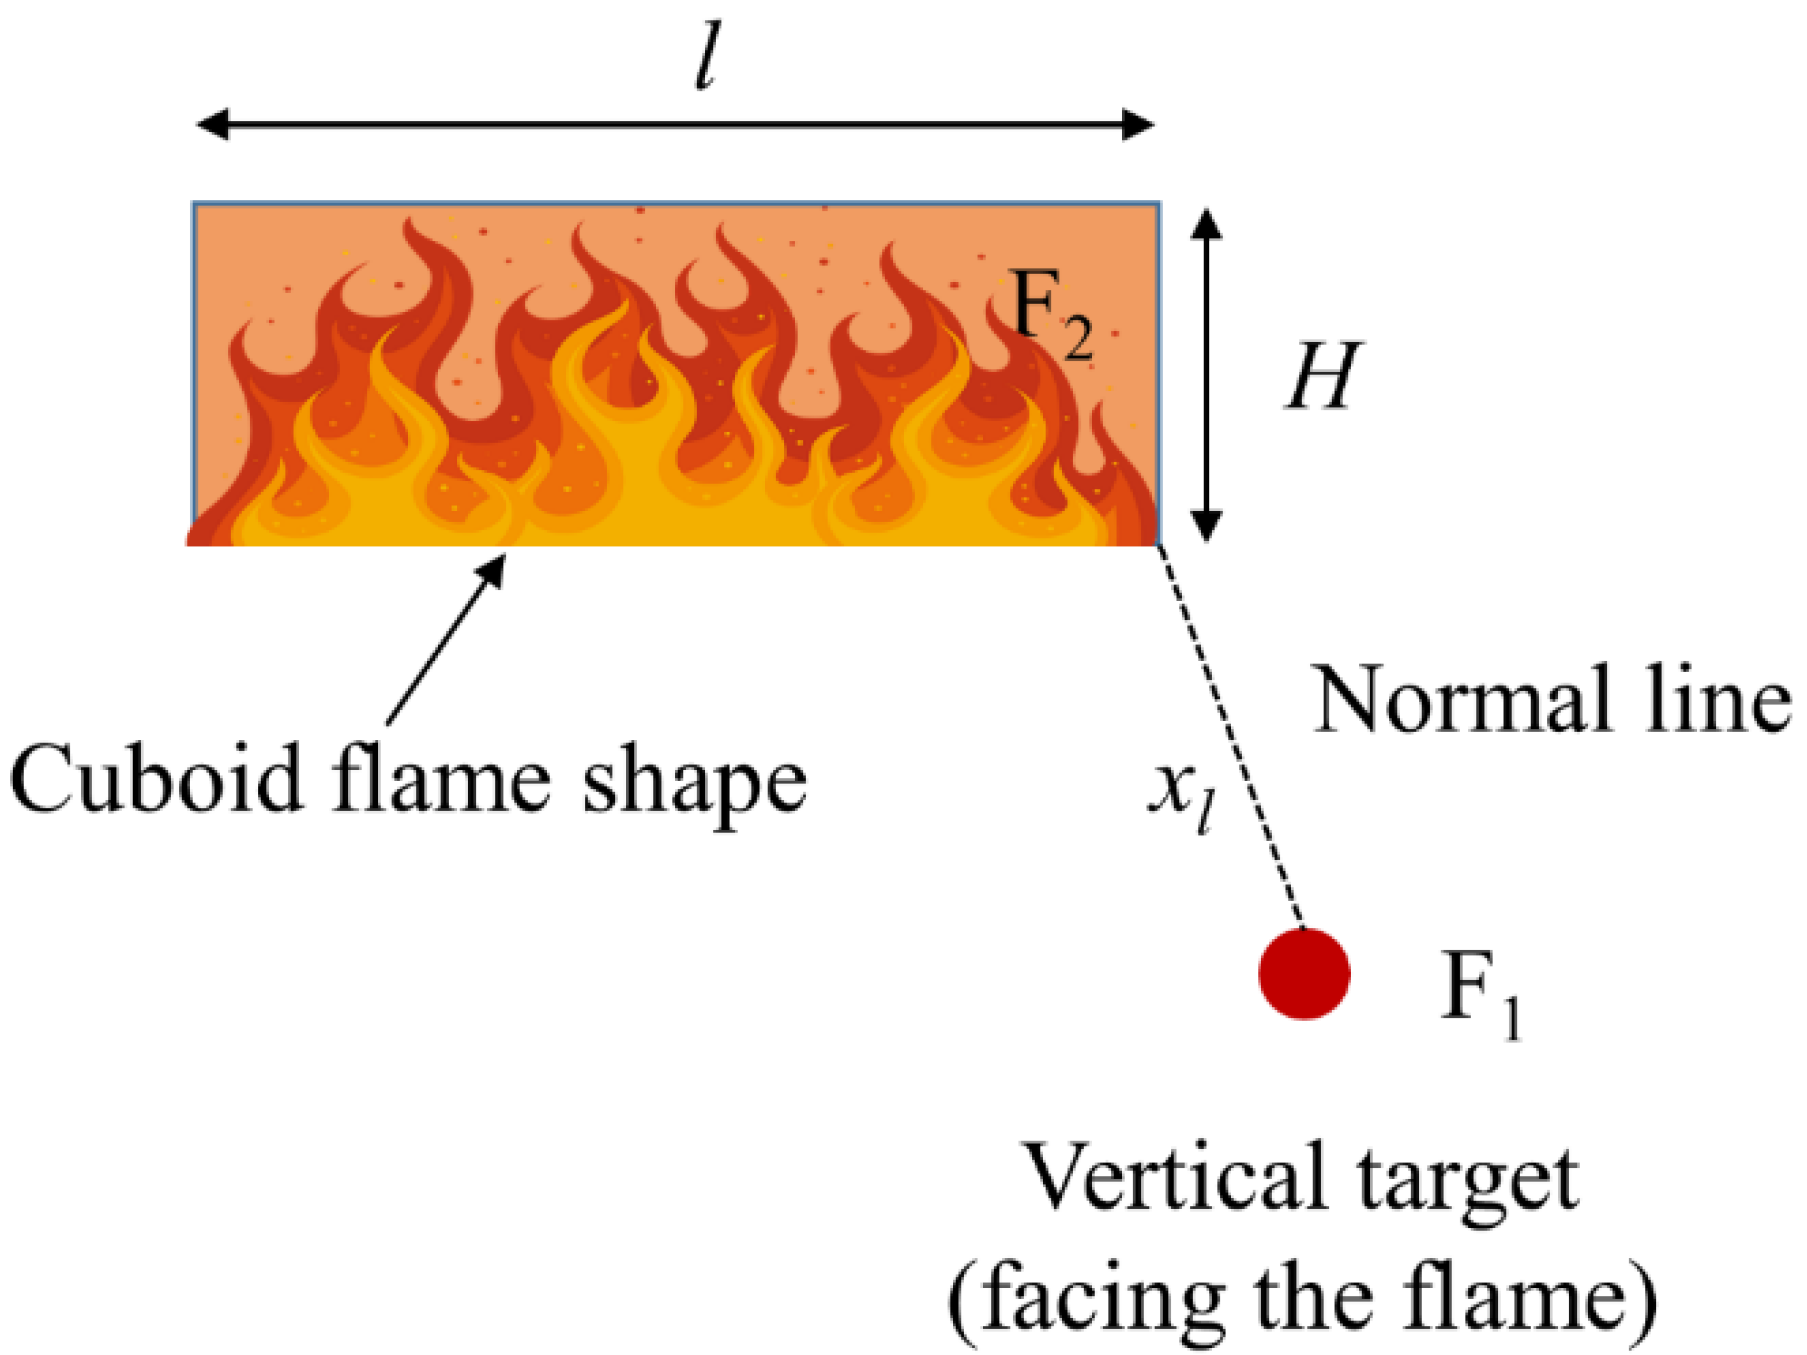
where E is the flame radiation intensity (kW/m2) emitted from the geometric solid surface; F1−2 is the view factor, a geometric parameter related to the shape of the flame and the relative position of the thermal radiation receiver. τ is the atmospheric transmittance. In this model, the flame is usually assumed to be a solid [29] with an emitting power surface similar to the flame shape. The view factor F1−2 of the classical rectangular flame radiation model is calculated by Equation (6) [30]
F 1 2 = 1 2 π H H 2 + x l 2 tan 1 l H 2 + x l 2 + l l 2 + x l 2 tan 1 H l 2 + x l 2
Note that the view factor model described above is based on the assumption that the receiver is orthogonal to the central axis of the flame, as shown in Figure 10. Where l and H are the length of the rectangular flame and the average height of the pulsation, respectively, and xl is the horizontal distance from the radiation target to the corners of the rectangle. xl = 10 cm in this work.
The flame spreading process can be regarded as a rectangular flame model with gradually increasing length, and the view factor at any position can be calculated by the additivity of the view factor, which is 0.39 for the solid flame model at the full spreading stable stage of Q = 61 mL/min, and 0.26 for the flame thermal radiation maximum at the gradually extinguished spreading state of Q = 545 mL/min. The flame height decreases from 13.5 cm to 6.6 cm, the flame spread gradually extinguishes, and the flame length decreases to 45 cm; the surface radiation force of the flame decreases with the volume of the flame [31]; therefore, the maximum value of thermal radiation reduces with the increase in discharge rate.

4. Conclusions

In this work, a series of laboratory-scale fire spread tests over sub-flash n-butanol surfaces are conducted. The major conclusions are summarized as follows:
(1)
The experimental fuel flow is in the laminar state, and the maximum thickness of the fuel layer is 0.52 cm; the influence of the fuel layer thickness on the flame spread is not negligible. The flame spread state is affected by temperature and discharge rate in three stages, (I) full spread, (II) gradually extinguished spread, and (III) unable to spread.
(2)
The spreading rate of spill fire reduces with the decrease in temperature and fuel liquid flow rate; when the temperature T = 15 °C, Q > 545 mL/min, the flame cannot spread, and the detachment rate of flame spread enlarges with the increase in temperature.
(3)
Flame front pulsation trajectory is gradually transitioned to uniform spreading by the dragging force of the liquid surface flow rate. The temperature increases, and the flame pulsation amplitude and subsurface flow preheating time decrease.
(4)
Radiant heat flow first increases at the full spread and then stabilizes, with a maximum view coefficient of 0.39; however, there is a tendency for a single peak change in gradually extinguishing the spread.

Author Contributions

Methodology, Z.Y.; software, L.H.; investigation, Y.L.; resources, T.F.; writing—original draft preparation, S.M.; writing—review and editing, Y.J.; funding acquisition, C.D. All authors have read and agreed to the published version of the manuscript.

Funding

This study has been sponsored by Anhui University Outstanding Youth Research Project under No. 2022AH020028 and No. 2022AH030037, Anhui Province Outstanding Young Talents Support Program under No. gxyqZD2022058, and the Project of Anhui Jianzhu University 2019 Talent Research Program under No. 2019QDZ21.

Institutional Review Board Statement

Not applicable.

Informed Consent Statement

Not applicable.

Data Availability Statement

The data presented in this study are available on request from the corresponding author.

Acknowledgments

This study has been sponsored by Anhui University Outstanding Youth Research Project under No.2022AH020028 and No.2022AH030037, Anhui Province Outstanding Young Talents Support Program under No. gxyqZD2022058, and the Project of Anhui Jianzhu University 2019 Talent Research Program under No. 2019QDZ21. The authors gratefully acknowledge these supports.

Conflicts of Interest

The authors declare no conflict of interest.

References

  1. Li, M.; Lu, S.; Guo, J.; Chen, R.; Tsui, K.L. Flame spread over n-butanol at sub-flash temperature in normal and elevated altitude environments. J. Therm. Anal. Calorim. 2015, 119, 401–409. [Google Scholar] [CrossRef]
  2. Lehr, W.; Simecek-Beatty, D. Comparison of hypothetical LNG and fuel oil fires on water. J. Hazard. Mater. 2004, 107, 3–9. [Google Scholar] [CrossRef]
  3. Oka, H.; Ota, S. Evaluation of consequence assessment methods for pool fires on water involving large spills from liquefied natural gas carriers. J. Mar. Sci. Tech. 2008, 13, 178. [Google Scholar] [CrossRef]
  4. Webber, D.M. Source terms. J. Loss Prev. Process Ind. 1991, 4, 5–15. [Google Scholar] [CrossRef]
  5. Webber, D.M. On models of spreading pools. J. Loss Prev. Process Ind. 2012, 25, 923–926. [Google Scholar] [CrossRef]
  6. Chebbi, R. Dynamics of unidirectional gravity-inertial spreading of oil on water. Chem. Eng. Sci. 2005, 60, 6806–6813. [Google Scholar] [CrossRef]
  7. Grimaz, S.; Allen, S.; Stewart, J.; Dolcetti, G. Predictive evaluation of surface spreading extent for the case of accidental spillage of oil on the ground. AIDIC Chem. Eng. Trans. 2007, 11, 389–394. [Google Scholar]
  8. Gottuk, D.T.; White, D.A. Liquid fuel fires. In SFPE Handbook of Fire Protection Engineering; Springer: New York, NY, USA, 2015; pp. 2552–2590. [Google Scholar]
  9. Pan, Y.; Li, M.; Wang, C.; Luo, X.; Luo, Q. Experimental investigation of spilling fire spread over steady flow n-butanol fuel: Effects of flow speed and spreading direction. Process Saf. Prog. 2020, 39, e12131. [Google Scholar] [CrossRef]
  10. Pan, Y.; Li, M.; Luo, X.; Wang, C.; Luo, Q.; Li, J. Analysis of heat transfer of spilling fire spread over steady flow of n-butanol fuel. Int. Commun. Heat Mass Transf. 2020, 116, 104685. [Google Scholar] [CrossRef]
  11. Li, M.; Xu, Z.; Luo, Q.; Wang, C. Oscillation behavior and heat transfer involving opposed spilling fire spread over n-butanol with various slope angles. Int. Commun. Heat Mass Transf. 2023, 140, 106512. [Google Scholar] [CrossRef]
  12. Sirignano, W.A.; Glassman, I. Flame Spreading Above Liquid Fuels: Surface-Tension-Driven Flows. Combust. Sci. Technol. 1970, 1, 307–312. [Google Scholar] [CrossRef]
  13. Degroote, E.; García Ybarra, P.L. Flame propagation over liquid alcohols: Part I. Experimental results. J. Therm. Anal. Calorim. 2005, 80, 541–548. [Google Scholar] [CrossRef]
  14. Degroote, E.; García Ybarra, P.L. Flame propagation over liquid alcohols: Part III. Pulsating regime. J. Therm. Anal. Calorim. 2005, 80, 555–558. [Google Scholar] [CrossRef]
  15. Degroote, E.; García Ybarra, P.L. Flame propagation over liquid alcohols: Part II. Steady propagation regimes. J. Therm. Anal. Calorim. 2005, 80, 549–553. [Google Scholar] [CrossRef]
  16. Miller, F.J.; Ross, H.D. Liquid-phase velocity and temperature fields during uniform flame spread over 1-propanol. In Proceedings of the 8th International Symposium on transport phenomena in Combustion, San Francisco, CA, USA, 16–20 July 1995; pp. 736–744. [Google Scholar]
  17. Schiller, D.; Ross, H.; Sirignano, W. Computational predictions of flame spread over alcohol pools. In Proceedings of the 31st Aerospace Sciences Meeting, Reno, NV, USA, 11–14 January 1993; p. 825. [Google Scholar]
  18. Yaws, C.L. Chemical Properties Handbook, 1st ed.; McGraw-Hill Education: New York, NY, USA, 1999; pp. 19–154. [Google Scholar]
  19. Li, Y.; Huang, H.; Shuai, J.; Zhao, J.; Su, B. Experimental study of continuously released liquid fuel spill fires on land and water in a channel. J. Loss Prev. Process Ind. 2018, 52, 21–28. [Google Scholar] [CrossRef]
  20. White, D.; Beyler, C.L.; Fulper, C.; Leonard, J. Flame spread on aviation fuels. Fire Saf. J. 1997, 28, 1–31. [Google Scholar] [CrossRef]
  21. Li, M.; Wang, C.; Yang, S.; Zhang, J. Precursor flame characteristics of flame spread over aviation fuel. Appl. Therm. Eng. 2017, 117, 178–184. [Google Scholar] [CrossRef]
  22. Takahashi, K.; Ito, A.; Kudo, Y.; Konishi, T.; Saito, K. Scaling analysis on pulsating flame spread over liquids. Int. J. Chem. Eng. 2008, 2008, 178292. [Google Scholar] [CrossRef] [Green Version]
  23. Li, M.; Wang, C.; Li, Z.; Yang, S.; Fukumoto, K.; Fan, C. Combustion and flame spreading characteristics of diesel fuel with forced air flows. Fuel 2018, 216, 390–397. [Google Scholar] [CrossRef]
  24. Li, M.; Luo, Q.; Ji, J.; Wang, C. Hydrodynamic analysis and flame pulsation of continuously spilling fire spread over n-butanol fuel under different slope angles. Fire Saf. J. 2021, 126, 103467. [Google Scholar] [CrossRef]
  25. Guo, J.; Lu, S.; Wang, C. Study on the subsurface flow induced by flame spread over aviation kerosene. J. Therm. Anal. Calorim. 2014, 116, 455–460. [Google Scholar] [CrossRef]
  26. Kim, I.; Schiller, D.N.; Sirignano, W.A. Axisymmetric flame spread across propanol pools in normal and zero gravities. Combust. Sci. Technol. 1998, 139, 249–275. [Google Scholar] [CrossRef]
  27. Glassman, I.; Dryer, F.L. Flame spreading across liquid fuels. Fire Saf. J. 1981, 3, 123–138. [Google Scholar] [CrossRef]
  28. Ji, J.; Lin, S.; Zhao, C.; Li, K.; Gao, Z. Experimental study on initial temperature influence on flame spread characteristics of diesel and gasoline–diesel blends. Fuel 2016, 178, 283–289. [Google Scholar] [CrossRef]
  29. Ji, J.; Gong, C.; Wan, H.; Gao, Z.; Ding, L. Prediction of thermal radiation received by vertical targets based on two-dimensional flame shape from rectangular n-heptane pool fires with different aspect ratios. Energy 2019, 185, 644–652. [Google Scholar] [CrossRef]
  30. Ingason, H.; Li, Y.Z.; Lönnermark, A. Heat flux and thermal resistance. In Tunnel Fire Dynamics; Springer: New York, NY, USA, 2015; pp. 249–290. [Google Scholar]
  31. Muñoz, M.; Planas, E.; Ferrero, F.; Casal, J. Predicting the emissive power of hydrocarbon pool fires. J. Hazard. Mater. 2007, 144, 725–729. [Google Scholar] [CrossRef] [PubMed]
Figure 1. Experimental device layout.
Fire 06 00284 g001
Figure 2. Peristaltic pump discharge rate and fuel layer thickness.
Fire 06 00284 g002
Figure 3. Sequences of spill fire appearance.
Fire 06 00284 g003
Figure 4. Flame spread rate versus discharge rate and temperature.
Fire 06 00284 g004
Figure 5. The ufu versus discharge rate.
Fire 06 00284 g005
Figure 6. Flame tip trajectory versus temperature and discharge rate.
Fire 06 00284 g006
Figure 7. Flame pulsation amplitude versus temperature.
Fire 06 00284 g007
Figure 8. Temperature distributions near the fuel surface. (a) T = 20 °C, Q = 604 mL/min. subsurface flow front; (b) T = 20 °C, Q = 604 mL/min. subsurface flow evacuation; (c) T = 15 °C, Q = 123 mL/min; (d) T = 30 °C, Q = 123 mL/min.
Fire 06 00284 g008aFire 06 00284 g008b
Figure 9. Thermal radiation with fire spread state.
Fire 06 00284 g009
Figure 10. Schematic calculation model of view factor.
Fire 06 00284 g010
Table 2. Flame spread state.
Temperature °CDischarge Rate
mL/min
Flame Spread State
15Q ≤ 123Full Spread
186 < Q ≤ 481Gradually extinguish the spread
545 ≤ QUnable to spread
20Q ≤ 185Full Spread
241 < Q ≤ 1195Gradually extinguish the spread
25Q ≤ 370Full Spread
426 < Q ≤ 1195Gradually extinguish the spread
30Q ≤ 545Full Spread
660 < Q ≤ 1195Gradually extinguish the spread
Disclaimer/Publisher’s Note: The statements, opinions and data contained in all publications are solely those of the individual author(s) and contributor(s) and not of MDPI and/or the editor(s). MDPI and/or the editor(s) disclaim responsibility for any injury to people or property resulting from any ideas, methods, instructions or products referred to in the content.